Article

Assessment of 18 Years of Genetic Marker-Assisted Selection and Augmentation of Native Walleye in the Upper New River, Virginia, USA

1
Department of Fish and Wildlife Conservation, Virginia Polytechnic Institute and State University, Blacksburg, VA 24061, USA
2
Virginia Department of Wildlife Resources, 1132 Thomas Jefferson Rd, Forest, VA 24551, USA
3
Virginia Department of Wildlife Resources, 2206 S. Main Street, Blacksburg, VA 24060, USA
*
Author to whom correspondence should be addressed.
Current address: New River Conservancy, 8C S. Jefferson Ave, West Jefferson, NC 28694, USA.
Fishes 2025, 10(3), 118; https://doi.org/10.3390/fishes10030118
Submission received: 16 December 2024 / Revised: 28 February 2025 / Accepted: 4 March 2025 / Published: 6 March 2025
(This article belongs to the Section Genetics and Biotechnology)

Abstract

:
Walleye Sander vitreus is a valued sportfish in eastern North America, including the upper New River of Virginia, where individuals can grow to a large size (>7 kg). After construction of dams, especially Claytor Dam in 1939, the population declined and non-native walleye were stocked. Stocking of non-native walleye was stopped in 1997, and molecular marker data showed that the presumptive native population had persisted. To restore the native stock, selection of broodstock candidates bearing native marker alleles and hatchery-based augmentation have been practiced over a 20-year period. We evaluated the success of the marker-assisted selection and hatchery-based augmentation program. Marker-assisted selection of native New River walleye began with mean frequencies of marker alleles at microsatellite loci Svi17 and Svi33 of ~30%, and continuing selection has driven marker allele frequencies to ~65–70%. Numbers of walleye collected in fall gillnet and spring electrofishing surveys were responsive to augmentations with hatchery fish 2–3 years earlier. Stocking was not practiced in 2012–2013, and a decrease in walleye catch rates was noted in 2016, suggesting that the native New River walleye population still depends upon hatchery-based augmentation. We recommend the development of a small panel of single nucleotide polymorphism markers for more rigorous selection of broodstock representative of the native walleye population.
Key Contribution: Our experience with MAS and fishery augmentation provides a case study for the design of similar programs, not only for walleye, but also for other fisheries.

1. Introduction

Walleye, Sander vitreus, is a valued sportfish in eastern North America [1,2], especially in the upper New River of Virginia [3,4]. This population is of particular interest because of its spawning in a riverine ecosystem, growth to a large ultimate size, and apparent resilience to environmental changes, though they tend to have a shorter lifespan than walleye populations in more northerly locations [5,6,7]. Upper New River walleye declined after the construction of dams (Fields—1930, Fries—1902, Byllesby—1910, Buck—1912, and Claytor—1939) inundated or impeded access to spawning areas. Walleye from outside sources, mostly from the Great Lakes region, were stocked in the upper New River beginning as early as 1921 [6], especially following the impoundment of Claytor Reservoir in 1939. All stocking from outside sources was ceased in 1997 just prior to genetic assessment of New River walleye populations. Results of that study showed that a presumptive native stock had persisted [7,8]. This stock was characterized by unique mitochondrial DNA (mtDNA) restriction fragment haplotypes (haplotypes 43, 44, and 45, which were similar to haplotypes of walleye populations in other Ohio River tributaries [8]) and high frequencies of particular alleles at two nuclear microsatellite loci (Svi17 and Svi33 [8]).
Beginning in 2001, a program of marker-assisted selection (MAS) of broodstock candidates was implemented to promote restoration of a fishery dominated by the native New River walleye population [9]. That is, prospective broodstock have been selected on the basis of exhibiting the Svi17 99-bp and Svi33 78-bp alleles characterizing the presumptive native stock. The gametes of selected individuals are crossed in a hatchery, and their offspring subsequently are stocked in targeted reaches of the upper New River (i.e., above Claytor Dam) in a program of hatchery-based augmentation. This is the only walleye stocking program in the New River above Claytor Dam; the reach is isolated from stocked downstream reaches by Claytor and Bluestem dams. Broodstock collection was halted during 2012 and 2013 to assess whether the hatchery-based augmentation had resulted in a self-sustaining stock; subsequent decline in spring run size showed that the native walleye population was not fully sustained by natural reproduction alone, and marker-assisted broodstock selection and the hatchery augmentation program were reinstated. The primary goal of this study was to assess the efficacy of genetic marker-assisted selection and hatchery-based augmentation of the presumptive native upper New River walleye population. Our objectives were to quantify relative abundance of walleye in the upper New River system using spring electrofishing and fall gillnet surveys, to quantify proportions of diagnostic microsatellite marker alleles in hatchery stocks and the augmented walleye population, and to assess whether hatchery-based augmentation increased catch of trophy walleye (over 4 kg).

2. Materials and Methods

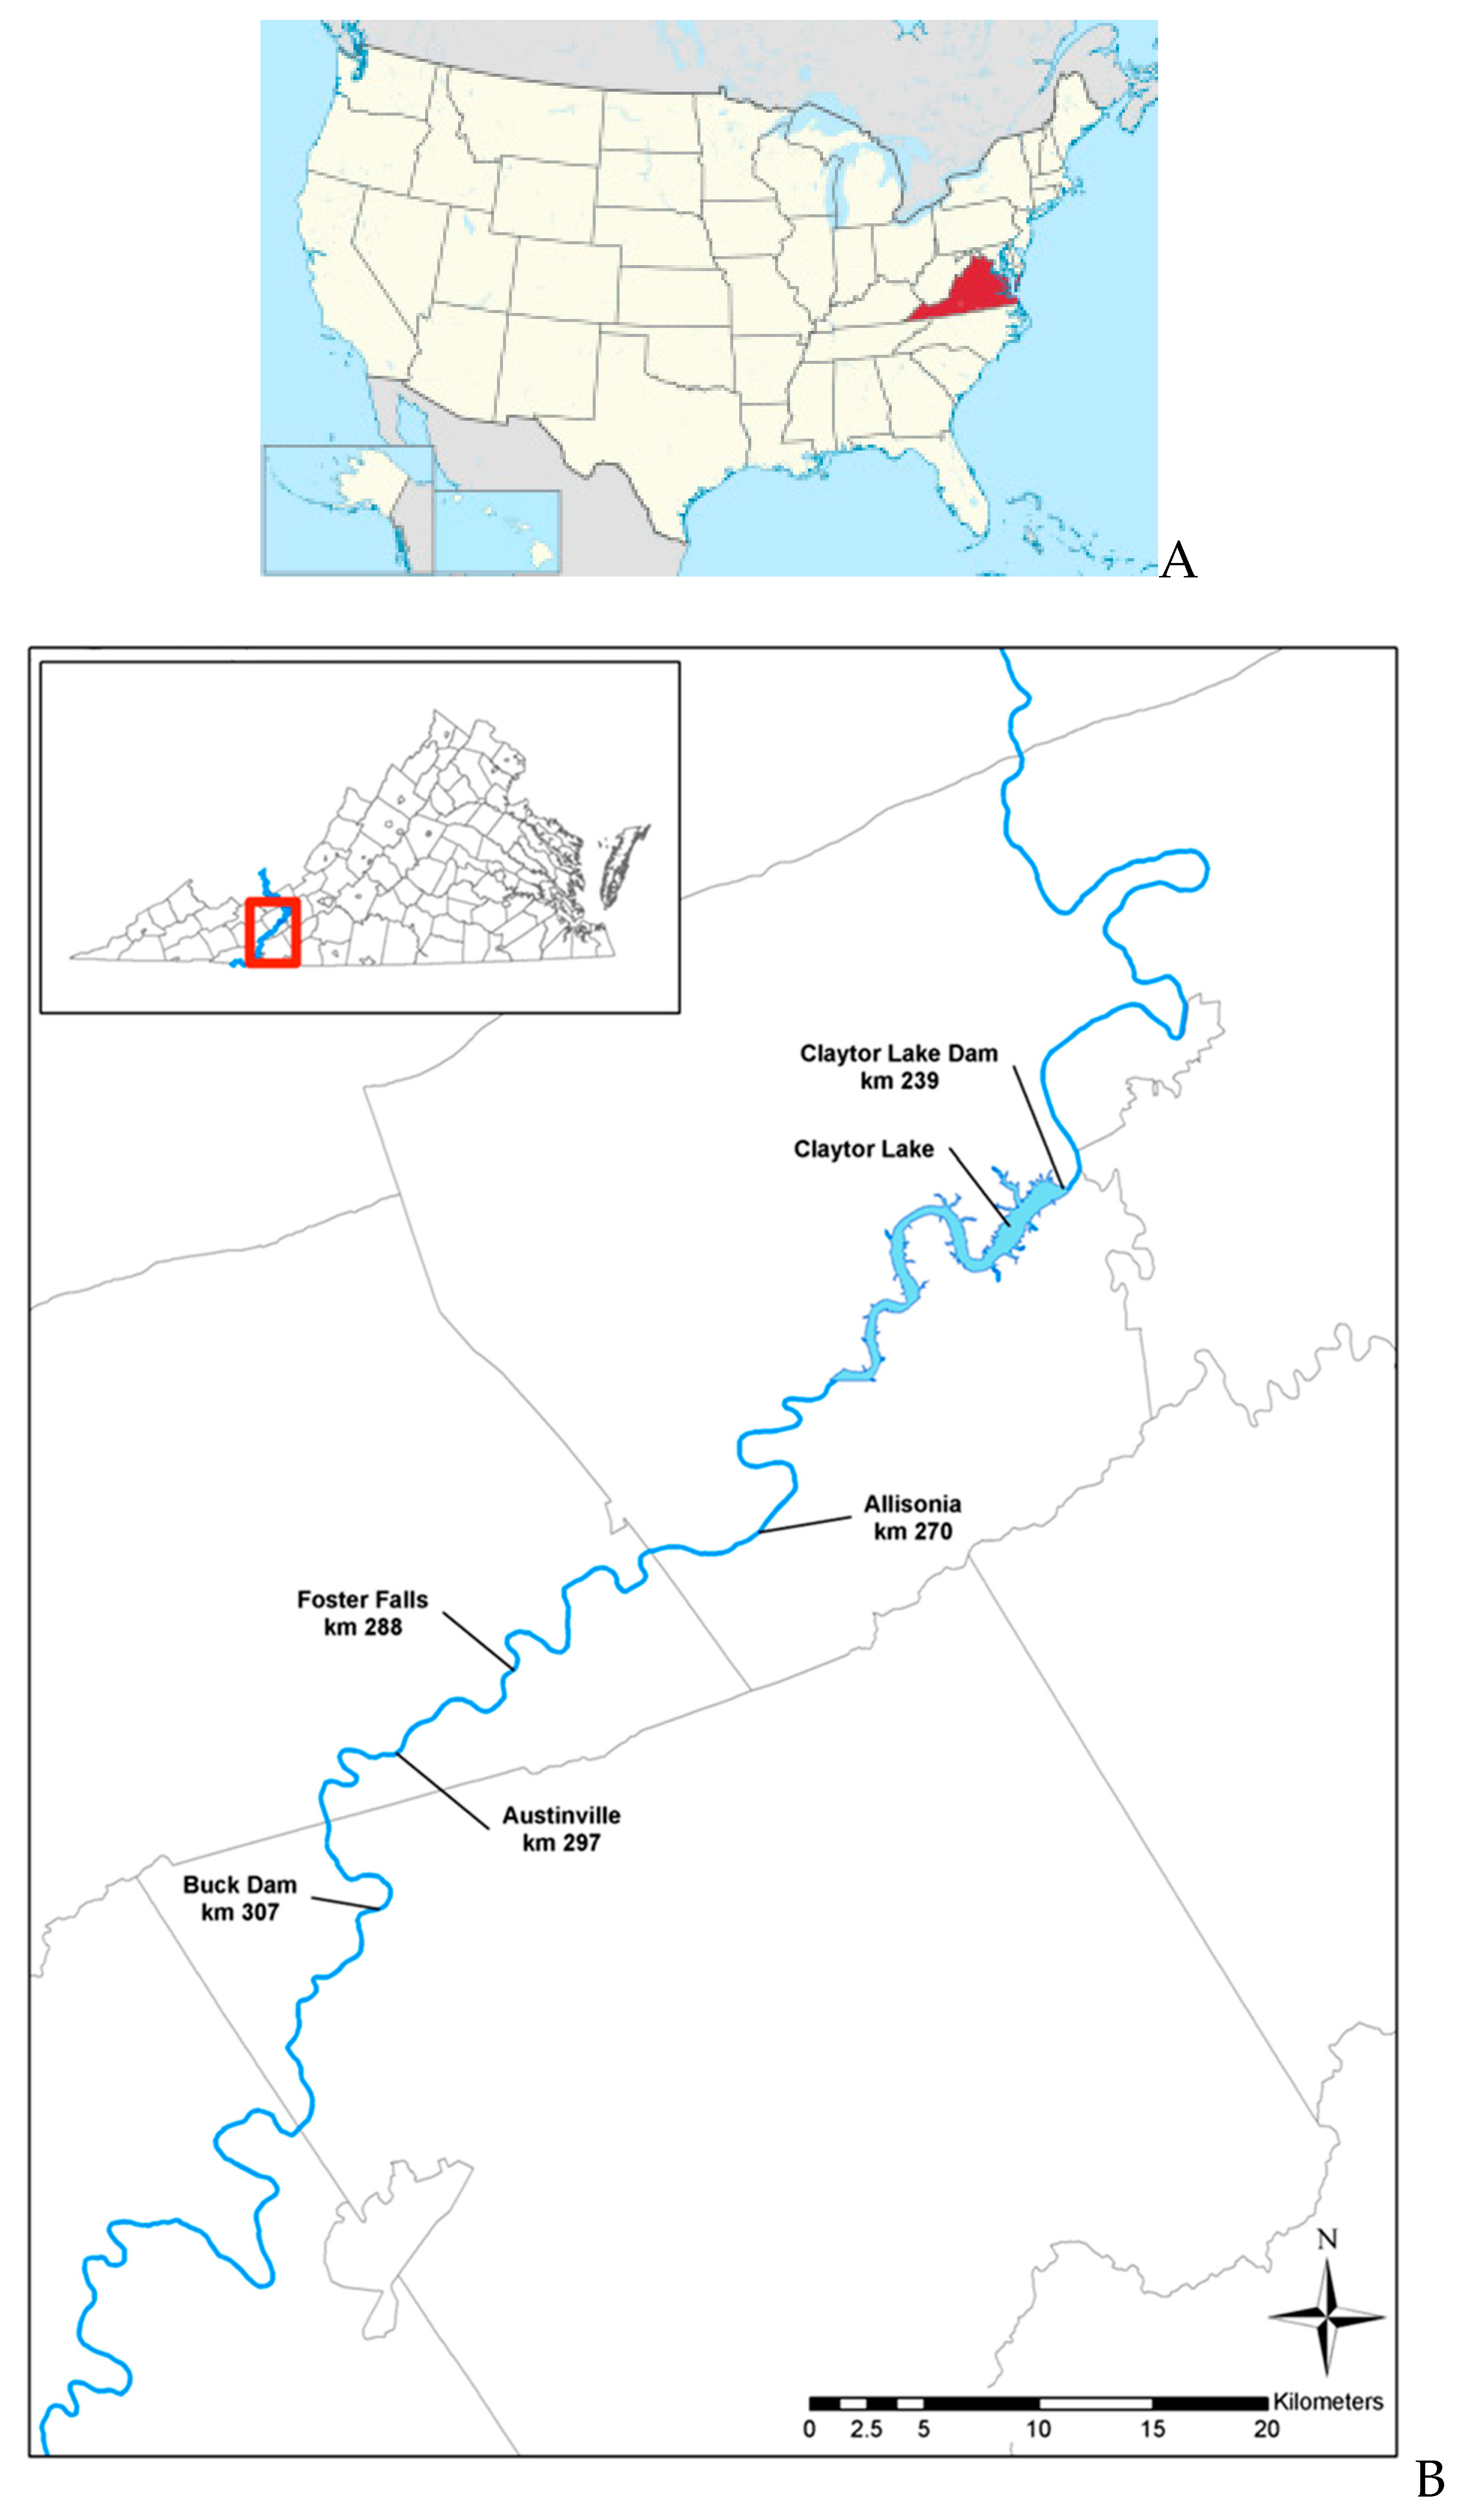
2.1. Study Area and Sampling

The area for collection of candidate native walleye broodstock was the upper New River above Claytor Reservoir in Virginia (Figure 1), an area known on the basis of earlier work [8,9] to harbor high frequencies of spawners of the putative native stock. Sampling of walleye broodstock candidates occurred each spring from 2001 to 2011 and 2014 to 2019 at spawning sites at Foster Falls, and as needed at Ivanhoe, Allisonia, and Virginia Route 100. Candidate broodstock were collected by Virginia Department of Wildlife Resources personnel using electrofishing, and were measured, weighed, and sexed. Individuals were marked with a numbered Floy tag, and in some years a passive integrated transponder (PIT) tag. A fin-clip was taken from each individual for isolation of DNA and subsequent genotyping [9].

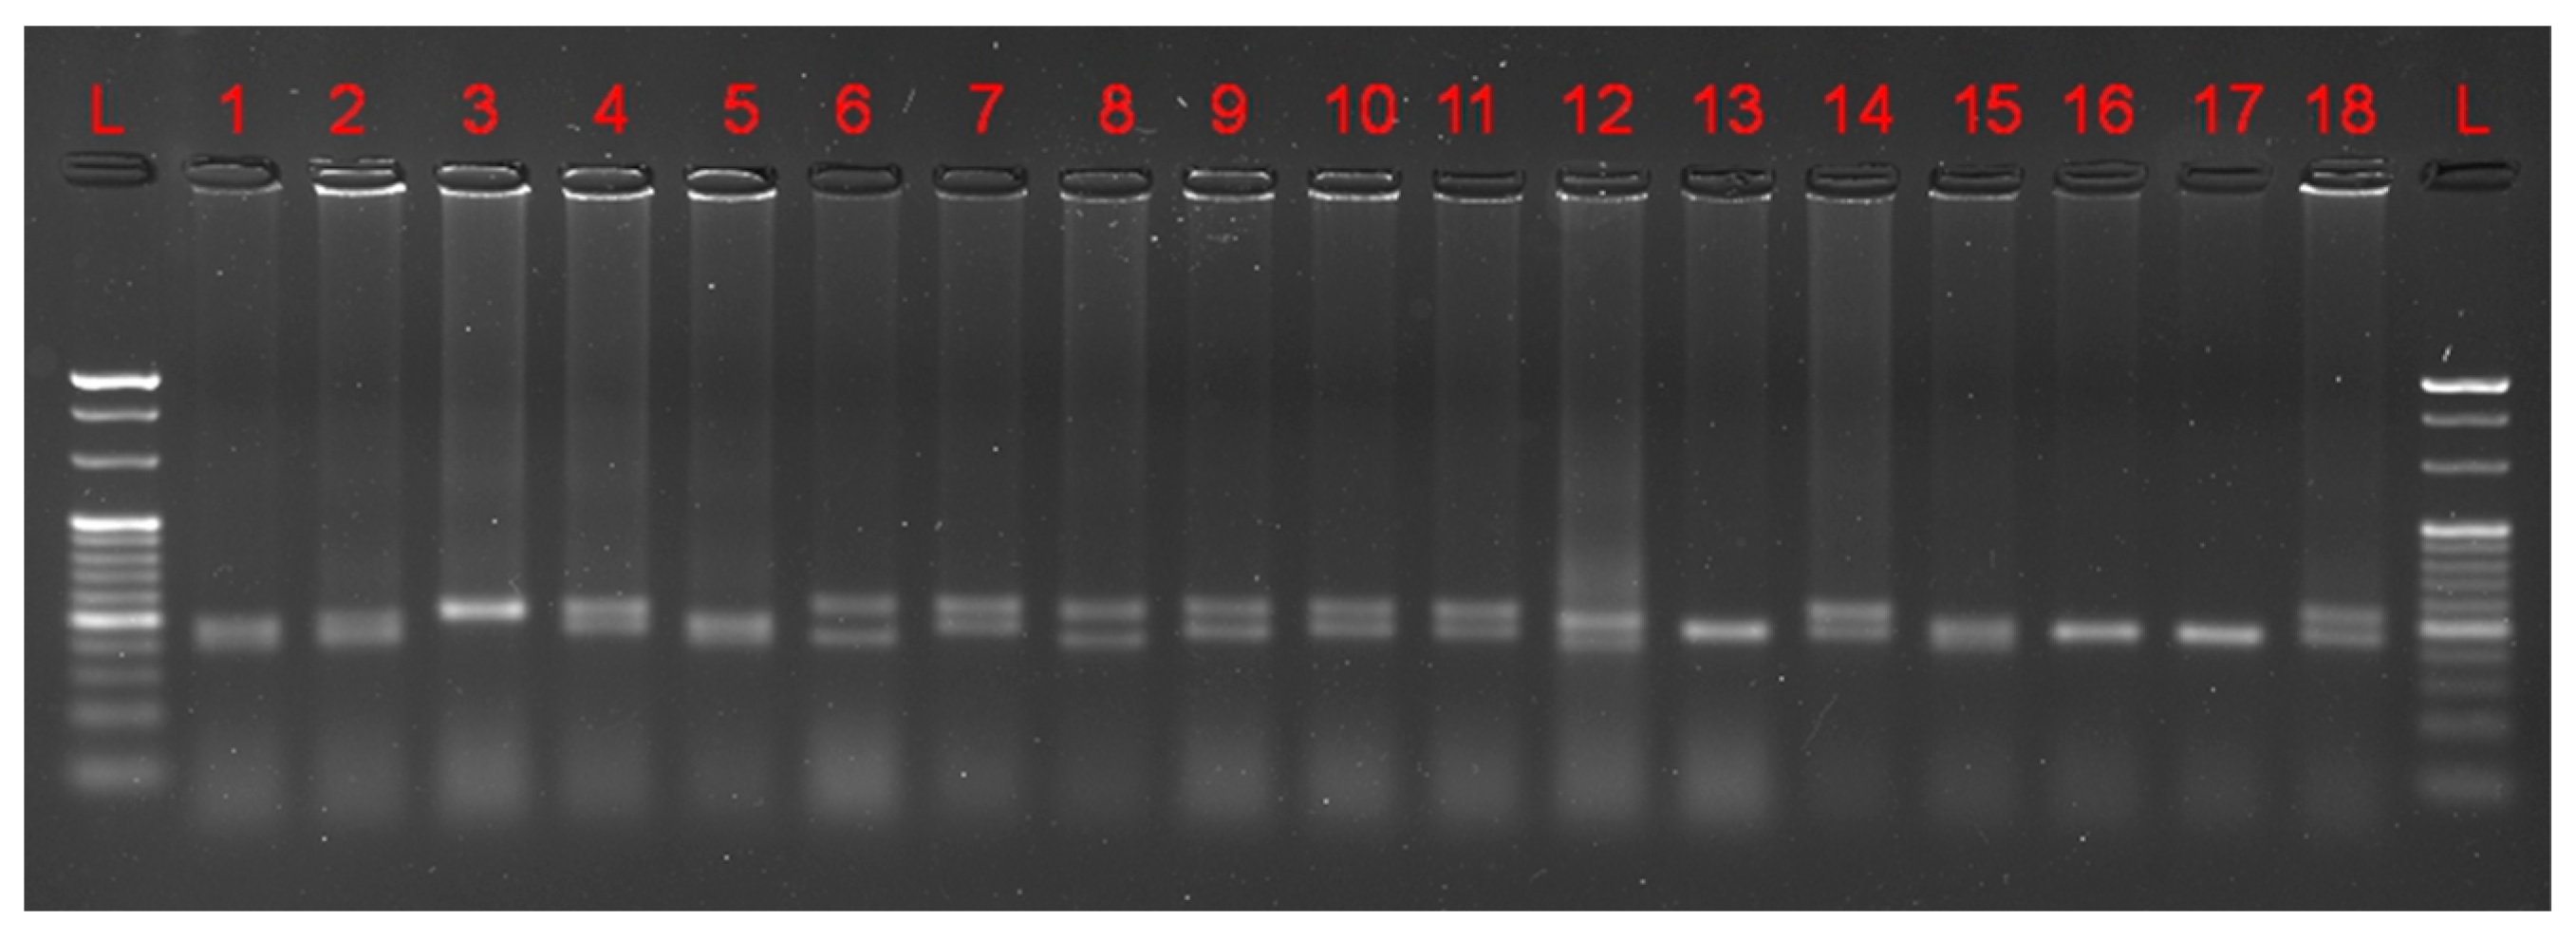
2.2. Molecular Methods

DNA was isolated from fin-clips using the DNEasy kit (Qiagen, Germantown, MD, USA). The Svi17 and Svi33 microsatellite loci [10], at which markers for upper New River loci were established by Palmer et al. [9], were screened. Each PCR reaction contained 4.5 µL of 5X Promega reaction buffer, 2.25 µL of 25 mM MgCl2, 2.5 mM dNTPs (Lucigen, Middleton, WI, USA), 0.18 U/µL GoTaq DNA polymerase (Promega, Madison, WI, USA), 5 mM forward primer and 5 mM reverse primer, 2 µL of sample DNA (25–200 ng/µL), and DI water to 17 mL. PCR reactions were performed in a T-100 thermal cycler (Bio-Rad Laboratories, Hercules, CA, USA). The thermocycling protocol consisted of 35 cycles of the following: denaturation for 30 s at 94 °C, annealing at a primer-specific temperature (Table 1) for 30 s, and elongation for 30 s at 72 °C; and a final elongation step for 10 min at 72 °C. Amplification products were separated on a 2.5% TBE agarose gel for 2 h. Amplicon sizes were estimated by visualizing bands using ethidium bromide and UV illumination, comparing band mobilities relative to those of walleye of known genotype (determined using an Applied Biosystems (Waltham, MA, USA) ABI 3730xl DNA sequencer, Institute of Biotechnology, Cornell University) and a 20 base-pair molecular weight size ladder (Takara Bio USA, Mountain View, CA, USA).
Genotyping results were reported to the Virginia Department of Wildlife Resources (VDWR) within 24 h of capture. Because individuals bearing four native alleles proved rare, individuals bearing at least three of the marker alleles associated with the native upper New River stocks at the two diagnostic loci (Svi17-99 bp and Svi 33-78 bp, [9]) were selected and their gametes crossed by VDWR hatchery personnel. Eggs from each female stripped were fertilized using milt from 3 to 4 males. The young were reared at the Front Royal, King and Queen, and Buller hatcheries, and fry or fingerlings subsequently were stocked in the upper New River. Adults bearing at least three native marker alleles were returned to the New River.
To provide quality assurance for hatchery operations after the progeny of selected walleye broodstock had been produced and reared, VDWR collected 30 individuals from ponds at each of the hatcheries in 2017. These fingerlings were screened at the diagnostic Svi17 and Svi33 microsatellite loci to determine the frequencies of native marker alleles. Genotyping was performed both by observation of UV fluorescence of amplification products in 2.5% ethidium bromide agarose gels following the same protocol used for genotyping of broodstock and also by amplification fragment-size analysis using an ABI 3730xl DNA sequencer (Cornell University).

2.3. Evaluation of Hatchery-Based Augmentation

To assess the efficacy of the marker-assisted selection and augmentation program in restoring the native population, walleye were collected from the upper New River by gillnet each fall from 2001 to 2021 and electrofishing each spring from 2000 to 2022, and relative abundance was quantified over time.
Fall gill net surveys were conducted using adjacent net sets of two 30.5 m experimental gill nets with four 7.6 m by 2.4 m panels with bar mesh sizes ranging from 1.27 cm to 6.35 cm. Gill nets were set in middle and lower Claytor Reservoir areas primarily during late October annually. Catch rates were calculated based on total walleye catch per net night.
Spring electrofishing was conducted primarily during April and May using a 5.2 m electrofishing boat outfitted with a Smith-Root 5.0GPP electrofishing system in years with suitable river flow conditions at upper New River sites from Allisonia to Fries Dam. Catch rates were calculated based on total walleye collected per hour of electrofishing. Fin-clips were taken, and allele frequencies at diagnostic loci Svi17 and Svi33 were determined.
As one fishery management goal was to increase catch of trophy fish, to assess angler catches of large fish, we consulted the Online Virginia Angler Recognition Program (OVARP) at https://dwr.virginia.gov/fishing/trophy-fish/citations/ (accessed 11 July 2022), where a citation walleye is defined as weighing 2.27 kg or measuring 63.5 cm total length (TL). We defined trophy walleye as those weighing over 4 kg.

3. Results

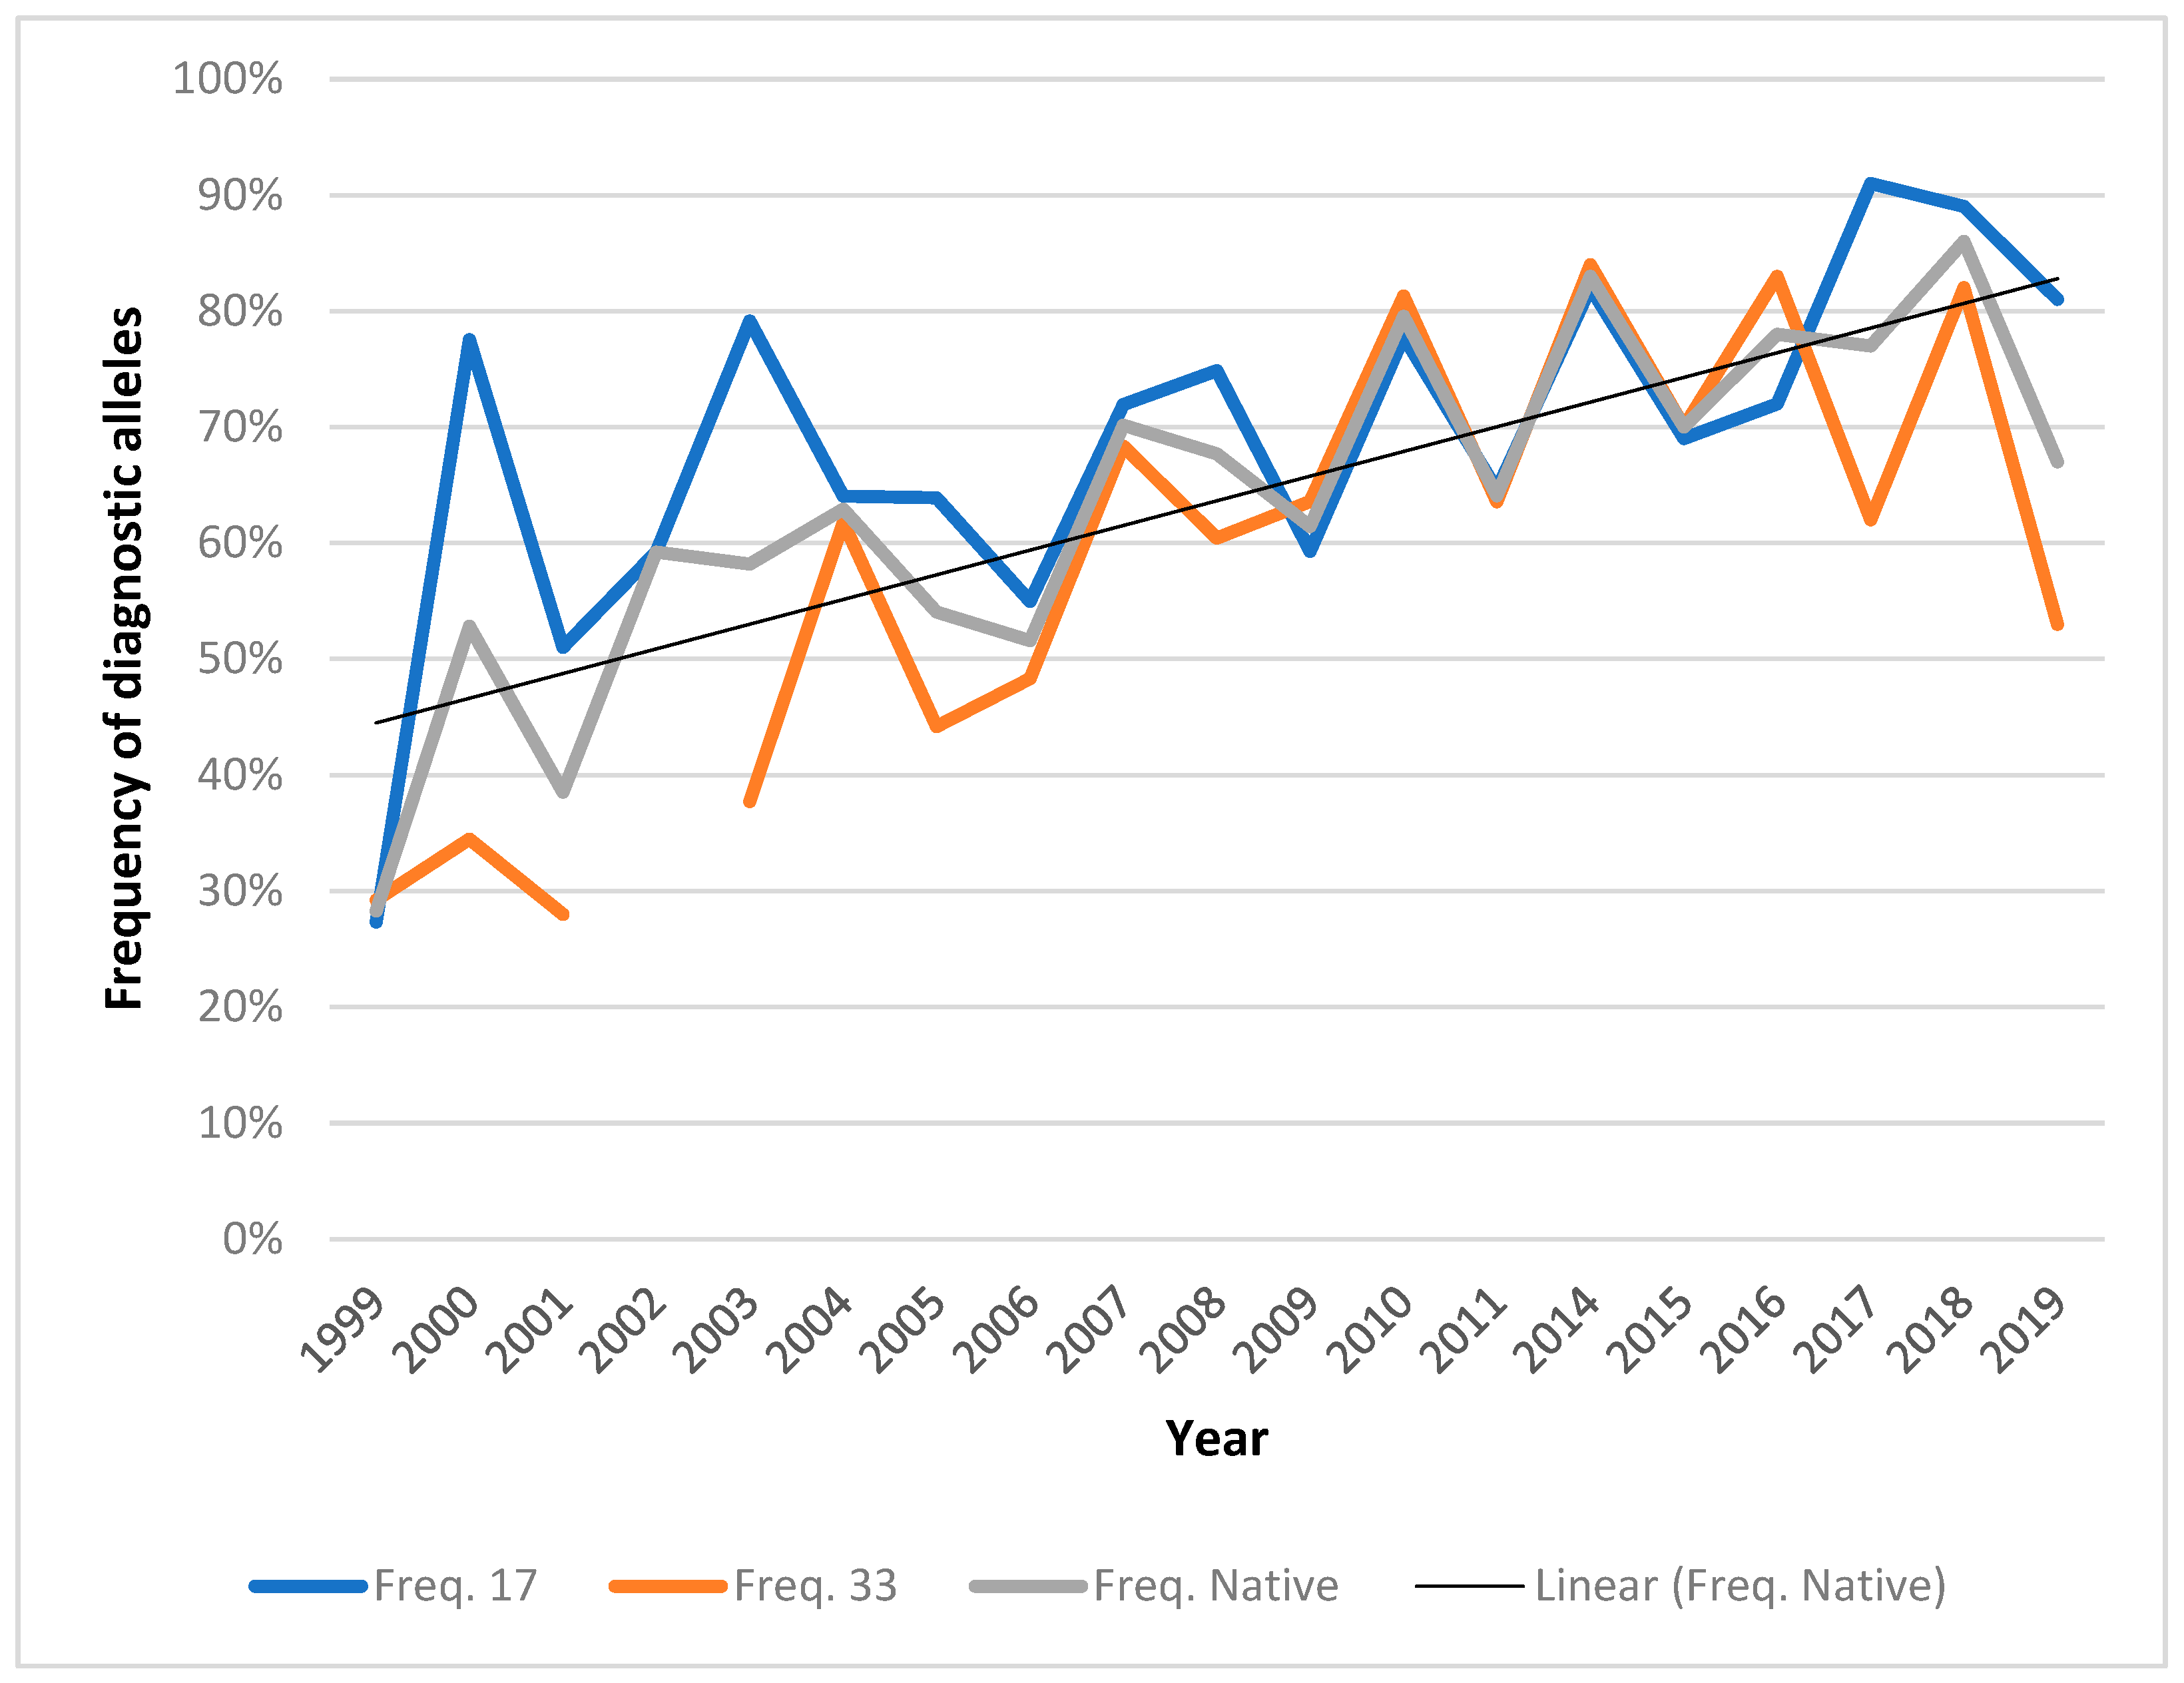
3.1. Marker-Assisted Selection

Numbers of walleye broodstock candidates collected each spring ranged from 28 to 200. Broodstock candidates were genotyped to observe Svi17-99 bp and Svi33-78 bp alleles characteristic of the native New River population (Figure 2). Numbers of walleye identified and spawned as native New River broodstock varied among years (Table 1), ranging from 9 females in 2000 and 2002 to 36 in 2017. The number of females successfully spawned and subsequent rearing success in the hatchery in turn affected the number of offspring that subsequently were stocked, ranging from 10,000 fingerlings in 2000 and 2018 to 156,000 in 2004. Fry were stocked only early in the program, 500,000 in 2001 and 100,000 in 2003. While numbers and locations have varied between years, native walleye have been stocked along the entire upper New River (i.e., well above Claytor Reservoir) to re-establish or augment the walleye population (Table 1).
The direct results of marker-assisted selection were evaluated in 2017 for progenies produced at the Front Royal, King and Queen, and Buller Hatcheries. All three hatcheries had been given walleye broodstock bearing native alleles for propagation. Individuals exhibiting at least three diagnostic alleles at the two marker loci were considered “native” for this analysis. Genotyping of fingerlings showed that all hatchery lots had >50% frequencies of both native marker alleles. Buller Hatchery, the main hatchery used for marker-assisted selection, had 0.75, 0.58, and 0.62 frequencies of native walleye fingerlings across the three ponds utilized during the fingerling production season. Front Royal hatchery had a 0.66 frequency and King and Queen hatchery a 0.53 frequency of native walleye so defined.
With practice of MAS, raw frequencies of marker alleles increased from the 16% and 14% at loci Svi17 and Svi33, respectively, observed in the baseline 1997 and 1999 surveys [7]. Marker alleles at both Svi17 and Svi33 exhibited mean frequencies across both spring and fall surveys of around 60% by 2007 and 80% by 2017 (Figure 3).

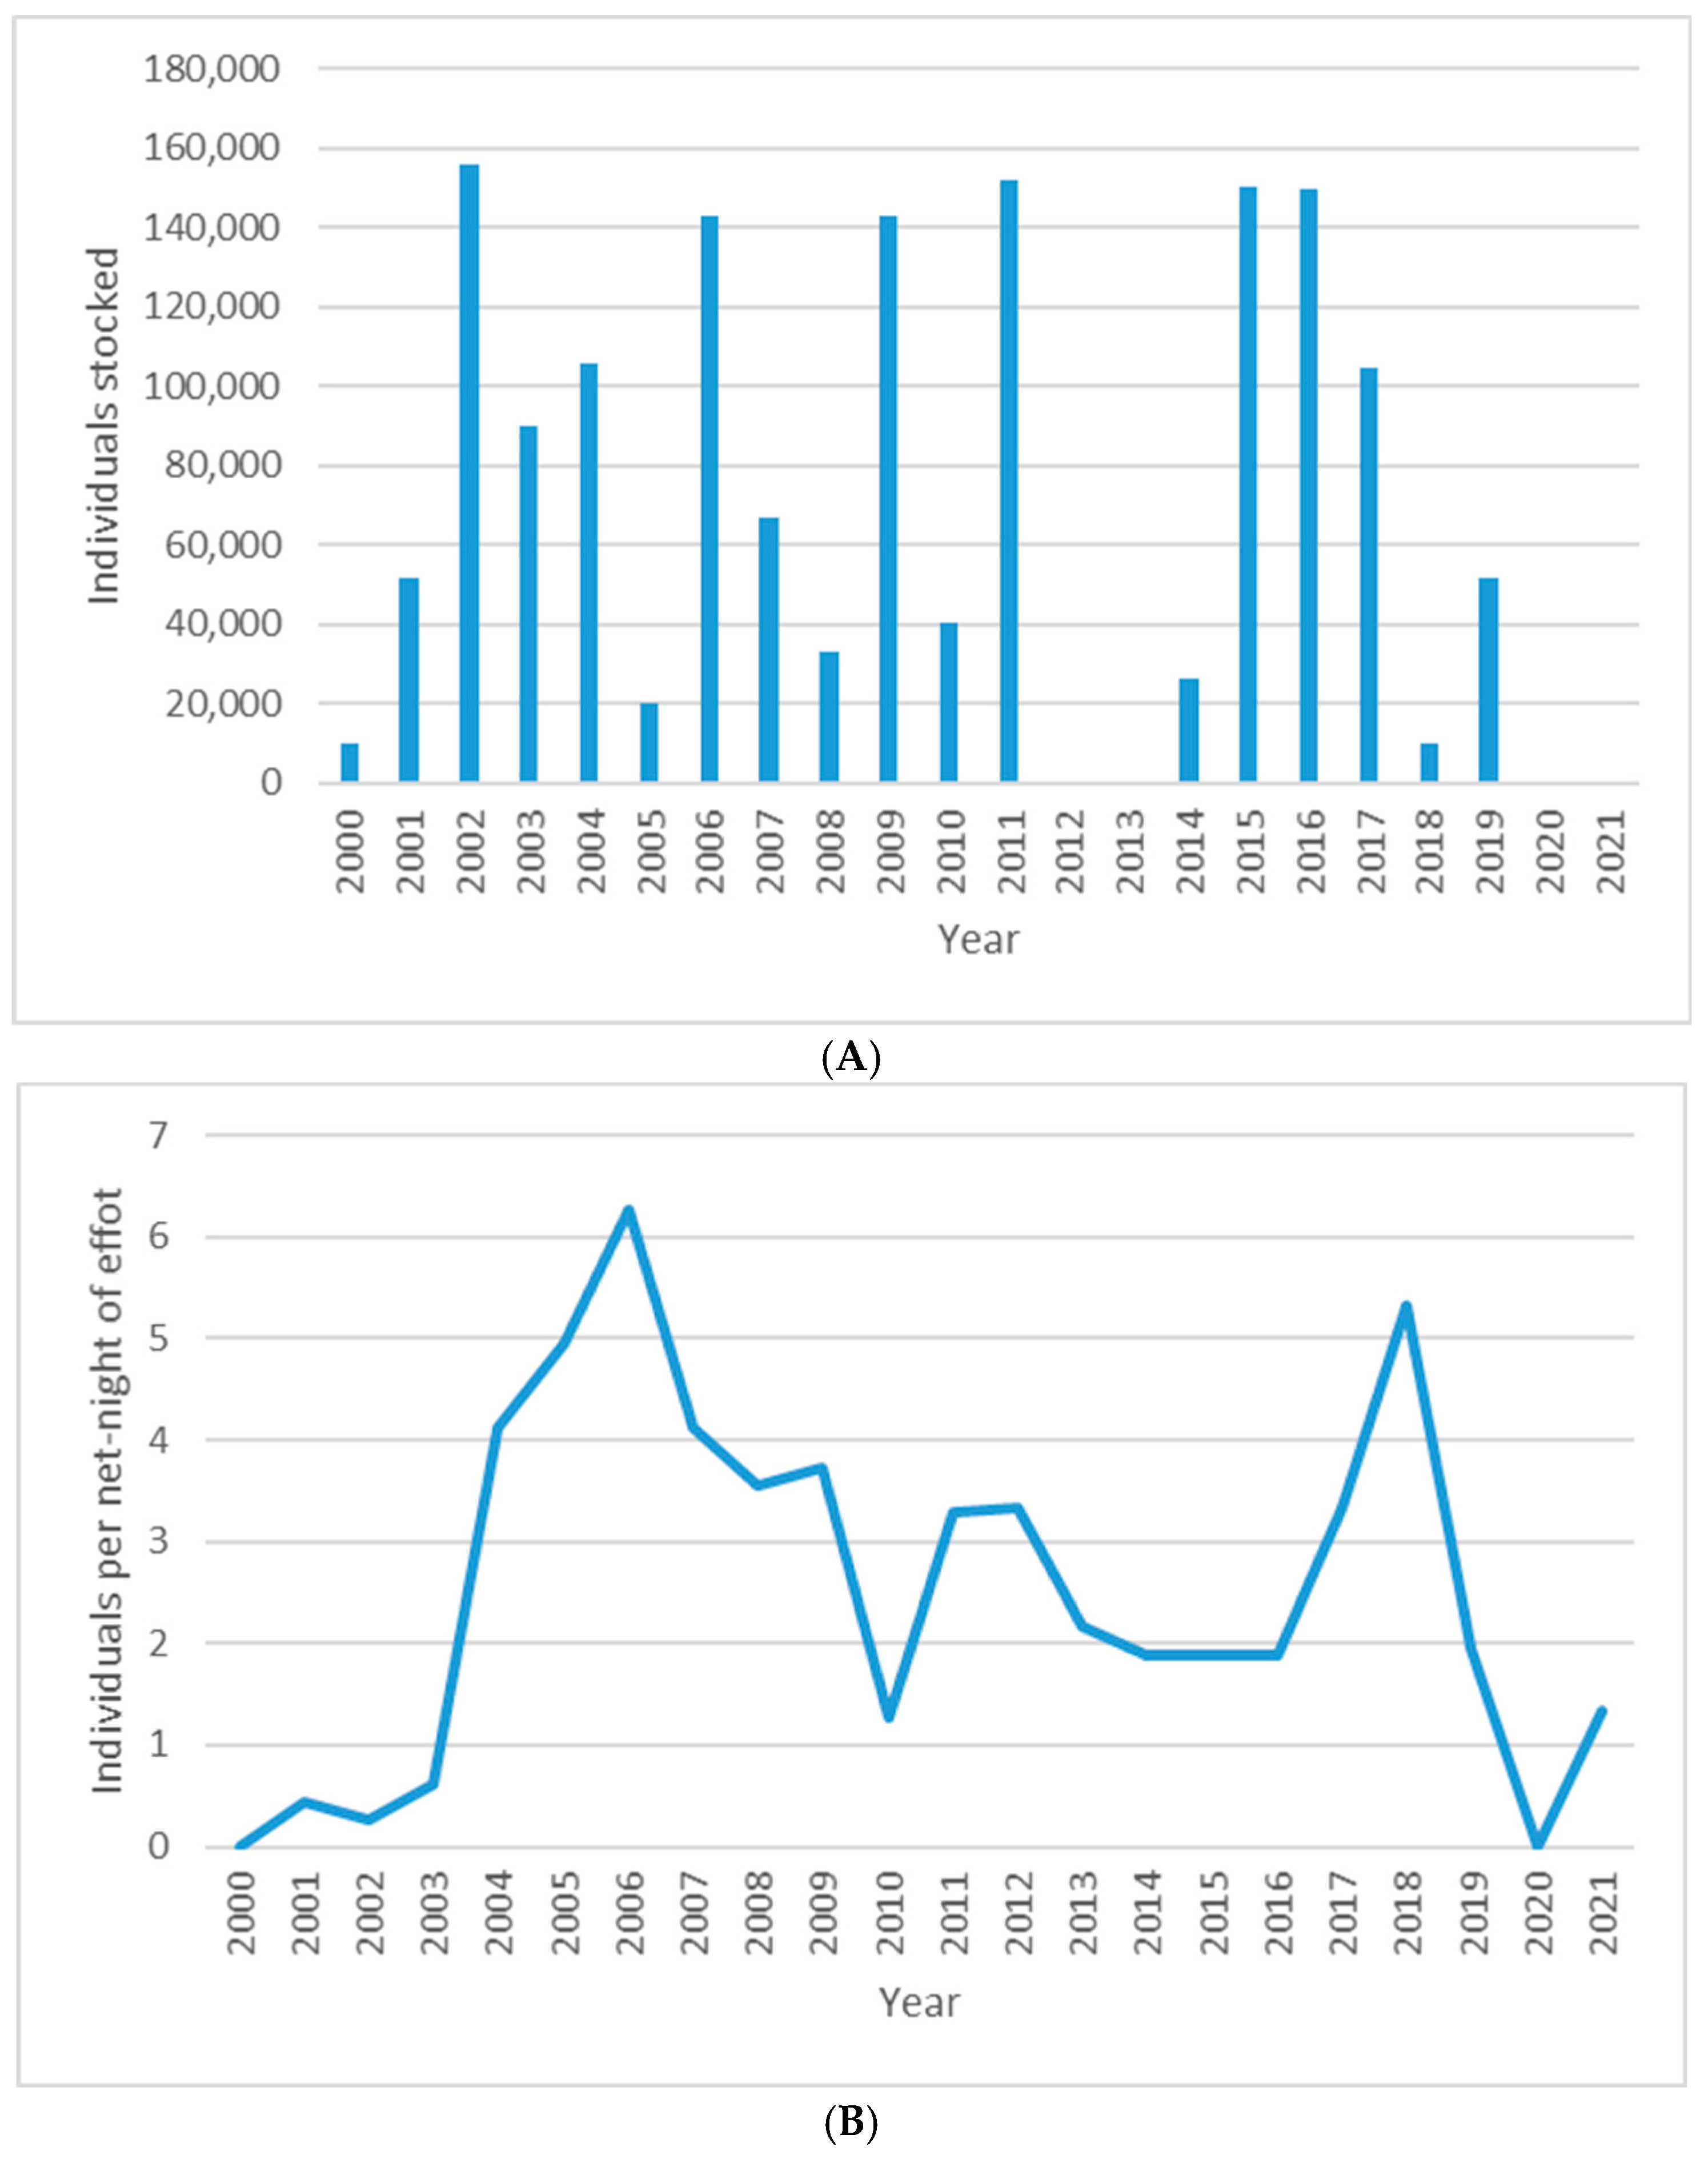
3.2. Augmentation of Upper New River Walleye

Hatchery-based augmentation (Figure 4A) led to increased relative abundance of upper New River walleye measured as catch per unit of effort (CPUE). Catch per net-night of effort in fall gillnet surveys in Claytor Reservoir are shown in Figure 4B. CPUE was lowest at the beginning of the time series and rose with a roughly three-year lag following the onset of stocking. We attribute this lag to the time that it takes for a young-of-year walleye to recruit to the collecting gear, whether gillnet or electroshocker. Lack of stocking in 2012 and 2013 led to decreased CPUE in subsequent years. CPUE rose three years after stocking resumed. Figure 4C shows CPUE per hour of effort for spring electrofishing surveys in the upper New River. CPUE was lowest early in the time-series, responding with a roughly three-year lag to stocking. CPUE peaked in 2011, and declined after stocking was not practiced in 2012 and 2013. CPUE climbed again after stocking resumed.
Over the 20 years for which citation data are available, 418 citation walleye were reported for the New River and Claytor Reservoir (Table 2), representing 28.7% of citation walleye in Virginia. Fifty-three walleye weighing over 4 kg were reported, representing 63.1% of such fish. Catches of fish from the New River and Claytor Reservoir in both categories were fewer in the three-to-five years following 2012 and 2013 when stocking was not practiced, and higher in 2019, the last year for which data are available.

4. Discussion

The purpose of hatchery-based augmentation of a fish population is to ensure the possibility of recruitment each year that it is practiced. Walleye exhibits highly variable recruitment among years and waterbodies [11,12]. Recruitment of walleye is affected by a large number of biotic and abiotic factors [13]. Previous analyses have identified biotic predictors of walleye recruitment in lakes, including adult stock size [11,14,15] as well as predation and competition by other species [16,17,18]. Abiotic factors affecting walleye recruitment have been identified, including lake size [19], spring water temperatures [11,20,21], a surrogate for regional climate variability [15], and water levels [14,21]. Hansen et al. [22] were able to model recruitment success based on lake surface area, water temperature degree-days, shoreline development factor, and conductivity. Of the variables analyzed by Honsey et al. [23], degree-days during the first year of life and first winter severity were the most important for predicting recruitment of lake walleye, with relatively weak year-classes predicted to occur with cold first growing seasons and severe first winters. However, we know of no such explanatory or predictive models for recruitment of walleye for highly variable, large riverine ecosystems, where in addition to thermal variation, there is also variation in flow and water level, all affecting the suitability of habitat available to young-of-year walleye. Hence, variable recruitment of walleye is an uncontrollable factor affecting the year-to-year results and programmatic efficacy of this supplementation approach.
Although walleye supplementation has been widely practiced, its effectiveness is not well studied, especially in river systems. In this report, we present evidence that hatchery-based augmentation contributed to recruitment of the upper New River walleye stock. We note that two walleye stocks historically occurred in the upper New River [8], the native stock spawning at Fosters Falls and at the foot of Buck Dam, and a mixture of native and introduced genotypes at Allisonia just above Claytor Reservoir. Stocking of walleye sourced from outside the New River ceased in 1997. Lacking augmentation for over 25 years, the spawning assemblage at Allisonia has decreased (G. Palmer, personal observation), supporting our inference that augmentation is required to support walleye in the anthropogenically disturbed upper New River. While many freshwater fisheries have been supplemented with hatchery-produced juveniles, few non-salmonid supplementation programs have been evaluated as thoroughly as this one, over 18 years of supplementation, with a pause to assess the impact of its cessation, and then resumption of stocking.
Justifications for maintaining native fish populations within riverine ecosystems include maintenance of historical biodiversity and local adaptation [24]. Adaptation to different cation/anion or metal concentrations was inferred for two Georgian Bay, Ontario, walleye populations [25]. Individual choice of spawning habitat (rocky lake shoals or riverine rapids) was shown to be heritable for walleye in Iowa [26]. Walleye show considerable spawning philopatry in the Great Lake region [24,27]. Native-origin walleye stocked in five Minnesota lakes increased in frequency relative to non-native walleye over time [28], suggesting local adaptation. Upper New River walleye exhibit large ultimate size (over 7 kg), supporting a trophy fishery. Local adaptations include spawning in riverine rapids [8], and production of large eggs [29], giving rise to large, active larvae that can feed effectively and subsequently recruit in a flowing-water system. While there is some level of natural reproduction, as young-of-year walleye were observed even in years without augmentation. However, the upper New River population, like many native walleye populations, especially those in impounded rivers, needs artificial augmentation to increase target population size and hopefully become self-sustaining demographically. Unfortunately, before population genetic structuring and possible local adaptations of native walleye populations were recognized, there were many cases of stocking non-native walleyes in native gene pools. This context, which is not unique to walleye management, complicates the augmentation or restoration of native populations.

4.1. MAS-Based Walleye Augmentation

Genetic variants characterizing native populations can be used for marker-assisted selection of broodstock. Microsatellite markers proved useful for distinction of native and non-native broodstock candidates for restoration of Dungeness River, Washington, pink salmon Oncorhynchus gorbuscha [30]. Microsatellite variation supported real-time differentiation among threatened summer- and winter-run Hood River, Oregon, steelhead O. mykiss in support of conservation-oriented propagation [31]. Following MAS and hatchery-based augmentation of upper New River walleye, we observed increased frequencies of marker alleles over time (Figure 3). The respective alleles showed differences in the rate of increase. This is because of the frequencies of the respective marker alleles. Svi17 more often presented the opportunity for selection of homozygotes; Svi33 being the more variable locus presented less-frequent opportunity to select homozygotes. Additionally, native walleye were previously collected in fast-moving reaches, considered to be the areas of the upper New River where ‘native’ genotypes and associated phenotypes would be favored. As marker-assisted selection has progressed, individuals bearing native genotypes are now being collected more frequently in other areas as well, including Claytor Reservoir and Allisonia just upstream, showing that native New River walleye are becoming more frequent across the entire upper New River ecosystem. However, since stocking from multiple outside sources occurred from 1939 to 1997, there is a low likelihood that the upper New River walleye gene pool could ever again be entirely native.
We observed changes not only in genetic composition, but also in catch-per-unit effort in fall gillnet and spring electrofishing surveys (Figure 4B,C). Decrease in catch rates for walleye, including citation and trophy walleye, after no stocking in 2012–2013, and subsequent recovery after stocking resumed suggest that the native New River walleye population is still dependent upon hatchery-based augmentation. The impoundment of key, rocky reaches of the upper New River by Claytor and Buck dams inundated historic spawning and nursery areas, limiting the ability of the population to once again sustain itself.
The Virginia Department of Wildlife Resources has practiced marker-assisted selection and hatchery-based augmentation of upper New River walleye since 2001. Our early results with walleye augmentation [9] were such that, although different genetic markers were used, marker-assisted selection was adopted as an approach to restoration of native walleye populations in West Virginia [32], Kentucky [33], and Missouri [34]. The Virginia program being the longest-running program of MAS for walleye, an evaluation of its efficacy over the time series is appropriate. While a demographic boost of walleye numbers in the upper New River was demonstrated, we found that it has not led to a heightened level of natural reproduction sufficient to maintain the native upper New River walleye population. The walleye augmentation program adopted the practice of not reusing broodstock and of using multiple males to fertilize each female’s egg lot to limit the likelihood of genetic bottleneck or inbreeding. The frequencies of different degrees of relatedness among individuals (full-sib, half-sib, and parent-offspring) within the augmented New River population resemble those seen in other walleye populations ([35], Chapter 2), although use of just eight microsatellite loci for relatedness assessment limits our confidence in these estimates. The inbreeding coefficient FIS for New River walleye is the lowest among 38 populations examined [36]. Walleye in the New River have estimated effective population size, Ne, values typical of other walleye populations examined [36]. Hence, we see no evidence of realization of a Ryman and Laikre [37] effect due to over-representation of hatchery-produced families within the augmented population.

4.2. Improving the MAS Protocol

Much progress has been achieved in development of molecular genetic markers for walleye since the native population was recognized [8], including 26 new microsatellite markers [28,38,39]. An evaluation of potential new markers for use in genetic marker-assisted selection was undertaken [35], but did not identify additional microsatellite alleles that mark native upper New River walleye. A particular microsatellite locus marks but a small proportion of the genome, perhaps 20 centiMorgans of recombinational distance bracketing the marker; with a genome likely of the order of 1000 centiMorgans in size, a few more markers would cover but a small increment of the genome. Further, MAS based on a limited number of nuclear loci will always be imprecise [30]. MAS based on mitochondrial markers [40] considers only the maternal ancestry of a focal individual. While our results showed that microsatellite markers provide a viable option, an approach combining mitochondrial and microsatellite markers would add to the rigor of an MAS protocol.
Another concept might be applied to assess the efficacy of hatchery augmentation. Letcher and King [41] described a “family-printing” approach to assess the contribution of hatchery-reared fish to an augmented population that uses multilocus microsatellite genotypes of individual mating adults to uniquely identify first- and second-generation offspring in the augmented mixture. The authors showed that with as few as seven alleles per locus using four loci scored without error, first-generation offspring can be uniquely assigned to the correct family. Using microsatellite DNA variation from an Atlantic salmon Salmo salar restoration project on the Connecticut River, they showed 100% correct first-generation assignment and 97% correct second-generation assignment for sea-run returns using 14 marker loci. Parentage-based tagging is being used to provide information to managers in state, federal, and tribal agencies on the harvest, research, and conservation of Chinook salmon Oncorhynchus tshawytscha and steelhead Oncorhynchus mykiss in the Pacific Northwest of the United States [42]. Stelle et al. [43] reviewed application of the parentage-based tagging approach more generally. With the use of more microsatellite or other markers, family-printing might be applied to assess the success of stocking for future generations of native New River walleye.
Single nucleotide polymorphisms (SNPs) could be developed to cover more of the genome and perhaps also to identify adaptive genetic variation between New River and other populations. Diagnostic SNP markers have been developed for Mobile basin [44] and Eastern Highlands [45,46] walleye, and likely could be developed for upper New River and other walleye populations. A new GTSeq resource has been developed to facilitate research and management of walleye across the Great Lake region [47], some markers of which may prove useful for purposes of MAS for upper New River or other populations of walleye. Assays would have to be developed to score diagnostic SNP assays within 24 h of candidate broodstock collection in order to prove useful for MAS.
We note that deep genomic coverage with SNPs that would clearly identify native New River walleye and estimate the extent of introgression (1) was not available when the program of MAS began, and (2) is not feasible for rapid screening of broodstock candidates given time constraints and the resources of a hatchery. Hatcheries have and, in the near term, will likely still rely on an incomplete and flawed picture of the genome for screening of broodstock candidates. Still, evaluative studies like that reported here can critically evaluate the costs and benefits of genetic screening and MAS. While we note that nuclear markers allow for the degree of introgression to be better understood than a mitochondrial marker, their frequency and linkage may eventually become a result of contemporary processes (i.e., broodstock selection and breeding) and cease to reflect the lineage as they originally do. The high mutation rate of microsatellites also creates the potential problem of homoplasy. Further, the severity of errors in MAS may differ across systems. Stricter selection criteria may limit broodstock contributors and lower effective population size, while looser criteria may do a poor job of maintaining the native strain. A higher frequency of the neutral allele being selected in the hatchery may suggest that augmentation is effective, but there is also the potential for maladaptive alleles and traits to be added to the system as a result of captive breeding. While we expressly recognize that MAS is imperfect, the alternative is to not practice selection of prospective walleye broodstock.

5. Conclusions

To restore the native stock of walleye in the upper New River of Virginia (USA), we practiced genetic marker-assisted selection of broodstock candidates for hatchery production of fingerlings subsequently stocked in the system. To increase representation of the native genetic background, we (1) collected broodstock candidates from areas where the native stock was known to predominate, and (2) selected candidates that bore genetic markers characteristic of the native stock. The relative abundance of walleye in fall gillnet and spring electrofishing surveys increased following years when such stocking was practiced, suggesting that the native stock had been augmented. Catches of citation- and trophy-sized walleye also suggested the impact of hatchery-based augmentation. Our approach of genetic marker-assisted, hatchery-based augmentation of walleye subsequently was adopted in three other states where river-spawning walleye fisheries are important.

Author Contributions

Conceptualization, G.P. and E.H.; methodology, S.H., G.P., J.C., J.W., and E.H.; validation, S.H., G.P., J.C., J.W., and E.H.; formal analysis, S.H. and E.H.; investigation, S.H., G.P., J.C., J.W., and E.H.; resources, S.H., G.P., J.C., J.W., and E.H.; data curation, S.H.; writing—original draft preparation, S.H.; writing—review and editing, S.H., G.P., J.C., J.W., and E.H.; visualization, S.H. and E.H.; supervision, E.H.; project administration, E.H.; funding acquisition, E.H. All authors have read and agreed to the published version of the manuscript.

Funding

This work was supported by the Virginia Department of Wildlife Resources under grant number 2015-10 with funding from the Federal Aid in Sportfish Restoration program. The participation of EMH was supported in part by the Virginia Agricultural Experiment Station and the U.S. Department of Agriculture National Institute for Food and Agriculture.

Institutional Review Board Statement

All work was in accordance with collection permits issued by the Virginia Department of Wildlife Resources and Protocol 16-188FIW, approved by the Virginia Tech Institutional Animal Care and Use Committee on 1 November 2016.

Informed Consent Statement

Not applicable.

Data Availability Statement

The data presented in this study are available upon request from the corresponding author.

Acknowledgments

We gratefully acknowledge the hard work of Virginia Department of Wildlife Resources hatchery staff that produced the walleye stocked in the upper New River. This manuscript was improved by attention to the comments of four peer reviewers.

Conflicts of Interest

The authors declare no conflicts of interest.

References

  1. Steinkoenig, E.; Hampton, T.; Reeser, S.; Greenlee, B. The walleye in Virginia. Virginia Wildl. 2001, 61, 10–26. [Google Scholar]
  2. Owens, S.J.; Palmer, G.; Hampton, T.; Wilson, D.; Harris, J. Differences in angler catch and exploitation of walleye from Virginia Waters. J. Southeast. Assoc. Fish Wildl. Agenc. 2014, 1, 14–19. [Google Scholar]
  3. McCotter, C.C. New River walleye: A late season bonus. Woods Waters Mag. 2006. Available online: https://woodsandwatersmagazine.com/ (accessed on 3 March 2025).
  4. Ingram, B. The upper New’s mystery fish. Virginia Wildl. 2007, 67, 8–11. [Google Scholar]
  5. Murphy, B.R.; Nielson, L.A.; Turner, B.J. Use of genetic tags to evaluate stocking success for reservoir walleyes. Trans. Am. Fish. Soc. 1983, 112, 457–463. [Google Scholar] [CrossRef]
  6. Jenkins, R.E.; Burkhead, N.M. Freshwater Fishes of Virginia; American Fisheries Society: Bethesda, MD, USA, 1994. [Google Scholar]
  7. Palmer, G.C. Genetic Characterization of Intermixed Walleye Stocks in Claytor Lake and the Upper New River, Virginia. Master’s Thesis, Virginia Polytechnic Institute and State University, Blacksburg, VA, USA, 1999. [Google Scholar]
  8. Palmer, G.C.; Culver, M.; Dutton, D.; Murphy, B.R.; Hallerman, E.M.; Billington, N.; Williams, J. Genetic distinct walleye stocked in Claytor Lake and the Upper New River, Virginia. Proc. Southeast. Assoc. Fish. Wild. Agenc. 2006, 60, 125–131. [Google Scholar]
  9. Palmer, G.C.; Williams, J.; Scott, M.; Finne, K.; Johnson, N.; Dutton, D.; Murphy, B.R.; Hallerman, E.M. Genetic marker-assisted restoration of the presumptive native walleye fishery in the New River, Virginia and West Virginia. Proc. Annu. Conf. Southeast. Assoc. Fish. Wildl. Agenc. 2007, 61, 17–22. [Google Scholar]
  10. Borer, S.; Miller, L.M.; Kapuscinski, A.R. Microsatellites in walleye Stizostedion vitreum. Mol. Ecol. 1999, 8, 36–37. [Google Scholar]
  11. Hansen, M.J.; Bozek, M.A.; Newby, J.R.; Newman, S.P.; Staggs, M.D. Factors affecting recruitment of walleyes in Escanaba Lake, Wisconsin, 1958–1996. N. Am. J. Fish. Manag. 1998, 18, 764–774. [Google Scholar] [CrossRef]
  12. Bozek, M.A.; Baccante, D.A.; Lester, N.P. Walleye and sauger life history. In Biology, Management, and Culture of Walleye and Sauger; Barton, B., Ed.; American Fisheries Society: Bethesda, MD, USA, 2011; pp. 233–301. [Google Scholar]
  13. Baccante, D.A.; Colby, P.J. Harvest, density and reproductive characteristics of North American walleye populations. Ann. Zool. Fenn. 1996, 33, 601–615. [Google Scholar]
  14. Chevalier, J.R. Changes in walleye (Stizostedion vitreum vitreum) population in Rainy Lake and factors in abundance, 1924–1975. J. Fish. Res. Board Can. 1977, 34, 1696–1702. [Google Scholar] [CrossRef]
  15. Beard, T.D., Jr.; Hansen, M.J.; Carpenter, S.R. Development of a regional stock–recruitment model for understanding factors affecting walleye recruitment in northern Wisconsin lakes. Trans. Am. Fish. Soc. 2003, 132, 382–391. [Google Scholar] [CrossRef]
  16. Forney, J.L. Evidence of inter- and intraspecific competition as factors regulating walleye (Stizostedion vitreum vitreum) biomass in Oneida Lake, New York. J. Fish. Res. Board Can. 1977, 34, 1812–1820. [Google Scholar] [CrossRef]
  17. Madenjian, C.P.; Tyson, J.T.; Knight, R.L.; Kershner, M.W.; Hansen, M.J. First-year growth, recruitment, and maturity of walleyes in western Lake Erie. Trans. Am. Fish. Soc. 1996, 125, 821–830. [Google Scholar] [CrossRef]
  18. Fielder, D.G.; Schaeffer, J.S.; Thomas, M.V. Environmental and ecological conditions surrounding the production of large year classes of walleye (Sander vitreus) in Saginaw Bay, Lake Huron. J. Gt. Lakes Res. 2007, 33 (Suppl. S1), 118–132. [Google Scholar] [CrossRef]
  19. Nate, N.A.; Bozek, M.A.; Hansen, M.J.; Hewett, S.W. Variation in walleye abundance with lake size and recruitment source. N. Am. J. Fish. Manag. 2000, 20, 119–126. [Google Scholar] [CrossRef]
  20. Serns, S.L. Influence of various factors on density and growth of age-0 walleyes in Escanaba Lake, Wisconsin, 1958–1980. Trans. Am. Fish. Soc. 1982, 111, 299–306. [Google Scholar] [CrossRef]
  21. Quist, M.C.; Guy, C.S.; Bernot, R.J.; Stephen, J.L. Factors related to growth and survival of larval walleyes: Implications for recruitment in a southern Great Plains reservoir. Fish. Res. 2004, 67, 215–225. [Google Scholar] [CrossRef]
  22. Hansen, G.J.; Carpenter, S.R.; Gaeta, J.W.; Hennessy, J.M.; Vander Zanden, M.J. Predicting walleye recruitment as a tool for prioritizing management actions. Can. J. Fish. Aquat. Sci. 2015, 72, 661–672. [Google Scholar] [CrossRef]
  23. Honsey, A.E.; Feiner, Z.S.; Hansen, G.J. Drivers of walleye recruitment in Minnesota’s large lakes. Can. J. Fish. Aquat. Sci. 2020, 77, 1921–1933. [Google Scholar] [CrossRef]
  24. Stepien, C.A.; Murphy, D.J.; Lohner, R.N.; Sepulveda-Villet, O.J.; Haponski, A.E. Signatures of vicariance, postglacial dispersal and spawning philopatry: Population genetics of the walleye Sander vitreus. Mol. Ecol. 2009, 18, 3411–3428. [Google Scholar] [CrossRef] [PubMed]
  25. Fox, M.G. A comparison of zygote survival of native and non-native walleye stocks in two Georgian Bay rivers. Environ. Biol. Fish. 1993, 38, 379–383. [Google Scholar] [CrossRef]
  26. Jennings, M.J.; Claussen, J.E.; Philipp, D.P. Evidence for heritable preferences for spawning habitat between two walleye populations. Trans. Am. Fish. Soc. 1996, 125, 978–982. [Google Scholar] [CrossRef]
  27. Stepien, C.A.; Farber, J.E. Population genetic structure, phylogeography and spawning philopatry in walleye (Stizostedion vitreum) from mitochondrial DNA control region sequences. Mol. Ecol. 1998, 7, 1757–1769. [Google Scholar] [CrossRef]
  28. Eldridge, W.E.; Bacigalupi, M.D.; Adelman, I.R.; Miller, L.M.; Kapuscinski, A.R. Determination of relative survival of two stocked walleye populations and resident natural-origin fish by microsatellite DNA parentage assignment. Can. J. Fish. Aquat. Sci. 2002, 59, 282–290. [Google Scholar] [CrossRef]
  29. Hopkins, C.B.; Hilling, C.D.; Orth, D.J. Egg Size Variation Among Walleye in Virginia; Department of Fish and Wildlife Conservation, Virginia Polytechnic Institute and State University: Blacksburg, VA, USA, 2018; Unpublished Manuscript. [Google Scholar]
  30. Olsen, J.B.; Bentzen, P.; Banks, M.A.; Shaklee, J.B.; Young, S. Microsatellites reveal population identity of individual pink salmon to allow supportive breeding of a population at risk of extinction. Trans. Am. Fish. Soc. 2000, 129, 323–342. [Google Scholar] [CrossRef]
  31. Matala, A.P.; French, R.; Olsen, E.; Ardren, W.R. Ecotype distinctions among steelhead in Hood River, Oregon, allow real-time genetic assignment of conservation broodstocks. Trans. Am. Fish. Soc. 2009, 138, 1490–1509. [Google Scholar] [CrossRef]
  32. Scott, M.T. WVDNR Fisheries Management Plan: Native Walleye in the New River; West Virginia Department of Natural Resources: Charleston, WV, USA, 2012; 6p. [Google Scholar]
  33. Dreves, D.P.; Baker, D.; Cummins, E.; Frey, K.; Harrala, J.; Middleton, R.; Ross, J.; Williams, J. Conservation and Management Plan for the Native Walleye of Kentucky; Fisheries Division; Kentucky Department of Fish and Wildlife Resources: Frankfort, KY, USA, 2014; 16p. [Google Scholar]
  34. Berkman, L.K.; Titus, C.L.; Thomas, D.R.; Fluker, B.L.; Cieslewicz, P.; Knuth, D.; Koppelman, J.B.; Eggert, L.S. Genetic differences among the Interior Highlands walleye (Sander vitreus) with mitochondrial and nuclear markers indicate the need for updated stocking practices. Conserv. Genet. 2023, 24, 347–359. [Google Scholar] [CrossRef]
  35. Harris, S.C. Genetic Marker-Assisted Management of Virginia Sport fishes. Master’s Thesis, Virginia Polytechnic Institute and State University, Blacksburg, VA, USA, 2019. Available online: https://vtechworks.lib.vt.edu/bitstream/handle/10919/98505/Harris_SC_T_2020.pdf?sequence=1&isAllowed=y (accessed on 26 May 2022).
  36. Harris, S.C.; Palmer, G.; Stepien, C.A.; Hallerman, E.M. Population genetic differentiation of walleye (Sander vitreus) across the Eastern Highlands of the United States. Fishes 2024, 9, 15. [Google Scholar] [CrossRef]
  37. Ryman, N.; Laikre, L. Effects of supportive breeding on the genetically effective population size. Conserv. Biol. 1991, 5, 325–329. [Google Scholar] [CrossRef]
  38. Wirth, T.; Saint-Laurent, R.; Bernatchez, L. Isolation and characterization of microsatellite loci in the walleye (Stizostedion vitreum), and cross-species amplification within the family Percidae. Mol. Ecol. 1999, 8, 1960–1963. [Google Scholar] [CrossRef] [PubMed]
  39. Cena, C.J.; Morgan, G.E.; Malette, M.D.; Heath, D.D. Inbreeding, outbreeding and environmental effects on genetic diversity in 46 walleye (Sander vitreus) populations. Mol. Ecol. 2006, 15, 303–320. [Google Scholar] [CrossRef] [PubMed]
  40. White, M.M.; Kassler, T.W.; Phillip, D.P.; Schell, S.A. A genetic assessment of Ohio River walleyes. Trans. Am. Fish. Soc. 2005, 134, 661–675. [Google Scholar] [CrossRef]
  41. Letcher, B.H.; King, T.L. Targeted stock identification using multilocus genotype ‘familyprinting’. Fish. Res. 1999, 43, 99–111. [Google Scholar] [CrossRef]
  42. Jensen, A.J.; Schreck, C.B.; Hess, J.E.; Bohn, S.; O’Malley, K.G.; Peterson, J.T. Application of genetic stock identification and parentage-based tagging in a mixed-stock recreational Chinook salmon fishery. N. Am. J. Fish. Manag. 2021, 41, 130–141. [Google Scholar] [CrossRef]
  43. Steele, C.A.; Hess, M.; Narum, S.; Campbell, M. Parentage-based tagging: Reviewing the implementation of a new tool for an old problem. Fisheries 2019, 44, 412–422. [Google Scholar] [CrossRef]
  44. Zhao, H.; Silliman, K.; Lewis, M.; Johnson, S.; Kratina, G.; Rider, S.J.; Stepien, C.A.; Hallerman, E.M.; Beck, B.; Fuller, A.; et al. SNP analyses highlight a unique, imperiled southern walleye (Sander vitreus) in the Mobile River Basin. Can. J. Fish. Aquat. Sci. 2020, 77, 1366–1378. [Google Scholar] [CrossRef]
  45. Johnson, A.; Zipfel, K.; Hallerman, E.; Massure, W.; Euclide, P.; Welsh, A. Genomic evaluation of native walleye in the Appalachian region and the effects of stocking. Trans. Am. Fish. Soc. 2023, 152, 346–360. [Google Scholar] [CrossRef]
  46. Johnson, A.; Zipfel, K.; Welsh, A. Advancing conservation strategies for native Eastern Highlands-strain walleye Sander vitreus in West Virginia: Insights from genomic investigations and broodstock screening. Diversity 2024, 16, 371. [Google Scholar] [CrossRef]
  47. Euclide, P.T.; Larson, W.A.; Bootsma, M.; Miller, L.M.; Scribner, K.T.; Stott, W.; Wilson, C.C.; Latch, E.K. A new GTSeq resource to facilitate multijurisdictional research and management of walleye Sander vitreus. Ecol. Evol. 2022, 12, e9591. [Google Scholar] [CrossRef]
Figure 1. (A). Location of Virginia within the United States. (B). Study area for restoration of native upper New River walleye. Fries Dam is farther upstream. The red square show the location of the upper New river study area within the Commonwealth of Virginia.
Fishes 10 00118 g001
Figure 2. Representative ethidium bromide-stained agarose gel showing amplification products for the diagnostic Svi17 locus for 18 walleye broodstock candidates. Lanes labelled “L” for ladder show molecular weight markers.
Fishes 10 00118 g002
Figure 3. Frequencies of upper New River walleye marker alleles (Svi17-99 and Svi33-78) over time. The baseline year was 1999; marker-assisted selection and hatchery-based augmentation began in 2001. No stocking occurred in 2012 and 2013. The equation for the regression is y = 0.021x + 0.42, and the R2 value is 0.65.
Fishes 10 00118 g003
Figure 4. (A) Number of walleye stocked in the upper New River per year. (B) Catch of individuals per net-night of gillnet effort in fall surveys in Claytor Reservoir. (C) Catch of individuals per hour of electrofishing effort in spring surveys on the upper New River.
Fishes 10 00118 g004aFishes 10 00118 g004b
Table 1. Stocking of walleye into the upper New River during the study period. Stocking was not practiced in 2012–2013 to assess natural reproduction.
YearFemales
Spawned
Eggs
Produced
Fry StockedFingerlings
Stocked
Locations StockedNo. Stocked
per km
200090.5 million-10,000Allisonia to Buck Dam 283
2001202.2 million500,00051,840Allisonia to Buck Dam 1463
200290.9 million-156,200Allisonia to Fries Dam 3031
2003201.7 million100,00090,080Allisonia to Fries Dam 1748
2004172.0 million-106,000Allisonia to Fields Dam 889
2005232.5 million-20,000Allisonia to Buck Dam 564
2006111.0 million-143,000Allisonia to Fields Dam 1200
2007110.66 million-67,140Allisonia to Buck Dam 1895
2008130.87 million-33,250Allisonia to Buck Dam 938
200917--143,000Allisonia to Fields Dam 1200
201014--40,612Allisonia N/A
201114--151,912Allisonia to Fries Dam 2948
201418--26,354Allisonia N/A
201517--150,100Allisonia to Fries Dam 2913
201624--150,000Allisonia to Fries Dam 2911
201736--105,000Allisonia to Fries Dam 2038
201830--10,000Allisonia to Buck Dam 283
201923--51,840Allisonia to Buck Dam 1463
Table 2. Catches of citation (2.27 kg or 63.5 cm TL) and trophy (4 kg) walleye in waters of Virginia.
CitationTrophy
YearNew R./
Claytor Res.
ElsewhereNew R./
Claytor Res.
Elsewhere
2000248530
2001179104
20021810672
2003158540
2004189431
2005189642
2006206023
2007115810
2008207530
2009324513
2010455713
2011193632
2012202141
2013271562
2014231533
201591710
2016112012
2017151511
2018141211
2019423341
Totals41810365331
Disclaimer/Publisher’s Note: The statements, opinions and data contained in all publications are solely those of the individual author(s) and contributor(s) and not of MDPI and/or the editor(s). MDPI and/or the editor(s) disclaim responsibility for any injury to people or property resulting from any ideas, methods, instructions or products referred to in the content.

