Article

Transcriptome Analysis of Immune Response Against Edwardsiella tarda Infection in Spotted Sea Bass (Lateolabrax maculatus)

1
Key Laboratory of Exploration and Utilization of Aquatic Genetic Resources, Ministry of Education, Shanghai Ocean University, Shanghai 201306, China
2
National Demonstration Center for Experimental Fisheries Science Education, Shanghai Ocean University, Shanghai 201306, China
3
Institute of Fisheries Science, Anhui Academy of Agricultural Sciences, Hefei 230031, China
*
Author to whom correspondence should be addressed.
These authors contributed equally to this work.
Fishes 2025, 10(4), 153; https://doi.org/10.3390/fishes10040153
Submission received: 10 February 2025 / Revised: 17 March 2025 / Accepted: 24 March 2025 / Published: 1 April 2025
(This article belongs to the Special Issue Interactions Between Fish and Pathogens in Aquaculture—2nd Edition)

Abstract

:
Edwardsiella tarda is a gram-negative bacterium reported to be one of the most harmful pathogens in aquaculture. In this study, we conducted transcriptome profiling of the head kidney, liver, and spleen in spotted sea bass (Lateolabrax maculatus) infected with E. tarda. A total of 22,015 unigenes were detected by de novo assembly and annotated by comparison with the major databases (NR, GO, COG, KEGG, Swiss-Prot), with 21,065 (NR:95.68%), 11,320 (GO:51.42%), 20,464 (COG:92.95%), 21,295 (KEGG:96.73%), 18,791 (Swiss-Prot:82%). Subsequently, a substantial number of differentially expressed genes (DEGs) were identified (p-adjust < 0.05). In the head kidney, liver, and spleen, there were 1302 upregulated genes and 503 downregulated genes, 377 upregulated genes and 530 downregulated genes, and 1240 upregulated genes and 736 downregulated genes, respectively. Additionally, the expression levels of eight immune-related DEGs were validated by qRT-PCR, further verifying the reliability of the transcriptome data. To the best of our knowledge, this is the first analysis of the transcriptome profile of L. maculatus in response to E. tarda. These findings not only offer fundamental insights into the antibacterial immune mechanisms of spotted sea bass but also serve as a reference for formulating more effective fish disease management strategies.
Key Contribution: This paper presents the first transcriptome profiling of spotted sea bass infected by E. tarda, identifying many DEGs in the head kidney, liver, and spleen. These genes, related to both innate and adaptive immunity, are involved in multiple crucial signaling pathways.

1. Introduction

Edwardsiella tarda, which is a typical gram-negative bacterium, has been reported to be able to infect a wide range of vertebrates, from lower fish to higher mammals [1]. As an intracellular bacterium, the slow infection of Edwardsiella spp. will occur in the cell internalization and proliferation. Because of the protection of its membrane, E. tarda can avoid body fluids and the lytic action of lysozyme during the phagocytosis by phagocytic cells. This causes damage to finfish skin, abnormal intestinal fluid secretion, abscesses, and bleeding in various internal organs, as well as severe inflammation of the digestive tract, eventually leading to the death of fish [2]. In the previous study, E. tarda infections led to a severe disease and fatal cases in flatfish such as Scophthalmus maximus [3,4,5]. And E. tarda also caused other fish to die, including Tilapia nilotica [6], Paralichthys olivaceus [7,8,9], Lates calcarifer [10], Pagrus major [11], Oncorhynchus mykiss [12], and Ictalurus punctatus [13]. Besides fish, E. tarda has been detected to infect various other species, such as birds, amphibians, and humans [14]. Notably, Edwardsiellosis, caused by E. tarda, is a type of generalized septicemia [15], for which fish are more susceptible because of their particular habitat [16].
Transcriptome analysis is a useful tool for studying how hosts respond to diseases and pathogens [17]. It has been widely employed to explore the interactions between aquaculture animals and pathogens. For example, it was used to study Aeromonas hydrophila in zebrafish (Danio rerio) [18], and Vibrio anguillarum in solen strictus (Cynoglossus semilaevis) [19], orange-spotted grouper (Epinephelus coioides) [20], and grass carp (Ctenopharyngodon idella) [21]. In addition, RNA-Seq has been used to examine immunology in aquacultures, such as large yellow croaker (Larimichthys crocea) [22], flounder (Paralichthys olivaceus) [23], whiteleg shrimp (Litopenaeus vannamei) [24], tiger grouper (Epinephelus fuscoguttatus) [25], antarctic notothenioid fish (Notothenia coriiceps) [26], Asian seabass (Lates calcarifer) [27], and Nile tilapia (Oreochromis niloticus) [28,29]. For spotted sea bass (Lateolabrax maculatus), transcriptome analysis has also been used to study the immune response to A. veronii and A. hydrophila infection [30,31]. These studies have utilized transcriptome sequencing technology to uncover immune genes and related signaling pathways that exert significant functions in the anti-infection immunity of fish. This provides a reference for the immune prevention and control of fish. Furthermore, in recent years, with the continuous advancement of transcriptome sequencing technology, the body of transcriptome research on fish has been growing steadily. The scope of these studies has broadened considerably, covering a more diverse range of research topics. For instance, the innate immune mechanisms of lenok trout (Brachymystax lenok) against Aeromonas salmonicida infection were studied through skin transcriptome combined with pathological experiments, and it was found that differentially expressed genes were significantly enriched in multiple immune signaling pathways [32]. Integrated gill transcriptome and biochemical indices analyses have revealed that acute salinity stress induces oxidative stress and immune and metabolic disorders in red tilapia (Oreochromis spp.) [33]. Transcriptome analysis also showed the hypoxic response key genes, modules, and the adaptive mechanism of crucian carp (Carassius auratus) gill under hypoxic stress [34].
Spotted sea bass, a highly productive economic fish, can be cultured in seawater, brackish water, and fresh water and is widely distributed along the coast of China [35]. In this study, we performed transcriptome profiling of spotted sea bass infected with E. tarda. A large quantity of differentially expressed genes (DEGs) was identified, which include many innate and adaptive immunity genes. The data may provide valuable insights for further research on the infection caused by E. tarda.

2. Materials and Methods

2.1. Experimental Fish

Healthy fish (100 ± 10 g) were obtained from a local farm in Ningbo City, Zhejiang Province, China. Before the experimental procedures, the fish were acclimated at 28 °C for at least 2 weeks. All experiments were conducted according to the national regulations on the use of laboratory animals and local guidelines on the use of animals for research and approved by the ethics committee of laboratory animals of Shanghai Ocean University (SHOU-DW-2019-012).

2.2. Edwardsiella tarda Infection and Sample Collection

0.05% MS-222 (Sigma-Aldrich, Saint Louis, MI, USA) was used for anesthetizing the fish. Then, the fish were randomly divided into an infected group and a control group. The infected group was intraperitoneally injected with E. tarda (5 × 10⁵ CFU/g), while the control group was injected with an equivalent volume of PBS. Fish under the same experimental conditions were grouped and placed together in each tank. Subsequently, at 12 h post-infection, three fish from each group were randomly selected, and the livers, spleens, and head kidneys of these fish were sampled for transcriptome analysis.

2.3. Transcriptome Sequencing

TRIzol reagent (Invitrogen, Carlsbad, CA, USA) was used to extract total RNA from the liver, spleen, and head kidney of each fish sample. RNA quality and quantity were assessed using an Agilent 2100 Bioanalyzer (Santa Clara, CA, USA) and NanoDrop 2000 (Waltham, MA, USA), respectively. After the evaluation, only RNA samples that met the following criteria were qualified for testing: RNA integrity number (RIN) > 6.5, OD260/280 = 1.8~2.2, OD260/230 ≥ 2.0, 28S:18S ≥ 1.0. Subsequently, the RNA samples were subjected to transcriptome sequencing (there were three replicates in each group). Specifically, the mRNA was enriched from the total RNA and then fragmented into short segments (about 300 bp). QuantiFluor® dsDNA System was quantified and mixed on a computer scale, and then bridge PCR amplification was performed on cBot to generate clusters. Finally, cDNA libraries were synthesized and subjected to Illumina sequencing (Shanghai Majorbio Sequencing Platform).

2.4. Transcriptome Data Analysis

The raw sequencing reads were first processed to remove adapter sequences and low-quality reads using the SeqPrep program and the Sickle program. Clean data were stored in FASTQ file format [36]. The clean reads were then aligned to the reference genome of spotted sea bass using the Hisat2 2.1.0 software. StringTie 1.3.3b was employed to assemble the clean data into transcripts.
BLAST analysis (https://blast.ncbi.nlm.nih.gov/Blast.cgi (accessed on 13 March 2025)) was employed to search the transcripts against the non-redundant (NR) database in NCBI, Swiss-Prot, and Clusters of Orthologous Groups (COGs) by DIAMOND (v0.8.37.99) with an E-value threshold of 0.00001. Gene ontology (GO) annotation was acquired using the BLAST2GO [37]. Pfam annotation was acquired using the HMMER program [38]. Pathway analysis was performed using the Kyoto Encyclopedia of Genes and Genomes (KEGG) database by KOBAS [39].
DESeq2 software (https://bioconductor.org/packages/release/bioc/html/DESeq2.html (accessed on 13 March 2025)) was employed to identify differentially expressed genes (DEGs) between the infected group and the control group. Genes with an adjusted p-value (p-adjust) < 0.05 and fold change ≥1 were considered significantly differentially expressed. The data were analyzed on the online platform of Majorbio Cloud Platform (www.majorbio.com).

2.5. QRT-PCR Validation

To validate the results of the transcriptome analysis, eight immune-related DEGs, including interleukin-1 beta (IL-1β), hepcidin (Hep), peptidoglycan recognition protein -2 (PGRP2), PGRP-SC2, Toll-like receptor 5 (TLR5), TLR8, TLR13, laboratory of genetics and physiology 2 (LGP2), were selected for qRT-PCR analysis using the same RNA sample. Primers were designed using Primer-BLAST on NCBI. Total RNA was subjected to cDNA synthesis using the reverse transcription premix 2×HifairTM II SuperMix plus (Yeasen, Shanghai, China). The qPCR was performed using the Light Cycler® 480 Real-Time PCR System. Relative expression level of genes was calculated against that of EF1α, and then changes in gene expression between treatment group and control group were calculated. All qPCR primers were described in Supplementary Table S1.

3. Results

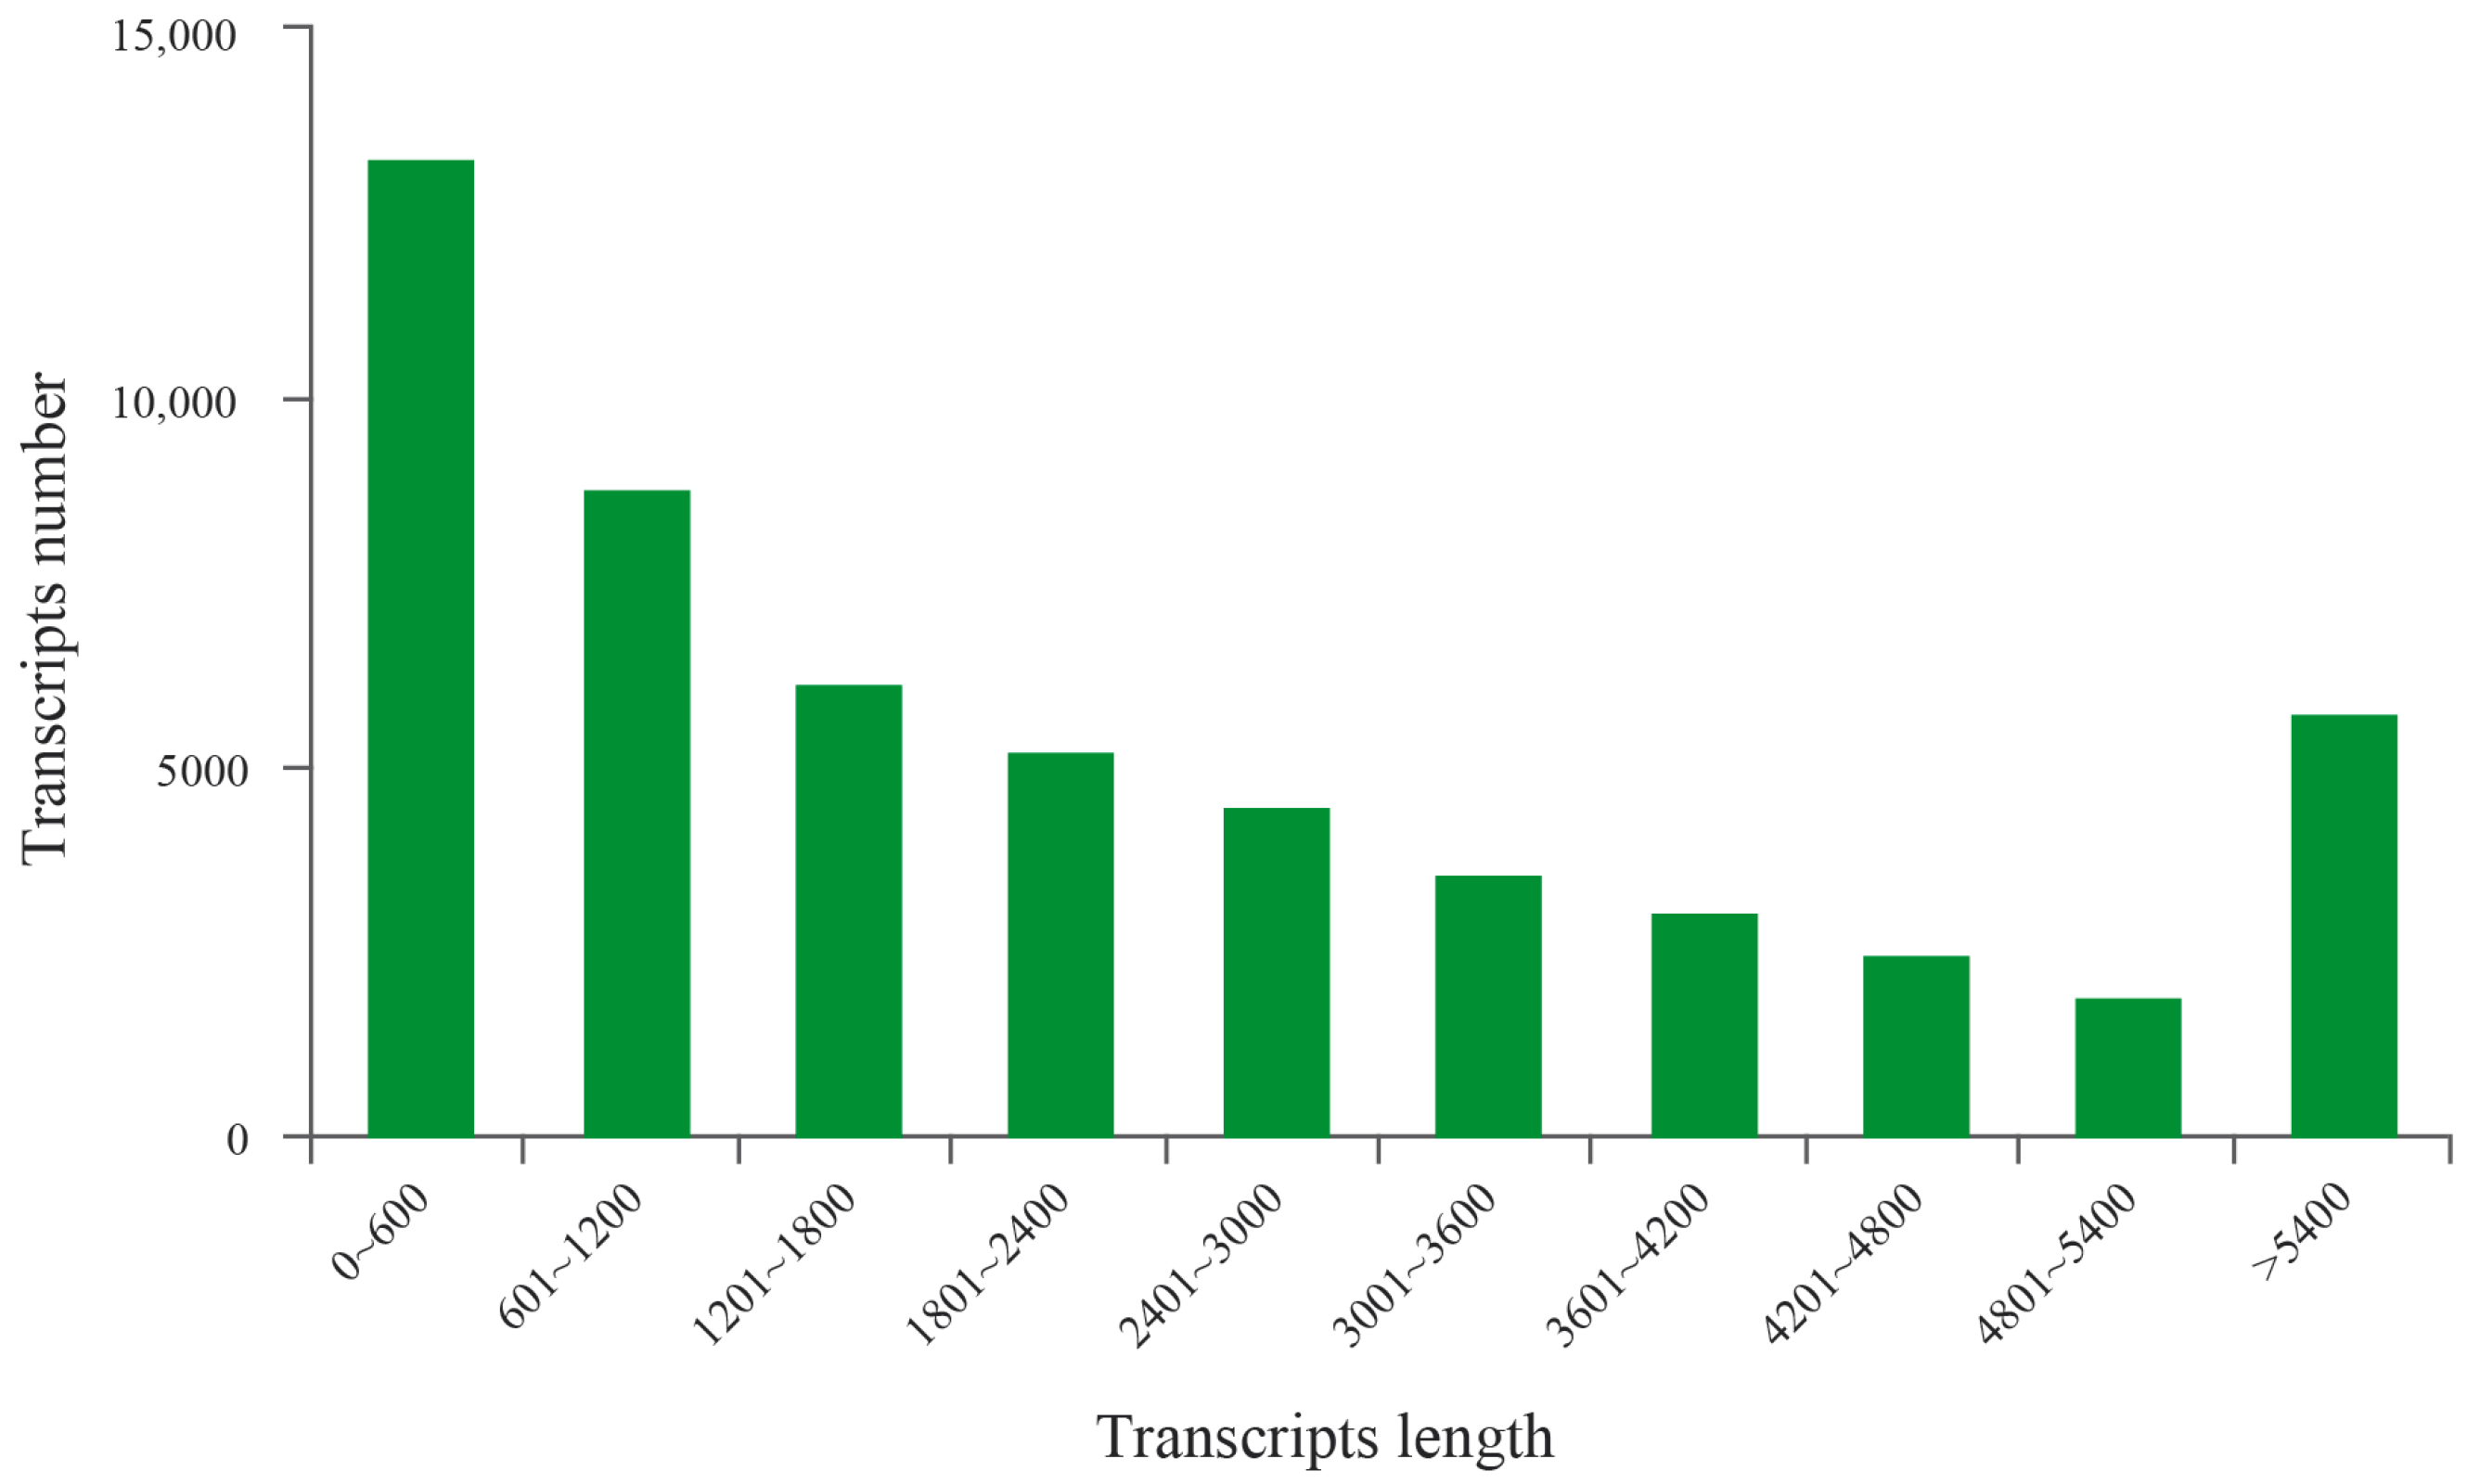
3.1. Transcriptome Assembly

Transcriptome profiling of the head kidney, liver, and spleen in spotted sea bass infected with E. tarda was conducted in this study. The raw data were deposited in the SRA database (BioProject accession number: PRJNA1229114). A total of clean reads was obtained with a high Q20 and Q30 after removing low-quality sequences (Supplementary Table S2). The length distribution of assembled unigenes obtained from the liver, head kidney, and spleen in control groups and E. tarda—challenged fish was analyzed. The results revealed the majority of the unigenes had a length of less than 600 bp, whereas roughly 10.5% of the unigenes were longer than 5400 bp (Figure 1).

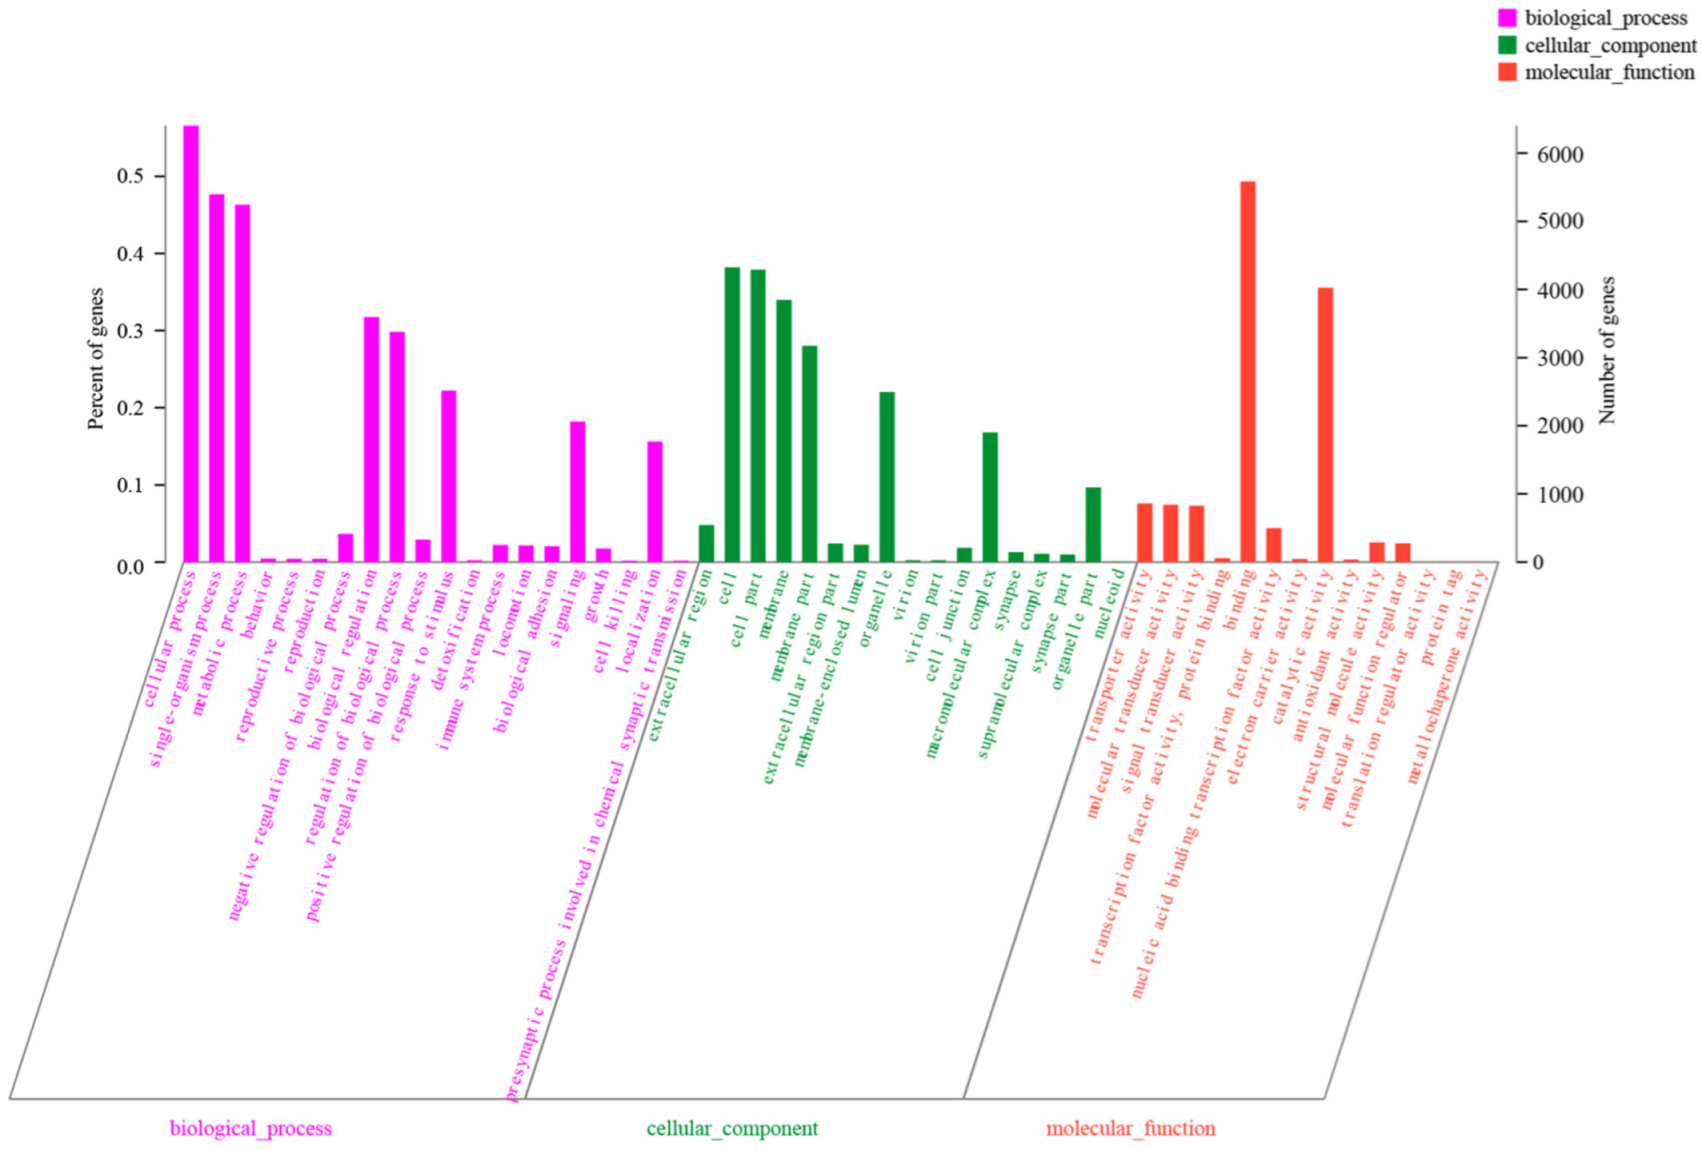
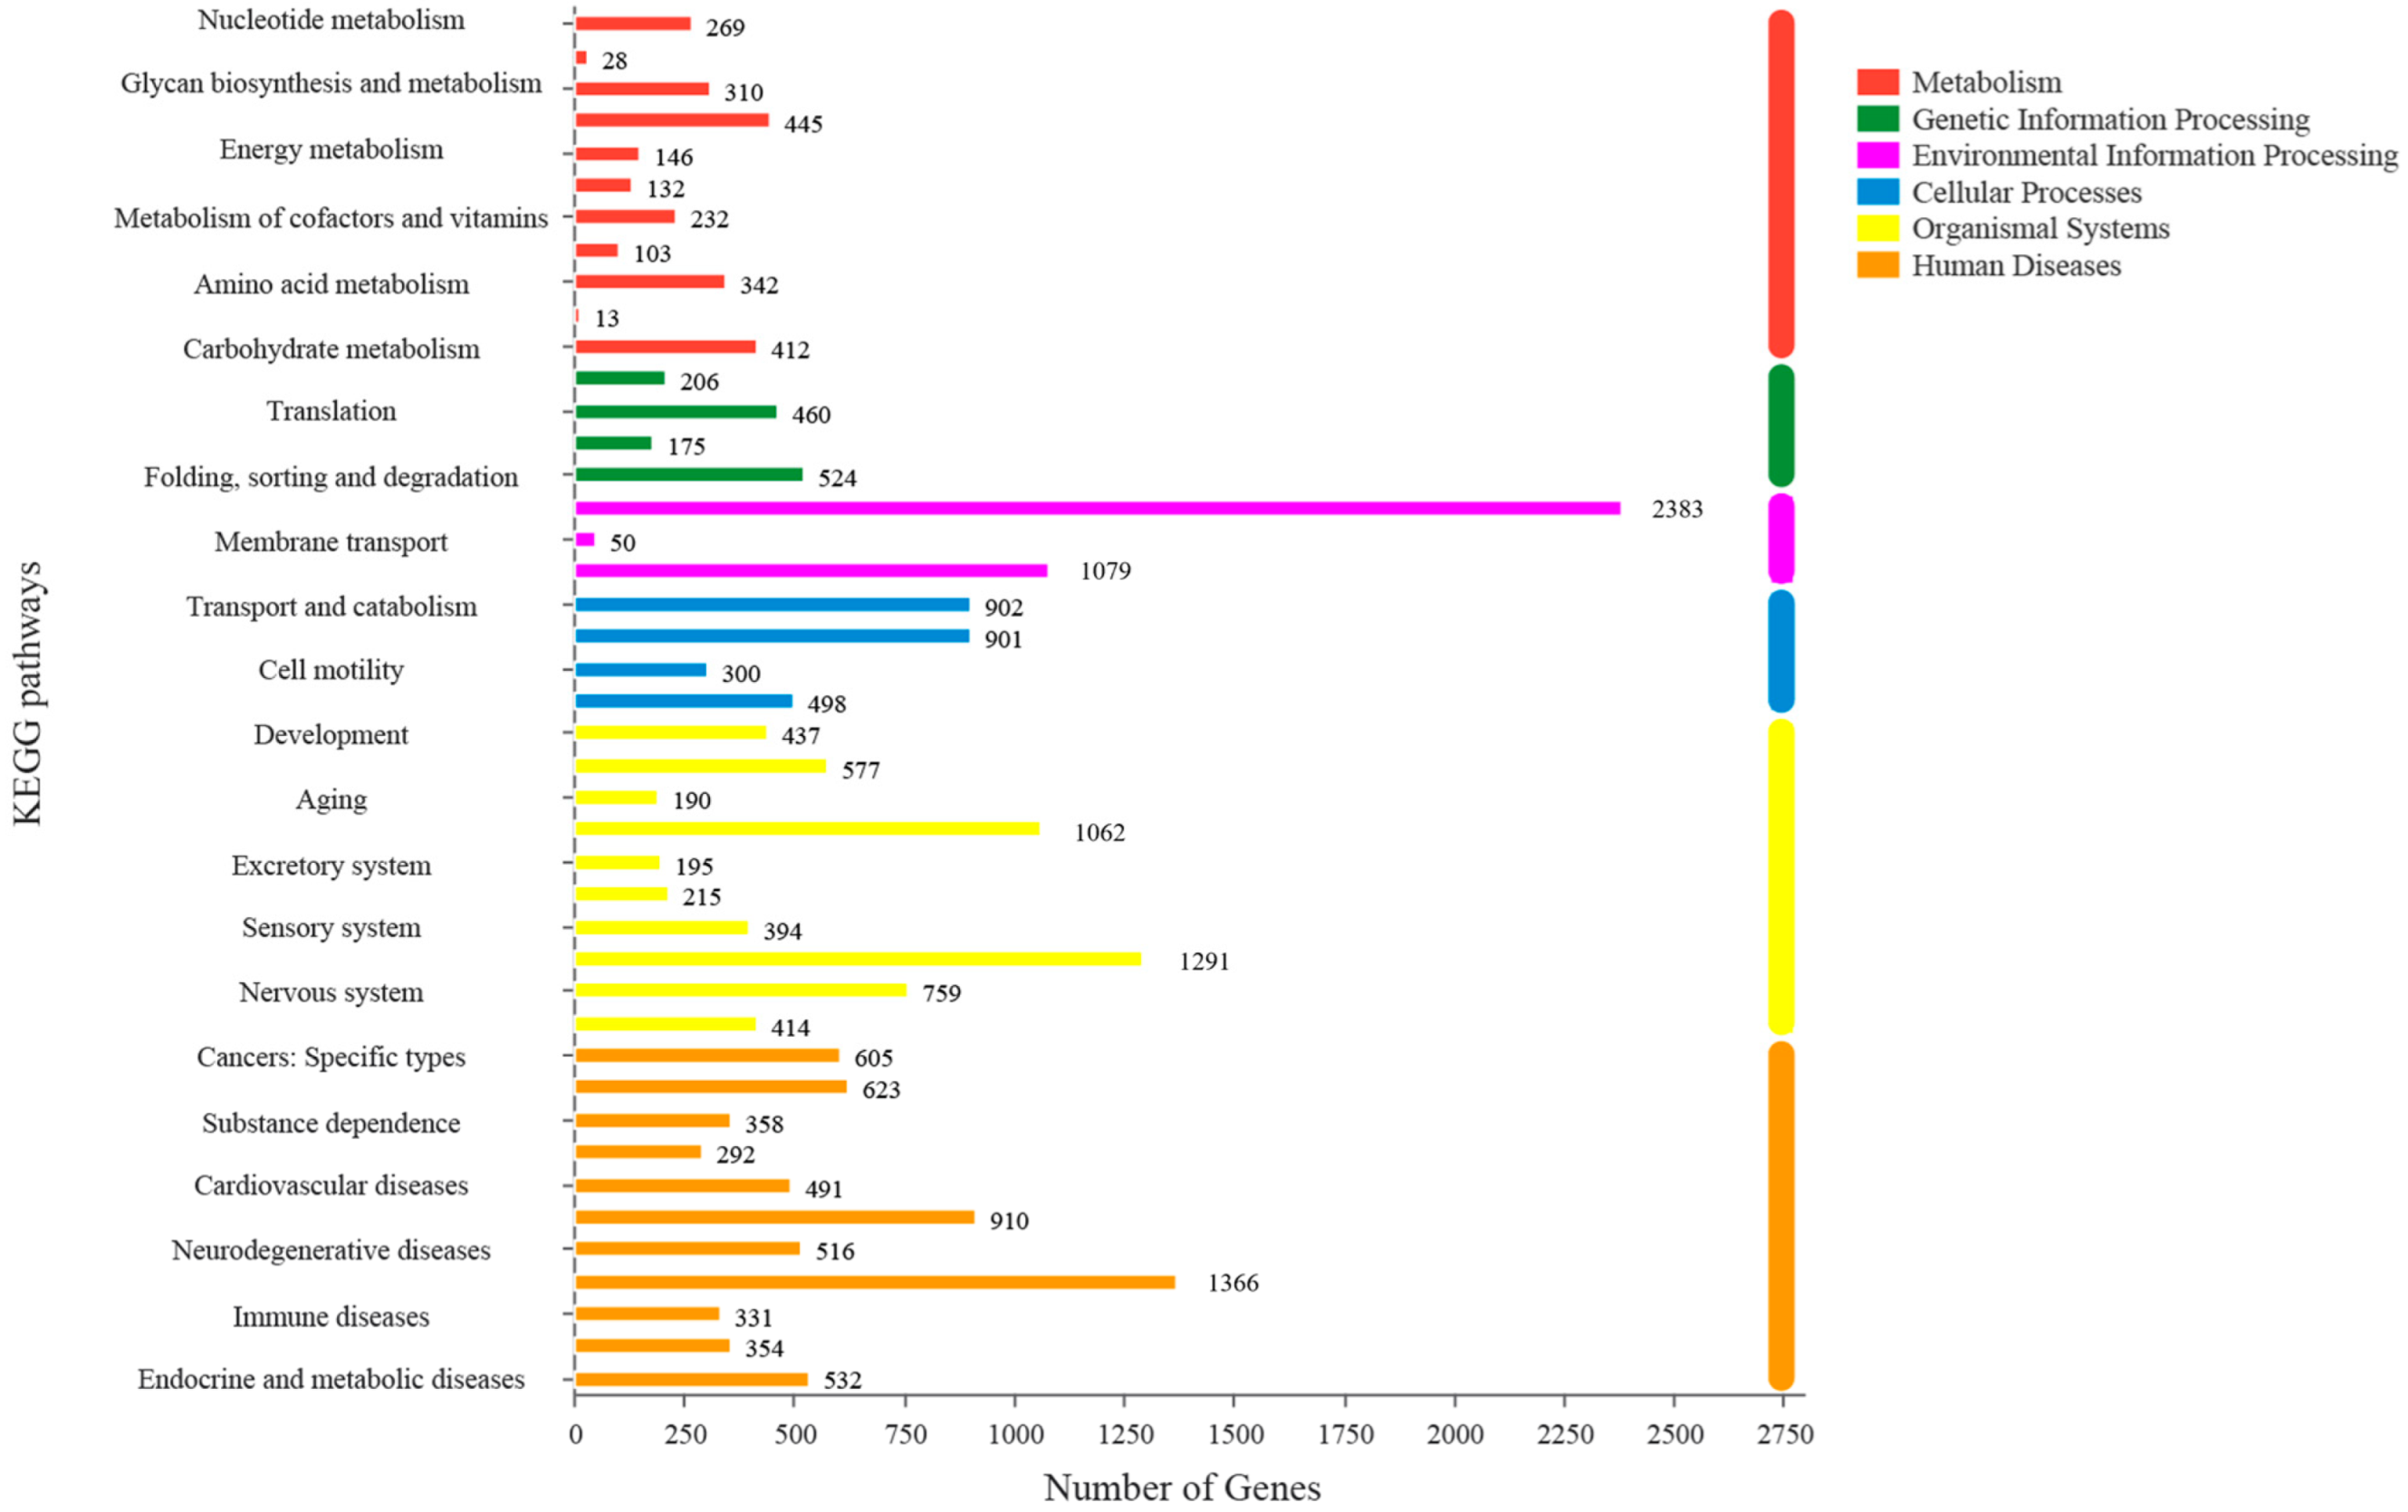
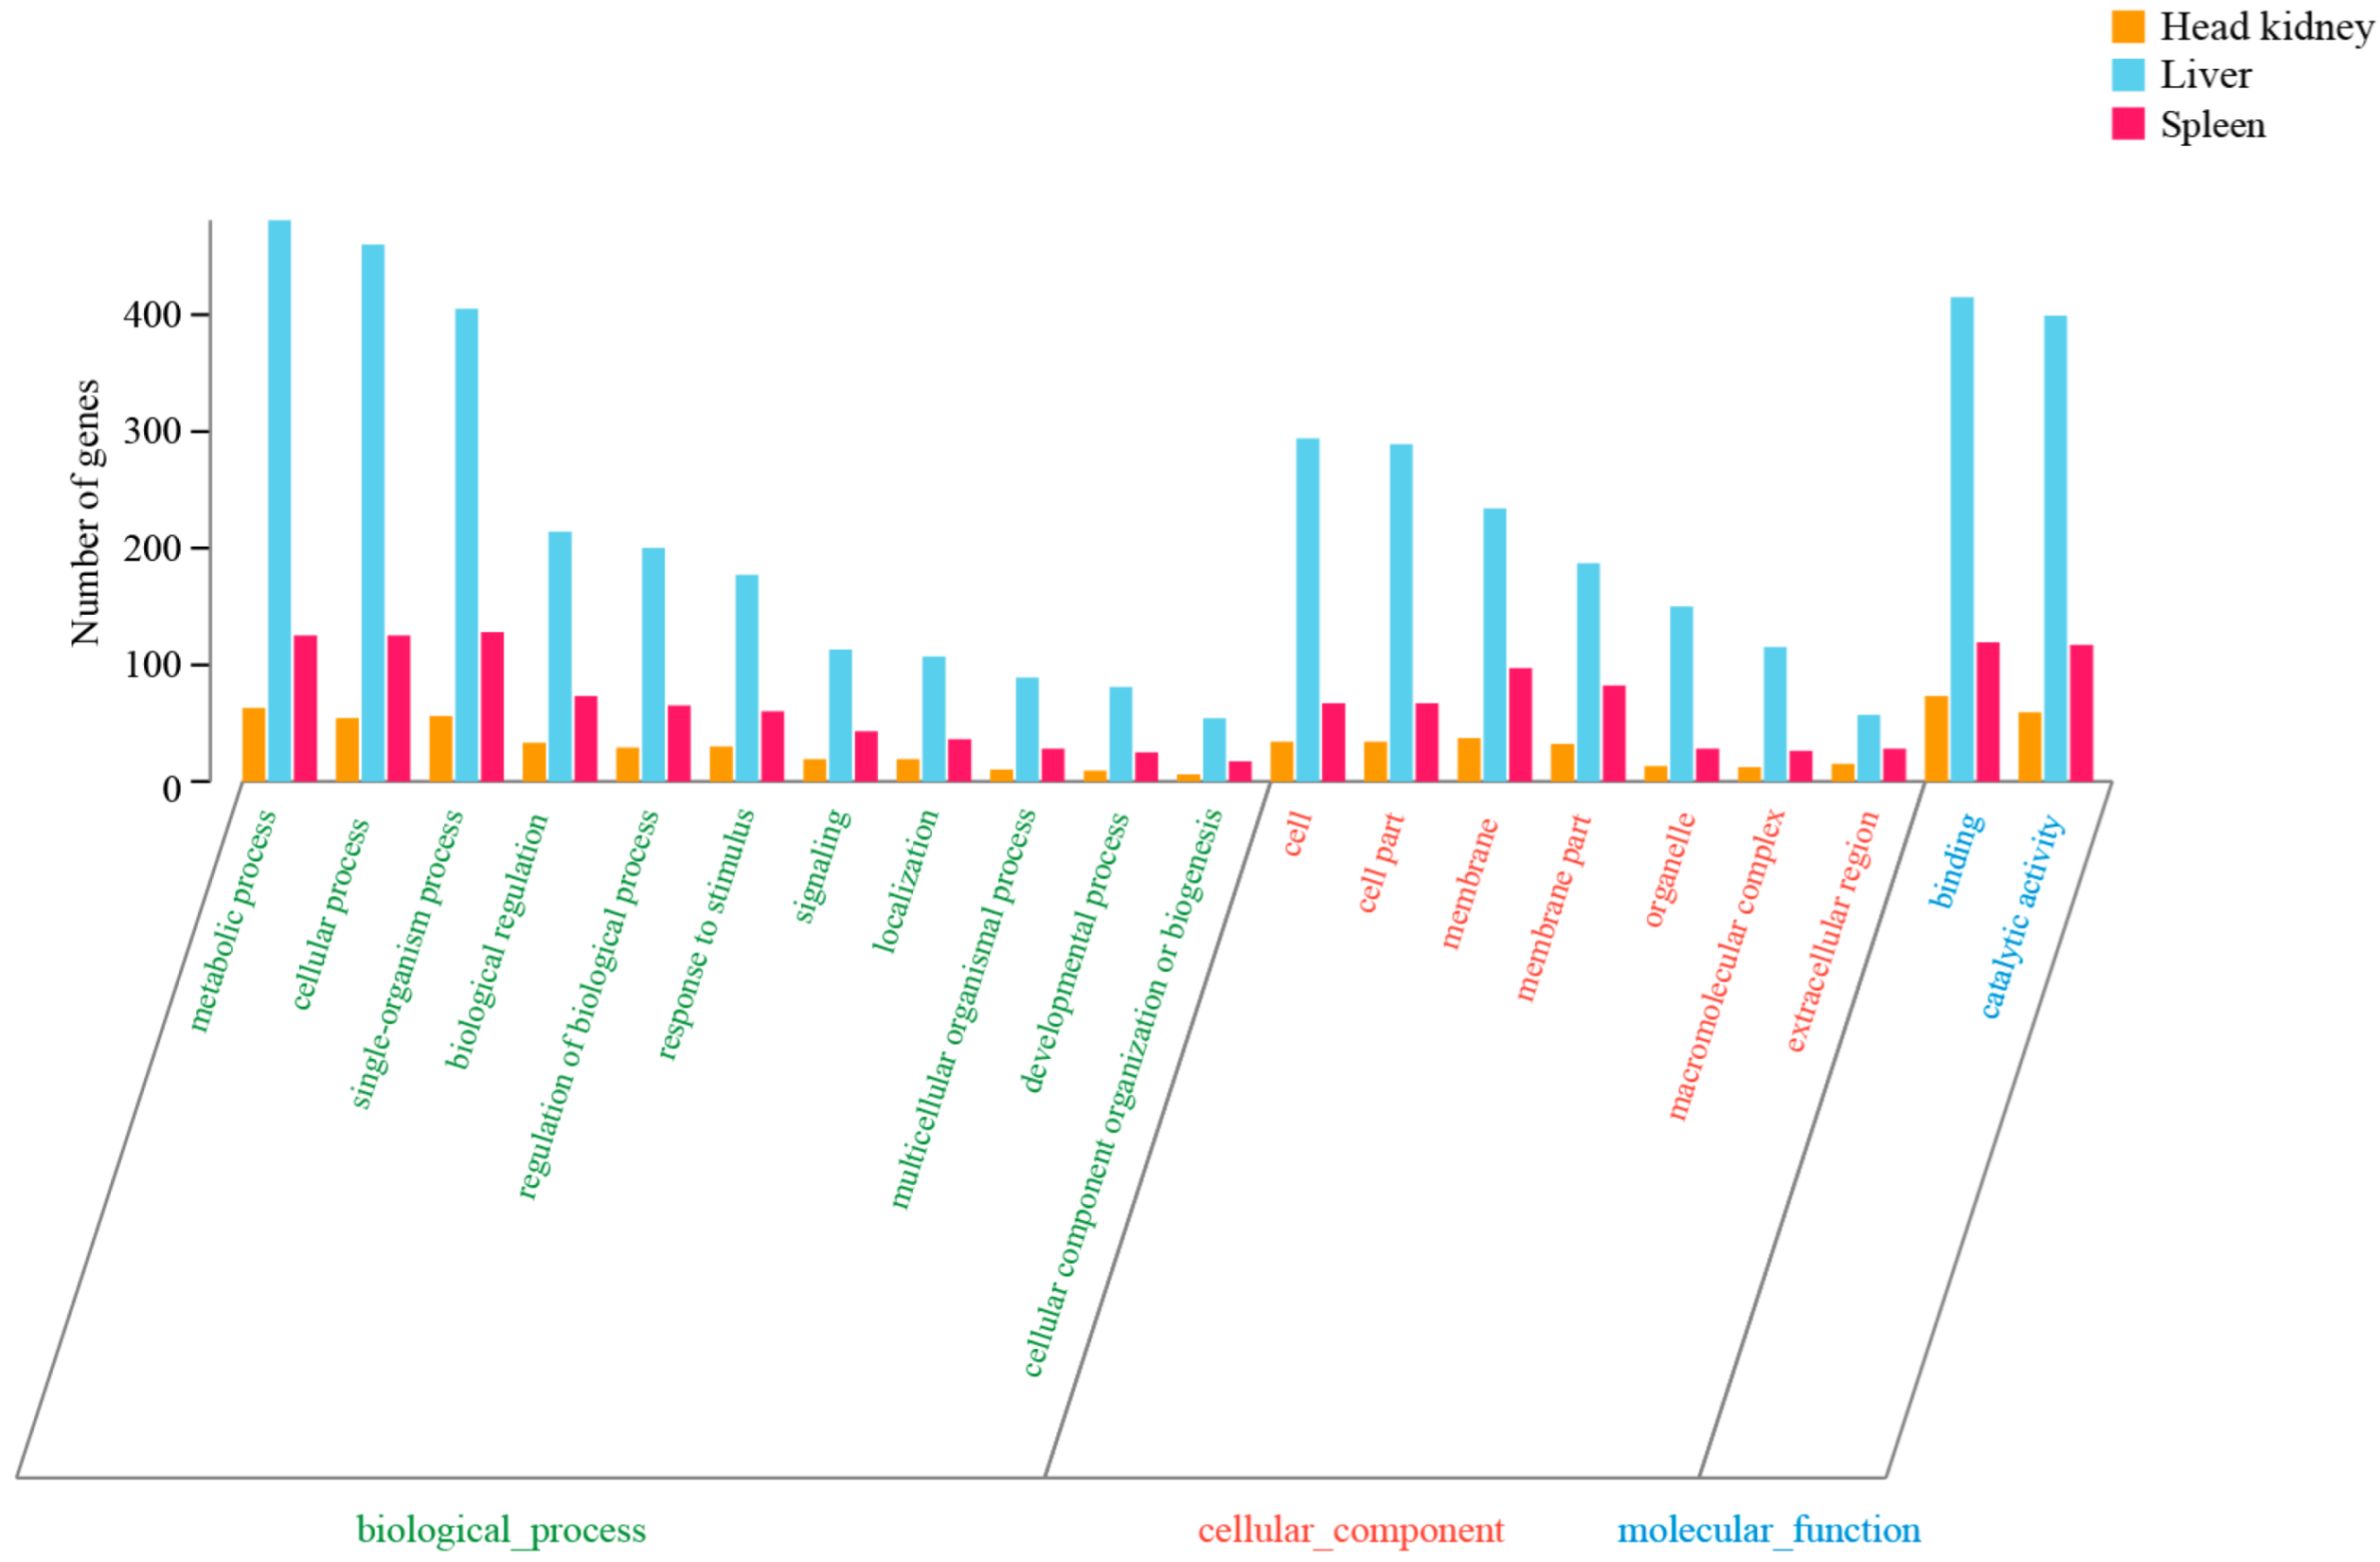
3.2. Annotation of Assembled Unigenes

Through annotation in multiple databases, including GO, KEGG, COG, NR, and Swiss-Prot, a total of 22,015 unigenes were successfully annotated. Among them, 21,065 unigenes (95.68%) were annotated in NR, 11,320 (51.42%) in GO, 20,464 (92.95%) in COG, 21,295 (96.73%) in KEGG, and 18,791 (82%) in Swiss-Prot (Supplementary Table S3). In particular, the GO databases were employed to characterize the function of genes and the interactions between genes and their products [40]. Specifically, 11,320 spotted sea bass unigenes were assigned to either the biological process, the cellular component, or the molecular function. In the biological process category, the most prevalent terms were cellular process (6401 unigenes), single-organism process (5396 unigenes), and metabolic process (5241 unigenes) (Figure 2). For the cellular component category, 4324 unigenes were in the cell, 3845 unigenes were in the membrane, while only 541 unigenes, 144 unigenes, and 121 unigenes were assigned to the extracellular region, synapse, and supramolecular complex (Figure 2). In the molecular function category, binding and catalytic activity emerged as the two most prominent GO terms. There were 5584 unigenes associated with binding and 4023 unigenes related to catalytic activity (Figure 2).
The COG database was then used to conduct a phylogenetic classification of the proteins encoded by the assembled unigenes [41]. Through COG-annotation analysis, 20,464 unigenes were classified into 23 molecular families. The top 4 hits were intracellular trafficking/secretion/vesicular transport (2655 unigenes), posttranslational modification/protein turnover/chaperones (2023 unigenes), transcription (1342 unigenes), and signal transduction mechanisms (1033 unigenes) (Figure 3). Subsequently, the KEGG database was used to conduct a systematic assessment of gene function and the integration of genomic and functional information [42]. In KEGG analysis, 21,295 unigenes were classified into 22 known signaling pathways (Figure 4).

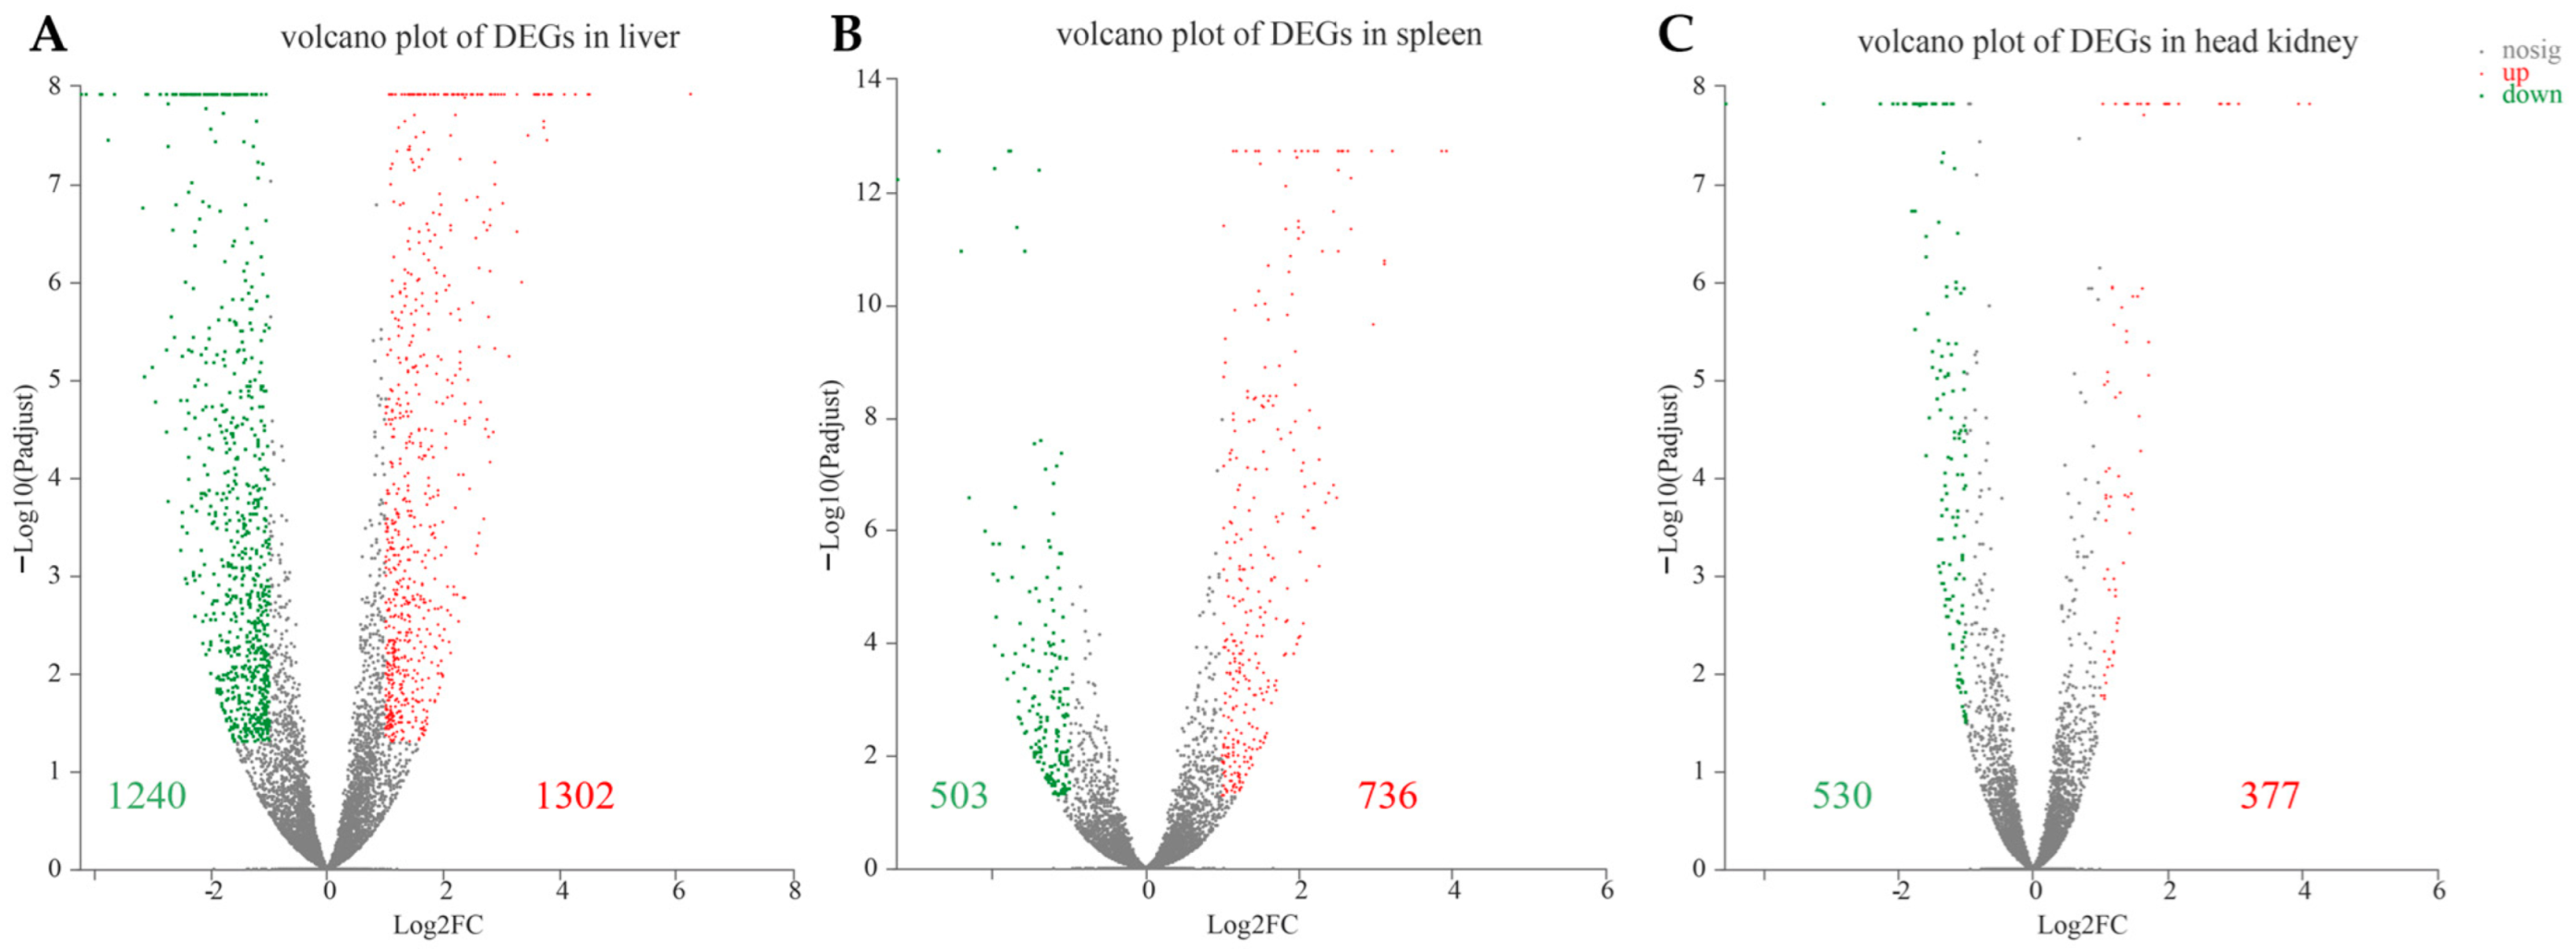
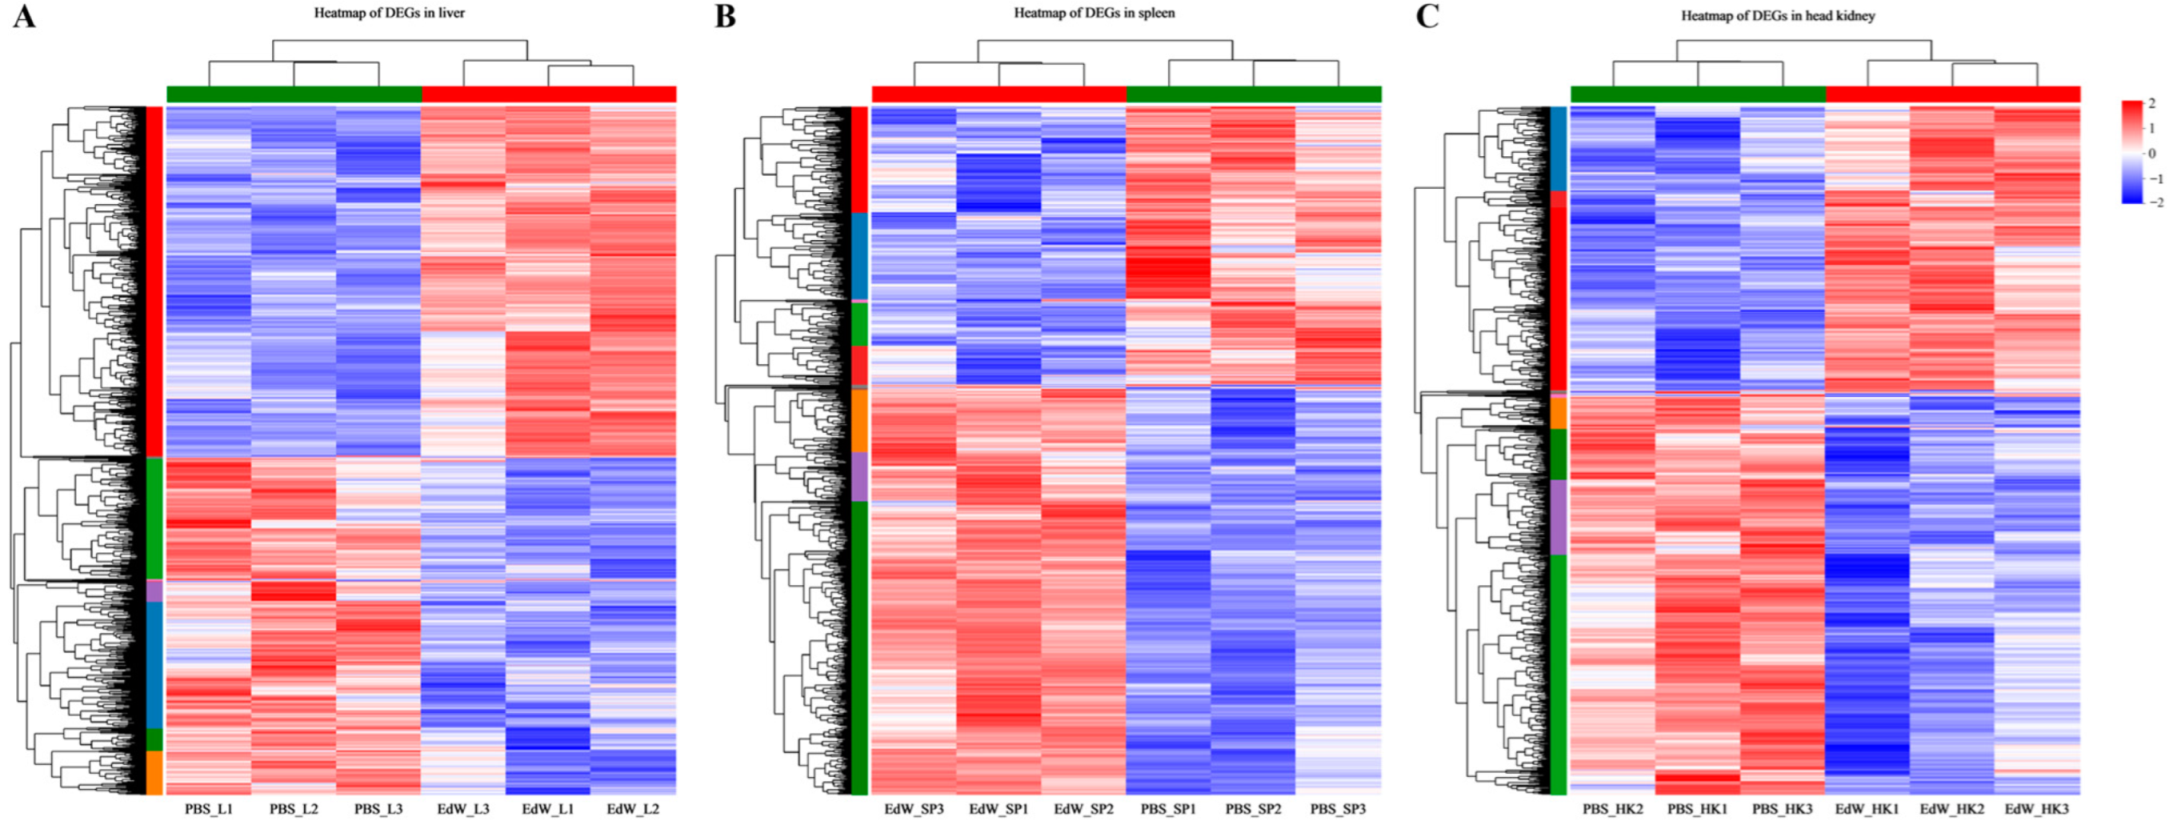
3.3. Identification of Differentially Expressed Genes

In the head kidney, liver, and spleen of the infected group compared with the control group, a large number of significantly differentially expressed genes (DEGs) (fold change ≥1, p-adjust ≤ 0.05) were identified. In the head kidney, there were 1302 upregulated genes and 503 downregulated genes; in the liver, 377 upregulated genes and 530 downregulated genes; and in the spleen, 1240 upregulated genes and 736 downregulated genes (Figure 5). In addition, we utilized the GO, COG, and KEGG databases for functional annotation, which offered crucial insights into biological characteristics. All DEGs were classified into three GO categories, namely biological process, cellular component, and molecular function (Figure 6). Notably, the KEGG database had a larger number of aligned genes compared with the other databases. Consequently, based on the DESeq analysis results, we carried out KEGG pathway classification and functional enrichment analysis for DEGs (Figure 7). The DEGs were categorized into six major groups: metabolism, genetic information processing, environmental information processing, cellular processing, organismal systems, and human disease. Among the KEGG pathways of the three tissues, signaling transduction is the most obvious pathway (Figure 7). These DEGs contain a large number of immune-related genes, such as TLRs, PGRPs, RIG-like receptors, and cytokines–cytokine receptors. In addition, we performed a clustering heatmap analysis on the DEGs in each tissue (Figure 8). The results indicated that the gene expression patterns of both the PBS group and the E. tarda group exhibited excellent clustering effects, with close convergence of samples within each group (Figure 8). This fully demonstrated the high degree of intra-group consistency of the transcriptome data and strongly validated the reliability and stability of the data. Furthermore, through Venn analysis, the common and tissue-specific DEGs in the three tissues were identified. The data showed that there were a total of 152 common DEGs among the three tissues, while the numbers of tissue-specific DEGs were 1892 in the liver, 676 in the spleen, and 400 in the head kidney, respectively (Figure 9). Additionally, there were 277 common DEGs between the spleen and liver, 134 common DEGs between the head kidney and spleen, and the number of common DEGs between the liver and head kidney was 221 (Figure 9). Finally, GO and KEGG enrichment analyses were conducted on the common DEGs in the three tissues. The results showed that these DEGs were enriched in pathways related to defense against external pathogen invasion and immune response (Figure 10).

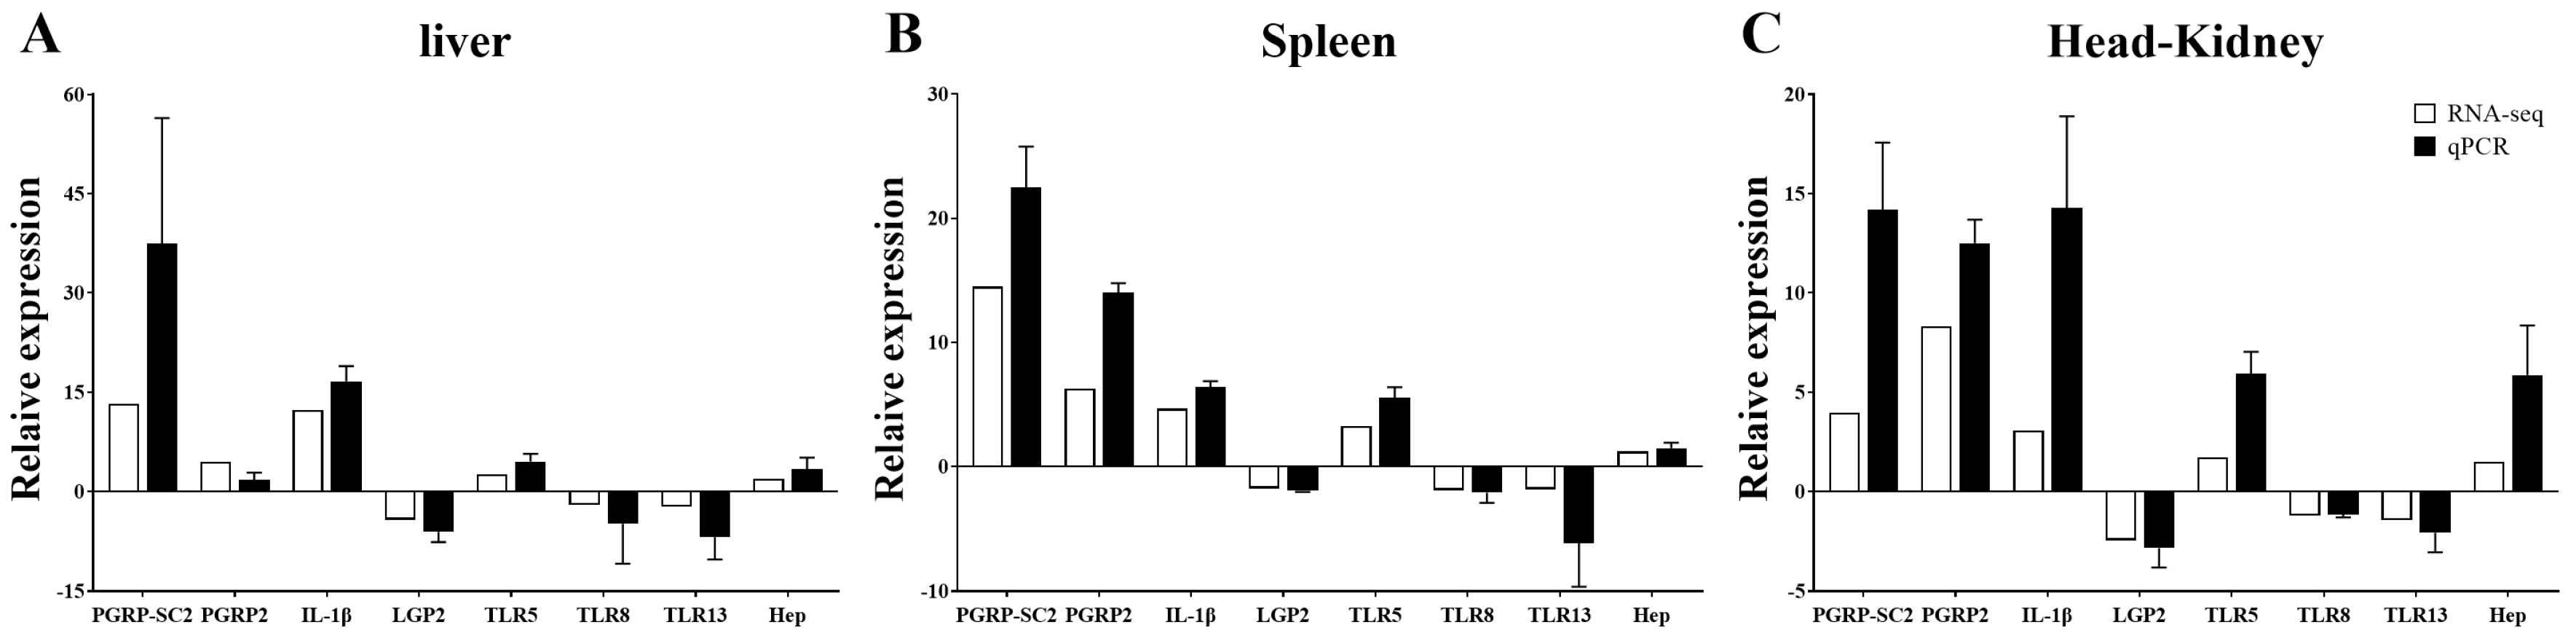
3.4. Validation of Differently Expressed Genes by qRT-PCR

The expression levels of eight DEGs in immune-related pathways, including PGRP-SC2, PGRP2, IL-1β, LGP2, TLR5, TLR8, TLR13, and Hep, were identified in the head kidney, spleen, and liver by qRT-PCR. The qRT-PCR results for the eight DEGs were consistent with the transcriptome analysis results, further confirming the reliability of the transcriptome data (Figure 11).

4. Discussion

In this study, in order to explore the immune response in the early stage of infection, transcriptome profiling was conducted on the head kidney, liver, and spleen of spotted sea bass infected with E. tarda at 12 h. A large number of DEGs were detected in the three tissues. The DEGs in different tissues exhibit similar characteristics in GO functional annotation and KEGG signaling pathway analysis. In addition, the common DEGs among the three tissues were mainly enriched in immune-related signaling pathways, such as the Toll-like receptor signaling pathway, the JAK-STAT signaling pathway, and the cytokine–cytokine receptor interaction. This suggested that they may play an important role in the immune defense process of fish against pathogen invasion. Also, the DEGs include numerous immune-related genes, suggesting that the bacterial infection had an impact on several innate and adaptive immune pathways. Innate immunity, also known as non-specific immunity, is gradually formed in the long-term evolution of organisms. For vertebrates, the natural immune system is recognized as the first defense against various pathogens in most organisms, while in invertebrates and plants, the innate immune system is their only defense against the invasion of external pathogens [43,44]. The innate immune system mainly consists of cellular components such as dendritic cells (DCs), macrophages, and neutrophilic granulocytes, as well as humoral components such as lectin, complement, chemokines, cytokines, and antimicrobial peptides [44,45]. It recognizes invading pathogens through conserved pattern recognition receptors (PRRs) [46]. In the previous research, multiple PRR families were identified in spotted sea bass, including Toll-like receptors (TLRs), Nod-like receptors (NLRs), Retinoic acid-inducible gene1-like receptors (RLRs), peptidoglycan recognition proteins (PGRPs), C-type lectin receptors (CLRs), and scavenger receptors (SRs), which indicated the PRR signaling mechanisms are conserved from fish to mammals [47].
TLRs recognize specific pathogen-associated molecular patterns (PAMPs), triggering the activation of signaling cascades to regulate the immune mechanisms [48,49]. In mammals, 13 members of TLRs, including TLR1-13, have been found [50]. In fish, 17 kinds of TLRs have been found, and the immune recognition and activation process mediated by TLR family molecules is also different from that in mammals [51,52]. In this study, eight members of the TLR family have been identified, including TLR1-3, 5, 8-9, 13, and 22. The expression of these TLRs was downregulated at 12 h post-E. tarda infection except TLR5. However, the expression of TLR2 was increased significantly after infection with the gram-negative bacterium Edwardsiella ictulari for 24 h in the kidney and spleen of catfish [53]; Edwardsiella spp. infection can also lead to significantly upregulated expression of TLR3 genes in the large yellow croaker [54] and zebrafish [55]. After the artificial infection of Edwardsiella spp., the expression levels of TLR3 in the head kidney tissues of rainbow trout [56] and channel catfish [57] appeared downregulated. The poly (I:C) stimulated the Ctenopharyngodon idella kidney cell (CIK) line, and TLR8 was rapidly and significantly downregulated [58]. After GCRV infection, TLR22 expression level was upregulated in grass carp [59]. It is speculated that pathogens may directly or indirectly affect the TLR-mediated immune response in fish; this influence may be related to the degree of infection of the pathogen, the type of fish, different physiological states or specific tissues, or different regulation methods in vitro and in vivo.
RLRs are a group of cytoplasmic pattern recognition receptors, including three highly conservative proteins: RIG-I, melanoma differentiation-associated gene 5 (MDA5), and the laboratory of genetics and physiology 2 gene (LGP2). There is evidence that RLRs can also mount a cellular immune response against different bacteria and viruses [60,61]. In mutant mice with LGP2 deficiency, infection by the bacterium Listeria monocytogenes led to augmented bacterial colonization and diminished synthesis of diverse cytokines [62]. After infection with Vibrio alginolyticus and Staphylococcus aureus, significant upregulation of LGP2 in the head kidney, liver, and spleen in Asian sea bass (Lates calcarifer) [63]. In this study, compared with PBS groups, the expression of the LGP2 upregulation after infection with E. tarda suggests that LGP2 can also respond to bacterial infection.
PGRPs, as a kind of PRR that can recognize the pathogenic bacteria of peptidoglycan and peptidoglycan, play a crucial role in the regulation of the innate immune defense system. Studies have shown that these peptidoglycan recognition proteins have bactericidal activity and can also activate signaling pathways. For example, in rockfish (Sebastes schlegeli), the PGRP-L2 has an obvious broad-spectrum bactericidal effect [64]. In rainbow trout, PGRP-L2 induced the downregulation of two cytokines: IL-1β and TNF-α [65]. The PGRP6 of the grass carp can play a role in activating the NF-κB pathway [66]. In the present study, PGRP-L2, PGRP2, and PGRP-SC2 are significantly upregulated in the liver, spleen, and the head kidney. It is indicated that PGRPs may participate in the anti-bacterial reaction.
Cytokines, important signaling molecules in the immune response [67], can initiate an antimicrobial inflammatory response [68]. In the previous study, IL-1β played various roles in regulating the inflammatory system of teleost fish. For instance, recombinant rainbow trout (Oncorhynchus mykiss) IL-1β increased the phagocytic and lysozyme activity [69]. IL-15 was primarily involved in T-cell response, and its expression was significantly upregulated in the head kidney and spleen following E. tarda infection in rock bream [70]. IL-8 (also named CXCL8), a key regulator of inflammation, was upregulated after infection with E. tarda in flounder [71]. In this study, following E. tarda infection, IL-1β, IL-6R, IL-13R, and IL-8R were all upregulated in the spleen, liver, and head kidney, suggesting that inflammatory processes were involved in response to bacterial infection.
Overall, these results indicate that the TLR signaling pathway, RLR signaling pathway, PGRP signaling pathway, and cytokine signaling pathway are involved in the early-stage immune response of L. maculatus against E. tarda infection. In the skin transcriptome of Brachymystax lenok after being infected by Aeromonas salmonicida, the DEGs are significantly enriched in the NOD-like receptor, C-type lectin receptor, and Toll-like receptor signaling pathways [32]. In the splenic transcriptomes of striped bass (Morone saxatilis) and white bass (M. chrysops) after Streptococcus iniae infection, the expression of a large number of cytokines was found to be upregulated [72]. In the splenic transcriptome of Japanese flounder (Paralichthys olivaceus) after being infected by Pseudomonas putida 1C3, the upregulation of the expression of a large number of cytokines was also found [73]. In the transcriptome study of E. tarda-infected intestinal epithelial cells of Japanese flounder, it was also found that the DEGs were significantly enriched in the Toll-like receptor signaling pathway, C-type lectin receptor signaling pathway, and cytokine–cytokine receptor interaction [74]. This strongly indicated that these signaling pathways play a pivotal role in fish resistance to pathogenic bacterial infections. It can provide references for formulating more effective immune prevention and control strategies. However, our research was conducted under laboratory conditions, which cannot fully represent the responses of fish in their natural habitats. Additionally, we only analyzed the early-stage (at 12 h post-infection) immune response. Therefore, more comprehensive analyses should be carried out in future research.

5. Conclusions

In conclusion, this study provides valuable information regarding the transcriptome analysis of spotted sea bass infection with E. tarda. A large number of DEGs have been identified, which include numerous immune-related genes. These genes are involved in the TLR signaling pathway, RLR signaling pathway, PGRP signaling pathway, and cytokine signaling pathway. These findings not only offer fundamental insights into the antibacterial immune mechanisms of spotted sea bass but also serve as a reference for formulating more effective fish disease management strategies.

Supplementary Materials

The following supporting information can be downloaded at https://www.mdpi.com/article/10.3390/fishes10040153/s1, Table S1: qPCR Primers used in this study; Table S2: Summary of de novo assembly of transcriptomic profile of spotted sea bass (Lateolabrax maculatus); Table S3: Annotation of unigenes after transcriptomic profiles of spotted sea bass (Lateolabrax maculatus).

Author Contributions

Conceptualization, Q.G.; Data curation, Z.S. and X.L.; Funding acquisition, Z.S. and Q.G.; Investigation, Z.S., X.L., Q.Z. and W.W.; Methodology, Z.S., X.L., Q.Z. and W.W.; Project administration, H.W. and T.P.; Supervision, Q.G.; Writing—original draft, Z.S. and X.L.; Writing—review and editing, H.W., T.P. and Q.G. All authors have read and agreed to the published version of the manuscript.

Funding

This research was funded by the National Natural Science Foundation of China (Grant Number: 32473198), the Wuhu City Science and Technology Planning Project (NO. 2022ly15), and the Postdoctoral Fellowship Program of CPSF under Grant Number GZC20240976.

Institutional Review Board Statement

All fish experiments were conducted under the national regulations on laboratory animals of China and were reviewed and approved by the ethics committee of laboratory animals of Shanghai Ocean University (approval code: SHOU-DW-2019-012; date: 12 December 2019).

Data Availability Statement

All the data generated or used during the study appear in the submitted article.

Acknowledgments

We thank Haixia Xie, Institute of Hydrobiology, Chinese Academy of Sciences, for providing Edwardsiella tarda.

Conflicts of Interest

The authors declare that there are no conflicts of interest regarding the publication of the work described in this manuscript.

References

  1. Okuda, J.; Arikawa, Y.; Takeuchi, Y.; Mahmoud, M.M.; Suzaki, E.; Kataoka, K.; Suzuki, T.; Okinaka, Y.; Nakai, T. Intracellular replication of Edwardsiella tarda in murine macrophage is dependent on the type III secretion system and induces an up-regulation of anti-apoptotic NF-kappaB target genes protecting the macrophage from staurosporine-induced apoptosis. Microb. Pathog. 2006, 41, 226–240. [Google Scholar] [CrossRef] [PubMed]
  2. Castro, N.; Toranzo, A.E.; Barja, J.L.; Nunez, S.; Magarinos, B. Characterization of Edwardsiella tarda strains isolated from turbot, Psetta maxima (L.). J. Fish. Dis. 2006, 29, 541–547. [Google Scholar] [CrossRef] [PubMed]
  3. Kim, H.S.; Lee, K.W.; Jung, H.S.; Kim, J.; Yun, A.; Cho, S.H.; Kwon, M. Effects of dietary inclusion of yacon, ginger and blueberry on growth, body composition and challenge test of juvenile rockfish (Sebastes schlegeli) against Edwardsiella tarda. Aquacult Nutr. 2018, 24, 1048–1055. [Google Scholar] [CrossRef]
  4. Ling, S.H.; Wang, X.H.; Xie, L.; Lim, T.M.; Leung, K.Y. Use of green fluorescent protein (GFP) to study the invasion pathways of Edwardsiella tarda in in vivo and in vitro fish models. Microbiology 2000, 146 Pt 1, 7–19. [Google Scholar] [CrossRef]
  5. Mohanty, B.R.; Sahoo, P.K. Edwardsiellosis in fish: A brief review. J. Biosci. 2007, 32, 1331–1344. [Google Scholar] [CrossRef]
  6. Wu, J.; Liu, G.; Sun, Y.; Wang, X.; Fang, H.; Jiang, H.; Guo, Z.; Dong, J. The role of regulator FucP in Edwardsiella tarda pathogenesis and the inflammatory cytokine response in tilapia. Fish. Shellfish. Immunol. 2018, 80, 624–630. [Google Scholar] [CrossRef] [PubMed]
  7. Zeng, C.; Tang, X.; Du, Y.; Sheng, X.; Xing, J.; Zhan, W. Dynamic distribution of formalin-inactivated Edwardsiella tarda in olive flounder (Paralichthys olivaceus) post intramuscular injection. Vet. Immunol. Immunopathol. 2018, 199, 53–60. [Google Scholar] [CrossRef]
  8. Morimoto, N.; Kondo, M.; Kono, T.; Sakai, M.; Hikima, J.I. Nonconservation of TLR5 activation site in Edwardsiella tarda flagellin decreases expression of interleukin-1beta and NF-kappaB genes in Japanese flounder, Paralichthys olivaceus. Fish. Shellfish. Immunol. 2019, 87, 765–771. [Google Scholar] [CrossRef]
  9. Tang, X.; Gong, J.; Zeng, C.; Sheng, X.; Xing, J.; Zhan, W. Dynamic distribution of formalin-inactivated Edwardsiella tarda in flounder (Paralichthys olivaceus) post intraperitoneal vaccination. Fish. Shellfish. Immunol. 2019, 89, 393–402. [Google Scholar] [CrossRef]
  10. Bujan, N.; Mohammed, H.; Balboa, S.; Romalde, J.L.; Toranzo, A.E.; Arias, C.R.; Magarinos, B. Genetic studies to re-affiliate Edwardsiella tarda fish isolates to Edwardsiella piscicida and Edwardsiella anguillarum species. Syst. Appl. Microbiol. 2018, 41, 30–37. [Google Scholar] [CrossRef]
  11. Noman Reza, M.A.; Mohapatra, S.; Shimizu, S.; Kitamura, S.I.; Harakawa, S.; Kawakami, H.; Nakayama, K.; Sawayama, E.; Matsubara, T.; Ohta, K.; et al. Molecular cloning, characterization and expression analysis of complement components in red sea bream (Pagrus major) after Edwardsiella tarda and red sea bream Iridovirus (RSIV) challenge. Fish. Shellfish. Immunol. 2018, 82, 286–295. [Google Scholar] [CrossRef]
  12. Reddacliff, G.L.; Hornitzky, M.; Whittington, R.J. Edwardsiella tarda septicaemia in rainbow trout (Oncorhynchus mykiss). Aust. Vet. J. 1996, 73, 30. [Google Scholar] [CrossRef] [PubMed]
  13. Li, M.; Wang, Q.L.; Lu, Y.; Chen, S.L.; Li, Q.; Sha, Z.X. Expression profiles of NODs in channel catfish (Ictalurus punctatus) after infection with Edwardsiella tarda, Aeromonas hydrophila, Streptococcus iniae and channel catfish hemorrhage reovirus. Fish. Shellfish. Immunol. 2012, 33, 1033–1041. [Google Scholar] [CrossRef]
  14. Janda, J.M.; Duman, M. Expanding the spectrum of diseases and disease associations caused by Edwardsiella tarda and related species. Microorganisms 2024, 12, 1031. [Google Scholar] [CrossRef] [PubMed]
  15. Yi, L.; Nie, P.; Yu, H.B.; Xie, H.X. Regulation of Type III Secretion of Translocon and Effector Proteins by the EsaB/EsaL/EsaM Complex in Edwardsiella tarda. Infect. Immun. 2017, 85, e00322-17. [Google Scholar] [CrossRef]
  16. Camp, K.L.; Wolters, W.R.; Rice, C.D. Survivability and immune responses after challenge with Edwardsiella ictaluri in susceptible and resistant families of channel catfish, Ictalurus punctatus. Fish. Shellfish. Immunol. 2000, 10, 475–487. [Google Scholar] [CrossRef]
  17. Mutz, K.O.; Heilkenbrinker, A.; Lonne, M.; Walter, J.G.; Stahl, F. Transcriptome analysis using next-generation sequencing. Curr. Opin. Biotechnol. 2013, 24, 22–30. [Google Scholar] [CrossRef]
  18. Lu, A.J.; Hu, X.C.; Wang, Y.; Zhu, A.H.; Shen, L.L.; Tian, J.; Feng, Z.Z.; Feng, Z.J. Skin immune response in the zebrafish, Danio rerio (Hamilton), to Aeromonas hydrophila infection: A transcriptional profiling approach. J. Fish. Dis. 2015, 38, 137–150. [Google Scholar] [CrossRef]
  19. Zhang, X.; Wang, S.; Chen, S.; Chen, Y.; Liu, Y.; Shao, C.; Wang, Q.; Lu, Y.; Gong, G.; Ding, S.; et al. Transcriptome analysis revealed changes of multiple genes involved in immunity in Cynoglossus semilaevis during Vibrio anguillarum infection. Fish. Shellfish. Immunol. 2015, 43, 209–218. [Google Scholar] [CrossRef]
  20. Huang, Y.; Huang, X.; Yan, Y.; Cai, J.; Ouyang, Z.; Cui, H.; Wang, P.; Qin, Q. Transcriptome analysis of orange-spotted grouper (Epinephelus coioides) spleen in response to Singapore grouper iridovirus. BMC Genom. 2011, 12, 556. [Google Scholar] [CrossRef]
  21. Chen, J.; Li, C.; Huang, R.; Du, F.; Liao, L.; Zhu, Z.; Wang, Y. Transcriptome analysis of head kidney in grass carp and discovery of immune-related genes. BMC Vet. Res. 2012, 8, 108. [Google Scholar] [CrossRef]
  22. Zhang, X.; Mu, Y.; Mu, P.; Ao, J.; Chen, X. Transcriptome analysis reveals comprehensive insights into the early immune response of large yellow croaker (Larimichthys crocea) Induced by Trivalent Bacterial Vaccine. PLoS ONE 2017, 12, e0170958. [Google Scholar] [CrossRef]
  23. Wu, R.; Sheng, X.; Tang, X.; Xing, J.; Zhan, W. Transcriptome analysis of flounder (Paralichthys olivaceus) gill in response to lymphocystis disease virus (LCDV) infection: Novel insights into fish defense mechanisms. Int. J. Mol. Sci. 2018, 19, 160. [Google Scholar] [CrossRef]
  24. Wang, Y.; Wang, B.; Liu, M.; Jiang, K.; Wang, M.; Wang, L. Comparative transcriptome analysis reveals the different roles between hepatopancreas and intestine of Litopenaeus vannamei in immune response to aflatoxin B1 (AFB1) challenge. Comp. Biochem. Physiol. C Toxicol. Pharmacol. 2019, 222, 1–10. [Google Scholar] [CrossRef]
  25. Cai, Y.; Wang, S.; Guo, W.; Xie, Z.; Zheng, Y.; Cao, Z.; Zhou, Y. Transcriptome analysis provides insights into the immune responsive pathways and genes in the head kidney of tiger grouper (Epinephelus fuscoguttatus) fed with Spatholobus suberectus, Phellodendron amurense, or Eclipta prostrata. Fish. Shellfish. Immunol. 2018, 73, 100–111. [Google Scholar] [CrossRef] [PubMed]
  26. Ahn, D.H.; Kang, S.; Park, H. Transcriptome analysis of immune response genes induced by pathogen agonists in the Antarctic bullhead notothen Notothenia coriiceps. Fish. Shellfish. Immunol. 2016, 55, 315–322. [Google Scholar] [CrossRef] [PubMed]
  27. Jiang, J.H.; Miyata, M.; Chan, C.; Ngoh, S.Y.; Liew, W.C.; Saju, J.M.; Ng, K.S.; Wong, F.S.; Lee, Y.S.; Chang, S.F.; et al. Differential Transcriptomic Response in the Spleen and Head Kidney Following Vaccination and Infection of Asian Seabass with Streptococcus iniae. PLoS ONE 2014, 9, e99128. [Google Scholar] [CrossRef]
  28. Zhu, J.; Li, C.; Ao, Q.; Tan, Y.; Luo, Y.; Guo, Y.; Lan, G.; Jiang, H.; Gan, X. Trancriptomic profiling revealed the signatures of acute immune response in tilapia (Oreochromis niloticus) following Streptococcus iniae challenge. Fish. Shellfish. Immunol. 2015, 46, 346–353. [Google Scholar] [CrossRef]
  29. Zhang, R.; Zhang, L.L.; Ye, X.; Tian, Y.Y.; Sun, C.F.; Lu, M.X.; Bai, J.J. Transcriptome profiling and digital gene expression analysis of Nile tilapia (Oreochromis niloticus) infected by Streptococcus agalactiae. Mol. Biol. Rep. 2013, 40, 5657–5668. [Google Scholar] [CrossRef]
  30. Pan, C.; Zhu, Y.R.; Cao, K.X.; Li, J.X.; Wang, S.Y.; Zhu, J.H.; Zeng, X.M.; Zhang, H.Q.; Qin, Z.W. Transcriptome, intestinal microbiome and histomorphology profiling of differences in the response of Chinese sea bass (Lateolabrax maculatus) to Aeromonas hydrophila infection. Front. Microbiol. 2023, 14, 1103412. [Google Scholar] [CrossRef]
  31. Wang, B.T.; Hu, J.M.; Feng, J.; Zhang, Y.Q.; Sun, Y.X.; Jiang, B.; Li, W.; Liu, C.; Huang, Y.H.; Su, Y.L. Acute septicemia and immune response of spotted sea bass (Lateolabrax maculatus) to Aeromonas veronii infection. Fish. Shellfish. Immun. 2022, 124, 47–55. [Google Scholar] [CrossRef]
  32. Liu, H.; Wang, M.L.; Du, J.Y.; Wang, S.; Zhang, Z.; He, T.T.; Wang, Y.; Chen, Y.; Wang, W.; Li, X.J. Skin transcriptome of lenok trout (Brachymystax lenok) provides new insight on lectin genes and immune response mechanisms to Aeromonas salmonicida infection. Comp. Biochem. Phys. D 2025, 54, 101439. [Google Scholar] [CrossRef]
  33. Huang, R.S.; Tao, Y.F.; Jiang, B.J.; Badran, M.F.; Zhu, J.; Hua, J.X.; Wang, Q.C.; Lu, S.Q.; Saleh, M.H.L.; Aboueleila, R.H.M.; et al. Integrated gill transcriptome and biochemical indices analyses reveal that acute salinity stress induces oxidative stress and immune and metabolic disorders in Red Tilapia (Oreochromis spp.). Aquaculture 2025, 599, 742108. [Google Scholar] [CrossRef]
  34. Xing, M.C.; Rong, Z.; Zhao, X.; Gao, X.W.; Hou, Z.G.; Zhang, L.H.; Khor, W.; Xu, Y.H.; Chen, L.; Wu, C.B. Transcriptome analysis reveals hypoxic response key genes and modules as well as adaptive mechanism of crucian carp (Carassius auratus) gill under hypoxic stress. Front. Immunol. 2025, 16, 1543605. [Google Scholar] [CrossRef] [PubMed]
  35. Zhang, X.; Wen, H.; Wang, H.; Ren, Y.; Zhao, J.; Li, Y. RNA-Seq analysis of salinity stress-responsive transcriptome in the liver of spotted sea bass (Lateolabrax maculatus). PLoS ONE 2017, 12, e0173238. [Google Scholar] [CrossRef]
  36. Cock, P.J.; Fields, C.J.; Goto, N.; Heuer, M.L.; Rice, P.M. The Sanger FASTQ file format for sequences with quality scores, and the Solexa/Illumina FASTQ variants. Nucleic Acids Res. 2010, 38, 1767–1771. [Google Scholar] [CrossRef]
  37. Conesa, A.; Gotz, S.; Garcia-Gomez, J.M.; Terol, J.; Talon, M.; Robles, M. Blast2GO: A universal tool for annotation, visualization and analysis in functional genomics research. Bioinformatics 2005, 21, 3674–3676. [Google Scholar] [CrossRef]
  38. Finn, R.D.; Clements, J.; Eddy, S.R. HMMER web server: Interactive sequence similarity searching. Nucleic Acids Res. 2011, 39, W29–W37. [Google Scholar] [CrossRef]
  39. Xie, C.; Mao, X.Z.; Huang, J.J.; Ding, Y.; Wu, J.M.; Dong, S.; Kong, L.; Gao, G.; Li, C.Y.; Wei, L.P. KOBAS 2.0: A web server for annotation and identification of enriched pathways and diseases. Nucleic Acids Res. 2011, 39, W316–W322. [Google Scholar] [CrossRef]
  40. Ashburner, M.; Ball, C.A.; Blake, J.A.; Botstein, D.; Butler, H.; Cherry, J.M.; Davis, A.P.; Dolinski, K.; Dwight, S.S.; Eppig, J.T.; et al. Gene ontology: Tool for the unification of biology. The Gene Ontology Consortium. Nat. Genet. 2000, 25, 25–29. [Google Scholar] [CrossRef]
  41. Tatusov, R.L.; Koonin, E.V.; Lipman, D.J. A genomic perspective on protein families. Science 1997, 278, 631–637. [Google Scholar] [CrossRef] [PubMed]
  42. Kanehisa, M.; Sato, Y.; Kawashima, M.; Furumichi, M.; Tanabe, M. KEGG as a reference resource for gene and protein annotation. Nucleic Acids Res. 2016, 44, D457–D462. [Google Scholar] [CrossRef]
  43. Medzhitov, R.; Janeway, C.A., Jr. Decoding the patterns of self and nonself by the innate immune system. Science 2002, 296, 298–300. [Google Scholar] [CrossRef]
  44. Hoffmann, J.A. The immune response of Drosophila. Nature 2003, 426, 33–38. [Google Scholar] [CrossRef]
  45. Janeway, C.A., Jr.; Medzhitov, R. Innate immune recognition. Annu. Rev. Immunol. 2002, 20, 197–216. [Google Scholar] [CrossRef] [PubMed]
  46. Gulati, A.; Kaur, D.; Krishna Prasad, G.V.R.; Mukhopadhaya, A. PRR function of innate immune receptors in recognition of bacteria or bacterial ligands. Adv. Exp. Med. Biol. 2018, 1112, 255–280. [Google Scholar] [CrossRef]
  47. Farre, E.M.; Liu, T. The PRR family of transcriptional regulators reflects the complexity and evolution of plant circadian clocks. Curr. Opin. Plant Biol. 2013, 16, 621–629. [Google Scholar] [CrossRef] [PubMed]
  48. West, A.P.; Koblansky, A.A.; Ghosh, S. Recognition and signaling by toll-like receptors. Annu. Rev. Cell Dev. Biol. 2006, 22, 409–437. [Google Scholar] [CrossRef]
  49. O’Neill, L.A.; Golenbock, D.; Bowie, A.G. The history of Toll-like receptors—Redefining innate immunity. Nat. Rev. Immunol. 2013, 13, 453–460. [Google Scholar] [CrossRef]
  50. Hopkins, P.A.; Sriskandan, S. Mammalian Toll-like receptors: To immunity and beyond. Clin. Exp. Immunol. 2005, 140, 395–407. [Google Scholar] [CrossRef]
  51. Stein, C.; Caccamo, M.; Laird, G.; Leptin, M. Conservation and divergence of gene families encoding components of innate immune response systems in zebrafish. Genome Biol. 2007, 8, R251. [Google Scholar] [CrossRef]
  52. Roach, J.C.; Glusman, G.; Rowen, L.; Kaur, A.; Purcell, M.K.; Smith, K.D.; Hood, L.E.; Aderem, A. The evolution of vertebrate Toll-like receptors. Proc. Natl. Acad. Sci. USA 2005, 102, 9577–9582. [Google Scholar] [CrossRef] [PubMed]
  53. Baoprasertkul, P.; Peatman, E.; Abernathy, J.; Liu, Z. Structural characterisation and expression analysis of toll-like receptor 2 gene from catfish. Fish. Shellfish. Immunol. 2007, 22, 418–426. [Google Scholar] [CrossRef] [PubMed]
  54. Huang, X.N.; Wang, Z.Y.; Yao, C.L. Characterization of Toll-like receptor 3 gene in large yellow croaker, Pseudosciaena crocea. Fish. Shellfish. Immunol. 2011, 31, 98–106. [Google Scholar] [CrossRef]
  55. Meijer, A.H.; Gabby Krens, S.F.; Medina Rodriguez, I.A.; He, S.; Bitter, W.; Ewa Snaar-Jagalska, B.; Spaink, H.P. Expression analysis of the Toll-like receptor and TIR domain adaptor families of zebrafish. Mol. Immunol. 2004, 40, 773–783. [Google Scholar] [CrossRef]
  56. Palti, Y.; Rodriguez, M.F.; Vallejo, R.L.; Rexroad, C.E., 3rd. Mapping of Toll-like receptor genes in rainbow trout. Anim. Genet. 2006, 37, 597–598. [Google Scholar] [CrossRef] [PubMed]
  57. Baoprasertkul, P.; Peatman, E.; Somridhivej, B.; Liu, Z. Toll-like receptor 3 and TICAM genes in catfish: Species-specific expression profiles following infection with Edwardsiella ictaluri. Immunogenetics 2006, 58, 817–830. [Google Scholar] [CrossRef]
  58. Chen, X.; Wang, Q.; Yang, C.; Rao, Y.; Li, Q.; Wan, Q.; Peng, L.; Wu, S.; Su, J. Identification, expression profiling of a grass carp TLR8 and its inhibition leading to the resistance to reovirus in CIK cells. Dev. Comp. Immunol. 2013, 41, 82–93. [Google Scholar] [CrossRef]
  59. Wang, R.H.; Li, W.; Fan, Y.D.; Liu, Q.L.; Zeng, L.B.; Xiao, T.Y. TLR22 structure and expression characteristic of barbel chub, Squaliobarbus curriculus provides insights into antiviral immunity against infection with grass carp reovirus. Fish. Shellfish. Immunol. 2017, 66, 120–128. [Google Scholar] [CrossRef]
  60. Ng, C.S.; Kato, H.; Fujita, T. Recognition of viruses in the cytoplasm by RLRs and other helicases--how conformational changes, mitochondrial dynamics and ubiquitination control innate immune responses. Int. Immunol. 2012, 24, 739–749. [Google Scholar] [CrossRef]
  61. Gu, T.; Lu, L.; An, C.; Chen, B.; Wei, W.; Wu, X.; Xu, Q.; Chen, G. MDA5 and LGP2 acts as a key regulator though activating NF-kappaB and IRF3 in RLRs signaling of mandarinfish. Fish. Shellfish. Immunol. 2019, 86, 1114–1122. [Google Scholar] [CrossRef]
  62. Pollpeter, D.; Komuro, A.; Barber, G.N.; Horvath, C.M. Impaired cellular responses to cytosolic DNA or infection with Listeria monocytogenes and vaccinia virus in the absence of the murine LGP2 protein. PLoS ONE 2011, 6, e18842. [Google Scholar] [CrossRef]
  63. Paria, A.; Deepika, A.; Sreedharan, K.; Makesh, M.; Chaudhari, A.; Purushothaman, C.S.; Rajendran, K.V. Identification, ontogeny and expression analysis of a novel laboratory of genetics and physiology 2 (LGP2) transcript in Asian seabass, Lates calcarifer. Fish. Shellfish. Immunol. 2017, 62, 265–275. [Google Scholar] [CrossRef]
  64. Kim, M.Y.; Jang, J.H.; Lee, J.W.; Cho, J.H. Molecular cloning and characterization of peptidoglycan recognition proteins from the rockfish, Sebastes schlegeli. Fish. Shellfish. Immunol. 2010, 28, 632–639. [Google Scholar] [CrossRef] [PubMed]
  65. Jang, J.H.; Kim, H.; Cho, J.H. Molecular cloning and functional characterization of peptidoglycan recognition protein OmPGRP-L2 from the rainbow trout, Oncorhynchus mykiss. Vet. Immunol. Immunopathol. 2017, 192, 28–32. [Google Scholar] [CrossRef] [PubMed]
  66. Li, J.H.; Yu, Z.L.; Xue, N.N.; Zou, P.F.; Hu, J.Y.; Nie, P.; Chang, M.X. Molecular cloning and functional characterization of peptidoglycan recognition protein 6 in grass carp Ctenopharyngodon idella. Dev. Comp. Immunol. 2014, 42, 244–255. [Google Scholar] [CrossRef]
  67. Banyer, J.L.; Hamilton, N.H.; Ramshaw, I.A.; Ramsay, A.J. Cytokines in innate and adaptive immunity. Rev. Immunogenet. 2000, 2, 359–373. [Google Scholar] [PubMed]
  68. Floege, J.; Luscher, B.; Muller-Newen, G. Cytokines and inflammation. Eur. J. Cell Biol. 2012, 91, 427. [Google Scholar] [CrossRef]
  69. Hong, S.; Zou, J.; Crampe, M.; Peddie, S.; Scapigliati, G.; Bols, N.; Cunningham, C.; Secombes, C.J. The production and bioactivity of rainbow trout (Oncorhynchus mykiss) recombinant IL-1 beta. Vet. Immunol. Immunopathol. 2001, 81, 1–14. [Google Scholar] [CrossRef]
  70. Bae, J.S.; Shim, S.H.; Hwang, S.D.; Kim, J.W.; Park, D.W.; Park, C.I. Molecular cloning and expression analysis of interleukin (IL)-15 and IL-15 receptor alpha from rock bream, Oplegnathus fasciatus. Fish. Shellfish. Immunol. 2013, 35, 1209–1215. [Google Scholar] [CrossRef]
  71. Guo, M.; Tang, X.; Sheng, X.; Xing, J.; Zhan, W. The effects of IL-1beta, IL-8, G-CSF and TNF-alpha as molecular adjuvant on the immune response to an E. tarda subunit vaccine in flounder (Paralichthys olivaceus). Fish. Shellfish. Immunol. 2018, 77, 374–384. [Google Scholar] [CrossRef] [PubMed]
  72. Andersen, L.K.; Abernathy, J.W.; Farmer, B.D.; Lange, M.D.; Sankappa, N.M.; Mcentire, M.E.; Rawles, S.D. Analysis of striped bass (Morone saxatilis) and white bass (M. chrysops) splenic transcriptome following Streptococcus iniae infection. Mar. Biotechnol. 2025, 27, 51. [Google Scholar] [CrossRef]
  73. Zhao, Y.; He, Z.; Liu, Y.; Ren, Y.; Ren, J.; Zhang, Y.; Wang, Y.; Wang, G.; San, L.; Hou, J. Isolation, identification and the pathogenicity characterization of Pseudomonas putida 1C3 and its activation on immune responses in Japanese flounder (Paralichthys olivaceus). Fish. Shellfish. Immun. 2025, 160, 110208. [Google Scholar] [CrossRef]
  74. Su, L.; Guo, B.S.; Jiang, L.R.; Lin, Y.P.; Xu, Q.Y.; Zheng, D.; Xiu, Y.J. Intestinal epithelial cells of Japanese flounder (Paralichthys olivaceus) as an in vitro model for studying intestine immune function based on transcriptome analysis. Fish. Shellfish. Immun. 2024, 148, 109473. [Google Scholar] [CrossRef]
Figure 1. Length distribution of transcripts obtained from all of the libraries. The X-axis shows the transcripts length, and the Y-axis represents the transcript’s number.
Fishes 10 00153 g001
Figure 2. Gene ontology (GO) analysis of the assembled unigenes.
Fishes 10 00153 g002
Figure 3. Cluster of Orthologous Group (COG) annotation of assembled unigenes. (A) RNA processing and modification; (B) Chromatin structure and dynamics; (C) Energy production and conversion; (D) Cell cycle control, cell division, chromosome partitioning; (E) Amino acid transport and metabolism; (F) Nucleotide transport and metabolism; (G) Carbohydrate transport and metabolism; (H) Coenzyme transport and metabolism; (I) Lipid transport and metabolism; (J) Translation, ribosomal structure, and biogenesis; (K) Transcription; (L) Replication, recombination, and repair; (M) Cell wall/membrane/envelope biogenesis; (O) Posttranslational modification, protein turnover, chaperones; (P) Inorganic ion transport and metabolism; (Q) Secondary metabolites biosynthesis, transport, and catabolism; (S) Function unknown; (T) Signal transduction mechanisms; (U) Intracellular trafficking, secretion, and vesicular transport; (V) Defense mechanisms; (Z) Cytoskeleton.
Fishes 10 00153 g003
Figure 4. Kyoto Encyclopedia of Genes and Genomes (KEGG) annotation of assembled unigenes.
Fishes 10 00153 g004
Figure 5. Volcano plot of differentially expressed unigenes in different tissues. (A) liver; (B) spleen; (C) head kidney. The green and red numbers represent the number of downregulated and upregulated differentially expressed genes per sample in the E. tarda-injected group compared with those in the PBS-injected group, respectively.
Fishes 10 00153 g005
Figure 6. The distribution of differentially expressed genes in GO analysis.
Fishes 10 00153 g006
Figure 7. Distribution of differentially expressed genes in KEGG pathway analysis. (A) DEGs of the liver in KEGG enrichment analysis; (B) DEGs of the spleen in KEGG enrichment analysis; (C) DEGs of the head kidney in KEGG enrichment analysis.
Fishes 10 00153 g007
Figure 8. Heatmap of differentially expressed genes in three tissues. (A) Heatmap of DEGs in liver; (B) Heatmap of DEGs in spleen; (C) Heatmap of DEGs in head kidney. EdW and PBS represent the E. tarda-injected group and the PBS-injected group, respectively. L: liver, SP: spleen, HK: head kidney. The numbers 1, 2, and 3 denote three fish (three biological replicates), respectively.
Fishes 10 00153 g008
Figure 9. Venn Diagram of differentially expressed genes in three tissues. The numbers and percentages represent the number of DEGs and their proportions in each set, respectively.
Fishes 10 00153 g009
Figure 10. GO and KEGG enrichment analysis of common differentially expressed genes in three tissues. (A) GO enrichment analysis; (B) KEGG enrichment analysis.
Fishes 10 00153 g010
Figure 11. Validation of differently expressed genes by qRT-PCR. (A) Liver; (B) Spleen; (C) Head kidney. Expression of target genes was normalized to EF1α as a reference gene.
Fishes 10 00153 g011
Disclaimer/Publisher’s Note: The statements, opinions and data contained in all publications are solely those of the individual author(s) and contributor(s) and not of MDPI and/or the editor(s). MDPI and/or the editor(s) disclaim responsibility for any injury to people or property resulting from any ideas, methods, instructions or products referred to in the content.

