
Fish Upstream Passage through Gauging Stations: Experiences with Iberian Barbel in Flat-V Weirs

 , , , ,
Abstract
:1. Introduction
2. Materials and Methods
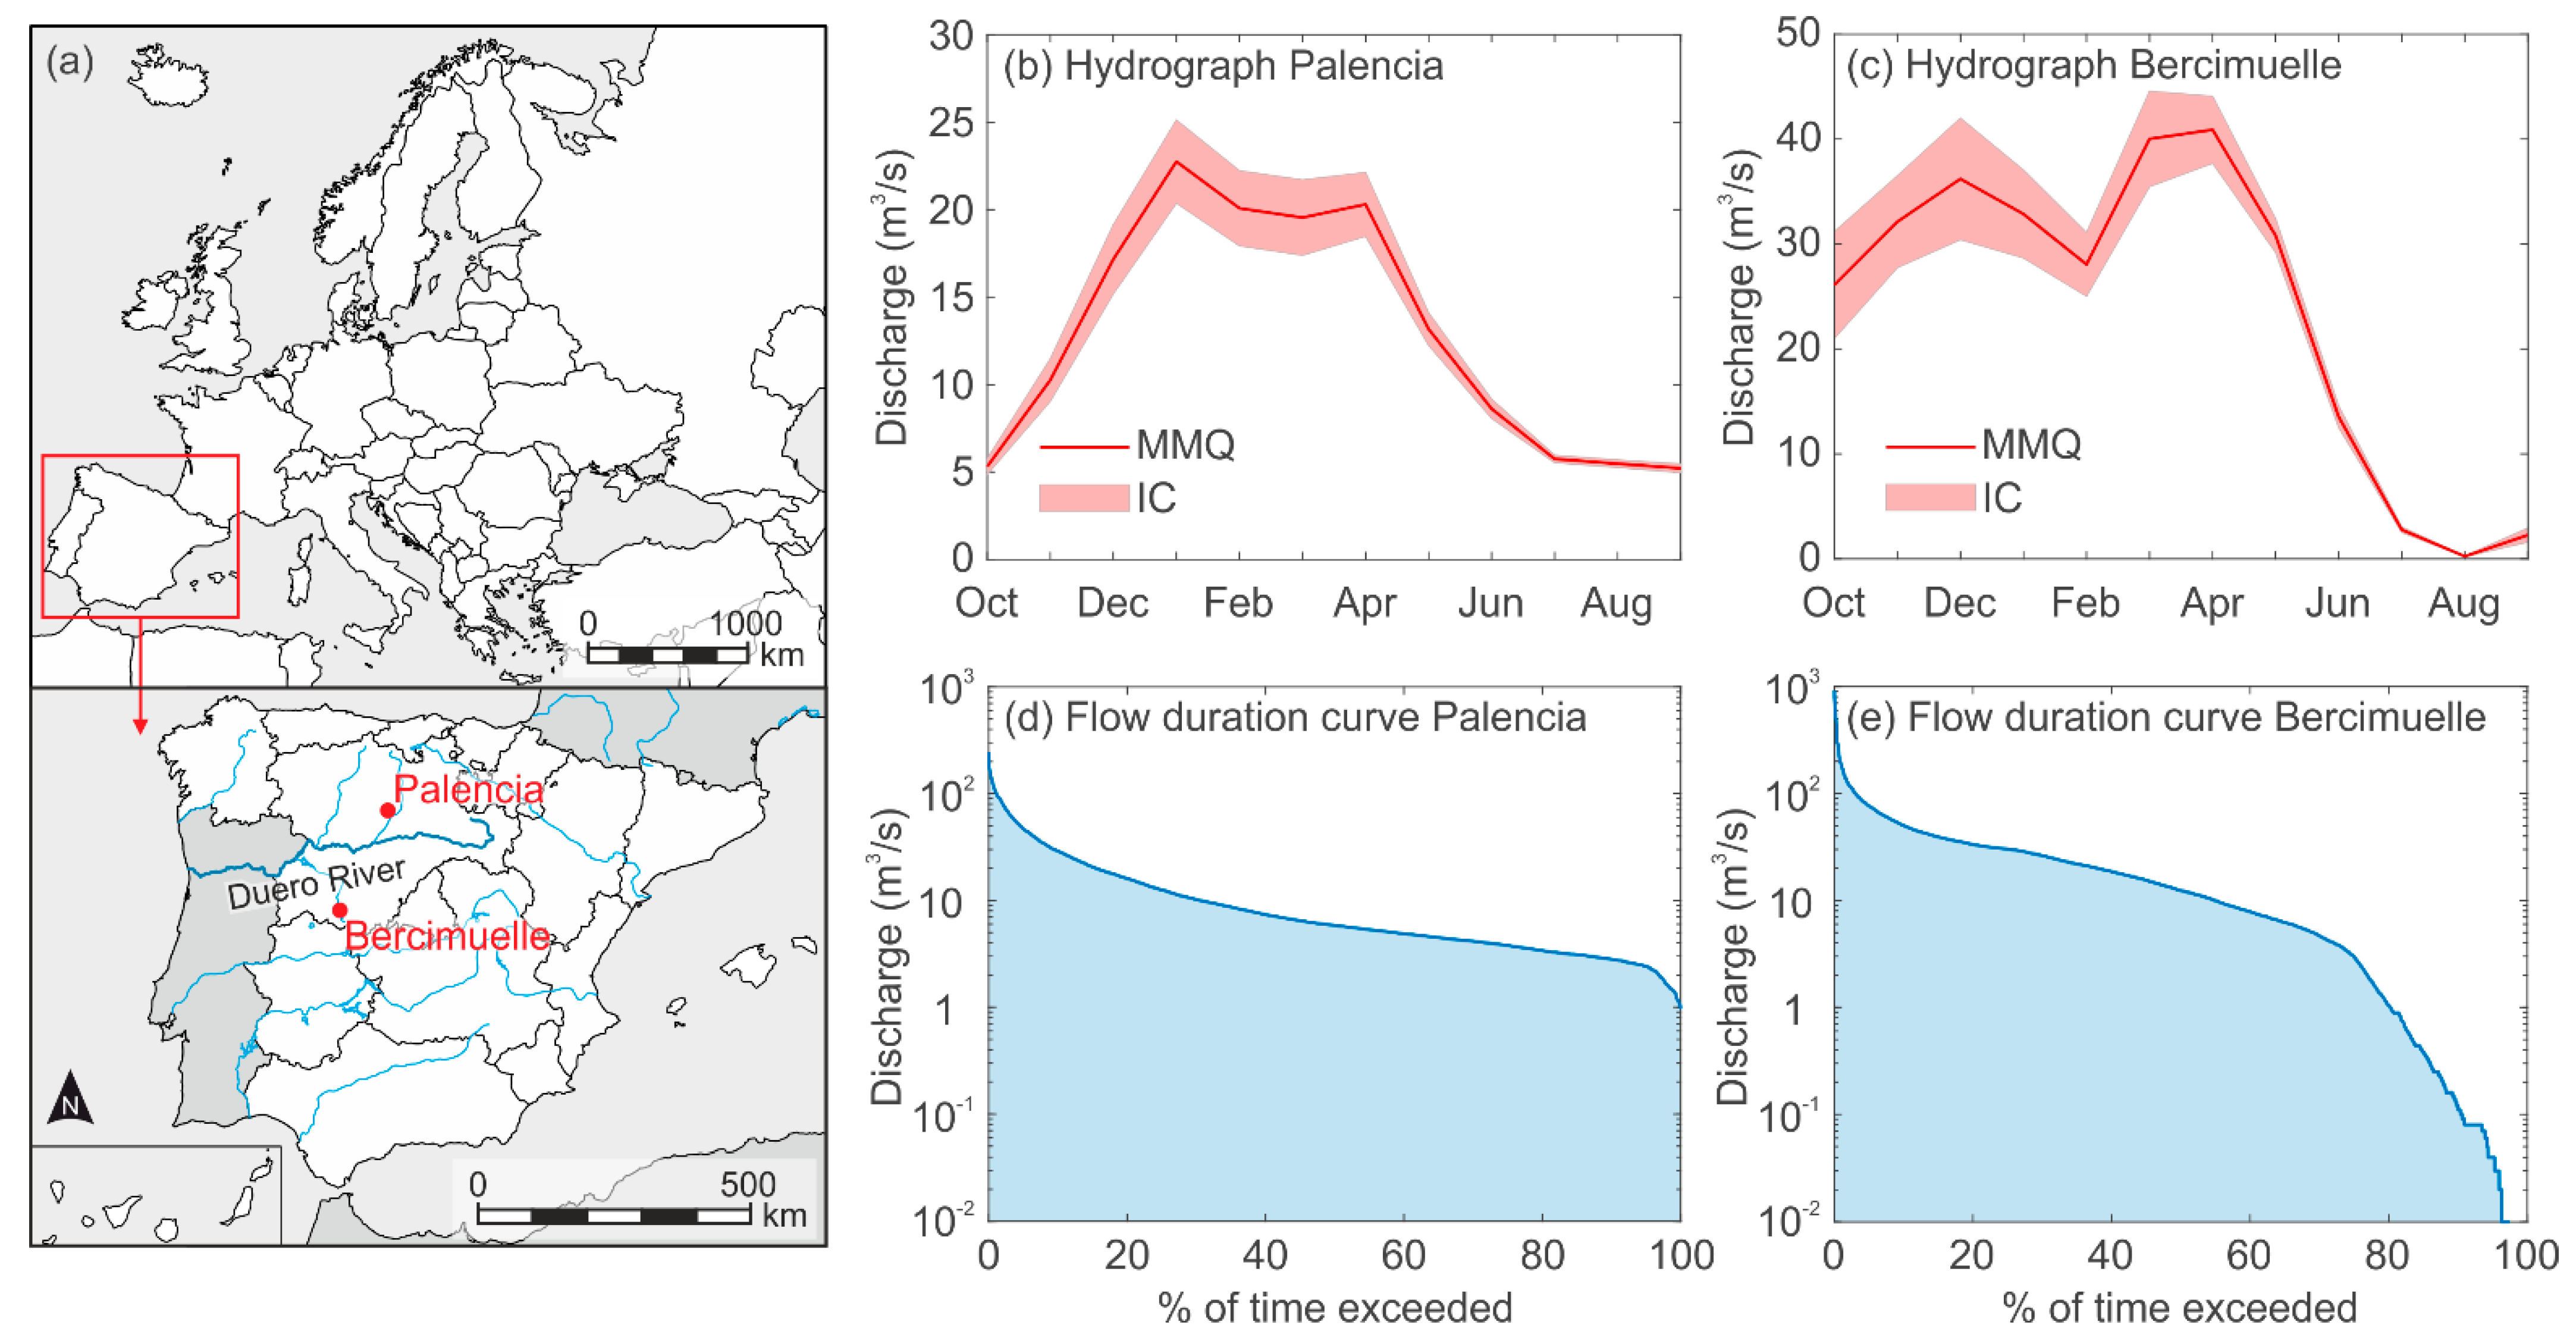
2.1. Study Sites
2.2. Hydraulic Data Collection and CFD Model
2.2.1. Hydraulic Data
2.2.2. CFD Methods
2.2.3. Mesh, Boundary Conditions, and Time Sensitivity Analysis
2.2.4. CFD Data Extraction
2.3. Fish Data Collection

2.3.1. Video Tracking—Bercimuelle
2.3.2. Radio Tracking—Palencia
2.4. Radio Tag Record Analysis
- The burst interval of the registered signal were required to be between 29 and 31 pulses per minute (in accordance with tag frequency).
- Only signals with a power of at least 60 (power scale of the reader between 0 and 255) were considered. This was determined based on on-site tests during the installation and by considering the levels of ambient noise.
- In order to consider a positive record, at least two consecutive records were required.
- A successful ascent through the weir was defined as a positive detection of a fish with both antennas together with a logical power variation. Specifically, a strong signal in the downstream antenna followed by a consecutive intensity gain in the upper antenna, a decrease in the intensity of the uppermost antenna and its disappearance in the downstream antenna were required.
- Ascent attempt without success was defined as (1) a strong positive detection in the downstream antenna, followed by a weak detection in upstream antenna and finishing with a detection only in the downstream antenna, or (2) fish detection only in the downstream antenna.
- Downstream movements were also identified whenever an inverse sequence of signals occurred. However, they were discarded for the analyses.
- Overall upstream passage efficiency was defined as the ratio between the successful upstream passages and the total number of registered events (successful upstream passages + ascent attempts).
2.5. Data Management and Statistical Analyses
3. Results
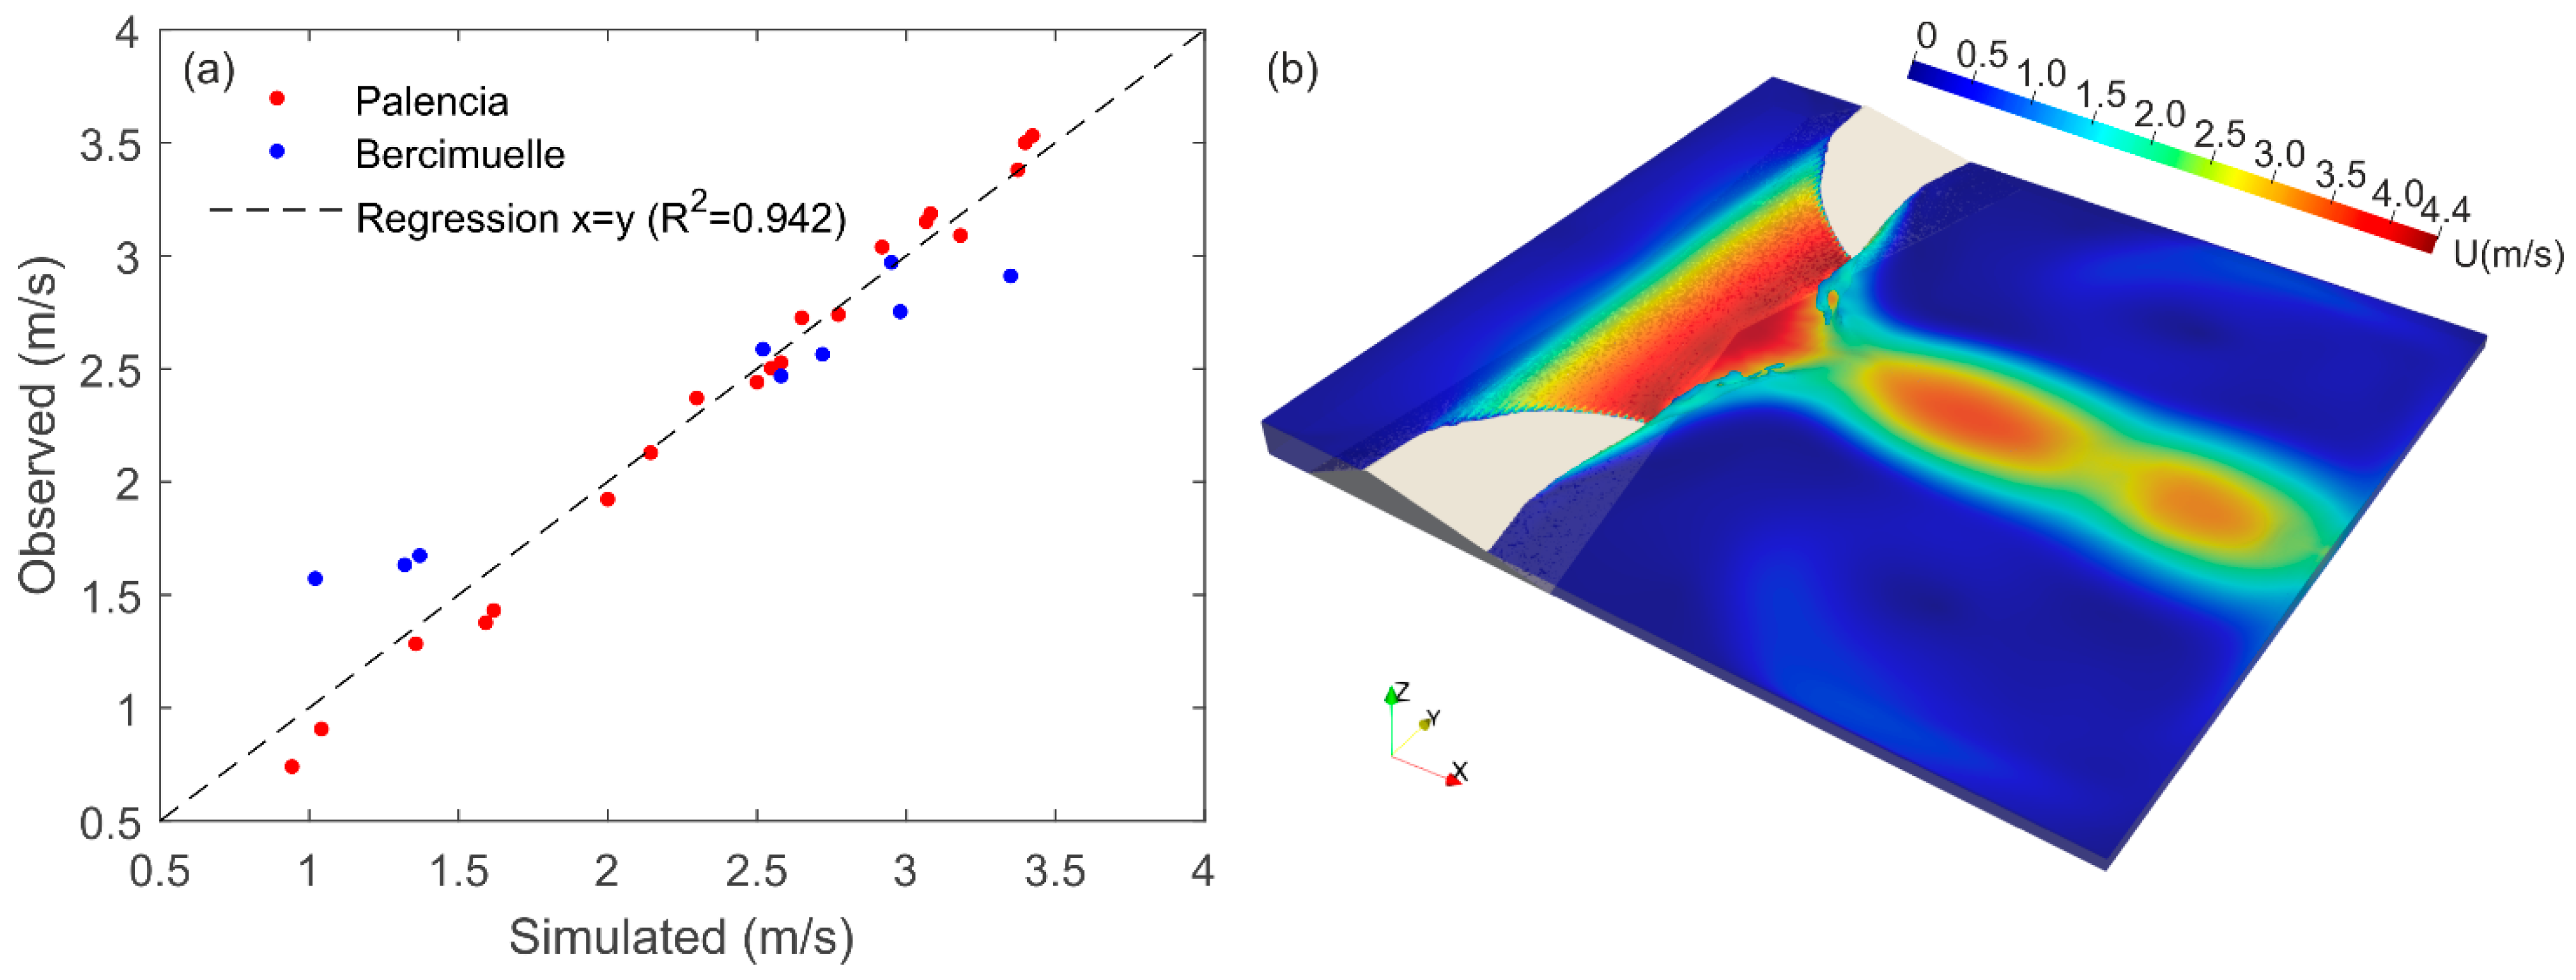
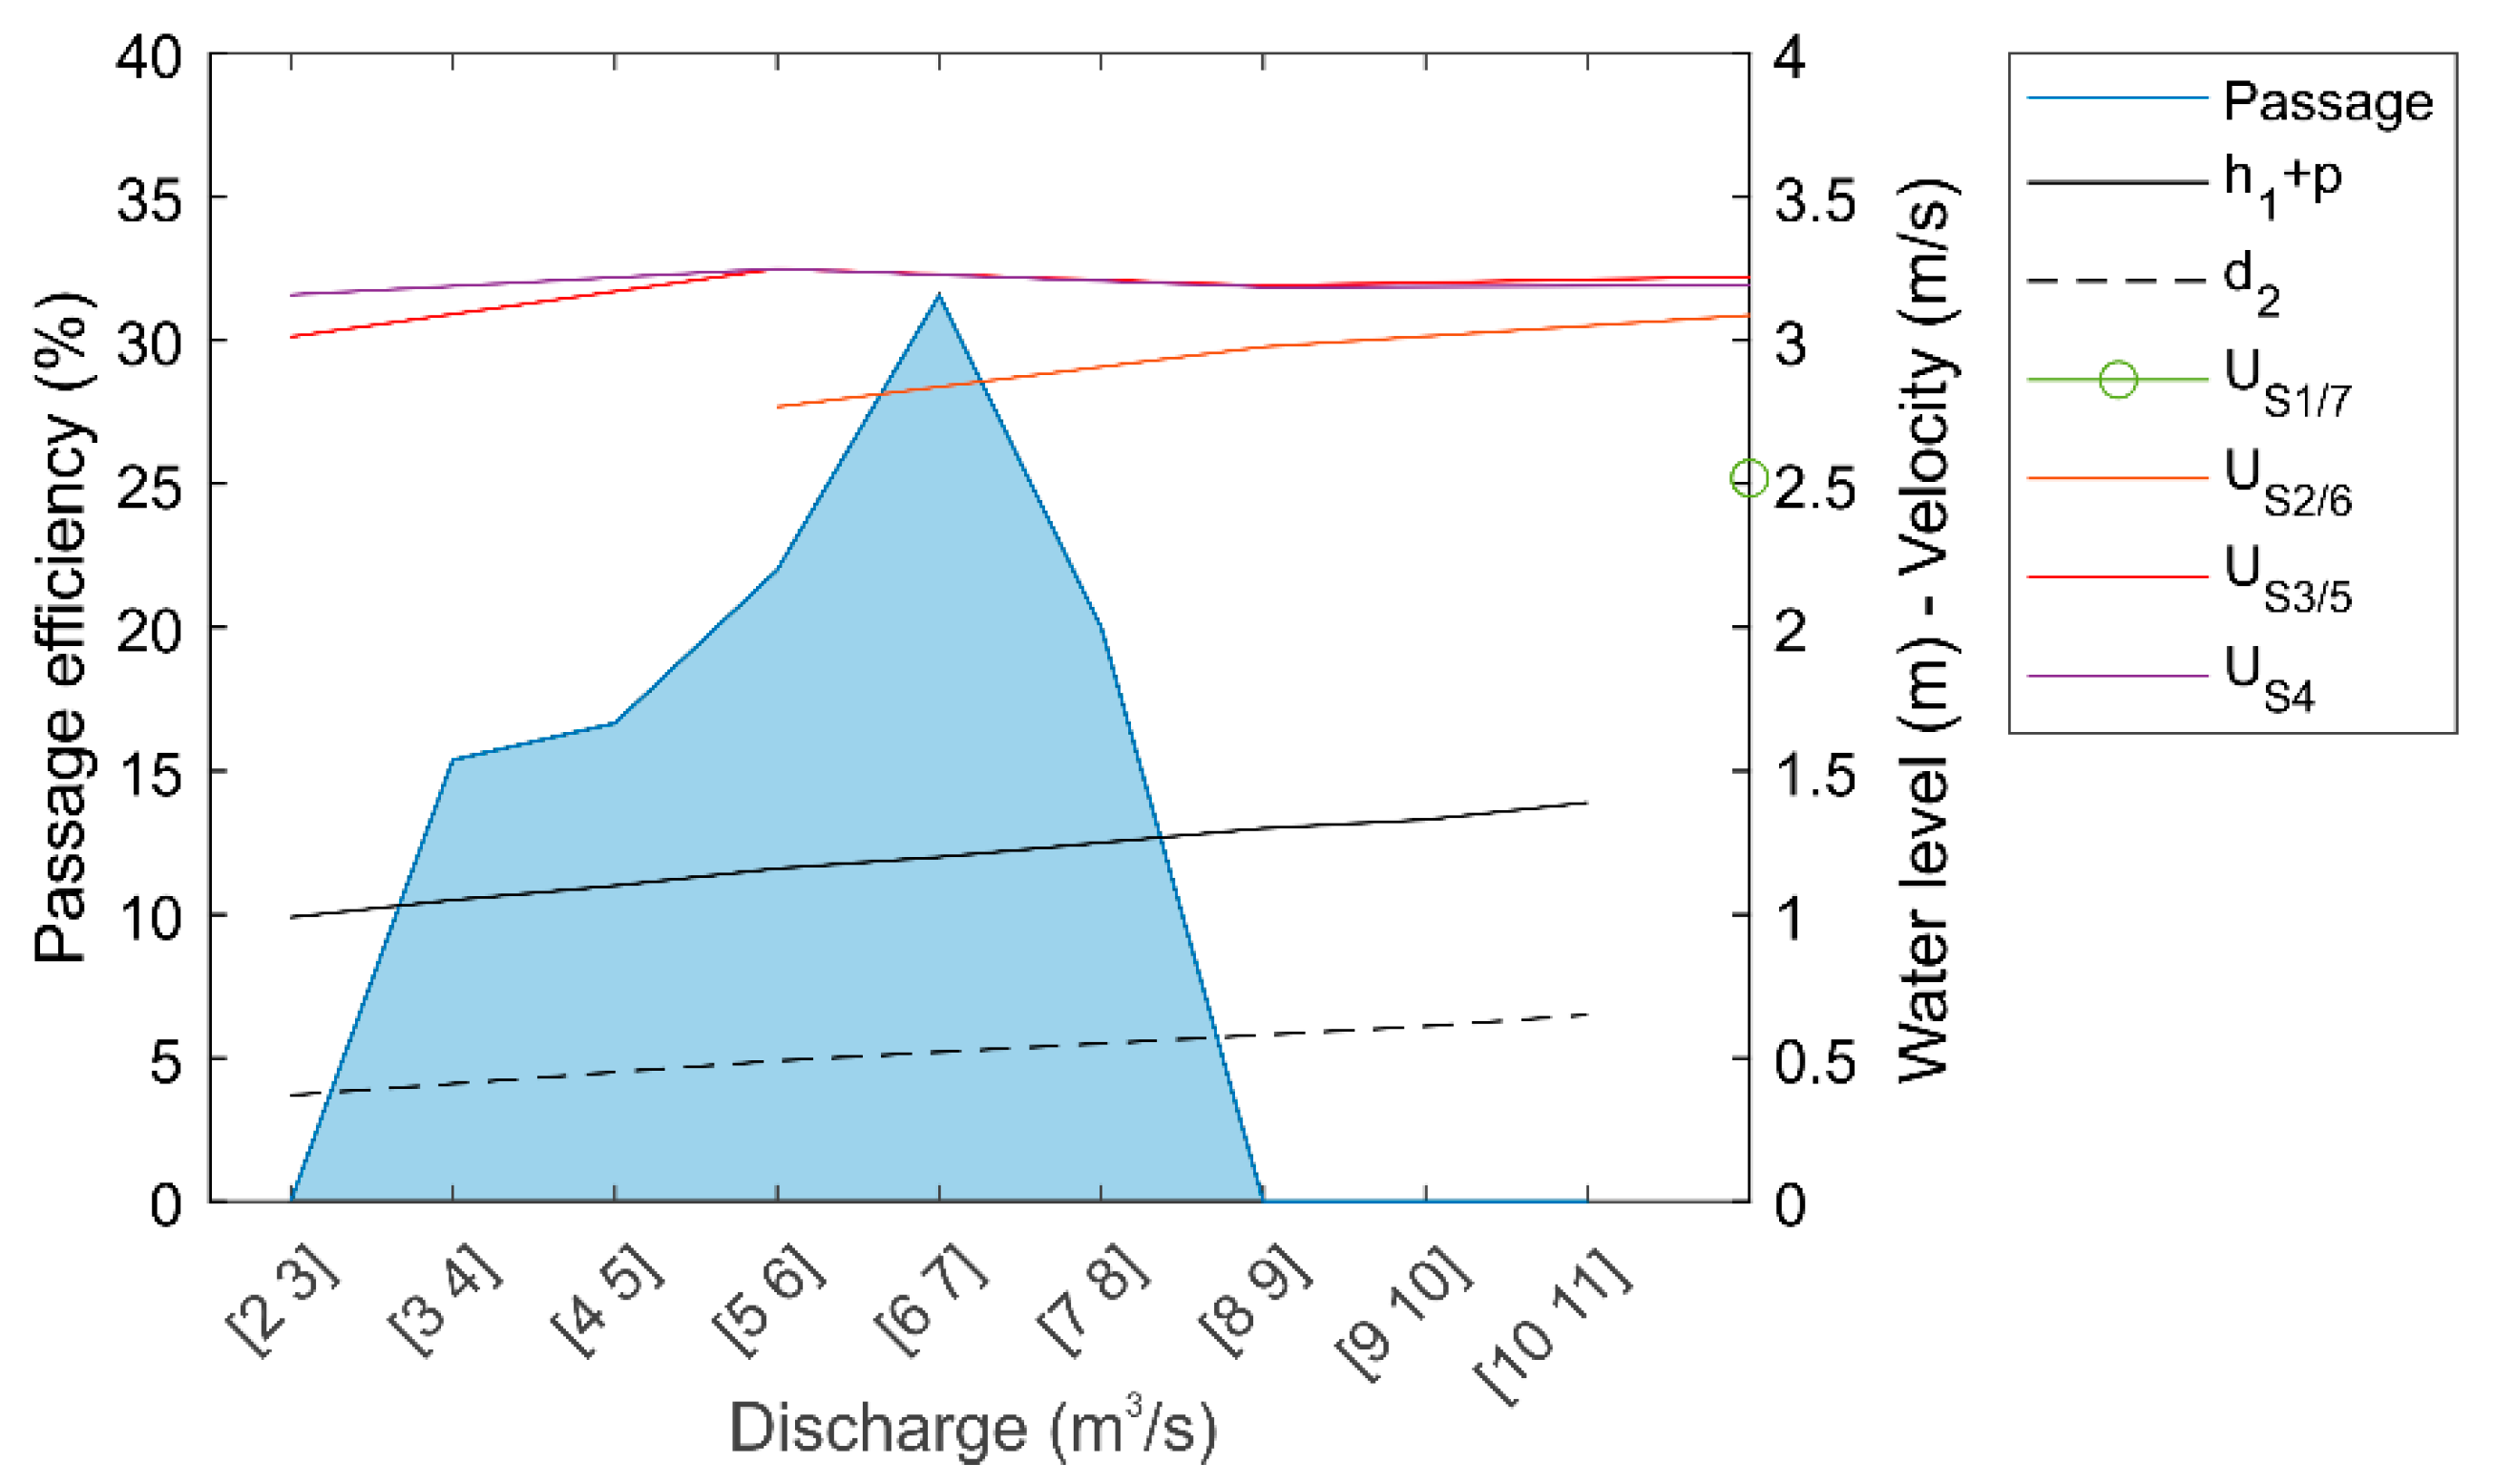
3.1. Hydraulic Modeling

| Flat-V | Grid Position | Q (m3/s) | h1 + p (m) | d2 (m) | Sections 1 and 7 | Sections 2 and 6 | Sections 3 and 5 | Section 4 | ||||
|---|---|---|---|---|---|---|---|---|---|---|---|---|
| U (m/s) | h (m) | U (m/s) | h (m) | U (m/s) | h (m) | U (m/s) | h (m) | |||||
| Bercimuelle (p = 0.5 m) | Upstream | 4 | 0.94 | 0.57 | 2.00 ± 0.38 | 0.10 ± 0.03 | 2.16 ± 0.37 | 0.15 ± 0.03 | 2.21 ± 0.36 | 0.21 ± 0.04 | 2.19 ± 0.34 | 0.26 ± 0.03 |
| Downstream | 2.81 ± 0.16 | 0.06 ± 0.01 | 2.94 ± 0.09 | 0.10 ± 0.02 | 2.93 ± 0.08 | 0.16 ± 0.03 | 2.93 ± 0.07 | 0.22 ± 0.01 | ||||
| Upstream | 6 | 1.03 | 0.64 | 2.31 ± 0.42 | 0.15 ± 0.04 | 2.41 ± 0.41 | 0.20 ± 0.04 | 2.44 ± 0.39 | 0.26 ± 0.04 | 2.41 ± 0.38 | 0.32 ± 0.04 | |
| Downstream | 3.23 ± 0.17 | 0.10 ± 0.02 | 3.30 ± 0.12 | 0.14 ± 0.02 | 3.28 ± 0.11 | 0.20 ± 0.03 | 3.25 ± 0.08 | 0.26 ± 0.02 | ||||
| Upstream | 8 | 1.10 | 0.71 | 2.46 ± 0.41 | 0.21 ± 0.05 | 2.53 ± 0.39 | 0.26 ± 0.05 | 2.54 ± 0.38 | 0.33 ± 0.05 | 2.50 ± 0.36 | 0.38 ± 0.04 | |
| Downstream | 3.42 ± 0.21 | 0.13 ± 0.02 | 3.49 ± 0.14 | 0.18 ± 0.02 | 3.48 ± 0.13 | 0.25 ± 0.03 | 3.42 ± 0.12 | 0.31 ± 0.01 | ||||
| Palencia (p = 0.7 m) | Upstream | 3 | 1.09 | 0.30 | - | - | 1.30 ± 0.51 | 0.03 ± 0.01 | 2.49 ± 0.44 | 0.09 ± 0.04 | 2.68 ± 0.37 | 0.17 ± 0.03 |
| Downstream | - | - | - | - | 3.54 ± 0.41 | 0.07 ± 0.03 | 3.64 ± 0.18 | 0.14 ± 0.02 | ||||
| Upstream | 6 | 1.23 | 0.46 | 0.77 ± 0.27 | 0.03 ± 0.01 | 2.3 ± 0.52 | 0.06 ± 0.03 | 2.78 ± 0.37 | 0.15 ± 0.04 | 2.81 ± 0.38 | 0.25 ± 0.04 | |
| Downstream | - | - | 3.27 ± 0.47 | 0.04 ± 0.01 | 3.71 ± 0.18 | 0.12 ± 0.03 | 3.70 ± 0.15 | 0.20 ± 0.03 | ||||
| Upstream | 9 | 1.33 | 0.62 | 1.76 ± 0.59 | 0.04 ± 0.01 | 2.70 ± 0.36 | 0.10 ± 0.03 | 2.87 ± 0.35 | 0.20 ± 0.05 | 2.84 ± 0.36 | 0.31 ± 0.04 | |
| Downstream | - | - | 3.35 ± 0.28 | 0.08 ± 0.03 | 3.52 ± 0.08 | 0.17 ± 0.03 | 3.54 ± 0.1 | 0.27 ± 0.03 | ||||
| Upstream | 12 | 1.40 | 0.75 | 2.33 ± 0.54 | 0.06 ± 0.03 | 2.82 ± 0.35 | 0.14 ± 0.03 | 2.93 ± 0.35 | 0.25 ± 0.05 | 2.88 ± 0.36 | 0.36 ± 0.05 | |
| Downstream | 2.71 ± 0.91 | 0.07 ± 0.1 | 3.36 ± 0.11 | 0.12 ± 0.02 | 3.52 ± 0.07 | 0.21 ± 0.04 | 3.51 ± 0.11 | 0.33 ± 0.03 | ||||
3.2. Video-Tracking
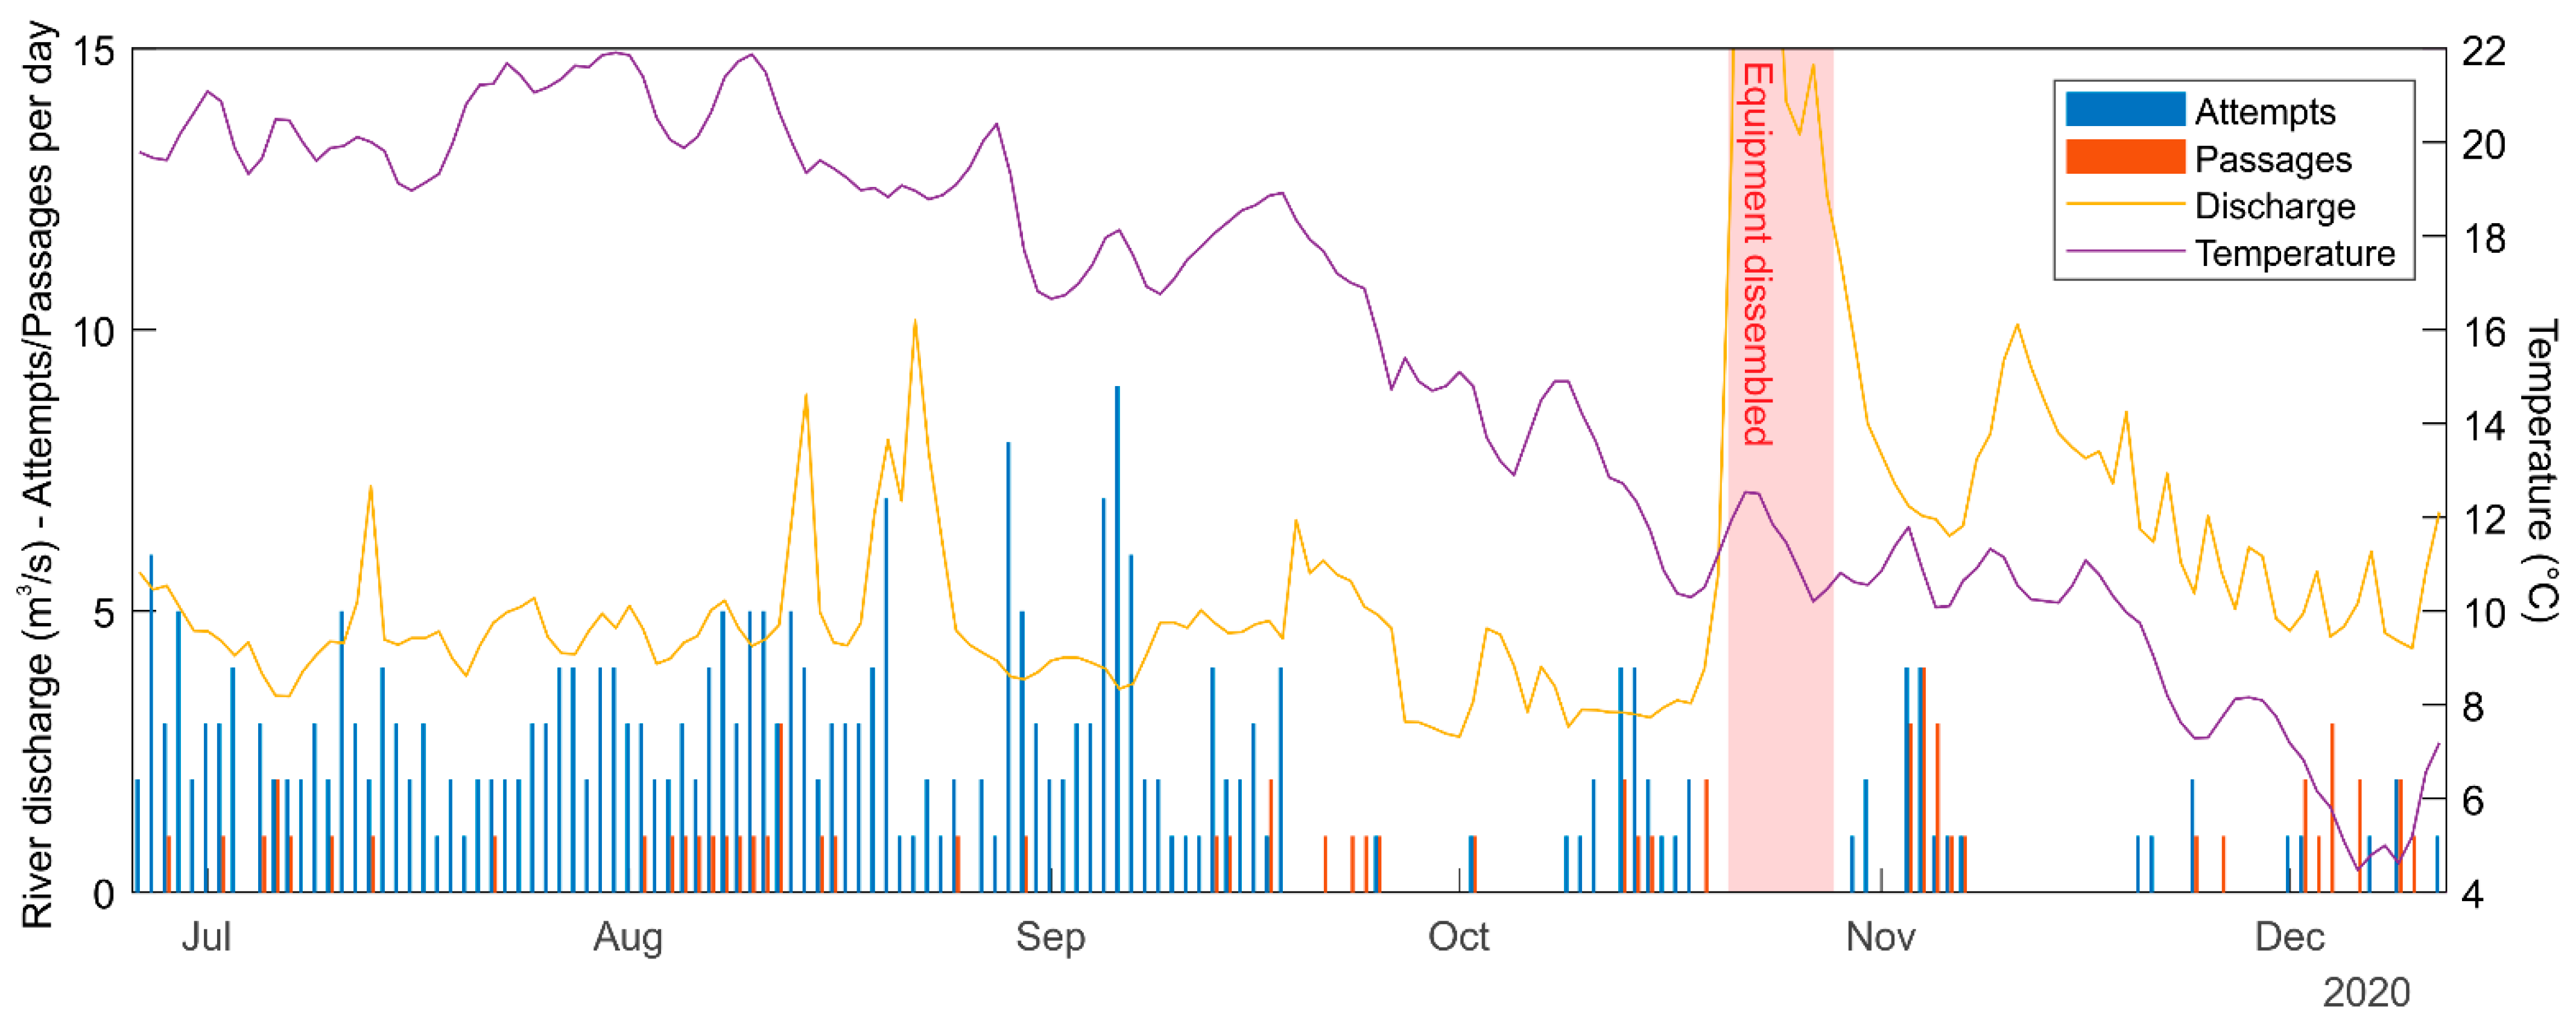
3.3. Radio Tracking
4. Discussion
5. Conclusions
Supplementary Materials
Author Contributions
Funding
Institutional Review Board Statement
Data Availability Statement
Conflicts of Interest
Nomenclature
| B | weir width (m) |
| D | swimming distance (m) |
| d2 | water depth downstream (m) |
| Fr | Froude number |
| h1 | water depth upstream deducting the sill height (m) |
| h | mean water depth (m) |
| n | number of fish |
| p | sill height (m) |
| Q | discharge (m3/s) |
| R2 | determination coefficient |
| U | flow velocity (m/s) |
| USi | flow velocity at section i (m/s) |
| α | significance level |
| ΔH | Water drop between upstream and downstream water levels (m) |
| Δx | mesh size in the x-direction (m) |
| Δy | mesh size in the y-direction (m) |
| Δz | mesh size in the z-direction (m) |
| χ2 | chi-square test value |
References
- Wessels, P.; Rooseboom, A. Flow-gauging structures in South African rivers Part 1: An overview. Water SA 2009, 35, 1. [Google Scholar] [CrossRef]
- Bos, M.G. Discharge Measurement Structures, Publication 20; ILRI: Wageningen, The Netherlands, 1989. [Google Scholar]
- WMO. Manual on Stream Gauging; World Meteorological Organization: Geneva, Switzerland, 2010. [Google Scholar]
- Rantz, S.E. Measurement and Computation of Streamflow; EEUU; US Department of the Interior, Geological Survey: Washington, DC, USA, 1982; Volume 2175.
- Servais, S.A. Physical Modelling of Low-Cost Modifications to the Crump Weir in order to Improve Fish Passage: Evelopment of Favourable Swimming Conditions and Investigation of the Hydrometric Effect. Ph.D. Thesis, Cranfield University, Bedford, UK, 2006. [Google Scholar]
- Ferrer Castillo, C. El SAIH y la modernización de la hidrometría. Rev. Obras Públicas 1996, 143, 63–74. [Google Scholar]
- Bleckmann, H. Role of the lateral line in fish behaviour. In The Behaviour ot Teleost Fish; Pitcher, T.J., Ed.; Springer: Boston, MA, USA, 1986; ISBN 978-1-4684-8263-8. [Google Scholar]
- Lucas, M.C.; Frear, P.A. Effects of a flow-gauging weir on the migratory behaviour of adult barbel, a riverine cyprinid. J. Fish Biol. 1997, 50, 382–396. [Google Scholar] [CrossRef]
- Mulligan, K.B.; Haro, A.; Noreika, J. Effect of backwatering a streamgage weir on the passage performance of adult American Shad (Alosa sapidissima). J. Ecohydraulics 2021. [Google Scholar] [CrossRef]
- White, W.R.; Iredale, R.; Armstrong, G. Fishpasses at flow measurement structures. Proc. Inst. Civ. Eng. -Water Manag. 2006, 159, 165–171. [Google Scholar] [CrossRef]
- Sanz-Ronda, F.J.; Bravo-Córdoba, F.J.; Martínez de Azagra-Paredes, A. Estaciones de aforo V-flat y peces migradores de la Península Ibérica: Problemas y soluciones. Ingeniería Civil 2010, 158, 111–119. [Google Scholar]
- Beach, M.H. Fish Pass Design-Criteria for the Design and Approval of Fish Passes and other Structures to Facilitate the Passage of Migratory Fish in Rivers. Fisheries Research Technical Report; No. 78; Ministry of Agriculture, Fisheries and Food; Directorate of Fisheries Research: Lowestoft, UK, 1984. [Google Scholar]
- Goerig, E.; Castro-Santos, T. Is motivation important to brook trout passage through culverts? Can. J. Fish. Aquat. Sci. 2017, 74, 885–893. [Google Scholar] [CrossRef] [Green Version]
- Chow, V.T. Open-Channel Hydraulics; McGraw-Hill: New York, NY, USA, 1959. [Google Scholar]
- Armstrong, G.; Apahamian, M.; Fewings, G.; Gough, P.; Reader, N.; Varallo, P. Environment Agency Fish Pass Manual; Environment Agency: Bristol, UK, 2004.
- Beamish, F.W.H. Swimming capacity. In Fish Physiology, Vol. VII. Locomotion; Hoar, W.H., Randall, D.J., Eds.; Academic Press: New York, NY, USA, 1978; pp. 101–187. [Google Scholar]
- Sánchez-González, J.R.; Morcillo, F.; Ruiz-Legazpi, J.; Sanz-Ronda, F.J. Fish Morphology and passage through velocity barriers. Experience with Northern straight-mouth nase (Pseudochondrostoma Duriense Coelho, 1985) in a open channel flume. Hydrobiologia 2021. [Google Scholar] [CrossRef]
- Reid, A.J.; Carlson, A.K.; Creed, I.F.; Eliason, E.J.; Gell, P.A.; Johnson, P.T.J.; Kidd, K.A.; MacCormack, T.J.; Olden, J.D.; Ormerod, S.J.; et al. Emerging threats and persistent conservation challenges for freshwater biodiversity. Biol. Rev. 2019, 94, 849–873. [Google Scholar] [CrossRef] [PubMed] [Green Version]
- Pringle, C. What is hydrologic connectivity and why is it ecologically important? Hydrol. Process. 2003, 17, 2685–2689. [Google Scholar] [CrossRef]
- Doadrio, I. Atlas y Libro Rojo de los Peces Continentales de España; Ministerio de Medio Ambiente: Madrid, Spain, 2002; ISBN 84-8014-313-4.
- Lucas, M.C.; Baras, E.; Thom, T.J.; Duncan, A.; Slavík, O. Migration of Freshwater Fishes; Wiley Online Library: Oxford, UK, 2001. [Google Scholar]
- García-Vega, A.; Sanz-Ronda, F.J.; Fuentes-Pérez, J.F. Seasonal and daily upstream movements of brown trout Salmo trutta in an Iberian regulated river. Knowl. Manag. Aquat. Ecosyst. 2017, 418, 9. [Google Scholar] [CrossRef] [Green Version]
- García-Vega, A.; Fuentes-Pérez, J.F.; Bravo-Córdoba, F.J.; Ruiz-Legazpi, J.; Valbuena-Castro, J.; Sanz-Ronda, F.J. Pre-reproductive movements of potamodromous cyprinids in the Iberian Peninsula: When environmental variability meets semipermeable barriers. Hydrobiologia 2021. [Google Scholar] [CrossRef]
- Sanz-Ronda, F.J.; Bravo-Córdoba, F.J.; Sánchez-Pérez, A.; García-Vega, A.; Valbuena-Castro, J.; Fernandes-Celestino, L.; Torralva, M.; Oliva-Paterna, F.J. Passage Performance of Technical Pool-Type Fishways for Potamodromous Cyprinids: Novel Experiences in Semiarid Environments. Water 2019, 11, 2362. [Google Scholar] [CrossRef] [Green Version]
- Doadrio, I.; Perea, S.; Garzón-Heydt, P.; González, J.L. Ictiofauna Continental Española: Bases Para su Seguimiento; Ministerio de Medio Ambiente y Medio Rural y Marino, Centro de Publicaciones: Madrid, Spain, 2011.
- Sanz-Ronda, F.J.; Fuentes-Pérez, J.F.; García-Vega, A.; Bravo-Córdoba, F.J. Fishways as Downstream Routes in Small Hydropower Plants: Experiences with a Potamodromous Cyprinid. Water 2021, 13, 1041. [Google Scholar] [CrossRef]
- Collares-Pereira, M.J.; Martins, M.J.; Pires, A.M.; Geraldes, A.M.; Coelho, M.M. Feeding behaviour of Barbus bocagei assessed under a spatio-temporal approach. Folia Zool. 1996, 45, 65–76. [Google Scholar]
- Kottelat, M.; Freyhof, J. Handbook of European Freshwater Fishes; Publications Kottelat: Cornol, Switzerland, 2007; Volume 2008, ISBN 978-2-8399-0298-4. [Google Scholar]
- Gasith, A.; Resh, V.H. Streams in Mediterranean climate regions: Abiotic influences and biotic responses to predictable seasonal events. Annu. Rev. Ecol. Syst. 1999, 30, 51–81. [Google Scholar] [CrossRef] [Green Version]
- Illies, J.; Botoseanu, L. Problèmes et méthodes de la classification et de la-zonation écologique des eaux courantes, considérées surtout-du point de vue faunistique. SIL Commun. 1963, 12, 1–57. [Google Scholar] [CrossRef]
- Rosgen, D.L.; Silvey, H.L. Applied River Morphology; Wildland Hydrology: Pagosa Springs, CO, USA, 1996; Volume 1481. [Google Scholar]
- Almaça, C. Freshwater fish and their conservation in Portugal. Biol. Conserv. 1995, 72, 125–127. [Google Scholar] [CrossRef]
- Ubbink, O. Numerical Prediction of Two Fluid Systems with Sharp Interfaces. Ph.D. Thesis, University of London, London, UK, 1997. [Google Scholar]
- Hirt, C.W.; Nichols, B.D. Volume of fluid (VOF) method for the dynamics of free boundaries. J. Comput. Phys. 1981, 39, 201–225. [Google Scholar] [CrossRef]
- Fuentes-Pérez, J.F.; Silva, A.T.; Tuhtan, J.A.; García-Vega, A.; Carbonell-Baeza, R.; Musall, M.; Kruusmaa, M. 3D modelling of non-uniform and turbulent flow in vertical slot fishways. Environ. Model. Softw. 2018, 99, 156–169. [Google Scholar] [CrossRef]
- Greenshields, C.J. The Open Source CFD Toolbox User Guide; OpenFOAM Foundation Ltd.: London, UK, 2015. [Google Scholar]
- Sanz-Ronda, F.J.; Ruiz-Legazpi, J.; Bravo-Córdoba, F.J.; Makrakis, S.; Castro-Santos, T. Sprinting performance of two Iberian fish: Luciobarbus bocagei and Pseudochondrostoma duriense in an open channel flume. Ecol. Eng. 2015, 83, 61–70. [Google Scholar] [CrossRef]
- Brown, R.S.; Cooke, S.J.; Anderson, W.G.; McKinley, R.S. Evidence to Challenge the “2% Rule” for Biotelemetry. N. Am. J. Fish. Manag. 1999, 19, 867–871. [Google Scholar] [CrossRef]
- Ostrand, K.G.; Zydlewski, G.B.; Gale, W.L.; Zydlewski, J.D. Long term retention, survival, growth, and physiological indicators of salmonids marked with passive integrated transponder tags. Am. Fish. Soc. Symp. 2011, 76, 1–11. [Google Scholar]
- Castro-Santos, T.; Vono, V. Posthandling Survival and PIT Tag Retention by Alewives—A Comparison of Gastric and Surgical Implants. N. Am. J. Fish. Manag. 2013, 33, 790–794. [Google Scholar] [CrossRef]
- Fujita, I.; Muste, M.; Kruger, A. Large-scale particle image velocimetry for flow analysis in hydraulic engineering applications. J. Hydraul. Res. 1998, 36, 397–414. [Google Scholar] [CrossRef]
- Fuentes-Pérez, J.F.; Quaresma, A.L.; Pinheiro, A.; Sanz-Ronda, F.J. OpenFOAM vs FLOW-3D: A comparative study of vertical slot fishway modelling. Ecol. Eng. 2022, 174, 106446. [Google Scholar] [CrossRef]
- Fuentes-Pérez, J.F.; García-Vega, A.; Bravo-Córdoba, F.J.; Sanz-Ronda, F.J. A step to Smart Fishways: An autonomous obstruction detection system using hydraulic modelling and sensor networks. Sensors 2021, 21, 6909. [Google Scholar] [CrossRef] [PubMed]
- Montali-Ashworth, D.; Vowles, A.S.; De Almeida, G.; Kemp, P.S. Use of Cylindrical Bristle Clusters as a novel multispecies fish pass to facilitate upstream movement at gauging weirs. Ecol. Eng. 2020, 143, 105634. [Google Scholar] [CrossRef]
- FAO/DVWK. Fish Passes: Design, Dimensions, and Monitoring; FAO: Rome, Italy, 2002; ISBN 9251048940. [Google Scholar]
- Amaral, S.D.; Quaresma, A.L.; Branco, P.; Romão, F.; Katopodis, C.; Ferreira, M.T.; Pinheiro, A.N.; Santos, J.M. Assessment of retrofitted ramped weirs to improve passage of potamodromous fish. Water 2019, 11, 2441. [Google Scholar] [CrossRef] [Green Version]
- Duguay, J.M.; Lacey, R.W.J.; Castro-Santos, T. Influence of baffles on upstream passage of brook trout and brown trout in an experimental box culvert. Can. J. Fish. Aquat. Sci. 2019, 76, 28–41. [Google Scholar] [CrossRef]
- Ruiz-Legazpi, J.; Sanz-Ronda, F.J.; Bravo-córdoba, F.J.; Fuentes-Pérez, J.F.; Castro-Santos, T. Influence of environmental and biometric factors on the swimming capacity of the Iberian barbel (Luciobarbus bocagei Steindachner, 1864), an endemic potamodromous cyprinid of the Iberian Peninsula. Limnetica 2018, 37, 251–265. [Google Scholar]
- Harbicht, A.B.; Castro-Santos, T.; Ardren, W.R.; Gorsky, D.; Fraser, D.J. Novel, continuous monitoring of fine-scale movement using fixed-position radiotelemetry arrays and random forest location fingerprinting. Methods Ecol. Evol. 2017, 8, 850–859. [Google Scholar] [CrossRef] [Green Version]
- Alexandre, C.M.; Almeida, P.R.; Neves, T.; Mateus, C.S.; Costa, J.L.; Quintella, B.R. Effects of flow regulation on the movement patterns and habitat use of a potamodromous cyprinid species. Ecohydrology 2016, 9, 326–340. [Google Scholar] [CrossRef]
- Prchalová, M.; Slavík, O.; Bartoš, L. Patterns of cyprinid migration through a fishway in relation to light, water temperature and fish circling behaviour. Int. J. River Basin Manag. 2006, 4, 213–218. [Google Scholar] [CrossRef]
- Alexandre, C.M.; Quintella, B.R.; Ferreira, A.F.; Romão, F.A.; Almeida, P.R. Swimming performance and ecomorphology of the Iberian barbel Luciobarbus bocagei (Steindachner, 1864) on permanent and temporary rivers. Ecol. Freshw. Fish 2014, 23, 244–258. [Google Scholar] [CrossRef]
- García-Vega, A.; Sanz-Ronda, F.J.; Celestino, L.F.; Makrakis, S.; Leunda, P.M. Potamodromous brown trout movements in the North of the Iberian Peninsula: Modelling past, present and future based on continuous fishway monitoring. Sci. Total Environ. 2018, 640, 1521–1536. [Google Scholar] [CrossRef]


| Swimming Velocity (m/s) | Median | IQR | Min–Max | |
|---|---|---|---|---|
| Size | Small (n = 21) | 5.03 | 4.53–5.31 | 3.97–6.50 |
| Large (n = 15) | 4.95 | 4.51–5.90 | 4.13–7.31 | |
| Discharge | Low (n = 22) | 4.86 | 4.53–5.65 | 3.97–6.02 |
| Medium (n = 14) | 5.04 | 4.51–5.61 | 4.13–7.31 | |
Publisher’s Note: MDPI stays neutral with regard to jurisdictional claims in published maps and institutional affiliations. |
© 2021 by the authors. Licensee MDPI, Basel, Switzerland. This article is an open access article distributed under the terms and conditions of the Creative Commons Attribution (CC BY) license (https://creativecommons.org/licenses/by/4.0/).
Share and Cite
Sanz-Ronda, F.J.; Bravo-Córdoba, F.J.; García-Vega, A.; Valbuena-Castro, J.; Martínez-de-Azagra, A.; Fuentes-Pérez, J.F. Fish Upstream Passage through Gauging Stations: Experiences with Iberian Barbel in Flat-V Weirs. Fishes 2021, 6, 81. https://doi.org/10.3390/fishes6040081
Sanz-Ronda FJ, Bravo-Córdoba FJ, García-Vega A, Valbuena-Castro J, Martínez-de-Azagra A, Fuentes-Pérez JF. Fish Upstream Passage through Gauging Stations: Experiences with Iberian Barbel in Flat-V Weirs. Fishes. 2021; 6(4):81. https://doi.org/10.3390/fishes6040081
Chicago/Turabian StyleSanz-Ronda, Francisco Javier, Francisco Javier Bravo-Córdoba, Ana García-Vega, Jorge Valbuena-Castro, Andrés Martínez-de-Azagra, and Juan Francisco Fuentes-Pérez. 2021. "Fish Upstream Passage through Gauging Stations: Experiences with Iberian Barbel in Flat-V Weirs" Fishes 6, no. 4: 81. https://doi.org/10.3390/fishes6040081