
Identification of Keystone Species in Ecological Communities in the East China Sea


Abstract
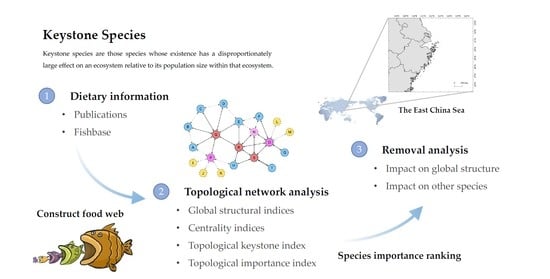
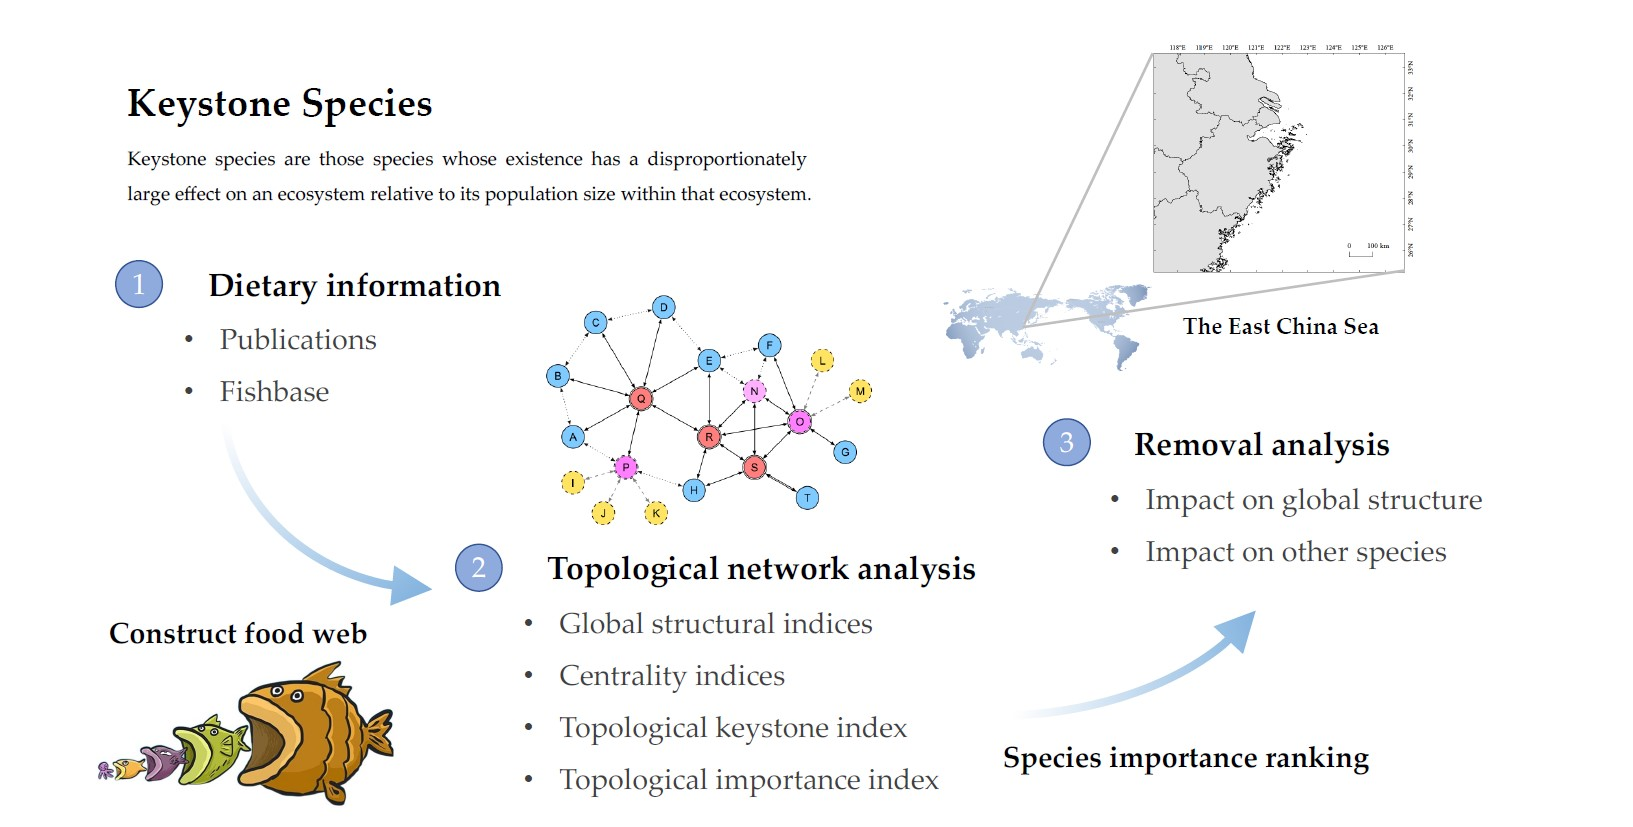
1. Introduction
2. Materials and Methods
2.1. Data
2.2. Topological Analysis
2.2.1. Global Structural Indices
2.2.2. Centrality Indices
2.2.3. Topological Keystone Index
2.2.4. Topological Importance Index
2.2.5. Removal Analysis
3. Results
3.1. Topological Analysis
3.2. Principal Component Analysis
3.3. Removal Analysis
4. Discussion
4.1. Complexity of Food Web

| FOOD WEB | LD | C | APL | CC |
|---|---|---|---|---|
| East China Sea | 9.6 | 0.13 | 1.13 | 0.174 |
| Yellow Sea [45] | 4.4 | 0.04 | NA | 0.138 |
| Laizhou Bay [17] | 3.0 | 0.18 | NA | 0.325 |
| Haizhou Bay [46] | 11.0 | 0.12 | 2.11 | 0.230 |
| the sea adjacent to Miaodao Archipelago [47] | 6.0 | 0.16 | 2.10 | 0.301 |
| Arctic [48] | 8.6 | 0.05 | 2.28 | 0.250 |
| Antarctic [49] | 6.8 | 0.01 | 3.00 | 0.140 |
| Potter Cove [29] | 3.4 | 0.04 | 1.80 | 0.080 |
| Caribbean coral reefs [50] | 11.1 | 0.22 | 1.60 | 0.360 |
| Golfo de Tortugas [1] | 2.5 | 0.01 | 1.65 | 0.022 |
4.2. Keystone Species
4.3. Removal Analysis
5. Conclusions
Supplementary Materials
Author Contributions
Funding
Institutional Review Board Statement
Data Availability Statement
Acknowledgments
Conflicts of Interest
References
- Navia, A.F.; Cruz-Escalona, V.H.; Giraldo, A.; Barausse, A. The structure of a marine tropical food web, and its implications for ecosystem-based fisheries management. Ecol. Model. 2016, 328, 23–33. [Google Scholar] [CrossRef]
- Paine, R.T. A note on trophic complexity and community stability. Am. Nat. 1969, 103, 91–93. [Google Scholar] [CrossRef]
- Estes, J.A.; Palmisano, J.F. Sea otters: Their role in structuring nearshore communities. Science 1974, 185, 1058–1060. [Google Scholar] [CrossRef]
- Hay, M.E. Patterns of fish and urchin grazing on Caribbean coral reefs: Are previous results typical? Ecology 1984, 65, 446–454. [Google Scholar] [CrossRef]
- Paine, R.T. A conversation on refining the concept of keystone species. Conserv. Biol. 1995, 9, 962–964. [Google Scholar] [CrossRef]
- Power, M.E.; Tilman, D.; Estes, J.A.; Menge, B.A.; Bond, W.J.; Mills, L.S.; Daily, G.; Castilla, J.C.; Lubchenco, J.; Paine, R.T. Challenges in the quest for keystones. Bioscience 1996, 46, 609–620. [Google Scholar] [CrossRef]
- Dunne, J.A.; Williams, R.J.; Martinez, N.D. Food-web structure and network theory: The role of connectance and size. Proc. Natl. Acad. Sci. USA 2002, 99, 12917–12922. [Google Scholar] [CrossRef]
- Eklof, A.; Ebenman, B. Species loss and secondary extinctions in simple and complex model communities. J. Anim. Ecol. 2006, 75, 239–246. [Google Scholar] [CrossRef]
- Petchey, O.L.; Eklof, A.; Borrvall, C.; Ebenman, B. Trophically unique species are vulnerable to cascading extinction. Am. Nat. 2008, 171, 568–579. [Google Scholar] [CrossRef]
- Sun, G.; Sheng, L.X. Developments of the studies on the theory of keystone species in ecosystems. Chin. J. Zool. 2000, 35, 53–57. (In Chinese) [Google Scholar]
- Hooper, D.U.; Adair, E.C.; Cardinale, B.J.; Byrnes, J.E.K.; Hungate, B.A.; Matulich, K.L.; Gonzalez, A.; Duffy, J.E.; Gamfeldt, L.; O’Connor, M.I. A global synthesis reveals biodiversity loss as a major driver of ecosystem change. Nature 2012, 486, 105–108. [Google Scholar] [CrossRef] [PubMed]
- Cardinale, B.J.; Matulich, K.L.; Hooper, D.U.; Byrnes, J.E.; Duffy, E.; Gamfeldt, L.; Balvanera, P.; O’Connor, M.I.; Gonzalez, A. The functional role of producer diversity in ecosystems. Am. J. Bot. 2011, 98, 572–592. [Google Scholar] [CrossRef] [PubMed]
- Urban, M.C. Accelerating extinction risk from climate change. Science 2015, 348, 571–573. [Google Scholar] [CrossRef] [PubMed]
- Mills, L.S.; Soulé, M.E.; Doak, D.F. The keystone-species concept in ecology and conservation. BioScience 1993, 43, 219–224. [Google Scholar] [CrossRef]
- Valls, A.; Coll, M.; Christensen, V. Keystone species: Toward an operational concept for marine biodiversity conservation. Ecol. Monogr. 2015, 85, 29–47. [Google Scholar] [CrossRef]
- Tang, Q.S. Strategies of research on marine food web and trophodynamics between high trophic levels. Prog. Fish. Sci. 1999, 20, 1–6. (In Chinese) [Google Scholar]
- Yang, T.; Shan, X.J.; Jin, X.S.; Chen, Y.L.; Teng, G.L.; Wei, X.J. Long-term changes in keystone species in fish community in spring in Laizhou Bay. Mar. Fish. Res. 2018, 39, 1–11. (In Chinese) [Google Scholar]
- Libralato, S.; Christensen, V.; Pauly, D. A method for identifying keystone species in food web models. Ecol. Model. 2006, 195, 153–171. [Google Scholar] [CrossRef]
- Jordan, F.; Liu, W.C.; Davis, A.J. Topological keystone species: Measures of positional importance in food webs. Oikos 2006, 112, 535–546. [Google Scholar] [CrossRef]
- Torres, M.A.; Casini, M.; Huss, M.; Otto, S.A.; Kadin, M.; Gårdmark, A. Food-web indicators accounting for species interactions respond to multiple pressures. Ecol. Indic. 2017, 77, 67–79. [Google Scholar] [CrossRef]
- Begon, M.; Townsend, C.R. Ecology: From individuals to ecosystems. Freshw. Biol. 2006, 51, 1786–1788. [Google Scholar]
- Montoya, J.M.; Pimm, S.L.; Sole, R.V. Ecological networks and their fragility. Nature 2006, 442, 259–264. [Google Scholar] [CrossRef] [PubMed]
- Jordán, F.; Liu, W.-c.; Mike, Á. Trophic field overlap: A new approach to quantify keystone species. Ecol. Model. 2009, 220, 2899–2907. [Google Scholar] [CrossRef]
- Zhu, J.F.; Dai, X.J.; Wang, X.F.; Chen, Y. A review of methodology in marine food-web topology. Prog. Fish. Sci. 2016, 37, 153–159. (In Chinese) [Google Scholar]
- Tan, S.J.; Gong, X.Z.; Sun, J.; Ni, X.B.; Song, S.Q.; He, Q. The phytoplankton community in spawning ground of the East China Sea and its adjacent waters in spring. Mar. Sci. 2009, 33, 5–10. (In Chinese) [Google Scholar]
- Wang, S.C.; Yang, R.; Gao, C.X.; Han, D.Y.; Ye, S. Keystone species of fish community in the offshore waters of southern Zhejiang: Insight from ecological network. J. Fish. Sci. China 2022, 29, 118–129. (In Chinese) [Google Scholar]
- Wang, Y.; Zhao, J.; Gao, C.X.; Wang, S.C.; Ye, S. Structure and interannual variation of fish communitys in the offshore waters of southern Zhejiang province in spring. Oceanol. Limnol. Sin. 2022, 53, 1455–1466. (In Chinese) [Google Scholar]
- Jin, Y.; Liu, Y.; Yuan, X.W.; Ling, J.Z.; Cheng, J.H. Review: Applications of complex network to food. Mar. Fish. 2018, 40, 249–256. (In Chinese) [Google Scholar]
- Marina, T.I.; Salinas, V.; Cordone, G.; Campana, G.; Moreira, E.; Deregibus, D.; Torre, L.; Sahade, R.; Tatián, M.; Barrera Oro, E.; et al. The Food Web of Potter Cove (Antarctica): Complexity, structure and function. Estuar. Coast. Shelf Sci. 2018, 200, 141–151. [Google Scholar] [CrossRef]
- Freeman, L.C. Centrality in social networks conceptual clarification. Soc. Netw. 1978, 1, 215–239. [Google Scholar] [CrossRef]
- Okamoto, K.; Chen, W.; Li, X.Y. Ranking of closeness centrality for large-scale social networks. In Proceedings of the 2nd International Workshop on Frontiers in Algorithmics, Changsha, China, 19–21 June 2008. [Google Scholar]
- Jordán, F.; Takács-Sánta, A.; Molnár, I. A reliability theoretical quest for keystones. Oikos 1999, 86, 453–462. [Google Scholar] [CrossRef]
- Berlow, E.L.; Dunne, J.A.; Martinez, N.D.; Stark, P.B.; Williams, R.J.; Brose, U. Simple prediction of interaction strengths in complex food webs. Proc. Natl. Acad. Sci. USA 2009, 106, 187–191. [Google Scholar] [CrossRef] [PubMed]
- Rummel, R.J. Applied Factor Analysis; Northwestern University Press: Evanston, IL, USA, 1970; pp. 112–113. [Google Scholar]
- Estrada, E. Characterization of topological keystone species local, global and “meso-scale” centralities in food webs. Ecol. Complex. 2007, 4, 48–57. [Google Scholar] [CrossRef]
- Dunne, J.A.; Williams, R.J.; Martinez, N.D. Network structure and biodiversity loss in food webs: Robustness increases with connectance. Ecol. Lett. 2002, 5, 558–567. [Google Scholar] [CrossRef]
- Montoya, J.M.; Sole, R.V. Topological properties of food webs: From real data to community assembly models. Oikos 2003, 102, 614–622. [Google Scholar] [CrossRef]
- MacArthur, R. Fluctuations of animal populations and a measure of community stability. Ecology 1955, 36, 533–536. [Google Scholar] [CrossRef]
- Dobrzycka-Krahel, A.; Skóra, M.E.; Raczyński, M.; Szaniawska, A. The signal crayfish Pacifastacus leniusculus—Distribution and invasion in the southern Baltic coastal river. Pol. J. Ecol. 2017, 65, 445–452. [Google Scholar]
- Baiser, B.; Russell, G.J.; Lockwood, J.L. Connectance determines invasion success via trophic interactions in model food webs. Oikos 2010, 119, 1970–1976. [Google Scholar] [CrossRef]
- Lurgi, M.; Galiana, N.; López, B.C.; Joppa, L.N.; Montoya, J.M. Network complexity and species traits mediate the effects of biological invasions on dynamic food webs. Front. Ecol. Evol. 2014, 2, 36. [Google Scholar] [CrossRef]
- Romanuk, T.N.; Zhou, Y.; Brose, U.; Berlow, E.L.; Williams, R.J.; Martinez, N.D. Predicting invasion success in complex ecological networks. Philos. Trans. R. Soc. B 2009, 364, 1743–1754. [Google Scholar] [CrossRef]
- Smith-Ramesh, L.M.; Moore, A.C.; Schmitz, O.J. Global synthesis suggests that food web connectance correlates to invasion resistance. Glob. Chang. Biol. 2017, 23, 465–473. [Google Scholar] [CrossRef]
- Lodge, D.M. Biological invasions: Lessons for ecology. Trends Ecol. Evol. 1993, 8, 133–137. [Google Scholar] [CrossRef]
- Su, C.C.; Shan, X.J.; Yang, T.; Han, Q.P. Interdecadal changes in keystone species of fish community during autumn in the Yellow Sea. Prog. Fish. Sci. 2021, 42, 1–14. (In Chinese) [Google Scholar]
- Xu, C.J.; Liu, Y.; Cheng, Y.; Xu, B.D.; Zhang, C.L.; Ren, Y.P.; Xue, Y. Structure and complexity of Haizhou Bay food web based on topological network analysis. Acta Oceanol. Sin. 2020, 42, 47–54. (In Chinese) [Google Scholar]
- Zhao, Y.S. Structural Characteristics of Benthic Food Web in the Sea Adjacent to Miaodao Archipelago. Ph.D. Thesis, Shanghai Ocean University, Shanghai, China, 2022. (In Chinese). [Google Scholar]
- Kortsch, S.; Primicerio, R.; Fossheim, M.; Dolgov, A.V.; Aschan, M. Climate change alters the structure of arctic marine food webs due to poleward shifts of boreal generalists. Proc. R. Soc. B-Biol. Sci. 2015, 282, 20151546. [Google Scholar] [CrossRef] [PubMed]
- De Santana, C.N.; Rozenfeld, A.F.; Marquet, P.A.; Duarte, C.M. Topological properties of polar food webs. Mar. Ecol. Prog. Ser. 2013, 474, 15–26. [Google Scholar] [CrossRef]
- Opitz, S. Trophic Interactions in Caribbean Coral Reefs; The International Center for Living Aquatic Resources Management: Makati City, Philippines, 1996; p. 341. [Google Scholar]
- Bellingeri, M.; Bodini, A. Food web’s backbones and energy delivery in ecosystems. Oikos 2016, 125, 586–594. [Google Scholar] [CrossRef]
- Hodgson, J.Y. A trophic cascade synthesis: Review of top-down mechanisms regulating lake ecosystems. Bioscience 2005, 76, 137–144. [Google Scholar] [CrossRef]
- Barnum, T.R.; Drake, J.M.; Colón-Gaud, C.; Rugenski, A.T.; Frauendorf, T.C.; Connelly, S.; Kilham, S.S.; Whiles, M.R.; Lips, K.R.; Pringle, C.M. Evidence for the persistence of food web structure after amphibian extirpation in a Neotropical stream. Ecology 2015, 96, 2106–2116. [Google Scholar] [CrossRef]
- Gaichas, S.K.; Francis, R.C. Network models for ecosystem-based fishery analysis: A review of concepts and application to the Gulf of Alaska marine food web. Can. J. Fish. Aquat. Sci. 2008, 65, 1965–1982. [Google Scholar] [CrossRef]
- Chen, Y.Q.; Zhu, Q.Q. A study on the feeding habit of hairtail fish and the relationship between its food basis and fishing grounds in the dong hai (East China Sea). J. Fish. China 1984, 8, 135–145. (In Chinese) [Google Scholar]
- Wang, S.C. Analysis of Fish Community Structure and Keystone Species in the Offshore Waters of Southern Zhejiang. Master’s Thesis, Shanghai Ocean University, Shanghai, China, 2022. (In Chinese). [Google Scholar]
- Michalski, J.; Arditi, R. The complexity-stability problem in food web theory. What can we learn from exploratory models. In Advances in Environmental and Ecological Modelling; Elsevier: Paris, France, 1999; pp. 91–119. [Google Scholar]
- Fagan, W.F. Omnivory as a stabilizing feature of natural communities. Am. Nat. 1997, 150, 554–567. [Google Scholar] [CrossRef] [PubMed]
- Barrera-Oro, E.; Casaux, R. General ecology of coastal fish from the South Shetland Island and west Antarctic Peninsula areas. Antarct. Sci. 2008, 571, 95–110. [Google Scholar]
- Wang, J.; Qiu, S.Y.; He, Y.L.; Yang, S.Y.; Liu, X.C.; Chen, M.R. Feeding habits of spadenose shark, Scoliodon laticaudus from southern coast of Fujian. J. Appl. Oceanogr. 1996, 15, 400–406. (In Chinese) [Google Scholar]
- Zhu, J.F.; Dai, X.J.; Li, Y. Preliminary study on biological characteristics of spadenose shark, Scoliodon laticaudus, caught from coastal waters of Zhejiang province. J. Shanghai Ocean Univ. 2008, 17, 17–21. (In Chinese) [Google Scholar]
- Tang, Y.M.; Wu, C.W. Feeding habit of conger pike Muraenesox cinereus in Zhejiang coastal waters. J. Zhejiang Ocean Univ. (Nat. Sci.) 1992, 11, 98–101. (In Chinese) [Google Scholar]
- Xiao, Y. Study on Feeding Ecology of Three Migratory Fishes Species in Zhejiang Coastal Waters. Master’s Thesis, Zhejiang Ocean University, Zhoushan, China, 2022. (In Chinese). [Google Scholar]
- Jiang, R.J.; Xue, L.J.; Zhang, H.L.; Zhu, Z.J. Feeding habits of Ilisha elongata in the East China Sea. Mar. Fish. 2013, 35, 168–175. (In Chinese) [Google Scholar]
- He, Z.T.; Zhang, Y.Z.; Xu, K.D.; Jin, H.W. Feeding habits and ontogenetic variation of Lophius litulon in East China Sea and Yellow Sea. Prog. Fish. Sci. 2012, 33, 9–18. (In Chinese) [Google Scholar]
- Li, Z.H.; Jiang, R.J.; Xu, K.D.; Pan, G.L. Food habits of Chelidonichthys spinosus in the sea area of middle-northern East China Sea. J. Fish. Res. 2010, 2, 33–37. (In Chinese) [Google Scholar]
- Li, Z.H.; Xu, K.D.; Jiang, R.J.; Zhou, Y.D.; Pan, G.L. Diet composition and feeding habits variation with body length of Chelidonichthys spinosus in central and northern East China Sea. J. Fish. Sci. China 2011, 18, 185–193. (In Chinese) [Google Scholar] [CrossRef]
- Jiang, R.J.; Jin, H.W.; Zhou, Y.D.; Xue, L.J.; Guo, A. Feeding habits of Trachurus japonicus in the East China Sea. Chin. J. Appl. Ecol. 2013, 24, 2015–2024. (In Chinese) [Google Scholar]
- Liu, Z.H.; Han, D.Y.; Gao, C.X.; Ye, S. Feeding habits of Bombay ducks (Harpadon nehereus) in the offshore waters of southern Zhejiang, based on predator CPUE weighting. J. Fish. Sci. China 2021, 28, 482–492. (In Chinese) [Google Scholar]
- Deng, Y.J. Reproductive Biology and Feeding Ecology of Saurida tumbil in the Beibu Gulf. Master’s Thesis, Guangdong Ocean University, Zhanjiang, China, 2021. (In Chinese). [Google Scholar]
- Zhang, Y.M.; Dai, C.T.; Yan, Y.R.; Yang, Y.L.; Lu, H.S. Feeding habits and trophic level of crimson sea bream, (Parargyrops edita Tanaka) in the Beibu Gulf. J.Fish. China 2014, 38, 265–273. (In Chinese) [Google Scholar]
- Lin, L.S.; Yan, L.P.; Ling, J.Z.; Liu, Y.; Zhou, R.K. Food habits of hairtail in the East China Sea region. Mar. Fish. 2005, 27, 187–192. (In Chinese) [Google Scholar]
- Zhang, B. Preliminary Studies on Marine Food Web and Trophodynamics in China Coastal Seas. Ph.D. Thesis, Ocean University of China, Qingdao, China, 2005. (In Chinese). [Google Scholar]
- Lu, Z.H.; Zhu, Z.J.; Lin, X.P. Food habits of Priacanthus macracanthus in East China Sea region. Mar. Fish. 2010, 322, 199–203. (In Chinese) [Google Scholar]
- Wang, C.Q.; Tang, J.H.; Xiong, Y. Feeding habits of Miichthys Miiuy in Jiangsu costal waters. J. Zhejiang Ocean Univ. (Nat. Sci.) 2020, 39, 372–378. (In Chinese) [Google Scholar]
- Wang, K.; Li, C.W.; Wang, Z.H.; Zhao, J.; Zhang, S.Y. Feeding habits of the marbled rockfish Sebastiscus marmoratus in the marine ranching off Ma’an Archipelago, China. Chin. J. Appl. Ecol. 2017, 28, 2321–2326. (In Chinese) [Google Scholar]
- Zhang, Y.Z.; Li, F.z.; Guo, C.C. Study on feeding habits of Sebastiscus marmoratus in Dongshan Bay. J. Oceanogr. Taiwan Strait 1993, 12, 233–241. (In Chinese) [Google Scholar]
- Zhang, B.; Tang, Q.S. Feeding habits of six species of eels in East China Sea and Yellow Sea. J. Fish. China 2003, 27, 307–314. (In Chinese) [Google Scholar]
- Xu, J.Y.; Chen, J.J.; Tian, F.G.; Xu, Z.l. Summer diet composition and feeding ecology of large yellow croaker (Larimichthys crocea) in Guanjing Yang. J. Fish. Sci. China 2012, 19, 94–104. (In Chinese) [Google Scholar] [CrossRef]
- Jiang, R.J.; Xu, H.X.; Jin, H.W.; Zhou, Y.D.; He, Z.T. Feeding habits of blue mackerel scad Decapterus maruadsi Temminck et Schlegel in the East China Sea. J. Fish. China 2012, 36, 216–227. (In Chinese) [Google Scholar]
- Xu, W.; Yang, R.; Chen, G.; Gao, C.X.; Ye, S. Feeding ecology of Decapterus maruadsi in the southern coastal area of Zhejiang based on stomach contents and stable isotope analysis. Chin. J. Appl. Ecol. 2022, 33, 3097–3104. (In Chinese) [Google Scholar]
- Song, Y.H.; Xue, Y.; Xu, B.D.; Zhang, C.L.; Ren, Y.P. Composition of food and niche overlap of three Sciaenidae species in Haizhou Bay. J. Fish. China 2020, 44, 2017–2027. (In Chinese) [Google Scholar]
- Chen, G.; Xu, W.; Gao, C.X.; Ye, S.; Han, D.Y. Feeding habits and diet overlap of two Sciaenidae species in the southern coastal waters of Zhejiang. J. Fish. Sci. China 2022, 29, 1337–1348. (In Chinese) [Google Scholar]
- Zhang, B.; Jin, X.S.; Dai, F.Q. Feeding habits of the two sciaenid fishes near the Changjiang estuary. Acta Zool. Sin. 2008, 54, 209–217. (In Chinese) [Google Scholar]
- Jin, H.W.; Xue, L.J.; Zhu, Z.J.; Pan, G.L. On the feeding habits of Acropoma japonicum in the East China Sea and southern Yellow Sea. Mar. Fish. 2013, 35, 405–414. (In Chinese) [Google Scholar]
- Jin, H.W.; Xue, L.J.; Zhu, Z.J.; Pan, G.L. Feeding habits of Apogon lineatusin the East China Sea and southern Yellow Sea. Mar. Fish. 2012, 34, 361–370. (In Chinese) [Google Scholar]
- Xu, K.D.; Jin, H.W.; Lu, Z.H.; Pan, G.L.; Zhu, Z.J. Preliminary study on feeding ecology of Champsodon snyderi in East China Sea region. Mar. Sci. 2012, 36, 79–88. (In Chinese) [Google Scholar]
- Wang, K.; Zhang, S.Y.; Wang, Z.H.; Zhao, J.; Xu, M. A preliminary study on fishery biology of Johnius belangerii off Ma’an Archipelago. J. Fish. China 2012, 36, 228–237. (In Chinese) [Google Scholar] [CrossRef]
- Jin, H.W.; Xue, L.J.; Pan, G.L.; Zhu, Z.J. Feeding habits of Benthosema pterotumin the East China Sea and southern part of Yellow Sea. Mar. Fish. 2011, 33, 368–377. (In Chinese) [Google Scholar]
- Han, D.Y.; Xue, Y.; Ji, Y.P.; Xu, B.D.; Liu, H.; Ma, Q.Y. Trophic and spatial niche of five gobiid fishes in Jiaozhou Bay. J. Fish. Sci. China 2013, 20, 148–156. (In Chinese) [Google Scholar] [CrossRef]
- Han, D.Y. Study on feeding ecology of dominate gobiid fishes in Jiaozhou Bay. Master’s Thesis, Ocean University of China, Qingdao, China, 2013. (In Chinese). [Google Scholar]
- Yang, J.M. A study on food and trophic levels of Baohai Sea fish. Fish. Inf. Strateg. 2001, 16, 10–19. (In Chinese) [Google Scholar]
- Guo, A.; Zhou, Y.D.; Jin, H.W.; Xue, L.J.; Xu, H.X. Seasonal changes on food composition and feeding habitat of Colilia mystus (Linnaeus) in the East China Sea. Fish. Inf. Strateg. 2010, 25, 10–13. (In Chinese) [Google Scholar]
- Wang, J.; Jiang, R.J.; Hu, C.L.; Li, Z.; Xiao, Y.; Xu, Y.J.; He, Z.T.; Xu, H.X. Feeding ecology of Engraulis japonicus based on stomach contents and stable isotope. Chin. J. Appl. Ecol. 2021, 32, 2035–2044. (In Chinese) [Google Scholar]
- Li, N.; Fang, Z.; Chen, X.J. Fishery of swordtip squid Uroteuthis edulis:a review. J. Dalian Ocean Univ. 2020, 35, 637–644. (In Chinese) [Google Scholar]
- Yang, J.M.; Tan, X.J. Food analysis of three cepalopod species in the Bohai Sea. Mar. Sci. 2000, 24, 53–55. (In Chinese) [Google Scholar]
- Liu, M.N.; Xu, L.; Wang, X.H.; Liu, Y.; Wang, M.D.; Qiu, Y.S.; Zhu, J.F.; He, Y.L.; Bei, W.L.; Du, F.Y. Study on food contents of Uroteuthis chinensis and Sthenoteuthis oualaniensis based on COI sequence. J. Trop. Oceanogr. 2020, 39, 61–69. (In Chinese) [Google Scholar]
- Yang, J.M. A Study on Food and Trophic Levels of Bohai Sea Invertebrates. Fish. Inf. Strateg. 2001, 16, 8–16. (In Chinese) [Google Scholar]
- China Agricultural Encyclopedia Editorial Department. Agricultural Encyclopedia of China: Aquaculture.; China Agriculture Press: Beijing, China, 1994. (In Chinese) [Google Scholar]
- Cheng, J.S.; Zhu, J.S. A study on feeding habits and trophic levels of main economic invertebrates Yellow Sea. Acta Oceanol. Sin. 1997, 19, 102–108. (In Chinese) [Google Scholar]
- Li, H.Y.; Jin, Y.; Li, S.F. Feeding habits of Solenocera melantho in the northern East China Sea. Chin. J. Appl. Ecol. 2016, 27, 937–945. (In Chinese) [Google Scholar]
- Huang, M.Z. Study on feeding habits and nutrient level of shrimp species from Taiwan Strait and its adjacent sea areas. J. Oceanogr. Taiwan Strait. 2004, 23, 481–488. (In Chinese) [Google Scholar]
- Huang, M.Z. Study on feeding habit and nutrient level of Portunus argentatus, P.sanguinolentus and Charybdis feriatu in Fujian sea area. J. Oceanogr. Taiwan Strait. 2004, 23, 159–166. (In Chinese) [Google Scholar]
- Zhao, W. Hydrobiology; China Agriculture Press: Beijing, China, 2005. (In Chinese) [Google Scholar]
- Yang, D.J.; Sun, S.C. Marine Invertebrate Zoology; China Ocean University Press: Qingdao, China, 1999. (In Chinese) [Google Scholar]


| Indices | S | L | LD | C | APL | CC |
|---|---|---|---|---|---|---|
| Value | 76 | 730 | 9.605 | 0.126 | 1.128 | 0.174 |
| D | Din | Dout | CL | BC | K | Kb | Kt | TI1 | TI19 | PC | |||||||||||
|---|---|---|---|---|---|---|---|---|---|---|---|---|---|---|---|---|---|---|---|---|---|
| a10 | 39 | a02 | 35 | c17 | 31 | a10 | 67.568 | a02 | 4.937 | a01 | 26.23 | c17 | 4.29 | a01 | 26.23 | c17 | 2.62 | c17 | 0.23 | a02 | 4.544 |
| a02 | 36 | a10 | 32 | c06 | 21 | a02 | 65.789 | a10 | 3.594 | a02 | 17.17 | c06 | 2.13 | a02 | 17.11 | c06 | 1.54 | c06 | 0.11 | c17 | 4.16 |
| c17 | 33 | a06 | 24 | a22 | 15 | c17 | 64.103 | c17 | 2.569 | a04 | 13.59 | c05 | 1.39 | a04 | 13.59 | a22 | 1.01 | a22 | 0.07 | a10 | 3.881 |
| a22 | 33 | a03 | 24 | a26 | 15 | a22 | 64.103 | a22 | 2.259 | a08 | 10.69 | a22 | 1.30 | a08 | 10.69 | c07 | 0.95 | c07 | 0.07 | c06 | 2.651 |
| a18 | 32 | a20 | 23 | c07 | 13 | a18 | 63.559 | a18 | 2.195 | a03 | 10.36 | a26 | 1.30 | a03 | 10.36 | a28 | 0.91 | a28 | 0.07 | a22 | 2.58 |
| c06 | 31 | a18 | 21 | a28 | 12 | c06 | 63.025 | c06 | 2.135 | a10 | 8.89 | a28 | 1.29 | a10 | 8.46 | a26 | 0.90 | a26 | 0.07 | a18 | 2.338 |
| a26 | 29 | a14 | 20 | a18 | 11 | a26 | 61.983 | c08 | 1.403 | a06 | 5.76 | c07 | 1.27 | a06 | 5.61 | c05 | 0.84 | c05 | 0.07 | a01 | 2.013 |
| a20 | 28 | a01 | 20 | a24 | 11 | a20 | 61.475 | a06 | 1.381 | a05 | 4.89 | c15 | 1.27 | a05 | 4.83 | a18 | 0.81 | c15 | 0.07 | a26 | 1.613 |
| a06 | 27 | a05 | 19 | a33 | 11 | a06 | 60.976 | c07 | 1.312 | c17 | 4.37 | a24 | 1.01 | a09 | 3.52 | a24 | 0.81 | a18 | 0.05 | a06 | 1.338 |
| a23 | 26 | a22 | 18 | a31 | 11 | a23 | 60.484 | a14 | 1.306 | a07 | 3.73 | a33 | 1.01 | a07 | 3.50 | c15 | 0.78 | a24 | 0.05 | a20 | 1.178 |
| a24 | 24 | a04 | 17 | c15 | 11 | a03 | 59.524 | a24 | 1.211 | a09 | 3.58 | a18 | 0.96 | a13 | 3.46 | a33 | 0.75 | a33 | 0.05 | a03 | 1.13 |
| a03 | 24 | a08 | 17 | a23 | 10 | c07 | 59.055 | a20 | 1.123 | a13 | 3.46 | c09 | 0.95 | a20 | 3.15 | c09 | 0.73 | c09 | 0.05 | c07 | 1.028 |
| c07 | 23 | a23 | 16 | c05 | 10 | a24 | 59.055 | a26 | 1.026 | a20 | 3.42 | c13 | 0.93 | a14 | 3.10 | c13 | 0.65 | c13 | 0.05 | a24 | 1.027 |
| c08 | 22 | a07 | 16 | c09 | 10 | c08 | 58.594 | a23 | 1.019 | a18 | 3.21 | a31 | 0.83 | a15 | 2.95 | a31 | 0.64 | a31 | 0.04 | a23 | 0.999 |
| a21 | 22 | a19 | 15 | c08 | 9 | a21 | 58.594 | a28 | 0.815 | a14 | 3.17 | a23 | 0.73 | a19 | 2.52 | c11 | 0.59 | c11 | 0.04 | c05 | 0.663 |
| a14 | 22 | a26 | 14 | a21 | 8 | a14 | 58.594 | a17 | 0.802 | a15 | 2.95 | c11 | 0.73 | a16 | 2.26 | a23 | 0.56 | a23 | 0.04 | c08 | 0.573 |
| c05 | 21 | a21 | 14 | a25 | 8 | c05 | 58.140 | c05 | 0.787 | a22 | 2.83 | a21 | 0.57 | a18 | 2.24 | c08 | 0.53 | c08 | 0.03 | a28 | 0.513 |
| a07 | 21 | a17 | 14 | c11 | 8 | a07 | 57.692 | a03 | 0.776 | a24 | 2.81 | c08 | 0.56 | a12 | 2.06 | a21 | 0.46 | a21 | 0.03 | a14 | 0.459 |
| a28 | 20 | a24 | 13 | a32 | 8 | a01 | 57.692 | c09 | 0.760 | a19 | 2.69 | a25 | 0.56 | a24 | 1.8 | a32 | 0.43 | a32 | 0.03 | a04 | 0.386 |
| a05 | 20 | c08 | 13 | a10 | 7 | a28 | 57.252 | a08 | 0.709 | c06 | 2.66 | a32 | 0.51 | a11 | 1.61 | a17 | 0.42 | a25 | 0.03 | a21 | 0.325 |
Disclaimer/Publisher’s Note: The statements, opinions and data contained in all publications are solely those of the individual author(s) and contributor(s) and not of MDPI and/or the editor(s). MDPI and/or the editor(s) disclaim responsibility for any injury to people or property resulting from any ideas, methods, instructions or products referred to in the content. |
© 2023 by the authors. Licensee MDPI, Basel, Switzerland. This article is an open access article distributed under the terms and conditions of the Creative Commons Attribution (CC BY) license (https://creativecommons.org/licenses/by/4.0/).
Share and Cite
Wang, Y.; Kindong, R.; Gao, C.; Wang, J. Identification of Keystone Species in Ecological Communities in the East China Sea. Fishes 2023, 8, 224. https://doi.org/10.3390/fishes8050224
Wang Y, Kindong R, Gao C, Wang J. Identification of Keystone Species in Ecological Communities in the East China Sea. Fishes. 2023; 8(5):224. https://doi.org/10.3390/fishes8050224
Chicago/Turabian StyleWang, Yin, Richard Kindong, Chunxia Gao, and Jiaqi Wang. 2023. "Identification of Keystone Species in Ecological Communities in the East China Sea" Fishes 8, no. 5: 224. https://doi.org/10.3390/fishes8050224
APA StyleWang, Y., Kindong, R., Gao, C., & Wang, J. (2023). Identification of Keystone Species in Ecological Communities in the East China Sea. Fishes, 8(5), 224. https://doi.org/10.3390/fishes8050224