Small-Scale Marine Fishers’ Possession of Fishing Vessels and Their Impact on Net Income Levels: A Case Study in Takalar District, South Sulawesi Province, Indonesia
Abstract
:1. Introduction

2. Materials and Methods

3. Results and Discussion
3.1. Characteristics of Fishers’ Household
3.2. Fishers’ Boat and Fishing Tools
3.3. Fishers’ Primary and Secondary Income
4. Conclusions
5. Limitations
Author Contributions
Funding
Informed Consent Statement
Data Availability Statement
Acknowledgments
Conflicts of Interest
References
- MMAFI. Konsumsi Ikan Naik Dalam 5 Tahun Terakhir Kementerian Kelautan dan Perikanan. 2016. Available online: http://kkp.go.id/wp-content/uploads/2016/05/Konsumsi-Ikan-Naik-dalam-5-Tahun-Terakhir.pdf (accessed on 13 March 2017).
- Tajerin, T.; Yusuf, R.; Sastrawidjaja, S.; Asnawi, A. Keterkaitan Sektor Perikanan Dalam Perekonomian Indonesia: Pendekatan Model Input-Output. J. Sos. Ekon. Kelaut. Dan Perikan. 2007, 2, 19–33. [Google Scholar] [CrossRef]
- Winter, G. (Ed.) Towards Sustainable Fisheries Law. A Comparative Analysis; International Union for Conservation of Nature and Natural Resources (IUCN): Gland, Switzerland, 2009. [Google Scholar]
- FAO. The State of World Fisheries and Aquaculture 2016. Contributing to Food Security and Nutrition for All; Food and Agriculture Organization of the United Nations: Rome, Italy, 2018. [Google Scholar]
- Martins, I.M.; Medeiros, R.P.; Domenico, M.D.; Hanazaki, N. What Fishers’ Local Ecological Knowledge Can Reveal about the Changes in Exploited Fish Catches. Fish. Res. 2018, 198, 109–116. [Google Scholar] [CrossRef]
- FAO. Achieving Poverty Reduction through Responsible Fisheries; Food and Agriculture Organization of the United Nations: Rome, Italy, 2008. [Google Scholar]
- Akbarsyah, N.; Wiyono, E.S.; Solihin, I. Dependency and Perception of Handline Fishermen towards Fish Resources at Prigi Trenggalek East Java. Mar. Fish. 2017, 8, 199–210. [Google Scholar]
- FAO. The State of World Fisheries and Aquaculture 2018: Meeting the Sustainable Development Goals; FAO: Rome, Italy, 2018; Available online: https://www.fao.org/3/i9540en/i9540en.pdf (accessed on 20 August 2021).
- Stacey, N.; Gibson, E.; Loneragan, N.R.; Warren, C.; Wiryawan, B.; Adhuri, D.S.; Steenbergen, D.J.; Fitriana, R. Developing Sustainable Small-scale Fisheries Livelihoods in Indonesia: Trends, Enabling and Constraining Factors, and Future Opportunities. Mar. Policy 2021, 132, 104654. [Google Scholar] [CrossRef]
- Setiawan, I. Keragaan Pembangunan Perikanan Tangkap: Suatu Analisis Program Pemberdayaan Nelayan Kecil; Bogor Agricultural University: Bogor, Indonesia, 2008; Unpublished; Available online: https://repository.ipb.ac.id/handle/123456789/41045 (accessed on 17 August 2021).
- Salam, M. Poverty Structure in Indonesian Forest Area: A Comparative Study on Poverty Structural Causal Model of Forest and Non-Forest Communities; Ryukoku University: Kyoto, Japan, 2005. [Google Scholar]
- Hafsaridewi, R.; Fahrudin, A.; Sulistiono Sutrisno, D.; Koesshendrajana, S. Fishers’ Resilience to the Availability of Fishery Resources in Karimunjawa Island. J. Nat. Resour. Environ. Manag. 2018, 9, 527–540. [Google Scholar] [CrossRef]
- Bene, C. When Fishery Rhymes with Poverty: A first Step Beyond the Old Paradigm on Poverty in Small-scale Fisheries. World Dev. 2003, 31, 949–975. [Google Scholar] [CrossRef]
- Indonesian Constitution. Undang-Undang Republik Indonesia Nomor 45 Tahun 2009. Available online: https://pelayanan.jakarta.go.id/download/regulasi/undang-undang-nomor-45-tahun-2009-tentang-perikanan.pdf (accessed on 4 April 2019).
- Agunggunanto, E.Y.; Arianti, F.; Model Penentu Pendapat Nelayan di Kabupaten Demak. Prosiding Seminar Nasional & Call for Papers-Kinerja Perbankan, Bisnis dan Ekonomi Indonesia Menghadapi Asean Economic Community 2015. Available online: http://eprints.undip.ac.id/50774/1/model_penentu_pendapatan-edy_yusuf_%26_fitrie-unisbank.pdf (accessed on 28 August 2021).
- Putra, G.E.A.B. Analisis Fakto-Faktor yang Mempengaruhi Produksi dan Pendapatan Nelayan di Desa Batununggul Kecamatan Nusa Penida. E-J. EP Unud 2019, 8, 1092–1121. [Google Scholar]
- Suri, R.A.; Kune, S.J. Analisis Pendapatan Nelayan Perahu Motor Tempel dan Perahu Motor Lampara di Kelurahan Humusu C, Kecamatan Insana Utara. Agrimor J. Agribisnis Lahan Kering 2017, 2, 39–40. [Google Scholar] [CrossRef]
- Rahim, A.; Hastuti, D.R.D. Determinants of Traditional Fishing Income in West Coast of Barru Regency. J. Sosek KP 2016, 11, 75–88. [Google Scholar]
- Rahim, A. Fish Production Comparison of Traditional Fishers in West Coast of Barru Regency. J. Kebijakan Sosek KP 2013, 3, 107–115. [Google Scholar]
- Rahim, A.; Hastuti, D.R.; Syahma, D.; Firmansyah, A. The Influence of Fishing Time, Power Outboard Engine, and Respondent Characteristics to Income of Traditional Catch Fishermen in Takalar District. Agrisocionomics J. Sos. Ekon. Pertan. 2018, 2, 50–57. [Google Scholar] [CrossRef]
- Widayatun, N.F.N. Satu Dekade Pembangunan Sumber Daya Manusia di Wilayah Pesisir: Capaian dan Tantangan (Kasus Pulau Mapur, Kabupaten Bintan). J. Kependud. Indones. 2016, 11, 119–132. [Google Scholar] [CrossRef]
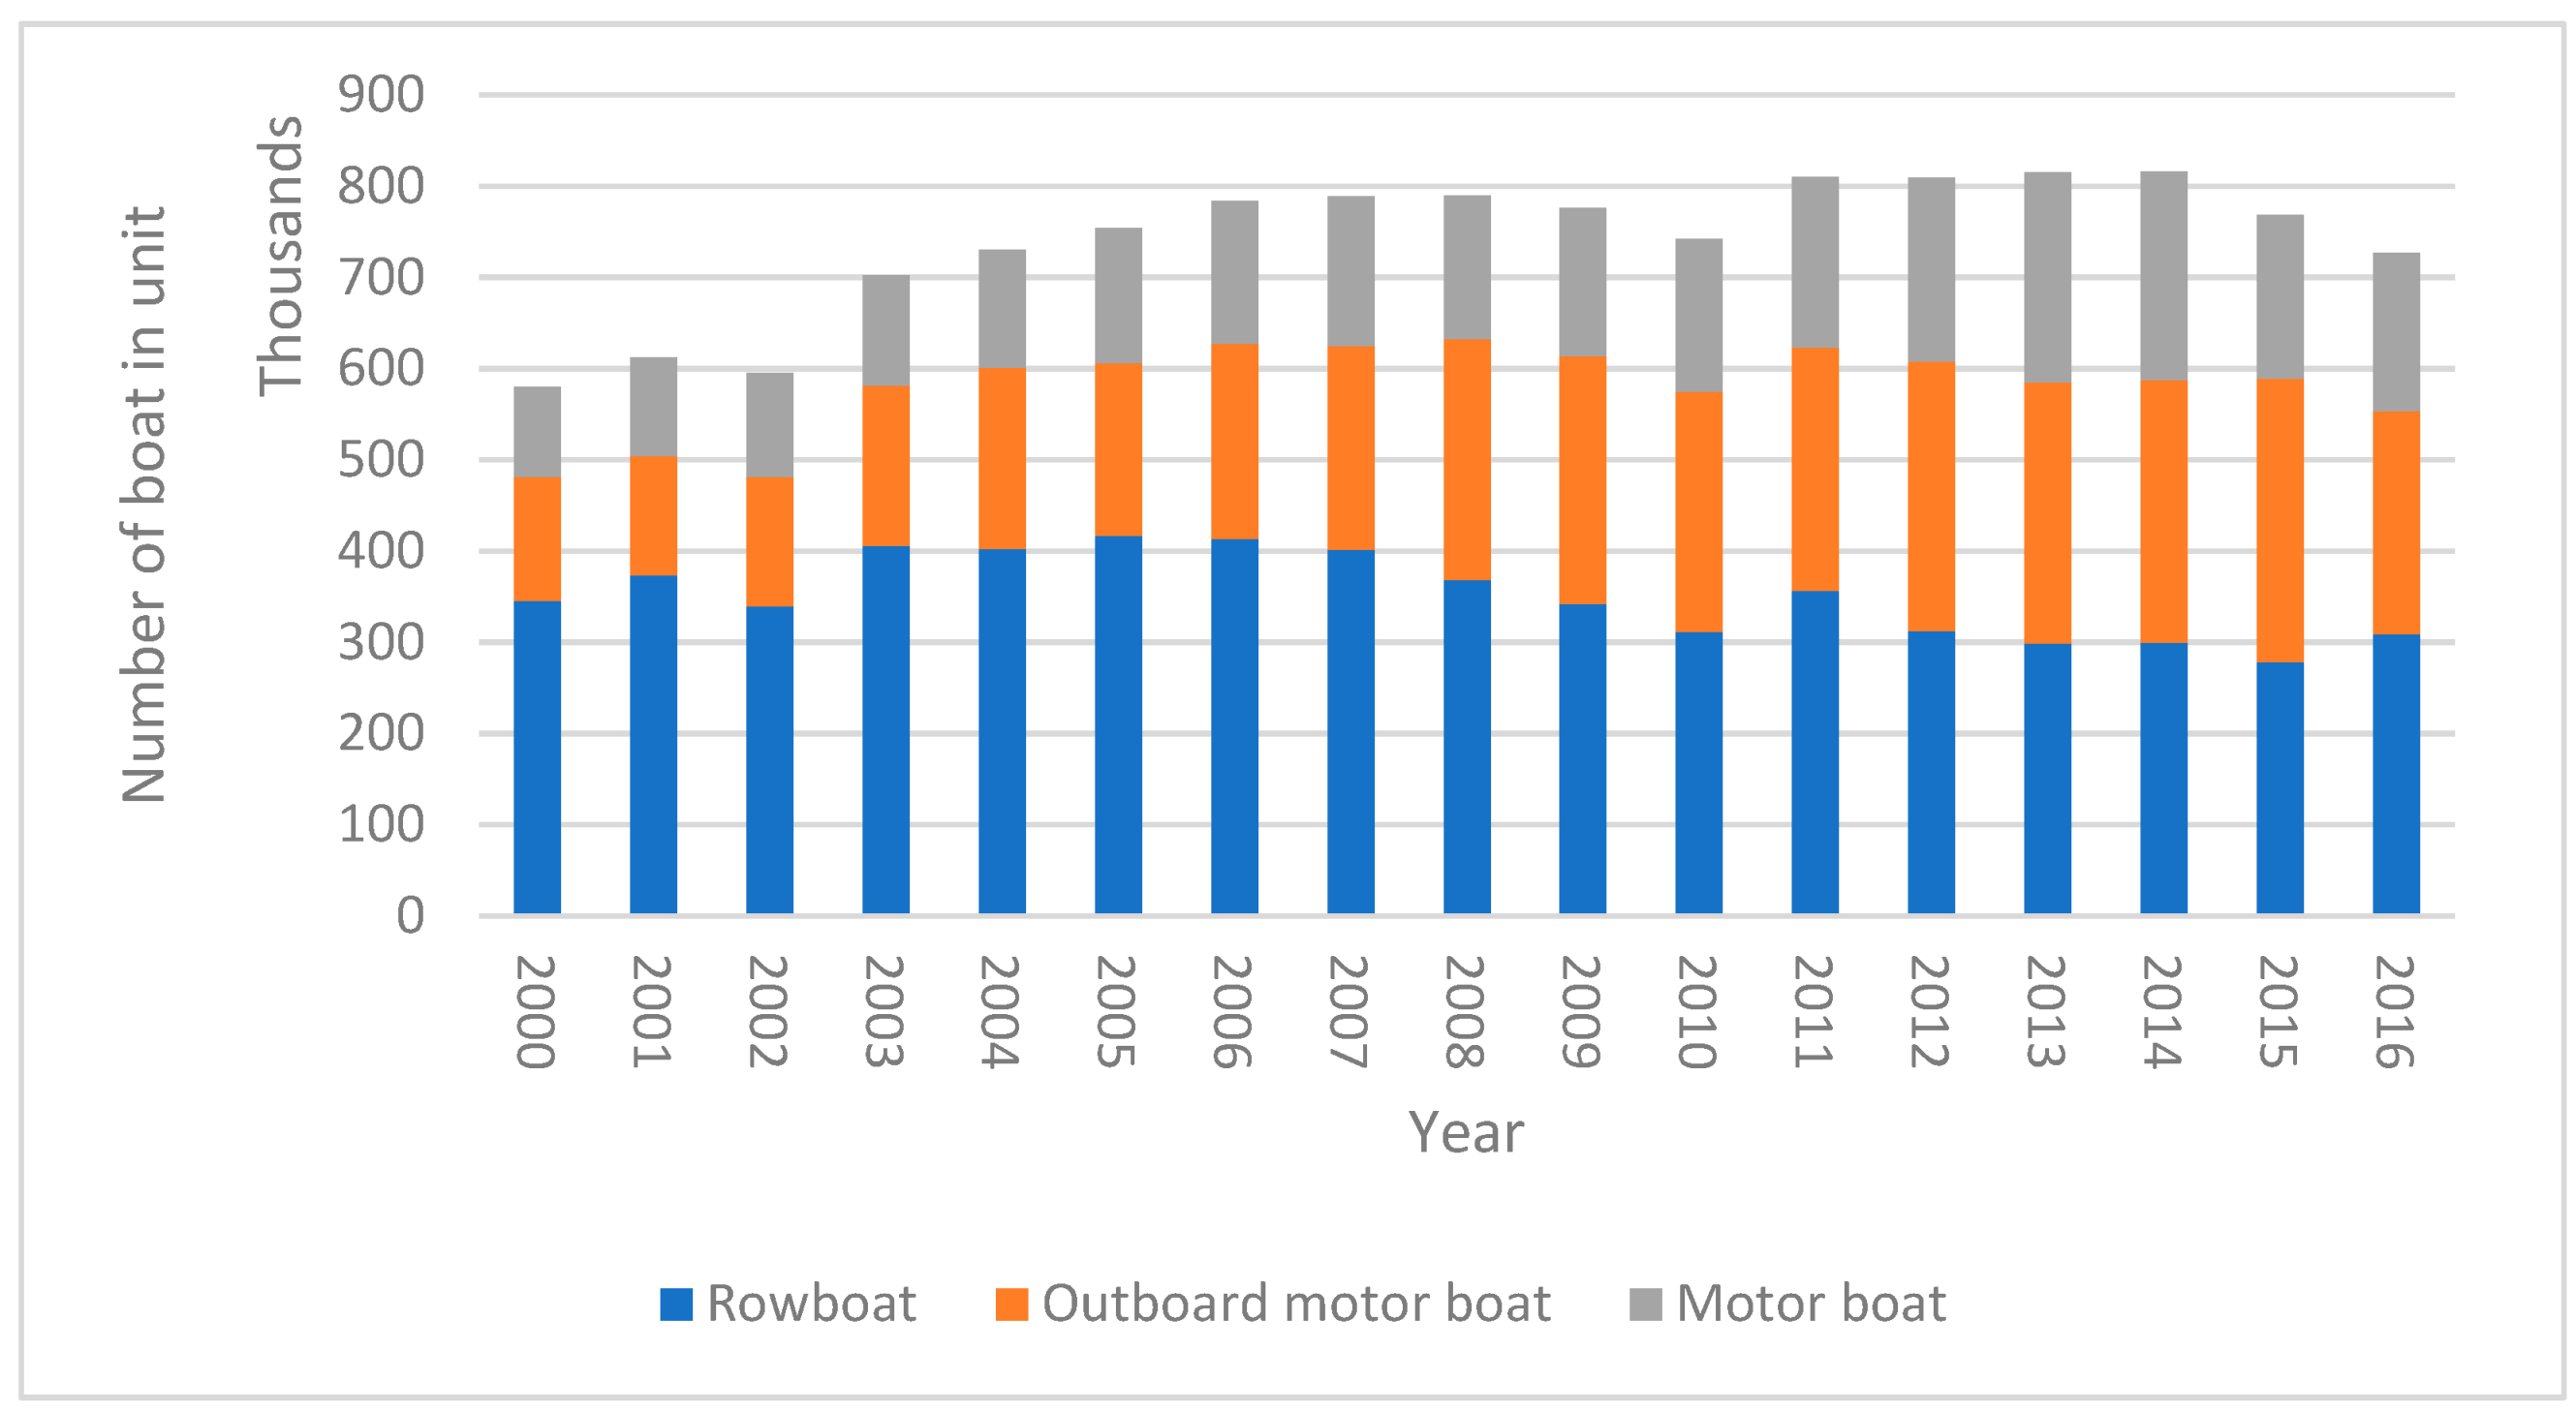
- Statistics Agency of Indonesia. Jumlah Perahu/Kapal Menurut Provinsi dan Jenis Perahu/Kapal, 2000–2016. 2021. Available online: https://www.bps.go.id/statictable/2014/01/10/1710/jumlah-perahu-kapalmenurut-provinsi-dan-jenis-perahu-kapal-2000-2016.html (accessed on 2 September 2021).
- Statistics Agency of Indonesia. Produksi Perikanan Tangkap Menurut Provinsi dan Jenis Penangkapan Tahun 2000–2020. 2023. Available online: https://www.bps.go.id/statictable/2009/10/05/1705/produksi-perikanan-tangkap-menurut-provinsi-dan-jenis-penangkapan-2000-2020.html (accessed on 20 August 2023).
- MMAFI. Laporan Tahunan Kementerian Kelautan dan Perikanan Tahun 2017; Tahunan Kementerian Kelautan dan Perikanan Tahun Republik Indonesia: Jakarta, Indonesia, 2017. [Google Scholar]
- Statistics Agency of South Sulawesi Province. Jumlah Rumah Tangga Perikanan Tangkap 2014–2015. 2021. Available online: https://sulsel.bps.go.id/indicator/56/980/1/jumlah-rumah-tangga-perikanan-tangkap.html (accessed on 2 September 2021).
- Statistics Agency of Takalar District. Kabupaten Takalar Dalam Angka 2016; Badan Pusat Statistik Kabupaten Takalar: South Sulawesi, Indonesia, 2016.
- Nur, R.H.; Najamuddin, N.; Ridha, M.R. Perubahan Pola Kehidupan Masyarakat Nelayan Desa Galesong Baru Pasca Modernisasi, 1980–2015. J. Pemikir. Pendidik. Dan Penelit. Kesejaht. 2020, 7, 133–145. [Google Scholar]
- Statistics Agency of Takalar District. Kabupaten Takalar Dalam Angka 2018; Badan Pusat Statistik Kabupaten Takalar: South Sulawesi, Indonesia, 2018.
- Google Maps. Takalar, South Sulawesi, Indonesia. 2023. Available online: https://www.google.com/maps/place/Takalar+Regency,+South+Sulawesi,+Indonesia/ (accessed on 31 July 2023).
- WHO. Engaging Young People for Health and Sustainable Development-Strategic Opportunities for the World Health Organization and Partners; World Health Organization: Geneva, Switzerland, 2018; Available online: https://apps.who.int/iris/bitstream/handle/10665/274368/9789241514576-eng.pdf (accessed on 24 August 2021).
- Statistics Agency of South Sulawesi Province (2018a). Education. Available online: https://sulsel.bps.go.id/subject/28/pendidikan.html#subjekViewTab3 (accessed on 15 November 2018).
- MMAFI. Peluang Usaha dan Investasi Rumput Laut; Ditjen Penguatan Daya Saing Produk kelautan dan Perikanan, Kementrian Kelautan dan Perikanan Republik Indonesia: Jakarta, Indonesia, 2019.
- MAFDSS. Komoditas Unggulan Rumput Laut. 2017. Available online: http://panel.sulselprov.go.id/pages/komoditas-unggulan-rumput-laut (accessed on 18 January 2022).
| Type | Characteristic | ||
|---|---|---|---|
| Fishing Ground | Driving Force | Size and Price | |
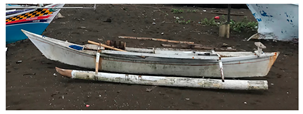
| Rowboat (RB) * | Shore (0–5 km) Single day fishing | Manpower (paddle) | Length is 2–4 m, width is 50–75 cm RP 700,000–RP 2,000,000 or USD 51–USD 145 ** |
 | |||
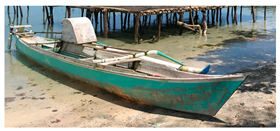
| Outboard Motorboat (OMB) * | Off-shore (0–20 km) Single day fishing | Single motor (can be removed or installed outside of boat before catching fish) | Length is 3–7 m, width 75–100 cm RP 8,000,000–RP 15,000,000 or USD 581–USD 1089 ** |
 | |||
| Motorboat (MB) * | Off-Shore (More than 20 km), Multi-day fishing | Single/double motor (installed permanently inside the boat) | Length is 10–15 m width 100–200cm RP 50,000,000– RP 100,000,000 or USD 3630–USD 7261 ** |
 | |||
| Category | Type of Boat and Ownership | |||
|---|---|---|---|---|
| Type of Boat * | No. Fisher (No. Boat) | Ownership | ||
| Type ** | No. Fisher | |||
| 1 | MB | 3 (1) | O | 2 |
| R/B | 1 | |||
| 2 (3) | O | 2 | ||
| OMB | 4 (1) | O | 3 | |
| R/B | 1 | |||
| 1 (3) | O | 1 | ||
| 2 | MB | 5 (1) | O | 6 |
| 1 (2) | ||||
| RB | 5 (1) | O | 6 | |
| 1 (2) | ||||
| 3 | MB | 38 (1) | O | 16 |
| R/B | 22 | |||
| 4 | OMB | 7 (1) | O | 8 |
| RB | 7 (1) | O | 8 | |
| 5 | OMB | 84 (1) 3 (2) | O | 71 |
| 1 (4) | R/B | 17 | ||
| 6 | RB | 7 (1) 1 (2) | O | 8 |
| Total | 152 | |||
| Category | No. of Fishers | % | Household Member (People) | Age | Age Category | School Period (Years) | Experience in Fishing (Years) | |
|---|---|---|---|---|---|---|---|---|
| Years | 15–54 Years | >55 Years | ||||||
| 1 | 5 | 3.3 | 4.2 | 45.4 | 3 | 2 | 7.2 | 23.8 |
| 2 | 6 | 3.9 | 4.5 | 42.0 | 5 | 1 | 5.0 | 23.7 |
| 3 | 38 | 25.0 | 4.1 | 41.2 | 34 | 4 | 6.4 | 16.5 |
| 4 | 7 | 5.3 | 3.6 | 44.3 | 5 | 2 | 5.7 | 19.9 |
| 5 | 88 | 57.3 | 4.5 | 45.1 | 73 | 15 | 5.1 | 24.8 |
| 6 | 8 | 5.3 | 4.5 | 45.1 | 6 | 2 | 3.75 | 18.0 |
| Average in total/Total | 4.2 | 43.9 | 126 | 26 | 5.5 | 22.1 | ||
| Economic Characteristics | Type of Boat | |||
|---|---|---|---|---|
| RB (Cat. 6) | OMB (Cat. 4 and 5) | MB (Cat. 1, 2, and 3) | Average in Total | |
| (N = 8) | (N = 95) | (N = 49) | (N = 152) | |
| (Thousand Rp./month) | ||||
| Primary job’s income (fishing income) | 2100 | 4194 | 8017 | 5317 |
| Fishing variable cost | 1152 | 1214 | 2951 | 2366 |
| Fishing fix cost | 0 | 1436 | 2798 | 1795 |
| Fishing Net Income | 1072 | 1588 | 2351 | 2019 |
| Secondary job’s income | 1627 (N = 3) | 1530 (N = 27) | 1207 (N = 31) | 1371 (N = 61) |
| Net income | 1682 | 2007 | 3105 | 3487 |
| Average food consumption expenditure | 1075 | 1233 | 1376 | 1271 |
| Average non-food household expenditure | 788 | 593 | 783 | 664 |
| Poverty line (USD/capita) | 1.21 * | 2.42 ** | 4.63 *** | |
| Category | Fishing Day/ Month | Sea Fish Catch/ Month (kg) | Selling Place | Fishing Ground (km) | Selling Price/kg (Rupiah) | Average Revenue | Variable Cost | Fix Cost |
|---|---|---|---|---|---|---|---|---|
| (Thousand Rp./Month) | ||||||||
| 1 | 24.8 | 258.0 | Local market and city market | 45.2 | 40,000 | 8017 | 2951 | 2798 |
| 2 | 22.7 | 195.3 | Shore and roadside | 23.6 | 45,416 | |||
| 3 | 21.6 | 128.4 | Roadside and local market | 19.6 | 43,842 | |||
| 4 | 21.7 | 178.6 | Home, shore and roadside | 18.4 | 30,071 | 4194 | 1214 | 1436 |
| 5 | 20.8 | 144.6 | Roadside and local market | 11.4 | 47,579 | |||
| 6 | 25.5 | 174.5 | Home and shore | 7.3 | 14,875 | 2100 | 1027 | 0 |
| Average | 21.5 | 149.4 | 20.9 | 43,782 | 5317 | 1759 | 1795 | |
| Variable | X1 | X2 | X3 | X4 | X5 | X6 | X7 | X8 | X9 | X10 | X11 | X12 | X13 | Y |
|---|---|---|---|---|---|---|---|---|---|---|---|---|---|---|
| X1 | 1.000 | |||||||||||||
| X2 | −0.429 ** | 1.000 | ||||||||||||
| X3 | 0.640 ** | −0.384 ** | 1.000 | |||||||||||
| X4 | 0.036 | −0.081 | 0.067 | 1.000 | ||||||||||
| X4 | −0.067 | −0.004 | 0.062 | 0.125 | 1.000 | |||||||||
| X5 | 0.132 | −0.176 * | 0.219 ** | 0.146 | 0.064 | 1.000 | ||||||||
| X6 | −0.104 | −0.008 | 0.013 | 0.195 * | 0.362 ** | −0.013 | 1.000 | |||||||
| X7 | 0.212 ** | 0.118 | 0.121 | −0.044 | −0.055 | −0.127 | −0.416 ** | 1.000 | ||||||
| X8 | 0.104 | −0.040 | 0.093 | −0.064 | 0.151 * | −0.152 * | 0.142 | 0.354 ** | 1.000 | |||||
| X9 | −0.033 | 0.155 * | −0.214 ** | −0.097 | −0.102 | −0.298 ** | 0.020 | 0.257 ** | 0.212 ** | 1.000 | ||||
| X10 | −0.036 | 0.109 | −0.094 | 0.035 | −0.041 | −0.257 ** | −0.062 | 0.429 ** | 0.347 ** | 0.373 ** | 1.000 | |||
| X11 | −0.011 | −0.095 | 0.088 | 0.072 | 0.186 * | −0.139 | 0.410 ** | 0.119 | 0.450 ** | 0.207 ** | 0.245 ** | 1.000 | ||
| X12 | −0.204 ** | 0.140 | −0.347 ** | 0.032 | 0.019 | −0.232 ** | 0.014 | −0.081 | −0.104 | 0.423 ** | 0.171 * | −0.049 | 1.000 | |
| Y | 0.054 | 0.072 | −0.005 | 0.102 | 0.222 ** | −0.210 ** | 0.555 ** | 0.282 ** | 0.270 ** | 0.248 ** | 0.118 | 0.181 * | 0.086 | 1.000 |
| Variable | Description | Measurement | Mean | SD | Coefficient | t Value | Collinearity–Tolerance |
|---|---|---|---|---|---|---|---|
| Constant | Intercept term | 1.275 × 10⁻¹⁶ | 0.000 | ||||
| Age (X1) | Fishers’ age | Years | 43.97 | 11.47 | 0.115 | 1.726 | 0.506 |
| School period (X2) | Formal school period attended by fishers | Years | 5.46 | 3.51 | 0.101 | 1.871 | 0.776 |
| Fishing experience (X3) | Fishers’ fishing experience or how long they have been a fisher | Years | 22.07 | 11.92 | −0.011 | −0.162 | 0.470 |
| Household members (X4) | Number of household member living in the same house including the fishers themselves | People | 4.19 | 1.26 | 0.021 | 0.419 | 0.920 |
| Fishing days (X5) | Number of days spend for fishing in a month | Days/month | 21.47 | 6.11 | 0.017 | 0.327 | 0.835 |
| Boat category (X6) | Boat ownership category (Table 2) | Categorical data (1–6) | - | - | −0.109 | −2.133 * | 0.853 |
| Sea fish catch (X7) | Number of fish catch by fishers in a month | kg/month | 149.42 | 170.21 | 0.317 | 4.978 ** | 0.554 |
| Fish selling price (X8) | Selling price of fish per kilogram | Rupiah/kg | 43,782.89 | 41,379.83 | 0.175 | 3.285 ** | 0.786 |
| Fishing ground (X9) | Distance from the shore to the fishing ground | Km | 15.19 | 18.83 | −0.017 | −0.284 | 0.646 |
| Total net (X10) | Total number of net or catching tools possess by fishers | Nets | 1.58 | 0.97 | −0.013 | −0.229 | 0.671 |
| Fix cost (X11) | Fix cost spends by fishers for fishing activity in a month | Rupiah/month | 147,637.06 | 484,110.28 | −0.263 | −5.019 ** | 0.814 |
| Variable cost (X12) | Variable cost spends by fishers for fishing activity in a month | Rupiah/month | 1,736,538.27 | 3,576,308.00 | 0.610 | 8.934 ** | 0.481 |
| Second job (X13) | Availability of second job of fishers | Dummy (0 = No, 1 = Yes) | - | - | 0.032 | 0.551 | 0.663 |
| Net income (Y) | Total fishers’ primary job and secondary job incomes minus variable cost and fix cost | Rupiah/month | 3,432,318.09 | 8,427,428.99 | |||
| N | 152 | ||||||
| R2 | 0.653 | ||||||
| Adj-R2 | 0.624 | ||||||
| F-value | 22.411 |
Disclaimer/Publisher’s Note: The statements, opinions and data contained in all publications are solely those of the individual author(s) and contributor(s) and not of MDPI and/or the editor(s). MDPI and/or the editor(s) disclaim responsibility for any injury to people or property resulting from any ideas, methods, instructions or products referred to in the content. |
© 2023 by the authors. Licensee MDPI, Basel, Switzerland. This article is an open access article distributed under the terms and conditions of the Creative Commons Attribution (CC BY) license (https://creativecommons.org/licenses/by/4.0/).
Share and Cite
Muslim, A.I.; Fujimura, M.; Kazunari, T.; Salam, M. Small-Scale Marine Fishers’ Possession of Fishing Vessels and Their Impact on Net Income Levels: A Case Study in Takalar District, South Sulawesi Province, Indonesia. Fishes 2023, 8, 463. https://doi.org/10.3390/fishes8090463
Muslim AI, Fujimura M, Kazunari T, Salam M. Small-Scale Marine Fishers’ Possession of Fishing Vessels and Their Impact on Net Income Levels: A Case Study in Takalar District, South Sulawesi Province, Indonesia. Fishes. 2023; 8(9):463. https://doi.org/10.3390/fishes8090463
Chicago/Turabian StyleMuslim, Ahmad Imam, Miho Fujimura, Tsuji Kazunari, and Muslim Salam. 2023. "Small-Scale Marine Fishers’ Possession of Fishing Vessels and Their Impact on Net Income Levels: A Case Study in Takalar District, South Sulawesi Province, Indonesia" Fishes 8, no. 9: 463. https://doi.org/10.3390/fishes8090463
APA StyleMuslim, A. I., Fujimura, M., Kazunari, T., & Salam, M. (2023). Small-Scale Marine Fishers’ Possession of Fishing Vessels and Their Impact on Net Income Levels: A Case Study in Takalar District, South Sulawesi Province, Indonesia. Fishes, 8(9), 463. https://doi.org/10.3390/fishes8090463


