Article

Fish Stock Status and Its Clues on Stocking: A Case Study of Acanthopagrus schlegelii from Zhanjiang Coastal Waters, China

by
Hagai Nsobi Lauden
1,
Xinwen Xu
1,
Shaoliang Lyu
1,
Alma Alfatat
1,
Kun Lin
1,
Shuo Zhang
2,
Ning Chen
1,* and
Xuefeng Wang
1
1
College of Fisheries, Guangdong Ocean University, Zhanjiang 524088, China
2
College of Marine Sciences, Shanghai Ocean University, Shanghai 201306, China
*
Author to whom correspondence should be addressed.
Fishes 2024, 9(10), 381; https://doi.org/10.3390/fishes9100381
Submission received: 8 August 2024 / Revised: 23 September 2024 / Accepted: 25 September 2024 / Published: 26 September 2024
(This article belongs to the Special Issue Assessment and Management of Fishery Resources)

Abstract

:
Global fisheries face overfishing challenges, endangering fish stock and biodiversity. While hatchery release stocking programs aim to bolster fish populations, their effectiveness remains uncertain due to challenges in data acquisition, such as obtaining stocking details and differentiating between wild and stocked individuals. This study evaluates the stock status of black sea bream (Acanthopagrus schlegelii) released in Chinese hatchery programs since the 1980s. Samples from Zhanjiang fish markets (January 2019–October 2021) underwent analysis using the length–weight relationship (LWR), length-based spawning potential ratio (LBSPR), and length-based Bayesian (LBB) methods. The male and female LWRs were W = 0.0188L2.9725 and W = 0.016L3.0284, respectively, and the observed condition factors indicated good health. The estimates imply that the region is conducive to species survival and can sustain its stocking programs. The LBSPR (SPR = 0.21 (0.17–0.25)) and LBB (B/BMSY = 1.1 (0.718–1.34), B/B0 = 0.37 (0.253–0.473)) results suggest a rebuilding population capable of replenishing to more sustainable levels. However, F/M and net selectivity estimates indicate that fishing practices target juvenile fish, limiting the reproductive potential of A. schlegelii. These findings underline the need for enhanced management strategies, including delayed harvesting and the use of size-specific fishing gear, to ensure the long-term sustainability of the species.
Key Contribution: Hatchery release programs aim to boost fish populations, but effectiveness is unclear due to data challenges. Stock assessments offer valuable insights into progress and help refine management strategies to address declining stocks and overfishing.

1. Introduction

Global fisheries are facing significant challenges from the increasing human population, which is exacerbating the decline of fish stocks due to overfishing [1]. Overfishing is disrupting natural fish replenishment processes, with around 30% of global fish stocks being biologically unstable and unable to keep up with demand. Hatchery-release stocking programs have been in place since the 17th century and have been implemented worldwide [2,3]. However, early efforts met with obstacles due to a limited understanding of species biology [4,5]. Advances in technology and enhanced understanding of species characteristics, such as growth rate and habitat preference, have made stocking in freshwater and marine environments easier [4,6]. While these stocking programs are still considered experimental, they are designed to test hypotheses and address associated challenges [4]. The importance of pre-and post-release success has been highlighted by recent research grounded in established principles [7,8]. Despite these progresses, a notable gap persists in comprehending how hatcheries can support wild populations of released species. This knowledge deficit stems from challenges in acquiring essential data such as stocking rate, timing, location, and methods to distinguish between stocked and wild individuals. Assessing the populations of species released from hatcheries is crucial for gaining insight into their present conditions and guaranteeing their sustained prosperity.
To date, over 100 species have been released into Chinese marine waters, with expectations of a further increase following the 2015 declaration of 6 June as the National Fish Release Day [9]. This study focuses on the black sea bream (Acanthopagrus schlegelii), which has been part of Chinese hatchery-release programs since the 1980s, initiated due to the depletion of its wild populations [10]. This species is distributed in the marine waters of the Pacific Northwest region and has significant commercial value. Given the historical decline of wild populations and the reliance on hatchery releases as the primary management technique, evaluating the current stock status is critical. To achieve this, we applied the Length–Weight Relationship (LWR), along with the Length-based Spawning Potential Ratio (LBSPR) and Length-based Bayesian (LBB) models. The LWR analysis estimates condition factors, which indicate the fish population’s health, offering insight into stock fitness and the presence of supportive habitats for species survival. LBSPR and LBB, in particular, are data-limited models that provide robust insights into stock status using length-frequency data. These models are particularly advantageous in this context, as they offer valuable insights into stock status amid the challenge of acquiring sufficient data to assess the effectiveness of hatchery releases. By focusing on length-frequency data, these models enable the estimation of key parameters such as the Spawning Potential Ratio (SPR) and biomass, which may be critical for understanding the sustainability of hatchery-based management strategies. This application is important in evaluating the contribution of hatchery releases to stock recovery, a topic that has not been thoroughly addressed in previous studies.

2. Materials and Methods

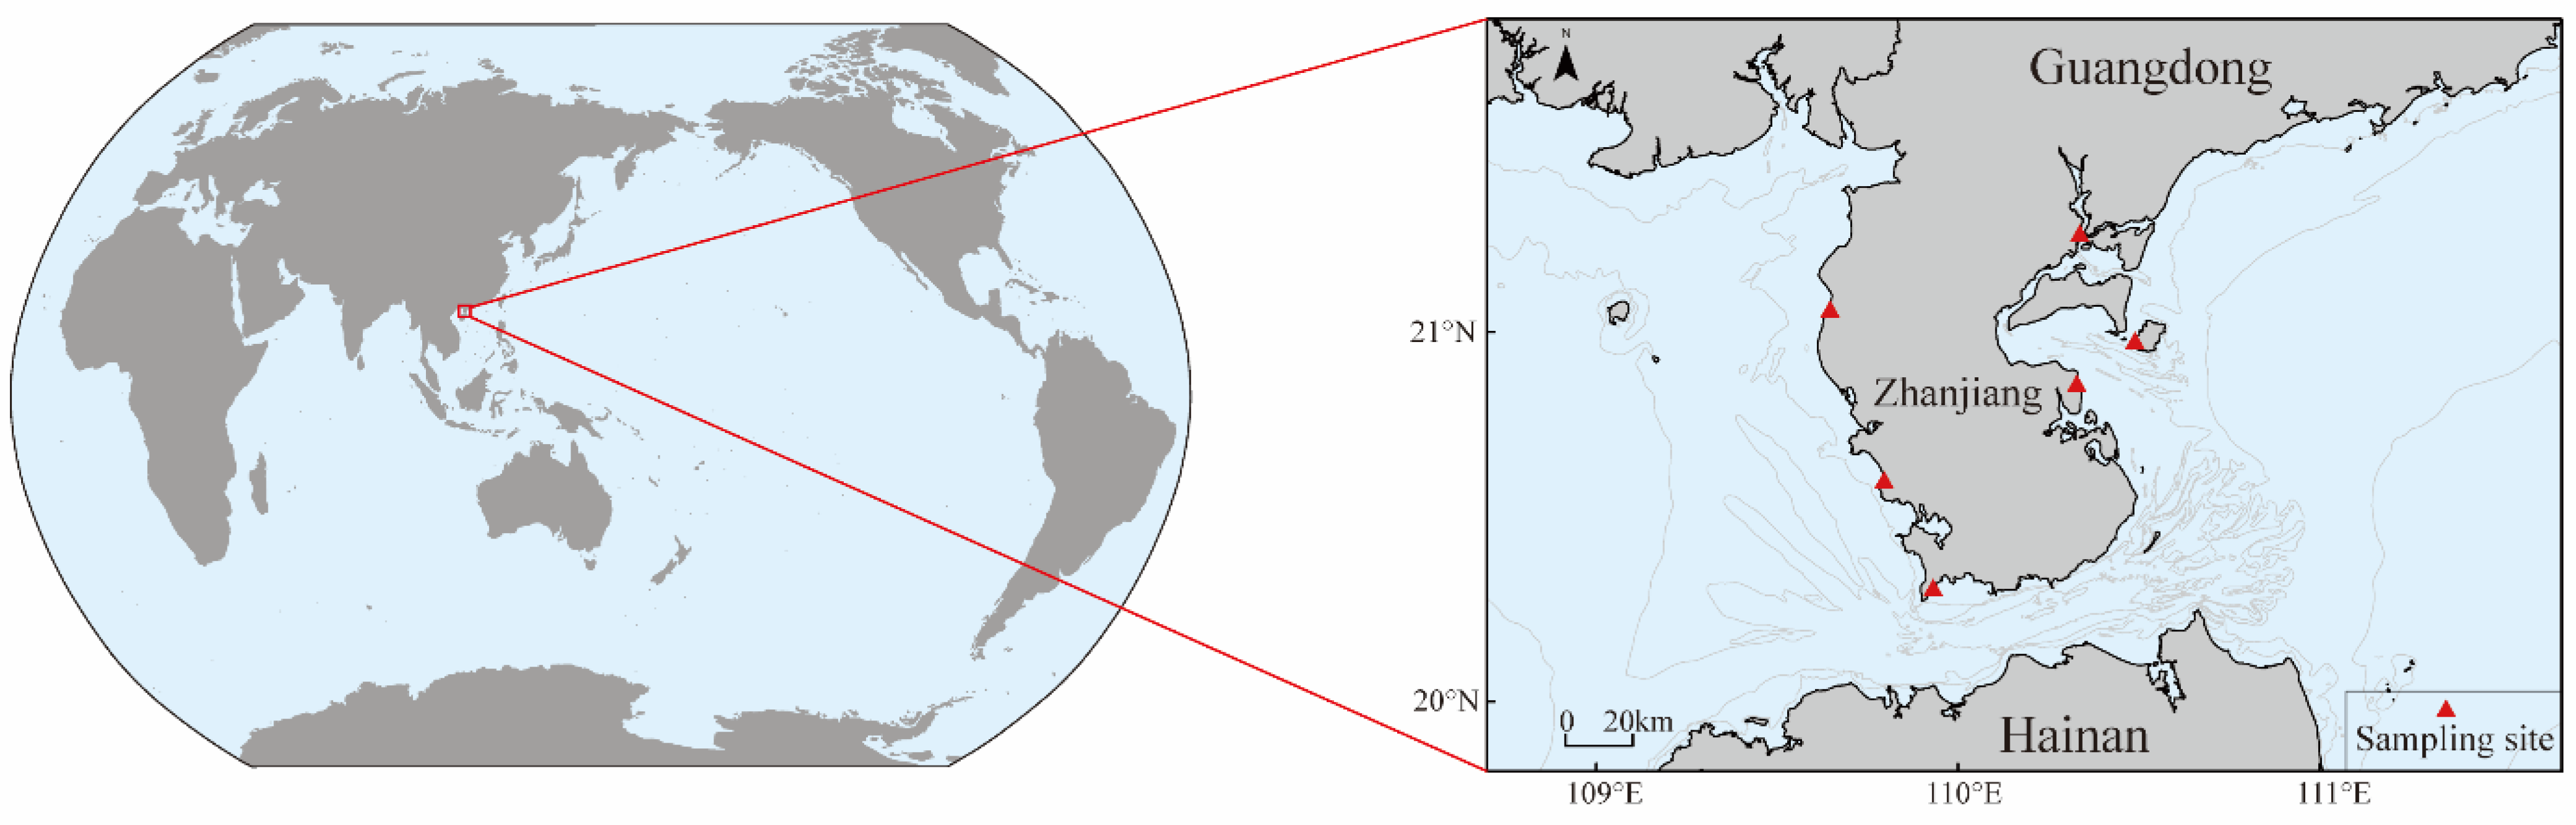
2.1. Study Area and Sampling

Black sea bream (Acanthopagrus schlegelii) samples were collected from various fish markets in Zhanjiang between January 2019 and October 2021 (Figure 1). Fishermen used a variety of fishing gear, such as gill nets, longlines, and trawls, each potentially targeting different size classes of fish. Fish were sourced from a wide range of market locations, ensuring a more comprehensive and representative sample. The collected samples were placed on ice to maintain freshness and transported to the laboratory for thorough examination. A total of 1543 individual fish were used in this study. Each individual’s total length (TL) and body weight were precisely measured using digital calipers and an electronic scale, with measurements recorded to the nearest 0.01 mm or cm and 0.01 g, respectively. The data were sorted by sex, and the maturity levels of 262 randomly selected individuals were determined through a macroscopic examination of their gonads. Gonads in stage I (immature) were small and translucent, while in stage II (developing), they began to enlarge. In stages III to VI (mature), gonads showed progressive enlargement, with females containing visible eggs. Individuals in stages III to VI were classified as mature, and those in stages I and II as immature.

2.2. Assessment Models

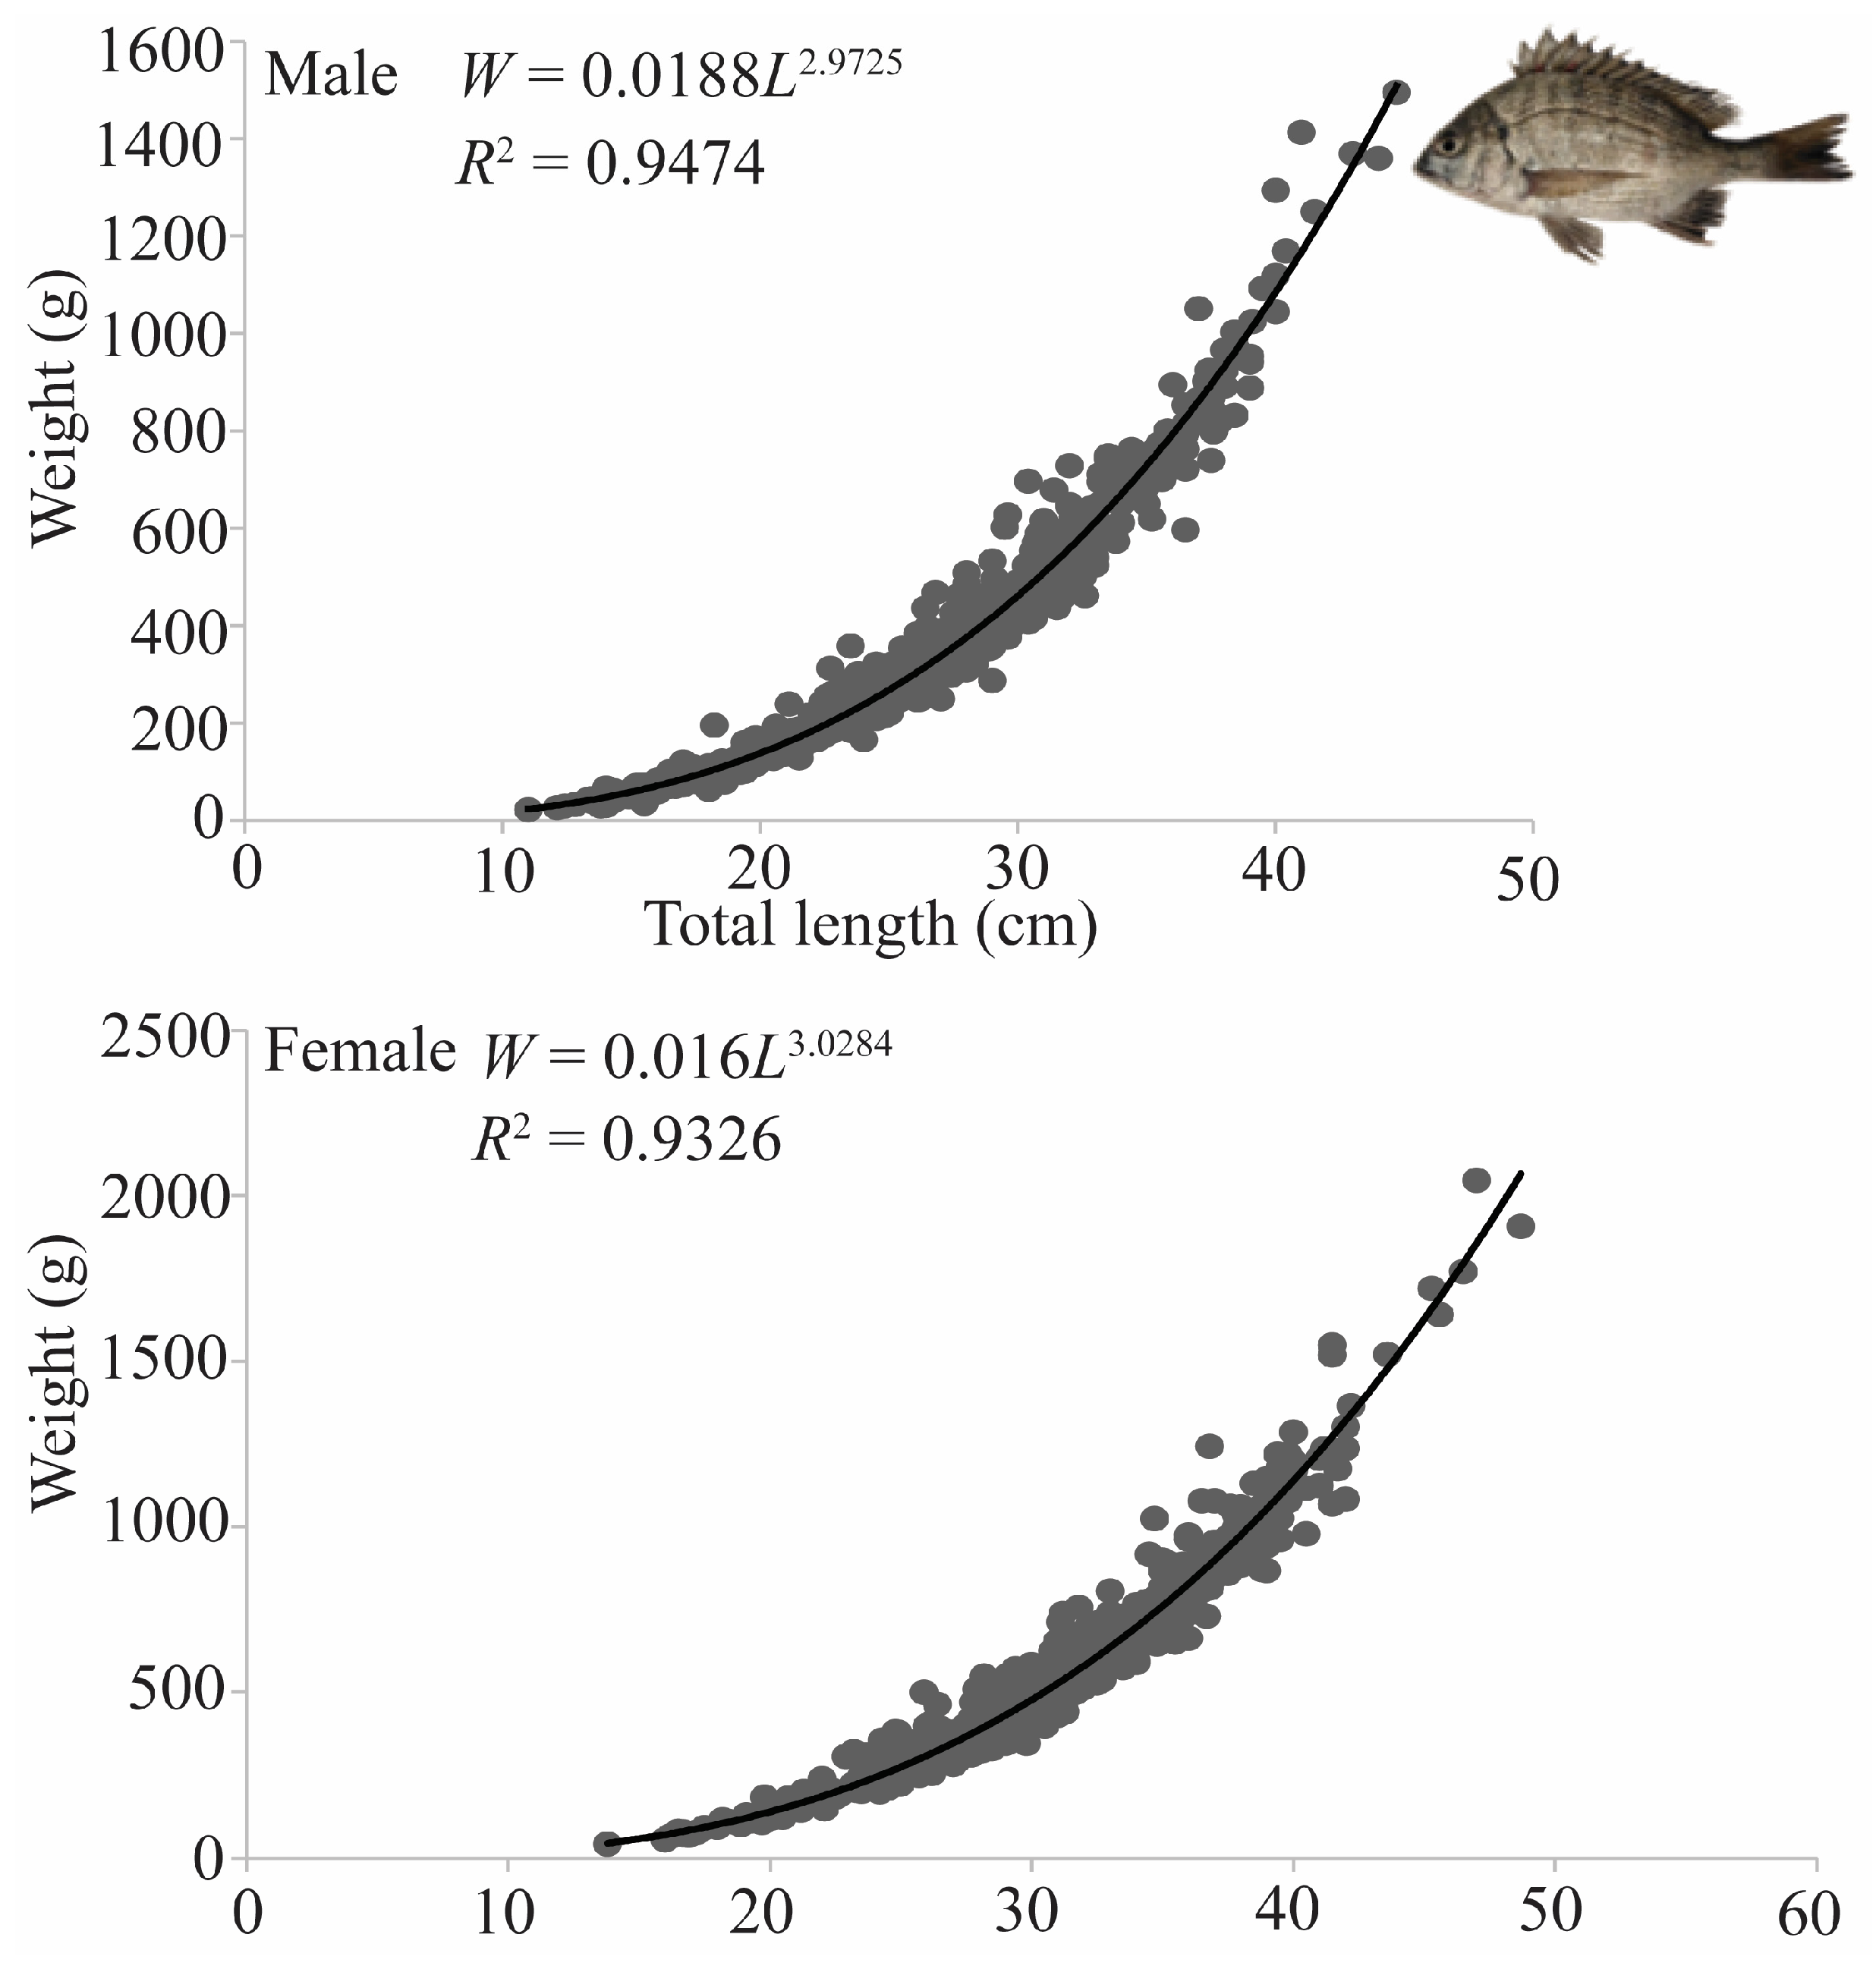
2.2.1. Length–Weight Relationship (LWR) Assessment

Fish health can be assessed through condition factors by performing LWR analyses. These factors include Fulton’s K (K1), Modified K (K2), and the Relative Condition K (Kn). A condition factor ≥1.0 signifies optimal health, whereas values below 1.0 suggest poorer health. During this assessment, the sex composition and growth patterns of the fish can also be determined, providing a comprehensive overview of the status of the population.

2.2.2. Length-Based Assessment Models: LBSPR and LBB

The LBSPR model uses information on the body length of female fish in a population to measure the reproductive potential of fish stock [11]. It measures the ratio of observed mature fish to the expected number of mature fish. The spawning potential ratio (SPR) assesses the impact of fishing on a species by using two key life-history ratios [12,13,14]:
i.
L50/L∞: The ratio of L50 (the species maturity size (mm) when 50% of the population matures) to its L∞ (the asymptotic length (mm));
ii.
M/K: The ratio of M (natural mortality rate (year−1)) to K (growth rate towards L∞ (year−1)).
The model provides estimates of SPR, net selectivity (SL50 and SL95), and fishing mortality to natural mortality ratio (F/M). SPR values 0.2 and 0.4 are the limit reference point (LRP) and target, respectively. An F/M ratio of ≤1.0 suggests sustainable fishing. Net selectivity estimates are compared to maturity size estimates to check for unsustainable fishing practices [11].
The LBB method uses a Bayesian Monte Carlo Markov Chain (MCMC) to calculate mortality parameters and the relative stock size. It can be applied when only length frequency data are available, even if L∞, Lm, and M/K ratios are unknown. The model is useful for species with continuous growth throughout their lives, as observed in the present study. By applying the established procedures and fishery equations [15], the model estimates key population metrics, including the following:
i.
B/B0: Current biomass relative to unexploited biomass;
ii.
B/BMSY: A proxy for biomass that can produce the maximum sustainable yield;
iii.
Size distribution and maturity of the population.
Using the F/M ratio calculated by the model, fishing mortality (F) and exploitation rate (E) can be estimated [16]. To maintain a sustainable stock status, B/BMSY should be >1.0, and F/M should be ≤1.0 [17]. For size composition, the ratios Lmean/Lopt, L95th/L∞, and Lc/Lc_opt should be approaching or equal to 1.0, indicating the presence of large individuals in the population [15].

2.3. Data Analysis

2.3.1. LWR

The length–weight relationship equation W = aLb was employed in this study, where W is the weight (g), L is the length (cm), a is the intercept indicating the weight change with length, and b is the growth parameter. Parameter b distinguishes between isometric growth (b = 3) and allometric growth (b < 3 for negative allometric growth and b > 3 for positive allometric growth) (Figure 2) [18]. Fish length–weight data were the primary inputs from which the secondary inputs (a and b) were derived. A two-tailed independent t-test was conducted at a significance level of p (0.05) to assess differences in the means of length and weight between male and female specimens. A p-value < 0.05 indicated significant differences between the two groups. Fish conditions were subsequently evaluated using Fulton’s (K1 = 100 × W/L3), modified (K2 = 100 × W/Lb), and relative (Kn = W/aLb) condition factors (Table 1). All LWR analyses were performed in Microsoft Excel 2019, except for the two-tailed independent t-test, which was conducted in R version 4.3.3.

2.3.2. LBSPR and LBB

To analyze the population of A. schlegelii using the LBSPR and LBB models, we needed the following key biological parameters: asymptotic length (L∞), growth rate (K), natural mortality (M), and size at maturity (Lm). We estimated L∞ and K from length-frequency data using FiSAT II software, version 1.2.2 [19]. In FiSAT II, these parameters are derived using the Von Bertalanffy Growth Function (VBGF), which is expressed as Lt = L∞ (1 − exp (−kt (t − t0))) [20], where Lt is the length at age t, and t0 is the theoretical age at length zero.
The natural mortality (M) of A. schlegelii was determined by averaging the estimates from the following six empirical formulas:
Log (M) = −0.0066–0.279 log (L∞) + 0.6543 log (K) + 0.4634 log (T)
M = 1.5K
M = 4.118 × K0.73 × L∞0.33
M = 4.899 × Amax−0.916
M = e1.46–1.01 × ln Amax
M = e1.44–0.98 × ln Amax
The corresponding references for these equations are [21] for (1), [22] for (2), [23] for (3) and (4), and [24] and [25] for (5) and (6), respectively.
Here, T is the average sea surface temperature of the study area (27 °C), and Amax is the maximum reported age of the species, which is 9 years [26].
To determine the maturity size of individuals, we performed a logistic regression analysis using R software, version 4.3.3. This analysis provided estimates for the sizes at which 50% (L50) and 95% (L95) of the individuals reached maturity (Figure 3).
We calculated LBSPR and LBB using length-frequency data and the inputs in Table 2. LBSPR analyses were performed using R code from https://cran.r-project.org/web/packages/LBSPR (accessed on 24 May 2024). For the LBB analyses, we followed user guidelines and used the R code from http://oceanrep.geomar.de/44832/ (accessed on 30 May 2024). Model estimates were calculated using 95% confidence intervals.

3. Results

3.1. Length–Weight-Based (LWR) Estimates

From the length–weight estimates of A. schlegelii (Figure 2), we found that males (n = 677) showed negative allometric growth (b = 2.97), whereas females (n = 657) showed positive allometric growth (b = 3.03). The length–weight relationships were W = 0.0188L2.9725 and W = 0.016L3.0284 for male and female individuals, respectively. A two-tailed independent t-test revealed significant differences between males and females in both total length and weight. The mean total length for females (29.84 cm) was significantly greater than for males (25.85 cm) (t = 12.21, df = 1327, 95% CI [3.35, 4.63], p < 2.2 × 10⁻¹⁶). Similarly, the mean weight for females (524.67 g) was significantly higher than for males (348.83 g) (t = 11.76, df = 1242.1, 95% CI [146.51, 205.18], p < 2.2 × 10⁻¹⁶). These results indicate strong sexual dimorphism in Acanthopagrus schlegelii, with females being both longer and heavier than males.
Additionally, the well-being of A. schlegelii is supported by the estimates of Fulton’s modified and relative condition factors, as shown in Table 1.

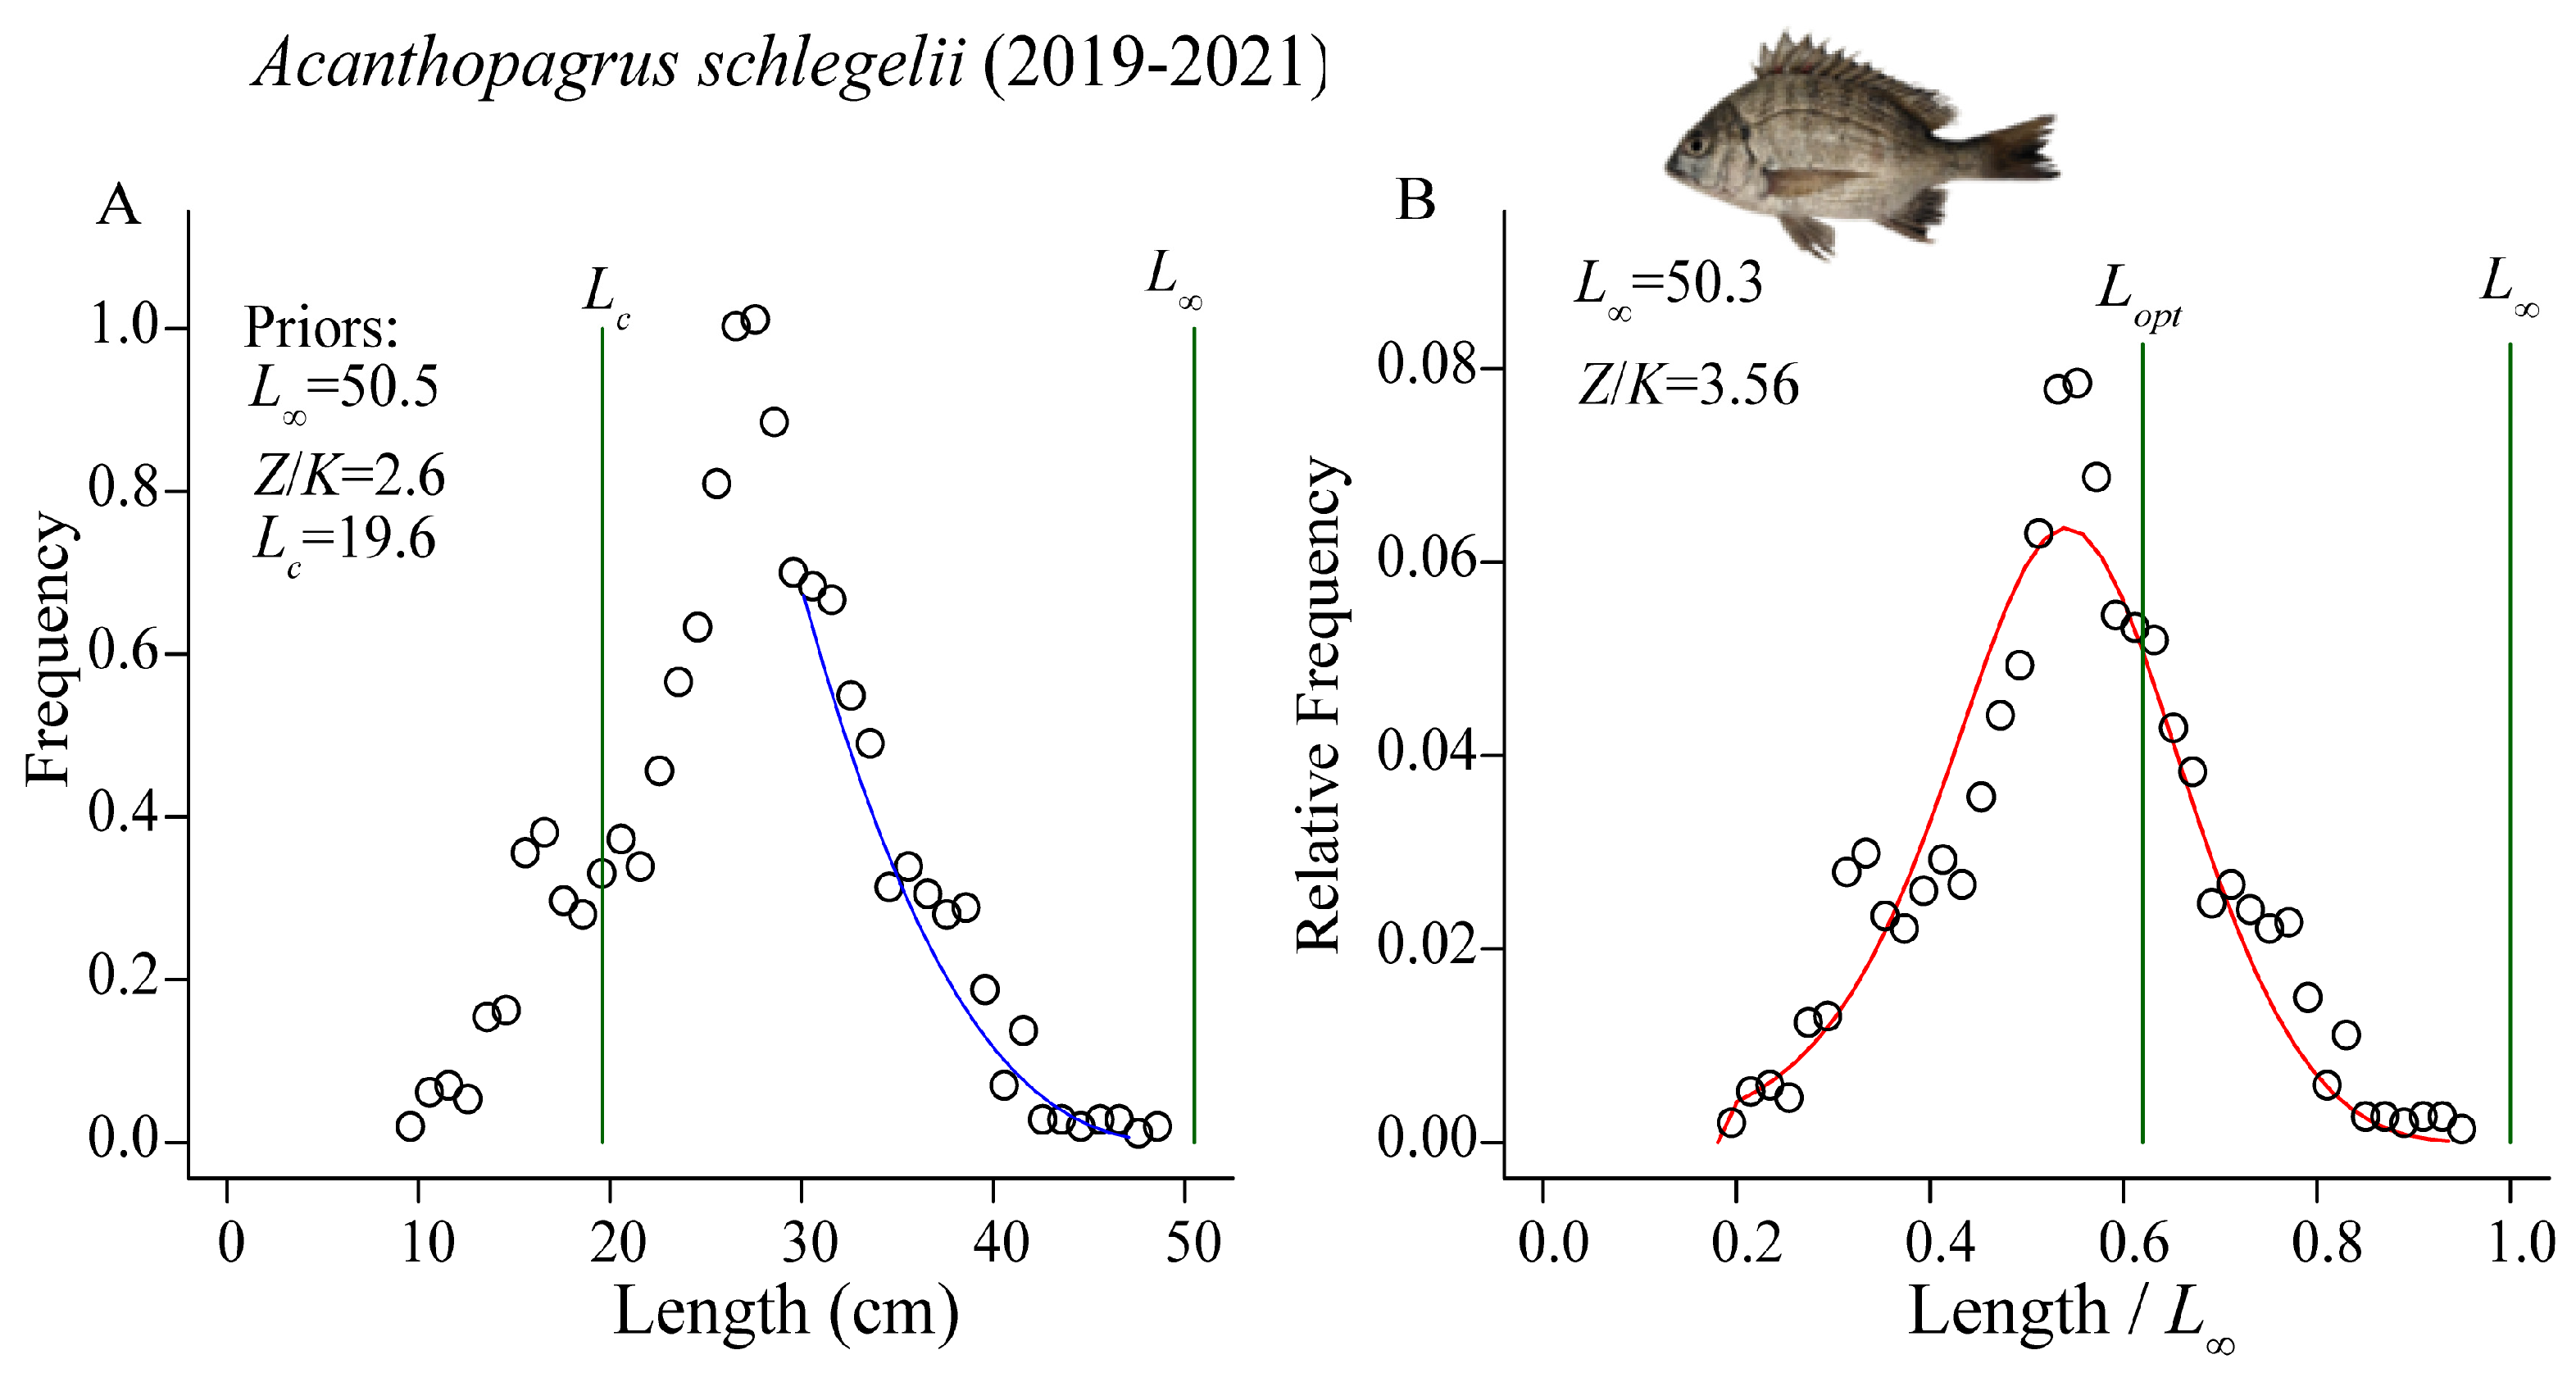
3.2. Length-Based Estimates

3.2.1. Model’s Inputs

The estimated von Bertalanffy growth parameters were L∞ = 505.05 mm and K = 0.26 year−1. The natural mortality (M) was determined to be 0.46 year−1, based on the average of six estimates from the empirical formulas: 0.33, 0.39, 0.42, 0.65, 0.47, and 0.49 year−1, respectively. The sizes at which 50% (L50) and 95% (L95) of the population were mature were estimated to be 250 and 400 mm, respectively (Figure 3). These estimates served as inputs for LBSPR and LBB analyses (Table 2). The sensitivity analyses of the models were conducted by varying each M calculated from the empirical formulas and adjusting L∞ by ±10%.

3.2.2. LBSPR Estimates

Analysis of the size composition of A. schlegelii (Figure 4A) using LBSPR showed an SPR of 0.21 (0.17–0.25), which was slightly above the reference limit of 0.2, indicating the species’ sustainability. The net selectivity estimates were SL50 = 220.63 mm (208.44–232.82) and SL95 = 290.76 mm (270.82–310.7). These values, along with the maturity sizes (L50 and L95 in Figure 3), suggest the use of diverse fishing nets, including those with small mesh sizes. The results also showed that some fish were caught before reaching maturity (Figure 4B). Moreover, the F/M estimate of 1.68 (1.28–2.08) suggests high fishing pressure on the population. Figure 4C illustrates the current size composition at an SPR of 0.21 and the predictions at the target SPR level of 0.4.

3.2.3. LBB Estimates

The results of the LBB analysis of A. schlegelii are shown in Figure 5. M/K was calculated to be 1.84 (1.72–1.93), with an asymptotic length (L∞) of 50.3 cm (49.6–51 cm). Additionally, the length at which 50% of the fish are retained by the gear (Lc) was determined to be 26.5 cm. The length at which the unexploited cohort would have maximum biomass (Lopt) was estimated to be 31 cm. Furthermore, the Lc value that would make Lopt the average length in the catch (Lc_opt) was determined to be 26 cm. The ratios Lmean/Lopt (1), L95th/L∞ (0.94), and Lc/Lc_opt (1) indicate the presence of large individuals in the population. With an estimated F/M of 0.94 and M of 0.46 year−1, the fishing pressure (F) and exploitation ratio (E) were determined to be 0.44 and 0.48, respectively. According to Gulland’s criteria [27], E ≤ 0.5 indicates sustainable fishing pressure, a condition met in this study. The observed B/B0 = 0.37 (0.253–0.473) and B/BMSY = 1.1 (0.718–1.34) further suggest a rebuilding population of A. schlegelii.

3.2.4. Model’s Sensitivity Analysis

The tested parameters and input estimates in Table 3 were applied to both LBSPR and LBB methods. The model sensitivity results for LBSPR showed an increase in SPR with L∞ −10% (0.34 SPR) and M4–6 (0.37, 0.21, and 0.22 SPR, respectively). Low SPR values were observed with the L∞ +10% (0.13 SPR) and M1–3 (0.12, 0.15, and 0.17 SPR, respectively). Similar trends were observed for LBB, where B/BMSY and B/B0 indicated a sustainable stock with L∞ −10%, and for M4–6 (Table 3). The unsustainable levels estimated by both LBSPR and LBB suggest that the catchable size of the species should be increased to boost their reproductive potential and stock biomass.

4. Discussion

4.1. Comparing Growth Parameters

Effective fishery management relies on comprehensive stock assessment processes. These assessments are crucial for developing and implementing suitable management strategies to ensure sustainable exploitation of fishery resources. This study used the length and weight data of A. schlegelii to evaluate its stock status and predict its prospects. Our model inputs and literature reveal that A. schlegelii in the Northern South China Sea typically grows to lengths below 550 mm. The species growth coefficient (K) ranges between 0.15 and 0.26 (year−1). The L∞ estimates for Japan are lower than those for China and Hong Kong, whereas Japan has a higher K value than China and Hong Kong (Table 4). Additionally, our analysis revealed that 50% of the A. schlegelii population matures at 250 mm. The discrepancies observed could be attributed to varying species management strategies implemented across different regions. For instance, strict size limits can prevent the capture of juveniles, allowing fish to grow larger before harvest, resulting in higher L∞ values. In contrast, regions with fewer size restrictions may see smaller maximum sizes. Seasonal closures and no-take zones can reduce fishing pressure during critical growth periods, promoting larger sizes and influencing both L∞ and K values. On the other hand, regions with higher fishing pressure may experience faster growth rates (higher K values) as fish prioritize early reproduction in response to increased mortality risks, leading to shorter life spans and lower maximum sizes. Nevertheless, our findings indicate that the population in our study area may be thriving under more favorable conditions for growth compared to other regions.

4.2. Length–Weight-Based Assessment of Stocking Ground Potential

Black sea bream (Acanthopagrus schlegelii) is known for its protandrous life cycle, wherein male organs develop earlier than female organs, leading to a sex composition typically dominated by one sex at different life stages [29]. This characteristic plays a significant role in the growth patterns of the species and is reflected in the allometric growth patterns observed in this study (Figure 2). Factors such as sex development, sampling methods, and fish physiology significantly influence growth patterns [30]. The length–weight analysis showed that males exhibited negative allometric growth, whereas females displayed positive allometric growth. This divergence is expected, given the species’ life cycle and the physiological demands associated with sex change and reproduction. The well-being of A. schlegelii, as indicated by the condition factors (Fulton’s, modified, and relative condition factors in Table 1), suggests that the species thrives in its current environment. Good condition factors reflect favorable environmental conditions, such as stable hydrological conditions and nutrient-rich habitats [31]. These factors are essential for the successful establishment and growth of fish populations, particularly in hatchery release programs. The positive well-being of A. schlegelii implies that the study area provides an environment conducive to its survival and growth, indicating that the habitat supports the biological requirements of the species [32]. Healthy habitats are crucial for the success of hatchery release programs. Habitat degradation, pollution, and other anthropogenic factors can severely limit the ability of the released individuals to establish viable populations. The findings of this study suggest that the study area has the potential for successful hatchery releases, as evidenced by the good condition factors of black sea bream. This relationship between good well-being and favorable habitats underscores the progress made in the management of black sea bream stocks in the area [33]. Efforts to improve and protect habitats are essential for the long-term success of hatchery release programs. Providing healthy environments for released individuals can increase their chances of survival and successful reproduction. These findings highlight the importance of considering habitat quality when planning and implementing hatchery release programs, as it can determine their effectiveness in restoring threatened species populations. It is crucial to continue monitoring and protecting habitats to support the ongoing success of these conservation efforts.

4.3. Length-Based Assessment of Stock Status

Length-based assessments using the LBSPR and LBB methods provide insights into the progress made in rebuilding the black sea bream (Acanthopagrus schlegelii) population and highlight areas requiring further management intervention. The LBSPR analysis (Figure 4) reveals a current Spawning Potential Ratio (SPR) of 0.21, indicating that the population is in a rebuilding phase following its significant decline in the 1980s [10]. This SPR level represents a notable improvement from the past, reflecting positive outcomes from stock enhancement efforts. However, the SPR is only marginally above the limit reference point of 0.2, suggesting that while some reproductive potential is preserved, it remains relatively low. The net selectivity estimates, with SL50 at 220.63 mm and SL95 at 290.76 mm, are below the size at maturity (L50 = 250 mm and L95 = 400 mm), pointing to growth overfishing where juvenile fish are predominantly targeted [12]. Additionally, the F/M ratio of 1.68 indicates that current fishing practices may undermine reproductive potential, increasing vulnerability to recruitment overfishing. The absence of “mega-spawners” could also affect genetic diversity and overall population health [1,34]. These estimates suggest that fishing practices may need to be adjusted to ensure that older, more reproductive individuals are available.
The LBB analysis (Figure 5) shows clear signs of stock rebuilding. With a B/B0 ratio of 0.37, the population has recovered to 37% of its original biomass, and a B/BMSY ratio of 1.1 indicates that the current biomass slightly exceeds the level required for maximum sustainable yield (MSY). These results underscore the effectiveness of hatchery releases, which have played a crucial role in replenishing the stock. Despite this progress, the exploitation ratio (E) of 0.48 and the F/M ratio of 0.94 suggest that fishing levels are nearing unsustainable thresholds. This highlights the importance of continued adaptive management to balance exploitation rates and ensure long-term sustainability [35].
The study shows that black sea bream can self-replenish, supporting stock enhancement goals to augment the natural supply of declining fish stocks [36]. Although positive trends in SPR and biomass indicators point to successful stock enhancement efforts, improved management practices are crucial. Addressing current challenges could lead to more sustainable black sea bream stock levels [11,15,17]. Growth overfishing is a major issue where juveniles are caught before they can reproduce adequately. F/M and net selectivity estimates further reveal that current fishing methods may decrease the reproductive output of populations. Moreover, these practices may reduce the number of individuals crucial for maintaining genetic diversity and overall population health [1]. Meanwhile, the SPR’s current estimate suggests that additional management approaches are necessary to enhance the stock to the preferred management target (≥0.4), as shown in Figure 4C. Additionally, B/B0 and B/BMSY need to increase to ≥0.4 and >1.1, respectively, to accommodate the increasing demands. Management strategies should focus on delaying harvesting until the species reaches maturity, enabling them to grow into larger individuals [37].
Several strategies can be applied to ensure the long-term sustainability of black sea bream populations. One key method involves managing fishing activities by designating specific areas and regulating fishing practices. This includes zoning regulations, seasonal openings and closures, setting fishing quotas, and monitoring boat operations to control catch levels. Additionally, species- and size-specific gear like cod-end mesh nets, which let small and non-target fish escape, should be used [38,39,40]. These practices also ensure spawning, nursery grounds, and dispersion centers for larval supply [41,42]. Community-based management (CBM) approaches can further enhance compliance and enforcement. CBM fosters a sense of ownership and easier identification of illegal activities. By integrating traditional knowledge and holding seminars on scientific principles, communities can be empowered to follow sustainable practices and support the conservation of black sea bream populations [11,43]. In addition, conducting regular stock assessments and research on black sea bream populations can provide valuable data to inform management decisions and ensure effective conservation efforts. By continuously monitoring population trends and adjusting management strategies as needed, we can work towards achieving long-term sustainability for black sea bream populations.

4.4. Hatchery Releases and Population Rebuilding of Black Sea Bream

LWR, LBB, and LBSPR models indicate a positive shift in the stock status of Acanthopagrus schlegelii. However, determining the exact factors driving this recovery remains challenging. Since the 1980s, hatchery releases have been the main management response to the species’ decline. The lack of detailed stocking rate data complicates quantifying their precise impact. These models are advantageous in this analysis, as they provide insights into stock status despite limited data on the effectiveness of hatchery releases. Population trends, supported by the models, suggest that large-scale stocking efforts, such as the release of over 70 million black sea breams in 2017 [44], have contributed to the recovery. This study offers important clues about the stock status and highlights the influence of ongoing stocking initiatives backed by the Chinese government [9]. Further research is needed to fully understand the effectiveness of hatchery releases and other management strategies. Factors like environmental changes, fishing pressure, and habitat degradation may also affect the stock status of A. schlegelii. Combining the insights from LWR, LBB, and LBSPR models with additional data on these factors will help develop more comprehensive management plans.

4.5. Parameters Uncertainty on Stock Status Estimates

Section 3.2.4 presents the sensitivity analysis results on the stock status of A. schlegelii in data-limited models (LBSPR and LBB). This analysis underscores how variations in assumptions regarding growth (L∞) and natural mortality (M) can markedly influence stock status estimates. Minor deviations in L∞ or M can lead to substantial variations in critical stock status indicators, including SPR, B/B0, B/BMSY, and F/M. For instance, underestimating natural mortality or overestimating growth rates may result in overly optimistic evaluations of stock recovery, whereas the reverse could lead to overly conservative management strategies. These findings emphasize the importance of acknowledging the uncertainties inherent in parameter estimates. Accurate interpretation of stock rebuilding and overfishing risks relies on a nuanced understanding of these uncertainties. Generally, the analysis suggests that adjusting the catchable size to boost reproductive potential and biomass is a crucial management strategy. However, the highlighted uncertainties call for an adaptive management approach, which includes regularly updating stock assessments and refining biological parameter estimates with new data. While hatchery releases have likely played a role in stock recovery, their effectiveness should be integrated with robust fishing regulations, habitat improvements, and a thorough comprehension of natural variability to ensure the long-term sustainability of A. schlegelii.

5. Conclusions

Despite the challenge of obtaining sufficient data to investigate the potential impact of hatchery releases on wild populations, the LWR and L-B methodologies utilized in this study effectively evaluated the progress in managing hatchery-released stocks. Our findings indicate that the black sea bream stock, which has been under Chinese hatchery releases since 1980 and has been declining, is now showing positive progress and is rebuilding sustainably. Stock estimates suggest the potential for self-replenishment to more sustainable levels with the implementation of sustainable fishing practices. However, fishing practices targeting juvenile fish pose significant risks due to growth overfishing. To promote sustainability, management strategies should prioritize delaying harvesting and increasing catch size to allow the fish to mature and spawn at least once. By adopting a holistic approach that integrates stock enhancement with responsible fisheries management, the long-term health and sustainability of the Acanthopagrus schlegelii population can be secured.

Author Contributions

Conceptualization and preparation of the original draft, H.N.L.; Fieldwork and experiments, data curation, and resources, X.X., S.L., A.A. and K.L.; Reviewing and editing, S.Z. and N.C.; Supervision, reviewing and editing, and funding acquisition, X.W. All authors have read and agreed to the published version of the manuscript.

Funding

This work was financially supported by Sino-Indonesian technical cooperation in coastal marine ranching, the Asian Cooperation Fund Program (12500101200021002), the program for scientific research start-up funds of Guangdong Ocean University (060302022301; 060302022302), and the College Student Innovation Team Project of Guangdong Ocean University (CCTD201803).

Institutional Review Board Statement

All experiments were conducted following the guidelines and approval of the Animal Research and Ethics Committee of the Guangdong Ocean University (Zhanjiang, China) GDOU-IACUC-2019-A1653 (16 January 2019).

Informed Consent Statement

Not applicable.

Data Availability Statement

All data are available upon request from the corresponding author.

Acknowledgments

The authors thank an anonymous reviewer whose comments and suggestions greatly improved the manuscript.

Conflicts of Interest

The authors declare no competing interests.

References

  1. Froese, R. Keep it simple: Three indicators to deal with overfishing. Fish Fish. 2004, 5, 86–91. [Google Scholar] [CrossRef]
  2. Liao, I.; Su, M.S.; Leano, E.M. Status of research in stock enhancement and sea ranching. Rev. Fish Biol. Fish. 2003, 13, 151–163. [Google Scholar] [CrossRef]
  3. Svåsand, T.; Agnalt, A.L.; Skilbrei, O.T.; Borthen, J.; Heggberget, T. An integrated development programme for marine stocking: The Norwegian example. FAO Fish. Tech. Pap. 2004, 429, 19–72. [Google Scholar]
  4. Leber, K.M. Rationale for an Experimental Approach to Stock Enhancement. In Readings in Stock Enhancement and Sea Ranching; Howell, B.R., Moksness, E., Svåsand, T., Eds.; Blackwell Science Ltd.: Oxford, UK, 1999; pp. 63–75. [Google Scholar]
  5. Svåsand, T.; Kristiansen, T.S.; Pedersen, T.; Salvanes, A.G.V.; Engelsen, R.; Naevdal, G.; Nødtvedt, M. The enhancement of cod stocks. Fish Fish. 2000, 1, 173–205. [Google Scholar] [CrossRef]
  6. Mustafa, S.; Saad, S.; Rahman, R.A. Species studies in sea ranching: An overview and economic perspectives. Rev. Fish Biol. Fish. 2003, 13, 165–175. [Google Scholar] [CrossRef]
  7. Crowe, T.P.; Lee, C.L.; McGuinness, K.A.; Amos, M.J.; Dangeubun, J.; Dwiono, S.A.P.; Makatipu, P.C.; Manuputty, J.; N’guyen, F.; Pakoa, K.; et al. Experimental evaluation of the use of hatchery-reared juveniles to enhance stocks of the topshell Trochus niloticus in Australia, Indonesia and Vanuatu. Aquaculture 2002, 206, 175–197. [Google Scholar] [CrossRef]
  8. Lorenzen, K.; Leber, K.M.; Blankenship, H.L. Responsible Approach to Marine Stock Enhancement: An Update. Rev. Fish. Sci. 2010, 18, 189–210. [Google Scholar] [CrossRef]
  9. Tang, Q.S. Study on the Strategy of Fishery Resources Enhancement in China’s Exclusive Economic Zone; Ocean Press: Beijing, China, 2019; 339p. (In Chinese) [Google Scholar]
  10. Zhong, X.M.; Ni, J.D.; Tang, J.H. Artificial reproduction and stock enhancement of Acanthopagrus schlegelii. Aquaculture 1998, 5, 28–29. (In Chinese) [Google Scholar]
  11. Prince, J.; Creech, S.; Madduppa, H.; Hordyk, A. Length based assessment of spawning potential ratio in data-poor fisheries for blue swimming crab (Portunus spp.) in Sri Lanka and Indonesia: Implications for sustainable management. Reg. Stud. Mar. Sci. 2020, 36, 101309. [Google Scholar] [CrossRef]
  12. Kindong, R.; Sarr, O.; Wu, F.; Tian, S. Length-Based Assessment Methods for the Conservation of a Pelagic Shark, Carcharhinus falciformis from the Tropical Pacific Ocean. Fishes 2022, 7, 184. [Google Scholar] [CrossRef]
  13. Petukhova, N.G. Preliminary Assessment of the Stock Status of Atlantic Bonito (Sarda sarda) in the Northeastern Part of the Atlantic Ocean. J. Ichthyol. 2020, 60, 101309. [Google Scholar] [CrossRef]
  14. Prince, J.; Wang, X.; Lin, K.; Suryanti, A.; Jamon, S.; Santos, M.D.; Torres, F.S.; Flores, N.A.L.; Ha, V.V.; Thi Ngoc Anh, T. Supporting regional co-operation in the South China Sea with an initial assessment of the data-limited skipjack tuna fishery. Mar. Policy. 2023, 155, 105711. [Google Scholar] [CrossRef]
  15. Froese, R.; Winker, H.; Coro, G.; Demirel, N.; Tsikliras, A.C.; Dimarchopoulou, D.; Scarcella, G.; Probst, W.N.; Dureuil, M.; Pauly, D. Original Article A new approach for estimating stock status from length frequency data. Ices J. Mar. Sci. 2018, 75, 2004–2015. [Google Scholar] [CrossRef]
  16. Zhang, K.; Zhang, J.; Zhang, P.; Su, L.; Hong, X.; Qiu, Y.; Chen, Z. This is what we know: Assessing the stock status of the data-poor skipjack tuna (Katsuwonus pelamis) fishery in the South China Sea. Front. Mar. Sci. 2023, 10, 1095411. [Google Scholar] [CrossRef]
  17. Palomares, M.L.D.; Froese, R.; Derrick, B.; Meeuwig, J.J.; Nöel, S.L.; Tsui, G.; Woroniak, J.; Zeller, D.; Pauly, D. Fishery biomass trends of exploited fish populations in marine ecoregions, climatic zones and ocean basins. Estuar. Coast. Shelf S. 2020, 243, 106896. [Google Scholar] [CrossRef]
  18. Nehemia, A.; Maganira, J.D.; Rumisha, C. Length-Weight relationship and condition factor of tilapia species grown in marine and fresh water ponds. Agric. Biol. J. N. Am. 2012, 3, 117–124. [Google Scholar] [CrossRef]
  19. Gayanilo, F.C., Jr.; Sparre, P.; Pauly, D. 2005: FAO-ICLARM Stock Assessment Tools II (FiSAT II); User’s Guide; FAO Computerized Information Series (Fisheries); No. 8, Revised Version; FAO: Rome, Italy; 168p.
  20. Beverton, R.J.H.; Holt, S.J. On the dynamics of exploited fish populations. Cal. Coop. Ocean Fish. 1957, 19, 1–533. [Google Scholar]
  21. Pauly, D. On the interrelationships between natural mortality, growth parameters, and mean environmental temperature in 175 fish stocks. Ices J. Mar. Sci. 1980, 39, 175–192. [Google Scholar] [CrossRef]
  22. Jensen, A.L. Beverton and Holt life history invariants result from optimal trade-off of reproduction and survival. Can. J. Fish. Aquat. Sci. 1996, 53, 820–822. [Google Scholar] [CrossRef]
  23. Then, A.Y.; Hoenig, J.M.; Hall, N.G.; Hewitt, D.A.; Jardim, H.E.E. Evaluating the predictive performance of empirical estimators of natural mortality rate using information on over 200 fish species. Ices J. Mar. Sci. 2015, 72, 82–92. [Google Scholar] [CrossRef]
  24. Hoenig, J.M. Empirical use of longevity data to estimate mortality rates. Fish B-NOAA 1983, 82, 898–903. [Google Scholar]
  25. Hewitt, D.A.; Hoenig, J.M. Comparison of two approaches for estimating natural mortality based on longevity. Fish B-NOAA 2005, 103, 433–437. [Google Scholar]
  26. Law, C.S.W.; Sadovy de Mitcheson, Y. Age and growth of black sea bream Acanthopagrus schlegelii (Sparidae) in Hong Kong and adjacent waters of the northern South China Sea. J. Fish Biol. 2018, 93, 382–390. [Google Scholar] [CrossRef] [PubMed]
  27. Gulland, J.A. The Fish Resources of the Oceans West By Fleet, Surrey News; FAO Ltd.: Rome, Italy, 1971; 255p. [Google Scholar]
  28. Zhang, S.; Lin, L.; Wang, X. Optimization of a Marine Fish Release Strategy: A Case Study of Black Sea Bream Acanthopagrus schlegelii in the Zhanjiang Estuary, Northern South China Sea. Front. Env. Sci-Switz. 2021, 9, 779544. [Google Scholar] [CrossRef]
  29. Yamashita, H.; Katayama, S.; Komiya, T. Age and Growth of Black Sea Bream Acanthopagrus schlegelii (Bleeker 1854) in Tokyo Bay. Asian Fish. Sci. 2015, 28, 47–59. [Google Scholar] [CrossRef]
  30. Pitcher, T.J. A bumpy old road: Size-base methods in fisheries assessment. In Readings in Handbook of Fish Biology and Fisheries; Hart, P.J.B., Reynolds, J.D., Eds.; Blackwell Publishing: Oxford, UK, 2002; pp. 189–210. [Google Scholar]
  31. Lo, K.C.; Teng, S.Y.; Wang, Y.C.; Lee, M.A.; Lin, J.L.; Lu, T.H.; Huang, I.L. Resource structure of an artisanal gillnet fishery in the coastal water of Tamsui, Taiwan. J. Fish. Soc. Taiwan 2017, 44, 147–157. [Google Scholar]
  32. Teng, S.; Su, N.; Lee, M.; Lan, K.; Chang, Y.; Weng, J.; Wang, Y.; Sihombing, R.I.; Vayghan, A.H. Modeling the Habitat Distribution of Acanthopagrus schlegelii in the Coastal Waters of the Eastern Taiwan Strait Using MAXENT with Fishery and Remote Sensing Data. J. Mar. Sci. Eng. 2021, 9, 1442. [Google Scholar] [CrossRef]
  33. Bohorquez, J.J.; Xue, G.; Frankstone, T.; Grima, M.M.; Kleinhaus, K.; Zhao, Y.; Pikitch, E.K. China’s little-known efforts to protect its marine ecosystems safeguard some habitats but omit others. Sci. Adv. 2021, 7, eabj1569. [Google Scholar] [CrossRef]
  34. Zhang, K.; Geng, P.; Li, J.; Xu, Y.; Kalhoro, M.A.; Sun, M.; Shi, D.; Chen, Z. Influences of fisheries management measures on biological characteristics of threadfin bream (Nemipterus virgatus) in the Beibu Gulf, South China Sea. Acta Oceanol. Sin. 2022, 41, 24–33. [Google Scholar] [CrossRef]
  35. Hilborn, R.; Walters, C.J. Quantitative Fisheries Stock Assessment: Choice, Dynamics and Uncertainty; Chapman and Hall: New York, NY, USA, 1992. [Google Scholar]
  36. Bell, J.D.; Leber, K.M.; Blankenship, H.L.; Loneragan, N.R.; Masuda, R. A new era for restocking, stock enhancement and sea ranching of coastal fisheries resources. Rev. Fish. Sci. 2008, 16, 1–9. [Google Scholar] [CrossRef]
  37. Cochrane, K.L. A Fishery Manager’s Guidebook: Management Measures and Their Application; FAO Fisheries Technical Paper No. 424; FAO: Rome, Italy, 2002. [Google Scholar]
  38. Gatti, P.; Méhault, S.; Morandeau, F.; Morfin, M.; Robert, M. Reducing discards of demersal species using a 100 mm square mesh cylinder: Size selectivity and catch comparison analysis. Mar. Policy 2020, 116, 10. [Google Scholar] [CrossRef]
  39. Hordyk, A.R.; Loneragan, N.R.; Prince, J.D. An evaluation of an iterative harvest strategy for data-poor fisheries using the length-based spawning potential ratio assessment methodology. Fish. Res. 2015, 171, 20–32. [Google Scholar] [CrossRef]
  40. Sala, A.; Lucchetti, A. The effect of mesh configuration and codend circumference on selectivity in the Mediterranean trawl Nephrops fishery. Fish. Res. 2010, 103, 63–72. [Google Scholar] [CrossRef]
  41. Williamson, D.H.; Russ, G.R.; Ayling, A.M. No-take marine reserves increase abundance and biomass of reef fish on inshore fringing reefs of the Great Barrier Reef. Environ. Conserv. 2004, 31, 149–159. [Google Scholar] [CrossRef]
  42. Marcos, C.; Díaz, D.; Marcos, C.; Díaz, D.; Fietz, K.; Forcada, A.; Ford, A.; García-charton, J.A.; Goñi, R.; Lenfant, P.; et al. Reviewing the Ecosystem Services, Societal Goods, and Benefits of Marine Protected Areas. Front. Mar. Sci. 2021, 8, 613819. [Google Scholar] [CrossRef]
  43. Obiero, K.O.; Mboya, J.B.; Ouko, K.O.; Kembenya, E.M.; Nyauchi, E.A.; Munguti, J.M.; Outa, N.O.; Githukia, C.M. The role of indigenous knowledge in fisheries resource management for aquaculture development: A case study of the Kenyan Lake Victoria region. Aquac. Fish Fish. 2023, 3, 175–183. [Google Scholar] [CrossRef]
  44. Ministry of Agriculture and Rural Affairs of the People’s Republic of China; National Fisheries Technology Extension Center; China Society of Fisheries. China Fishery Statistical Yearbook; Agriculture Press: Beijing, China, 2018.
Figure 1. Map showing sampling locations of landings from Zhanjiang coastal waters.
Fishes 09 00381 g001
Figure 2. Length–weight relationship of A. schlegelii from Zhanjiang coastal waters.
Fishes 09 00381 g002
Figure 3. Estimates of the maturity size of A. schlegelii.
Fishes 09 00381 g003
Figure 4. LBSPR estimates of A. Schlegelii from Zhanjiang coastal waters. (A) Size composition of the sample fitted by the LBSPR curve, (B) plot of selectivity curve relative to the curve of size at maturity, (C) sample length-frequency composition and expected size composition at the SPR target (0.4).
Fishes 09 00381 g004
Figure 5. LBB estimates of A. schlegelii from Zhanjiang coastal waters. (A) panel: the model fitted to the length data; (B) panel: predictions made by the LBB analysis. L∞, Lc, and Lopt are as described above.
Fishes 09 00381 g005
Table 1. Health condition of A. schlegelii in Zhanjiang coastal waters.
Condition FactorsFulton’s (K1)Modified (K2)Relative (Kn)Status
Male1.7465941.9081121.017663Healthy
Female1.7808931.6180291.009686Healthy
Table 2. The LBSPR and LBB inputs.
ParametersL∞ (mm)C.VL∞M/KL50 (mm)L95 (mm)
Estimations505.050.11.77250400
Input for LBSPR and LBB1/211/21/21
C.VL∞: coefficient of variation of the asymptotic length (L∞); 1: input for LBSPR analysis only; 1/2: input for both LBSPR and LBB.
Table 3. LBB sensitivity analysis results.
Parameter TestedInput EstimatesB/B0B/BMSY
L∞ −10%454.55 mm0.72 (0.206–1.22)2 (0.585–3.46)
L∞ +10%555.56 mm0.2 (0.166–0.256)0.58 (0.47–0.727)
M1 = 0.33 year−11.27 M/K0.22 (0.166–0.29)0.6 (0.447–0.781)
M2 = 0.39 year−11.5 M/K0.28 (0.195–0.373)0.77 (0.538–1.03)
M3 = 0.42 year−11.62 M/K0.33 (0.232–0.417)0.92 (0.649–1.17)
M4 = 0.65 year−12.5 M/K0.72 (0.142–1.21)2.2 (0.426–3.63)
M5 = 0.47 year−11.81 M/K0.4 (0.235–0.543)1.1 (0.672–1.55)
M6 = 0.49 year−11.88 M/K0.41 (0.227–0.567)1.2 (0.65–1.63)
Table 4. Growth parameters comparison of A. schlegelii.
ParameterL∞ (mm)K (year−1)LocationReference
1505.050.26ChinaThis study
2543.90.15China[28]
34370.22Hongkong[26]
44390.36Japan[29]
54070.51Japan[29]
Disclaimer/Publisher’s Note: The statements, opinions and data contained in all publications are solely those of the individual author(s) and contributor(s) and not of MDPI and/or the editor(s). MDPI and/or the editor(s) disclaim responsibility for any injury to people or property resulting from any ideas, methods, instructions or products referred to in the content.

