Article

Study on Fish Species Diversity in the Pingzhai Reservoir Based on Environmental DNA Technology

1
College of Animal Science, Guizhou University, Guiyang 550025, China
2
College of Oceanography, Beibu Gulf University, Qinzhou 535000, China
*
Author to whom correspondence should be addressed.
Fishes 2024, 9(10), 382; https://doi.org/10.3390/fishes9100382
Submission received: 6 August 2024 / Revised: 18 September 2024 / Accepted: 20 September 2024 / Published: 27 September 2024

Abstract

:
This study elucidated the composition and diversity characteristics of the main fish species in the Pingzhai Reservoir by collecting and analyzing environmental DNA (eDNA) samples from the reservoir and comparing them with data from traditional fishery resource surveys. The results showed that eDNA technology detected 43 fish species spanning 37 genera, 5 orders, and 11 families. Importantly, no significant difference in fish diversity was observed among the surveyed sites, and the potential of eDNA technology in studying fish diversity in the Pingzhai Reservoir was discussed. A total of 29 species distributed across 18 genera, 3 families, and 3 orders were captured using traditional resource surveys. Overall, 21 fish species were detected using both methods, constituting 48.8% of the total fish population. Cypriniformes were the most prominently detected order in both methods. Among all the fish species, the most abundant in the Pingzhai Reservoir were the free-range fish species Hypophthalmichthys molitrix and Hypophthalmichthys nobilis, which have the largest sequence abundance in the eDNA investigation, in addition to the detection of exotic species, such as Micropterus salmoides and Oreochromis niloticus. Compared with traditional investigation methods, eDNA technology offers several advantages, including high sensitivity, minimal ecological impact, superior data accuracy, and low cost, making it suitable for fish diversity research in fishery resources investigations. This study enhances our understanding of fish diversity in the Pingzhai Reservoir and provides crucial basic information to support the ecosystem management and restoration efforts of the reservoir.
Key Contribution: Through eDNA sample collection and high-throughput sequencing analysis within the waters of the Pingzhai Reservoir, combined with data from traditional fishery resources survey data, this study explores the species composition and diversity characteristics of the main fish communities in the Pingzhai Reservoir. The study aimed to provide references for biodiversity monitoring and aquatic life protection within the reservoir.

1. Introduction

The freshwater ecosystem is integral to the global ecosystem, providing significant ecological and social benefits. The world is rich in freshwater fish species, with >10,000 species accounting for approximately 40% of the global fish total and 1/4th of the global vertebrates total [1,2,3]. Fish diversity is an important component of aquatic biodiversity and contributes significantly to the health and stability of aquatic ecosystems [4]. In recent years, climate change, habitat loss, biological invasions, overfishing, dam construction, water pollution, and invasive alien species have caused a notable decline in fish populations [5,6]. Therefore, conducting resource surveys to assess fish diversity is essential for understanding freshwater ecosystems and ensuring the sustainable use of resources. As the longest river in China, the Yangtze River stretches over 6300 km and encompasses a watershed area of 1.8 million km2. It hosts 416 fish species, including 178 endemic to the basin [7]. Furthermore, 286 fish species are distributed in the upper reaches of the Yangtze alone, with 124 of them being endemic [8]. The Pingzhai Reservoir is located in the upper reaches of the Wujiang River, the largest tributary on the south bank of the Yangtze River, at 105°6′57″ E–105°40′50″ E and 26°29′33″ N–26°35′38″ N. It is situated at the outskirts of Bijie, a city in Naiyong County, Zhijin County, Shuicheng County, and Liupanshui City, Guizhou Province, and serves as the source reservoir for the Qianzhong Water Project. The dam site is located in Liuzhi Special Zone, Niuchang Township. The Pingzhai Reservoir has five primary inflow rivers, namely Nyong River, Shuigong River, Zhangwei River, Baishui River, and Hujia River. The reservoir has an area of 14.57 km2, a shoreline 94.89 km long, a normal water level of 1331 m, an average water depth of 50 m, and a total capacity of 10.89 × 10⁸ m3, with an adjustable storage capacity of 4.48 × 10⁸ m3. As the only source reservoir for the Qianzhong water conservancy project, it mainly supplies water for agriculture, industry, domestic use, and cities across 49 towns in 10 counties (cities and districts) in central Guizhou [9].
Traditional fish resource surveys typically involve methods such as electric fishing, net fishing, and cage fishing to collect fish samples and identify species based on fish morphology. However, these methods require considerable human and material resources and can be affected by numerous uncertain factors during sampling, resulting in potentially inaccurate survey results. Some traditional methods can also harm biological systems, requiring a high level of taxonomic expertise from identification personnel. Environmental DNA (eDNA) refers to the sum of DNA fragments that can be directly extracted from environmental samples (e.g., water, soil, air, and ice cores). It comprises DNA from different species, such as microorganisms, animals, and plants. This includes intracellular DNA of epidermal cells released into the environment by an organism through its skin, urine, feces, and mucus, among others, and extracellular DNA released after cell death [10,11]. eDNA metabarcoding usually refers to the direct extraction of total DNA from environmental samples, followed by PCR using specific or universal primers. Sequencing and bioinformatics analysis are used to identify the sequence of target species in the environment, representing a new method for biodiversity detection [12,13]. eDNA technology originally emerged in environmental microbiology [14] and gained widespread recognition and application after the year 2000 [15]. In 2008, Ficetola et al. [16] were the first to use eDNA technology to detect the presence of invasive species, American bullfrog (Rana catesbeiana), in ponds. Evans et al. [17] used three pairs of universal fish primers to detect all fish species detected through traditional methods in a 0.022 km2 reservoir, including 11 species that had not previously been captured. Sigsgaard et al. [18] used 12S rRNA genetic markers to successfully monitor seasonal changes in the fish community structure off the coast of Denmark. Currently, the use of eDNA macrobarcoding to investigate fish diversity is becoming increasingly prevalent in China. In two studies conducted in Xiangshan Port waters [19] and Erhai Lake [20], the results obtained through the eDNA sequence abundance for dominant fish species and fishery resources are largely consistent. Wang et al. [21] evaluated the fishery resources of small yellow croaker in the East China Sea based on eDNA concentration and revealed that its regional and water layer distribution aligned with traditional trawling results.
In this work, through eDNA sample collection and high-throughput sequencing analysis within the waters of the Pingzhai Reservoir, combined with data from traditional fishery resources survey data, this study explores the species composition and diversity characteristics of the main fish communities in the Pingzhai Reservoir. The study aimed to provide references for biodiversity monitoring and aquatic life protection within the reservoir.

2. Materials and Methods

2.1. Environmental Sample Collection

Pingzhai Reservoir is located in the upper reaches of Wujiang River, the largest tributary on the south bank of the Yangtze River. It belongs to the source of the water conveyance project in central Guizhou, and undertakes the functions of irrigation, drinking water supply, and power generation in the region. The construction of Pingzhai Reservoir has greatly alleviated the difficulties in urban and rural water use and agricultural irrigation. At the same time, the water condition of the Pingzhai Reservoir is not only related to the safety of water supply, but also determines the agricultural irrigation and urban water use in this area to a great extent. Samples were collected on 13 March 2023. Based on the geographical characteristics of the Pingzhai Reservoir basin, eight sampling points were established to maximize the coverage of the entire reservoir (Figure 1 shows the number of each sampling point). At each sampling point, 5 L of surface water was collected using a water sampler. This process was repeated thrice, and 24 water samples were collected. The water samplers and sampling bottles were disinfected with 10% bleach powder solution before use, and collectors were required to change disposable gloves after each sampling [22]. The collected water samples were stored at a low temperature, kept away from light, transported back to the laboratory, and filtered using a 0.45 μm poly(ether sulfone) filter membrane within 24 h, employing a vacuum pump (Tianjin, China). To minimize contamination, the equipment was disinfected before and after filtration to prevent cross-contamination between the samples. Two blank water samples were filtered before the experimental water sample was filtered. The filtered membrane was folded and sealed in a 2 mL centrifuge tube and then frozen at −80 °C until DNA extraction.
Nine bottom trawl stations were established (Figure 1). The study utilized a 50-m long multi-layer gillnet, a bottom cage net with a mesh size of 10 cm, and a hand-cast net with a mesh size of 5 cm, and trawling was conducted for 6 h. The collected fish samples were identified on-site using data from sources such as ‘Guizhou Fish’, ‘Zoology of China • Cyprinid Fish’, and ‘Journal of Fish in Guizhou’. Unidentified samples were preserved in a 10% formalin solution and returned to the laboratory for further identification.

2.2. DNA Extraction of Water Samples

For DNA extraction, the E.Z.N.A.® Water DNA Kit (Shanghai, China) was used following the kit instructions. Each sample was extracted independently. To prevent contamination during extraction, a blank filter was used as a negative control. The obtained eDNA samples were promptly refrigerated at −20 °C until PCR amplification.

2.3. PCR Amplification and High-Throughput Sequencing

PCR amplification was conducted using the universal fish primer tele02-F-TELE02-R, with the following sequences: Tele02-F: 5′-AAACTCGTGCCAGCCACC-3′ and Tele02-R: 5′-GGGTATCTAATCCCAGTTTG-3′ [23]. Then, 12S marker was used. The PCR amplification was performed using the ABI GeneAmp® 9700 (ABI, Waltham, MA, USA) and comprised a 20 μL reaction with the following components: 4 μL 5× FastPfu Buffer, 2 μL 2.5 mM dNTPs, 0.4 μL FastPfu Polymerase, 0.8 μL 5 μM forward primer, 0.8 μL 5 μM reverse primer, 10 ng template DNA, and finally ddH2O to achieve a total volume of 20 μL. The PCR reaction procedure included an initial denaturation at 95 °C for 5 min, followed by 27 cycles comprising denaturation at 95 °C for 30 s, annealing at 55 °C for 30 s, extension at 72 °C for 45 s, and a final extension at 72 °C for 10 min, followed by storage at 10 °C. To assess for contamination during PCR amplification, a negative PCR control using ddH2O as a template was included. Each sample underwent three replicates, and the twenty-four samples yielded detectable PCR products. After 2% agarose gel electrophoresis, the gel was purified through PCR with the AxyPrepDNA gel recovery kit (Thermo Fisher Scientific, Beijing, China) (AXYGEN) and sent to Shanghai Lingen Biotechnology Co., Ltd. (Shanghai, China) for sequencing using the Illumina NovaSeq 6000 (Illumina, San Diego, CA, USA).

2.4. Data Analysis

The Illumina sequencing data were initially processed to obtain effective sequences for all samples based on barcodes. Filter the base of the read tail mass value below 20, set a window of 10 bp; if the average mass value in the window is lower than 20, cut off the back-end base from the window, and filter the read below 50 bp after quality control. Based on the overlap between PE reads, pairs of reads with a minimum overlap length of 10 bp were merged. Non-conforming sequences were screened out, sequence orientation was adjusted, and chimeras were removed. Operational taxonomic unit (OTU) clustering was conducted on non-repeating sequences (excluding single sequences) with a 97% similarity threshold. Chimeras were removed during clustering to obtain representative sequences for each OTU. All optimized sequences were then mapped to these representative OTU sequences, and sequences with >97% similarity were selected to generate OTU tables. The MitoFish Income OTU and database (http://mitofish.aori.u-tokyo.ac.jp/, accessed on 1 January 2023) and the NCBI (https://www.ncbi.nlm.nih.gov/, accessed on 1 January 2023) database were used for species comparison and classification annotations.
The statistical analysis method of data in this chapter is as follows:
Shannon–Wiener Index:
H = i = 1 s ( P i ) ( ln P i )
where, S is the number of species and Pi is the individual proportion of the i-th species in the community.
Pielou Index:
E = H H max
where, H refers to the diversity index of species and the diversity index of the largest species of Hmax, where Hmax = ln S.

3. Results

3.1. Composition of Fish Species

From the 24 water samples collected at 8 sampling points, 1152 representative OTU sequences were obtained through clustering at a 97% similarity threshold. After uploading the results to the NCBI database and conducting comparisons with the MitoFish database, non-freshwater fish species were manually screened and removed. Consequently, 43 freshwater fish species were detected, belonging to 5 orders, 11 families, and 37 genera. With 34 species, Cypriniformes exhibited the highest species diversity among them, accounting for approximately 79.1% of the total fish species. Peciformes followed with four species (9.3%), whereas Siluriformes had three species (approximately 7%). One species was detected in both Cyprinodontiforme and Synbranchiformes (Table 1). The seven species with the highest number of reads detected using eDNA macrobarcodes were Hypophthalmichthys molitrix, Hypophthalmichthys nobilis, Carassius auratus, Procypris rabaudi, Oryzias latipes, Leiocassis longirostris, and Micropterus salmoides. These seven species exhibited significantly higher sequence abundance across all eight sampling sites than the other species. Hypophthalmichthys molitrix and Hypophthalmichthys nobilis, as the primary free-range species, dominated the eDNA detection results in the Pingzhai Reservoir.

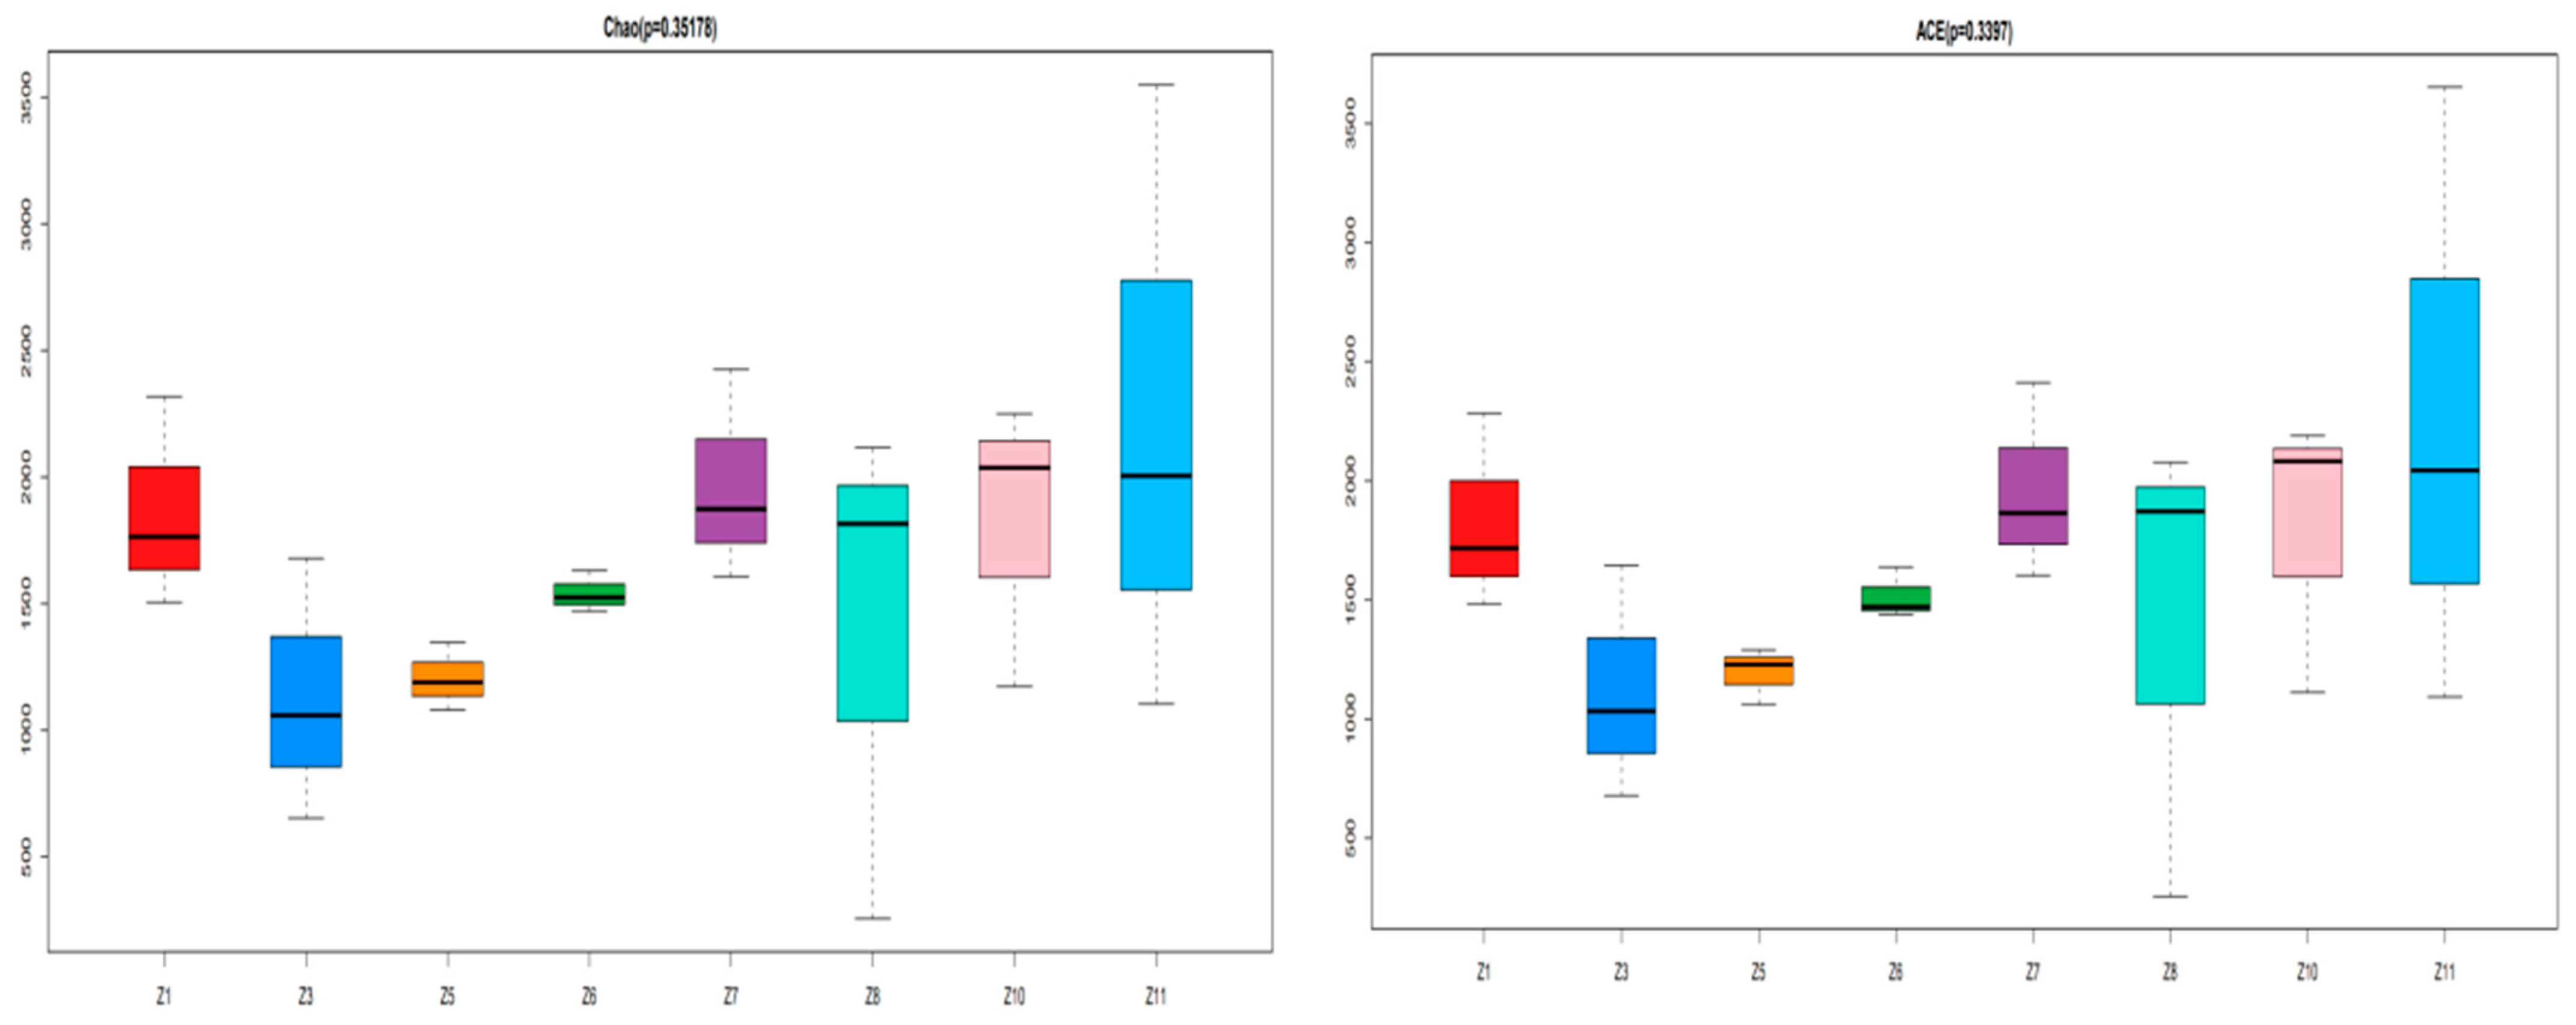
3.2. Analysis of Fish Species Diversity

The alpha diversity index is typically used to represent species diversity in a raw territory. In this study, the alpha diversity of the fish community in the Pingzhai Reservoir was analysed by calculating the Chao species richness index, Shannon index, Simpson index, and ACE index (Table 2). The Chao index is an index used to estimate species richness in a community; the Shannon index evaluates community diversity by considering species richness (that is, species number) and evenness (that is, relative abundance of species). The Shannon index evaluates community diversity by considering species richness (that is, species number) and evenness (that is, relative abundance of species); the Simpson index evaluates species diversity by calculating the probability that the number of individuals obtained from two consecutive sampling in the community belongs to the same species; and the ACE index is used to estimate the unobserved species richness.
The Chao index ranged from 1130.423 to 2220.166, with an average value of 1643.5544. Similarly, the ACE index ranged from 1118.466 to 2262.968, with an average value of 1633.9193. The distribution trends of these two indices were similar. The Simpson index ranged from 0.0822 to 0.4473, with an average value of 0.1899. The Shannon index ranged from 2.6241 to 4.8649, with an average value of 4.0279. However, the distribution trends of these two indices were different. The Pielou evenness index ranged from 0.2653 to 0.4573, with an average value of 0.3912. Analysis of the alpha diversity index using the Pielou evenness index showed no significant differences (p > 0.05) among different sampling points. Notably, the Z6 sampling point exhibited higher Chao1, ACE, and Shannon indices. The coverage values for each sampling point ranged from 0.9993 to 0.9996, indicating that the sequencing covered most OTU data and could represent the authenticity of the sample.
Using R software (4.3 for Windows), box plots were generated for the Chao index and ACE index, yielding p-values of 0.352 and 0.34, respectively (p > 0.05). These results indicate no significant difference in fish abundance among all sampling points (Figure 2). Similarly, box plots were generated for the Shannon index and Simpson index, resulting in p-values of 0.094 and 0.079, respectively (p > 0.05), indicating that there was no significant difference in fish diversity among all sampling points (Figure 3).

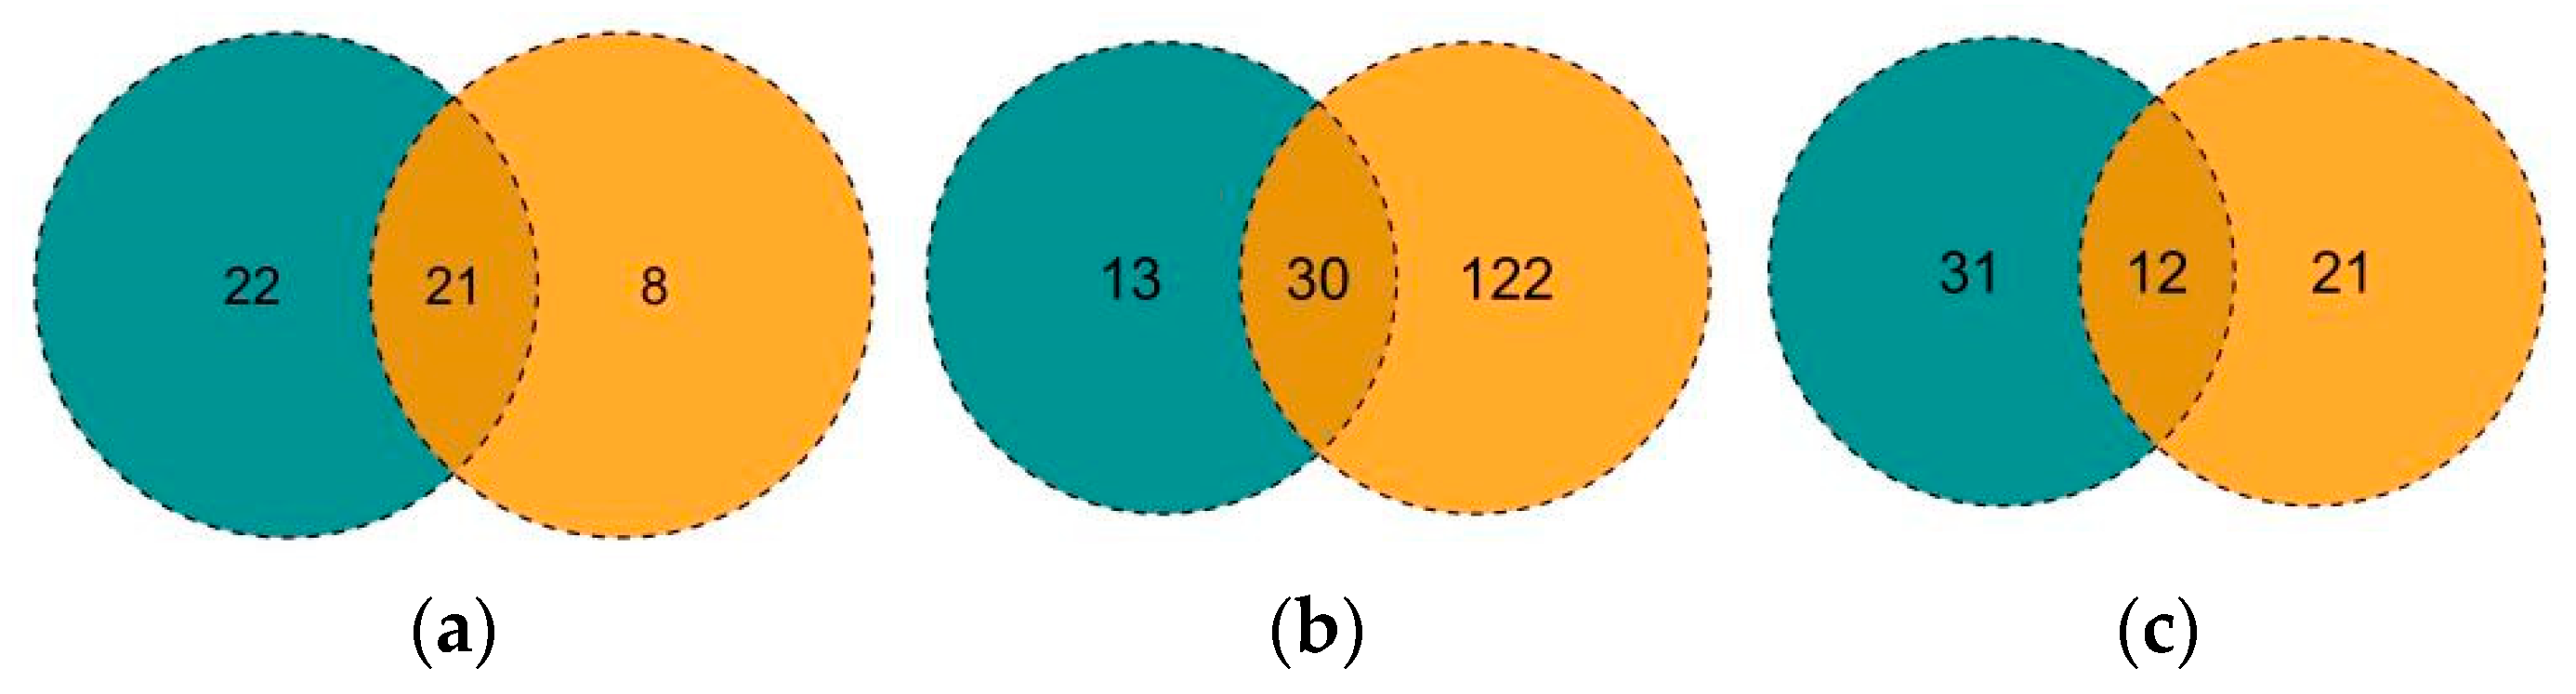
3.3. Environmental DNA Test Results and Analysis

Studies have shown that eDNA technology detects an equal or greater number of species in aquatic ecosystems compared with traditional methods [24,25]. According to the fish harvesting conducted by the Guizhou Fisheries Research Institute in the autumn and winter of 2022 in the central Guizhou Water Conservancy Project, 29 freshwater fish species were caught using traditional fishing gear, such as multi-layer gillnets, bottom cage nets, and hand-cast nets. These included 22 species of Cypriniformes, 5 of Siluriformes, and 2 of Peciformes. When combined with the eDNA macrobarcodes used in this study, 21 species were detected (Figure 4a). Wang Xue et al. [26] investigated fish diversity in the Wujiang River basin from 2017 to 2021 using traditional fishing methods, such as electric fish machines and hand nets. They identified 152 fish species in total, and 30 species were detected using the eDNA macrobarcode method in our study (Figure 4b). Cheng Ruli et al. [27] detected 33 freshwater fish species in the cascade hydropower reservoir of the Wujiang River trunk stream using eDNA macrobarcodes, and 12 species were detected jointly using our eDNA macrobarcode method (Figure 4c).

4. Discussion

4.1. Composition of Fish in the Pingzhai Reservoir

In this study, eDNA macrobarcoding technology was used for the first time to detect fish diversity in the Pingzhai Reservoir. In winter, 43 freshwater fish species were detected, spanning 5 orders, 11 families, and 37 genera, with Cypriniformes accounting for 79.1% of them (34 species). Additionally, 29 freshwater fish species were caught in the Pingzhai Reservoir during autumn and winter using traditional ground cages and gillnets, with Cypriniformes accounting for 75.9% (22 species). The results show that eDNA macrobarcoding is superior to traditional methods in detecting fish species richness, with 21 species detected when eDNA was combined with traditional fishing methods. The species detected using this combined approach are Opsariichthys bidens, Hemiculter leucisculus, Hypophthalmichthys molitrix, Hypophthalmichthys nobilis, Pseudorasbora parva, Rhodeus ocellatus, Spinibarbus denticulatus, Spinibarbus sinensis, Percocypris pingi, Acrossocheilus yunnanensis, Acrossocheilus longipinnis, Onychostoma lini, Schizothorax prenanti, Schizothorax kozlovi, Procypris rabaudi, Cyprinus carpio, Carassius auratus, Leiocassis longirostris, and Pseudobagrus emarginatus of the family Bagridae and Rhinogobius giurinus of Peciformes and Gobiidae. Thus, the fish species detected in this study align closely with the findings of traditional resource surveys, indicating that Cypriniformes dominate in the Pingzhai Reservoir. This finding also shows that eDNA technology, as a new method for biodiversity investigation, has high detection sensitivity in aquatic biological monitoring and protection [28,29], making it a feasible method for studying fish diversity in the Pingzhai Reservoir.
The DNA present in the water body can be transported by the Yangtze River current to estuaries and tributaries, with eDNA remaining in the water body for varying periods (a few days to a few weeks), typically not exceeding a month [30]. In this study, exotic species, such as Micropterus salmoides, Oreochromis niloticus, and Megalobrama amblycephala, were detected, consistent with findings in the Yangtze River basin [31]. This is primarily attributed to the inadequate containment measures in farms near the Yangtze River basin, resulting in the escape of exotic species [32]. Related studies have shown that the introduction of alien species can pose significant threats to indigenous fish populations and ecosystems [33]. Notably, the reads of Micropterus salmoides ranked seventh among all fish species in the Pingzhai Reservoir. Furthermore, the proportion of Hypophthalmichthys molitrix and Hypophthalmichthys nobilis had the highest sequence abundance in the reservoir.

4.2. Analysis of Fish Diversity in the Pingzhai Reservoir Based on Environmental DNA

Due to the complexity of the environment of the fish DNA water basin, the production and degradation rates of eDNA are easily influenced by numerous environmental factors, including water temperature, pH, flow rate, ultraviolet light, and water bottom quality [34,35]. There were 8 sampling points and 24 samples in this survey. Among them, only the concentration of the PCR product at the Z3 sampling point was classified as B, indicating that the target band size of the product was correct but that the concentration was low, not allowing for subsequent experiments. The PCR amplification results at the other seven sampling sites were all classified as A, indicating that the target band size of the product was correct and the concentration was appropriate, thereby meeting the requirements for subsequent experiments. The discrepancy at the Z3 sampling point could be attributed to the Z5 sampling point being the last bottle of the filtered water sample, resulting in an extended water sample exposure time. This prolonged exposure may have caused some DNA fragments to degrade during filtration, thereby affecting the DNA extraction results and the concentration at the Z3 sampling point. Therefore, the water samples should be immediately filtered after collection and frozen with filter membranes.

5. Conclusions

Traditional fish resource surveys typically entail ecological damage to some extent, and the sampling process is not only time-consuming and laborious but also influenced by numerous factors, resulting in uncertain survey results. For example, fish such as Hemiculter leucisculus exhibit strong swimming ability, whereas black carp and other fish have the characteristics of ‘seclusion’, making them difficult to catch using the ground cage method. Moreover, the morphological identification of species requires expertise, and the ability of scientific researchers to identify the different species varies considerably. In contrast, eDNA macrobarcodes offer an efficient method for monitoring fish biodiversity that is convenient, habitat-friendly, and not restricted to fishing. In this study, eDNA technology was employed for the first time to analyze fish species diversity in the Pingzhai Reservoir, and the results were compared with traditional fish resource survey methods. In total, 21 fish species were detected using both methods. However, 43 species were detected using eDNA technology in winter, whereas only 29 species were detected using traditional fishing methods (e.g., bottom cages) in autumn and winter. Compared with traditional fishing methods, eDNA technology detected more fish species. Most fish species detected were consistent with historical survey data from the Wujiang River basin, indicating that eDNA macrobarcodes exhibit high accuracy. However, because eDNA technology relies on the integrity of the molecular database, it may result in false negatives, and sample contamination during the experiment will lead to false positives. Therefore, eDNA technology cannot completely replace traditional fish resource surveys but can serve as a valuable supplement to these methods. Combining the advantages of both methods can quickly and accurately reflect the distribution of fish resources. This survey detects fish biodiversity based on eDNA technology, confirming the significant potential of eDNA macrobarcodes in fish diversity detection.

Author Contributions

Conceptualization, J.Y.; Methodology, J.W., Q.K. and X.Z. All authors have read and agreed to the published version of the manuscript.

Funding

This work was financially supported by the Guizhou Provincial Science and Technology Support Plan Project [2021] General 165, Qiankehe Support [2022] General 129, Qiankehe Support [2022] General 130.

Institutional Review Board Statement

In this paper, DNA identification was done using water samples and did not involve fishing. The traditional part of the fishery resources survey does not carry out killing and dissolving research of fish, but only carries out identification of fish species. The data were obtained from the fish species identification of Guizhou Fisheries Research Institute.

Informed Consent Statement

Not applicable.

Data Availability Statement

Data are contained within the article.

Conflicts of Interest

The authors declare no conflict of interest.

References

  1. Dudgeon, D.; Arthington, A.H.; Gessner, M.O.; Kawabata, Z.I.; Knowler, D.J.; Lévêque, C.; Naiman, R.J.; Prieur-Richard, A.H.; Soto, D.; Stiassny, M.L.; et al. Freshwater biodiversity: Importance, threats, status and conservation challenges. Biol. Rev. Camb. Philos. Soc. 2006, 81, 163–182. [Google Scholar] [CrossRef]
  2. Lundberg, J.G.; Kottelat, M.; Smith, G.R.; Stiassny, M.L.; Gill, A.C. So many fishes, so little time: An overview of recent ichthyological discovery in continental waters. Ann. Mo. Bot. Gard. 2000, 87, 26–62. [Google Scholar] [CrossRef]
  3. Nelson, J.S.; Grande, T.C.; Wilson, M.V.H. Fishes of the World; John Wiley & Sons: Hoboken, NJ, USA, 2016. [Google Scholar]
  4. Zhong, L.P.; Gao, T.X.; Zhang, H.B.; Chen, Z.; Wang, X.Y. Study on fish species diversity in the Zhongjieshan Islands based on environmental DNA metabarcoding. J. Fish. China 2023, 5, 1–11. [Google Scholar]
  5. Chen, Y.S.; Qu, X.; Xiong, F.Y.; Lu, Y.; Wang, L.Z.; Hughes, R.M. Challenges to saving China’s freshwater biodiversity: Fishery exploitation and landscape pressures. Ambio 2020, 49, 926–938. [Google Scholar] [CrossRef]
  6. Su, G.H.; Logez, M.; Xu, J.; Tao, S.L.; Villeger, S.; Brosse, S.; Brosse, S. Human impacts on global freshwater fish biodiversity. Science 2021, 371, 835–838. [Google Scholar] [CrossRef]
  7. Ye, S.W.; Li, Z.J.; Liu, J.S.; Zhang, T.L.; Xie, S.G. Distribution, Endemism and Conservation Status of Fishes in the Yangtze River Basin, China//Grilloo; Venora, G., Ed.; Ecosystems Biodiversity; IntechOpen: London, UK, 2011; pp. 41–66. [Google Scholar]
  8. Chen, J.M.; Zhao, H.T.; Miao, Z.G.; Chen, Y.X.; Zhang, F.T.; Wang, J.W. Status and conservation of fish resources in the Chishui River. Biodivers. Sci. 2010, 18, 162–168. [Google Scholar]
  9. Li, S.H. Characteristics and Influencing Factors of Water Eutrophication in Pingzhai Reservoir on Guizhou Plateau. Master’s Thesis, Guizhou Normal University, Guizhou, China, 2021. [Google Scholar]
  10. Rees, H.C.; Bishop, K.; Middleditch, D.J.; Patmore, J.R.; Maddison, B.C.; Gough, K.C. The application of eDNA for monitoring of the Great Crested Newt in the UK. Ecol. Evol. 2014, 4, 4023–4032. [Google Scholar] [CrossRef]
  11. Rees, H.C.; Maddison, B.C.; Middleditch, D.J.; Patmore, J.R.; Gough, K.C. REVIEW: The detection of aquatic animal species using environmental DNA—A review of eDNA as a survey tool in ecology. J. Appl. Ecol. 2014, 51, 1450–1459. [Google Scholar] [CrossRef]
  12. Deiner, K.; Walser, J.C.; Mächler, E.; Altermatt, F. Choice of capture and extraction methods affect detection of freshwater biodiversity from environmental DNA. Biol. Conserv. 2015, 183, 53–63. [Google Scholar] [CrossRef]
  13. Ruppert, K.M.; Kline, R.J.; Rahman, M.S. Past, present, and future perspectives of environmental DNA (eDNA) metabarcoding: A systematic review in methods, monitoring, and applications of global eDNA. Glob. Ecol. Conserv. 2019, 17, e547. [Google Scholar] [CrossRef]
  14. Goldberg, C.S.; Turner, C.R.; Deiner, K.; Klymus, K.E.; Thomsen, P.F.; Murphy, M.A.; Spear, S.F.; McKee, A.; Oyler-McCance, S.J.; Cornman, R.S.; et al. Critical considerations for the application of environmental DNA methods to detect aquatic species. Methods Ecol. Evol. 2016, 7, 1299–1307. [Google Scholar] [CrossRef]
  15. Hänfling, B.; Lawson Handley, L.; Read, D.S.; Hahn, C.; Li, J.; Nichols, P.; Blackman, R.C.; Oliver, A.; Winfield, I.J. Environmental DNA metabarcoding of lake fish communities reflects long-term data from established survey methods. Mol. Ecol. 2016, 25, 3101–3119. [Google Scholar] [CrossRef]
  16. Ficetola, G.F.; Miaud, C.; Pompanon, F.; Taberlet, P. Species detection using environmental DNA from water samples. Biol. Lett. 2008, 4, 423–425. [Google Scholar] [CrossRef] [PubMed]
  17. Evans, N.T.; Li, Y.; Renshaw, M.A.; Olds, B.P.; Deiner, K.; Turner, C.R.; Jerde, C.L.; Lodge, D.M.; Lamberti, G.A.; Pfrender, M.E. Fish community assessment with edna metabarcoding: Effects of sampling design and bioinformatic filtering. Can. J. Fish. Aquat. Sci. 2017, 74, 1362–1374. [Google Scholar] [CrossRef]
  18. Sigsgaard, E.E.; Nielsen, I.B.; Carl, H.; Krag, M.A.; Knudsen, S.W.; Xing, Y.; Holm-Hansen, T.H.; Møller, P.R.; Thomsen, P.F. Seawater environmental DNA reflects seasonality of a coastal fish community. Mar. Biol. 2017, 164, 128. [Google Scholar] [CrossRef]
  19. Ling, J.Z.; Jiang, Y.Z.; Sun, P. Application and evaluation of environmental DNA technology in fish diversity research in Xiangshan Bay. J. Fish. Sci. China 2021, 28, 205–214. [Google Scholar]
  20. Shu, L.; Lin, J.Y.; Xu, Y. Investigating the fish diversity in erhai lake based on environmental dna metabarcoding. Acta Hydrobiol. Sin. 2020, 44, 1080–1086. [Google Scholar]
  21. Wang, X.; Lu, G.; Zhao, L.; Yang, Q.; Gao, T. Assessment of fishery resources using environmental DNA: Small yellow croaker (Larimichthys polyactis) in East China Sea. PLoS ONE 2020, 15, 0244495. [Google Scholar] [CrossRef]
  22. Pilliod, D.S.; Goldberg, C.S.; Arkle, R.S.; Waits, L.P. Estimating occupancy and abundance of stream amphibians using environmental DNA from filtered water samples. Can. J. Fish. Aquat. Sci. 2013, 70, 1123–1130. [Google Scholar] [CrossRef]
  23. Taberlet, P.; Bonin, A.; Zinger, L.; Coissac, E. Environmental DNA-for Biodiversity Research and Monitoring; Oxford University Press: Oxford, UK, 2018. [Google Scholar]
  24. Deiner, K.; Fronhofer, E.A.; Mächler, E.; Walser, J.C.; Altermatt, F. Environmental DNA reveals that rivers are conveyer belts of biodiversity information. Nat. Commun. 2016, 7, 12544. [Google Scholar] [CrossRef]
  25. Gillet, B.; Cottet, M.; Destanque, T.; Kue, K.; Descloux, S.; Chanudet, V.; Hughes, S. Direct fishing and eDNA metabarcoding for biomonitoring during a 3-year survey significantly improves number of fish detected around a South East Asian Reservoir. PLoS ONE 2018, 13, e0208592. [Google Scholar] [CrossRef]
  26. Wang, X.; Zeng, S. Species composition and diversity of fish in the Wujiang River. J. Fish. China 2023, 47, 143–153. [Google Scholar]
  27. Xioa, Q.; Yang, Z.; Tang, H.Y. Species diversity of fish and its conservation in the mainstream of the lower reaches of Wu River. Biodivers. Sci. 2015, 23, 499–506. [Google Scholar] [CrossRef]
  28. Shan, X.J.; Li, M.; Wang, W.J. Application of Environmental DNA Technology in Aquatic Ecosystem. Prog. Fish. Sci. 2018, 39, 23–29. [Google Scholar]
  29. Dejean, T.; Valentini, A.; Miquel, C.; Taberlet, P.; Bellemain, E.; Miaud, C. Improved detection of an alien invasive species through environmental DNA barcoding: The example of the American bullfrog Lithobates catesbeianus. J. Appl. Ecol. 2012, 49, 953–959. [Google Scholar] [CrossRef]
  30. Wang, R.X.; Yang, G.; Geng, Z. Application of environmental DNA technology in fish diversity analysis in the YANGTZE river estuary. Acta Hydrobiol. Sin. 2023, 47, 365–375. [Google Scholar]
  31. Wang, M.; Yang, X.; Wang, W. Fish diversity in ChongQing section of the national nature reserve for rare and endemic fish in the upper YANGTZE river based on eDNA technology. Acta Hydrobiol. Sin. 2022, 46, 2–16. [Google Scholar]
  32. Ba, J.W.; Chen, D.Q. Invasive fishes in Three Gorges Reservoir area and preliminary study on effects of fish invasion owing to impoundment. J. Lake Sci. 2012, 24, 185–189. [Google Scholar]
  33. Yan, T.M.; He, J.Y.; Luo, J. Assessment of ecosystem health on the upper and middle reaches of Nanhe River with the fish-based biotic integrity index. Freshw. Fish. 2021, 51, 3–12. [Google Scholar]
  34. Chen, Z.; Song, N.; Yuan, L.W. The eDNA collection method of Zhoushan coastal waters. Acta Hydrobiol. Sin. 2020, 44, 50–58. [Google Scholar]
  35. Strickler, K.M.; Fremier, A.K.; Goldberg, C.S. Quantifying effects of UV-B, temperature, and pH on eDNA degradation in aquatic microcosms. Biol. Conserv. 2015, 183, 85–92. [Google Scholar] [CrossRef]
Figure 1. Sampling stations of Pingzhai reservoir. The red icon indicates that the site conducts sampling studies for environmental DNA macro barcodes, while the black icon indicates that the site conducts sampling studies for traditional fisheries resource surveys.
Fishes 09 00382 g001
Figure 2. Chao index and ACE index between eight sites. Different colors correspond to each coordinate point of the abscissa, and different coordinate points represent different sampling locations.
Fishes 09 00382 g002
Figure 3. Shannon index and Simpson index between eight sites. Different colors correspond to each coordinate point of the abscissa, and different coordinate points represent different sampling locations.
Fishes 09 00382 g003
Figure 4. Venn diagrams of fish species detected based on environmental DNA metabarcoding and historical survey data. The green areas represent the number of fish species detected by environmental DNA in this study, and the orange areas represent historical survey data (a), (b), and (c), respectively.
Fishes 09 00382 g004
Table 1. Statistical table of fish species detected in Pingzhai reservoir based on eDNA technology.
OrderFamilyGenusSpecies
CypriniformsCyprinidaeCtenopharyngodonC. idella
CyprinidaeMegalobramaM. terminalis
CyprinidaeMegalobramaM. amblycephala
CyprinidaeHypophthalmichthysH. molitrix
CyprinidaeHypophthalmichthysH. nobilis
CyprinidaeProcyprisP. rabaudi
CyprinidaePercocyprisP. pingi
CyprinidaeCyprinusC. carpio
CyprinidaeCarassiusC. auratus
CyprinidaeSchizothoraxS. prenanti
CyprinidaeSchizothoraxS. kozlovi
CyprinidaeSchizothoraxS. davidi
CyprinidaeAcrossocheilusA. longipinnis
CyprinidaeAcrossocheilusA. yunnanensis
CyprinidaeElopichthysE. bambusa
CyprinidaeSqualiobarbusS. curriculus
CyprinidaeHemiculterH. leucisculus
CyprinidaeZaccoZ. platypus
CyprinidaeOpsariichthysO. bidens
CyprinidaeChanodichthysC. mongolicus
CyprinidaeRhodeusR. ocellatus
CyprinidaeHemiculterH. leucisculus
CyprinidaeZaccoZ. platypus
CyprinidaeOpsariichthysO. bidens
CyprinidaeChanodichthysC. mongolicus
CyprinidaeBanganaB. rendahli
CyprinidaeSpinibarbusS. denticulatus
CyprinidaeSpinibarbusS. sinensis
CyprinidaeOnychostomaO. lini
CyprinidaeVaricorhinusV. barbatulus
CyprinidaeMicrophyogobioM. kiatingensis
CyprinidaeSqualidusS. wolterstorffi
CyprinidaeAbbottinaA. rivularis
CyprinidaePseudorasboraP. parva
CobitisLeptobotiaL. pellegrini
CobitisSyncrossusS. hymenophysa
CobitidaeParamisgurnusP. dabryanus
BalitoridaeBeaufortiaB. kweichowensis
PeciformesPercichthyidaeSinipercaS. undulata
GobiidaeRhinogobiusR. giurinus
CichlaidaeOreochromisO. niloticus
CentrarchidaeMicropterusM. salmoides
SiluriformesBagridaePseudobagrusP. emarginatus
BagridaeLeiocassisL. longirostris
BagridaeHemibagrusH. guttatus
CyprinodontiformesAdrianichthyidaOryziasO. latipes
SynbranchiformesMastacembelidaeSinobdellaS. sinensis
Table 2. Alpha diversity index of each sampling point in Pingzhai Reservoir.
SampleChao1ShannonACEPielouSimpsonCoverage
Z11862.4104.4881827.3710.42530.10670.999460
Z21130.4232.62411118.4660.26530.44730.999641
Z31206.0493.28621192.8710.33220.30150.999621
Z41542.3634.07641515.6210.39890.1420.999461
Z51969.7344.86491958.9430.45730.08220.999367
Z62220.1664.81642262.9680.44460.09200.999486
Z71396.6174.22601400.6380.44000.12610.999539
Z81820.6733.84121794.4760.36580.22130.999374
Disclaimer/Publisher’s Note: The statements, opinions and data contained in all publications are solely those of the individual author(s) and contributor(s) and not of MDPI and/or the editor(s). MDPI and/or the editor(s) disclaim responsibility for any injury to people or property resulting from any ideas, methods, instructions or products referred to in the content.

