Abstract
In Mexico, marine acoustics research still faces technical and scientific challenges. For the past decade, the country has made a sustained effort to implement acoustic techniques to generate time series of standardized information; however, these data have been underutilized. Marine acoustics research has been used mainly for small pelagic species and has contributed to improving fishery management and to advising stakeholders. The Mexican scientific community has perceived marine acoustic techniques as expensive tools that are only used for industrial fishing purposes. Marine acoustics can provide information on the variability and interactions between species, their physical environment, and other communities of species, but this approach has not yet been integrated into interdisciplinary research programs or ecosystem models. Additionally, acoustic data provide estimates of biomass and indices of relative abundance, and they have suitable statistical properties for use in integrated catch-at-age models. In summary, to consolidate marine acoustic techniques in Mexico, it is necessary, at a minimum, to maintain the current infrastructure for acoustic studies, to increase the budget for the development of monitoring programs that collect ecosystem indicator data, to promote the training of human resources, and to encourage peer review of the information generated and reported in gray literature.
Key Contribution:
(1) At present, it is critical for Mexico to consolidate the use of acoustic techniques and to produce added value for the acoustic data that are currently generated. Hence, a discussion on the contributions of acoustics to fishery management, Marine Protected Areas, and the ecosystem approach among the community of Mexican fisheries scientists should be promoted. (2) Investment in scientific instrumentation and human capital is relatively expensive in the short term, but fisheries acoustics has the potential to solve many of the challenges facing Mexican fisheries.
1. Introduction
Scientific echosounders have positioned themselves as extensively used tools in abundance and biomass assessments of resources as diverse as mesopelagic fishes, pelagic fishes, semidemersal organisms, macroalgal forests, zooplankton, squid, jellyfish, and top predators [1,2,3,4,5,6,7,8,9]. As technologies and data analysis methods have matured, the use of acoustics in ecological studies has grown rapidly [10,11], even developing in benthic habitat mapping to classify substrates and habitat type [12].
The constant and progressive evolution of acoustic technology makes tracing the historical events that led to the application of acoustics in fisheries research a difficult task. At the beginning of the First World War, there was a great push for research on transducers due to their military applications; two decades after the war, echosounders had become widespread, and acoustics were already being used as an assessment tool in European, American, Asian, and African countries, as well as in Australia and New Zealand [13,14,15,16]. In Mexico, during the 1970s, researchers from the Mexican Institute for Research in Sustainable Fisheries and Aquaculture (in Spanish: Instituto Mexicano de Investigación en Pesca y Acuacultura Sustentables (IMIPAS)) carried out acoustic surveys using analog echosounders off the coast of Baja California to estimate the anchovy biomass [17]. However, there was a failure to consolidate the use of these techniques in the country, and by the end of 1980, acoustic techniques for the evaluation of anchovy populations in Mexico had been replaced by the daily egg production method (DEPM) [18].
During the next two decades (1980–2000), Mexico did not make significant investments in acoustic equipment, nor in the training of human resources to develop and promote this line of research in the country. In 2007, the Mexican government, through IMIPAS and in collaboration with researchers from the French Institute for Ocean Science (IFREMER), began a fisheries acoustics monitoring program in the Gulf of California for small pelagic species using a single-beam 38 kHz frequency echosounder. Another frequency, 120 kHz, was added in 2012. Subsequently, new acoustic monitoring programs were implemented in different regions such as the western coast of the Baja California Peninsula, the northern region of Nayarit, and off the coast of Sinaloa (Figure 1). The main reason and rationale for studying the small pelagic fishery is that sardines and anchovies caught in northwestern Mexico represent the greatest contribution to the national fishery catch [19]. To date, acoustic techniques have been used most frequently to study these resources.
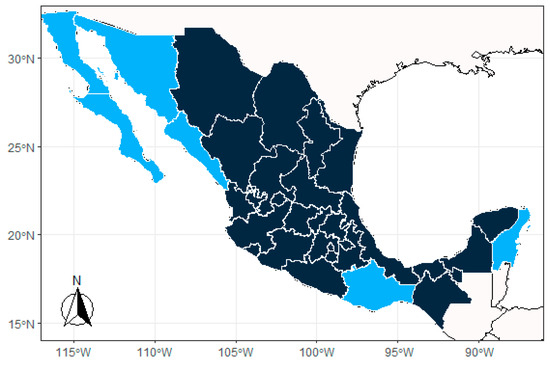
Figure 1.
The Mexican states in which acoustics studies have been applied to Mexican commercial fisheries are denoted in light blue. These studies have been developed almost entirely in northwestern Mexico, with limited studies in Oaxaca and Quintana Roo.
Since 2012, there have been several publications in which acoustics have played a central role in stock assessment and fishery management in Mexico. However, these investigations have mainly focused on the northwestern Pacific coast of Mexico, including the Gulf of California. The objective of this review is to analyze and discuss the applications of acoustic techniques in Mexico, including their successes, utility, and limitations compared with those in other countries. We hope that this review will encourage the development and application of these techniques in Mexico for a wide range of ecological topics outside of the standard procedures for monitoring Mexican marine resources.
2. Materials and Methods
This review was based on manuscripts with the following eligibility criteria: (i) published and available from Scopus Elsevier, Redalyc, Crossref Metadata, and Google Scholar; (ii) research papers or technical reports mainly from Institute of the Sea of Peru (IMARPE), IFREMER, the National Oceanic and Atmospheric Administration (NOAA), the Commonwealth Scientific and Industrial Research Organization (CSIRO), and IMIPAS; and (iii) studies with an emphasis on Mexican marine resources. Gray literature on acoustic research was excluded (e.g., abstracts in symposiums or congresses). The review is organized into six topics, namely processing software, sampling design, frontiers for the applications of acoustics, the relevance of time series, the Mexican budget for research, and conclusions.
3. Processing Software
Acoustic work requires real-time data acquisition and processing software. There are a limited number of manufacturers and suppliers of scientific echosounders, typically Biosonics or Konsgberg, with the choice of supplier depending on the specific requirements and applications. In Mexico, the echosounders are SIMRAD EK60 and EK80, both provided by Konsgberg (Horten, Norway). Comparatively, the choice of processing software is not simple. A research group can choose to pay for a license or use freely available software, but the available options differ greatly in price, development level, and available guidance, all of which influence the analysis of the available information and its reproducibility. The processing sequence sometimes involves manual processing providing physical quantities (e.g., backscatter) that are used to compute the density and biomass values for a fishery resource. The software shares some specific characteristics, such as an array of colors, or “palette”, that are mapped to the backscatter; algorithms for the correction of a line that describes the bottom, which discard possible contributions from the seabed in the water column; algorithms for removing noise and reverberation; and other attributes. This review is based on the most used and frequently cited software in the literature (Table 1).
Echoview (ver. 8-15) has been cited the most in scientific publications. It was developed by an Australian company of the same name (formerly known as Myriax) via collaboration and feedback from the research community. It is used and distributed in several countries. Access to the program requires a physical key that can be shared within the workgroup (without being used at the same time), while workflows can be made available to other users who have access to the same or later versions of the program in which they were made. Payment for the annual renewal of the license allows the user to access the latest updates and innovative methodologies, while the modules vary according to the research objective.
The large-scale survey system (LSSS, ver. 2.16.0) also has a global commercial presence and is marketed through a business unit of the Norwegian Research Center (NORCE) [20]. Its predecessor was the Bergen Echo Integrator (BEI) program [21], which already had automatic categorization. The echogram interpretation process of LSSS has been improved through multifrequency applications. The system is powerful because it rapidly interprets large volumes of data, taking 2 h to process a full day of the survey [20]. LSSS continues to be developed, so new features are constantly added. For example, it now supports the Sonar-net CDF4 format and can handle acoustic wideband data from the EK80 wideband echosounder. To get the most out of the program, the hardware requirement is computationally demanding: a 64-bit operating system and at least 32 GB of RAM.
Open-Source Software Options
Other initiatives have emerged from the scientific–academic community for acoustic data processing. Most of them have been built as open-source initiatives, a feature that allows the verification of the processing details and the creation of routines that can be shared inside and outside the workgroup, which help to foster collaboration. This software is more economical but less robust (Table 1).
Matecho (ver. 7) was developed in MATLAB by the Development Research Institute (IRD). It can be used by running MATLAB Compiler Runtime (MCR) or by using the Matecho standalone version, although it is always recommended to run it within MATLAB. This software works in conjunction with MOVIES 3D (ver. 2.2.7 and further) [22]. It has automated processing that allows important functions to be performed to estimate abundance, such as echo integration by layer, extraction by schools, and noise removal. Moreover, it includes algorithms for applying methodologies based on multifrequency filters [23]. These features provide similar advantages as those implemented by Echoview. An important feature is that it supports the HAC standard format, which was adopted by the International Council for the Exploration of the Sea (ICES) Fisheries Acoustics Science and Technology Working Group (WGFAST) in 1999 for the exchange of raw and edited fisheries acoustics data. Thus, it allows for the recovery of files that have been previously processed in that format or for the processing raw data, including those collected by the EK80 broadband echosounder. The hardware requirements are simple and easily accessible (64-bit Windows 7 or 10 and ≥4 GB RAM).
ESP3 (ver. 1.52.0) is an open-source software platform that can be downloaded at sourceforge.net. The algorithms used in the processes are visible, and the user can consult them in the software documentation. Similarly to Matecho, it is an executable program developed in MATLAB and can be used with MCR. ESP3 is free and powerful, but there are a few “bugs.” These issues are solved by project administrators from the National Institute of Water and Atmospheric Research (NIWA). In the latest update (ver_1.52.0.), it is now possible to process multibeam echosounder data. ESP3 does not specify the hardware requirements, although it can run efficiently with 64-bit Windows 7 or 10 and ≥4 GB RAM [24].
StoX (ver. 4.0.0) is an open-source software package integrated with R. It was developed by the Institute of Marine Research (IMR) in response to the need for standardized software for research institutes working on marine studies in the North Sea, the Norwegian Sea, and the Barents Sea. The design features standardized sampling and repetitive protocols yet is flexible enough to allow workflows to be expanded, modified, deleted, and reorganized. Until 2019, StoX was used to estimate the abundance of stocks such as herring, sprat, blue whiting, cod, haddock, sandeel, and horse mackerel [25].
ECOPAMPA is a type of software created in Visual Studio 2010 to scrutinize synthetic echograms (implemented in C+ ver. 2.3). It was initially tailored for data collected by the National Institute of Fisheries Research and Development (INIDEP) using an EK500 echosounder. This software incorporates algorithms for the automatic detection of the seabed, surface, and schools of fish. It allows for the classification of schools of fish using artificial neural networks (ANNs). Of note, comparisons of experimental data between Echoview and ECOPAMPA have yielded good results. There is the potential to expand the application of ECOPAMPA to other regions, an endeavor that would require new data sets for training; however, this project is currently inactive [26].
Several projects in the Python (2024) programming language are at different levels of development; their advantage is that they do not have demanding hardware requirements. Perhaps the most ambitious and advanced is Echopype, a collaborative project that facilitates the integration of echosounder data into interdisciplinary oceanographic research [27]. Since 2019, its functions have increased due to multidisciplinary collaborations. Currently, Echopype supports data from the EK60, EK80, and Acoustic Zooplankton Fish Profiler (AZFP) echosounders, and it can convert raw data files into the Sonar-netCDF4 format [28]. Users with advanced programming skills can contribute via the GitHub repository, and those with limited experience with Python can find examples of how to use it. Other projects have been added, such as the PyEcholab library [29], developed in collaboration with different institutions in the United States to meet the needs of the National Centers for Environmental Information (NCEI). At this time, the code can read, plot, and export echosounder data. The EchoPy library (ver. 0.0.2) contains algorithms that allow for the basic processing of acoustic data, such as seabed correction and removal, the removal of corrupted pings, and multifrequency analysis (https://pypi.org/project/echopy accessed on 4 March 2024). A disadvantage of these libraries is their limited documentation. The long-term vision of these libraries is for the continuous contribution by other users to grow in a modular way, which would mean the expansion of the tool and accessibility for users beyond fisheries acoustic scientists.
Echogram (ver. 0.1.2), developed in the R language environment (version 4.2.3) [30], is a package that can manipulate multifrequency acoustic data in HAC and RAW (EK60) files and explore acoustic filters of echogram data (still under development [31]). Similarly to other software, Echogram can be run without demanding hardware requirements.
Due to the evolution of hardware, some processing software has become antiquated because of rapid advances in data technology: They have fallen into disuse or evolved into new versions. MOVIES+ (version is not reported), developed by IFREMER in the 1990s, was one of the first programs developed for fisheries acoustics data. It enabled the quantified analysis of echoes to manage fishery resources and ecological research. A particular feature was fish shoal extraction and characterization [32]. Over time, it has evolved into 3D MOVIES for the visualization of all echosounders in real time and in a three-dimensional (3D) environment. This software can incorporate data obtained from other instruments and is currently used by the French oceanographic fleet. Likewise, new software has been developed, including ESP3, ECHO (Division of Marine Research, Australia), SCHOOLS (Limnological Institute, University of Konstanz, Baden-Württemberg, Germany), SCHOOL (Institute of Marine Biology, Crete, Greece), CH1 and CH2 (Department of Fisheries and Oceans, British Columbia, Canada), and SCHOOLBASE (Marine Laboratory Aberdeen, Scotland) [33]. However, we have not considered them in this review because they are not used or there is limited available information.
The use of processing software in Mexico has varied over time. In the 2000s, IMIPAS began collaborating with the Research Institute for Development (IRD) and IFREMER to use MOVIES+; it was used from 2008 to 2018 to process the national acoustic surveys. However, this software cannot be installed on computers running Windows 8 and later. Consequently, since 2015, IMIPAS has invested in two Echoview licenses to process the massive amount of data collected from the water column. However, this investment was insufficient for the research vessels (RVs) that carry out acoustic monitoring in coastal areas in Mexico. To solve this problem, the first approach was to use free software; Echogram was the first choice. However, it has limitations in processing massive amounts of data. The second approach was to use Matecho, whose main advantage is its ability to analyze data from entire surveys. This program was used for 1 year. For the past 3 years, ESP3 has been used.
In Mexico, the use of different criteria and subjective user decisions make it nearly impossible to obtain the same output from two or more different processing software programs. This issue is exacerbated for long time series and the effects of tests or new methods. A single processing program is often tailored to the needs of the institution and used to establish a workflow and to improve the software. Hence, institutions with well-established acoustics programs maintain a workflow for analyzing their data, and their monitoring has improved continuously. Historical transitions among processing software programs used in Mexico have not favored the reproducibility and consistency required for acoustics research. For example, MOVIES+ cannot provide robust and accurate estimates of background noise, while ESP3 contains algorithms for these estimates. Similarly, Matecho was tailored for the acoustics data collected by the French oceanographic fleet, and this implies difficulties when implementing it for different data sources. Moreover, slight changes in results can have significant management implications (e.g., individual quota and the harvest rate).
Free software remains in a stage of development and is maintained based on the interests of the public institutions that finance it, so it is unknown how long it will continue to be developed. Given the uncertainty around the availability of processing software, it is difficult to train specialized technicians effectively. The final choice of the processing software could be based on several factors: the possibility of a decrease in the budget that covers commercial license renewals, the possibility that free software will become outdated in the short term, and the possibility that software will be unable to support new, updated acoustic instruments.
Available processing software may only be endorsed by their institution or program manager, and many lack standardization or even documentation. Hence, the main issue is to establish whether there are differences among the available software. A desirable focus could be on the quantitative comparison of the following features: (i) the capacity to analyze a massive amount of data provided from multiple frequency channels; (ii) the suitability and accessibility of the programming language; (iii) suitable documentation indicating the codes used and a user manual; (iv) evaluation and comparison of the algorithm’s performance; (v) the use of the metadata to estimate the volume backscattering coefficient (e.g., calibration values, pulse duration, and transmitting power) and the impact of metadata on the estimation of the area backscattering coefficient and nautical area scattering coefficient; and (vi) comparison between outputs of mean density and abundance because both quantities are relevant for fishery management (i.e., management quantities that are used to advise stakeholders).
When the power of each processing software is known and the methods are sufficiently general, the software can transcend the quantitative estimation of fish abundance and be used for a wide range of topics. We highlight the importance of using processing tools that are widely accessible and used in the scientific community. Ecologists, freshwater researchers, and others should be trained to use these tools. The accessibility of the processing software is not a problem for countries with a tradition in acoustics and that have achieved consolidated working groups. However, technology transfer has been a problem in Mexico. Although the country is on an upward curve to consolidate the application of acoustic techniques, the availability of processing software has become a “bottleneck”. Breaking this bottleneck is the most immediate challenge for Mexico.

Table 1.
The most cited software available for processing acoustic data.
Table 1.
The most cited software available for processing acoustic data.
| Software | Open Source | Project Administrator | Country of Origin | Programming Language | Availability | References, Contacts, and Repositories |
|---|---|---|---|---|---|---|
| Echoview | No | Echoview | Australia | C++ | Request sales information from info@echoview.com | info@echoview.com |
| Echopype | Yes | The project is directed by Wu-Jung Lee and Emilio Mayorga, but there are other collaborators | United States | Python | https://pypi.org/project/echopype/, accessed on 16 July 2024. | https://github.com/leewujung https://github.com/emiliom leewj@uw.edu, accessed on 16 July 2024 |
| Large-Scale Survey System (LSSS) | MAREC—Institute of Marine Research (IMR) | Norway | Java | Request sales information from info@marec.no | [34] | |
| ESP3 | Yes | National Institute of Water and Atmospheric (NIWA) | New Zealand | Executable with a MATLAB license or with MATLAB Compiler Runtime (free) | https://sourceforge.net/, accessed on 4 September 2024 * You can subscribe to project updates to receive notification of new versions | Yoann.ladroit@niwa.co.nz Pablo.Escobar@niwa.co.nz |
| StoX | Yes | Institute of Marine Research (IMR) | Norway | Java | https://github.com/StoXProject/StoX/releases/tag/v4.0.0, accessed on 20 July 2024 | espen.johnsen@hi.no arnejh@hi.no |
| PyEcholab | Yes | Institute for Research in Environmental Science, University of Colorado, Boulder, and collaborators | United States | Python | https://github.com/CI-CMG/pyEchola/, accessed on 20 July 2024 | wcd.info@noaa.gov |
| EchoPy | Yes | Institut de Recherche pour le Développement (IRD) | France | Python | https://pypi.org/project/echopy/, accessed on 12 August 2024 | echopy@protonmail.com |
| ECOPAMPA | Yes | The Physics and Engineering Research Center of the Center of the Province of Buenos Aires (CIFICEN) | Argentina | Visual Studio 2010 | svillar@fio.unicen.edu.ar | |
| Matecho | Yes | Institut de Recherche pour le Développement (IRD) | France | Executable with a MATLAB license or with MATLAB Compiler Runtime (free) | https://git.outilsis.ird.fr/activeacoustics/matecho, accessed on 19 August 2024 | [22] |
| MOVIES + Movies-B | No | France | [32,35] | |||
| Echogram | Yes | Centro Interdisciplinario de Ciencias Marinas | Mexico | R | https://github.com/hvillalo/echogram, accessed on 26 August 2024 | hvillalo@inp.mx |
| Bergen Echo Integrator (BEI) | No | Institute of Marine Research (IMR) | Norway | C++ | [21,36] | |
| SONAR 4,5,6 | No | |||||
| MOVIES 3D | No | L’Institut Français de Recherche pour l’Exploitation de la Mer | France | http://flotte.ifremer.fr/Presentation-de-la-flotte/Logiciels-embarques/HERMES-MOVIES3D/Telechargem, accessed on 2 September 2024 |
4. Sampling Design
All known information on a population should be used to create an efficient sampling design that provides the best field data to estimate biomass. For this purpose, the placement of transects must maintain a balance between the total area to be covered, the available time, and the assigned budget. For Mexico, the objective is to design a survey that generates a long and consistent time series, because once the design is chosen, it can be used systematically to produce estimates that are comparable to each other.
Classical sampling theory states that a random sampling procedure provides unbiased estimators of the mean and variance. If the sampling design used is systematic, the samples are considered not to have been taken independently of each other, and statistically, there is no valid estimator of variance from a systematic sample unless the population is randomly distributed [37]. The schools of fish vary in two dimensions, height and width, and the closest observations within a sample could exhibit a high “correlation” because this factor depends on the distance between the observations [38]. If sampling is performed at a scale larger than that of the correlation length, classical methods can be used to estimate the variance. But if this is not the case, then a model that explores the possibility of autocorrelation of the samples is needed.
In acoustics, three commonly used sampling designs are systematic zig-zag, systematic parallel, and stratified random parallel. The stratified parallel transects provide maximum separation between transects, resulting in the least correlation between them and greater coverage. However, it may be more difficult to estimate the variance of the estimate. According to Kimura and Lemberg [39], zig-zag transects are better than stratified parallel transects at low transect densities; on the contrary, stratified parallel transects are better than zig-zag transects at higher transect densities. Furthermore, Kimura et al. [40] explained that change regions are oversampled with the zig-zag design, while regions between changes are undersampled.
Mexico uses these three sampling designs in different regions, covering the area of distribution of the small pelagic fish populations in northwestern Mexico, including the sampling of shallow bays, which have historically maintained a substantial portion of populations of these species. The Gulf of California and the west coast of the Baja California Peninsula use a stratified parallel sampling design, while a zig-zag design is used for the mouth of the Gulf of California (Figure 2), considering a sampling design until the 200 m isobath that has been surveyed in the recent 15, 12, and 10 years, respectively, using the same echosounder, ship, and fishing protocol [41,42,43].
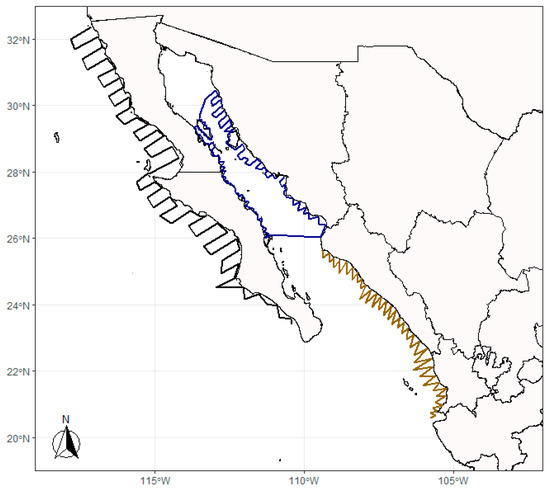
Figure 2.
The sample design for acoustic survey research indicating the transects used in the different regions of the Mexican northwest Pacific Ocean. The three main regions are spatially located as follows: (i) the west coast of the Baja California Peninsula (transects in black); (ii) the northern region of the states of Nayarit and off the shore of Sinaloa (transects in gold); and (iii) the Gulf of California (transects in blue).
Fréon et al. [44] mentioned that schools of fish display migratory behavior at night-time toward shallower waters, where they lose their ability to behave as schools and disperse and extend into aggregations and layers in search of food. In northwestern Mexico, pelagic fishing activities occur during the night and the so-called el oscuro, a period of 22–26 days centered on the new moon of each month [45]. In the Gulf of California, schools are maintained while they migrate to shallower waters, and they are distributed closer to the surface (<40 m) at night [43], making them more accessible for commercial fishing and sampling.
This school behavior requires a different acoustic sampling procedure implemented by agencies such as NOAA (California, United States) for Pacific sardines; IFREMER (Brest, France) for anchovies; MEDIAS (Mediterranean International Acoustic Survey) for European anchovy and European sardine [46]; the Japan Fisheries Research and Education Agency (FRA) for anchovies, herring, and other pelagic species; and the Institute of Marine Research (IMR) for herring [47]. For these species, the estimates of density and abundance are mainly supported by acoustic data collected during the day. Therefore, the night-time acoustic datasets are neglected due to diel vertical migration of the species, avoiding negative bias in the outcomes. Consequently, these night-time data provide little information on the stock status [48,49,50,51]. During the night, the acoustic sampling performed by these agencies can identify species by superficially using mid-water trawls. This procedure implies that the ship returns to previous positive areas where the target species were identified with acoustic equipment. In Mexico, when a school is identified during a survey, the ship keeps going until it has gone 1 nautical mile, which is an elementary sampling distance unit. Then, the transect is interrupted to carry out the fishing set in the opposite direction. At that time, the captain and the crew execute the fishing maneuver to position the net at the depth of the previously observed shoal. Because the ship lacks net sensors, the angle at which the net is deployed is monitored by the researchers. The fishing set begins with a mid-water trawl for 30 min at a constant speed of 3 knots. Subsequently, the ship goes back to the point of interruption to provide continuity to the survey. The criteria for carrying out the fishing sets are described by Doray et al. [50].
The presence of new platforms for survey research in Mexico has allowed the implementation of alternative methods for the acoustic data collection for small pelagic species. For example, since 2021, the RV Dr. Jorge Carranza Frazer has used a methodology closer to the acoustic data collection proposed by NOAA. During 2023, there were changes to the sampling design at the mouth of the Gulf of California: the surveyed transect was modified from zig-zag to stratified parallel, the EK60 echosounder (38 and 120 kHz) was replaced with a broadband frequency echosounder (EK80) with a single frequency (38 kHz), and the estimates of density and abundance were mainly supported by daytime data collection and nighttime mid-water trawls. Stock assessment and fishery management approaches often use time series that are collected during research surveys with standardized protocols (the number of sampling stations, similar fishing gear over time, and defined periods). These changes represent breaks in the time series because direct comparisons between estimates might not be easy.
5. Frontiers for the Application of Acoustics
5.1. The Contribution of Acoustic Data to Ecosystem Studies
The scientific community agrees that to maintain sustainable fisheries, it is not sufficient to assess the target species alone; the role of exploited species must also be assessed within the ecosystem in which they live [52]. The implementation of this management approach requires multidisciplinary efforts that include multiple species and synoptic and periodic monitoring to promote more realistic fishery management.
The first effort made to understand the structure and function of marine ecosystems through the trophic relationships between components of the studied communities was the direct application of “ecosystem models” developed in the early 1980s [53], which were later adapted to routines such as Ecopath, Ecosim, Ecospace [54], the integrated software package EwE [55], and Ecotroph [56]. These tools have been useful in addressing questions regarding the ecosystem impacts of fishing. However, these models have a high degree of complexity that increases as the number of functional groups increases. In addition, various types of information, including species abundance, diet composition, catches, consumption rates, ecosystem properties, and trends of species biomass, are required for their application to plausible scenarios [57]. In commercially exploited species, discard and catch information from arrival notices can provide that information or even help to corroborate the results to reinforce the time series, but species that are not commercially exploited are subject to unverified assumptions. For example, there are no catch data available for the “mid-trophic level” functional group, which includes cephalopods, gelatinous organisms, adult euphausiids, and mesopelagic fish [58]. Nevertheless, they represent an important group, particularly in ecosystems with wasp-waist-type dynamics [59]. If ecological management units are spatially large, they will never be assessed properly due to the limitations associated with human and economic resources [60].
Comparatively, acoustic data provide quantitative and qualitative metrics over a wide range of scales and with high spatiotemporal resolution [52]. They allow for observations ranging from hours to long time series, and they can gather information on marine organisms of all sizes (from fish eggs and larvae to zooplankton and larger species), identifying and estimating them by size. Furthermore, they provide data on scales ranging from centimeters to ocean basins [61].
According to Bertrand et al. [62], ecosystem models do not consider the variability and the interactions between the physical environment and species communities. According to Lazzari and Tupper [63], when the complexity of the habitat increases, properties such as its species richness and abundance also increase. Other properties associated with the seabed also play an important role in the habitat description [64]. In this sense, acoustic methods can provide data such as substratum characteristics. By associating the backscatter intensity with the angle of incidence, it is possible to detect differences in seabed properties [65,66], and the frequency response can indicate the type of seafloor [67]. For example, Siwabessy et al. [68] performed a backscatter signal analysis to determine the backscatter characteristics of seabeds associated with seagrass beds. Cutter and Demer [67] used multifrequency split-beam echosounders and proposed the multifrequency biplanar interferometric imaging technique to predict the potential habitat for demersal fish (Sebastes spp.); this finding helped to optimize the surveyed area. Gastauer et al. [69] identified different seabed habitats to investigate the ecological meaning of clusters of fish and the distribution of fish density hotspots.
There are differences in the level of implementation of ecosystem-based fishery management (EBFM) between developed and developing countries [70]. In Mexico, most management strategies are aimed at a single objective. Ecopath was constructed for the northern Gulf of California, including for small pelagic species [71], and for a benthic ecosystem exploited by shrimp trawlers in the Gulf of California [72] and the Gulf of Ulloa [60], and it has been applied to jumbo squid (Dosidicus gigas [73]) and loggerhead marine turtles (Caretta caretta [74]). The available Mexican fisheries information is quite variable; for a few resources, there are more than 50 years of well-documented information, while for others, in the best of cases, there are basic levels of information. These fisheries usually make a minimal economic contribution to the region; consequently, they have a limited research budget. Applying ecological models such as Ecopath to these resources is not a viable option, because the detailed biological fishery information may be limited or even unavailable.
Currently, acoustic data collected for stock assessment are not utilized effectively in understanding the interactions among species. The contribution of information from plankton and micronekton on ecosystem functioning or the study of ecological relationships, such as prey–predator and intra- or inter-specific competition, is not considered. During data processing, these are assumed to be noise and therefore eliminated. In Mexican research, ecosystem studies supported by acoustic tools have been developed to a limited extent. Few studies had been published prior to 2020 [43,75,76]. More recently, collaborations between national and foreign ecologists have flourished. One example is the daily vertical migration of zooplankton and its seasonal cycle in the Gulf of Mexico [77]. In the Gulf of California, there have been some recent ecological studies supported by acoustic data. Portner et al. [78] analyzed the responses of the mid-trophic communities to oceanographic and climatic variability, while Sarmiento-Lezcano et al. [79] estimated the biomass of migratory mesopelagic species, decapods, and euphausiids and their role in the respiratory flux. However, the technique is not widely used in Mexico. Other Mexican researchers in marine sciences only use acoustic data to evaluate resources.
There are an increasing number of publications that have used an ecological approach with acoustic methodologies throughout the world, indicating the appropriation of acoustic techniques in diverse research fields. In Mexico, to avoid failures in the potential application of acoustic methodologies, the advantages of acoustic techniques need to be disseminated and socialized so they that are more understandable to researchers before these tools can be incorporated into research programs. In addition, these are perceived as expensive tools that are used only for industrial fisheries, while most of the fishing in Mexico is carried out with coastal or small-scale fleets. Collaboration between researchers from different disciplines could facilitate the combination of acoustics as a tool and ecology as the main objective to enhance the scenarios that are moving toward EBFM by integrating multidisciplinary oceanographic research programs, ecology, and fishing. Acoustic data from a range of platforms could provide auxiliary and complementary information to develop better ecosystem models.
5.2. The Relevance of Acoustic Data for Marine Protected Areas and Endangered Species
Marine Protected Areas (MPAs) represent a management tool created as an alternative approach to reduce and prevent the intensity of human pressure on marine life and habitats [80]. Mexico has decreed 66 MPAs covering an area of approximately 13.12 million ha. The details of the geographic distribution of these MPAs are available in a previous study [81]. Since their implementation, some MPAs have been more successful than others. For example, in the Gulf of California, ~23,300 km2 have been decreed as MPAs, but only the national park known as Cabo Pulmo has met conservation and sustainability goals [82]; it has experienced a great recovery in the biomass of fish and top predators [83].
There are guidelines and recommendations for MPAs, which highlight the need for long-term national programs to monitor variations in key parameters such as the age structure of marine organisms, variations in the number of prey, and the rate of habitat loss [84]. Most of the literature on MPAs involves traps or baited traps, fishing, hook-and-line fishing surveys, optical methods, and underwater visual censuses with divers [85,86,87]. While these methodologies are useful for bottom-dwelling species, there is a lack of knowledge on the response to the management measures for pelagic and benthic species [88].
Acoustic methods could be a particularly valuable tool for these regions. The procedures are non-invasive, can provide long-term observations and sample species assemblages throughout the water column over a wide spatial range in a record time, and may even be more economical than the methods previously described [85]. Furthermore, these methods can be combined with other tools—for example, optical methods to identify species mixtures and their size structures in areas where fishing is restricted [89,90]—even when the rocky high-relief substrates are inaccessible to standard survey trawls [91]. Combining acoustics with systematic conservation planning tools can take monitoring a step further, allowing for the adaptive management of protected areas to assess reserve effectiveness based on the spatiotemporal patterns of ecosystems [92].
Considering the number of MPAs in Mexico and the budget to evaluate them, the selected tools must be able to monitor the recovery of fish stocks effectively. Mexican scientists have published innovative work on this topic. Mayorga-Martínez et al. [93] showed that the planning and management of marine areas in the country could benefit from the application of active acoustics. They evaluated the fine topographic complexity of a group of coastal coral reefs in Veracruz at mesophotic depths (>30 m), which are rarely included in marine reserve designs and management, despite their ecological importance and connectivity to shallow reefs. With this information, they proposed expanding and reshaping the core zone to include the high structural complexity exhibited by the entire reef complex. Another example of sampling to monitor change inside MPAs was carried out in the El Bajo Espíritu Santo seamount. Villalobos et al. [90] described the bathymetry, oceanographic habitat, distributions of zooplankton and fish, determination of the dominant fish species, estimation of their biomasses, and determination of the target strength (TS) of the Pacific creolefish (Paranthias colonus) and the finescale triggerfish (Balistes polylepis). The researchers obtained these results by collecting and integrating acoustic, optical, and oceanographic data.
Mexican scientists have also used innovative approaches to apply acoustic techniques for endangered species. The Biosphere Reserve of the Upper Gulf of California was established as an MPA with the purpose of protecting vulnerable species. Since its creation, various social problems have led to an active debate about fishing in the area [94]. The totoaba (Totoaba macdonaldi) is an endemic species of the Gulf of California. Since 1976, commercial fishing of this species has been banned due to the alarming decrease in its stock. Nevertheless, illegal fishing and a lack of scientific monitoring have led to controversies regarding stock conditions and conflicts of interest in the management of the current population [95]. In this region, the most recent update on the current totoaba biomass was supported by fishery-independent data (an acoustic survey).
As MPA management becomes more effective, the effects will be reflected in the enhanced provision of a variety of ecosystem services for the communities. In the Mexican context, these kinds of studies require institutions to apply innovative methodologies that produce the best results and that provide stakeholders with the best advice for their decision making.
5.3. Acoustic Assessment of Fishery Resources in Freshwater and Shallow Water
Inland waters are defined as lakes, rivers, streams, canals, reservoirs, and other land-locked waterbodies. They have an important role in providing animal protein for humans, in maintaining riverine fish abundance, and have an ecological role as a reservoir of biodiversity [96]. Fishery hydroacoustic research in freshwater aquatic ecosystems has mainly been developed in North America (Canada and the United States) and northern and central Europe. Its development has been favored by significant reductions in the size of echosounders and other acoustic instruments as well as cost reductions. Other important work has been undertaken in Australia, China, and the East African Rift Valley. Conversely, there have been fewer studies from South America, Russia, and New Zealand. This growth is parallel to advances in marine acoustics, which are quickly being adopted by developed countries [97].
Mexico has about 320 hydrological basins. Among these, there are 37 main basins, of which 12 discharge into the Gulf of Mexico and the Caribbean Sea, 19 that discharge into the Pacific Ocean and the Gulf of California, and 6 that are endorheic. It is estimated that there are about 70 lakes in Mexico. There are also 840 reservoirs classified as large dams. In 169 of them, there are productive activities such as commercial fishing, sport fishing, and fish farming. The scientific research that is carried out on species of commercial importance in freshwater ecosystems is of a fishery biology type (e.g., yield per recruit and catch per unit effort (CPUE)). In contrast, there are no periodic evaluations of biomass for a large portion of these reservoirs. According to the National Fisheries Chart [19], the most important species for commercial fishing are the groups of mojarras (i.e., cichlids such as tilapia), carp, channel catfish, and charales; in sport fishing, the species of interest is the sea bass.
In Mexico, Linares et al. [98] applied acoustic techniques to evaluate red grouper aggregations, recognizing the potential of these applications in the evaluation of fish that inhabit areas of steep slopes or use them as spawning grounds. This work is pioneering in the modern application of these techniques in southern Mexico. It highlights relevant points to improve the results in the application of acoustics in shallow waters, which can be applied to other areas of the Mexican Caribbean.
Rowell et al. [99] estimated the abundance, biomass, length structure, and spatial distribution in the Gulf Corvina in the Colorado River delta, Mexico, through several acoustic surveys combined with hydrophones (passive acoustics). This procedure provided excellent fishery-independent data. Besides that study, little research has been carried out in shallow waters, despite the fact that a large part of the territory has these characteristics.
Similarly to the situation with some MPAs in Mexico, the budget available to evaluate dams and lakes must be maximized as much as possible. In large dams, the use of nets represents a passive method that increases the time required to obtain the dataset. Moreover, there is a high labor cost, and the specific fishing gear chosen could bias the biological data, mainly the size structure of the analyzed fish population, leading to a lack of continuity [100]. On the other hand, the range of direct visual underwater observations is limited to a few meters because in many Mexican waterbodies, the optical properties are poor and transparency is low; thus, the use of other optical sensors, including satellite images, is very limited. Acoustic methods offer new possibilities for evaluation. Echosounders can be easily installed on small boats, and institutions with experience and instruments can provide training so that a small team of local researchers can operate hydroacoustic technologies.
5.4. Target Strength
TS is a scaling factor to convert the intensity of the energy values that are backscattered by the object into abundance. Without knowledge of an organism’s TS, it would not be feasible to translate acoustic densities into biologically meaningful data. TS is not a single value; rather, it is the average value of a distribution of individual observations of the backscattering cross-sections (, with the units that are often expressed in terms of body length [101]. There are extensive reviews on TS measurement methods [102,103,104]. These experiments can be separated into in situ—using measurements made on fish with a natural behavior and free swimming—and ex situ—using measurements made on fish confined to a cage, immobilized, or unconscious. The checks are influenced by a large number of factors including the method used, the angle of inclination of the organisms, and up to 90% of the state of the swim bladder (if any) [105]. In addition, the estimated values are not interchangeable between the frequencies used.
TS is considered to be the most important source of error in acoustic estimates of absolute abundance [101]. Underestimating the TS would overestimate the abundance, while overestimating the TS would underestimate the abundance. Hence, due to their economic importance, considerable efforts are made to determine the TS of species that support fisheries. Of note, research on this topic is also growing for organisms of ecological importance in disturbed ecosystems. TS has been used widely to estimate species distributed in the North Sea, the Baltic Sea, the North Atlantic, the Southeast Atlantic, the North Pacific, and even the South China Sea (see Table 4 in Liu et al. [106] and Table 6.4 in Simmons and MacLennan [101]), among others. In tropical species, this type of study is limited. When the TS for any species is unknown, published values of similar species or the same species distributed in another region are usually used. However, this approach introduces inaccuracy, which reduces the potential of the data obtained from survey research by affecting estimates of the relative abundance and biomass.
For Mexico, there have been very few specific studies estimating TS. The first efforts focused on estimating the TS of species distributed in Mexican waters were for Pacific thread herring (Opisthonema spp.), totoaba, and giant squid (D. gigas). Although Mexican researchers perceive that this issue is important, these TS models are insufficient for a country that has large commercial and potential fisheries. Ideally, acoustics research must include the development of TS models, especially in those cases where there are no TS models in the literature to provide support for acoustic survey data. In the next decade, Mexico must focus on this critical point to implement and consolidate the technique in the country.
6. The Relevance of Time Series
6.1. Proportionality between Indices of Relative Abundance and Abundance
A stock assessment can usually be supported by two kinds of datasets. The first comprises fishery-dependent data (i.e., extensive data collected by commercial fleets). The second comprises fishery-independent data, which are commonly obtained from survey research cruises. There are fundamental requirements for these data to become valuable: a consistent year-to-year sampling design that covers the distribution of the stock, a carefully standardized fishing operation [107], and fishing nets with selectivity that can be assumed to be constant [108]. For any commercial fishery, the catch rate or CPUE is a traditional index of relative abundance. Thus, the CPUE may be used as a proxy for the stock abundance, assuming that both the CPUE and stock abundance are proportional [109]. However, it is usually difficult to make this assumption. For small pelagic species, the CPUE could remain relatively stable while the stock abundance decreases. This phenomenon, known as hyperstability, indicates a disproportionate relationship between the CPUE and stock abundance [109,110]. Another phenomenon for commercial fisheries is the density-dependent catchability, which occurs when the catchability of small pelagic fish schools increases as their stock abundance decreases [110,111,112]. From this perspective, hyperstability and density-dependent catchability exhibit a mirror effect for measuring the fall in stock abundance and both mask a decline in the index of relative abundance time series (e.g., CPUE) (Figure 3).
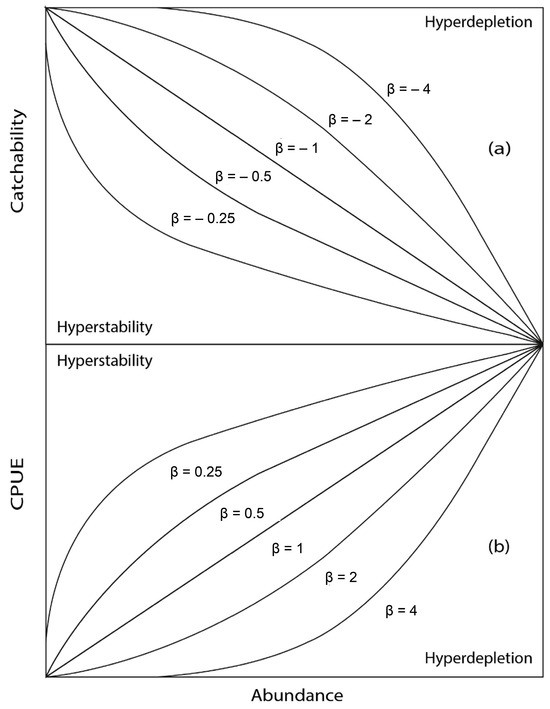
Figure 3.
The graphs show (a) the relationship between abundance and catchability, indicating patterns of density-dependent catchability, and (b) the relationship between abundance and catch per unit effort (CPUE), exhibiting different patterns of hyperstability [109,110,113].
6.2. The Relevance of Density Time Series and Their Use as an Index of Relative Abundance
Since the 1980s, fishery models fitted with multiple time series using fishery-independent data have been implemented successfully [114,115]. Indeed, even a “weight factor” has been added to these data to measure the performance of fishery-independent data, thus enhancing the estimation of parameters in the models. The main reason for using multiple time series is related to the quantity of information contained in each dataset. For example, a time series of an index of relative abundance that exhibits a negative trend indicates that the population abundance is decreasing. In contrast, a different index of relative abundance could indicate a positive trend for the same time series; consequently, this index would suggest that the population abundance is increasing. It is a difficult situation when these contradictory datasets are recorded and included in the fishery models [113]. However, there is also an advantage: multiple time series could contain complementary information that helps to understand the changes in abundance. In Mexico, although independent estimates of fisheries began with an assessment program of eggs and larvae for pelagic fish stocks, they were eventually discontinued due to budget limitations. In 2008, the acoustic methodology was implemented and replaced the abundance estimate provided by the collection of eggs and larvae of small pelagic species. In other countries, abundance estimates using eggs and larvae have been combined with acoustic methods, and the generated time series are used in population assessment models. During the generated time series, there are sometimes changes in the fishing gear or ships used and even increased sampling with other tools. Because the new gear has its time series, the old and new time series can be entered as separate indices of relative abundance or statistically standardized [116].
MacLennan et al. [117] highlighted that density () is proportional to the area backscattering coefficient (). This assertion suggests that or the nautical area scattering coefficient () could be used as an index of relative abundance and, consequently, to assume that it is proportional to abundance (N). Assuming that a time series of ρ values has been estimated, it could be possible to assume a priori the changes in the abundance of biological targets.
According to [109], the index of relative abundance (I) in trawl surveys can be expressed as ; consequently, N can be estimated as , where q represents the catchability [116,118]. The main assumption is that I is proportional to N. For this reason, estimating the best I time series is difficult. The best option is to utilize several I values. If the proportionality for any I is weak, then the equation could be re-expressed as , where is a power parameter indicating proportionality when its value is 1 or close to 1, and is a random error assumed as [109]. MacLennan et al. [117] explained that acoustic studies provide two important quantities: the density and the abundance of biological targets. Specifically, is expressed as the number per unit surface area of the layer. An estimation of could represent an index of relative abundance for an area at time t. Perhaps the most important mathematical expressions using two surface scales are for km2 and for nmi2, where represents the backscattering cross-section. The assumptions about the field data, including the statistical distribution (e.g., normal, lognormal, and delta), the presence or high frequency of negative sampling stations, and a spatially structured population, would affect values—they could be biased and would provide little information about the biomass. To avoid a failure to estimate ρ, several assumptions may be made depending on the methodological approach: the application of generalized additive models (GAMs) with spatial variability, assuming that the samples collected are statistically independent of each other; the application of geostatistical techniques that can represent the spatial variation of density, providing solutions to the spatial correlation in a structured population without any assumption regarding the independence of the sample; and a lognormal/delta distribution, assuming the effect of negative sampling stations on estimates of ρ (e.g., Pennington estimator), also assuming statistical independence in the samples.
The random functions for interpreting the spatial distribution of a population within a specific area allow for the development of models with explicit spatial variability, such as generalized linear models (GLMs) or GAMs [119]. One of the main disadvantages of these methods for abundance estimation is that they do not provide simple estimates of error variance or survey precision.
There are a large number of geostatistical tools that allow one to determine the sample variance in a systematic sampling design. The most relevant aspect of a geostatistical approach, and perhaps why it is currently one of the most widely used approaches, is that it does not require the independence of the sample to be assumed, and it offers an explanation for spatial variability [120].
The delta-lognormal approach proposed by Pennington [121] includes highly skewed data (known as positive sampling stations) and negative sampling stations denoting a value of zero (apparent absence of the target species). Both datasets are used to estimate the mean value of the survey. For Syrjala [122], this method is not resistant to relatively small and undetectable deviations from the assumptions of the model. Thus, an excess of small values generates poor behavior in the delta-lognormal distribution, an increase in the bias, and a loss of information in the estimation of the mean value [40,123].
In Mexico, these topics have not been widely analyzed by fishery biologists, but they have been applied in other areas such as earth sciences and engineering. Thus, the integration of interdisciplinary groups regarding the use and application of these statistical procedures would be desirable. There is the possibility that the acoustic samples have spatial autocorrelation; the degree of this autocorrelation depends on the size of the schools (length and width) and the distance between transects. Even if these interactions are ignored, they would impact the estimated variance.
6.3. Hydroacoustic Data and Integrated Stock Assessment Models
Traditionally, the fishery management approach used by international fisheries agencies (e.g., NOAA, IFREMER, the General Fisheries Commission for the Mediterranean (GFCM), and the Scientific, Technical and Economic Committee for Fisheries (EC STECF)) has been based on abundance estimates comparing biological hypotheses and datasets. NOAA has developed two methods to measure the uncertainty and discrepancies in outcomes such as abundance as well as management quantities: the explicitly vulnerable biomass and the annual harvest rate. The most widely analyzed stocks have been small pelagic species, mainly the Pacific sardine and the northern anchovy.
The first method is based on ichthyoplankton surveys and extensive field datasets collected using a stratified sampling design [124]. The datasets were analyzed using the DEPM, which is based on the ratio between daily egg production and the specific daily fecundity of the species [125,126]. This approach provides estimates of the biomass, spawning biomass, and related biological parameters, as well as indices of relative abundance such as the egg production index (eggs 0.05 m2 day−1), DEPM data (103 t), and historical egg production data (eggs 0.05 m2 day−1) [127]. These indices have been used frequently for stock assessment purposes. Moreover, additional indices of relative abundance have been computed, such as the reproduction area (nm2) and the proportion of positive stations, which refer to the marine stations where the eggs or larvae of target species were collected [128,129].
The second methodological approach is the application of stock assessment models, mainly those called integrated catch-at-age models. These statistical models can represent the most important features of population dynamics (i.e., growth, recruitment, and mortality, both natural and fishing) and incorporate all the information known about the analyzed species. When these models are tuned using fishery-independent data, their realism increases. In the last two decades, the implemented methodologies have been diverse (Table 2).
Acoustic data can also provide an estimate of the biomass and indices of relative abundance and can serve as an alternative to the DEPM. Moreover, and SA have suitable statistical properties for use in the integrated catch-at-age models [109]. This manner of assessing marine resources has been a standard procedure. Comparing outcomes that search for the best scientific evidence can increase the level of scientific discussion, enhance the conclusions, and help to maintain the sustainability of the target species.
In Mexico, the DEPM has been implemented successfully [18,130], but it is not used systematically. Hence, there is a lack of consistency in the temporal sequence of the obtained outcomes, and the time series of the biomass and the index of relative abundance are only used in the stock assessment models. Since 2008, acoustic data have been collected systematically in the Gulf of California, where the target species is mainly the Pacific sardine. Estimates of the biomass are available for 15 years (2008–2023). The index of relative abundance used to fine-tune the integrated catch-at-age model of the Pacific sardine in the Gulf of California is biomass-computed from the acoustic data [131]. The rationale and support for this procedure are based on the fact that the time series of acoustic estimates do not include a relative and time-dependent proportion of the real abundance of the target species. This value is known as detectability [132]; it is estimated within the insonified volume, included in the echo-integration, and can reduce bias in the final estimate. Therefore, the biomass calculated from acoustic data can be understood as an index of relative abundance rather than an absolute value of biomass [132]. Detectability has been estimated for benthic resources, but its utility for small pelagic species remains unclear.
In Mexico, stock assessment for small pelagic species has focused on maintaining two sources of information for fishery management purposes: one based on acoustic data and the other applying fishery models fine-tuned through acoustic outcomes [42,131]. Future challenges include choosing the best indices of relative abundance for the stock assessment models, the possibility of incorporating the density estimated from acoustic data, and the use of different density values considering the spatial distribution of the target species in the Mexican Pacific Ocean. Finally, the objective is to use more informative fishery-independent data—acoustic data may be a good choice. Changing the input data is a common procedure when integrated catch-at-age models are solved. In this way, different assumptions can be analyzed, and the performance of the fishery models can be assessed. The contribution from scientific fishery management will have an impact on the advice to stakeholders and decision makers, possibly affecting the governance of the target species.
Table 2.
Age-structured models are commonly used to input data such as acoustic data (including indices of relative abundance). The models included are the most used and referenced in the worldwide literature.
Table 2.
Age-structured models are commonly used to input data such as acoustic data (including indices of relative abundance). The models included are the most used and referenced in the worldwide literature.
| Package Name | Acronym | Does the Package Include a Population Dynamic Structure? | Is Uncertainty Assessed? | Does the Model Require Indices of Relative Abundance? | Is Documentation Available in the Form of a Peer-Reviewed Publication? | Source |
|---|---|---|---|---|---|---|
| Age-structured Assessment Procedure | ASAP | Yes | Yes | Yes | Yes | [133] |
| C++ Algorithmic Stock Assessment Laboratory | CASAL | Yes | Yes | Yes | Yes | [134] |
| Stock Synthesis Model | SSM | Yes | Yes | Yes | Yes | [114,135] |
| Assessment Method for Alaska | AMAK | Yes | Yes | Yes | Yes | [136] |
| Simple Stock Synthesis | SSS | Yes | Yes | Yes | Yes | [137] |
| Extended Simple Stock Synthesis | XSSS | Yes | Yes | Yes | Yes | [138,139] |
| Woods Hole Assessment Model | WHAM | Yes | Yes | Yes | Yes | [140] |
| A Length-based, Age-structured Model | Multifan-CL | Yes | Yes | Yes | Yes | [141] |
7. Mexican Budget for Research
7.1. Acoustic Equipment and Instrumentation: Mexican Research Vessels
In Mexico, there are currently three platforms that aim to carry out marine studies and acoustics research. Two of them are the property of the IMIPAS, which coordinates and provides scientific research and advice in fisheries and aquaculture. The platforms are the RV BIP XI, a 25 m long boat that allows for coastal sampling, mainly of shallow areas. Its autonomy is 22 days, and it can hold 13 people, including researchers, technicians, and crew. It is equipped with a SIMRAD EK60 echosounder with two 38 and 120 kHz transducers embedded in the boat’s hull. It has winches to work with demersal or pelagic nets (Table 3). Since 2008, this vessel has carried out uninterrupted acoustic surveys and maintains a busy schedule of annual surveys, mainly assessing small pelagic fish, Pacific hake, and giant squid, and some extraordinary surveys that have been carried out in northwestern Mexico (e.g., of totoaba). This vessel has provided the longest time series of acoustic data of small pelagic species in Mexico (2009–2023).
Table 3.
Platforms and equipment available for acoustic surveys in Mexico.
RV Dr. Jorge Carranza Fraser is almost 60 m long. It was financed by the Inter-American Development Bank and is undoubtedly the most important investment in Mexico for acoustics research. The acoustic system comprises seven transducers at the frequencies of 18, 38, 70, 120, and 200 kHz and two side frequencies of 70 kHz, coupled to a SIMRAD EK60 echosounder. It is built to be autonomous for 60 days, which allows it to reach the Exclusive Economic Zone, and can house 22 researchers and technicians. Its programming includes multipurpose campaigns for several species, mainly small pelagic species, Pacific hake, and squid. This modern vessel has advantages over older ships: a quiet diesel–electric engine, a liftable keel to prevent bubble reverberation, and better modern fishing facilities; these features provide remarkable results and spatial coverage.
Since 1980, The National Autonomous University of Mexico (UNAM) has managed RV El Puma. Although this vessel was initially used for acoustic surveys, it is currently in limited use for this purpose. RV El Puma has an autonomy of 30 days and carries a SIMRAD EK60 echosounder with a 38 kHz transducer that has been used mainly to investigate plankton and pelagic organisms such as squids and small pelagic fish. The EK60 echosounder and its ER60 data acquisition software are no longer manufactured. The SIMRAD EK80 system has taken its place; it is a more advanced system that has broadband capability and a significant improvement in the signal-to-noise ratio. INAPESCA and CICIMAR acquired this equipment, which has been installed in and uninstalled from different platforms, such as small boats, via a swing steel arm. These devices allow autonomy to carry out sampling in different regions, and the vessel can even reach continental waterbodies, where research with this technology has not yet been carried out.
Other vessels carry out marine research in Mexico, including the Alpha Helix Oceanographic Vessel, which is the property of the Center for Scientific Research and Higher Education at Ensenada (CICESE). Although it has carried out extensive hydrographic and planktonic campaigns, it does not integrate biological acoustics as a research goal; therefore, it does not have this kind of echosounder installed. RV Justo Sierra, which is also the property of UNAM, has recently installed an EK80 multifrequency echosounder (Table 3). The development of acoustic instrumentation is constant, and the miniaturization of echosounders has triggered the development of instruments whose potential is expanding every decade, in a stage that some have called the robot revolution [142].
Although it is not the aim of this review to enumerate global advances on this topic, there are promising developments of alternative platforms that provide opportunities to address new questions with fewer investments and operating challenges than a ship. For those institutions that do not own ships, unmanned surface vehicles (USVs) have proved to be operationally efficient and have the potential to be incorporated into research programs [143]. According to Eriksen et al. [144], there are advantages to coupling echosounders: This approach provides a depth profile of plankton (macrozooplankton and mesozooplankton) and fish aggregations in water masses that can be coupled to hydrological–oceanographic stations that are already being used on Mexican vessels. Although these developments are different from the “traditional” approach, they have the potential to increase the information available and can be incorporated by institutions interested in expanding their interdisciplinary research programs. Given the limited human resources of some Mexican institutions, investing in instrumentation to develop this research goal is unrealistic in the short term. However, capitalizing on investments through scientific collaboration schemes to maximize the benefit of the campaigns—and thus obtain more and better information and biological data—could be assumed to be a medium-term goal.
7.2. Investment in Human Resources
Fisheries acoustics is an applied science that requires a multidisciplinary approach between physics and engineering that is framed in a biological context. Acoustic surveys should be conducted in the presence of at least one scientist who is experienced in fisheries acoustics and is familiar with the target species in the surveyed area. This scientist can guide the fishery and recognize the potential of complementary data. In Mexico, there are few people with experience and formal training in the operation of acoustic equipment. Indeed, there are not enough human resources for the number of acoustic campaigns that are currently being carried out inside and outside the country with Mexican investment. A lot of acoustic data are piling up, and there is a failure to recognize the potential that this information has for understanding the assemblages that exist between zooplankton, ichthyoplankton, and mesopelagic organisms beyond the assessment of the most commercially important species (e.g., small pelagic fish, jumbo squid, and Pacific hake). Future challenges include developing a strategy to build long-term capabilities to understand and use acoustic techniques through undergraduate or postgraduate education. This approach should include updates from national experts, developing skills to capitalize on existing investments, and maximizing the applicability of acoustic techniques. Engaging students in solving real-world problems and linking the needs of the country with the needs of universities would provide them with direct research opportunities and experience. This collaboration could lead to the development of new methods that respond to the demands of the complex and contrasting ecosystems exhibited in Mexican waters, such as mixed aggregations and species assemblages, for which the acoustic characterization of locally distributed species is unknown.
Through its academic unit, Centro Interdisciplinario de Ciencias Marinas (CICIMAR), National Polytechnic Institute (IPN) has developed a postgraduate program in which the topic of fisheries acoustics has recently expanded. Although the working group is limited, it has had collaborations, mainly with INAPESCA, to assess marine resources. In this sense, there are experiences from IPN that provide advice and develop research focused on marine acoustics. While these efforts satisfy some demands, a single institution cannot solve all problems. Promoting exchanges between North American and European universities, which have solid postgraduate courses and consolidated working groups, would be a useful choice. The advantages of marine acoustics have been recognized by stakeholders in Mexican institutions with a focus on fishery management as necessary in contributing to the sustainability of harvested stocks. Estimates based on fishery-independent data are valuable because they can be compared with stock assessments supported by fishery-dependent data. This comparison could allow researchers to test hypotheses regarding stock conditions and to provide recommendations to enhance the management instruments of the Mexican government.
8. Conclusions
Improving fishery management in a changing environment is a global challenge. Mexico must face this challenge with solid scientific tools and modern assessment methods to streamline recommendations and the decision-making process. This approach would comply with the objectives of sustainable development and contribute to improving the quality of life of coastal populations while generating a steady supply of fish protein.
The successful application of fishery acoustics in Mexico has been documented for the Pacific sardine (Sardinops sagax) fishery in the Gulf of California. Acoustic data have been useful for providing biomass estimates and indices of relative abundance; these estimations are usually contrasted with biomass estimated from statistical models expressing the population dynamics for this species; under this scenario, it is possible to obtain information from fishery-independent data (an acoustic survey) and fishery-dependent data [145]. The acoustic outcomes have been used to support the management of the Pacific sardine fishery; this endeavor is included in the legal Mexican guidelines through the Fishery National Chart [19], the Fishery Management Plan [146], and the Mexican Official Standard [147]. Additionally, the scientific information reported using acoustic data has been used to obtain international certification of this fishery from the Marine Stewardship Council (https://fisheries.msc.org/en/fisheries/small-pelagics-fishery-in-sonora-gulf-of-california/@@view; accessed on 5 July 2024). The Pacific thread herring (Ophistonema libertate) fishery in the south zone from the Gulf of California has also received this certification (https://fisheries.msc.org/en/fisheries/southern-gulf-of-california-thread-herring/@@view; accessed on 5 July 2024).
Although fisheries acoustics still present technical and scientific challenges, the field is expanding to meet the growing demands of modern ecosystemic and multidisciplinary marine research. Traditional ship-mounted sensors remain prevalent, but emerging marine technologies such as autonomous underwater vehicles (AUVs), remotely operated vehicles (ROVs), unmanned surface vehicles (USVs), moored inverted echosounders, and compact high-capacity echosounders have significant potential for integration into existing fishery surveys and research projects [148]. These new platforms not only increase the diversity and volume of data but also allow operations during periods when surveys are impractical, thereby expanding both the spatial and temporal coverage. Together, these advances could make long-term acoustic measurements of fish abundance more accessible and are likely to see broader application in the future [10,149]. For Mexico, these platforms could potentially enable the collection of biomass data for other marine resources that are currently not monitored.
The current state of development of acoustic instruments has required considerable economic investments and interdisciplinary groups of scientists and engineers who have led this discipline toward constant improvement and diversification. The countries maintaining a leading role in the use, development, and innovation of acoustic instruments have implemented a long-term vision that includes collaboration among their institutions. This approach will allow them to continue to implement strategies for the management and conservation of marine resources and to improve their position in the face of emerging challenges that arise from current problems.
For developing countries such as Mexico, fishing is a primary source of food and livelihood for coastal communities. The delay in implementing fisheries acoustics in countries with these characteristics is an example of failed technology transfer and contributes to the underrepresentation of information on tropical and subtropical seas, which may represent a gap in the understanding of the response of marine communities to global changes. For the past decade, Mexico has made a sustained effort to implement acoustic techniques to provide a time series of standardized information. However, at present their acoustic data are underutilized. Because the current global approach to fishery management is ecosystem-based, ecological time series become more informative when they are longer. In Mexico, survey research usually evaluates a single species, so the surveyed area, the fishing gear, and the type of vessel have always been used for surveying the most abundant species. This type of approach is usually the only one that a small RV can address due to its space or autonomy limitations. The Mexican deep-draft fleet (RV Dr. Jorge Carranza Fraser and RV El Puma) can change this situation by participating in campaigns that improve the understanding of a wide range of ecological subjects so that an ecosystemic approach can be implemented from marine acoustic data.
The Mexican scientific community maintains a good understanding of how technology and science can make a positive contribution to fishery management without “ready-to-use” solutions. The gap between commercial and scientific development is becoming smaller; acoustic tools developed for commercial purposes are being adopted by scientists, and scientific developments are being used to produce commercial tools. These changes represent opportunities that can be taken advantage of to shorten the path. Consistent long-term studies will enhance the response to emerging problems such as climate change and the redistribution of species, so it is necessary to continue to support research programs that have been maintained in the long term in Mexico. For Mexico, to at least maintain the current infrastructure for acoustic survey research, there is a need to increase the budget for the development of monitoring programs that collect ecosystem indicator data, train human resources, and encourage peer review of the information generated and reported in gray literature.
One of the purposes of this review is to promote the use of acoustics to study aquatic ecosystems, especially considering that other methodological developments or currents of thought have failed to become established in the Mexican scientific community and have simply disappeared from the country. To ensure that the initiatives mentioned in this work prevail, evolve, and transcend, the discussion on the contributions of acoustics to fishery management, MPAs, and the ecosystemic approach must be built, defended, and promoted among the community of Mexican fishery scientists.
Author Contributions
Conceptualization, V.E.G.-M. and E.M.-B.; methodology, V.E.G.-M. and E.M.-B.; validation, H.V. and M.O.N.-M.; investigation, V.E.G.-M.; writing—original draft preparation, V.E.G.-M. and E.M.-B.; writing—review and editing, V.E.G.-M. and E.M.-B.; visualization, V.E.G.-M. and E.M.-B.; supervision, H.V. and M.O.N.-M. All authors have read and agreed to the published version of the manuscript.
Funding
The authors thank CONAHCYT for the Ph.D. scholarship (number 782714).
Institutional Review Board Statement
Not applicable.
Informed Consent Statement
Not applicable.
Data Availability Statement
Not applicable.
Acknowledgments
The authors wish to especially thank the technicians and researchers from IMIPAS/CRIAP Guaymas for their valuable contributions to the development of multiple acoustic campaigns carried out over the recent decade. The opinions expressed in this publication are directly attributable to the authors and do not represent the opinions or policies of the Mexican institutions. Any use of trademarks, commercial products, or company names is for descriptive purposes only.
Conflicts of Interest
The authors declare no conflicts of interest.
References
- Dornan, T.; Fielding, S.; Saunders, R.A.; Genner, M.J. Large Mesopelagic Fish Biomass in the Southern Ocean Resolved by Acoustic Properties. Proc. R. Soc. B 2021, 289, 20211781. [Google Scholar] [CrossRef] [PubMed]
- Stenevik, E.K.; Vølstad, J.H.; Høines, Å.; Aanes, S.; Óskarsson, G.J.; Jacobsen, J.A.; Tangen, Ø. Precision in Estimates of Density and Biomass of Norwegian Spring-Spawning Herring Based on Acoustic Surveys. Mar. Biol. Res. 2015, 11, 449–461. [Google Scholar] [CrossRef]
- Wassermann, S.; Johnson, M.P. The Potential to Improve the Sustainability of Pelagic Fisheries in the Northeast Atlantic by Incorporating Individual Fish Behavior Into Acoustic Sampling. Front. Mar. Sci. 2020, 7, 357. [Google Scholar] [CrossRef]
- David, V.; Mouget, A.; Perrot, Y.; Le Goff, L.; Thiriet, P.; Diogoul, N.; Feunteun, E.; Acou, A.; Brehmer, P. Insights from a Multibeam Echosounder to Survey Pelagic Fish Shoals and Their Spatio-Temporal Distribution in Ultra-Shallow Waters. Estuar. Coast. Shelf Sci. 2022, 264, 107705. [Google Scholar] [CrossRef]
- Domokos, R. On the Development of Acoustic Descriptors for Semi-Demersal Fish Identification to Support Monitoring Stocks. ICES J. Mar. Sci. 2021, 78, 1117–1130. [Google Scholar] [CrossRef]
- Shao, H.; Kiyomoto, S.; Kadota, T.; Nakagawa, M.; Yamanaka, H.; Kawauchi, Y.; Minami, K.; Miyashita, K. Assessment of Spatio-Temporal Variations of Macroalgal Canopies and Fish Schools before and after Coastal Desertification Using Acoustic Methods. Hydrobiologia 2023, 851, 1891–1906. [Google Scholar] [CrossRef]
- Lu, Z.; Mukai, T.; Fujimori, Y.; Lida, K. Estimating the Sampling Efficiencies of a Framed Midwater Trawl and Ring Net for Zooplankton Using an Acoustic Method Net for Zooplankton Using an Acoustic Method. J. Mar. Sci. Technol. 2021, 29, 3. [Google Scholar] [CrossRef]
- Zhang, J.; Chen, Z.-Z.; Chen, G.-B.; Zhang, P.; Qiu, Y.-S.; Yao, Z. Hydroacoustic Studies on the Commercially Important Squid Sthenoteuthis oualaniensis in the South China Sea. Fish. Res. 2015, 169, 45–51. [Google Scholar] [CrossRef]
- Yang, H.; Cheng, J.; Tang, T.; Chen, J.; Li, G. Acoustic Target Strength of Jellyfish, Nemopilema nomurai, Measured at Multi-Frequency and Multi-Orientation. J. Appl. Ichthyol. 2023, 2023, 6650863. [Google Scholar] [CrossRef]
- Trenkel, V.M.; Handegard, N.O.; Weber, T.C. Observing the Ocean Interior in Support of Integrated Management. ICES J. Mar. Sci. 2016, 73, 1947–1954. [Google Scholar] [CrossRef]
- Benoit-Bird, K.J.; Lawson, G.L. Ecological Insights from Pelagic Habitats Acquired Using Active Acoustic Techniques. Annu. Rev. Mar. Sci. 2016, 8, 463–490. [Google Scholar] [CrossRef] [PubMed]
- Brown, C.J.; Smith, S.J.; Lawton, P.; Anderson, J.T. Benthic Habitat Mapping: A Review of Progress towards Improved Understanding of the Spatial Ecology of the Seafloor Using Acoustic Techniques. Estuar. Coast. Shelf Sci. 2011, 92, 502–520. [Google Scholar] [CrossRef]
- Fernandes, P.G.; Gerlotto, F.; Holliday, D.V.; Nakken, O.; Simmonds, E.J. Acoustic Applications in Fisheries Science: The ICES Contribution. ICES Mar. Sci. Symposia 2002, 215, 483–492. [Google Scholar] [CrossRef]
- Alverson, D.L. FAO Study Tour in USSR; US Fish and Wildlife Service: Washington, DC, USA, 1967; Sep No. 805.
- Bhupinder Singh, D.; Andrews, F. A Literature Survey on the Subject of the Use of Acoustics in Fish Catching and Fish Study; Institute of Ocean Engineering, School of Engineering and Architecture, The Catholic University of America: Washington, DC, USA, 1971. [Google Scholar]
- Dragesund, O.; Midttun, L. Development of Acoustic Techniques in Norway for Fisheries Research and Commercial Fishing. Proc. R. Soc. Edinb. Sect. B Biol. 1972, 73, 429–435. [Google Scholar] [CrossRef]
- Melcer-Zaiane, J.; García-Franco, W.; Mondragon-Corona, E.; Cota-Villavicencia, A. Estimación de Biomasa y Distribución de Peces Pelágicos Con Métodos Hidroacústicos En La Corriente de California Frente a La Costa Occidental de Baja California. In Proceedings of the Primer Simposium Nacional de Recursos Pesqueros Masivos de México, Ensenada, Mexico, 28–30 September 1976. [Google Scholar]
- Cotero-Altamirano, C.E.; Green-Ruiz, Y. Spawning Biomass of the Northern Anchovy (Engraulis mordax) in the Gulf of California during 1991; CalCOFI Reo: La Jolla, CA, USA, 1997; Volume 38. [Google Scholar]
- Diario Oficial de la Federación. Acuerdo Mediante el Cual Se da a Conocer la Actualización de la Carta Nacional Pesquera; Diario Oficial de la Federación: Cuauhtémoc, Mexico, 2021.
- Korneliussen, R.J.; Heggelund, Y.; Macaulay, G.; Patel, D.; Johnsen, E.; Eliassen, I.K. Acoustic Identification of Marine Species Using a Feature Library. Methods Oceanogr. 2016, 17, 187–205. [Google Scholar] [CrossRef]
- Knudsen, H.P. The Bergen Echo Integrator: An Introduction. ICES J. Mar. Sci. 1990, 47, 167–174. [Google Scholar] [CrossRef]
- Perrot, Y.; Brehmer, P.; Habasque, J.; Roudaut, G.; Behagle, N.; Sarré, A.; Lebourges-Dhaussy, A. Matecho: An Open-Source Tool for Processing Fisheries Acoustics Data. Acoust. Aust. 2018, 46, 241–248. [Google Scholar] [CrossRef]
- Ballón, M.; Bertrand, A.; Lebourges-Dhaussy, A.; Gutiérrez, M.; Ayón, P.; Grados, D.; Gerlotto, F. Is There Enough Zooplankton to Feed Forage Fish Populations off Peru? An Acoustic (Positive) Answer. Prog. Oceanogr. 2011, 91, 360–381. [Google Scholar] [CrossRef]
- Ladroit, Y.; Escobar-Flores, P.C.; Schimel, A.C.G.; O’Driscoll, R.L. ESP3: An Open-Source Software for the Quantitative Processing of Hydro-Acoustic Data. Softwarex 2020, 12, 100581. [Google Scholar] [CrossRef]
- Johnsen, E.; Totland, A.; Skålevik, A.; Holmin, A.J.; Dingsør, G.E.; Fuglebakk, E.; Handegard, N.O. StoX: An Open Source Software for Marine Survey Analyses. MEE 2019, 10, 1523–1528. [Google Scholar] [CrossRef]
- Villar, S.; Madirolas, A.; Cabreira, A.G.; Rozenfeld, A.; Acosta, G.G. ECOPAMPA: A New Tool for Automatic Fish Schools Detection and Assessment from Echo Data. Heliyon 2021, 7, e05906. [Google Scholar] [CrossRef] [PubMed]
- Lee, W.-J.; Mayorga, E.; Setiawan, L.; Majeed, I.; Nguyen, K.; Staneva, V. Echopype: A Python Library for Interoperable and Scalable Processing of Water Column Sonar Data for Biological Information. arXiv 2021, arXiv:2111.00187. [Google Scholar] [CrossRef]
- ICES. Working Group on Fisheries Acoustics, Science and Technology (WGFAST); Scientific Reports; ICES: Copenhagen, Denmark, 2020; Volume 2, p. 18. [Google Scholar] [CrossRef]
- Wall, C.C.; Towler, R.; Anderson, C.; Cutter, R.; Jech, J.M. PyEcholab: An Open-Source, Python-Based Toolkit to Analyze Water-Column Echosounder Data. J. Acoust. Soc. Am. 2018, 144, 1778. [Google Scholar] [CrossRef]
- R Core Team. R: A Language and Environment for Statistical Computing; R Foundation for Statistical Computing: Vienna, Austria, 2022. [Google Scholar]
- Villalobos, H. Echogram: Echogram Visualisation and Analysis; R Package, Version 0.1.2; R Foundation for Statistical Computing: Vienna, Austria, 2022; Available online: https://CRAN.R-project.org/package=echogram (accessed on 4 September 2024).
- Weill, A.; Scalabrin, C.; Diner, N. MOVIES-B: An Acoustic Detection Description Software. Application to Shoal Species Classification. Aquat. Living Resour. 1993, 6, 255–267. [Google Scholar] [CrossRef]
- Reid, D.G. Report on Echo Trace Classification. ICES Coop. Res. Rep. 2000, 238, 115. [Google Scholar] [CrossRef]
- Korneliussen, R.J.; Ona, E.; Eliassen, I.; Heggelund, Y.; Patel, R.; Godø, O.R.; Giertsen, C.; Patel, D.; Nornes, E.; Bekkvik, T.; et al. The Large Scale Survey System—LSSS. In Proceedings of the 29th Scandinavian Symposium on Physical Acoustics, Ustaosetm, Norway, 29 January–1 February 2006. [Google Scholar]
- Berger, L.; Durand, C.; Marchalot, C.; Diner, N. Movies+ User Manual Version 4.3; Ifremer: Plouzané, France, 2005. [Google Scholar]
- Korneliussen, R.J. Advances in Bergen Echo Integrator; ICES Cooperative Report; ICES: Copenhagen, Denmark, 1993; p. 12. [Google Scholar]
- Simmonds, E.J.; Williamson, N.J.; Gerlotto, F.; Aglen, A. Acoustic Survey Design and Analysis Procedure: A Comprehensive Review of Current Practice; ICES Cooperative Report; ICES: Copenhagen, Denmark, 1992; Volume 187. [Google Scholar]
- Walline, P.D. Geostatistical Simulations of Eastern Bering Sea Walleye Pollock Spatial Distributions, to Estimate Sampling Precision. ICES J. Mar. Sci. 2007, 64, 559–569. [Google Scholar] [CrossRef]
- Kimura, D.; Lemberg, N.A. Variability of Line Intercept Density Estimates (A Simulation Study of the Variance of Hydroacoustic Biomass Estimates). Can. J. Fish. Aquat. Sci. 1981, 38, 1141–1152. [Google Scholar] [CrossRef]
- Kimura, D.K.; Somerton, D.A. Review of Statistical Aspects of Survey Sampling for Marine Fisheries. Rev. Fish. Sci. 2007, 14, 245–283. [Google Scholar] [CrossRef]
- López-Serrano, A.; Villalobos-Ortíz, H.; Nevárez-Martínez, M.O. A Probabilistic Procedure for Estimating an Optimal Echointegration Threshold Using the Expectation-Maximisation Algorithm. Aquat. Living Resour. 2018, 31, 12. [Google Scholar] [CrossRef]
- Enciso-Enciso, C.; Nevárez-Martínez, M.O.; Sánchez-Cárdenas, R.; Salcido-Guevara, L.A.; Minte-Vera, C.; Marín-Enriquez, E.; Hernández-Rivas, M. Assessment and Management of the Temperate Stock of Pacific Sardine (Sardinops sagax) in the South of California Current System. Reg. Stud. Mar. Sci. 2023, 62, 102972. [Google Scholar] [CrossRef]
- Rubio-Rodríguez, U.; Villalobos, H.; Nevárez-Martínez, M.O. Acoustic Observations of the Vertical Distribution and Latitudinal Range of Small Pelagic Fish Schools in the Midriff Islands Region, Gulf of California, Mexico. Lat. Am. J. Aquat. Res. 2018, 46, 989–1000. [Google Scholar] [CrossRef]
- Fréon, P.; Misund, O.A. Dynamics of Pelagic Fish Distribution and Behaviour: Effects on Fisheries and Stock Assessment; Fishing New Books, Blackwell Science Ltd.: Oxford, UK, 1999; p. 348. [Google Scholar]
- Morales-Bojórquez, E.; Nevárez-Martínez, M.O.; García-Alberto, G.; Villalobos, H.; Aguirre-Villaseñor, H.; Larios-Castro, E.; González-Peláez, S.S.; Arizmendi-Rodríguez, D.I.; Martínez-Zavala, M.A. Interaction Between Marine Fauna and the Small Pelagic Fishery in the Coastal Environment of the Gulf of California, Mexico. Front. Mar. Sci. 2021, 8, 669176. [Google Scholar] [CrossRef]
- Leonori, I.; Ticina, V.; Giannoulaki, M.; Hattab, T.; Iglesias, M.; Bonanno, A.; Costantini, I.; Canduci, G.; Machias, A.; Ventero, A.; et al. History of Hydroacoustic Surveys of Small Pelagic Fish Species in the European Mediterranean Sea. Mediterr. Mar. Sci. 2021, 22, 751–768. [Google Scholar] [CrossRef]
- Salthaug, A.; Stenevik, K.E.; Vatnehol, S.; Anthonypillai, V.; Slotte, A. Distribution and Abundance of Norwegian Springspawning Herring during the Spawning Season in 2021; Survey Report; Institute of Marine Research: Bergen, Norway, 2021; ISSN 15036294. [Google Scholar]
- Cutter, G.R.; Demer, D.A. California Current Ecosystem Survey 2006 Acoustic Cruise Reports for NOAA FSV Oscar Dyson and NOAA FRV David Starr Jordan; NOAA Technical Memo; NOAA-SWFSC-415: 98; U.S. Department of Commerce: Washington, DC, USA, 2008.
- Demer, D.A.; Hewitt, R.P. Bias in Acoustic Biomass Estimates of Euphausia superba Due to Diel Vertical Migration. Deep Sea Res. I Oceanogr. Res. Pap. 1995, 42, 455–475. [Google Scholar] [CrossRef]
- Doray, M.; Badts, V.; Masse, J.; Huret, M.; Doremus, G.; Ptetitgas, P. Manual of Fisheries Survey Protocols 2014 PELGAS Surveys (PELagiques GAScogne); RBE/EMH 2014-01; Ifremer: Plouzane, France, 2014. [Google Scholar] [CrossRef]
- Ohshimo, S. Spatial Distribution and Biomass of Pelagic Fish in the East China Sea in Summer, Based on Acoustic Surveys from 1997 to 2001. Fish. Sci. 2004, 70, 389–400. [Google Scholar] [CrossRef]
- Koslow, J. The Role of Acoustics in Ecosystem-Based Fishery Management. ICES J. Mar. Sci. 2009, 66, 966–973. [Google Scholar] [CrossRef]
- Polovina, J.J. Model of a Coral Reef Ecosystem. Coral Reefs 1984, 3, 1–11. [Google Scholar] [CrossRef]
- Pauly, D.; Christensen, C.V.; Walters, C.J. Ecopath, Ecosim, and Ecospace as Tools for Evaluating Ecosystem Impact of Fisheries. ICES J. Mar. Sci. 2000, 57, 697–706. [Google Scholar] [CrossRef]
- Krebs, J.C.; Danell, K. Terrestrial Trophic Dynamics in the Canadian Arctic. Can. J. Zool. 2003, 81, 827–843. [Google Scholar] [CrossRef]
- Gascuel, D.; Pauly, D. EcoTroph: Modelling Marine Ecosystem Functioning and Impact of Fishing. Ecol. Model. 2009, 220, 2885–2898. [Google Scholar] [CrossRef]
- Christensen, V.; Walters, C.; Pauly, D.; Forrest, R. Ecopath with Ecosim Version 6: User Guide; Fisheries Centre, University of British Columbia: Vancouver, BC, Canada; ICLARM: Penang, Malaysia, 2008; p. 130. [Google Scholar]
- Rose, K.A.; Allen, J.I. End-To-End Models for the Analysis of Marine Ecosystems: Challenges, Issues, and Next Steps. Mar. Coast. Fish. 2010, 2, 115–130. [Google Scholar] [CrossRef]
- Handegard, N.O.; Buisson, L.; Brehmer, P.; Chalmers, S.J.; de Robertis, A.; Huse, G.; Kloser, R.; Macaulay, G.; Maury, O.; Ressler, P.H.; et al. Towards an Acoustic-Based Coupled Observation and Modelling System for Monitoring and Predicting Ecosystem Dynamics of the Open Ocean. Fish Fish. 2013, 14, 605–615. [Google Scholar] [CrossRef]
- Del Monte-Luna, P.; Arreguín-Sánchez, F.; Lluch-Belda, D. Marine ecosystem analyses in the Gulf of Ulloa, Mexico: BAC meets Ecopath. In INCOFISH Ecosystem Models: Transiting from Ecopath to Ecospace; Le Quesne, W., Arreguín-Sánchez, F., Heymans, S., Eds.; Fisheries Centre Research Reports; University of British Columbia: Vancouver, BC, Canada, 2007; Volume 15, pp. 114–133. [Google Scholar]
- Godø, O.R.; Handegard, N.O.; Browman, H.I.; Macaulay, G.; Kaartvedt, S.; Giske, J.; Ona, E.; Huse, G.; Johnsen, E. Marine Ecosystem Acoustics (MEA): Quantifying Processes in the Sea at the Spatio-Temporal Scales on Which They Occur. ICES J. Mar. Sci. 2014, 71, 2357–2369. [Google Scholar] [CrossRef]
- Bertrand, A.; Josse, E.; Bach, P.; Dagorn, L. Acoustics for Ecosystem Research: Lessons and Perspectives from a Scientific Programme Focusing on Tuna-Environment Relationships. Aquat. Living Resour. 2003, 16, 197–203. [Google Scholar] [CrossRef]
- Lazzari, M.A.; Tupper, B. Importance of Shallow Water Habitats for Demersal Fishes and Decapod Crustaceans in Penobscot Bay, Maine. Environ. Biol. Fishes 2002, 63, 57–66. [Google Scholar] [CrossRef]
- Collings, W.; McConnaughey, R.A. Acoustic Classification of the Sea Floor to Address Essential Fish Habitat and Marine Protected Area Requirements. In Proceedings of the Canadian Hydrographic Conference, Victoria, BC, Canada, 10–12 March 1998; pp. 369–377. [Google Scholar]
- Kloser, R.J.; Penrose, J.D.; Butler, A.J. Multi-Beam Backscatter Measurements Used to Infer Seabed Habitats. Cont. Shelf Res. 2010, 30, 1772–1782. [Google Scholar] [CrossRef]
- Lamarche, G. Quantitative Characterization of Seafloor Substrate and Bedforms Using Advanced Processing of Multibeam Backscatter—Application to Cook Strait, New Zealand. Cont. Shelf Res. 2011, 31, S93–S109. [Google Scholar] [CrossRef]
- Cutter, G.R.; Demer, D.A. Seabed Classification Using Surface Backscattering Strength versus Acoustic Frequency and Incidence Angle Measured with Vertical, Split-Beam Echosounders. ICES J. Mar. Sci. 2014, 71, 882–894. [Google Scholar] [CrossRef][Green Version]
- Siwabessy, J.W.; Tseng, Y.-T.; Gavrilov, A.N. Seabed Habitat Mapping in Coastal Waters Using a Normal Incident Acoustic Technique. In Proceedings of the Acoustics, Gold Coast, Australia, 3–5 November 2004. [Google Scholar]
- Gastauer, S.; Scoulding, B.; Parsons, M. An Unsupervised Acoustic Description of Fish Schools and the Seabed in Three Fishing Regions within the Northern Demersal Scalefish Fishery (NDSF, Western Australia). Acoust. Aust. 2017, 45, 363–380. [Google Scholar] [CrossRef]
- Pitcher, T.J.; Kalikoski, D.; Short, K.; Varkey, D.; Pramod, G. An Evaluation of Progress in Implementing Ecosystem-Based Management of Fisheries in 33 Countries. Mar. Policy 2009, 33, 223–232. [Google Scholar] [CrossRef]
- Morales-Zarate, M.V.; Arreguín-Sánchez, F.; López-Martínez, J.; Lluch-Cota, S.E. Ecosystem Trophic Structure and Energy Flux in the Northern Gulf of California, México. Ecol. Model. 2004, 174, 331–345. [Google Scholar] [CrossRef]
- Arreguín-Sánchez, F.; Arcos, E.; Chávez, E.A. Flows of Biomass and Structure in an Exploited Benthic Ecosystem in the Gulf of California, Mexico. Ecol. Model. 2002, 156, 167–183. [Google Scholar] [CrossRef]
- Rosas-Luis, R.; Salinas-Zavala, C.A.; Koch, V.; Del Monte-Luna, P.; Morales-Zarate, M.V. Importance of Jumbo Squid Dosidicus gigas (Orbigny, 1835) in the Pelagic Ecosystem of the Central Gulf of California. Ecol. Model. 2008, 218, 149–161. [Google Scholar] [CrossRef]
- Morales-Zarate, M.V.; Lopez-Ramírez, J.A.; Salinas-Zavala, C.A. Loggerhead Marine Turtle (Caretta caretta) Ecological Facts from a Trophic Relationship Model in a Hot Spot Fishery Area: Gulf of Ulloa, Mexico. Ecol. Model. 2021, 439, 109327. [Google Scholar] [CrossRef]
- Gómez- Gutiérrez, J.; Robinson, C.J. Tidal Current Transport of Epibenthic Swarms of the Euphausiid Nyctiphanes simplex in a Shallow, Subtropical Bay on Baja California Peninsula, México. Mar. Ecol. Progr. Ser. 2006, 320, 215–231. [Google Scholar] [CrossRef]
- Robinson, C.J.; Anislado, V.; Ramos, P. Shoaling Fish and Red Crab Behaviour Related to Tidal Variations in Bahía Magdalena, México. Deep Sea Res. II Top. Stud. Oceanogr. 2004, 51, 767–783. [Google Scholar] [CrossRef]
- Ursella, L.; Pensieri, S.; Pallás-Sanz, E.; Herzka, S.Z.; Bozzano, R.; Tenreiro, M.; Cardin, V.; Candela, J.; Sheinbaum, J. Diel, Lunar and Seasonal Vertical Migration in the Deep Western Gulf of Mexico Evidenced from a Long-Term Data Series of Acoustic Backscatter. Prog. Oceanogr. 2021, 195, 102562. [Google Scholar] [CrossRef]
- Portner, E.J.; Benoit-Bird, K.J.; Hazen, E.L.; Waluk, C.M.; Robinson, C.J.; Gómez-Gutiérrez, J.; Gilly, W.F. Decline and Recovery of Pelagic Acoustic Backscatter Following El Niño Events in the Gulf of California, Mexico. Prog. Oceanogr. 2022, 206, 102823. [Google Scholar] [CrossRef]
- Sarmiento-Lezcano, A.N.; Busquets-Vass, G.; Rubio-Rodríguez, U.; Pilar Olivar, M.; Peña, M.; Medina-Suárez, I.; González-Rodríguez, E.; Gómez- Gutiérrez, J.; Robinson, C.J.; Hernández-León, S. Active Flux Seasonality of the Small Dominant Migratory Crustaceans and Mesopelagic Fishes in the Gulf of California during June and October. Prog. Oceanogr. 2022, 208, 102894. [Google Scholar] [CrossRef]
- Crain, C.M.; Halpern, B.S.; Beck, M.W.; Kappel, C.V. Understanding and Managing Human Threats to the Coastal Marine Environment. Ann. N. Y. Acad. Sci. 2009, 1162, 39–62. [Google Scholar] [CrossRef]
- Ortíz-Lozano, L.; Olivera-Vázquez, L.; Espejel, I. Legal Protection of Ecosystem Services Provided by Marine Protected Areas in Mexico. Ocean Coast. Manag. 2017, 138, 101–110. [Google Scholar] [CrossRef]
- Rife, A.N.; Erisman, B.; Sanchez, A.; Aburto-Oropeza, O. When Good Intentions Are Not Enough... Insights on Networks of “Paper Park” Marine Protected Areas. Conserv. Lett. 2013, 6, 200–212. [Google Scholar] [CrossRef]
- Aburto-Oropeza, O.; Erisman, B.; Galland, G.R.; Mascareñas-Osorio, I.; Sala, E.; Ezcurra, E. Large Recovery of Fish Biomass in a No-Take Marine Reserve. PLoS ONE 2011, 6, e23601. [Google Scholar] [CrossRef] [PubMed]
- Kelleher, G.; Phillips, A. Guidelines for Marine Protected Areas; IUCN: Gland, Switzerland; Cambridge, UK, 1999; pp. 24–107. [Google Scholar]
- Bloomfield, H.J.; Sweeting, C.; Mill, A.C.; Stead, S.M.; Polunin, N.V.C. No-Trawl Area Impacts: Perceptions, Compliance and Fish Abundances. Environ. Conserv. 2012, 9, 237–247. [Google Scholar] [CrossRef]
- Hill, N.A.; Barrett, N.; Lawrence, E.; Hulls, J.; Dambacher, J.M.; Nichol, S.; Williams, A.; Hayes, K.R. Quantifying Fish Assemblages in Large, Offshore Marine Protected Areas: An Australian Case Study. PLoS ONE 2014, 9, e110831. [Google Scholar] [CrossRef]
- Starr, R.M.; Wendt, D.E.; Barnes, C.L.; Marks, C.I.; Malone, D.; Waltz, G.; Schmidt, K.T.; Chiu, J.; Launer, A.L.; Hall, N.C.; et al. Variation in Responses of Fishes across Multiple Reserves within a Network of Marine Protected Areas in Temperate Waters. PLoS ONE 2015, 10, e0118502. [Google Scholar] [CrossRef]
- Egerton, J.P.; Turner, J.; LeVay, L.; Mascareñas-Osorio, I.; Aburto-Oropeza, O. Hydroacoustics as a Tool to Examine the Effects of Marine Protected Areas and Habitat Type on Marine Fish Communities. Sci. Rep. 2018, 8, 47. [Google Scholar] [CrossRef]
- Salvatat, J.; Bez, N.; Habasque, J.; Lebourges-Dhaussy, A.; Lopes, C.; Roudaut, G.; Simier, M.; Travassos, P.; Vargas, G.; Bertrand, A. Comprehensive Spatial Distribution of Tropical Fish Assemblages from Multifrequency Acoustics and Video Fulfils the Island Mass Effect Framework. Sci. Rep. 2022, 12, 8787. [Google Scholar] [CrossRef]
- Villalobos-Ortíz, H.; Zwolinski, J.P.; Godínez-Pérez, C.A.; González-Máynez, V.E.; Mayorga-Martínez, M.; Michaels, W.L.; Palacios-Higuera, M.S.; Rubio-Rodríguez, U.; Sarmiento-Lezcano, A.N.; Demer, D.A. A Practical Approach to Monitoring Marine Protected Areas. Oceanography 2021, 4, 32–43. [Google Scholar] [CrossRef]
- Jones, D.R.; Wilson, C.D.; de Robertis, A.; Rooper, C.N.; Weber, T.; Butler, J.L. Evaluation of Rockfish Abundance in Untrawlable Habitat: Combining Acoustic and Complementary Sampling Tools. Fish. Bull. 2012, 110, 332–343. [Google Scholar]
- Xie, X.; Zhang, H.; Wang, C.; Wu, J.; Wei, Q.; Du, H.; Li, J.; Ye, H. Are River Protected Areas Sufficient for Fish Conservation? Implications from Large-Scale Hydroacoustic Surveys in the Middle Reach of the Yangtze River. BMC Ecol. 2019, 19, 42. [Google Scholar] [CrossRef] [PubMed]
- Mayorga-Martínez, M.; Bello-Pineda, J.; Perales-Valdivia, H.; Pérez-España, H.; Heyman, W. Characterizing Geomorphology of Mesophotic Coral Reef Ecosystems in the Southwestern Gulf of Mexico: Implications for Conservation and Management. Front. Mar. Sci. 2021, 8, 639359. [Google Scholar] [CrossRef]
- Cisneros-Montemayor, A.M.; Vincent, A. Science, Society, and Flagship Species: Social and Political History as Keys to Conservation Outcomes in the Gulf of California. Ecol. Soc. 2016, 21, 9. [Google Scholar] [CrossRef]
- de Anda Montañez, J.A.; García-de-León, F.J.; Zenteno-Savín, T.; Balart-Paez, E.; Méndez-Rodríguez, L.C.; Bocanegra-Castillo, N.; Martínez-Aguilar, S.; Campos-Dávila, L.; Román-Rodríguez, M.J.; Valenzuela-Quiñones, F.; et al. Estado de Salud y Estatus de Conservación de La(s) Población(Es) de Totoaba (Totoaba macdonaldi) En El Golfo de California: Una Especie En Peligro de Extinción; Proyecto No. HK050; Centro de Investigaciones Biológicas del Noroeste, S.C. La Paz, Baja California Sur. Informe Final, SNIB-CONABIO: Tlalpan, México, 2013; p. 113. [Google Scholar]
- Lynch, A.; Cooke, S.J.; Deines, A.M.; Bower, S.D.; Bunnell, D.B.; Cowx, I.G.; Nguyen, V.M.; Nohner, J.; Phouthavong, K.; Riley, B.; et al. The Social, Economic, and Environmental Importance of Inland Fish and Fisheries. Environ. Rev. 2016, 24, 115–121. [Google Scholar] [CrossRef]
- Pollom, R.A.; Rose, G.A. A Global Review of the Spatial, Taxonomic, and Temporal Scope of Freshwater Fisheries Hydroacoustics Research. Environ. Rev. 2016, 24, 333–347. [Google Scholar] [CrossRef]
- Linares, E.O.; Guillard, J.; Schneider, P.; Caballero-Caballero, P.I.; Gerlotto, F. Hydroacoustic Surveys as Contribution to the Study of Spawning Aggregations of Nassau Grouper (Epinephelus striatus) in the Yucatan. In Proceedings of the IEEE/OES Acoustics in Underwater Geosciences Symposium, Rio de Janeiro, Brazil, 24–26 July 2013; pp. 1–4. [Google Scholar] [CrossRef]
- Rowell, T.J.; Demer, D.A.; Aburto-Oropeza, O.; Cota-Nieto, J.J.; Hyde, J.R.; Erisman, B.E. Estimating Fish Abundance at Spawning Aggregations from Courtship Sound Levels. Sci. Rep. 2017, 7, 3340. [Google Scholar] [CrossRef]
- Lin, P.; Chen, L.; Gao, X.; Wang, C.; Gao, X.; Kang, M. Spatiotemporal Distribution and Species Composition of Fish Assemblages in the Transitional Zone of the Three Gorges Reservoir, China. Water 2020, 12, 3514. [Google Scholar] [CrossRef]
- Simmonds, J.; MacLennan, D.N. Fisheries Acoustics: Theory and Practice, 2nd ed.; Blackwell Science Ltd.: New York, NY, USA, 2005; p. 472. [Google Scholar]
- Love, R. Measurements of Fish Target Strength: A Review. Fish. Bull. 1971, 69, 703–715. [Google Scholar]
- MacLennan, D.N. Acoustical Measurement of Fish Abundance. J. Acoust. Soc. Am. 1990, 87, 1–15. [Google Scholar] [CrossRef]
- Ona, E. Physiological Factors Causing Natural Variations in Acoustic Target Strength of Fish. J. Mar. Biol. Assoc. U. K. 1990, 70, 107–127. [Google Scholar] [CrossRef]
- Foote, K.G. Averaging of Fish Target Strength Functions. J. Acoust. Soc. Am. 1980, 67, 504–515. [Google Scholar] [CrossRef]
- Liu, J.; Setiazi, H.; Yuk, P.-S. Fisheries Hydroacoustic Assessment: A Bibliometric Analysis and Direction for Future Research towards a Blue Economy. Reg. Stud. Mar. Sci. 2023, 60, 102838. [Google Scholar] [CrossRef]
- ICES. Report of the Workshop on Survey Design and Data Analysis (WKSAD). In Proceedings of the Workshop on Survey Design and Analysis [WKSAD], Sète, France, 9–13 May 2005. [Google Scholar]
- Trenkel, V.M.; Berger, L.; Bourguignon, S.; Doray, M.; Fablet, R.; Massé, J.; Mazauric, V.; Poncelet, C.; Quemener, G.; Scalabrin, C.; et al. Overview of Recent Progress in Fisheries Acoustics Made by Ifremer with Examples from the Bay of Biscay. Aquat. Living Resour. 2009, 22, 433–445. [Google Scholar] [CrossRef]
- Harley, S.J.; Myers, R.A.; Dunn, A. Is Catch-per-Unit-Effort Proportional to Abundance? Can. J. Fish. Aquat. Sci. 2001, 58, 1760–1772. [Google Scholar] [CrossRef]
- Martínez-Aguilar, S.; de Anda-Montañez, J.A.; Arreguín-Sánchez, F. Constant Harvest Rate for the Pacific Sardine (Sardinops caeruleus) Fishery in the Gulf of California Based on Catchability-at-Length Estimations. Fish. Res. 2009, 99, 74–82. [Google Scholar] [CrossRef]
- Csirke, J. Small Schoalling Pelagic Fish Stocks. In Fish Population Dynamics, 2nd ed.; Gulland, J.A., Ed.; John Wiley: London, UK, 1988; pp. 271–302. [Google Scholar]
- Arreguín-Sánchez, F. Catchability: A Key Parameter for Fish Stock Assessment. Rev. Fish Biol. Fish. 1996, 6, 221–242. [Google Scholar] [CrossRef]
- Hilborn, R.; Walters, C.J. Quantitative Fisheries Stock Assessment: Choice, Dynamics and Uncertainty; Chapman and Hall: Boston, MA, USA, 1992; p. 470. [Google Scholar] [CrossRef]
- Methot, R.D., Jr. Synthesis Model: An Adaptable Framework for Analysis of Diverse Stock Assessment Data. Bull. Int. North Pac. Fish. Comm. 1990, 50, 259–277. [Google Scholar]
- Fournier, D.; Archibald, C.P. A General Theory for Analyzing Catch at Age Data. Can. J. Fish. Aquat. Sci. 1982, 39, 1195–1207. [Google Scholar] [CrossRef]
- Polacheck, T.; Hilborn, R.; Punt, A. Fitting Surplus Production Models: Comparing Methods and Measuring Uncertainty. Can. J. Fish. Aquat. Sci. 1993, 50, 2597–2607. [Google Scholar] [CrossRef]
- MacLennan, D.N.; Fernandes, P.G.; Dalen, J. A Consistent Approach to Definitions and Symbols in Fisheries Acoustics. ICES J. Mar. Sci. 2002, 59, 365–369. [Google Scholar] [CrossRef]
- Haddon, M. Modelling and Quantitative Methods in Fisheries, 2nd ed.; Chapman and Hall: Boston, MA, USA; CRC: Boca Raton, FL, USA, 2011. [Google Scholar]
- Petitgas, P. Geostatistics in Fisheries Survey Design and Stock Assessment: Models, Variances and Applications. Fish Fish. 2001, 2, 231–249. [Google Scholar] [CrossRef]
- Mello, L.G.S.; Rose, G.A. Using Geostatistics to Quantify Seasonal Distribution and Aggregation Patterns of Fishes: An Example of Atlantic Cod (Gadus morhua). Can. J. Fish. Aquat. Sci. 2005, 62, 659–670. [Google Scholar] [CrossRef]
- Pennington, M. Some Statistical Techniques for Estimating Abundance Indices from Trawl Surveys. Fish. Bull. 1986, 84, 519–525. [Google Scholar]
- Syrjala, S.E. Critique on the Use of the Delta Distribution for the Analysis of Trawl Survey Data. ICES J. Mar. Sci. 2020, 57, 831–842. [Google Scholar] [CrossRef]
- Jolly, G.; Hampton, I. A Stratifid Random Transect Design for Acoustic Surveys of Fish Stock. Can. J. Fish. Aquat. Sci. 1990, 47, 1282–1291. [Google Scholar] [CrossRef]
- Lo, N. Biomass and Reproduction of Pacific Sardine (Sardinops sagax) off the Pacific Northwestern United States, 2003–2005. Fish. Bull. 2010, 108, 174–192. [Google Scholar]
- Lo, N.G.-H.; Hunter, J.R.; Moser, H.G.; Smith, P.E. A Daily Fecundity Reduction Method of Biomass Estimation with Application to Dover Sole Microstomus pacificus. Bull. Mar. Sci. 1993, 53, 842–863. [Google Scholar]
- Lo, N.G.-H.; Green-Ruiz, Y.A.; Cervantes, M.J. Egg Production and Spawning Biomass of Pacific Sardine (Sardinops sagax) in 1994, Determined by the Daily Egg Production Method. Calif. Coop. Ocean Fish. Investig. Rep. 1996, 37, 160–174. [Google Scholar]
- Jacobson, L.; Konno, E.S.; Pertierra, J.P. Status of Pacific Mackerel and Trends in Biomass, 1978–1993. Calif. Coop. Ocean Fish. Investig. Rep. 1994, 35, 36–39. [Google Scholar]
- Conser, R.J.; Kevin, T.H.; Crone, P.R.; Lo, N.G.-H.; Berger, D. Stock Assessment of Pacific Sardine with Management Recommendations for 2003 Executive Summary; Pacific Fishery Management Council: Portland, OR, USA, 2002. [Google Scholar]
- Jacobson, L.; Lo, N.G.-H.; Barnes, J. A Biomass-Based Assessment Model for Northern Anchovy, Engraulis mordax. Fish. Bull. 1994, 92, 711–724. [Google Scholar]
- Green-Ruiz, Y.A.; Cotero-Altamirano, C.E. Spawning Biomass of the Northern Anchovy (Engraulis Mordax) in the Gulf of California during 1992. Cienc. Pesq. 2009, 17, 27–96. [Google Scholar]
- Nevárez-Martínez, M.O.; Morales-Bojórquez, E.; De Los Angeles Martínez-Zavala, M.; Villalobos-Ortíz, H.; Luquin-Covarrubias, M.; González-Máynez, V.E.; López-Martínez, J.; Santos-Molina, J.P.; Ornelas-Vargas, A.; Delgado-Vnces, F. An Integrated Catch-at-Age Model for Analyzing the Variability in Biomass of Pacific Sardine (Sardinops sagax) from the Gulf of California, Mexico. Front. Mar. Sci. 2023, 10, 940083. [Google Scholar] [CrossRef]
- Lawson, G.L.; Rose, G.A. The Importance of Detectability to Acoustic Surveys of Semi-Demersal Fish. ICES J. Mar. Sci. 1999, 56, 370–380. [Google Scholar] [CrossRef]
- Legault, C.; Restrepo, V.R. A Flexible Forward Age-Structured Assessment Program. ICCAT. Col. Vol. Sci. Pap. 1998, 49, 246–253. [Google Scholar]
- Bull, B.; Francis, R.; Dunn, A. CASAL (C++ Algorithmic Stock Assessment Laboratory) CASAL User Manual v2.30-2012/03/21; NIWA Technical Report; NIWA: Auckland, New Zealand, 2012; p. 135. [Google Scholar]
- Methot, R.D., Jr.; Wetzel, C.R. Stock Synthesis: A Biological and Statistical Framework for Fish Stock Assessment and Fishery Management. Fish. Res. 2013, 142, 86–99. [Google Scholar] [CrossRef]
- Anon. Assessment Model for Alaska Description of GUI and Instructions. 2015. Available online: https://github.com/NMFS-toolbox/AMAK/blob/master/docs/AMAK%20Documentation.pdf (accessed on 4 September 2024).
- Cope, J. Implementing a Statistical Catch-at-Age Model (Stock Synthesis) as a Tool for Deriving Overfishing Limits in Data-Limited Situations. Fish. Res. 2013, 142, 3–14. [Google Scholar] [CrossRef]
- Cope, J.; MacCall, A.; Monk, M. Data-Moderate Stock Assessments for Brown, China, Copper, Sharpchin, Stripetail, and Yellowtail Rockfishes and English and Rex Soles in 2013; Pacific Fishery Management Council: Portland, OR, USA, 2015; Volume 97220, p. 298. [Google Scholar]
- Wetzel, C.R.; Punt, A.E. Performance of a Fisheries Catch-at-Age Model (Stock Synthesis) in Datalimited Situations. Mar. Freshw. Res. 2011, 62, 927–936. [Google Scholar] [CrossRef]
- Stock, B.C.; Miller, T.J. The Woods Hole Assessment Model (WHAM): A General State-Space Assessment Framework That Incorporates Time- and Age-Varying Processes via Random Effects and Links to Environmental Covariates. Fish. Res. 2021, 240, 105967. [Google Scholar] [CrossRef]
- Fournier, D.; Hampton, J.; Sibert, J.R. MULTIFAN-CL: A Length-Based, Age-Structured Model for Fisheries Stock Assessment, with Application to South Pacific Albacore, Thunnus Alalunga. Can. J. Fish. Aquat. Sci. 1998, 55, 2105–2116. [Google Scholar] [CrossRef]
- Benoit-Bird, K.J.; Welch, T.P.; Waluk, C.M.; Barth, J.A.; Wangen, I.; McGill, P.; Okuda, C.; Hollinger, G.A.; Sato, M.; McCammon, S. Equipping an Underwater Glider with a New Echosounder to Explore Ocean Ecosystems. Limnol. Oceanogr. Methods 2018, 16, 734–749. [Google Scholar] [CrossRef]
- Goulon, C.; Le Meaux, O.; Vincent-Falquet, R.; Guillard, J. Hydroacoustic Autonomous Boat for Remote Fish Detection in LakE (HARLE), an Unmanned Autonomous Surface Vehicle to Monitor Fish Populations in Lakes. Limnol. Oceanogr. Methods 2021, 19, 280–292. [Google Scholar] [CrossRef]
- Eriksen, E.; Gjøsæter, H.; Prozorkevich, D.; Shamray, E.; Dolgov, A.; Skern-Mauritzen, M.; Stiansen, J.E.; Kovalev, Y.; Sunnana, K. From Single Species Surveys towards Monitoring of the Barents Sea Ecosystem. Prog. Oceanogr. 2018, 166, 4–14. [Google Scholar] [CrossRef]
- Izquierdo-Peña, V.; Lluch-Cota, S.E.; Chavez, F.P.; Lluch-Belda, D.; Morales-Bojórquez, E.; Ponce-Díaz, G. Is There a Future in the Sustainability Certification of Sardine and Anchovy Fisheries? Fisheries 2020, 45, 554–560. [Google Scholar] [CrossRef]
- Diario Oficial de La Federación. Plan de Manejo Pesquero Para La Pesquería de Pelágicos Menores (Sardina, Anchovetas, Macarela y Afines) Del Noroeste de México; Diario Oficial de La Federación: Cuauhtémoc, Mexico, 2012.
- Diario Oficial de La Federación. NORMA Oficial Mexicana NOM-003-SAG/PESC-2018; Diario Oficial de La Federación: Cuauhtémoc, México, 2019.
- Chu, D.; Parker-Stetter, S.; Hufnagle, L., Jr.; Thomas, R.; Getsiv-Clemons, J.; Gauthier, S.; Stanley, C. 2018 Unmanned Surface Vehicle (Saildrone) Acoustic Survey off the West Coasts of the United States and Canada. In Proceedings of the OCEANS 2019 MTS/IEEE, Seattle, WA, USA, 27–31 October 2019. [Google Scholar] [CrossRef]
- de Robertis, A.; Lawrence-Slavas, N.; Jenkins, R.; Wangen, I.; Mordy, C.W.; Meinig, C.; Levine, M.; Peacock, D.; Tabisola, H. Long-Term Measurements of Fish Backscatter from Saildrone Unmanned Surface Vehicles and Comparison with Observations from a Noise-Reduced Research Vessel. ICES J. Mar. Sci. 2019, 76, 2459–2470. [Google Scholar] [CrossRef]


Disclaimer/Publisher’s Note: The statements, opinions and data contained in all publications are solely those of the individual author(s) and contributor(s) and not of MDPI and/or the editor(s). MDPI and/or the editor(s) disclaim responsibility for any injury to people or property resulting from any ideas, methods, instructions or products referred to in the content. |
© 2024 by the authors. Licensee MDPI, Basel, Switzerland. This article is an open access article distributed under the terms and conditions of the Creative Commons Attribution (CC BY) license (https://creativecommons.org/licenses/by/4.0/).