Article

Feeding Behavior and Bait Selection Characteristics for the Portunidae Crabs Portunus sanguinolentus and Charybdis natator

1
Department of Environmental Biology and Fisheries Science, National Taiwan Ocean University, Keelung 20224, Taiwan
2
Faculty of Fisheries and Food Science, Universiti Malaysia Terengganu, Kuala Nerus, Kuala Terengganu 21030, Terengganu, Malaysia
3
Center of Excellence for Oceans, National Taiwan Ocean University, Keelung 20224, Taiwan
*
Author to whom correspondence should be addressed.
Fishes 2024, 9(10), 400; https://doi.org/10.3390/fishes9100400
Submission received: 22 August 2024 / Revised: 29 September 2024 / Accepted: 30 September 2024 / Published: 2 October 2024
(This article belongs to the Special Issue Advances in Crab Fisheries)

Abstract

:
Understanding the feeding behavior of Portunidae crabs with different baits can improve bait selection and is crucial for improving the effectiveness of crab fishing gear. This study, conducted in indoor experimental tanks, used trajectory tracking software and two types of natural baits (mackerel (Scomber australasicus) and squid (Uroteuthis chinensis)) to understand the behavior of Portunus sanguinolentus and Charybdis natator. Spatial distribution results showed that P. sanguinolentus was frequently present in the starting area (S1) and bait area (S3) in the control and treatment groups. However, C. natator was frequently present and concentrated in the S1 area compared to the middle areas S2 and S3, and only in the mackerel treatments were they observed to move to the S3 areas. The spatial distribution results indicate that P. sanguinolentus shows a stronger willingness to explore its surroundings, while C. natator is generally in a stationary, wait-and-see state. The swimming speeds of P. sanguinolentus and C. natator showed different trends. P. sanguinolentus showed continuous movement with no fixed speed when no bait was present in the control groups. However, when treated with mackerel and squid, the average swimming speed of P. sanguinolentus was faster (>5 cm/s) in the first 10 min and showed a more stable movement speed when searching for the baits. C. natator showed a stationary or low movement speed when no bait was present in the control groups. However, when C. natator perceived the presence of the baits in the treatment groups, their movement speed increased in the first 10 min. In addition, there was no significant difference between male and female crabs of P. sanguinolentus and C. natator in movement speed in the control and treatment groups. Compared to C. natator, P. sanguinolentus might be more sensitive to natural baits, as shown by its movement from S1 to S3. The results indicate that the species of Portunidae crabs show different bait selections. Natural baits (mackerel and squid) are recommended for catching P. sanguinolentus in crab fisheries.
Key Contribution: This study indicated the feeding behavior of P. sanguinolentus and C. natator using trajectory-tracking software and two types of natural baits. P. sanguinolentus actively explores and responds to natural baits, while C. natator remains stationary. It also highlighted that there are no significant differences in movement speed between male and female crabs, which can inform more effective bait selection and feeding strategies.

1. Introduction

The family Portunidae, commonly known as swimming crabs, is the most important taxonomic group in the global crab fishery. With over 300 species distributed worldwide in tropical to temperate zones, these crabs inhabit diverse habitats, including brackish estuaries, mangroves, coral reefs, and shallow and deep seas [1,2]. Swimming crabs are mainly found in sandy seabeds and play a crucial role as a predator species in benthic ecosystems. Their presence is ecologically important and contributes to the overall health and dynamics of the marine ecosystem [3]. The Taiwan Strait (TS) is located in the tropical to subtropical western Pacific region and is an important channel in the western Pacific Ocean for transporting water and chemical constituents from the East China Sea to the South China Sea. The crab species in the TS are diverse, with more than 800 species in East Asia [4]. The crucifix crab Charybdis feriatus, the blue swimming crab Portunus pelagicus, the three-spotted swimming crab P. sanguinolentus, and the ridged swimming crab Charybdis natator are the most important commercial crab species in the TS [5,6].
At least 14 types of fishing gear are used in the TS, including traps. The traps used by fishermen in Taiwan are crab, fish, tangled, and eel traps [5]. However, only crab and fish traps are widely and commercially used in Taiwan [5,7]. The catch of swimming crabs accounts for over 80% of the crab trap harvest and is typically conducted in coastal regions on rocky substrates within the TS. [6,8,9]. Fresh bait is a significant cost factor, often accounting for up to 50% of the total operating cost of baited traps [7,10]. In addition, crabs primarily rely on their sense of smell when foraging for food [11]. Consequently, selecting appropriate bait is a critical factor that influences the catch rates of target species.
Understanding the behavior of target species is crucial for fisheries science and aquatic ecology and contributes to the sustainable management and conservation of aquatic ecosystems [12,13]. The behavior of marine species encompasses various activities, from feeding and reproduction to migration and habitat selection. New technologies, such as video tracking software, have become powerful tools for studying fish behavior and are revolutionizing the way researchers observe, analyze, and understand the complex dynamics of aquatic organisms. As marine ecosystems face increasing environmental pressures and human-induced changes, an accurate and comprehensive study of fish behavior is critical for conservation, management, and scientific research. Lee et al. [14] studied the swimming behavior of Acanthopagrus schlegelii, Trachinotus blochii, and Acanthopagrus latus in a captive experiment using an advanced tracking system and found that A. schlegelii and A. latus preferred areas of the artificial reefs with more protection. Video tracking software represents a technological leap forward and offers unprecedented opportunities for monitoring animal movements, interactions, and responses in natural environments.
Understanding crab-feeding behavior is critical to studying crab ecology and crucial to improving the effectiveness of crab fishing gear. Crab trapping relies primarily on bait to attract the crabs into the traps. The choice of bait is an important factor influencing the catch. In Taiwan, fishermen use fish species such as Decapterus maruadsi or Scomber australasicus as the main bait [6]. However, there is a lack of research on the attractiveness of different baits and the characteristics of the foraging behavior of swimming crabs. Therefore, this study used trajectory tracking software and two types of natural baits to understand the behavior of P. sanguinolentus and C. natator. In this study, a controlled tank environment was created to observe the spatial distribution and changes in movement speed of these two swimming crabs. The results may provide an initial understanding of the changing behavior of swimming crabs, which is important to reduce bycatch species or irregular size. In addition, the results of this study are important for developing new types of artificial bait and reducing operating costs and dependence on the use of natural bait in the future.

2. Materials and Methods

2.1. Experimental Crab Species and Experimental Data Collection

This study was conducted in accordance with the guidelines of the Animal Research and Ethics Committees of National Taiwan Ocean University. To ensure compliance, all procedures involving the experimental crab species and data collection were carefully planned. Due to current regulations prohibiting the capture of swimming crabs with a carapace width of less than 90 mm for P. sanguinolentus and 70 mm for C. natator, we only used crabs that met the conditions approved by the Taiwan Fisheries Agency. A total of 180 untrained live swimming crabs (90 for each species: 45 males and 45 females) were examined. P. sanguinolentus had an average carapace width of 118 mm (SD ± 1.1 cm) and an average weight of 110.7 g (SD ± 37.6 g), while C. natator had an average carapace width of 84 mm (SD ± 1 cm) and an average weight of 149.74 g (SD ± 45 g). The swimming crabs were kept under constant aeration in six separate circular holding tanks (separated by species) with a diameter of 1.3 m and a depth of 0.7 m; the tanks contained water with a salinity of approximately 30.0 PSU. The water temperature in the holding tanks was maintained at 20.0 °C, and the crabs were kept in captivity for 12 h in quarantine without food prior to the experiment [7].
Before the experiments, visually regular crabs without carapace damage or missing limbs were selected, and their carapace width was measured before being placed into the experimental water tank. Male and female crabs were separated, with random individuals selected for each experiment. Control groups were established prior to the natural bait treatments to ensure that the crabs moved randomly in the experimental tanks. To avoid retesting the same crabs for each group, they were divided into two equally sized reserve tanks, set up next to the experimental tanks, after each trial. Each trial began by randomly transferring a single crab, starting with male P. sanguinolentus, from the holding tanks to the experimental tanks. The crabs were allowed 30 min to acclimatize. Subsequently, the bait was randomly selected and lowered into the center of the experimental tanks. Cameras started recording after the bait was introduced and the barrier plate was removed. After 30 min, the cameras stopped, and the crabs were transferred to separate nets in the holding tanks. This process was repeated until all crabs and experiments were completed.

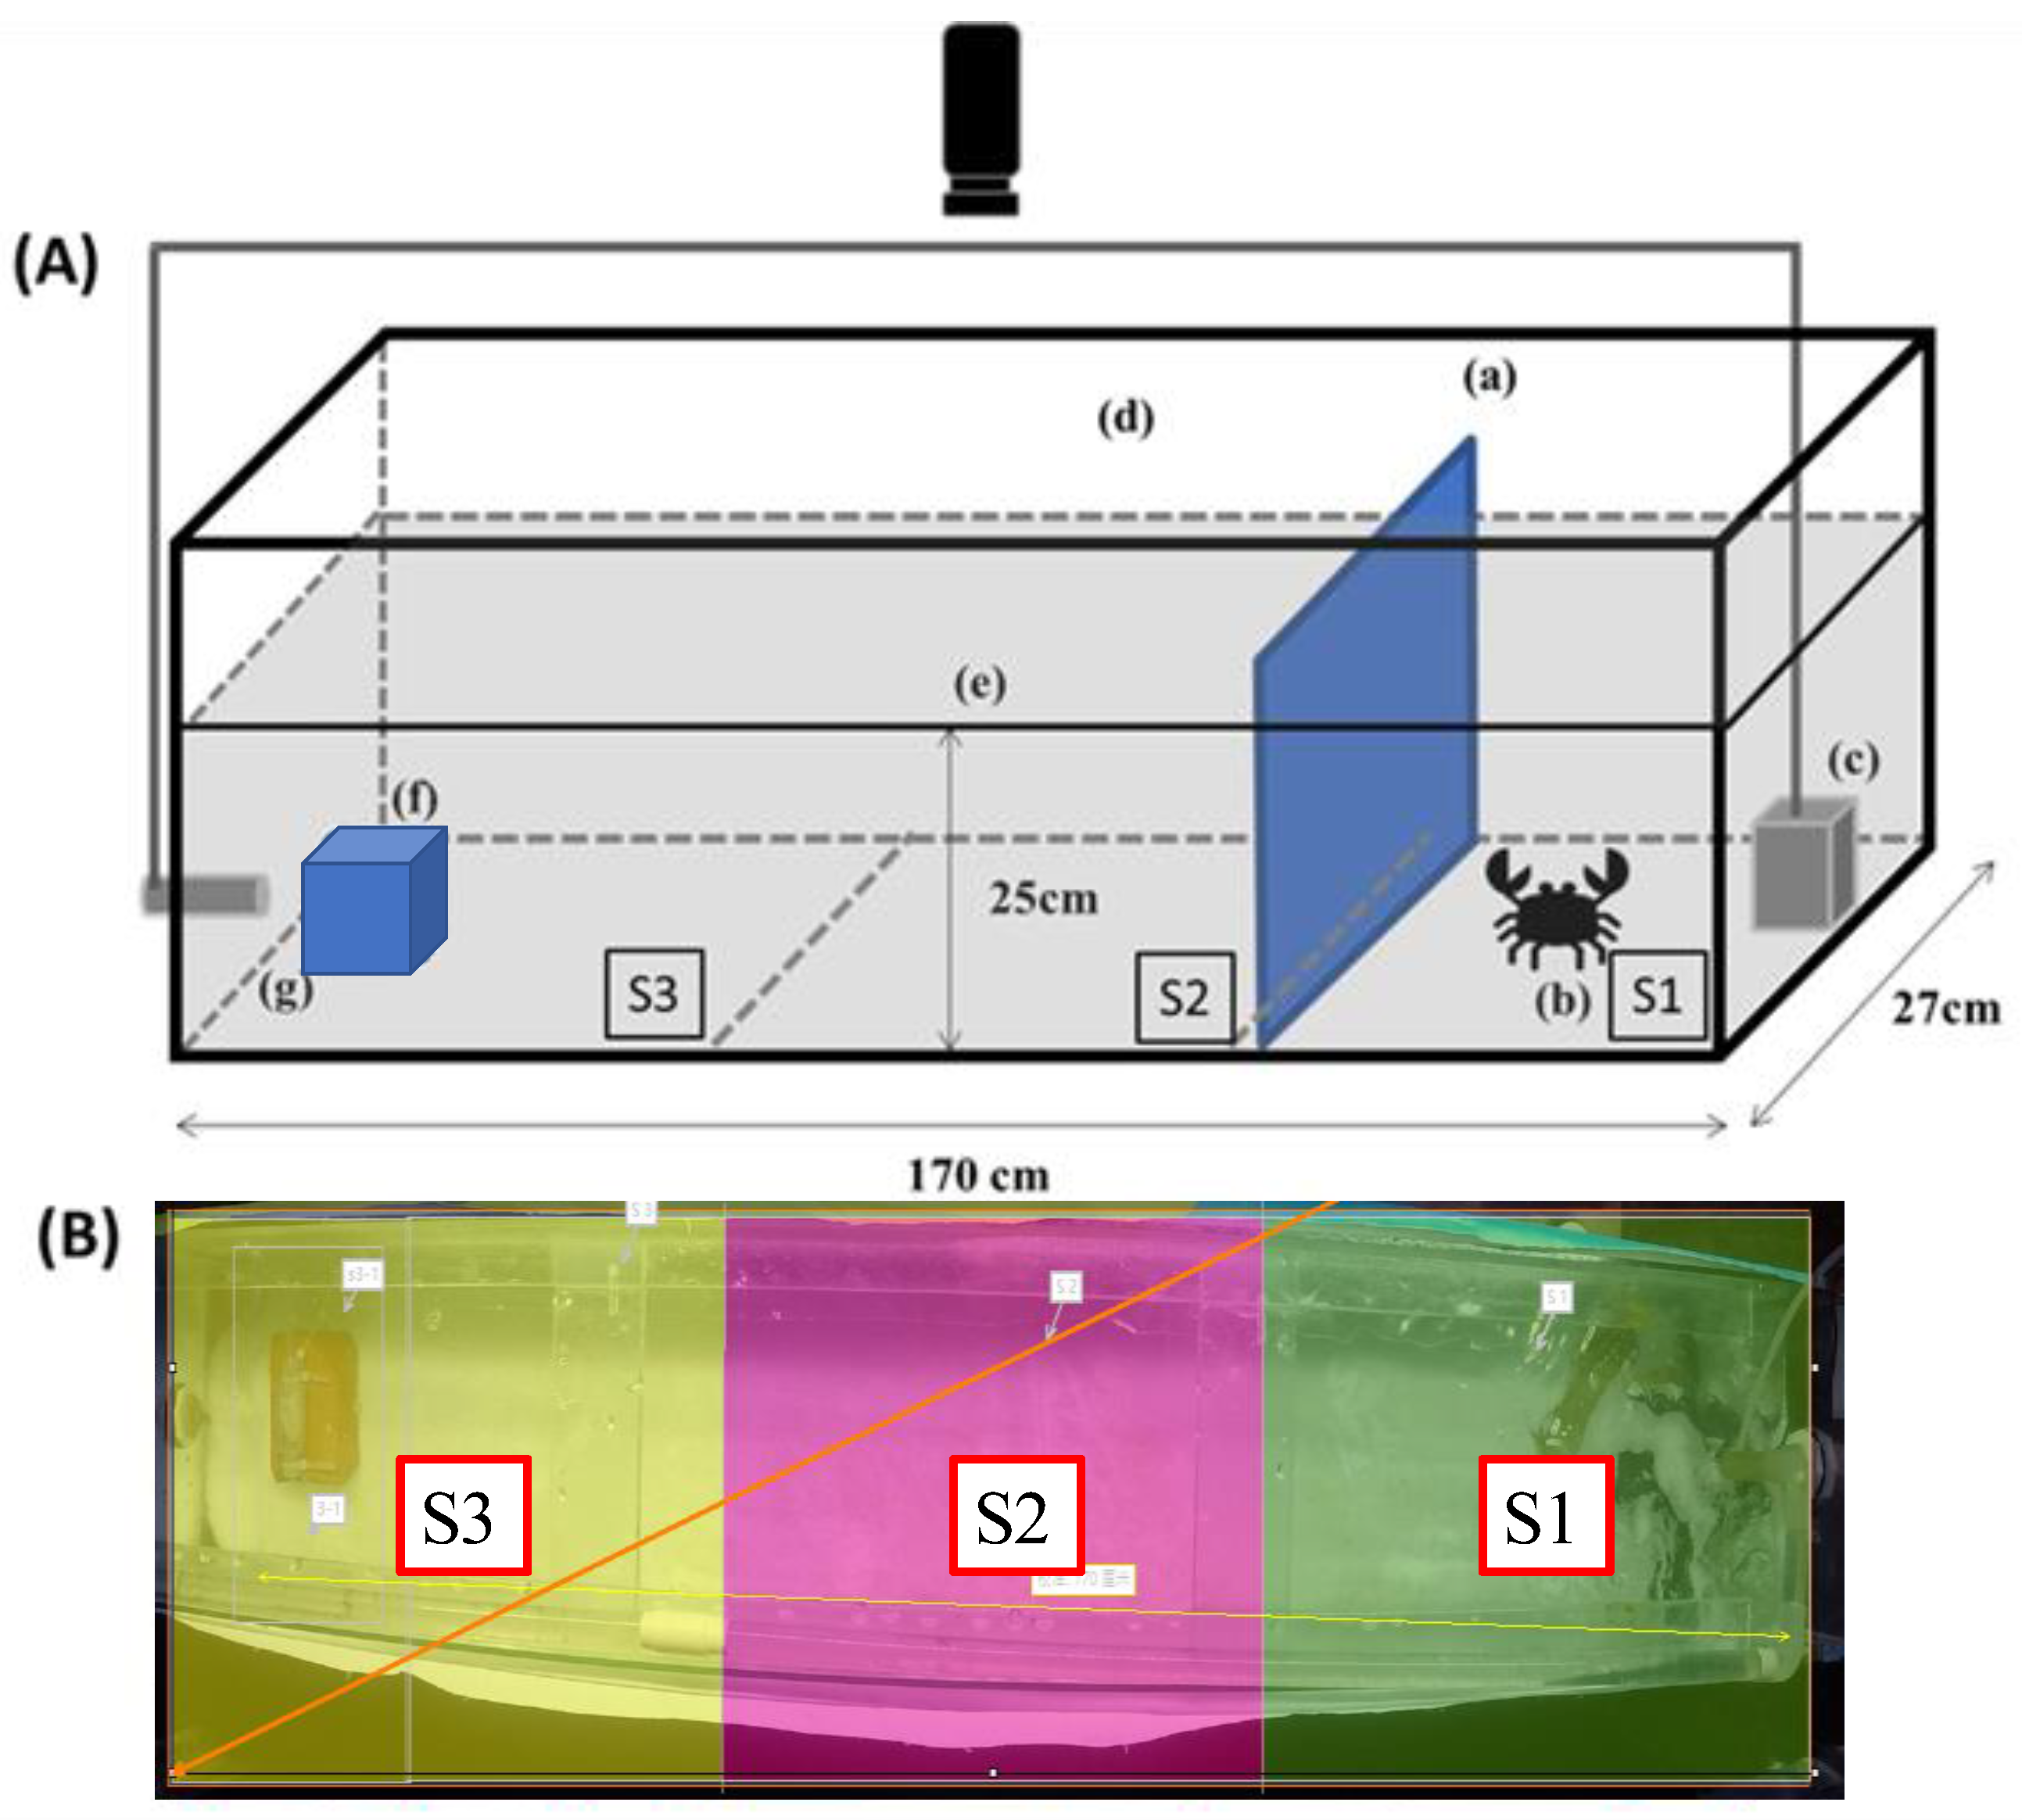
2.2. Captivity Behavior Experimental Design

The setup of the captive behavior experiments consisted of a rectangular glass experimental tank measuring 170 cm × 27 cm × 25 cm and a water circulation system (Figure 1A). The bottom of the experimental tank was covered with white stickers to ensure that the video background appeared completely white. This improved the contrast between the crab and the background and reduced software errors during tracking. White stickers were also used to cover the experimental tank to prevent the external environment from attracting the target crab and affecting the experimental results.
The surrounding light source was covered with a black cloth to avoid reflections on the water surface that could interfere with the software analysis. We used two GoPro Hero 5 (GoPro, San Mateo, CA, USA) cameras placed 2 m from the top center of the experimental tank to record the changes in the crab’s swimming behavior. The experimental tank was divided into three areas and one sub-area to understand the crab’s movement behavior better. These areas were designated as the starting area (S1), the middle area (S2), and the bait area (S3) (Figure 1B). Each area (S1 to S3) had a length of 56 cm.
One control (no bait) and two treatments with natural baits (mackerel, Scomber spp., and squid, Loligo spp.) commonly used by Taiwanese crab trap fishermen were conducted. The bait weight was set at 20 g. During the experiments, the baits were placed in a bait box, and the bait area was in the water tank. The tank was filled with new running water for each experiment. The bait was introduced after a period of silence to avoid saturating the tank with the odor of the bait, which could affect the accuracy of the experiments.

2.3. Image Processing and Analysis

In these experiments, video analysis was performed using EthoVision XT 13 video tracking software, a tool for tracking and analyzing animal behavior based on recorded video footage [15]. This software uses neural networks and machine learning techniques to gather experience and achieve profound learning effects. EthoVision XT 13 can automatically distinguish between observed targets and background images by analyzing the pixel differences in the video images. It can accurately determine various parameters of the observed targets, including their speed, position coordinates, and other relevant behavioral data.
In each trial, the pixel variation method was used to detect the primary movement trajectory and determine the X and Y coordinates of the crabs every 2 s for a total of 30 min. Two behavioral parameters were extracted for each species in the three treatments using the software; the following behavioral endpoints were considered:
I.
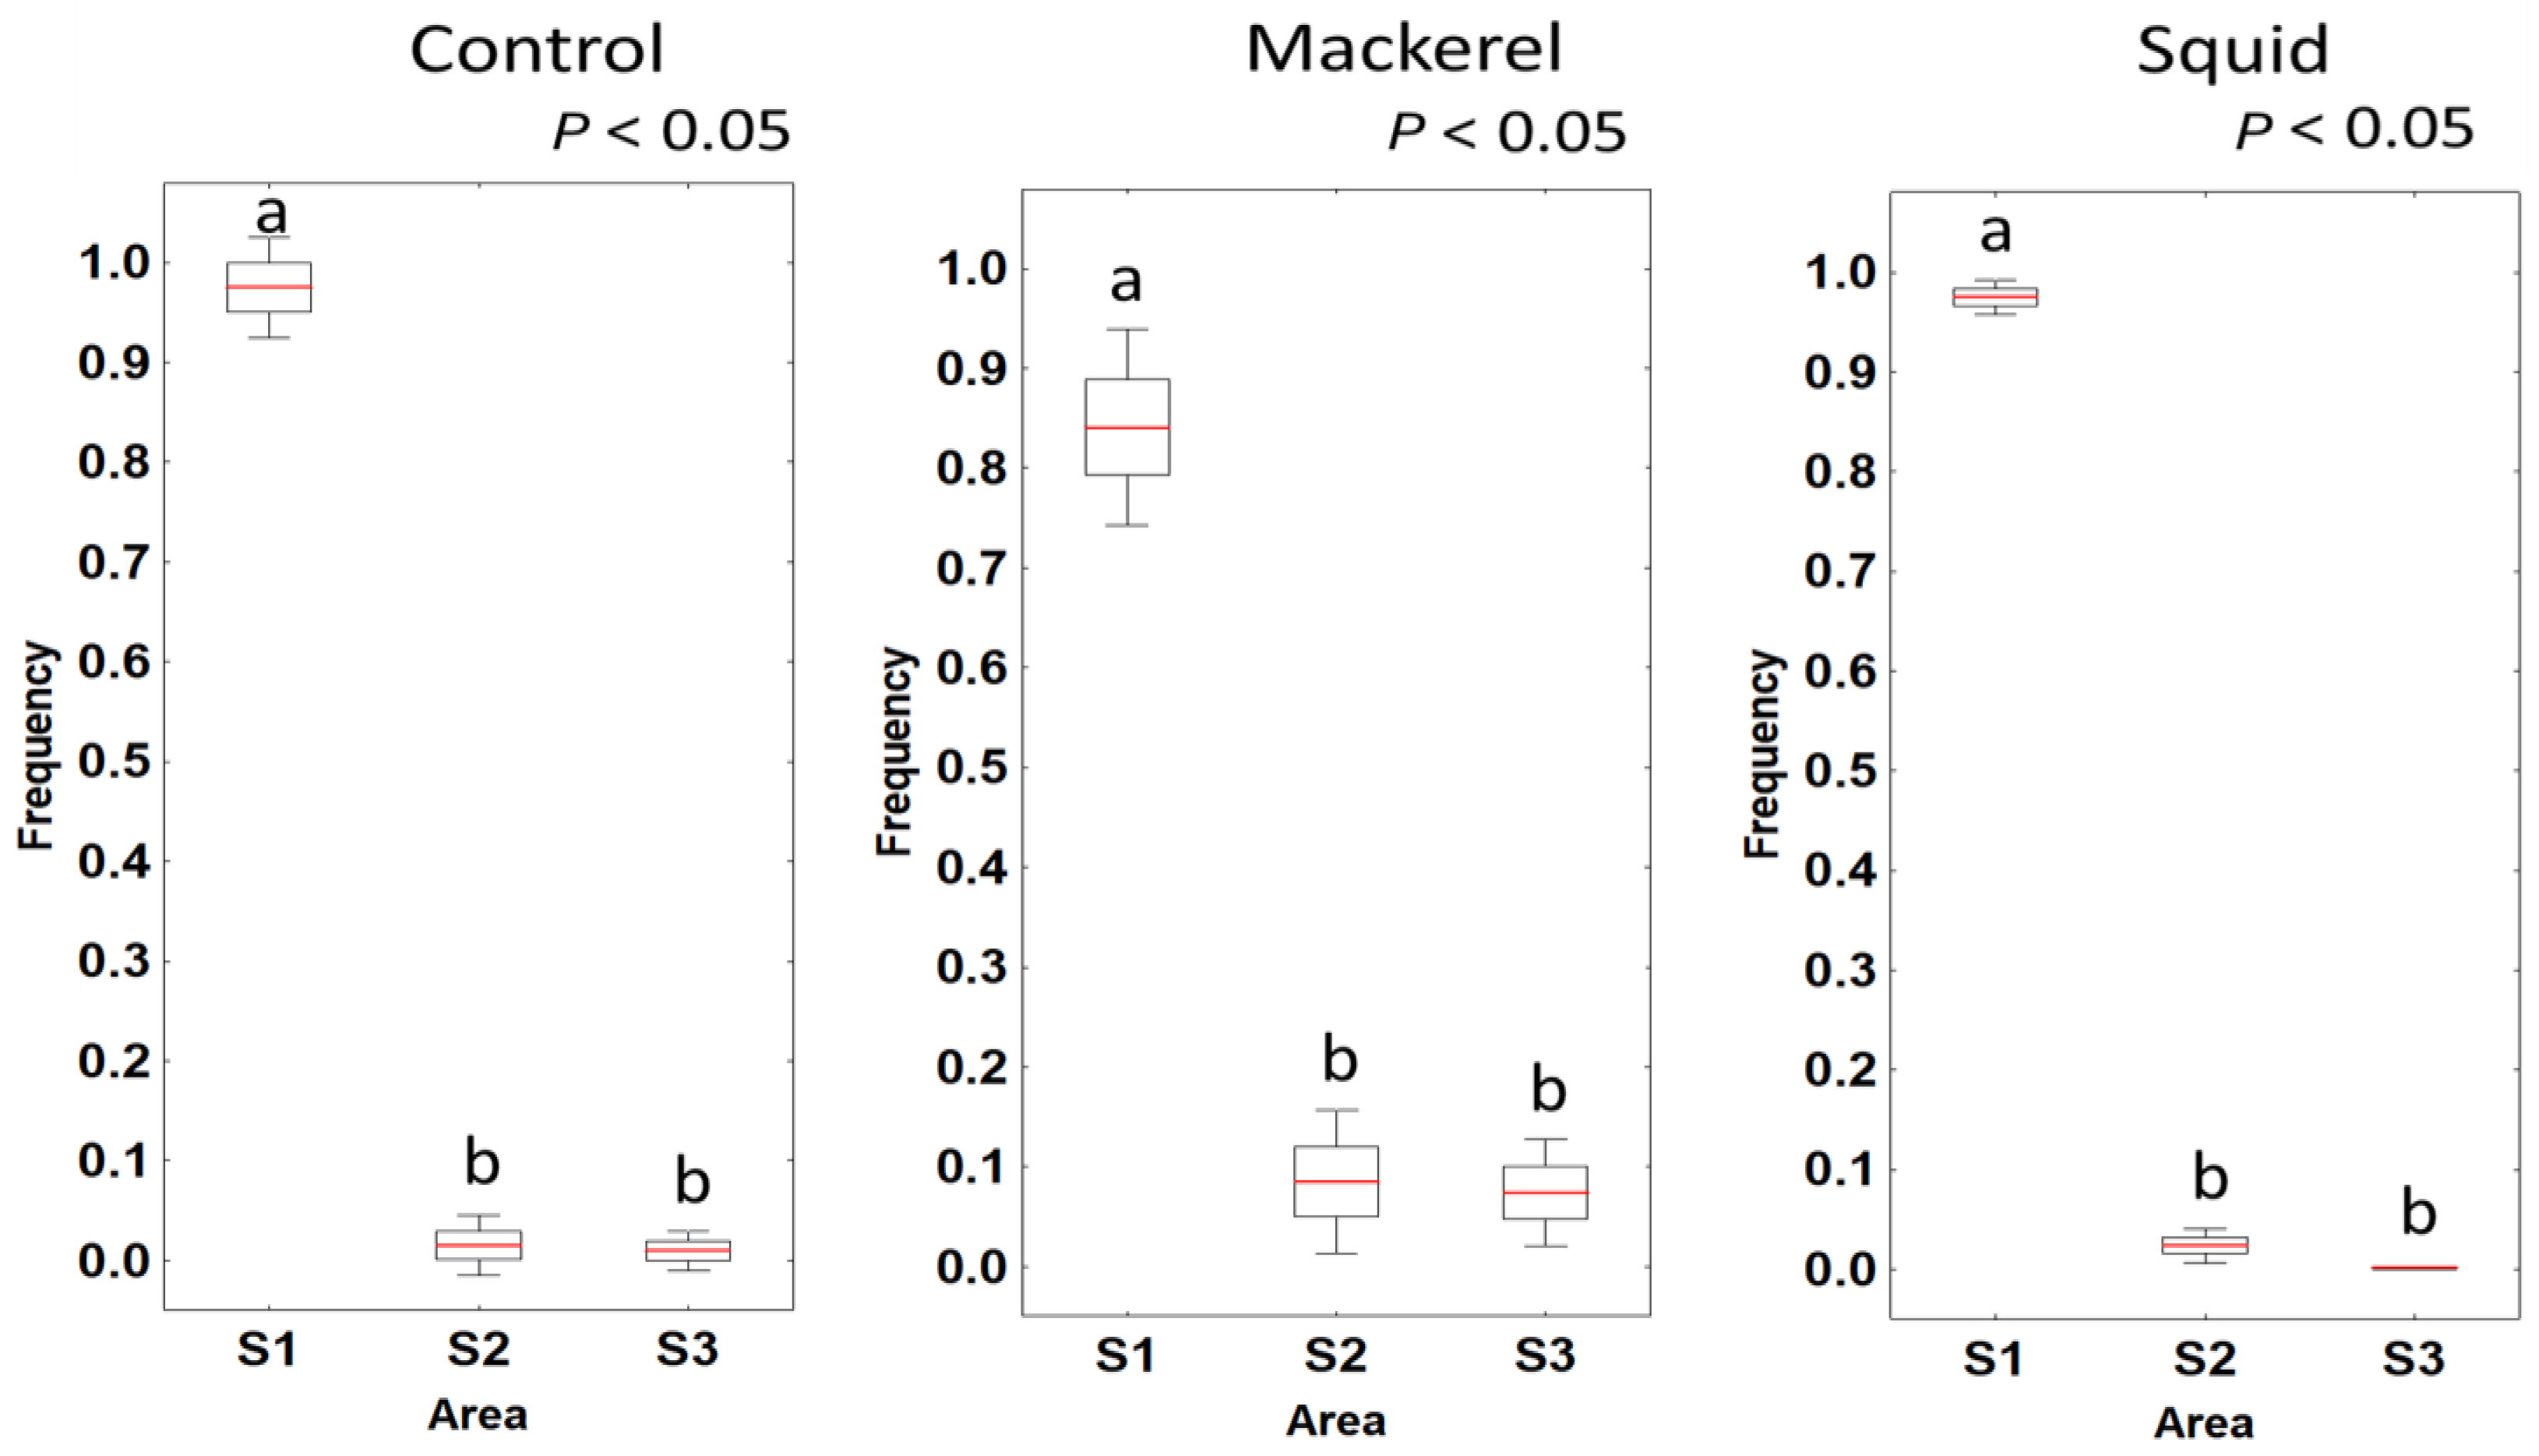
Duration time (DT): The parameter measures crabs’ duration time in each area (S1–S3).
II.
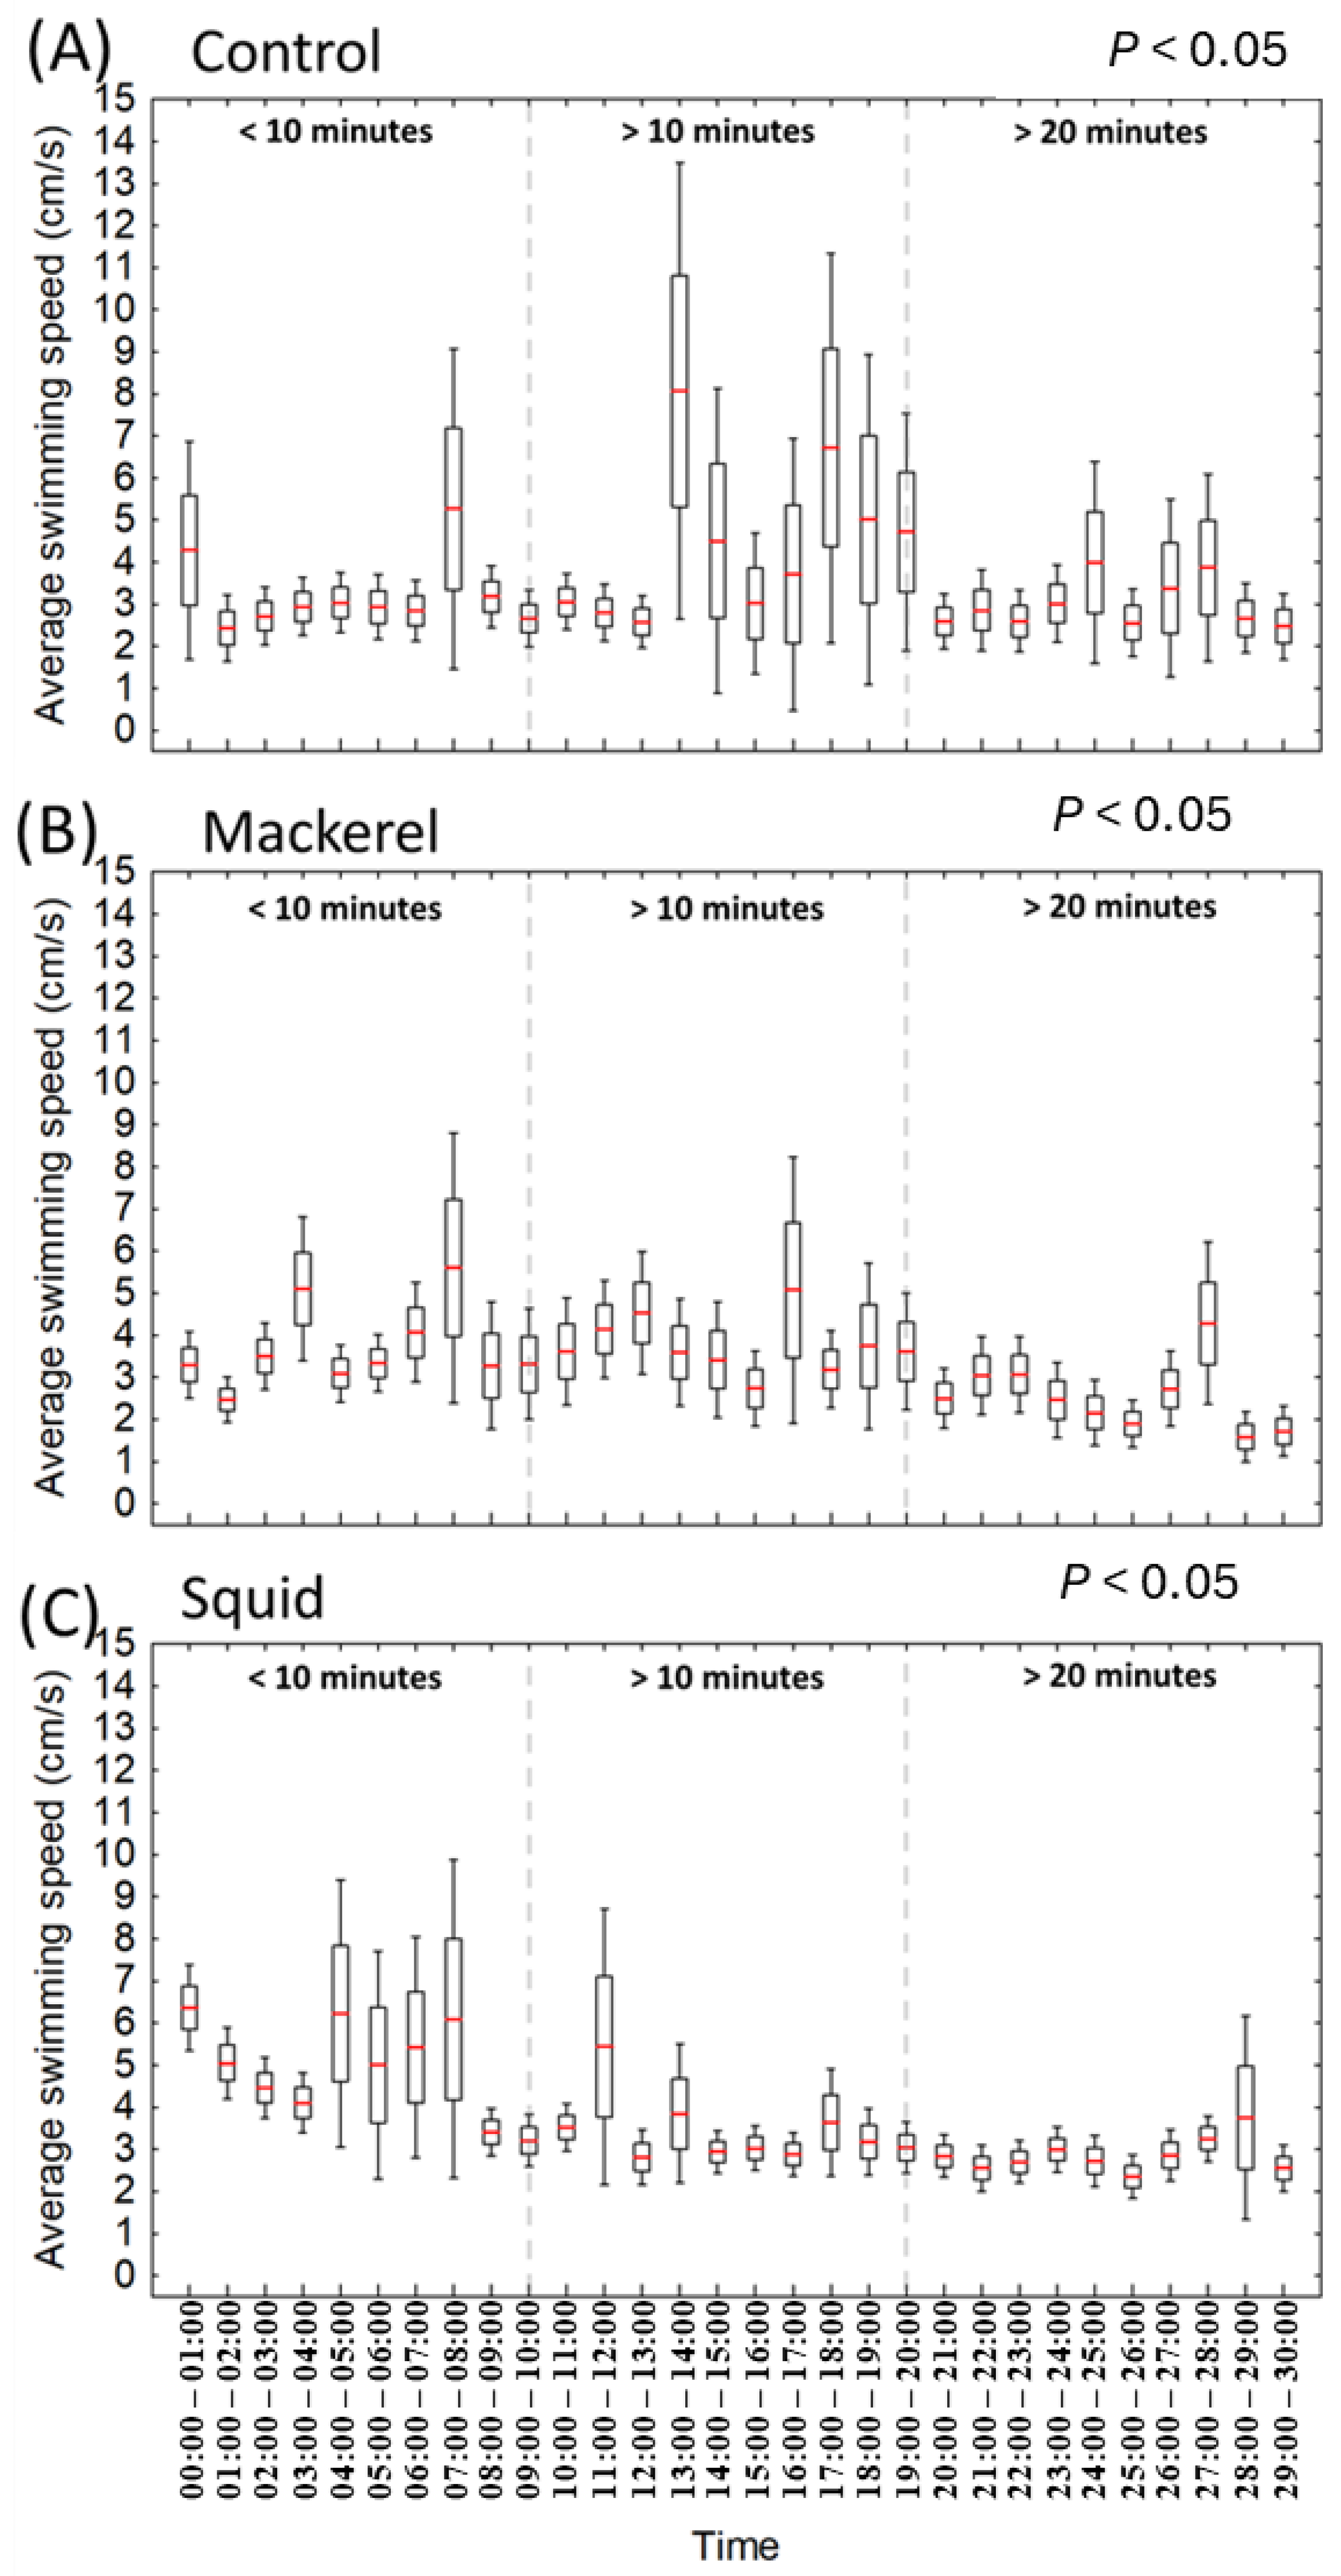
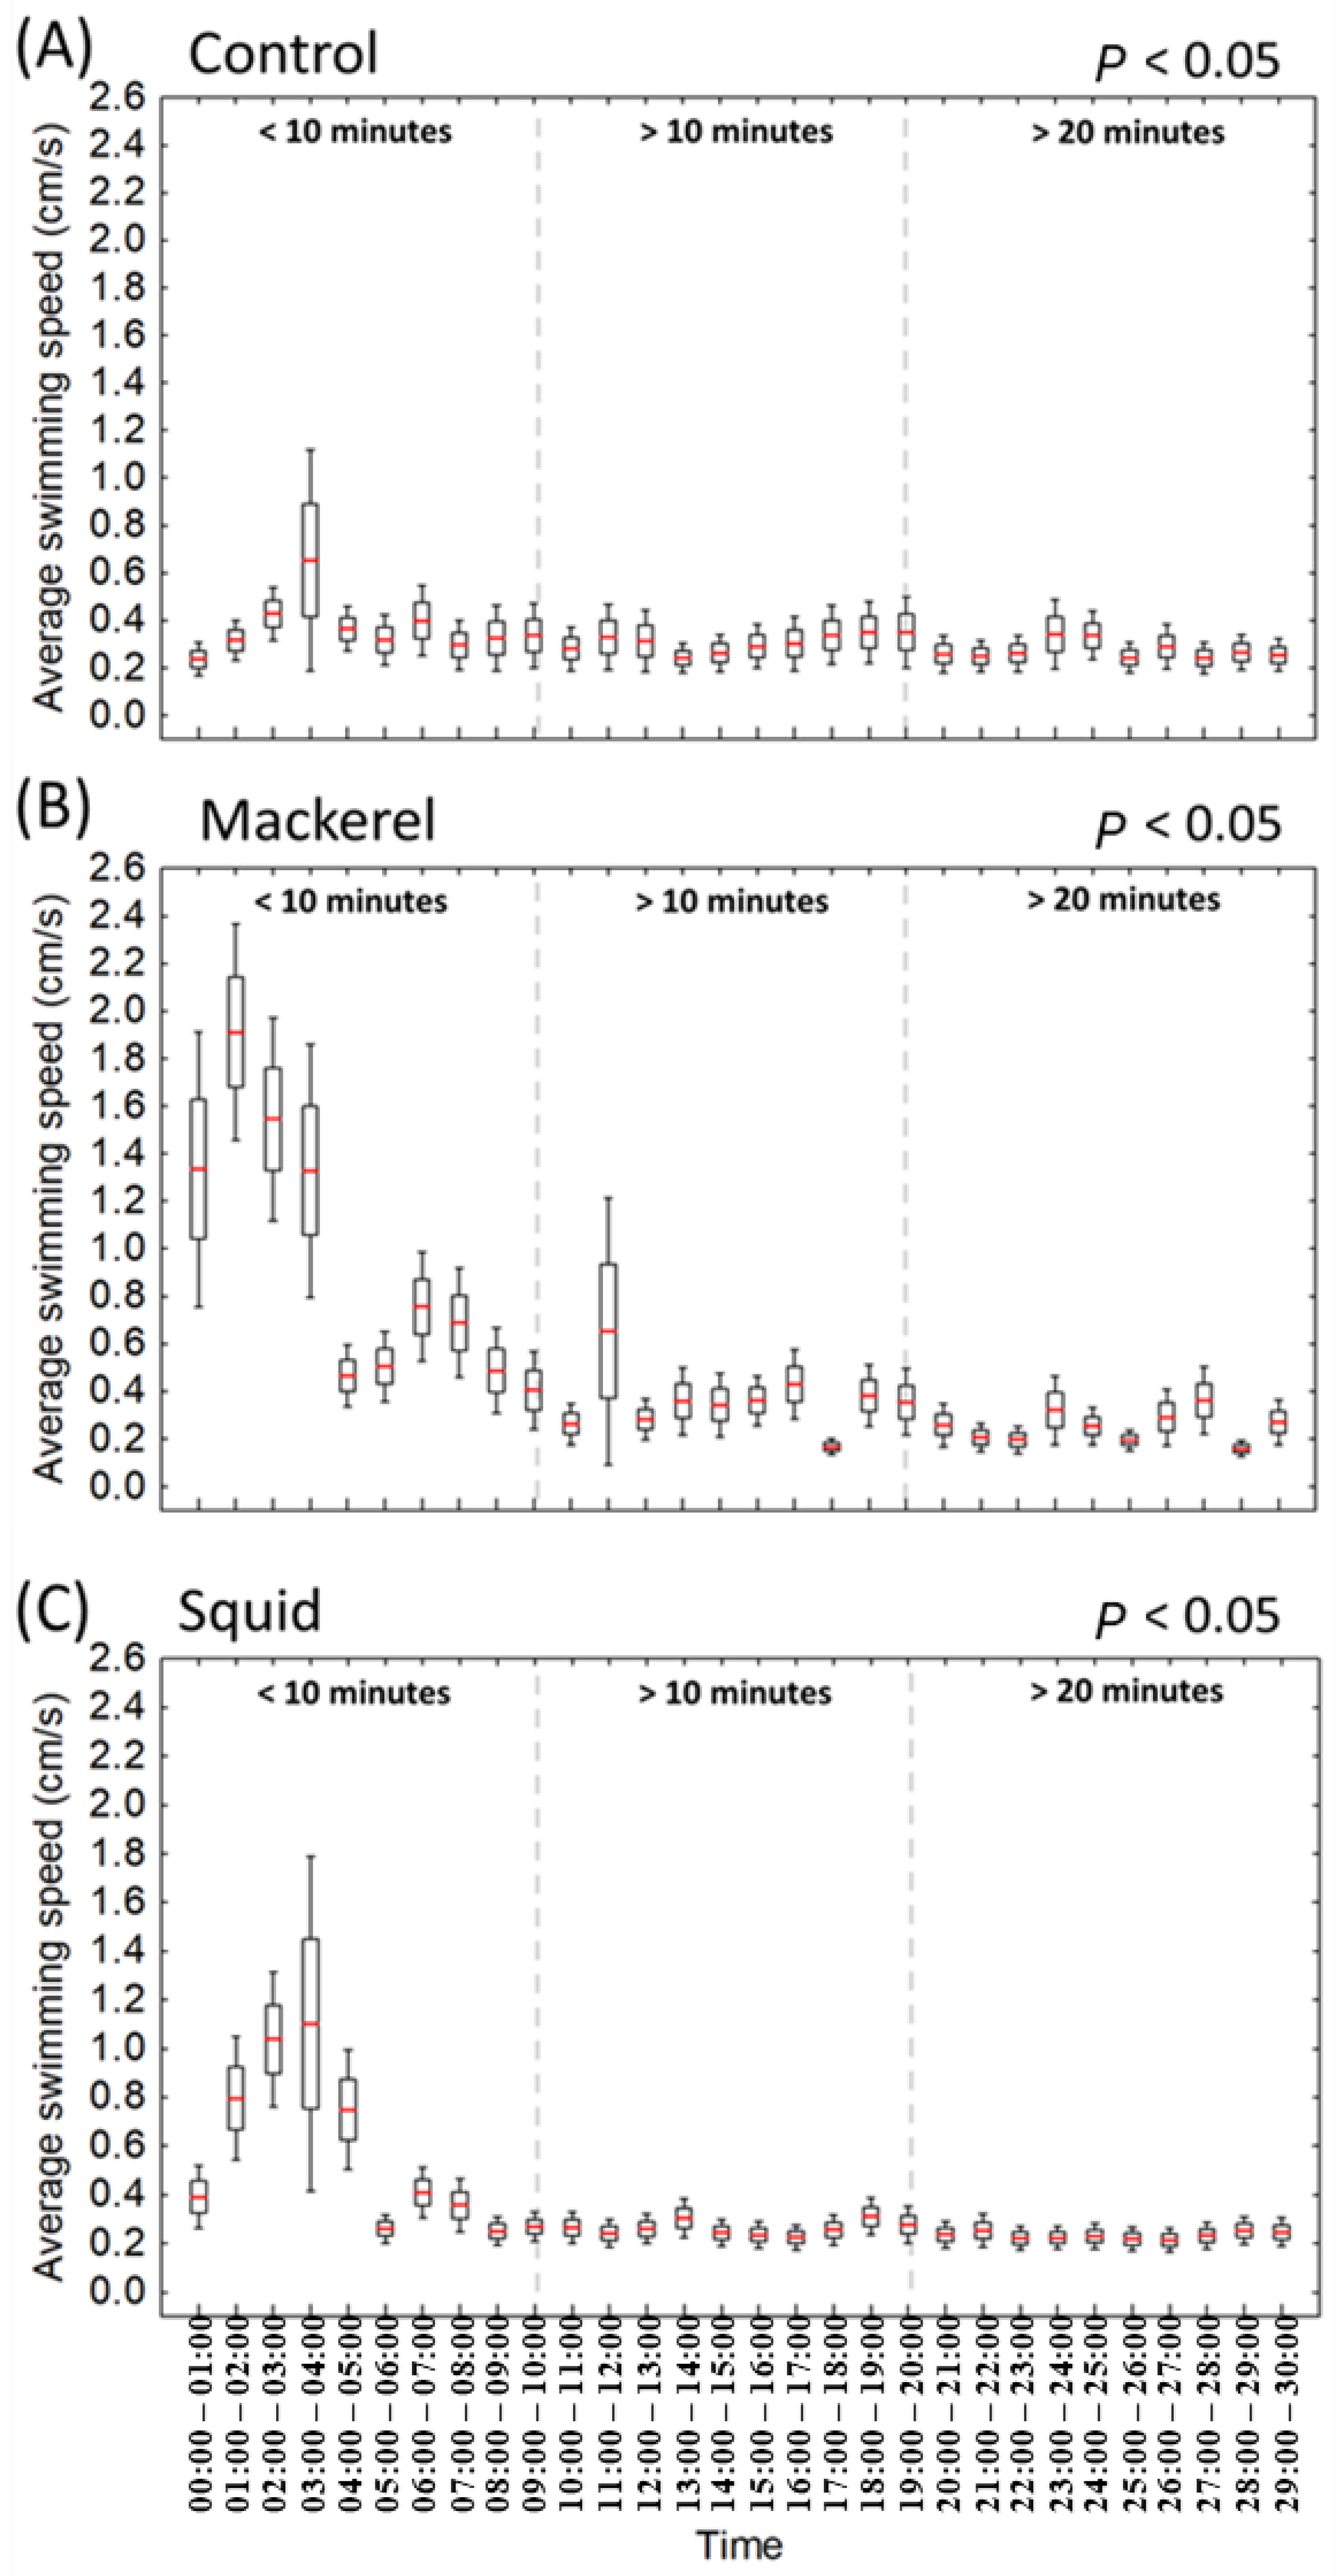
Movement speed (MS): The speed in cm/s of crab moving during the trial.

2.4. Statistical Analysis

The statistical significance of all fixed terms for the captivity experiment was calculated using chi-square tests (ꭓ2) to determine whether the categorical variables significantly correlated. The relationship between each crab species and post-treatment behavior was analyzed using a one-way analysis of variance. Post-hoc pairwise comparisons were performed using Fisher’s Least Significant Difference.
Poisson generalized linear mixed models (GLMMs) [16] were used to determine how the different baits, area, and time affected the swimming behavior of P. sanguinolentus and C. natator. The GLMMs were run using the glmmTMB package v.4.0 [17]; the tidverse package [18] was also used for data manipulation and visualization.
The response variables for our first and second GLMMs were the frequency with which the DT for crabs entered the three areas (Equation (1)) and the MS in which the crabs moved (Equation (2)), respectively. The fixed effects for the first GLMMs were the experimental groups (control, mackerel, and squid) and the area type (S1, S2, and S3). For the second GLMMs, the fixed effects were the experimental groups (control, mackerel, and squid) and the time phases (<10, 10 to 20, >20 min). The random effects of crab ID (i.e., the first crab used in the captivity experiment = 1) were included to account for the time-dependence structure of the data for the first and second GLMMs. The first model is shown in Equation (1), where frequency ij represents the j-th frequency observation in the i-th captivity experiment. Our second model is shown in Equation (2), where speed ij represents the j-th speed observation in the i-th captivity trial.
µ i j = f r e q u e n c y i j + t r e a t m e n t i j + D T i j + c r a b I D i
µ i j = M S i j + t r e a t m e n t i j + t i m e i j + c r a b I D i
Each GLMM was tested for outliers, homogeneity, normality, collinearity, interactions, and independence according to a method presented in the literature [19], as described in the Supplementary Data. The p-value of the variables was less than 0.05, which is defined as a significant difference. The GLMM analysis was performed using R Statistical Software 3.6 (R Development Core Team) for data preparation and visualization.

3. Results

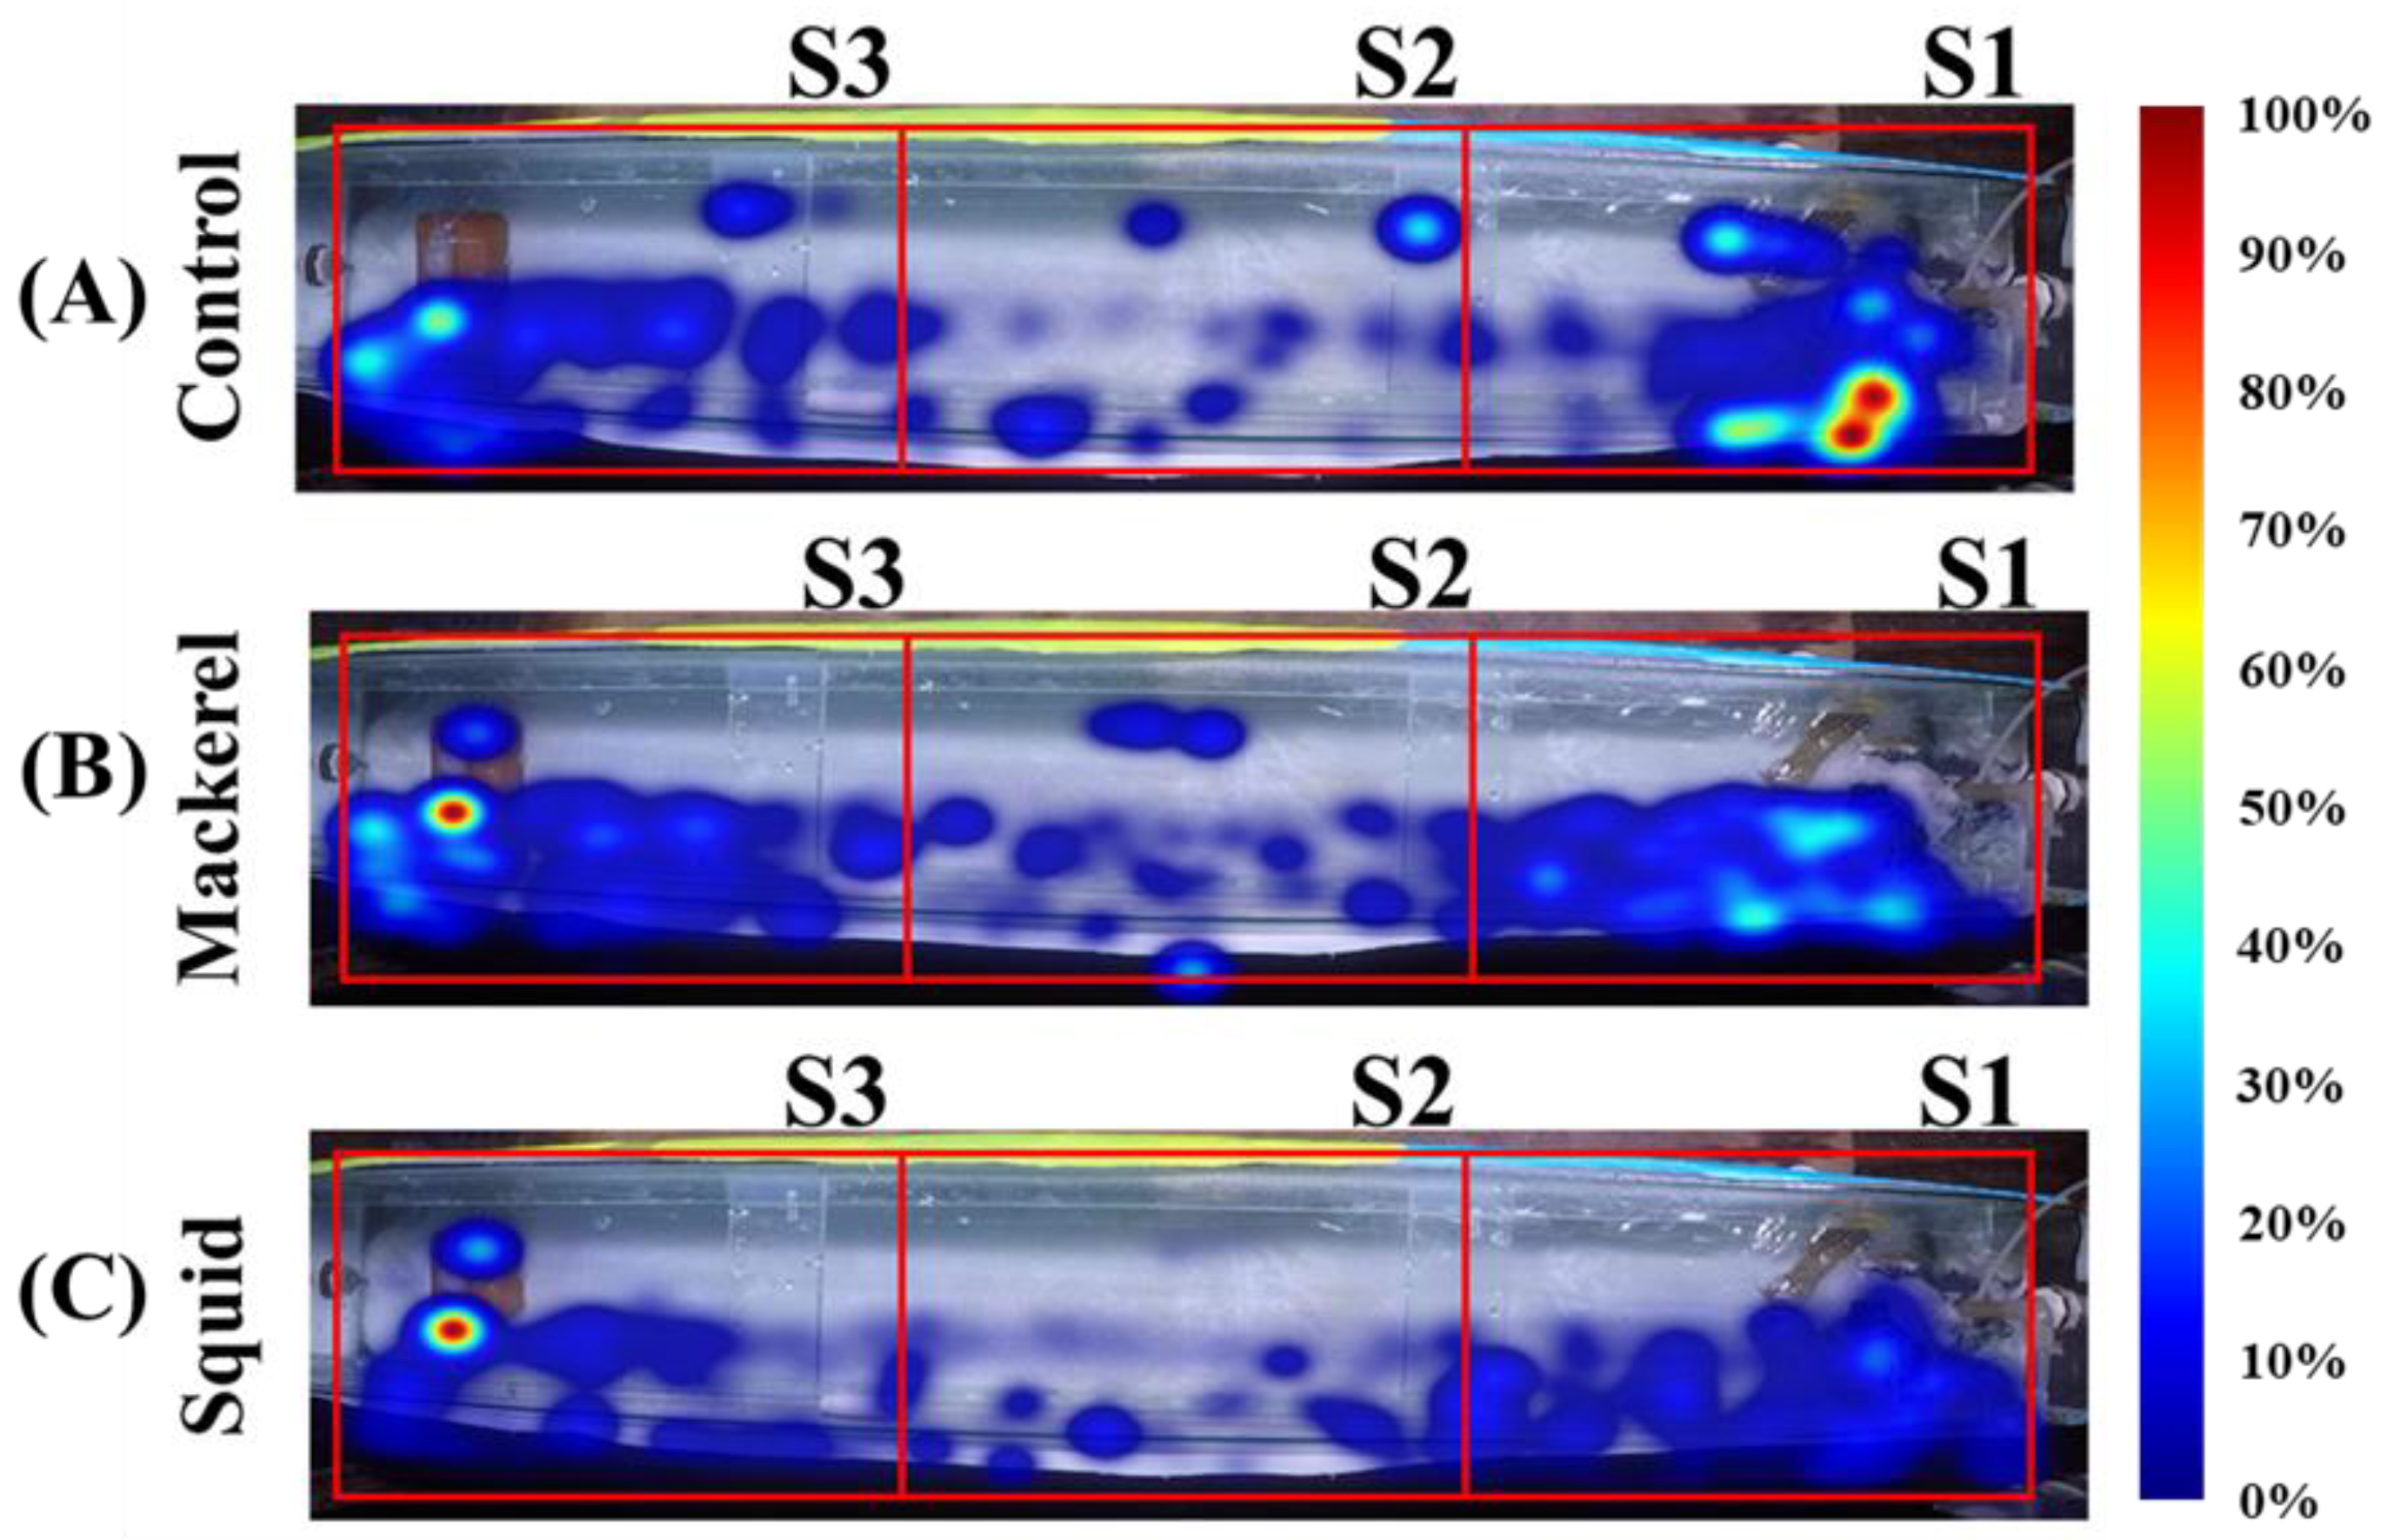
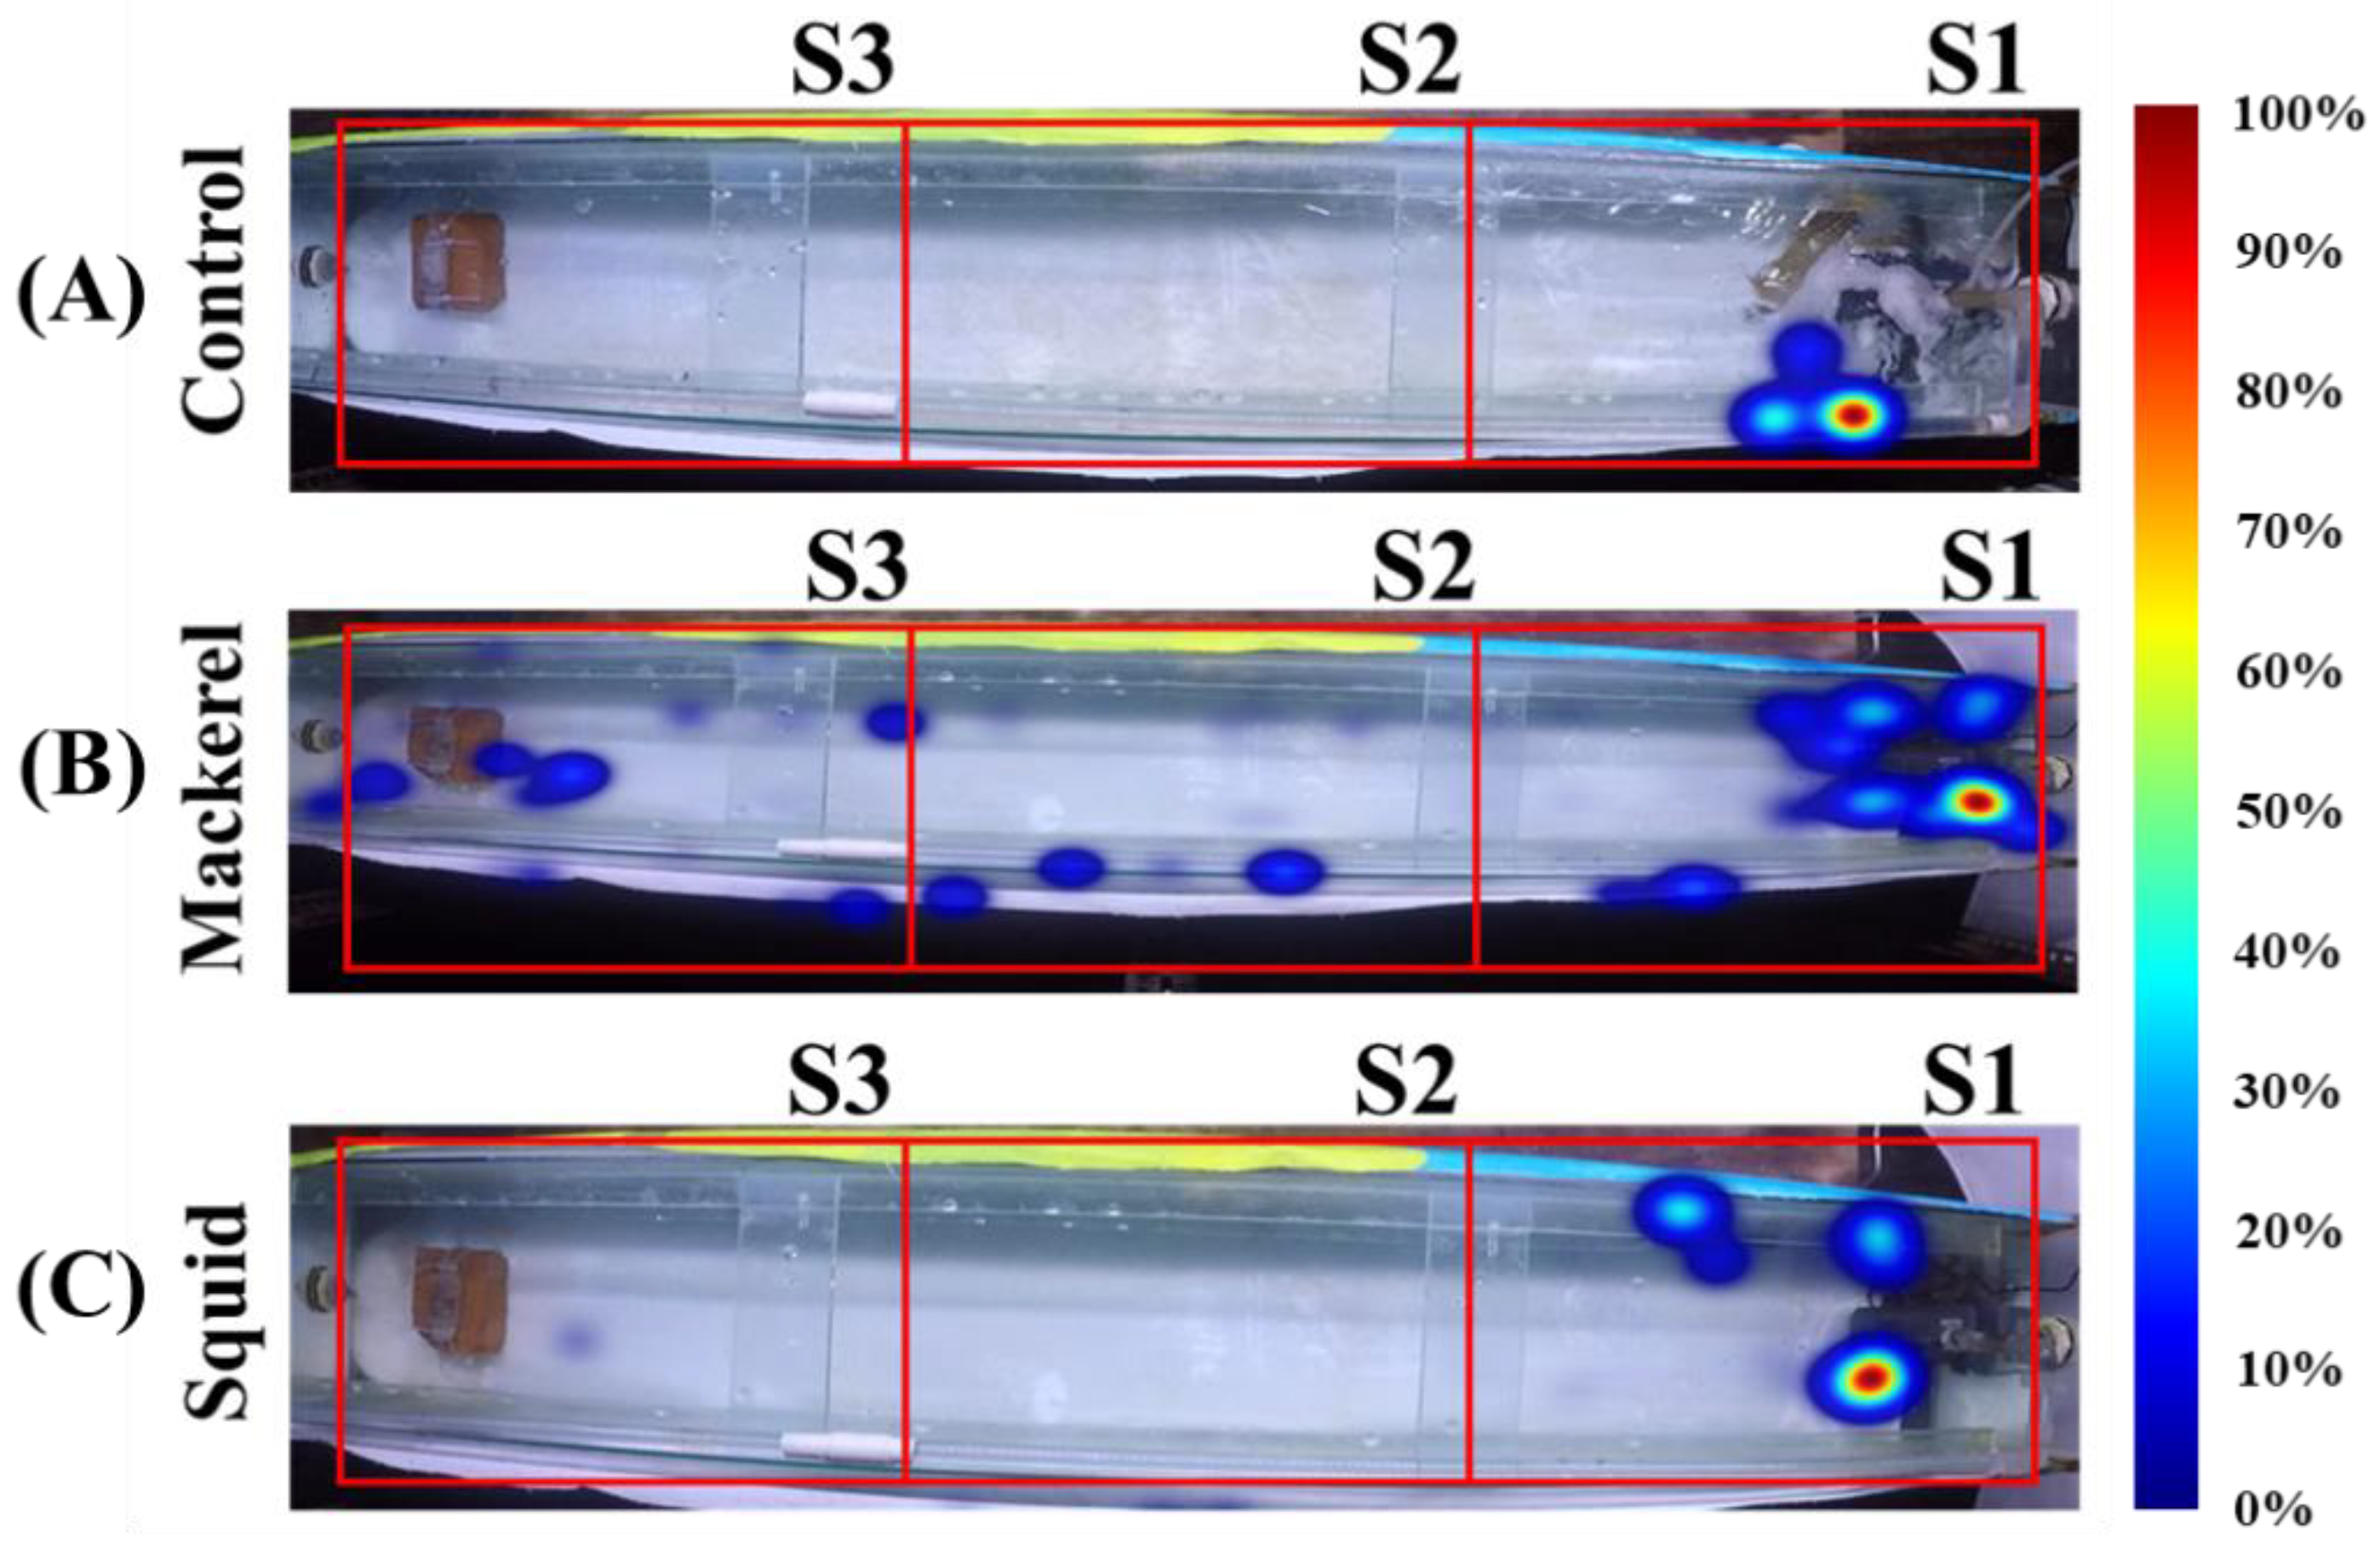
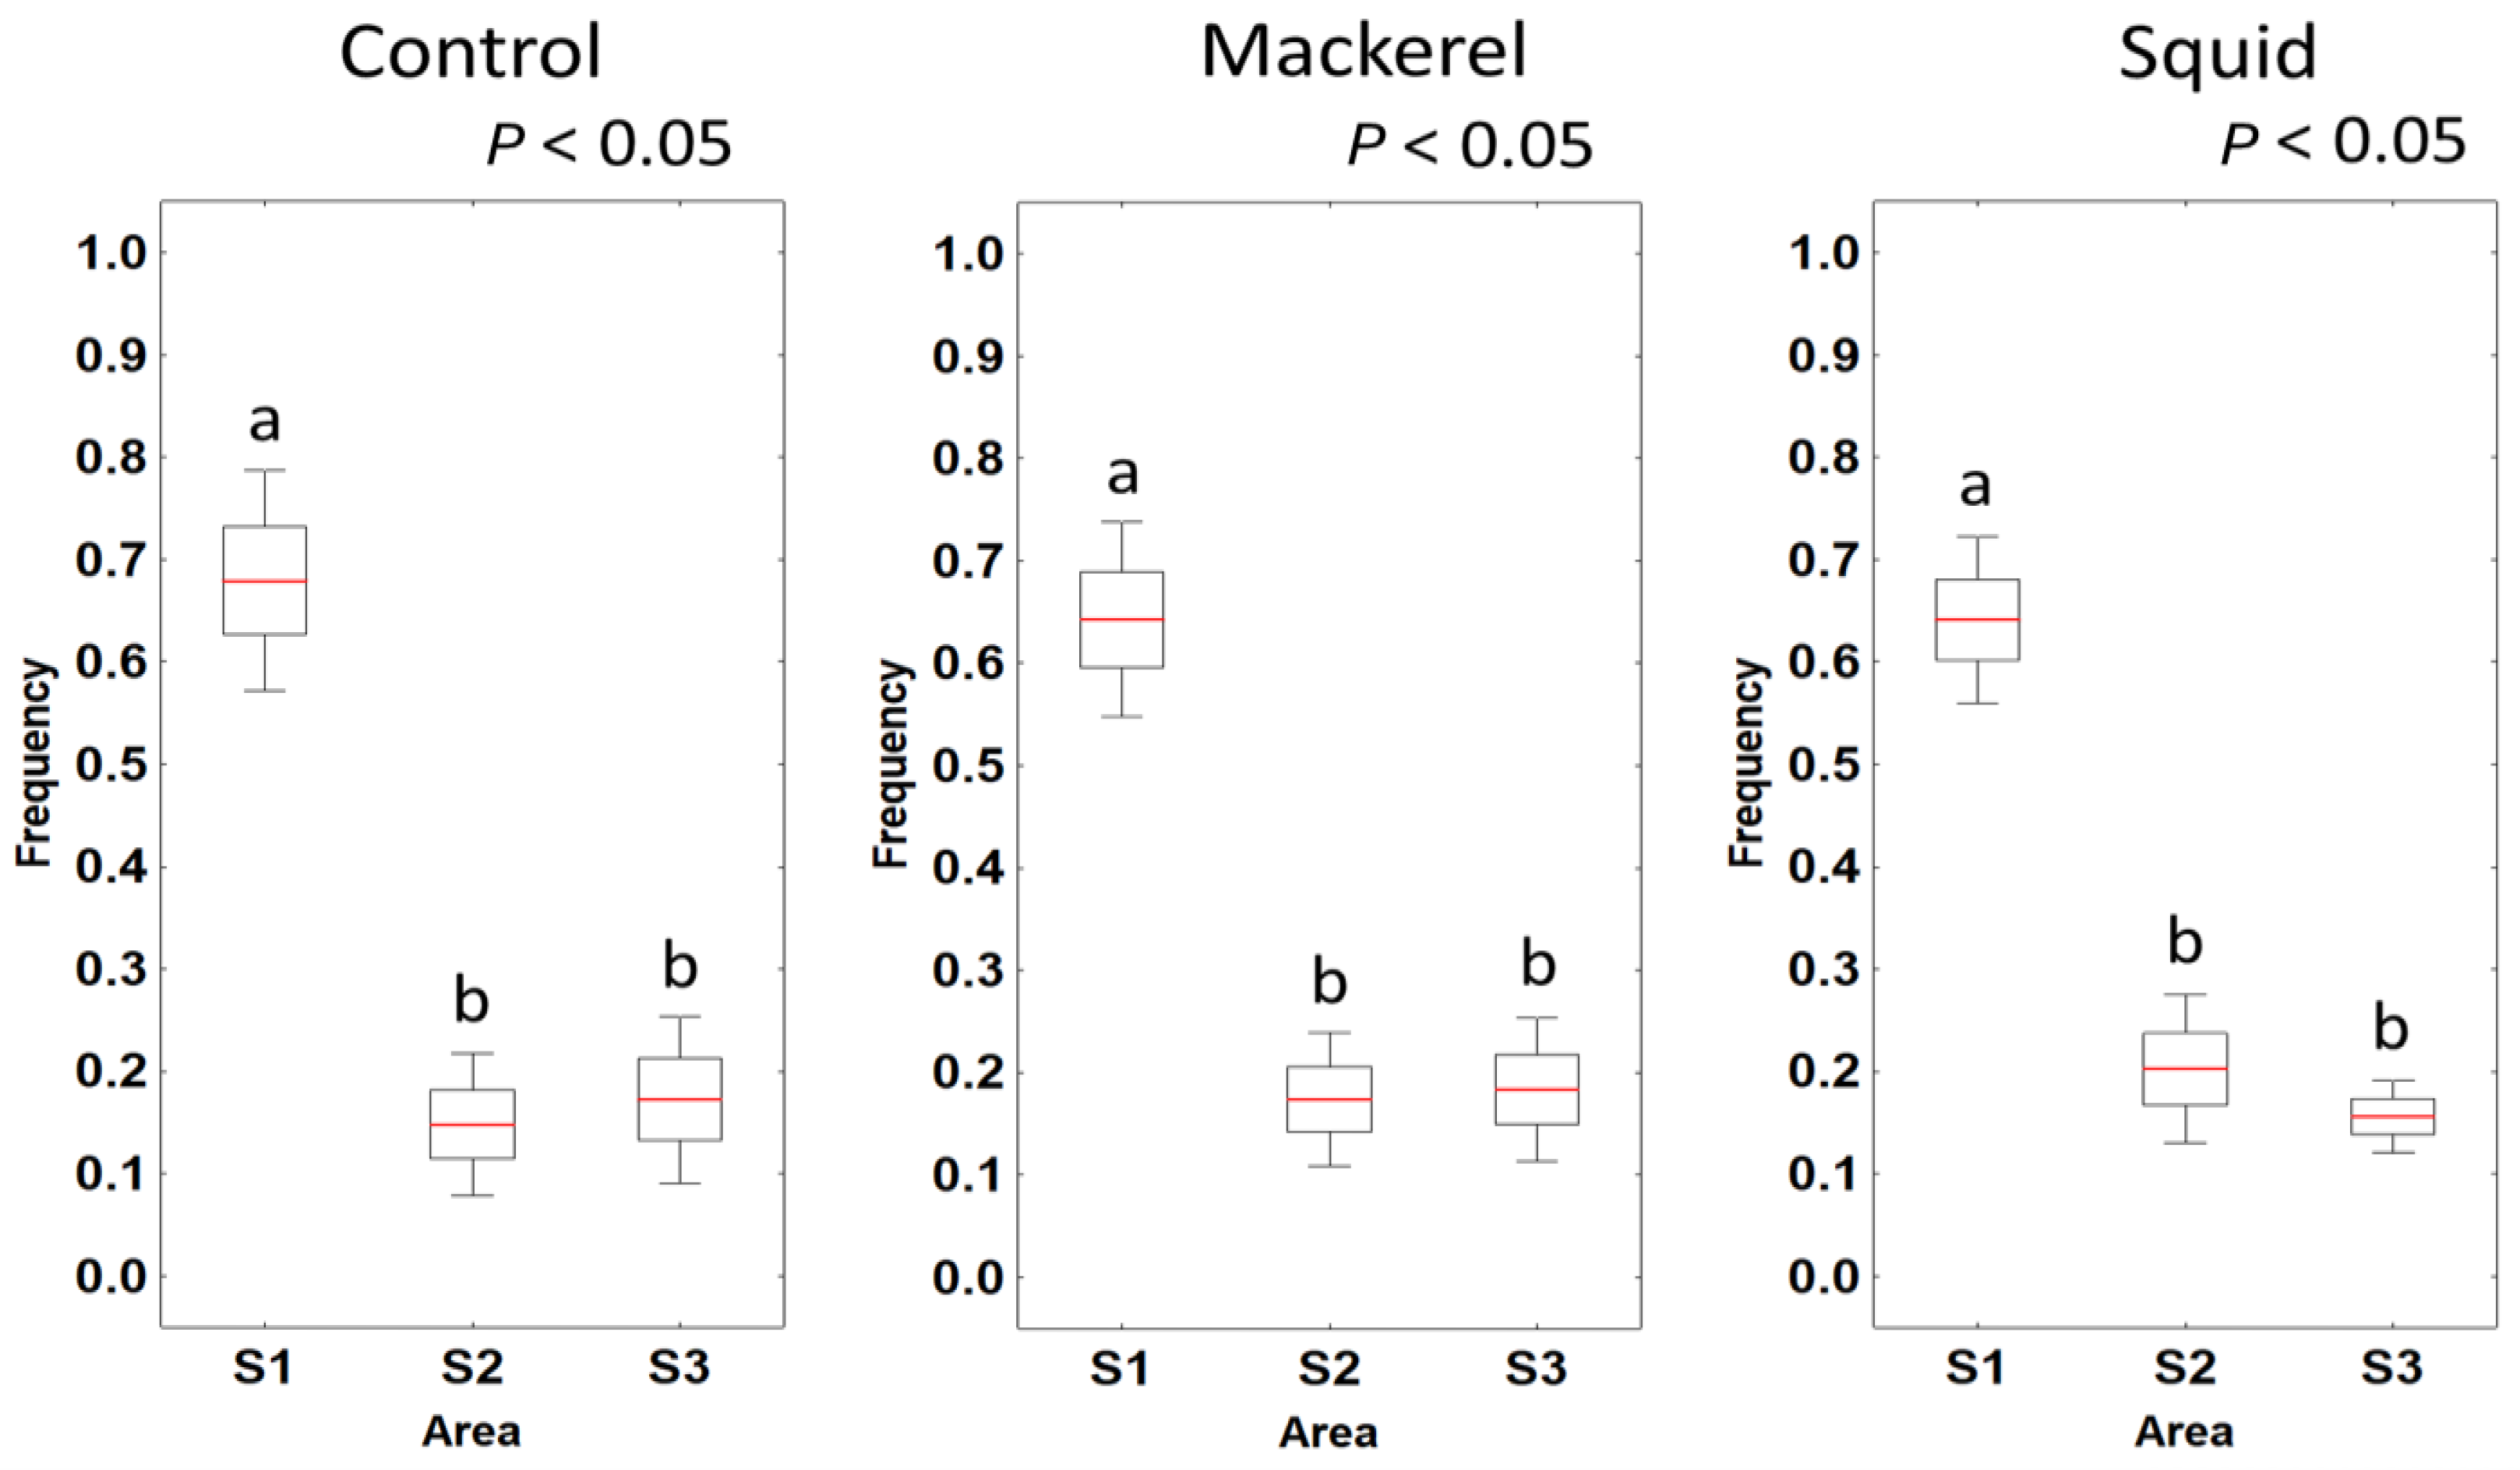
3.1. Spatial Distribution

Maps of the spatial distribution of hotspots were used to compare the effects of the different baiting trials. The results showed that P.sanguinolentus was frequently concentrated in areas S1 and S3 in both the control and treatment groups (Figure 2). However, C. natator crabs were frequently observed, in both the control and squid treatments, with a higher concentration in the S1 area compared to the S2 and S3 areas (Figure 2A,C). The crabs moved to areas S2 and S3 only during the mackerel treatment (Figure 3B).
The chi-square test results showed differences in the behavior of the individual crab species after applying the different treatment groups (natural bait) (Table 1). There was no significant difference in the spatial distribution of P. sanguinolentus between the control and treatment groups in area S1 (p > 0.05), but significant differences were observed in areas S2 and S3 (p < 0.05, Table 1 (a)). GLMM analysis of P. sanguinolentus showed that mackerel and squid were negatively correlated with time duration (DT) in each area (Figure 4A). A comparison of the box-and-whisker plots for the mean abundance in each area also showed that P. sanguinolentus had similar patterns in both the control and treatment groups (Figure 5). The spatial distribution results indicate that P. sanguinolentus shows a greater willingness to explore its surroundings.
For C. natator, there was no significant difference in spatial distribution between the control and treatment groups of squid in area S1 (p > 0.05), but there was a significant difference with the treatment groups of mackerel in area S1 (p < 0.05, Table 1 (b)). The results of the GLMM analysis for C. natator showed that only the squid treatment groups had no negative correlation with DT in S1 (Figure 4B). In addition, the mean abundance showed lower values in S1 and higher values in S2 and S3 for the mackerel treatment groups compared to the squid control and treatment groups (Figure 6). The spatial distribution results indicate that C. natator is usually in a stationary waiting state and only shows a difference in movement distribution when mackerel is used as bait.
In addition, there was no significant difference in DT of S1-S3 in the control, mackerel, and squid treatment groups between male and female crabs of P. sanguinolentus and C. natator (Table 2).

3.2. Swimming Speed

The average swimming speed of P. sanguinolentus was lower in the first 10 min and increased after 15 min in the control groups, although no consistent trend was observed (Figure 7A). In the mackerel and squid treatments, P. sanguinolentus exhibited a faster average swimming speed (>5 cm/s) during the first 10 min, particularly in the squid treatment (Figure 7B,C). After 10 min, the average swimming speed displayed a stable and continuous movement trend in both the mackerel and squid treatments.
In contrast, the average swimming speed of C. natator was nearly motionless in the control groups (Figure 8A). However, in the mackerel and squid treatments, C. natator demonstrated a faster average swimming speed (>1 cm/s) during the first 5 min (Figure 8B,C) but subsequently reverted to an almost motionless state after 10 min in the squid treatment (Figure 8C).
Thes indicated that the swimming speeds of P. sanguinolentus were negatively correlated during the time phase > 20 min and in the mackerel treatment groups (Figure 9A). This finding showed that P. sanguinolentus exhibited continuous movement with no fixed speed when no bait was present in the control groups. However, when the crabs perceived the presence of bait within the first 10 min, they demonstrated a more stable movement speed while searching for it. Conversely, the GLMMs revealed that the swimming speed of C. natator was positively correlated in the mackerel and squid treatment groups (Figure 9B). This result indicated that C. natator exhibited stationary or low movement speed when no bait was present in the control groups; however, upon perceiving the bait in the treatment groups, its movement speed increased within the first 10 min. Additionally, there was no significant difference in movement speed between male and female crabs of both P. sanguinolentus and C. natator in the control and treatment groups (Table 2).

4. Discussion

Individual differences can lead to variations in behavior among crabs of the same species. Factors such as hunger levels, body size, water temperature, habitat substrate, and maturation time all influence their behavior [10,20,21,22,23,24]. Utilizing distribution maps of two crab species, this study found that the attraction of different bait scents affects their distribution characteristics. Notably, P. sanguinolentus exhibited a greater willingness to explore its environment compared to C. natator.
The sex and age distribution of P. sanguinolentus is closely related to habitat depth. Juveniles and adult males typically inhabit nearshore waters with sandy and muddy bottoms at depths of approximately 10–30 m [25]. In contrast, adult and buried females often migrate to deeper waters (between 40 and 80 m) to spawn, resulting in a broader distribution of this species [6,25].
Observations of P. sanguinolentus individuals reveal substantial individual differences; for example, larval crabs tend to explore the aquarium quickly, while shyer individuals may linger in the S1 area for some time before venturing out (Figure 2). C. natator can reach a maximum carapace width of 17 cm and is predominantly found in the East China Sea and South China Sea [1,26]. This species inhabits rocky-sandy bottoms at depths ranging from 5 to 300 m [27] and primarily feeds on small marine invertebrates and fish [28].
Thus, P. sanguinolentus and C. natator may exhibit different life histories, habitats, body shapes, and other factors, which may have contributed to the rapid exploration of the aquarium by P. sanguinolentus and the more stationary behavior patterns of C. natator. Moreover, the hotspot distribution of the two crab species displayed characteristics influenced by the attraction of different bait scents (Figure 2 and Figure 3). The scent of the baits is released through chemical reactions and is carried by water currents [29,30]. Consequently, the principle behind traps is based on the fact that crustaceans are drawn to the scent of the bait carried downstream, prompting them to crawl toward the trap entrance where they are captured [31,32,33].
The catch rate of crustacean species in their natural habitats largely depends on various factors including population numbers, season, bait type, fishing gear, soaking time, and sea conditions [34,35,36,37,38,39]. For instance, the catch rate of Scylla serrata significantly decreases if the bait is soaked for more than 24 h [40]. The dietary composition of P. sanguinolentus consists of fish, crustaceans, mollusks, and polychaetes, with little variation [41,42]. This suggests that there are no significant differences in spatial distribution between the two baits used in this study. However, the spatial distribution became more concentrated around the bait box when squid was used, whereas a broader distribution range was observed in area S3 when mackerel was employed (Figure 2, Table 2). The muscle cells of mackerel are arranged in parallel, connected to the skeleton and skin by connective tissue [43]. In contrast, the muscle tissue of squid consists of a strong collagenous epithelium, inner epithelium, and radially arranged muscles between the circular muscle and the epithelium, running perpendicular to these three layers [44]. Through experimental observation, it was found that crabs tend to come into contact with the dispersed muscle tissue of mackerel during movement, resulting in a prolonged attraction time (Figure 2, Table 2). In contrast, squid have a specialized circular muscle structure [44,45,46], so their muscle tissue is less likely to break and scatter, allowing the crabs to gather around the bait quickly. The different results with squid and mackerel baits arise from their muscle structures: the scattered tissue of mackerel prolongs attraction as the crabs interact with it. In contrast, the intact structure of squid leads to faster aggregation of crabs around the bait.
It can also be observed that P. sanguinolentus tends to explore along walls, while C. natator cluster around current-generating devices to seek shelter in their environment. Natural or artificial shelters in habitats can distract crabs and increase their survival rate from cannibalism [47,48,49,50]. In addition, there was no significant difference in movement speed or spatial distribution between the control and experimental groups concerning the sexes of P. sanguinolentus and C. natator. Naimullah et al. [51] compared the attractiveness of LED fishing lights to orange mud crabs (Scylla olivacea) and found no significant differences in catch rates between males and females. Thus, it is evident that the factors influencing crab behavior by sex are not limited to bait; seasonal variation, at-sea trials, and indoor experiments also play a role.
This study highlights two key limitations to be addressed in future research on crab behavior in captivity. First, observing swimming crabs in various experimental tanks could provide valuable insights, as these crabs exhibit high cannibalism and are naturally drawn to traps, even in the presence of other organisms. While our experiment used a rectangular tank with a single crab per trial, future studies should explore different tank shapes, such as square or circular, to assess whether environmental conditions affect crab behavior. Additionally, larger and deeper tanks are needed to better replicate the crabs’ natural habitat, as small, shallow tanks may have influenced their responses to bait treatments. Testing behavior in more naturalistic enclosures is essential for accurate behavioral observations and the well-being of the crabs.

5. Conclusions

In summary, this study provides valuable insights into the feeding behavior of P. sanguinolentus and C. natator in response to different baits. The results show different spatial distribution patterns and swimming speeds between the two species, with P. sanguinolentus showing more exploratory behavior and C. natator being more stationary. The use of mackerel and squid bait significantly influenced the movement patterns of the crabs, especially during the first 10 min of exposure. This study found two types of natural baits that alter crab behavior. These observations have important implications for improving bait selection and gear effectiveness: the results of this study should help reduce bycatch and make catching target crabs more effective. Mackerel indicated more attraction for P. sanguinolentus, which might decrease the soaking time for targeting crabs in the future. Further research in this area could lead to more sustainable and efficient crab fishing practices that benefit both the fishing industry and the marine ecosystem.

Author Contributions

Conceptualization, K.-W.L. and W.-Y.L.; methodology, W.-Y.L.; software, Y.-L.W.; validation, Y.-L.W., T.-Y.L. and K.-W.L.; formal analysis, M.N.; investigation, W.-Y.L.; resources, W.-Y.L.; data curation, T.-Y.L.; writing—original draft preparation, W.-Y.L.; writing—review and editing, K.-W.L.; visualization, M.N.; supervision, K.-W.L.; project administration, K.-W.L.; funding acquisition, K.-W.L. All authors have read and agreed to the published version of the manuscript.

Funding

This research received financially supported by the Ministry of Agriculture (112J0237202-01), Penghu County Government (AF-113-14) and the National Science Council (MOST-112-2611-M-019-023 and MOST-112-2611-M-019-020).

Institutional Review Board Statement

This study was conducted in accordance with the guidelines of the Animal Research and Ethics Committees of National Taiwan Ocean University.

Informed Consent Statement

Not applicable.

Data Availability Statement

Data is contained within the article.

Acknowledgments

We gratefully acknowledge the financial support of the Ministry of Agriculture (112J0237202-01), the Penghu County Government (AF-113-14), and the National Science Council (MOST-112-2611-M-019-023 and MOST-112-2611-M-019-020). We would also like to thank Wei-Pin Hsu for his assistance with data analysis, and Wen-He Kao for his help in conducting the experiments.

Conflicts of Interest

The authors declare no conflicts of interest.

References

  1. Stephenson, W.; Rees, M. The endeavour and other Australian Museum collections of portunid crabs (Crustacea, Decapoda, Portunidae). Rec. Aust. Mus. 1968, 27, 285–298. [Google Scholar] [CrossRef]
  2. Spiridonov, V.A. Results of the Rumphius Biohistorical Expedition to Ambon (1990). Part 8. Swimming crabs of Ambon (Crustacea: Decapoda: Portunidae). Zool. Meded. 1999, 73, 63–97. [Google Scholar]
  3. Sumpton, W.D.; Smith, G.S.; Potter, M.A. Notes on the biology of the portunid crab, Portunus sanguinolentus (Herbst), in subtropical Queensland waters. Mar. Freshw. Res. 1989, 40, 711–717. [Google Scholar] [CrossRef]
  4. Ng, P.K.; Wang, C.H.; Ho, P.H.; Shih, H.T. An Annotated Checklist of Brachyuran Crabs from Taiwan (Crustacea: Decapoda); National Taiwan Museum: Taipei, Taiwan, 2001; pp. 1–86. [Google Scholar] [CrossRef]
  5. Hsueh, P.W.; Hung, H.T. Temporal and spatial reproductive patterns of subtidal brachyuran crabs in coastal waters of Taiwan. Crustaceana 2009, 82, 449–465. [Google Scholar] [CrossRef]
  6. Naimullah, M.; Lan, K.W.; Liao, C.H.; Hsiao, P.Y.; Liang, Y.R.; Chiu, T.C. Association of environmental factors in the Taiwan strait with distributions and habitat characteristics of three swimming crabs. Remote Sens. 2020, 12, 2231. [Google Scholar] [CrossRef]
  7. Naimullah, M.; Lee, W.Y.; Wu, Y.L.; Chen, Y.K.; Huang, Y.C.; Liao, C.H.; Lan, K.W. Effect of soaking time on targets and bycatch species catch rates in fish and crab trap fishery in the southern East China Sea. Fish. Res. 2022, 250, 106258. [Google Scholar] [CrossRef]
  8. Naimullah, M.; Wu, Y.L.; Lee, M.A.; Lan, K.W. Effect of the El Niño–Southern Oscillation (ENSO) cycle on the catches and habitat patterns of three swimming crabs in the Taiwan Strait. Front. Mar. Sci. 2021, 8, 763543. [Google Scholar] [CrossRef]
  9. Naimullah, M.; Lan, K.W.; Liao, C.H.; Yang, Y.J.; Chen, C.C.; Liew, H.J.; Ikhwanuddin, M. Effects of spatial–temporal conditions and fishing-vessel capacity on the capture of swimming crabs by using different fishing gear around the waters of Taiwan. Mar. Freshw. Res. 2023, 74, 1244–1261. [Google Scholar] [CrossRef]
  10. Huner, J.V.; Pfister, V.A.; Romaire, R.P.; Baum, T.J. Effectiveness of commercially formulated and fish baits in trapping cambarid crawfish 1. J. World Aquac. Soc. 1990, 21, 288–294. [Google Scholar] [CrossRef]
  11. Billock, W.L.; Dunbar, S.G. Shell and food acquisition behaviors: Evidence for contextual decision hierarchies in hermit crabs. J. Exp. Mar. Biol. Ecol. 2011, 398, 26–32. [Google Scholar] [CrossRef]
  12. Naimullah, M.; Lan, K.W.; Mammel, M.; Chen, L.C.; Wu, Y.L.; Hsiao, P.Y.; WaiHo, K. Effect of climate change on habitat suitability and recruitment dynamics of swimming crabs in the Taiwan Strait. Mar. Freshw. Res. 2024, 75, 1244–1261. [Google Scholar] [CrossRef]
  13. Council of Agriculture. Control Measures for Crab Fishing along Offshorefishing Vessels. 2022. Available online: https://law.moa.gov.tw/LawContent.aspx?id=GL000522 (accessed on 15 March 2024).
  14. Lee, W.Y.; Lan, K.W.; Chang, H.H.; Naimullah, M. Residency and swimming behavior of Acanthopagrus schlegelii, Trachinotus blochii, and Acanthopagrus latus in relation to artificial reef models in a captivity experiment. Appl. Anim. Behav. Sci. 2022, 257, 105778. [Google Scholar] [CrossRef]
  15. Lim, C.J.; Platt, B.; Janhunen, S.K.; Riedel, G. Comparison of automated video tracking systems in the open field test: ANY-Maze versus EthoVision XT. J. Neurosci. Methods 2023, 397, 109940. [Google Scholar] [CrossRef] [PubMed]
  16. Zuur, A.F.; Ieno, E.N.; Walker, N.; Saveliev, A.A.; Smith, G.M. GLMM and GAMM. In Mixed Effects Models and Extensions in Ecology with R; Springer: New York, NY, USA, 2009; pp. 323–341. [Google Scholar]
  17. Brooks, M.E.; Kristensen, K.; Van Benthem, K.J.; Magnusson, A.; Berg, C.W.; Nielsen, A.; Bolker, B.M. Glmm TMB balances speed and flexibility among packages for zero-inflated generalized linear mixed modeling. R J. 2017, 9, 378–400. [Google Scholar] [CrossRef]
  18. Magnusson, K.; Nilsson, A.; Andersson, G.; Hellner, C.; Carlbring, P. Level of agreement between problem gamblers’ and collaterals’ reports: A bayesian random-effects two-part model. J. Gambl. Stud. 2019, 35, 1127–1145. [Google Scholar] [CrossRef]
  19. Favaro, B.; Butt, M.A.; Bergshoeff, J.A. Comparison of catch per unit effort of invasive European green crab (Carcinus maenas) across four bait types. Fish. Res. 2020, 225, 105484. [Google Scholar] [CrossRef]
  20. McLay, C.L.; Osborne, T.A. Burrowing behaviour of the paddle crab Ovalipes catharus (White, 1843) (Brachyura: Portunidae). N. Z. J. Mar. Freshw. Res. 1985, 19, 125–130. [Google Scholar] [CrossRef]
  21. Bellwood, O. The occurrence, mechanics and significance of burying behaviour in crabs (Crustacea: Brachyura). J. Nat. Hist. 2002, 36, 1223–1238. [Google Scholar] [CrossRef]
  22. Su, X.; Liu, J.; Wang, F.; Zhang, D.; Zhu, B.; Liu, D. Effect of temperature on agonistic behavior and energy metabolism of the swimming crab (Portunus trituberculatus). Aquaculture 2020, 516, 734573. [Google Scholar] [CrossRef]
  23. Su, X.; Zhu, B.; Wang, F. Feeding strategy changes boldness and agonistic behaviour in the swimming crab (Portunus trituberculatus). Aquac. Res. 2022, 53, 419–430. [Google Scholar] [CrossRef]
  24. Zhu, B.; Zhang, H.; Liu, D.; Lu, Y.; Wang, F. Importance of substrate on welfare in swimming crab (Portunus trituberculatus) culture: A territorial behavior perspective. Aquac. Rep. 2022, 24, 101113. [Google Scholar] [CrossRef]
  25. Lee, H.H.; Hsu, C.C. Population biology of the swimming crab Portunus sanguinolentus in the waters off northern Taiwan. J. Crustac. Biol. 2003, 23, 691–699. [Google Scholar] [CrossRef]
  26. Yang, C.P.; Li, H.X.; Li, L.; Xu, J.; Yan, Y. Population structure, morphometric analysis and reproductive biology of Portunus sanguinolentus (Decapoda: Brachyura: Portunidae) in honghai bay, South China Sea. J. Crustac. Biol. 2014, 34, 722–730. [Google Scholar] [CrossRef]
  27. Lin, B.A.; Jiang, Y.; Liu, M. Population structure and reproductive dynamics of the ridged swimming crab Charybdis natator in the southern Taiwan Strait of China: Significant changes within 25 years. Front. Mar. Sci. 2023, 10, 1056640. [Google Scholar] [CrossRef]
  28. Ye, Q.T. Biological characteristic and resource status of Charybdis natator in Minnan-Taiwan shallow shoal fishing ground. Mar. Fish. 1999, 10, 107–111. [Google Scholar]
  29. Westerberg, H.; Westerberg, K. Properties of odour plumes from natural baits. Fish. Res. 2011, 110, 459–464. [Google Scholar] [CrossRef]
  30. Vabø, R.; Huse, G.; Fernö, A.; Jørgensen, T.; Løkkeborg, S.; Skaret, G. Simulating search behaviour of fish towards bait. ICES J. Mar. Sci. 2004, 61, 1224–1232. [Google Scholar] [CrossRef]
  31. Collins, M.A.; Yau, C.; Guilfoyle, F.; Bagley, P.; Everson, I.; Priede, I.G.; Agnew, D. Assessment of stone crab (Lithodidae) density on the South Georgia slope using baited video cameras. ICES J. Mar. Sci. 2002, 59, 370–379. [Google Scholar] [CrossRef]
  32. Lees, K.J.; Mill, A.C.; Skerritt, D.J.; Robertson, P.A.; Fitzsimmons, C. Movement patterns of a commercially important, free-ranging marine invertebrate in the vicinity of a bait source. Anim. Biotelemetry 2018, 6, 8. [Google Scholar] [CrossRef]
  33. Stiansen, S.; Fernö, A.; Furevik, D.; Jørgensen, T.; Løkkeborg, S. Horizontal and vertical odor plume trapping of red king crabs explains the different efficiency of top-and side-entrance pot designs. Trans. Am. Fish. Soc. 2010, 139, 483–490. [Google Scholar] [CrossRef]
  34. Stevens, B.G. The ups and downs of traps: Environmental impacts, entanglement, mitigation, and the future of trap fishing for crustaceans and fish. ICES J. Mar. Sci. 2021, 78, 584–596. [Google Scholar] [CrossRef]
  35. Krouse, J.S. 14 Performance and selectivity of trap fisheries for crustaceans. In Marine Invertebrate Fisheries: Their Assessment and Management; Wiley: Hoboken, NJ, USA, 1989; p. 307. [Google Scholar]
  36. Stoner, A.W. Effects of environmental variables on fish feeding ecology: Implications for the performance of baited fishing gear and stock assessment. J. Fish Biol. 2004, 65, 1445–1471. [Google Scholar] [CrossRef]
  37. Hewitt, D.E.; Taylor, M.D.; Suthers, I.M.; Johnson, D.D. Environmental drivers of variation in southeast Australian Giant Mud Crab (Scylla serrata) harvest rates. Fish. Res. 2023, 268, 106850. [Google Scholar] [CrossRef]
  38. Leitao, F.; Monteiro, J.N.; Cabral, P.; Teodósio, M.A.; Roa-Ureta, R.H. Revealing the role of crab as bait in octopus fishery: An ecological and fishing approach to support management decisions. Mar. Policy 2023, 158, 105878. [Google Scholar] [CrossRef]
  39. Young, A.M.; Elliott, J.A.; Incatasciato, J.M.; Taylor, M.L. Seasonal catch, size, color, and assessment of trapping variables for the European green crab Carcinus maenas (Brachyura: Portunoidea: Carcinidae), a nonindigenous species in Massachusetts, USA. J. Crustac. Biol. 2017, 37, 556–570. [Google Scholar] [CrossRef]
  40. Robertson, W.D. Factors affecting catches of the crab Scylla serrata (Forskål) (Decapoda: Portunidae) in baited traps: Soak time, time of day and accessibility of the bait. Estuar. Coast. Shelf Sci. 1989, 29, 161–170. [Google Scholar] [CrossRef]
  41. Zainal, K.A. Natural food and feeding of the commercial blue swimmer crab, Portunus pelagicus (Linnaeus, 1758) along the coastal waters of the Kingdom of Bahrain. J. Assoc. Arab Univ. Basic Appl. Sci. 2013, 13, 1–7. [Google Scholar] [CrossRef]
  42. Rasheed, S.; Mustaquim, J. Natural diet of two commercial crab species, Portunus segnis (Forskål, 1775) and P. sanguinolentus (Herbst, 1783), in the Coastal Waters of Karachi. Anim. Vet. Sci. 2018, 6, 35–42. [Google Scholar] [CrossRef]
  43. Westneat, M.W.; Wainwright, S.A. 7. Mechanical design for swimming: Muscle, tendon, and bone. Fish Physiol. 2001, 19, 271–311. [Google Scholar]
  44. Kier, W.M. Squid cross-striated muscle: The evolution of a specialized muscle fiber type. Bull. Mar. Sci. 1991, 49, 389–403. [Google Scholar]
  45. Bone, Q.; Pulsford, A.; Chubb, A.D. Squid mantle muscle. J. Mar. Biol. Assoc. United Kingd. 1981, 61, 327–342. [Google Scholar] [CrossRef]
  46. Mommsen, T.P.; Ballantyne, J.; MacDonald, D.; Gosline, J.; Hochachka, P.W. Analogues of red and white muscle in squid mantle. Proc. Natl. Acad. Sci. USA 1981, 78, 3274–3278. [Google Scholar] [CrossRef] [PubMed]
  47. Baird, H.P.; Patullo, B.W.; Macmillan, D.L. Reducing aggression between freshwater crayfish (Cherax destructor Clark: Decapoda, Parastacidae) by increasing habitat complexity. Aquac. Res. 2006, 37, 1419–1428. [Google Scholar] [CrossRef]
  48. Marshall, S.; Warburton, K.; Paterson, B.; Mann, D. Cannibalism in juvenile blue-swimmer crabs Portunus pelagicus (Linnaeus, 1766): Effects of body size, moult stage and refuge availability. Appl. Anim. Behav. Sci. 2005, 90, 65–82. [Google Scholar] [CrossRef]
  49. Mirera, O.D.; Moksnes, P.O. Cannibalistic interactions of juvenile mud crabs Scylla serrata: The effect of shelter and crab size. Afr. J. Mar. Sci. 2013, 35, 545–553. [Google Scholar] [CrossRef]
  50. Zhang, H.; Zhu, B.; Lu, Y.; Yu, L.; Wang, F.; Liu, D. An evaluation of the preferences of the juvenile swimming crab, Portunus trituberculatus, for different structural properties of shelters. Aquaculture 2022, 557, 738316. [Google Scholar] [CrossRef]
  51. Naimullah, M.; Lan, K.W.; Ikhwanuddin, M.; Amin-Safwan, A.; Lee, W.Y. Unbaited light-emitting diode traps performance for catching orange mud crabs. J. Mar. Sci. Technol. 2022, 30, 5. [Google Scholar] [CrossRef]
Figure 1. (A) The experimental tank was divided into three areas: (a) separator, (b) crab specimen, (c) water pump, (d) experimental tank, (e) water level, (f) bait, and (g) water outlet. (B) The three areas in the experimental tank are S1: starting area, S2: middle area, and S3: bait area.
Fishes 09 00400 g001
Figure 2. Cumulative frequency of Portunus sanguinolentus using three bait treatment types ((A) control, (B) mackerel, and (C) squid) in the three different areas (S1: starting area, S2: middle area, and S3: bait area).
Fishes 09 00400 g002
Figure 3. Cumulative frequency of Charybdis natator using three bait treatment types ((A) control, (B) mackerel, and (C) squid) in the three different areas (S1: starting area, S2: middle area, and S3: bait area).
Fishes 09 00400 g003
Figure 4. Visualization of GLMM-derived estimates of (A) Portunus sanguinolentus spatial distribution (versus treatment type and area type) and (B) Charybdis natator spatial distribution. The solid vertical bar represents the control S1.
Fishes 09 00400 g004
Figure 5. The average of the box plots for spatial distributions of Portunus sanguinolentus was tested in three different areas: S1: starting area, S2: middle area, and S3: bait area. Significant differences are indicated between S1 and both S2 and S3 with S1 having a higher value, as denoted by different letters (a, b).
Fishes 09 00400 g005
Figure 6. The average of the box plots for spatial distributions of Charybdis natator was tested in three different areas: S1: starting area, S2: middle area, and S3: bait area. Significant differences are indicated between S1 and both S2 and S3 with S1 having a higher value, as denoted by different letters (a, b).
Fishes 09 00400 g006
Figure 7. Box plots show the average swimming speed of Portunus sanguinolentus in various time phases (in minutes) using (A) control, (B) mackerel, and (C) squid treatments.
Fishes 09 00400 g007
Figure 8. Box plots show the average swimming speed of Charybdis natator in various time phases (in minutes) using (A) control, (B) mackerel, and (C) squid treatments.
Fishes 09 00400 g008
Figure 9. Visualization of GLMM-derived estimates of (A) Portunus sanguinolentus spatial swimming speed (versus treatment type and time phase) and (B) Charybdis natator spatial swimming speed. The comparisons were conducted relative to the crab’s behavior in the treatment involving no bait (i.e., control bait treatment; vertical solid black bar) in the starting area (S1) within the <10 min time phase. The solid vertical bar indicates no statistically significant effect of the relevant covariate on the response variable.
Fishes 09 00400 g009
Table 1. GLMM results for the spatial distribution of Portunus sanguinolentus and Charybdis natator in various bait treatments and the duration time in each area relative to control treatment (control bait treatment: no bait used and in the S1 area). ꭓ2 is defined as a chi-square test.
(a) Portunus sanguinolentus(b) Charybdis natator
ParameterEstimatez-ValuepEstimatez-Valuep
(Intercept)1223.1118.19<0.051755.1240.97<0.05
ControlS2−956.65−10.06<0.05−1727.92−28.52<0.05
ControlS3−912.69−9.59<0.05−1737.45−28.68<0.05
MackerelS1−66.19−0.69>0.05−241.24−3.98<0.05
MackerelS2−910.12−9.57<0.05−1602.29−26.45<0.05
MackerelS3−893.03−9.39<0.05−1621.84−26.77<0.05
SquidS1−68.49−0.72>0.050.340.01>0.05
SquidS2−858.58−9.03<0.051712.64−28.27<0.05
SquidS3−942.27−9.91<0.051753.09−28.93<0.05
Table 2. Summary table of space staying time ratios. Average moving speed (cm/s), and movement times for different sexes of Portunus sanguinolentus and Charybdis natator under control, mackerel, and squid conditions.
Portunus sanguinolentus
ControlMackerelSquid
MaleFemaleMaleFemaleMaleFemale
S1 starting area65%71%64%64%67%61%
S2 middle area17%12%19%16%21%20%
S3 bait area17%17%17%20%12%19%
S1–S3 area
Average moving speed in seconds (cm/s)
0.240.260.430.620.801.33
S1–S3 area average moving time (s)458.89423.10260.39180.52139.6984.11
Charybdis natator
ControlMackerelSquid
MaleFemaleMaleFemaleMaleFemale
AS1 starting area100%100%82%86%97%98%
S2 middle area0%0%10%7%3%2%
S3 bait area0%0%8%6%0%0%
S1–S3 area
Average moving speed in seconds (cm/s)
--0.430.38--
S1–S3 area average moving time (s)--257.51291.56--
Disclaimer/Publisher’s Note: The statements, opinions and data contained in all publications are solely those of the individual author(s) and contributor(s) and not of MDPI and/or the editor(s). MDPI and/or the editor(s) disclaim responsibility for any injury to people or property resulting from any ideas, methods, instructions or products referred to in the content.

