Article

Population Genetics and Gene Flow in Cyphotilapia frontosa and Cyphotilapia gibberosa Along the East Coast of Lake Tanganyika

by
George D. Jackson
1,*,
Timothy Standish
2,
Ortaç Çetintaş
3,
Oleksandr Zinenko
4,
Asilatu H. Shechonge
5 and
Alexey Yanchukov
3
1
School of Medicine, Department of Earth and Biological Sciences, Loma Linda University, Loma Linda, CA 92350, USA
2
Geoscience Research Institute, Loma Linda, CA 92350, USA
3
Faculty of Science, Department of Biology, Zonguldak Bülent Ecevit University, Incivez, Zonguldak 67100, Türkiye
4
School of Biology, Department of Zoology and Animal Ecology, Museum of Nature, V. N. Karazin Kharkiv National University, Svobody sq. 4, 61022 Kharkiv, Ukraine
5
Tanzania Fisheries Research Institute (TAFIRI), Dar Es Salaam P.O. Box 78850, Tanzania
*
Author to whom correspondence should be addressed.
Fishes 2024, 9(12), 481; https://doi.org/10.3390/fishes9120481
Submission received: 3 October 2024 / Revised: 19 November 2024 / Accepted: 22 November 2024 / Published: 26 November 2024

Abstract

:
The radiation of cichlid species in the East African Great Lakes is remarkable and rapid. The population genetics of two deep-water Cyphotilapia species along the east coast of Lake Tanganyika from Burundi to southern Tanzania was determined using ddRAD-seq. A combination of ADMIXTURE, PCA, genome polarization, and 2D site frequency spectrum analyses confirmed the presence of two species, C. frontosa in the north and C. gibberosa in the south, as documented in other studies. We also found evidence of a potential hybrid zone connecting the two species at a sharp genetic cline centered in the middle of the lake and apparent introgression in both directions, but predominantly from ‘gibberosa’ into ‘frontosa’. The highest proportion of introgressed ‘gibberosa’ ancestry was present in the southernmost populations of C. frontosa collected near Karilani Island and Cape Kabogo. At the intra-specific level, there was support for between 1 and 3 populations of C. frontosa, whereas the results indicated only a single homogeneous population of C. gibberosa. The presence of different morphs in the lake despite the low levels of heterozygosity suggests that a small number of loci may be involved in the morphological variation and/or that there is a more complex interplay between genetics and the environment in different locations.
Key Contribution: This study focused on the genetics of Cyphotilapia based on nine samples along the east coast of Lake Tanganyika. The study confirmed the presence of two species, with Cyphotilapia frontosa in the north of the lake and C. gibberosa in the south of the lake. There was evidence of potentially three populations present for C. frontosa but no evidence was found of separate populations in C. gibberosa. In the central region of the lake, we found evidence of introgression between the two species with a greater degree of gene flow from C. gibberosa to C. frontosa.

Graphical Abstract

1. Introduction

1.1. The East African Great Lakes

Lake Tanganyika, the second largest lake in the world by volume after Lake Baikal, is a rift lake and the deepest of the East African Great Lakes, which also include Lakes Victoria and Malawi. A unique feature of the East African Great Lakes is the diversity of endemic cichlid fish species that have radiated in each one, with virtually all of these species found only in one specific lake [1]. The cichlid radiation in these lakes has produced a spectacular number of species in very little time [1,2,3,4,5]. Rather than point mutation rate alone, which is considerably lower in cichlids than in humans, mechanisms such as gene duplication, accumulation of transposable elements, and recombination have all been suggested as factors contributing to genetic variability [4]. Furthermore, hybridization has contributed to these radiations, with interspecific introgression signatures found in all three lakes [4], and has been shown to be important in speciation in lamprologine ciclids in Lake Tanganyika [6]. Hybridization and subsequent introgression appear to be an important mechanism in contributing to cichlid diversification in African lakes [7]. The cichlid adaptive radiation in Lake Victoria has recently been shown to have arisen through cycles of hybridization, leading to the fusion of lineages into hybrid swarms [8] followed by diversification (lineage fission) [5].
Past lake fluctuations have been one mechanism that has contributed to speciation, which has led to many different populations living in such a restricted area. The diversity in morphs such as in Tropheus [3] has been linked to migration events resulting from large lake fluctuations in the past, which resulted in population fragmentation. A subsequent rise in the lake level resulted in secondary contact between adjacent populations [3,9,10,11]. This in turn led to the development of new hybrid morphs through introgression. Alternatively, over shorter distances and within the same environment, other rock-dwelling herbivores of the genus Petrochromis have developed genetically distinct populations and color morphs in sympatry probably due to mechanisms leading to reproductive isolation [12].

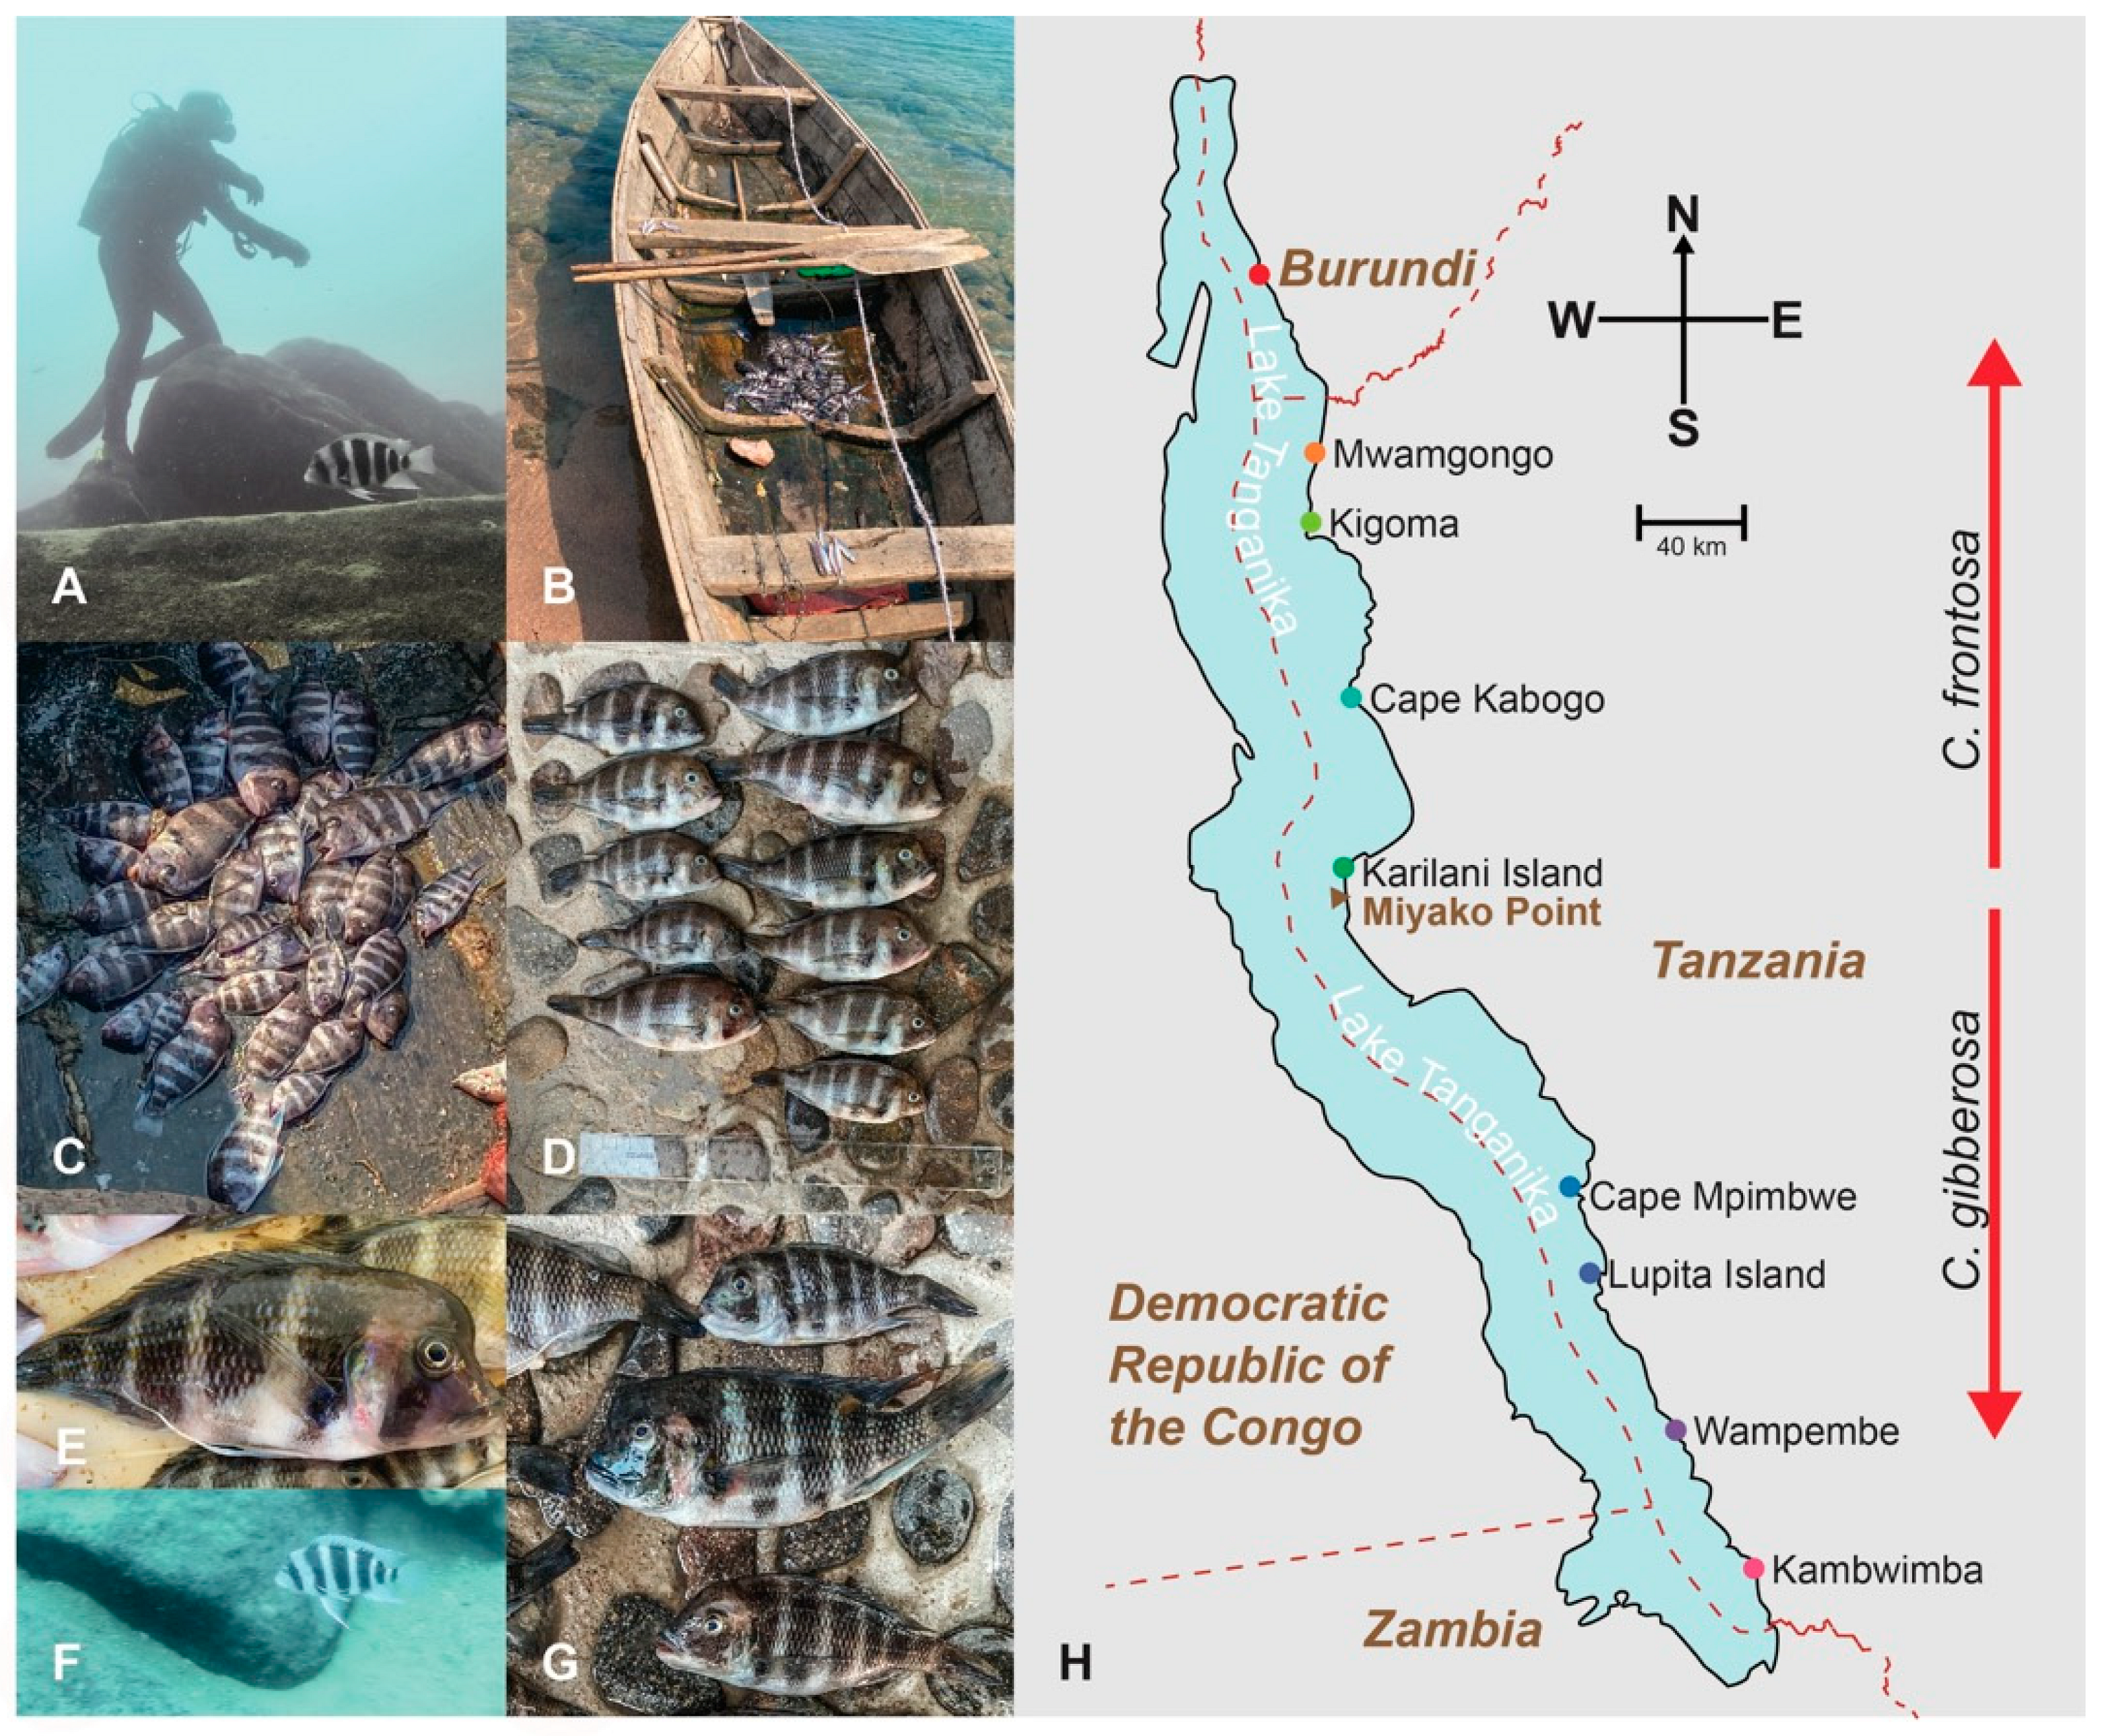
1.2. The Genus Cyphotilapia

Cyphotilapia is a large iconic species found throughout Lake Tanganyika. Unlike Tropheus, it is a deep-water species which can live to a depth of 60 m [13]. This species also has a number of distinct color morphs, suggesting the possibility of past population separation. These color morphs are, as in Tropheus, known by their local names. On the Congo coast, there are the bluest varieties, Moba and Kitumba; in the north of the lake, there are predominantly black and white morphs, Burundi and Kigoma; in the mid Tanzanian coast, there are lighter blue morphs, Mpimbwe and Kipili; and in the south of the lake, there is the pale blue Samazi morph. These many morphs of Cyphotilapia are popular aquarium fish, being exported around the world and also bred in captivity. There are at least 12 distinct morphs of Cyphotilapia [13], providing a suitable model for exploring gene flow and speciation.
The majority of Cyphotilapia morphs throughout the lake have six vertical bars against a white background except for the Kigoma region where there is a 7-bar morph. An examination of the northern 6-bar and 7-bar Cyphotilapia morphs concluded that they were conspecific based on overlap in morphological features [14]. There is a Cyphotilapia population off Mwamgongo, Tanzania, 30 km north of Kigoma. The Mwamgongo population has been reported to be intermediate between the Kigoma 7-bar and the Burundi 6-bar morphs, with individuals possessing seven bars on one side and six bars on the other, along with other individuals that have seven bars on both sides. Only the 6-bar morph is found 14 km north of Mwamgongo near the Burundi border [13,15]. This situation provided a natural experiment to explore gene flow between two distinct populations north and south with an intermediate (potentially hybrid) population in the middle.
The large variety of Cyphotilapia morphs contributed to past uncertainty surrounding the number of species in Lake Tanganyika. The genus was originally thought to be monotypic, represented by the single species Cyphotilapia frontosa [16]. However, a second species (Cyphotilapia gibberosa) [17] was described based on morphological features, with C. gibberosa restricted to the southern end of the lake while C. frontosa is found in the lake’s northern region [17]. Nevertheless, the presence a second species has been disputed based on the considerable overlap in the morphological features, which was thought to be representative of only a single species [13,15]. A more recent genomic study of ~200 cichlid species from Lake Tanganyika including Cyphotilapia specimens from the northern (i.e., C. frontosa, n = 10) as well as the southern (i.e., C. gibberosa, n = 12) regions of the lake revealed that the level of divergence between the two Cyphotilapia species is comparable to other closely related cichlid species within the same genus [18].
The following are this study’s aims: (1) to explore how genetic data can be used to determine whether or not the unique Cyphotilapia color morphs in the lake are indeed distinct populations; (2) if so, how evidence of gene flow between them can be detected; and (3) how a more detailed genetic analysis can clarify the presence of one or more Cyphotilapia species in the lake. To address these questions, we employed a reduced representation sequencing approach, double digest Restriction-site AssociateD sequencing (ddRAD-seq), which allows for the resolution of individual genotypes at tens of thousands of genetic markers scattered throughout the genome. This technique is well suited to reveal the population genetic structure in large samples.

2. Materials and Methods

Cyphotilapia were collected from nine locations along the east coastline of Lake Tanganyika, from Burundi in the North to Kambwimba near the Zambian border in the South. Ten specimens were collected at each site (Figure 1). Collections were made in September 2021 in Burundi, and September, October, and November 2022 in Tanzania.
On all three collection trips, whole fish were kept frozen in Africa and transported back to the USA laboratory in an insulated cooler. The first trip was to Burundi in September 2021; the second trip, in September 2022, included collections from Mwamgongo, Kigoma, Cape Mpimbwe, and Lupita Island. Fish from these first two trips arrived back in the US still frozen. Fish from the third trip were collected in October and November from Karilani Island, Cape Kabogo, Wampembe, and Kambwimba, and were transported back to the USA in December 2022. Unfortunately, there was a 6-day airline delay in obtaining the fish from trip three, which resulted in the defrosting of the fish, although they were still cool. These fish were immediately refrozen upon unpacking.
Samples for DNA extraction were taken from muscle tissue in the dorsal lateral region below the dorsal fin. For best results, tissue samples were taken from the fish while they were still frozen. All tissue was kept frozen until DNA extraction. As expected, the initial DNA extraction from fish collected on the third trip that had thawed before being refrozen revealed considerable DNA degradation. Several regions other than dorsal muscle from these fish were explored for less degraded DNA, and lower yields of higher-quality DNA were obtained from posterior vertebrae samples near the tail.

2.1. DNA Extraction, Preparation, and Sequencing of Genomic Libraries

Genomic DNA from each of the 10 individuals captured in each sampling location was isolated using the QIAGEN DNeasy® Blood & Tissue kit (cat. nos. 69504 and 69506), Germantown, MD, USA. Bone and muscle tissue were each disrupted using a Biospec Products BioVortexer (item code 1017MC) with disposable spiral pestles after the addition of Buffer ATL and proteinase K in step 1a of the “Quick-Start Protocol” supplied by QIAGEN. After disruption, muscle was incubated for 1 h, bone for 90 min, and fins for 2 h, all at 56 °C, and the rest of the protocol was followed without modification.
DNA was quantified using a Thermo Scientific™ Invitrogen™ Nanodrop™ One Spectrophotometer, Waltham, MA, USA. Values ranged from a high of 284.5 ng/μL from a live specimen fin clip (from an aquarium specimen that was tested) down to 11.8 ng/μL for individual samples from Karilani Island and Wampembe, both isolated from tail bone.
The ddRAD-seq libraries were prepared following a protocol described in [19], which included (i) digestion of the genomic DNA with Pstl and MseI restriction enzymes; (ii) the ligation of indexed adapters to the digested fragments; (iii) the amplification of double-indexed libraries, and (iv) purification to remove the leftover adapters and short DNA fragments. The individual libraries were pooled in equimolar concentrations for size-selection in a 350–550 bp window on a Pippin Prep instrument (Sage Science, Beverly, MA, USA). The final pool was outsourced to a commercial provider Macrogen-Europe (Amsterdam, The Netherlands) for sequencing on a single flowcell of an Illumina HiSeq X platform with 2 × 150 paired-end reads. The raw fastq files were deposited in the NCBI SRA database (BioProject ID PRJNA1076153, BioSample accessions SAMN39933234-39933323).
The sequence data were demultiplexed using process radtags and suspected PCR duplicates were removed using clone filter commands in STACKs 2.62 [20]. The reads were then aligned to the scaffold-level reference genome assembly of Cyphotilapia frontosa (NCBI acc.no. GCA_015110975) using Bowtie2 [21], with the conservative global alignment option (end-to-end). The reads with QC < 30 were discarded using SAMtools [22]. The ref_map.pl program in STACKs was used to build a catalog of RAD loci and assemble the SNP datasets. To control for the amount of missing data in the downstream analyses, we applied the following selection criteria (in populations program in STACKs) to produce two sets of SNPs: Set 1—a RAD locus had to be genotyped in >25% of individuals in any single collection site (Figure 1), and all SNPs in a locus were included (-p 1 -r 0.25); Set 2—a RAD locus had to be genotyped across all nine collection sites, with a >70% genotyping rate in each, and a single SNP was selected at random from each locus (-p 9 -r 0.7 –write-random-snp). Set 2 was further subjected to LD pruning in Plink 2.0 [23], using the option –indep-pairwise 50 5 0.5, and a 5% minor allele frequency (MAF) threshold was applied to remove non-informative SNPs from this dataset.

2.2. Population Genetics Analysis

SNP Set 1 was only analyzed using RADpainter and fineRADstructure software version 0.3.2 [24] to produce the matrix of individual pairwise co-ancestries. The pruned Set 2 was used to construct the PCA, as well as for genetic clustering analyses in ADMIXTURE version 1.3.0 [25] to infer the most likely ancestral proportions of each individual, under a scenario where a number (K) of initial ‘pure’ populations admixed to produce the observed genotypes. Both algorithms were run in unsupervised mode for K from one to six, and the cross-validation error (CV) was calculated for each value of K starting with K = 2. The clustering methods cannot identify which SNP allele was presumably inherited from the respective ancestral clusters, nor can they explain which fraction of all genotyped SNPs contributed to the model. We therefore used a more direct approach of diagnostic index expectation maximization implemented in R package version 4.3.3 diemr, which assigns each (biallelic) SNP variant to one of two hybridizing populations separated by a semi-permeable genetic barrier [26]. The results of diemr analysis include the individual hybrid index (h), which can be interpreted as the ancestry proportion, as well as the per-SNP diagnostic index (DI) that reflects the contribution of each SNP to the perceived genetic barrier. The DI reaches the maximum possible value when the populations on either side of the barrier do not share any allele at a given SNP, while an SNP with the heterozygote genotype in all individuals in the dataset has the minimum DI. Another advantage of diemr over clustering methods is that it provides a better way to validate the scenario of two admixing populations (K = 2) vs. the single gene pool (K = 1) [26].
To demonstrate the differences in the introgression pattern of individual SNPs, we used the function plotPolarized() in diemr, and also inferred the per-SNP cline shape parameters c and v as implemented in the R package bgchm [27]. In order to reduce the computation time, bgchm was applied to a small subset of 330 out of 3624 randomly chosen SNPs in the top 30% with the highest d values. The R package snpR [28] was used to calculate the population/species genetic diversity statistics (number of private alleles, allelic richness, Tajima’s D, and the average pairwise nucleotide divergence), the pairwise Fst [29] between populations, and the 2D site frequency spectrum for the entire dataset. The Wright’s inbreeding coefficient (Fis) was calculated in PLINK 2.0 [23].

3. Results

After sequencing and demultiplexing, we obtained an average of 7.335 M paired-end reads per individual. One individual (Kb5-2 from Cape Kabogo) yielded only 413,310 reads and was excluded from further analyses. After the removal of putative PCR duplicates and alignment of each of the reads to the reference genome of Cyphotilapia frontosa (GCA_015110975) [18], between 1.247 and 9.196 M reads were successfully mapped per individual. Finally, <1% of aligned reads were removed from each individual since they were below the QC = 30 quality threshold. After the assembly of the ddRAD-loci and further downstream filtering (see Section 2), we obtained 786,617 SNPs in Set 1 and 80,449 SNPs in Set 2.

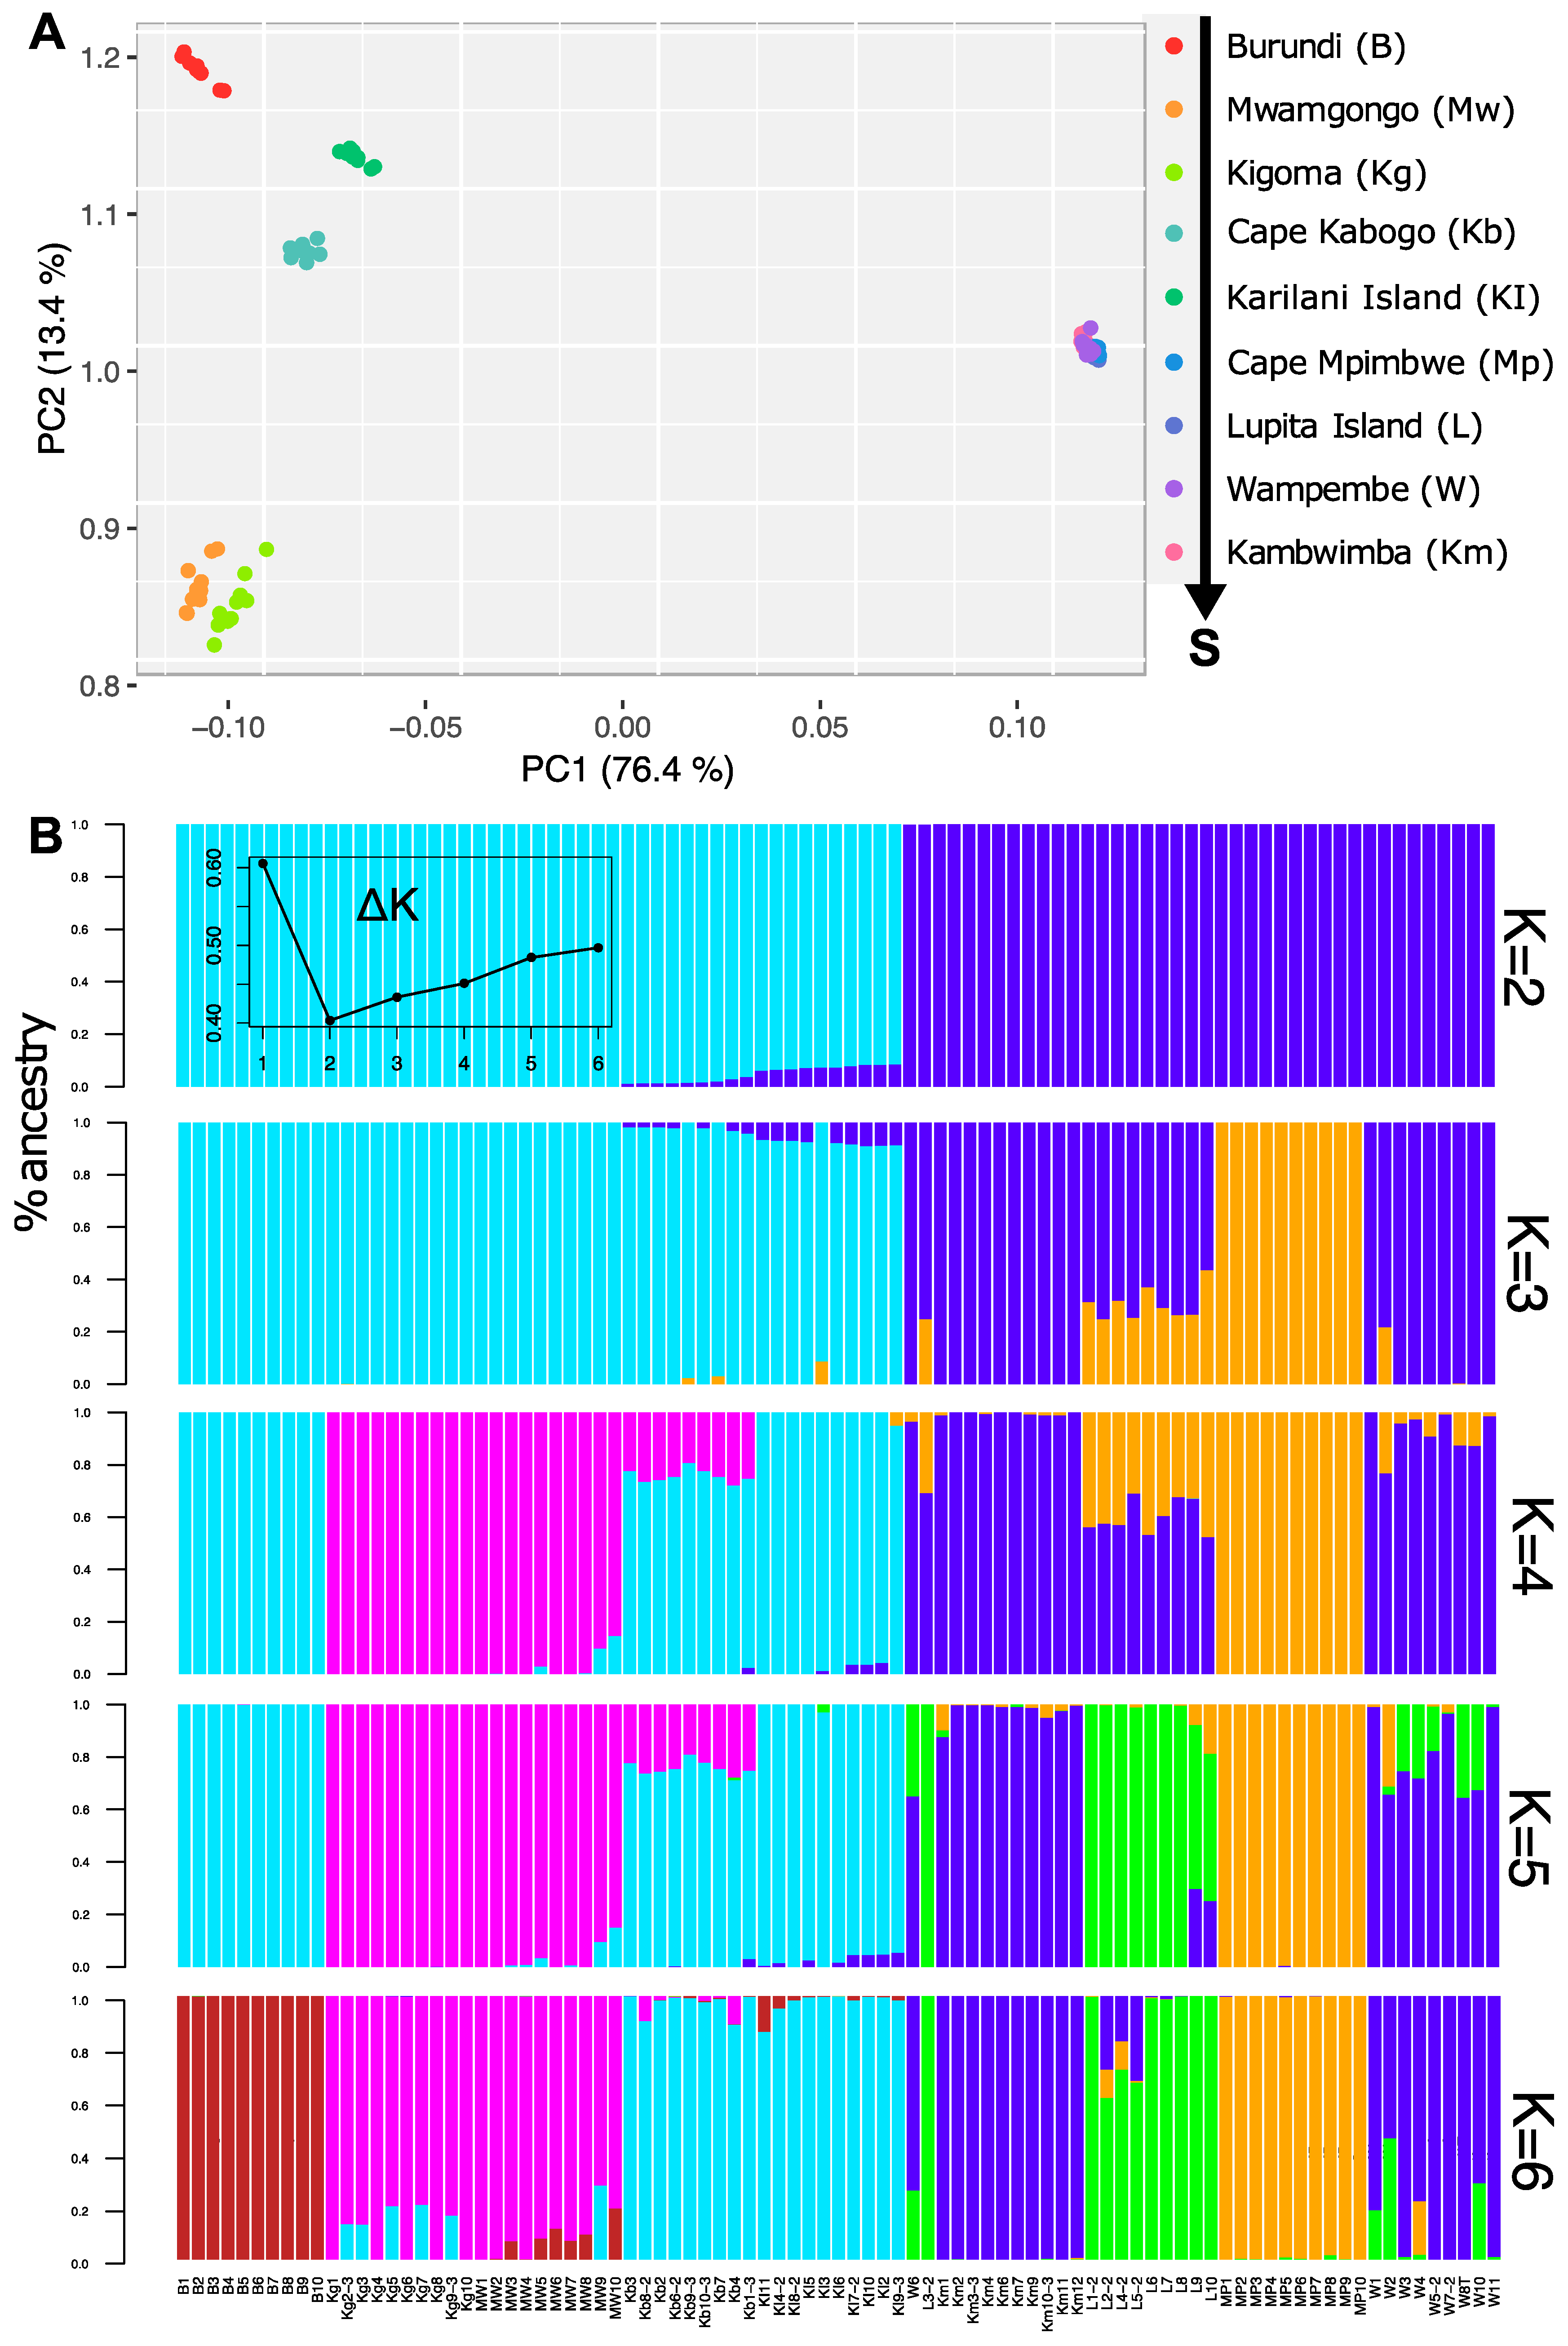
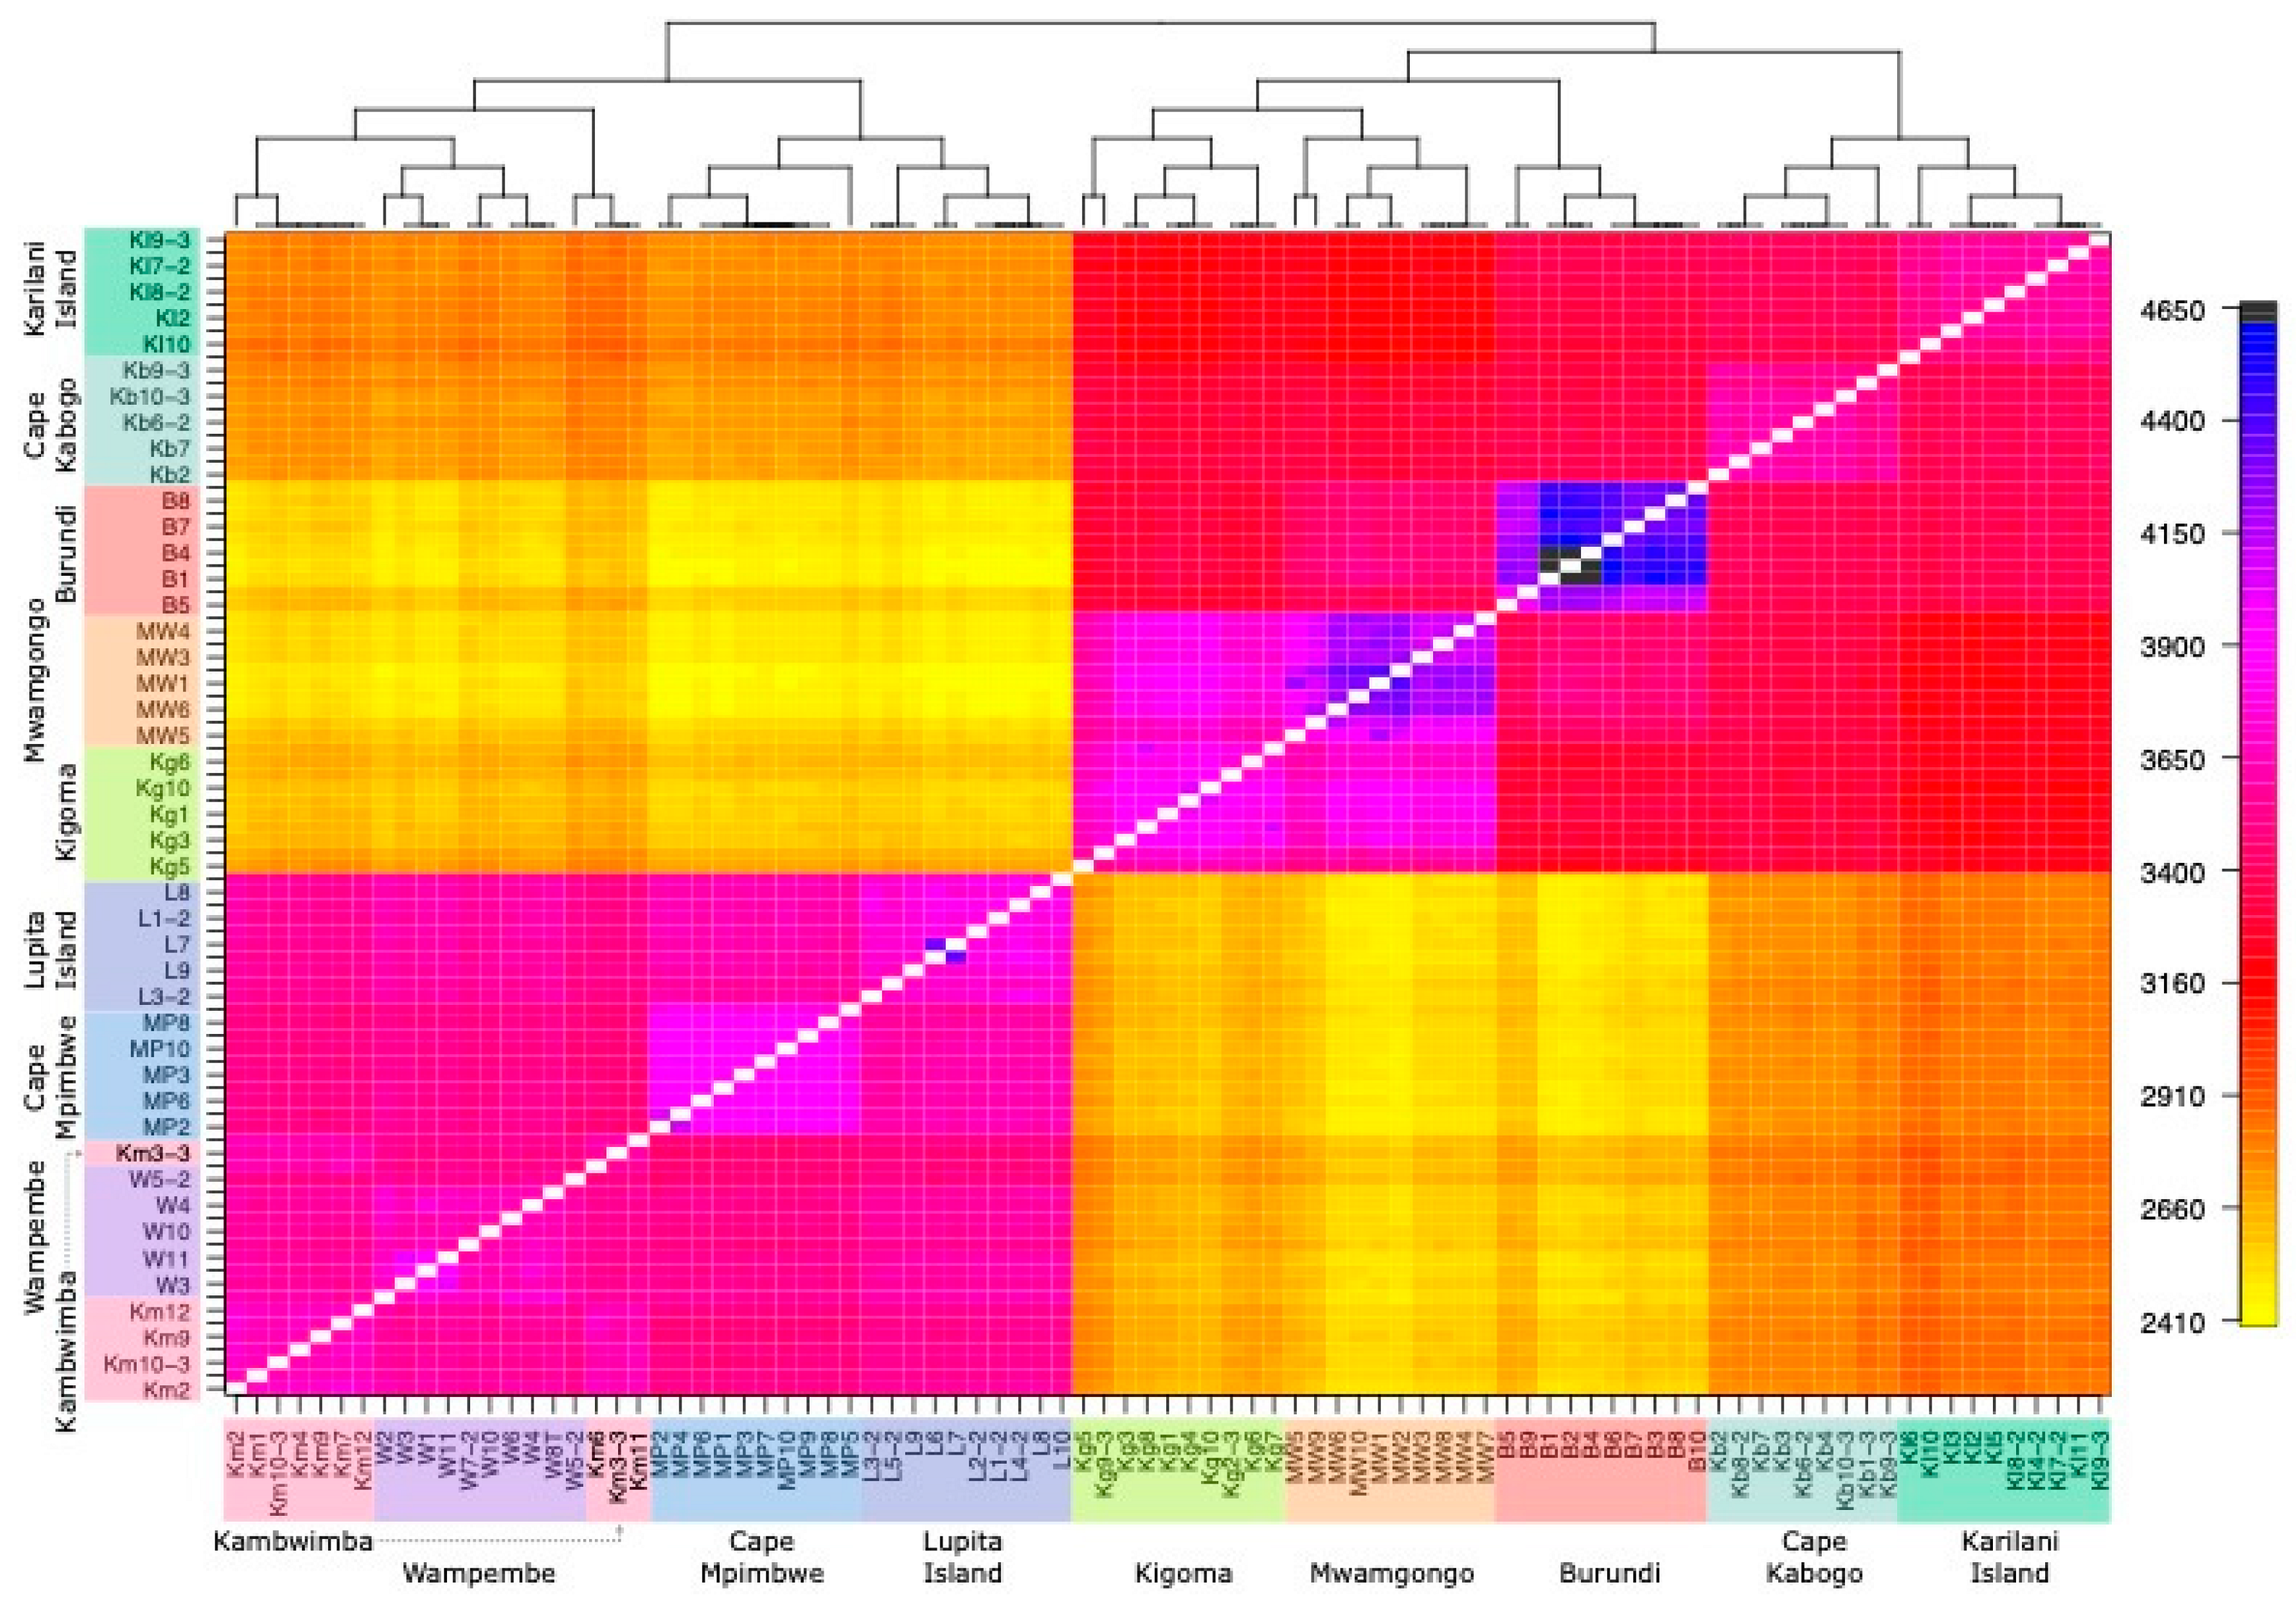
3.1. Genetic Clustering and Visualization Analyses

The PCA revealed a clear division between the northern and southern regions of Lake Tanganyika along PC1, which captured 76.4% of the total genetic variation at the level of individuals (Figure 2). The southern part of the lake, i.e., Kambwimba, Lupita Island, Cape Mpimbwe, and Wampembe, formed a single tight cluster (hereafter referred to as “gibberosa”) with negligible differences among individuals. The remaining populations (hereafter referred to as “frontosa”) were further separated along PC2 (13.4% of the total variation) and were grouped into the following three sub-clusters: (1) Mwamgongo and Kigoma, (2) Cape Kabogo and Karilani Island, and (3) Burundi (in the extreme north of the lake). Among these, Cape Kabogo and Karilani Island occupied the most central position on the first PC axis, although the distance between them and the “gibberosa” group to the south was still at least five times greater than within “frontosa” (Figure 2A).
Using hierarchical analysis in ADMIXTURE, we calculated the most likely individual ancestry proportions for K ranging from 1 to 6. When all individuals were included, the model with two ancestral populations (K = 2) clearly had the best statistical support (Figure 2B). The two main clusters corresponded to the north–south (frontosagibberosa) division observed previously on the PCA (Figure 2A). However, the model suggested that a small proportion of the “gibberosa” ancestry was present in all individuals from Cape Kabogo and Karilani island. Running ADMIXTURE recursively for the higher values of K (Figure 2B) consistently separated frontosa and gibberosa and revealed further population subdivision with both species. For the K ranging from two to five, a small ancestry proportion derived from “gibberosa” clusters in Cape Kabogo and Karilani Island could be observed; however, at K = 6, the fine-scale clustering of individuals into their own populations was more prevalent and no admixture between the two species could be detected. At K = 6, every geographic population was clearly recognizable on the plot, but (i) Cape Kabogo and Karilani Island and (ii) Mwamgongo and Kigoma still shared higher similarities compared to other populations.
The standard population-level summary statistics revealed a complex pattern of genetic variation. All populations except Mwamgongo showed high levels of deviation from the Hardy–Weinberg genotype proportions towards the deficit of heterozygotes (positive Fis values in Table 1). Tajima’s D approached zero in Cape Kabogo, Mawamgongo, and Wampembe (Table 1), indicating stable demographic history, but the rest of the locations showed high positive values of D, suggesting a possible recent population contraction, with the maximum in Karilani Island. Interestingly, the same population also had the highest Fis Finally, while the levels of allelic richness and nucleotide divergence (pi) were mostly similar across locations, we note that the populations in the central part of Lake Tanganyika (i.e., Kigoma, Cape Kabogo, and Karilani Island) had lower numbers of private alleles (corrected for the sample size), compared to the populations from more distal parts of the lake.
The pattern of the pairwise genetic distance between populations (Fst) reflected our previous findings of strong differentiation between the two Cyphotilapia species (average Fst between species = 0.378, SD = 0.004), while comparing populations within the “frontosa” and “gibberosa” clusters resulted in much lower Fst values (average Fst among frontosa population = 0.103, SD = 0.0031; Fst among gibberosa = 0.045; SD = 0.0004; Table 2). This indicates a higher degree of population structuring in frontosa, compared to the overall lower level of differentiation in gibberosa.
We then constructed the genetic co-ancestry matrix (after [24] in RADpainter/fineRADstructure, using the larger SNP Set 1 (Figure 3). Here, the two species clusters indicating genetic similarity were also clearly visible with the gibberosa cluster in the bottom left and the frontosa cluster in top right. However, additional clusters are apparent for frontosa individuals from Cape Kabogo and Karilani Island as indicated by the darker orange in the top rows of the heatmap cells for these locations. This suggests shared ancestry with individuals at these locations being closer to gibberosa than the other frontosa populations, indicating likely gene flow from gibberosa to frontosa.

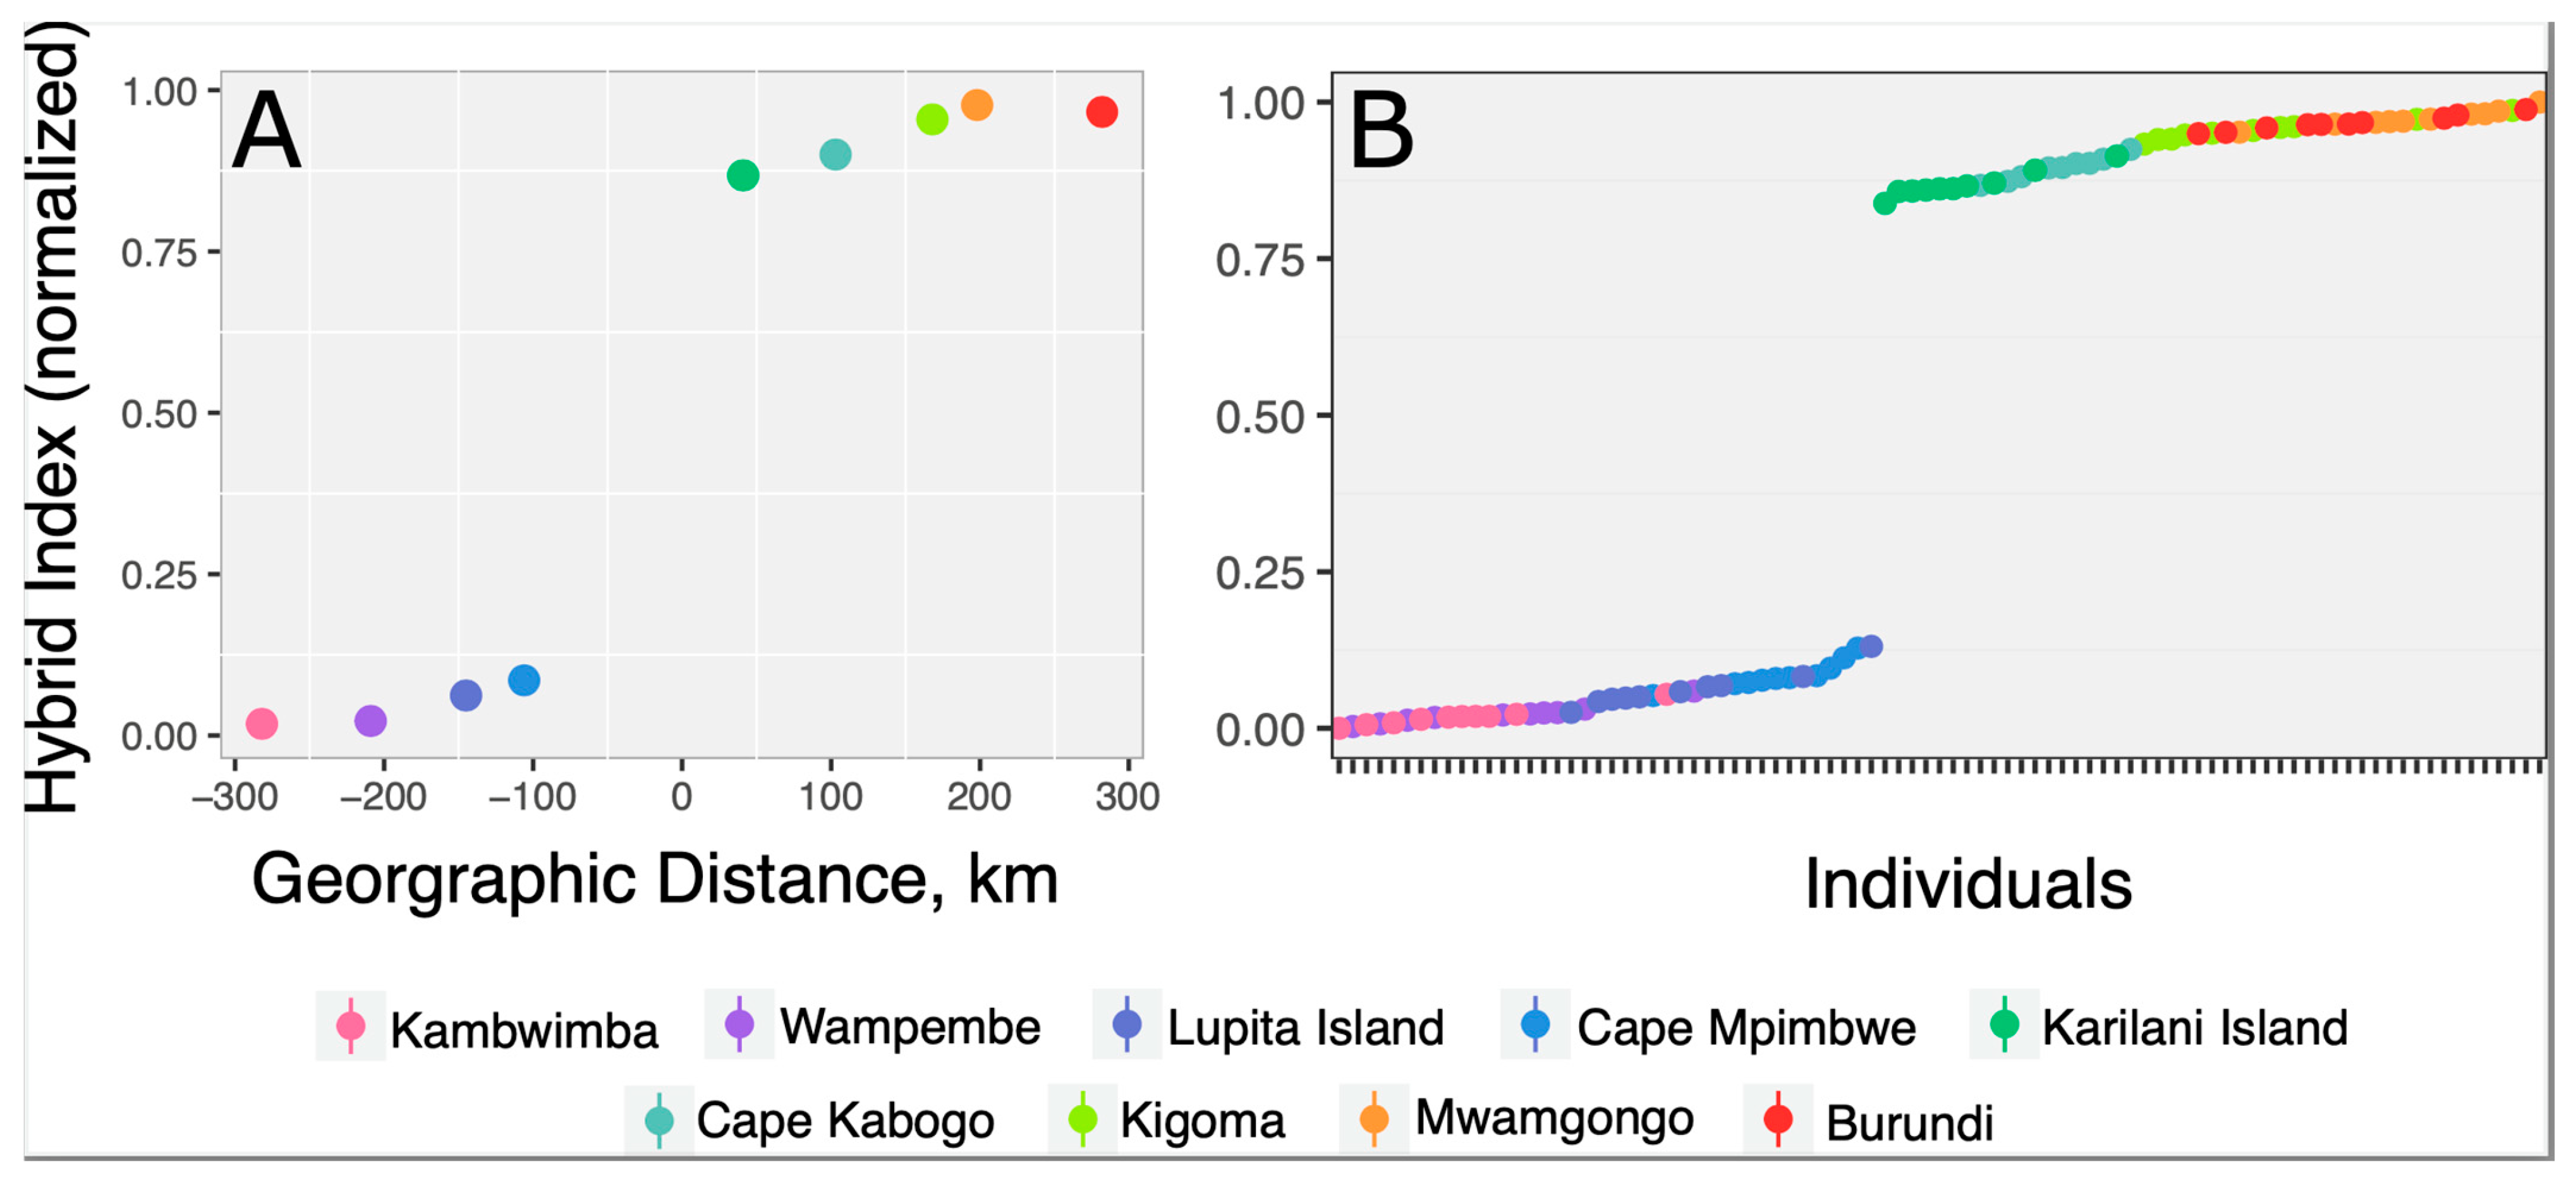
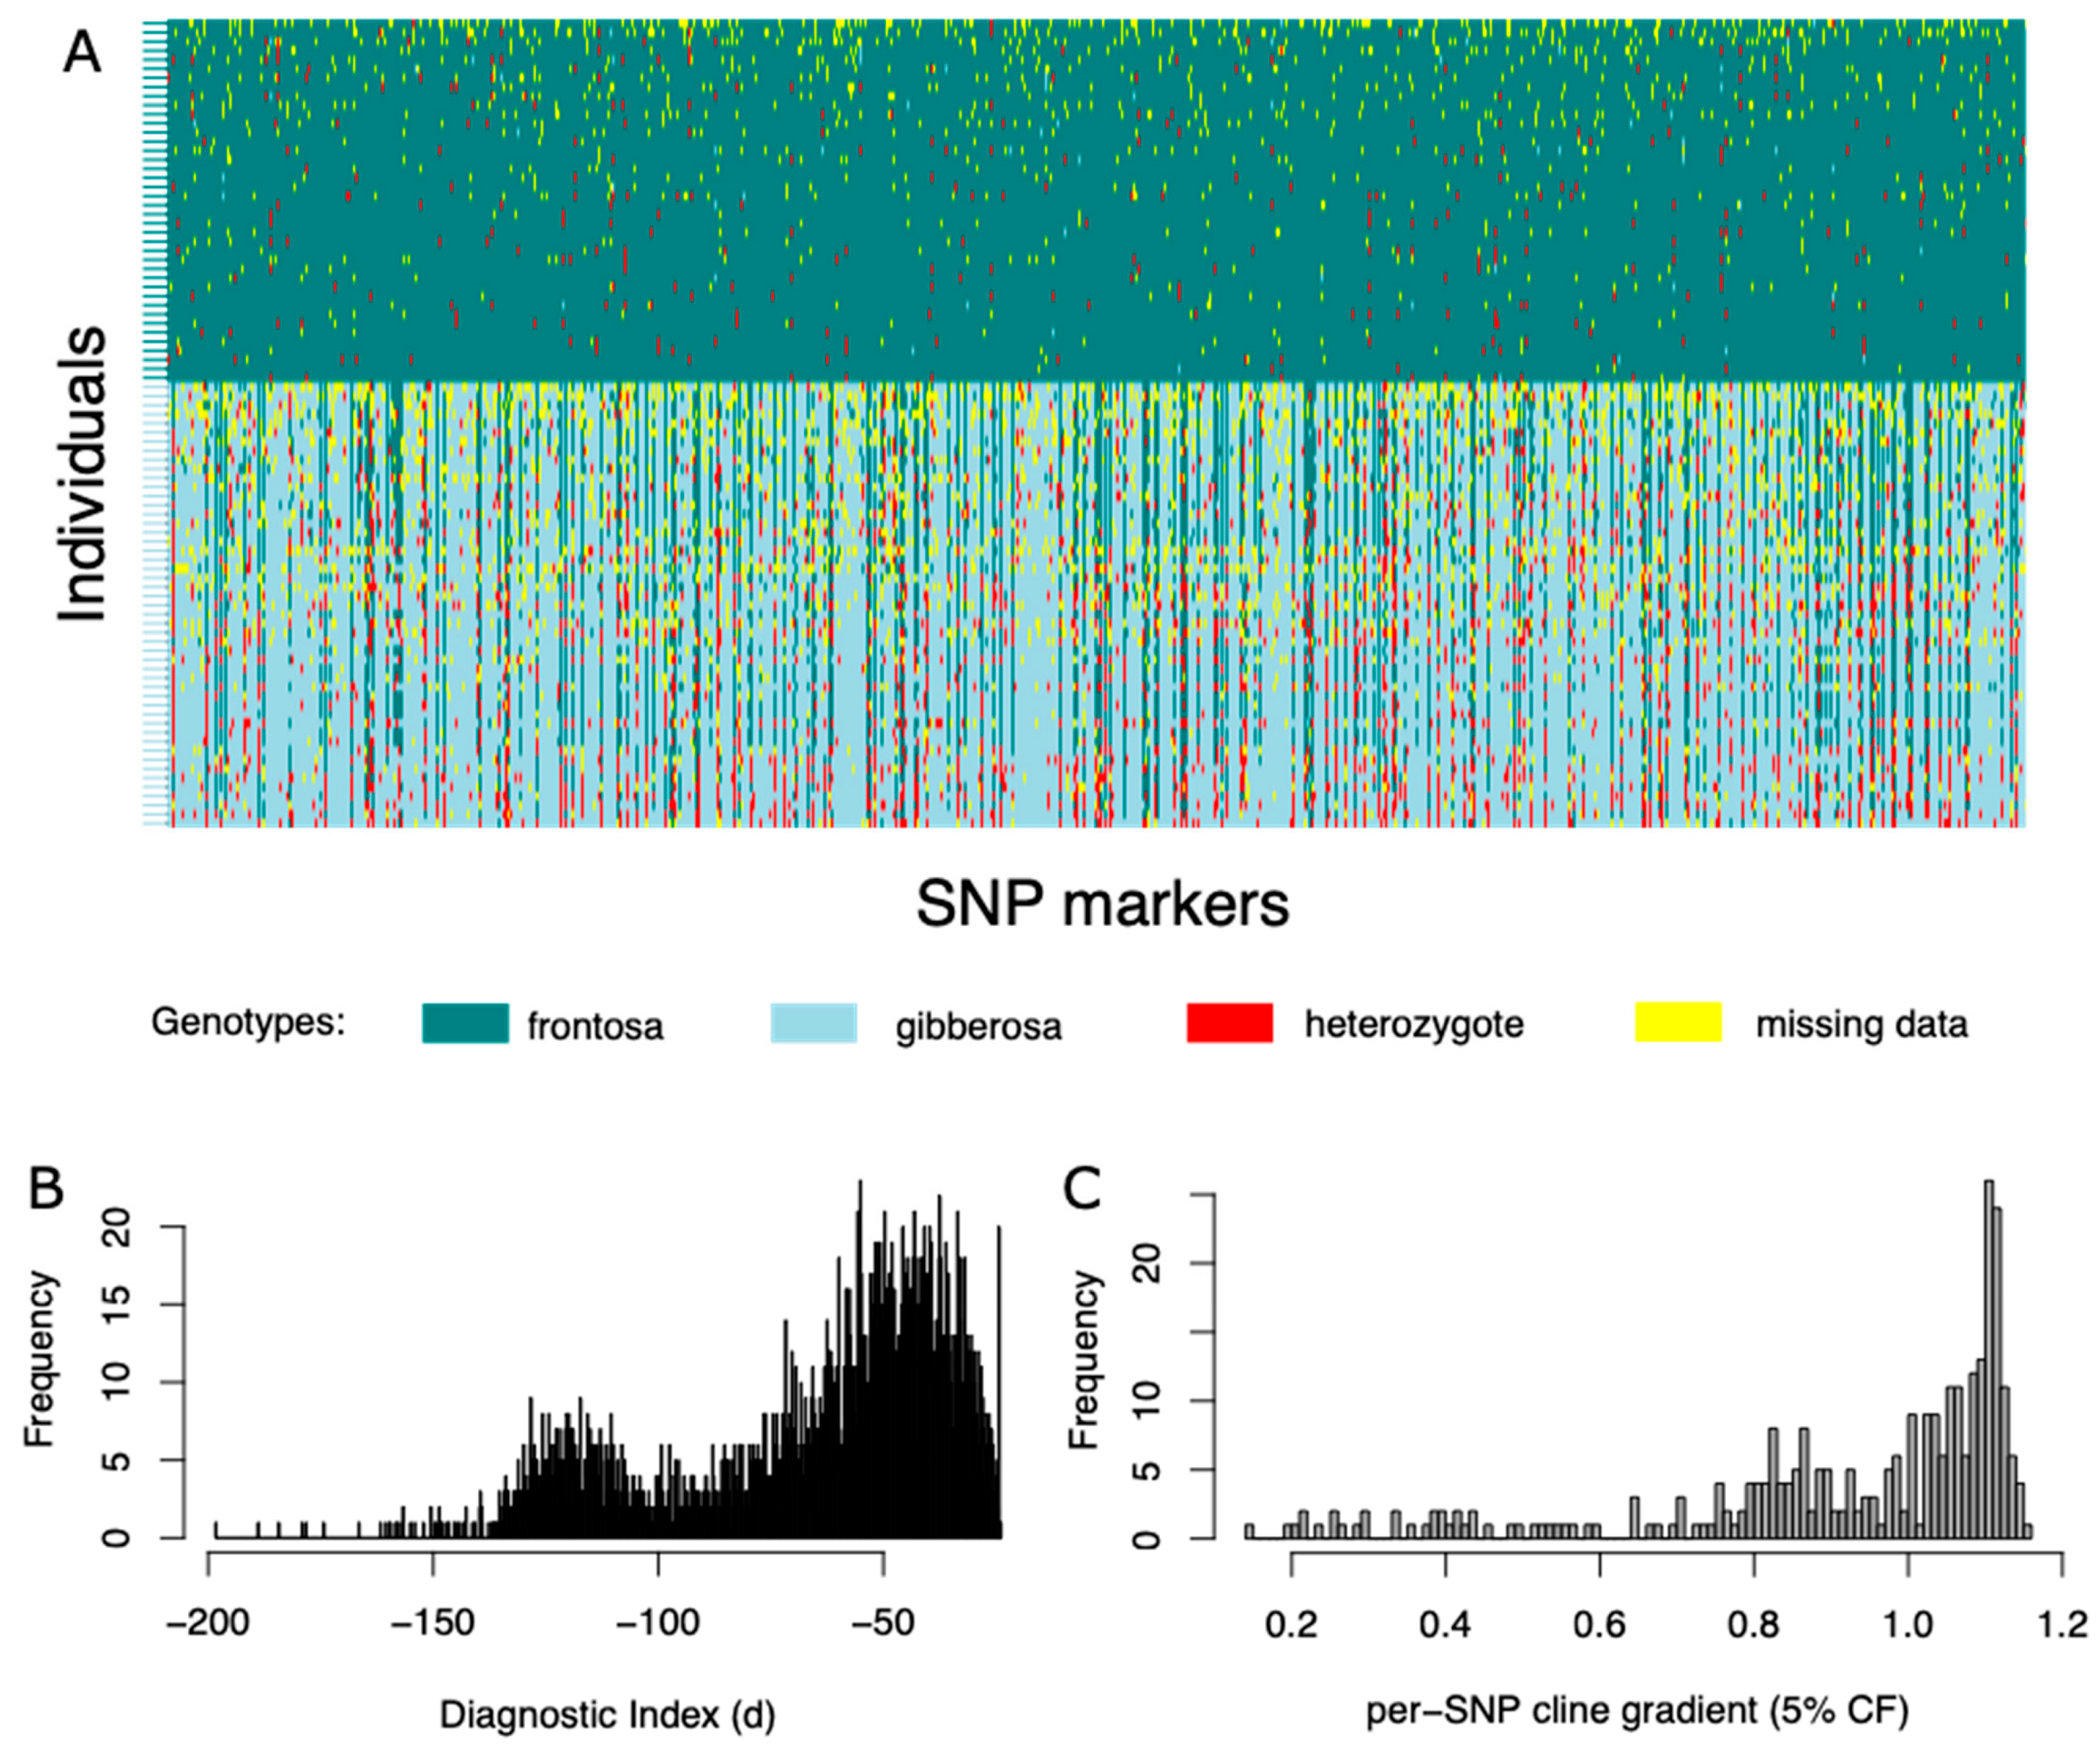
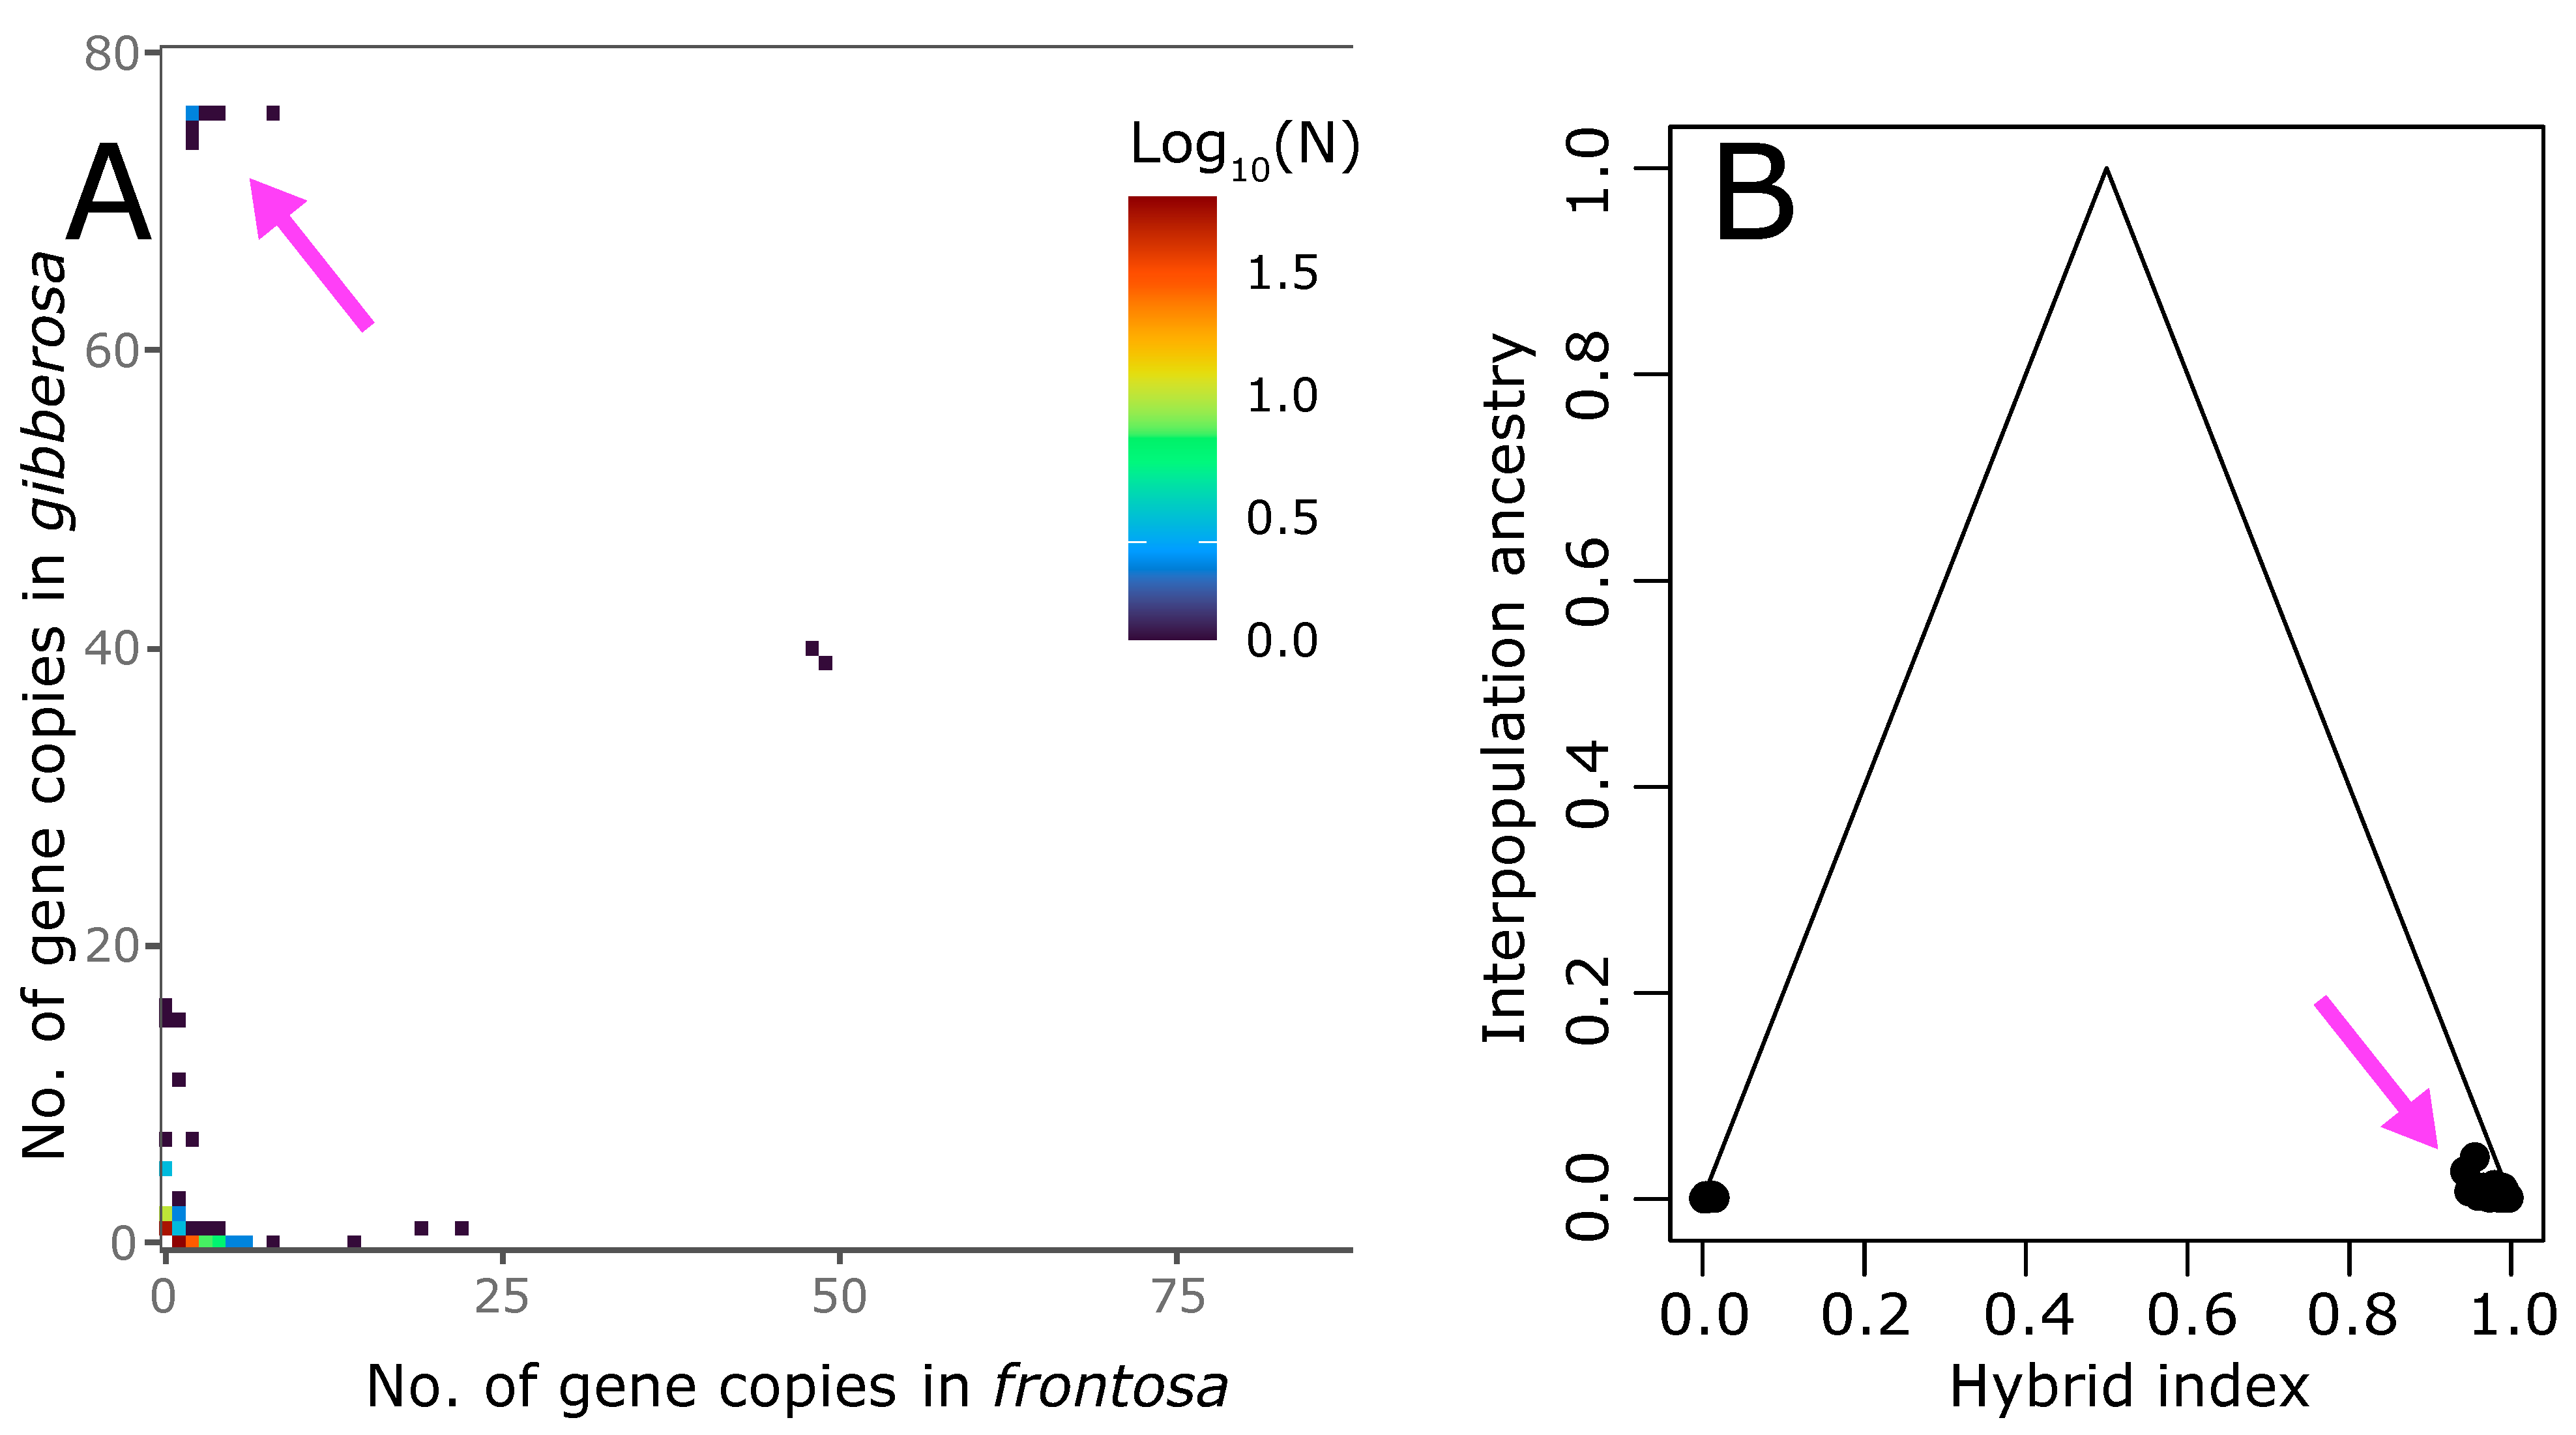
3.2. Clinal Variation and Gene Introgression

In order to investigate the pattern of suspected gene introgression between two Cyphotilapia species, we calculated the hybrid index (h) per individual and the diagnostic index (DI) per SNP marker in diemr. We set the model parameters so that the hybrid index arbitrarily reflects the estimated proportion of the individual “frontosa” ancestry (Figure 4A). Ordering the individuals by their h values revealed a strong clinal pattern, with shallow gradients on the edges and a clear gap in the middle, reflecting the sharp transition between the two species’ gene pools. Unlike the previous ADMIXTURE analysis, the clinal pattern in diemr suggests that the reciprocal introgression affects even the most distant populations on either end of the lake. The clinal pattern varied substantially across the individual SNP markers; i.e., while the majority of SNPs coincided with the hybrid index and switched sharply from carrying mostly frontosa to mostly gibberosa-derived alleles, a small number of markers showed a much shallower gradient, as inferred both in diemr (Figure 5A,B) and numerically for a subset of 330 markers in bgchm (Figure 5C). The large per-SNP variation in the bgchm cline shape parameters—center (c) = 0.135, 95% CF = [0.032, 0.321] and gradient (v) = 0.605 95% CF = [0.556, 0.658]—cannot be easily explained by the ancestral polymorphism nor by genetic drift scenarios, but is indicative of the continuous introgression of individual markers across a strong barrier to gene flow [30].
We then plotted the h averaged by population against the length of the geographic lake shoreline measured between the collection sites (Figure 1 and Figure 4). The resulting one-dimensional approximation of the genetic cline further demonstrated (1) the presence of a large unsampled geographic area in the middle of the lake, which also appears to contain the center of the transition (hybrid) zone between C. frontosa and C. gibberosa, as well as (2) a steeper but also less smooth clinal variation on the “frontosa” side (Figure 4B).
We obtained further evidence of possible asymmetric introgression in Cypholilapia, by examining the 2D site frequency spectrum, where the frequencies of the same SNP alleles were plotted, respectively, in “frontosa” and “gibberosa” gene pools (x and y axes on Figure 6A). A considerable number of markers exhibited a contrasting pattern, i.e., low frequency in one and high frequency in the other species (upper-left and bottom-right corners of Figure 6A). It was notable that “frontosa” had more potentially introgressed alleles (Figure 6). In addition, we used bgchm to calculate the proportion of SNP genotypes where one of two alleles is derived from one or the other species, and plotted the interspecific ancestries against the hybrid index on Figure 6B. A small but noticeable number of frontosa individuals had a slightly higher amount of gibberosa ancestry, separating them from the rest. These contrasting patterns could potentially represent introgressed variants that would require further investigation.

4. Discussion

Delineating species in the African Great Lakes continues to be challenging as traditional species concepts are difficult to apply to cichlids due to the considerable gene flow between species. Because of these challenges, “diversification” has been suggested as the preferred descriptive term rather than “speciation”, since we are observing speciation in action [4]. Biologists continue to be challenged by the explosive radiation in these cichlids and the extremely rapid rate at which diversification is taking place. It has been suggested that there is in fact something special about cichlids, some kind of “cichlidness” that has enabled this explosive radiation [4]. These explosive radiations may provide important insights into speciation by providing snapshots of ongoing processes of diversification and speciation [31].
This is the first time population genetic analyses and a gene flow study have been undertaken on Cyphotilapia in Lake Tanganyika. Both C. frontosa and C. gibberosa are now recognized species based on morphological studies [17] and confirmed by relatively recent large-scale multi-species genetic studies that have identified and separated the two species [18,32]. The results of our genetics analysis align with and confirm prior conclusions where the second species, C. gibberosa, was initially identified based only on morphological features [17]. That study indicated that C. gibberosa was found on the east coast of Lake Tanganyika from what they referred to as Myako (also referred to as Miyako Point, Figure 1) southward.
Our northernmost sample of C. gibberosa was from Cape Mpimbwe, which is about 140 km south of Myako, and the southernmost C. frontosa in our study came from Karilani Island, which is only around seven kilometers north of Myako. The more homogeneous genetic pool of C. gibberosa was particularly striking, indicating high levels of gene flow within this species or its recent geographic expansion in the southern region of the lake along the east coastline from Cape Mpimbwe to Kambwimba in the south near the Zambian border (around 173 km in a straight line).
A lower degree of genetic variation was also evident in the population at Mwamgongo in northern Lake Tanganyika. This is a transition region between the 7-bar Kigoma morph to the south and the 6-bar Burundi morph further north. Here, we expected some evidence indicating this region as being a hybrid zone. However, we found no genetic evidence of a clear separation between the 6-bar and 7-bar morphs, nor did we detect any indication of a hybrid zone at Mwamgongo. The Mwamgongo and Kigoma populations clustered quite closely on the PCA, and although Burundi was separated further from these two groups, only a small amount of variation was explained by the PCA compared to the frontosagibberosa separation. Our genetic results support the conclusions of a prior study that found that the 6-bar and 7-bar morphs are conspecifics based on morphological overlap [14].
While we expected a hybrid zone at Mwamgongo, our genetic results indicate that a potential hybrid zone occurs elsewhere, in the middle region of the lake somewhere between Karilani Island in the north (inhabited by C. frontosa) and Cape Mpimbwe in the south (inhabited by C. gibberosa). Unfortunately, we did not obtain samples from this part of the lake. However, we did find evidence of possible introgression between the two species. The genetic cline analysis in diemr pointed to bidirectional introgression, with a much stronger signal for gene flow from C. gibberosa to C. frontosa. This was particularly apparent from the ADMIXTURE analysis of the two populations of C. frontosa directly north of the C. gibberosa distribution (Cape Kabogo and Karilani Island), with a small percentage of C. gibberosa ancestry detected in these populations. The fact that both Cape Kabogo and Karilani Island are geographically positioned close to the center of the genetic cline between the two species may explain why these populations had greater levels of introgression.
Populations can be separated by a barrier leading to allopatric speciation such as the two species of Cyphotilapia on either side of the middle of the lake. Secondary contact between these two populations can result in genetic exchange and mixing. Patterns of population genetic structure following the secondary contact and introgressive hybridization between previously allopatric populations can sometimes be remarkably similar to those resulting from an Isolation-By-Distance (IBD) process, which does not require the presence of any additional barrier to gene flow [33]. In our case, the presence of heavily admixed individuals confined in a narrow geographic region in the center of Lake Tanganyika could be interpreted as evidence of a hybrid zone. Alternatively, a more gradual and linear genetic transition between the two most distant sampling locations would be more consistent with the IBD scenario. The presence of apparent gibberosa-associated alleles in the frontosa gene pool could be caused by introgression (Figure 6), but it could also be a result of genetic drift at polymorphic makers inherited from the common ancestor (i.e., incomplete lineage sorting). We argue that despite the absence of direct evidence (i.e., lack of samples from the middle of the lake), the combined results of our analyses still favor the scenario of limited introgression across a genetic barrier (=hybrid zone) scenario and not the IBD. Firstly, both the individual-level (Figure 4A) as well as the geographic (Figure 4B) gradient in allele frequencies are composed of two parts: (1) more gradual (shallow) tails in the north and south parts of the lake, and (2) a steep central part, which is unsampled, but is easily interpolated from the data on the periphery. Such a steep transition in the cline center is a classic feature of hybrid zones maintained by natural selection against hybrids and/or by variation in the environment [30,34,35]. At the same time, a stepped cline pattern runs contrary to the IBD model, which would instead result in a much more linear cline. Moreover, the examination of the per-marker cline shapes revealed a considerable number of SNPs that appear to have introgressed deep into frontosa, in sharp contrast with the rest of the genome. Such a distinct pattern is difficult to explain by any other scenario than introgression.
We observed a large variation in within-population genetics statistics, namely (i) a deficit of heterozygote genotypes (indicated by high Fis) in each examined location except Mwamgongo and Kigoma, (ii) evidence of recent demographic contraction (high positive values of Tajima’s D) in all populations except Kabwimba and Wampembe, and (iii) a smaller number of private alleles in the population sampled closer to the center of the lake (Table 1). Each of these patterns could arise due to reasons not necessarily connected with introgression between two species. For example, the high Fis could result from fine-scale population subdivision within the respective locations (i.e., Wahlund effect), and the apparent recent demographic changes, as well as the variation in the number of private alleles, could reflect the dynamic nature of local extinction and re-colonization. We believe that further investigation of the local population genetic structure and dynamics could shed the light on these and other interesting processes in Cypholtilapia.
It is likely that the bathymetry of Lake Tanganyika along with past lake level fluctuations have influenced the genetic structure of cichlid populations in the lake. The bathymetry of Lake Tanganyika reveals the presence of three deep basins, one in the north, one in the central region, and one in the south. In the past, lake levels appear to have been 350–600 m lower than those of the present [36,37,38]. A substantial drop in past water levels would have created three lakes [9]. The region of Myako (south of Cape Kabogo) is an area of relatively shallow water separating two deeper basins. A lower water level in the past would have separated these two basins, essentially splitting the Cyphotilapia populations. Past lake fluctuations have been seen as an important factor in the development of color morphs of Lake Tanganyika Tropheus populations [3,11], in the surprisingly close genetic populations on opposite sides of the lakeshore in the rock-dwelling herbivorous cichlid Variabilichromis moori [39], and in the expansion of rock- and shell-dwelling ecomorphs of Telmatochromis temporalis [40]. Fluctuating lake levels can drive speciation through population fragmentation when the water level drops, as well as subsequent hybridization when populations are brought back in contact with each other after the water level rises. This model may account for the Cyphotilapia population structure apparent today, with gibberosa developing in the southernmost lake during a period of low Lake Tanganyika water levels. At the same time, frontosa populations may have accumulated differences due to genetic drift while being restricted to the two northern lakes. Once water levels rose, the disparate frontosa populations hybridized, resulting in the greater diversity and various subpopulations observed in this study. The now-distinct gibberosa species would have then made contact with frontosa once the three lakes were reconnected into the current Lake Tanganyika.
The asymmetrical gene flow detected in the two Cyphotilpia populations (from C. gibberosa to C. frontosa) has been found in Zambian populations of Tropheus that were separated by a beach in southern Lake Tanganyika [10]. This study found that gene flow was unidirectional between phenotypically distinct Tropheus lineages. It was suggested that this was the result of potential population movement facilitated by lake level rise, leading to admixture followed by extinction due to habitat restructuring from sedimentation, along with the greater reproductive success of one morph over the other. We believe that proper sampling of the central part of the lake is necessary to find whether asymmetric introgression in Cyphotilapia also takes place in the hybrid zone center, i.e., is genome-wide, or whether it only occurs at the specific genetic markers as we are able to observe so far.
It would be of interest to perform more intense sampling in the region of Karilani Island and Miyako Point as the two species are only around seven kilometers apart based on previous distribution records [17]. Furthermore, we also lack data on population genetics along the west coast of the lake including the Democratic Republic of the Congo and Zambian populations. West coast populations would enable the exploration of any evidence of genetic links between east and west coast populations of Cyphotilapia. Such a genetic link could indicate previous migration events that would have been possible during periods of lower lake levels when Lake Tanganyika was composed of three separate lakes, and individuals could have migrated across the northern or southern shores of the individual lakes, or along underwater ridges [39]. Additional sampling can also be complemented by more sophisticated analytical approaches, including tools such as demographic modeling (e.g., [41]), to infer the likelihoods of complex scenarios in the population history of Cyphotilapia species.
The habitat and biology of Cyphotilapia contrast with shallow-water species such as Tropheus. Cyphotilapia lives in considerably deeper water and is a larger species in body size compared to many of the shallow-water Lake Tanganyika rock-associated cichlid species. Our hypothesis is that Cyphotilapia populations are more mobile than other shallow-water cichlids. There is fishing evidence of large populations of Cyphotilapia at depths as great as 100 m (Figure 1B,C). However, juveniles and sub-adults can be encountered at much shallower depths (18–20 m) and can be observed with SCUBA (Figure 1A,F). This suggests potential ontogenetic movement to deeper water. It is likely that Cyphotilapia are less tied to rock environments than other shallow-water cichlid species. The observed ontogenetic differences in vertical distribution suggest the possibility of greater horizontal movement. Moreover, we now have good evidence of low levels of isolation particularly within populations of C. gibberosa, where no significant population separation was detected. This may also suggest considerable horizontal movement in these southern populations. A similar pattern of low population genetic differentiation, however, could also be caused by a more recent expansion of C. gibberosa in the southern region of the lake, compared to an older formation in the population structure in C. frontosa in the northern part. A similar lack of genetic structure has been found in the giant cichlid Boulengerochromis microlepis in Lake Tanganyika and is probably due to the recent rapid expansion and high mobility of this species [42].
Despite this apparent mobility and low levels of isolation (particularly in C gibberosa) it does raise the question of how the distinct color morphs are maintained. There are still distinct 7-bar populations, as well as location-specific color morphs in head banding patterns and body color [13,15]. Currently, it is not clear what genetic factors might be accounting for these subtle population differences that are found at distinct regions in the lake. It is possible that a small number of loci play an important role in creating pattern variations. Alternatively, the interplay between genetics and the environment might be different in the different localities.

5. Conclusions

This study confirmed not only the presence of two species of Cyphotilapia along the east coast of Lake Tanganyika, but also a degree of population structure in both species, with somewhat greater differentiation among C. frontosa populations in the north. Currently, the mechanisms driving this difference is unknown, but this difference is nonetheless intriguing especially as there are recognizable color morphs at different locations in the lake. Our study also identified asymmetric introgression from C. gibberosa to G. frontosa. Further collections would be necessary in the middle region of the lake, which currently remains unsampled, to better identify and document the presence and extent of a potential hybrid zone.

Author Contributions

Conceptualization, G.D.J. and T.S.; methodology, G.D.J., T.S. and A.H.S.; validation, A.Y., O.Ç. and O.Z.; formal analysis, A.Y., O.Ç. and O.Z.; investigation, G.D.J., A.H.S. and T.S.; resources, G.D.J. and T.S.; data curation, T.S., O.Ç. and A.Y.; writing—original draft preparation, G.D.J. and A.Y.; writing—review and editing, G.D.J., A.Y., T.S. and O.Z.; visualization, T.S., O.Ç. and A.Y.; supervision, G.D.J. and A.Y.; project administration, G.D.J., T.S., A.H.S. and A.Y.; funding acquisition, G.D.J. and T.S. All authors have read and agreed to the published version of the manuscript.

Funding

This research was funded by FSC, grant number 2022_A_R4.

Institutional Review Board Statement

This study was conducted in accordance with the Institutional Animal Care and Use Committee (IACUC) of Loma Linda University (approval notice IACUC 21-200).

Informed Consent Statement

Not applicable.

Data Availability Statement

All DNA sequences from this study were deposited in the NCBI SRA database (BioProject PRJNA1076153).

Acknowledgments

We are grateful to Gaspard Ntakimazi and his assistants at the University of Burundi who facilitated the collection of fish in Burundi, and Chris and Louise Horsfall and the staff at Lake Shore Lodge in Kipilli, Tanzania, who helped greatly with the logistics of fish collection and provided wonderful accommodation at their lodge. Thanks also go to Gaspar Kuzumbe who was not only a great diving partner but was instrumental in coordinating a number of the fish collections in Tanzania. Ad Konings generously shared his knowledge of important collecting sites in Lake Tanganyika and provided connections with key people in Africa. We also thank David Welch and Christine Jackson who assisted with the two trips to Tanzania. Oleksandr Zinenko received support through the EURIZON project, which is funded by the European Union under grant agreement No. 871072.

Conflicts of Interest

The authors declare no conflicts of interest.

References

  1. Salzburger, W.; Mack, T.; Verheyen, E.; Meyer, A. Out of Tanganyika: Genesis, explosive speciation, key-innovations and phylogeography of the haplochromine cichlid fishes. BMC Evol. Biol. 2005, 5, 17. [Google Scholar] [CrossRef] [PubMed]
  2. Kocher, T.D. Ghost of speciation past. Nature 2005, 435, 29–30. [Google Scholar] [CrossRef] [PubMed]
  3. Egger, B.; Koblmüller, S.; Sturmbauer, C.; Sefc, K.M. Nuclear and mitochondrial data reveal different evolutionary processes in the Lake Tanganyika cichlid genus Tropheus. BMC Evol. Biol. 2007, 7, 137. [Google Scholar] [CrossRef] [PubMed]
  4. Salzburger, W. Understanding explosive diversification through cichlid fish genomics. Nat. Rev. Genet. 2018, 19, 705–717. [Google Scholar] [CrossRef]
  5. Meier, J.I.; McGee, M.D.; Marques, D.A.; Mwaiko, S.; Kishe, M.; Wandera, S.; Neumann, D.; Mrosso, H.; Chapman, L.J.; Chapman, C.A. Cycles of fusion and fission enabled rapid parallel adaptive radiations in African cichlids. Science 2023, 381, eade2833. [Google Scholar] [CrossRef]
  6. Koblmüller, S.; Duftner, N.; Sefc, K.M.; Aibara, M.; Stipacek, M.; Blanc, M.; Egger, B.; Sturmbauer, C. Reticulate phylogeny of gastropod-shell-breeding cichlids from Lake Tanganyika—The result of repeated introgressive hybridization. BMC Evol. Biol. 2007, 7, 7. [Google Scholar] [CrossRef]
  7. Wagner, C.E. Ecological opportunity, genetic variation, and the origins of African cichlid radiations. In The Behavior, Ecology and Evolution of Cichlid Fishes; Springer: Dordrecht, The Netherlands, 2021; pp. 79–105. [Google Scholar]
  8. Seehausen, O. Hybridization and adaptive radiation. Trends Ecol. Evol. 2004, 19, 198–207. [Google Scholar] [CrossRef]
  9. Sturmbauer, C.; Koblmüller, S.; Sefc, K.M.; Duftner, N. Phylogeographic history of the genus Tropheus, a lineage of rock-dwelling cichlid fishes endemic to Lake Tanganyika. In Aquatic Biodiversity II; Springer: Dordrecht, The Netherlands, 2005; pp. 335–366. [Google Scholar]
  10. Sefc, K.M.; Mattersdorfer, K.; Ziegelbecker, A.; Neuhüttler, N.; Steiner, O.; Goessler, W.; Koblmüller, S. Shifting barriers and phenotypic diversification by hybridisation. Ecol. Lett. 2017, 20, 651–662. [Google Scholar] [CrossRef]
  11. Sefc, K.M.; Mattersdorfer, K.; Hermann, C.M.; Koblmüller, S. Past lake shore dynamics explain present pattern of unidirectional introgression across a habitat barrier. Hydrobiologia 2017, 791, 69–82. [Google Scholar] [CrossRef]
  12. Wagner, C.E.; McCUNE, A.R.; Lovette, I.J. Recent speciation between sympatric Tanganyikan cichlid colour morphs. Mol. Ecol. 2012, 21, 3283–3292. [Google Scholar] [CrossRef]
  13. Konings, A. Tanganyika Cichlids in Their Natural Habitat, 4th ed.; Cichlid Press: El Paso, TX, USA, 2019; p. 662. [Google Scholar]
  14. Takahashi, T.; Ngatunga, B.; Snoeks, J. Taxonomic status of the six-band morph of Cyphotilapia frontosa (Perciformes: Cichlidae) from Lake Tanganyika, Africa. Ichthyol. Res. 2007, 54, 55–60. [Google Scholar] [CrossRef]
  15. Konings, A. None other than Cyphotilapia frontosa. Cichlid News, 2019; pp. 11–16. [Google Scholar]
  16. Poll, M. Poissons Cichlidae. Exploration Hydrobiologique du Lac Tanganika (1946–1947)—Résultats Scientifiques. Institut Royal des Sciences Naturelles de Belgique: Bruxelles, Belgium, 1956; Volume 3:1. [Google Scholar]
  17. Takahashi, T.; Nakaya, K. New species of Cyphotilapia (Perciformes: Cichlidae) from Lake Tanganyika, Africa. Copeia 2003, 2003, 824–832. [Google Scholar] [CrossRef]
  18. Ronco, F.; Matschiner, M.; Böhne, A.; Boila, A.; Büscher, H.H.; El Taher, A.; Indermaur, A.; Malinsky, M.; Ricci, V.; Kahmen, A. Drivers and dynamics of a massive adaptive radiation in cichlid fishes. Nature 2021, 589, 76–81. [Google Scholar] [CrossRef]
  19. Brelsford, A.; Dufresnes, C.; Perrin, N. High-density sex-specific linkage maps of a European tree frog (Hyla arborea) identify the sex chromosome without information on offspring sex. Heredity 2016, 116, 177–181. [Google Scholar] [CrossRef] [PubMed]
  20. Rochette, N.C.; Rivera-Colón, A.G.; Catchen, J.M. Stacks 2: Analytical methods for paired-end sequencing improve RADseq-based population genomics. Mol. Ecol. 2019, 28, 4737–4754. [Google Scholar] [CrossRef]
  21. Langmead, B.; Salzberg, S. Fast Gapped-Read Alignment with Bowtie 2. Nat. Methods 2012, 9, 357–359. [Google Scholar] [CrossRef]
  22. Danecek, P.; Bonfield, J.K.; Liddle, J.; Marshall, J.; Ohan, V.; Pollard, M.O.; Whitwham, A.; Keane, T.; McCarthy, S.A.; Davies, R.M. Twelve years of SAMtools and BCFtools. Gigascience 2021, 10, giab008. [Google Scholar] [CrossRef]
  23. Chang, C.C.; Chow, C.C.; Tellier, L.C.; Vattikuti, S.; Purcell, S.M.; Lee, J.J. Second-generation PLINK: Rising to the challenge of larger and richer datasets. GigaScience 2015, 4. [Google Scholar] [CrossRef]
  24. Malinsky, M.; Trucchi, E.; Lawson, D.J.; Falush, D. RADpainter and fineRADstructure: Population inference from RADseq data. Mol. Biol. Evol. 2018, 35, 1284–1290. [Google Scholar] [CrossRef]
  25. Alexander, D.H.; Novembre, J.; Lange, K. Fast model-based estimation of ancestry in unrelated individuals. Genome Res. 2009, 19, 1655–1664. [Google Scholar] [CrossRef]
  26. Giakoumis, M.; Pinilla-Buitrago, G.E.; Musher, L.J.; Wares, J.P.; Baird, S.J.; Hickerson, M.J. Evidence of introgression, ecological divergence and adaptation in Asterias sea stars. Mol. Ecol. 2023, 32, 5541–5557. [Google Scholar] [CrossRef] [PubMed]
  27. Gompert, Z.; DeRaad, D.A.; Buerkle, C.A. A next generation of hierarchical Bayesian analyses of hybrid zones enables direct quantification of variation in introgression in R. bioRxiv, 2024. [Google Scholar]
  28. Hemstrom, W.; Jones, M. snpR: User friendly population genomics for SNP data sets with categorical metadata. Mol. Ecol. Resour. 2023, 23, 962–973. [Google Scholar] [CrossRef] [PubMed]
  29. Weir, B.S.; Cockerham, C.C. Estimating F-statistics for the analysis of population structure. Evolution 1984, 38, 1358–1370. [Google Scholar] [CrossRef] [PubMed]
  30. Barton, N.H.; Hewitt, G.M. Analysis of hybrid zones. Annu. Rev. Ecol. Syst. 1985, 16, 113–148. [Google Scholar] [CrossRef]
  31. Kocher, T.D. Adaptive evolution and explosive speciation: The cichlid fish model. Nat. Rev. Genet. 2004, 5, 288–298. [Google Scholar] [CrossRef]
  32. Takahashi, T.; Sota, T. A robust phylogeny among major lineages of the East African cichlids. Mol. Phylogenet. Evol. 2016, 100, 234–242. [Google Scholar] [CrossRef]
  33. Meirmans, P.G. The trouble with isolation by distance. Mol. Ecol. 2012, 21, 2839–2846. [Google Scholar] [CrossRef]
  34. Szymura, J.M.; Barton, N.H. Genetic analysis of a hybrid zone between the fire-bellied toads, Bombina bombina and B. variegata, near Cracow in southern Poland. Evolution 1986, 40, 1141–1159. [Google Scholar] [CrossRef]
  35. Yanchukov, A.; Hofman, S.; Szymura, J.M.; Mezhzherin, S.V.; Morozov-Leonov, S.Y.; Barton, N.H.; Nürnberger, B. Hybridization of Bombina bombina and B. variegata (Anura, Discoglossidae) at a sharp ecotone in western Ukraine: Comparisons across transects and over time. Evolution 2006, 60, 583–600. [Google Scholar] [CrossRef]
  36. Gasse, F.; Lédée, V.; Massault, M.; Fontes, J.-C. Water-level fluctuations of Lake Tanganyika in phase with oceanic changes during the last glaciation and deglaciation. Nature 1989, 342, 57–59. [Google Scholar] [CrossRef]
  37. Scholz, C.A.; King, J.W.; Ellis, G.S.; Swart, P.K.; Stager, J.C.; Colman, S.M. Paleolimnology of Lake Tanganyika, East Africa, over the past 100 kyr. J. Paleolimnol. 2003, 30, 139–150. [Google Scholar] [CrossRef]
  38. Cohen, A.S.; Stone, J.R.; Beuning, K.R.; Park, L.E.; Reinthal, P.N.; Dettman, D.; Scholz, C.A.; Johnson, T.C.; King, J.W.; Talbot, M.R. Ecological consequences of early Late Pleistocene megadroughts in tropical Africa. Proc. Natl. Acad. Sci. USA 2007, 104, 16422–16427. [Google Scholar] [CrossRef] [PubMed]
  39. Duftner, N.; Sefc, K.M.; Koblmueller, S.; Nevado, B.; Verheyen, E.; Phiri, H.; Sturmbauer, C. Distinct population structure in a phenotypically homogeneous rock-dwelling cichlid fish from Lake Tanganyika. Mol. Ecol. 2006, 15, 2381–2395. [Google Scholar] [CrossRef] [PubMed]
  40. Winkelmann, K.; Rüber, L.; Genner, M.J. Lake level fluctuations and divergence of cichlid fish ecomorphs in Lake Tanganyika. Hydrobiologia 2017, 791, 21–34. [Google Scholar] [CrossRef]
  41. Lewanski, A.L.; Golcher-Benavides, J.; Rick, J.A.; Wagner, C.E. Variable hybridization between two Lake Tanganyikan cichlid species in recent secondary contact. Mol. Ecol. 2022, 31, 5041–5059. [Google Scholar] [CrossRef]
  42. Koblmüller, S.; Odhiambo, E.A.; Sinyinza, D.; Sturmbauer, C.; Sefc, K.M. Big fish, little divergence: Phylogeography of Lake Tanganyika’s giant cichlid, Boulengerochromis microlepis. Hydrobiologia 2015, 748, 29–38. [Google Scholar] [CrossRef]
Figure 1. Cyphotilapia from this study: (A) juvenile near Lupita island around 15–20 m in depth. (B,C) Catch in fisherman’s boats between Kipili on the mainland and Lupita Island. (D) Mwamgongo morphs showing variety in bar patterns. (E) Burundi morph. (F) Juvenile near Lupita Island around 15–20 m in depth. (G) Kigoma 7-bar morph. (H) Collection locations of fish for this study.
Fishes 09 00481 g001
Figure 2. PCA and hierarchical genetic clustering analysis. (A) Principal component analysis: the vertical arrow indicates geographic positions of the localities, north to south. (B) ADMIXTURE plots for the range of values of K (2–6). The individuals on each plot are aligned according to their inferred ancestry proportions of two clusters at K = 2. The inset on the plot with K = 2 shows the respective cross-validation errors (CV) over K (lower values of CV translate into better statistical support).
Fishes 09 00481 g002
Figure 3. Co-ancestry matrix of Cyphotilapia populations in Lake Tanganyika, produced in RADpainter [24]. The values in the heatmap cells indicate the contributions of inferred genetic ancestry from the individuals listed in columns (“donors”) to the individuals listed in rows (“recipients”). Note the presence of two main clusters (‘gibberosa’ in the bottom left and ‘frontosa’ in the top right), as well as the higher genetic affinity of Cape Kabogo and Karalani Island individuals to the ‘gibberosa’ cluster, likely caused by gene flow.
Fishes 09 00481 g003
Figure 4. Genetic barrier between C. frontosa and C. gibberosa visualized using SNP polarization in diemr. (A,B) Hybrid index (h) showing a sharp transition between two species, as well as possible traces of admixture on both sides of the barrier: (A) individuals ordered by h; (B) average h per sampling location across the geographic distance (centered at the mid-point between the most distant locations Burundi and Kabwimba) along Lake Tanganyika shore.
Fishes 09 00481 g004
Figure 5. Introgression between C. frontosa and C. gibberosa visualized using SNP polarization in diemr. (A) The top 30% diagnostic individual SNP genotypes (n = 3624) ordered in rows by their genomic location and colored as follows: teal—homozygotes for frontosa alleles; light blue—homozygotes for gibberosa alleles; red—heterozygotes; and yellow—missing genotypes. (B) Frequency distribution of the diemr per-SNP diagnostic index (d) for the dataset on (A). (C) The distribution of the lower 5% confidence interval boundary of the cline parameter v (cline gradient) among the 330 SNPs included in the bgchm analysis.
Fishes 09 00481 g005
Figure 6. Asymmetric introgression between two Cyphotilapia species. (A) A 2D site frequency spectrum constructed in snpR. The x and y axes show the projected number of gene copies in frontosa and gibberosa individuals: a small fraction of SNPs with high prevalence in gibberosa but also present at low frequencies in frontosa, indicated by an arrow. (B) Triangular plot of the mixed interspecific individual ancestry vs. hybrid index (=proportion of frontosa alleles), inferred for 330 SNPs in bgchm. Arrow indicates a small number of frontosa individuals with slightly higher values of interspecific ancestry, possibly caused by distant introgression.
Fishes 09 00481 g006
Table 1. Basic population genetics statistics per population of Cyphotilapia in Lake Tanganyika: private.al.—number of private alleles, corrected for sample size; al.rich.—allelic richness; Fis—Wright’s inbreeding coefficient; Tajima’s D—difference between the mean number of pairwise nucleotide differences and the number of segregating sites; π—number of pairwise nucleotides.
Populationprivate.al.al.rich.FisTajima’s Dπ
Burundi84451.1730.1640.1940.074
Kambwimba49371.1620.2960.1160.061
Cape Kabogo13131.1500.2340.0780.057
Karilani Island35591.1670.2980.6290.060
Kigoma40001.1850.0830.2730.072
Lupita Island67011.1670.1660.1330.074
Cape Mpimbwe55971.1470.2140.3910.071
Mwamgongo89371.269−0.083−0.0800.111
Wampembe62471.2060.254−0.0510.081
Table 2. Pairwise Fst between populations. All Fst values had significant bootstrap support (p < 0.05). Letters in parentheses indicate the species of that population: f = frontosa, g = gibberosa.
Kabwimba (g)Cape
Kabogo (f)
Karalani
Island (f)
Kigoma (f)Lupita
Island (g)
Cape
Mpimbwe (g)
Mwamgongo (f)Wampembe (g)
Burundi (f)0.4430.1480.1540.1960.473 0.4830.1500.390
Kabwimba (g) 0.3490.3490.3810.0390.0700.2940.015
Kabogo (f) 0.0480.0900.4240.4380.0790.327
Karalani_Island (f) 0.0860.4030.4170.0690.304
Kigoma (f) 0.417 0.4290.0140.319
Lupita_Island (g) 0.0390.3290.041
Cape
Mpimbwe (g)
0.3340.067
Mwamgongo (f) 0.238
Disclaimer/Publisher’s Note: The statements, opinions and data contained in all publications are solely those of the individual author(s) and contributor(s) and not of MDPI and/or the editor(s). MDPI and/or the editor(s) disclaim responsibility for any injury to people or property resulting from any ideas, methods, instructions or products referred to in the content.

