
Comparison of Growth Performance, Nutritional Composition, and Muscle Transcriptome between Two Cultured Varieties of the Chinese Mitten Crab (Eriocheir sinensis)

 ,
,
Abstract
:1. Introduction
2. Materials and Methods
2.1. Experimental Protocol and Sample Collection
2.2. Aquaculture Water Quality Measurements
2.3. Measurement of Growth Indicators
2.4. Nutrient Component Measurements
2.5. Transcriptomics Analysis
2.5.1. Sample Collection, RNA Extraction, cDNA Library Construction, and Sequencing
2.5.2. Transcriptome Sequencing Data Processing
2.5.3. Quantitative RT-PCR (qPCR)
2.6. Statistical Analysis
3. Results
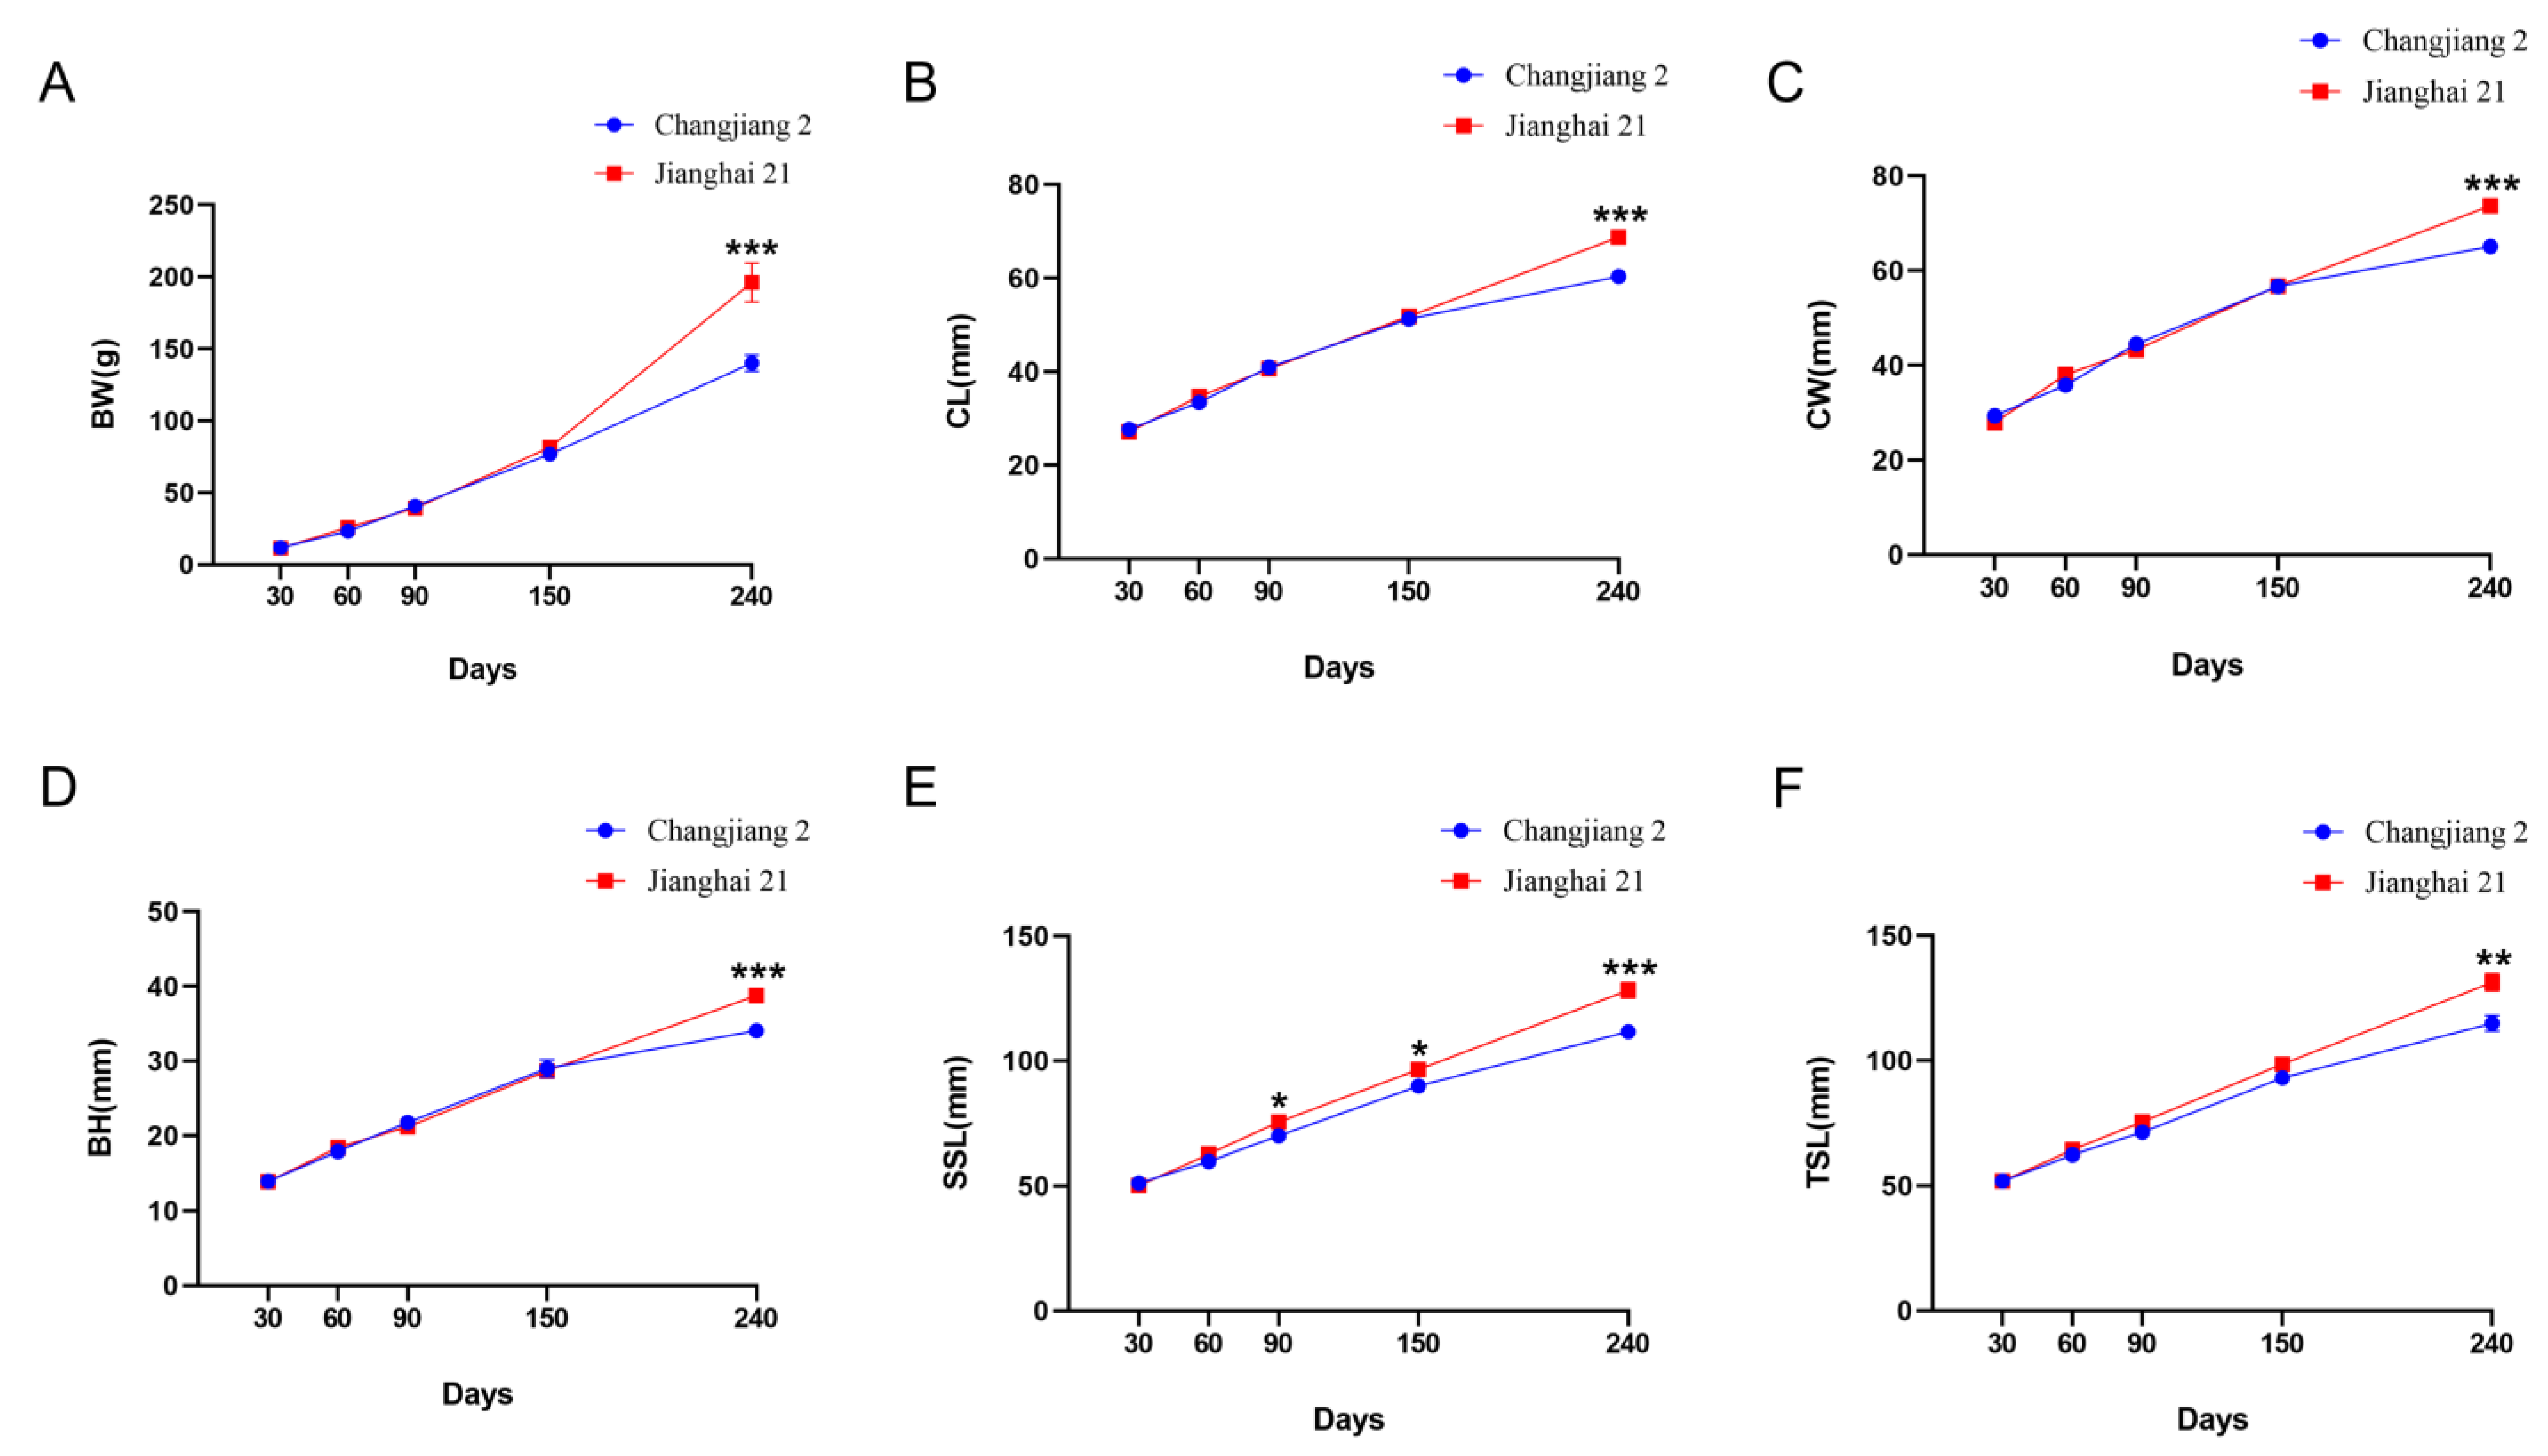
3.1. Growth Performance
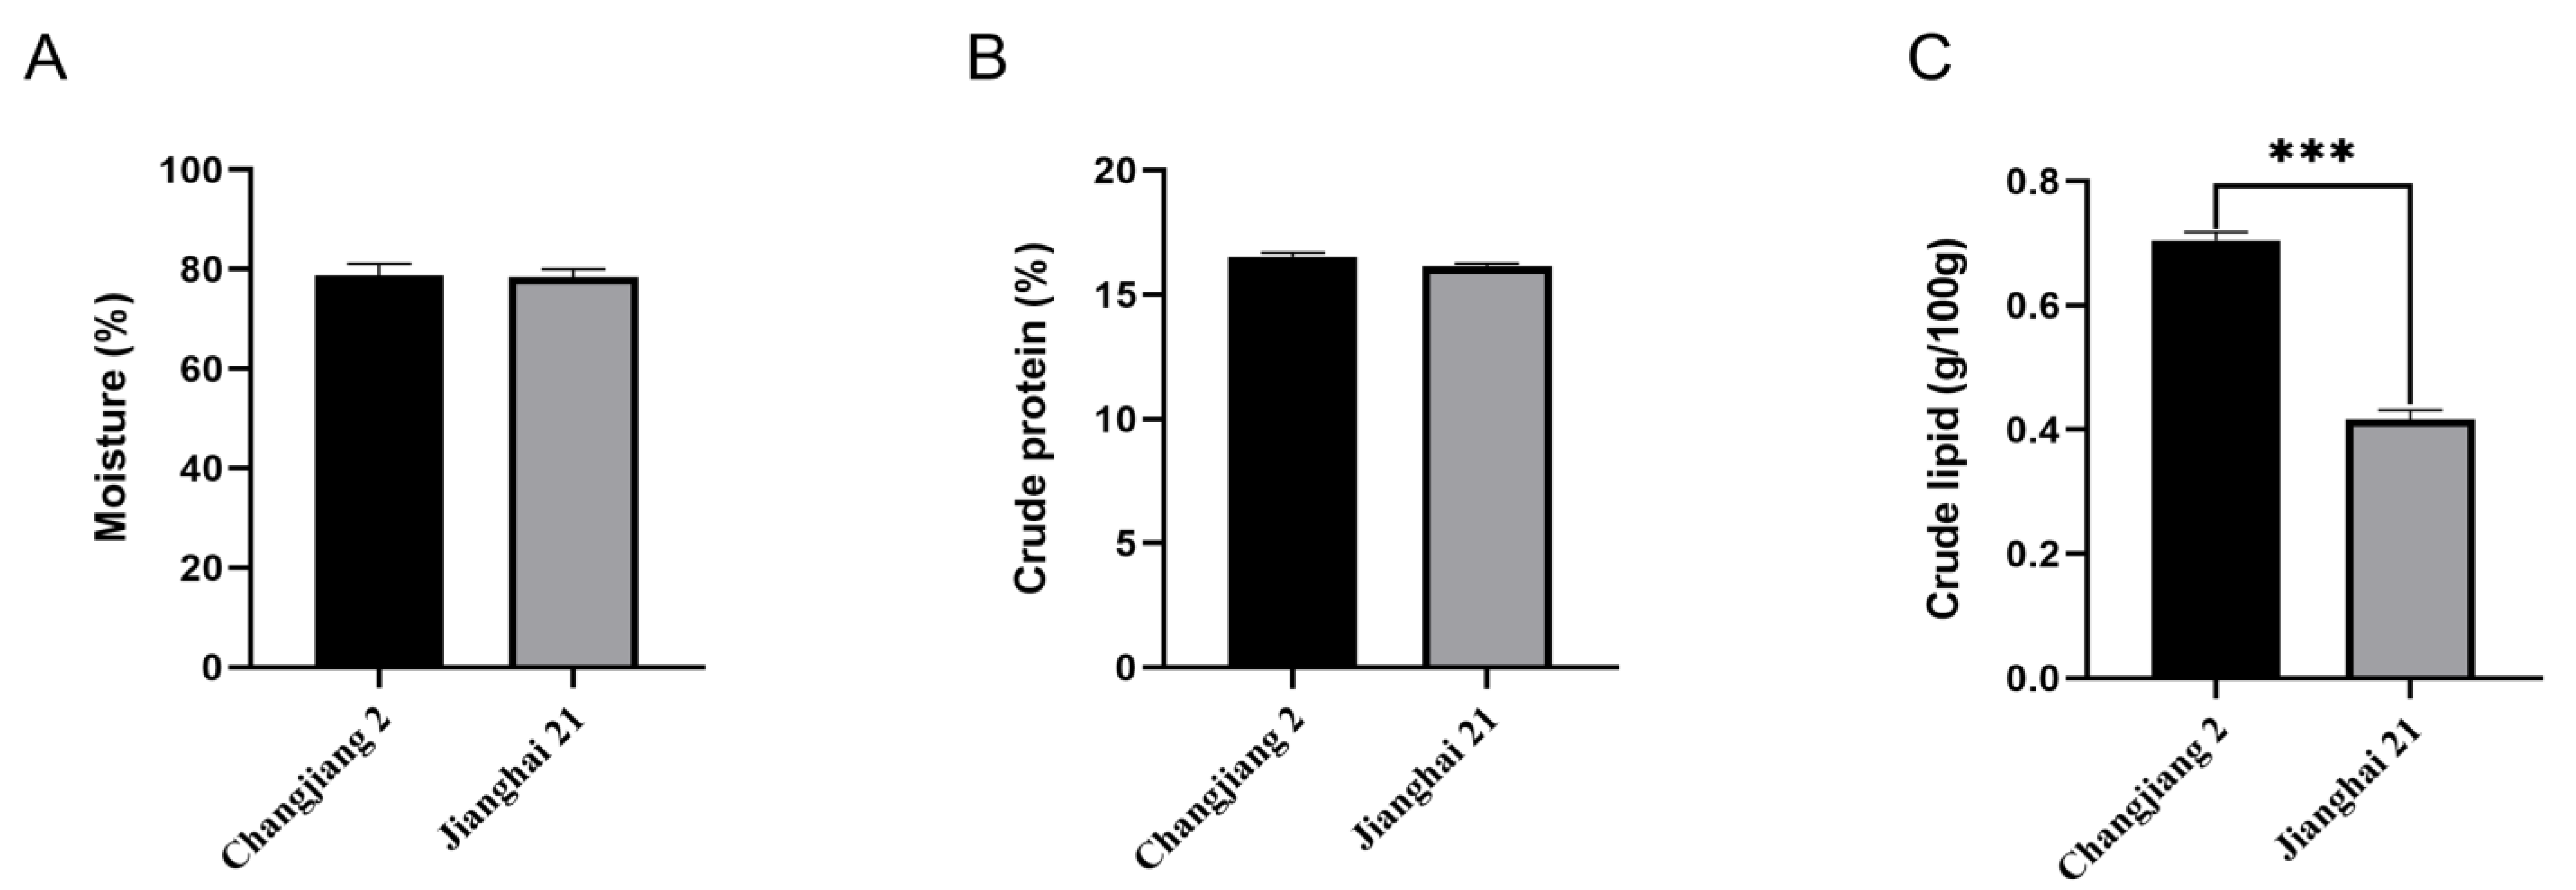
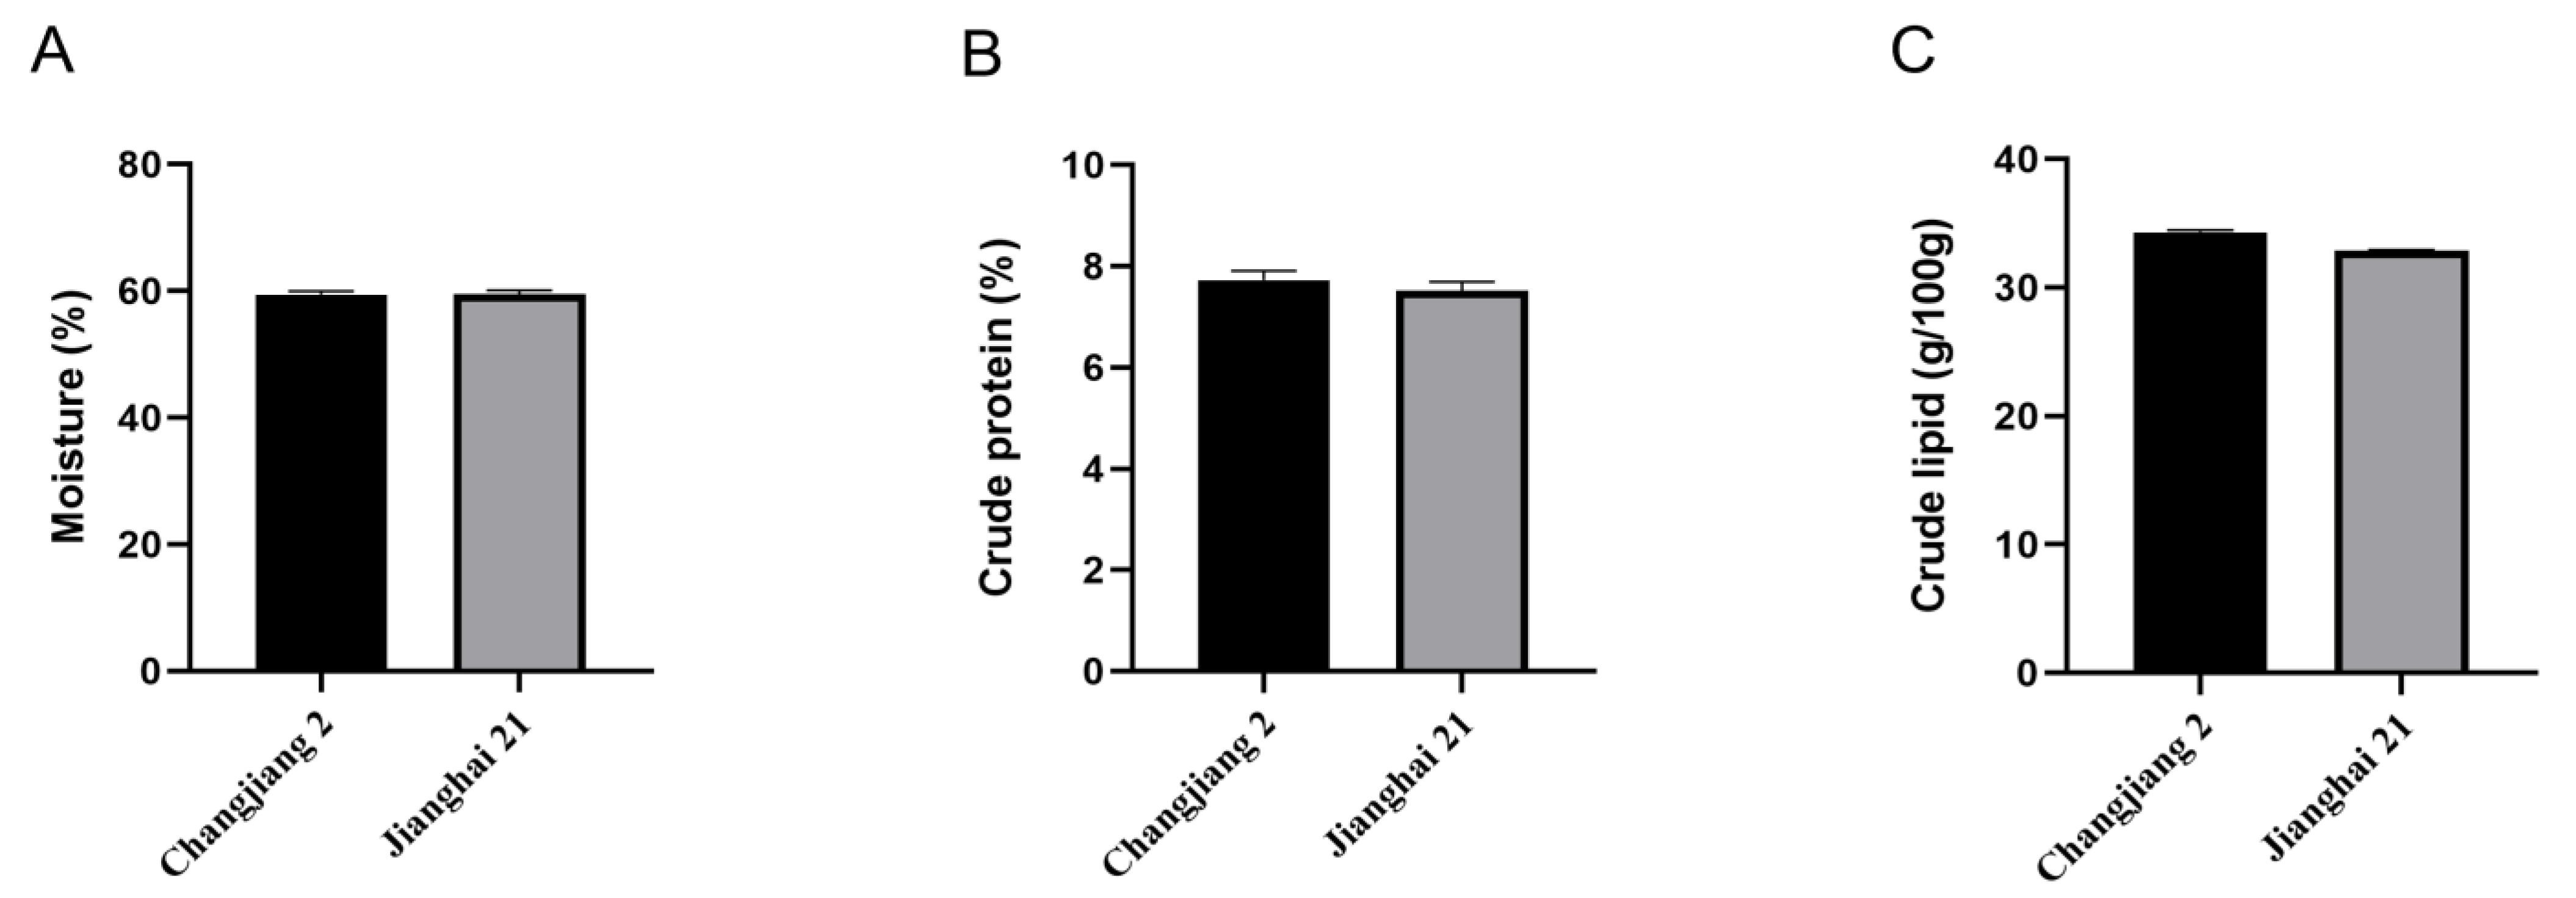
3.2. Proximate Composition
3.3. Amino Acids
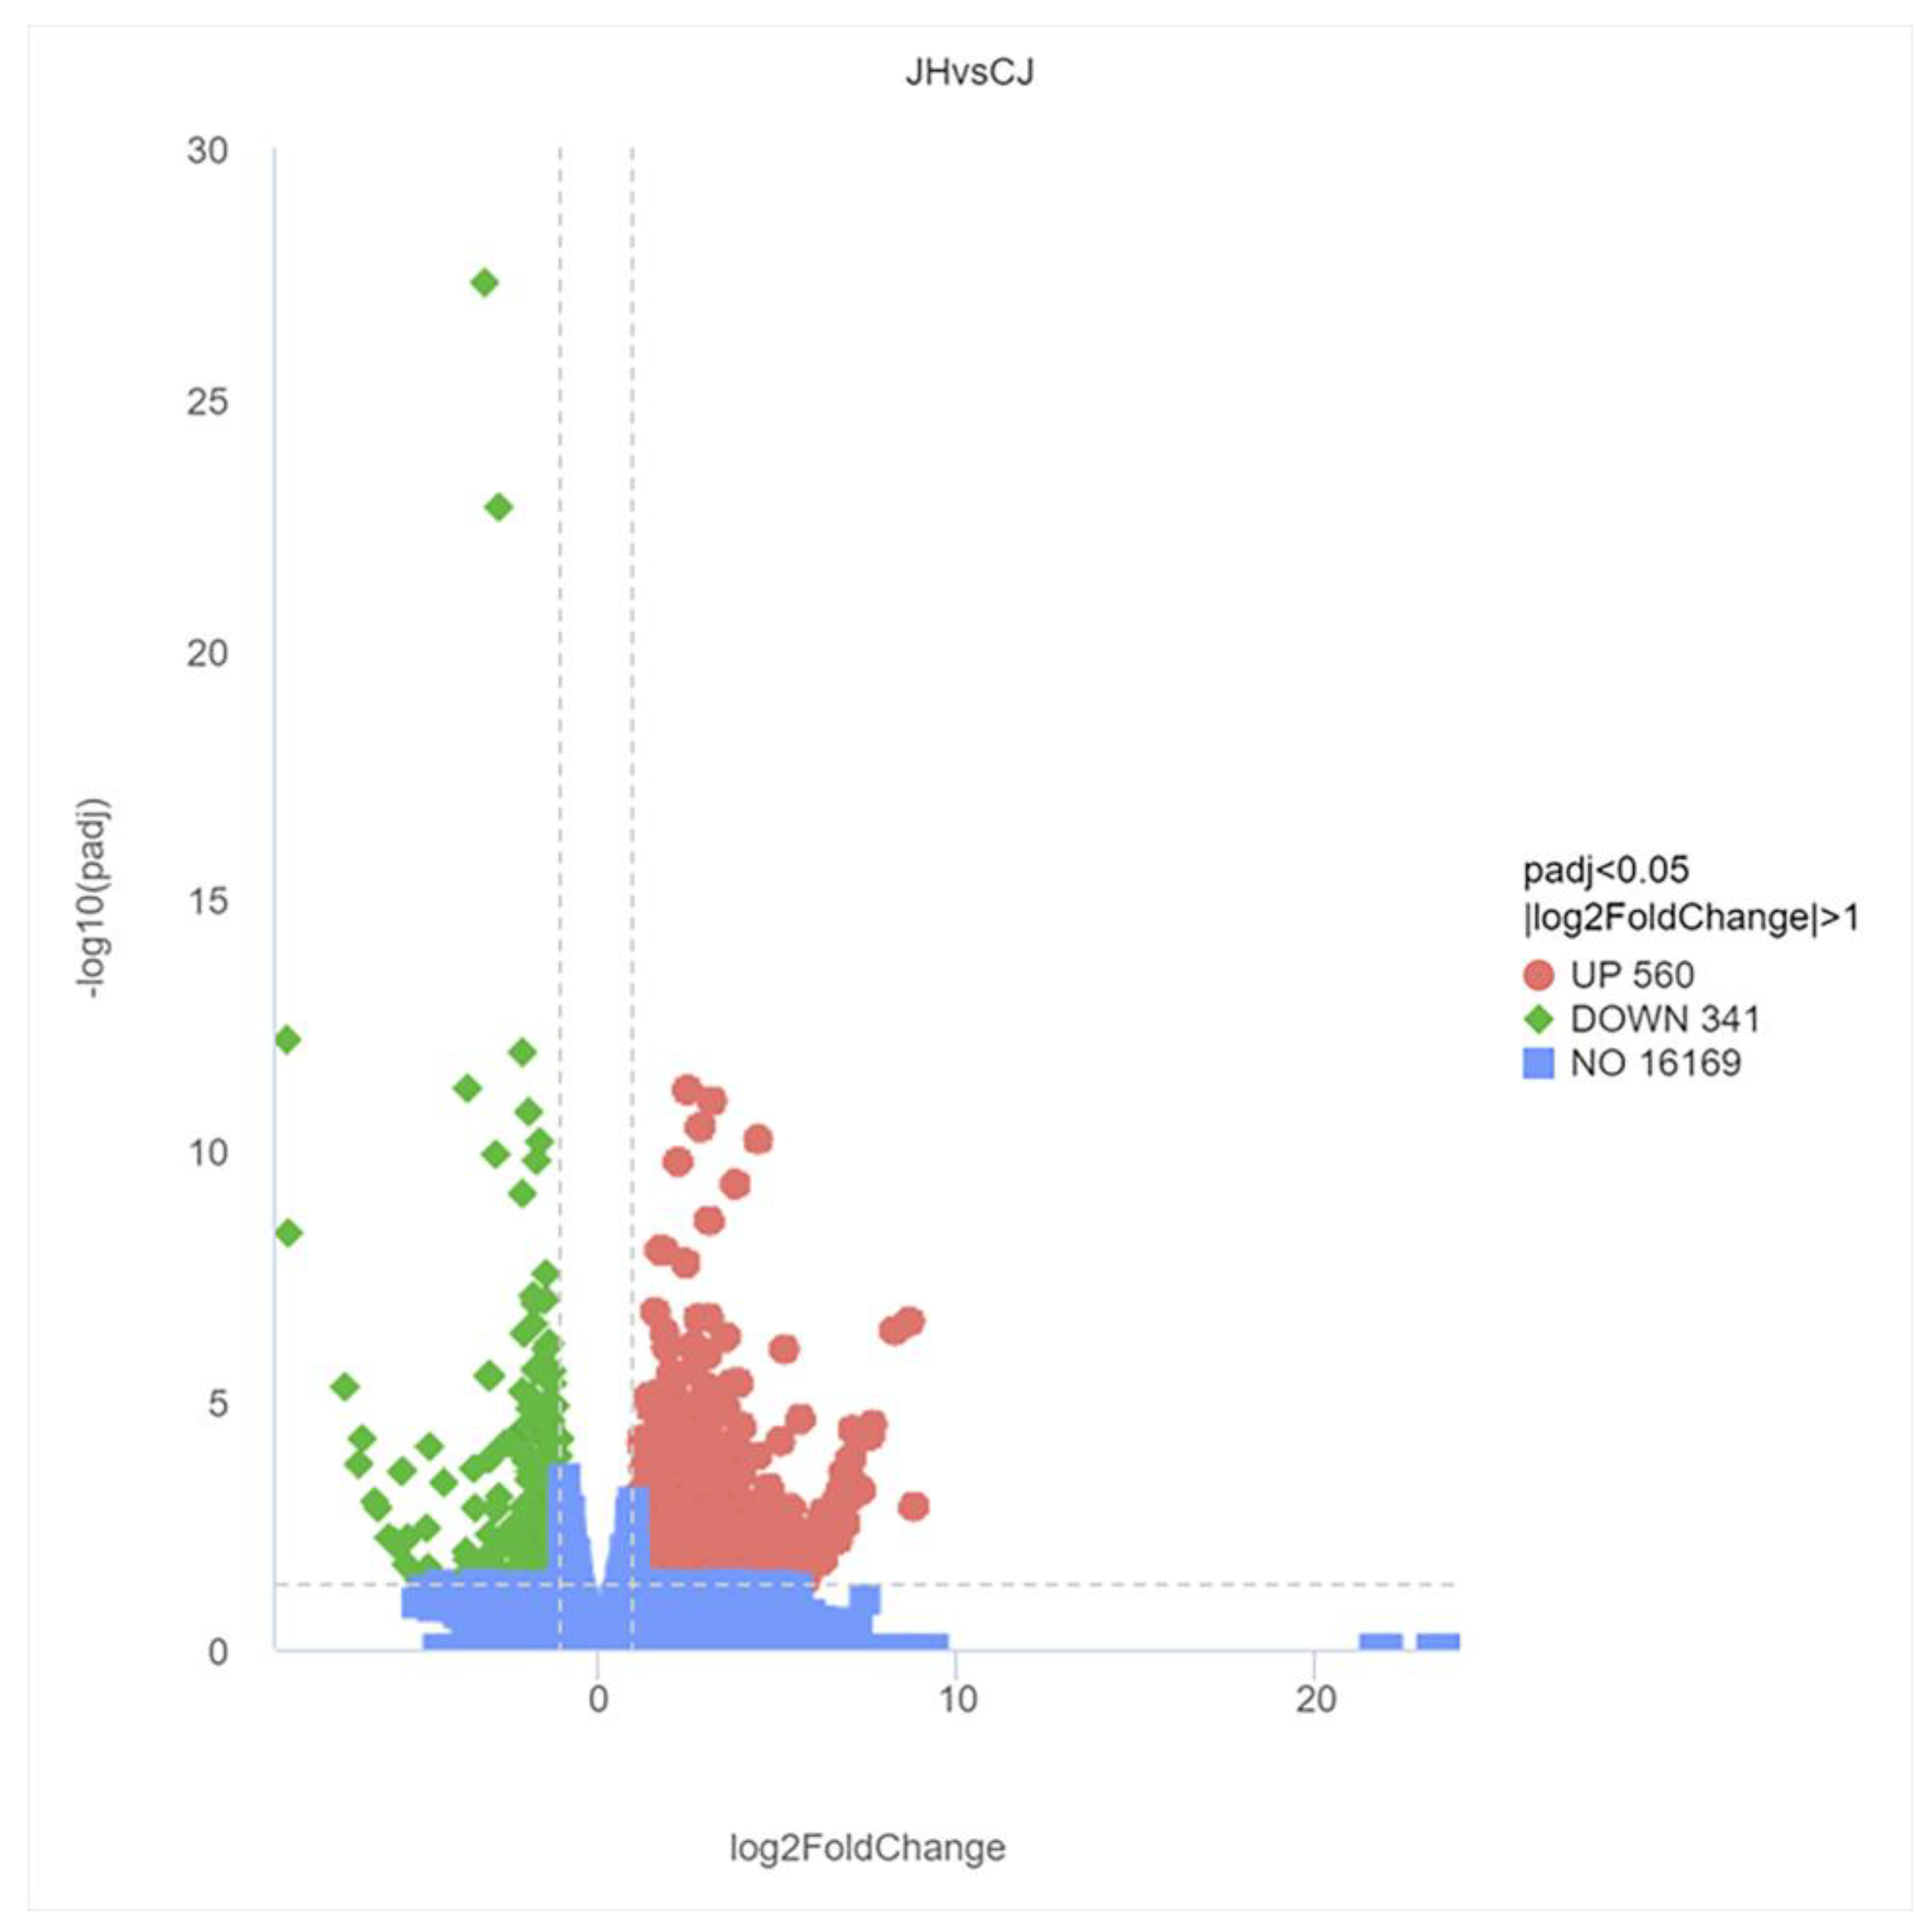
3.4. DEG Analysis
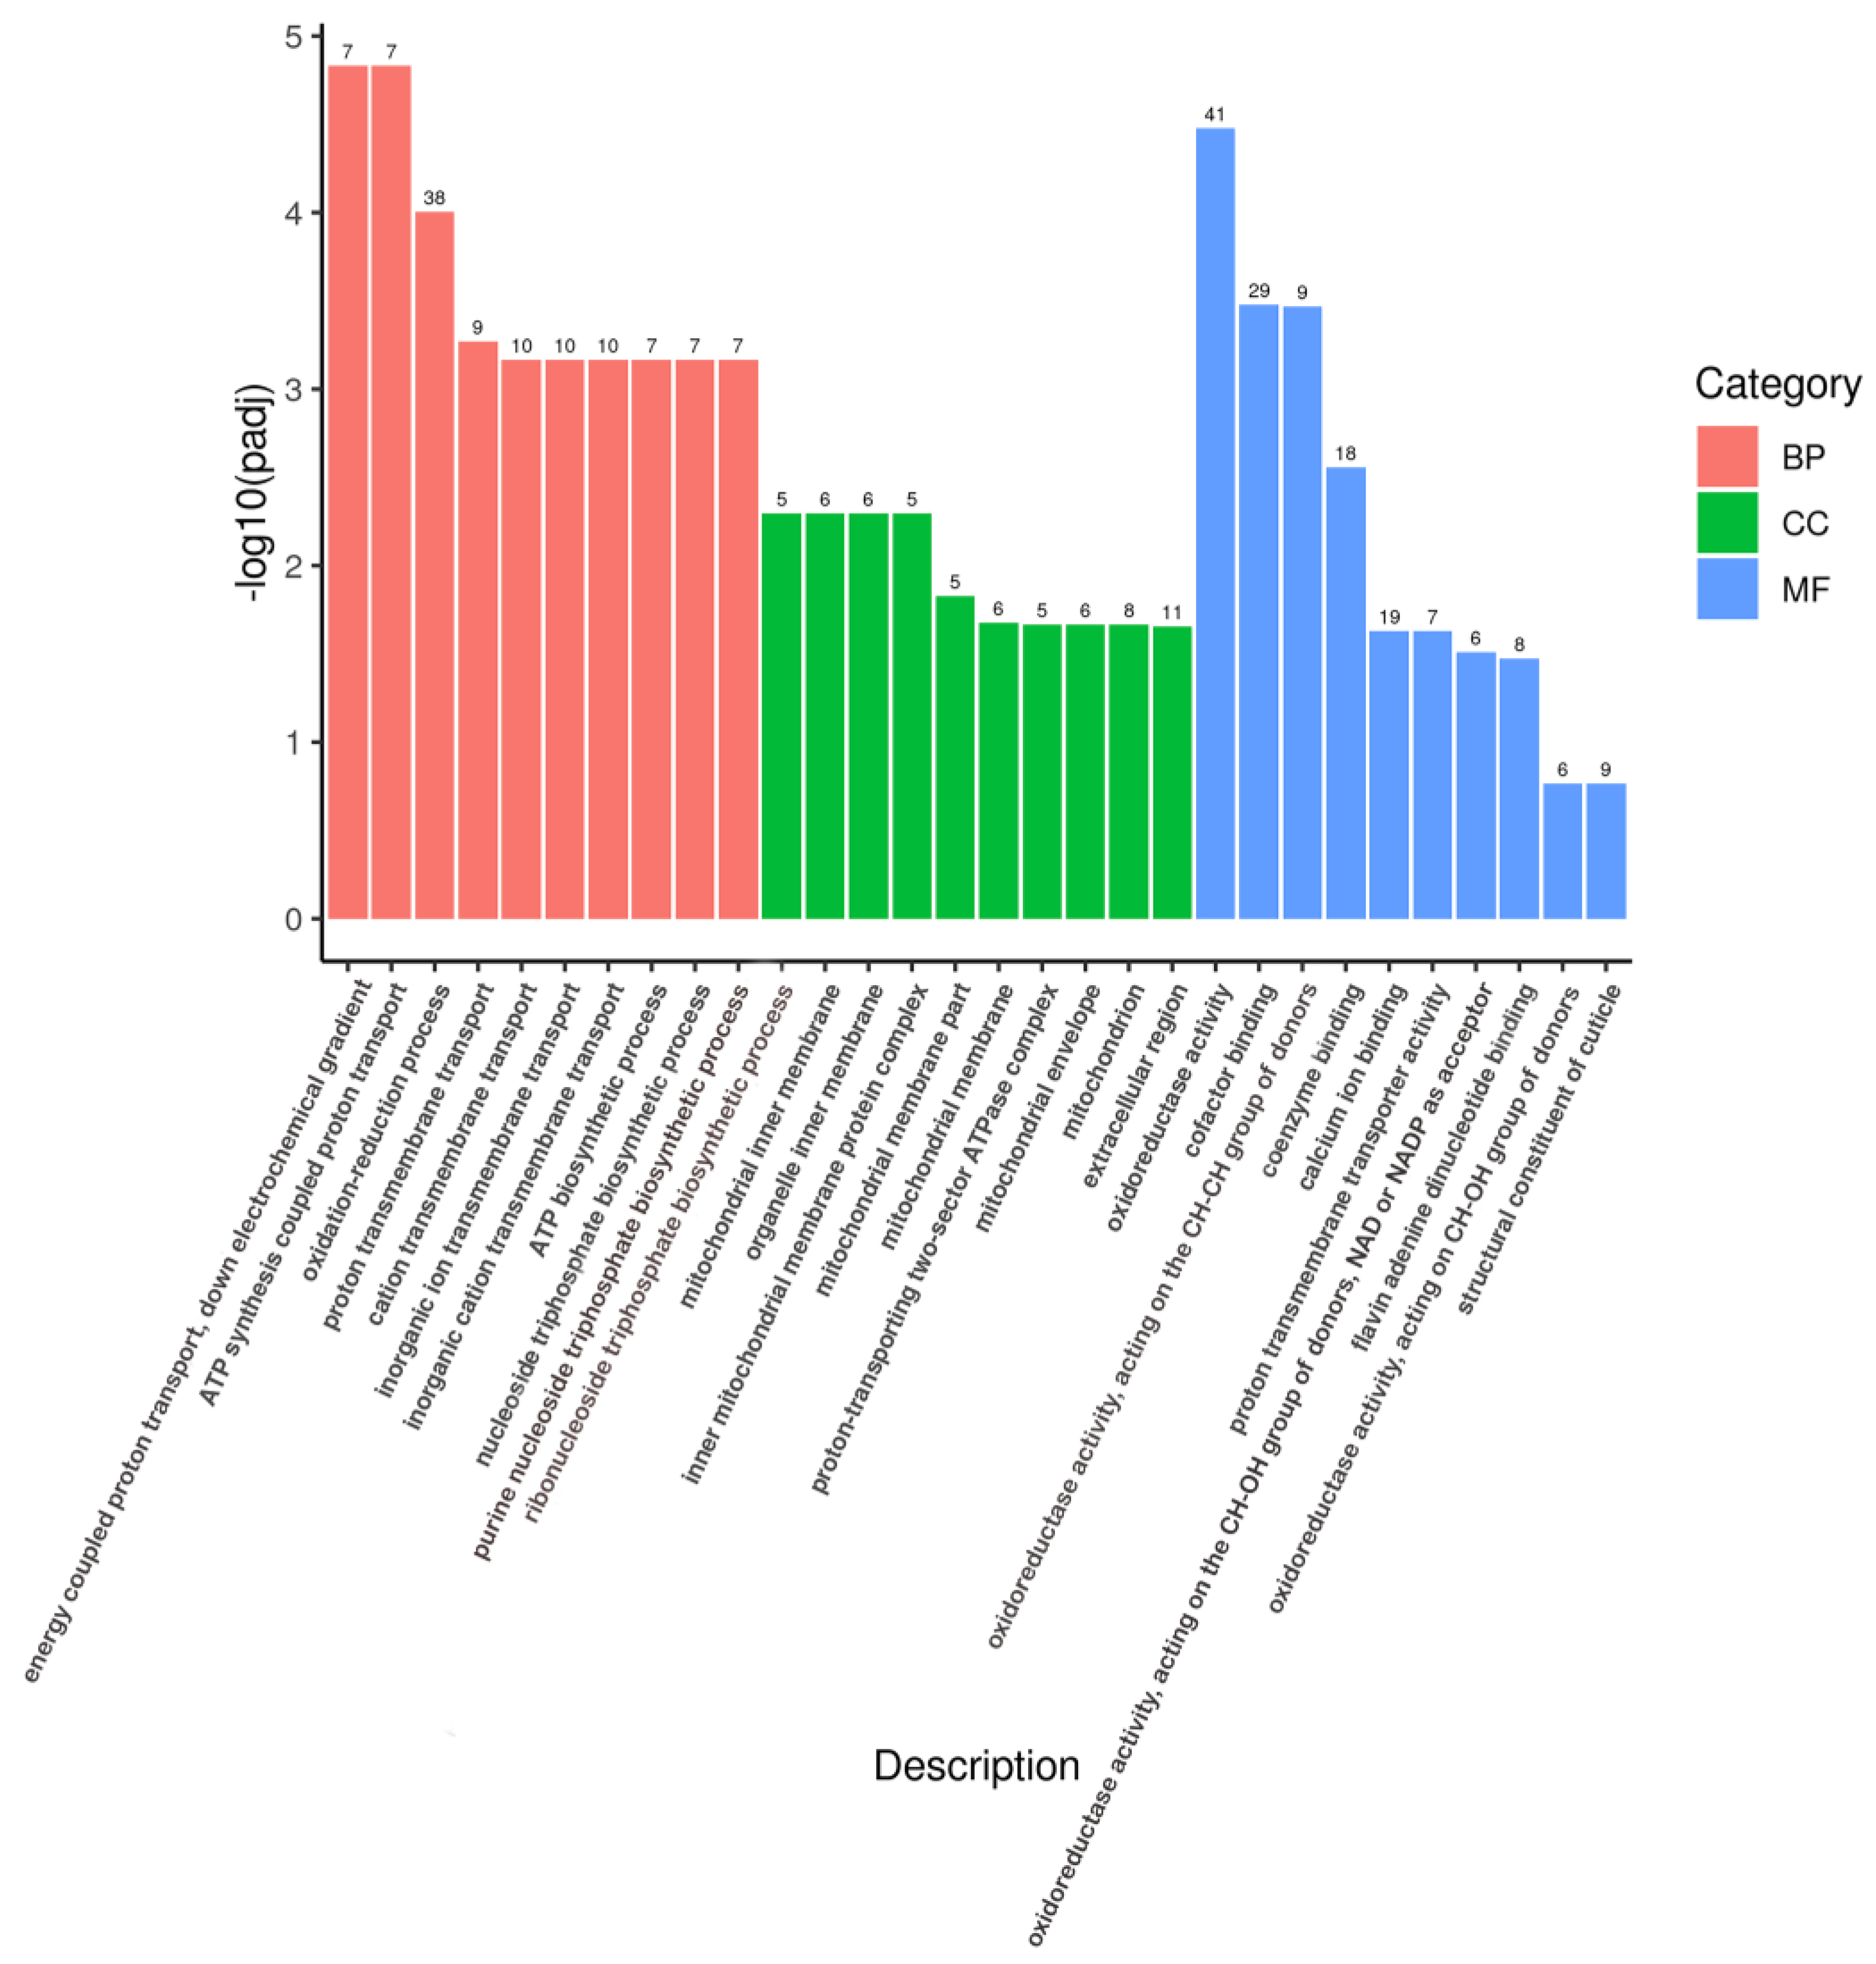
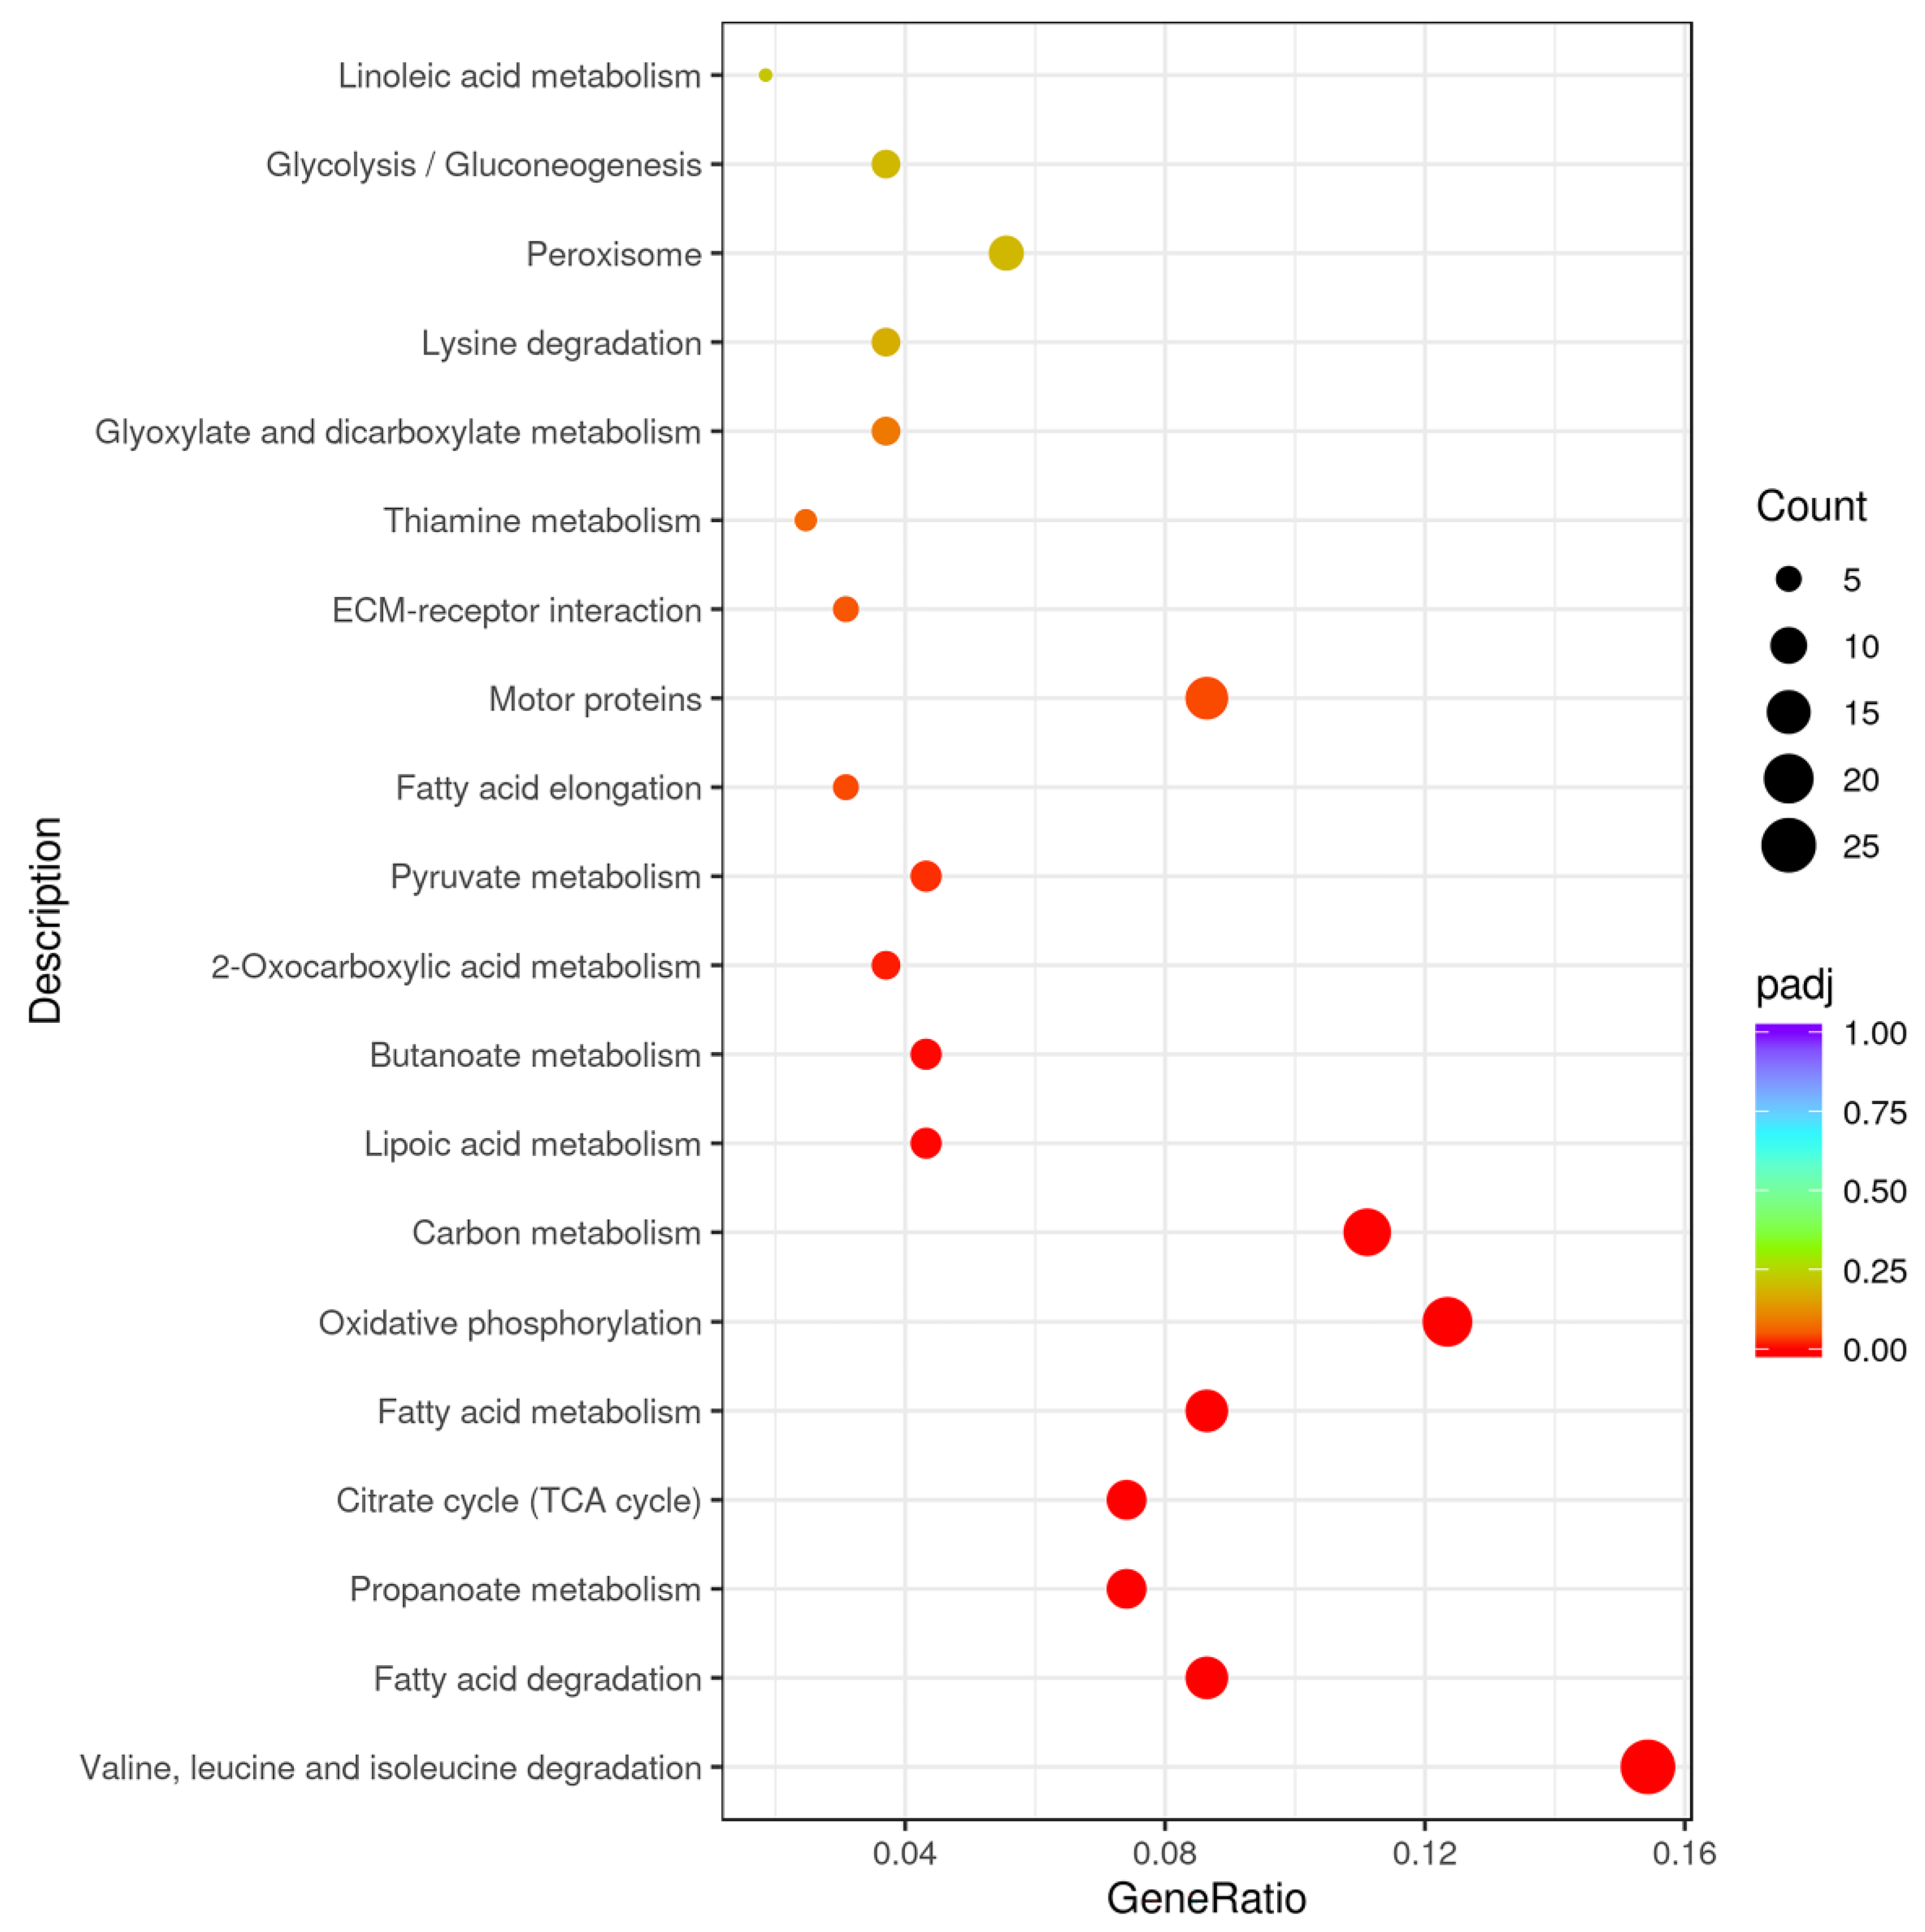
3.5. GO and KEGG Analysis of DEGs
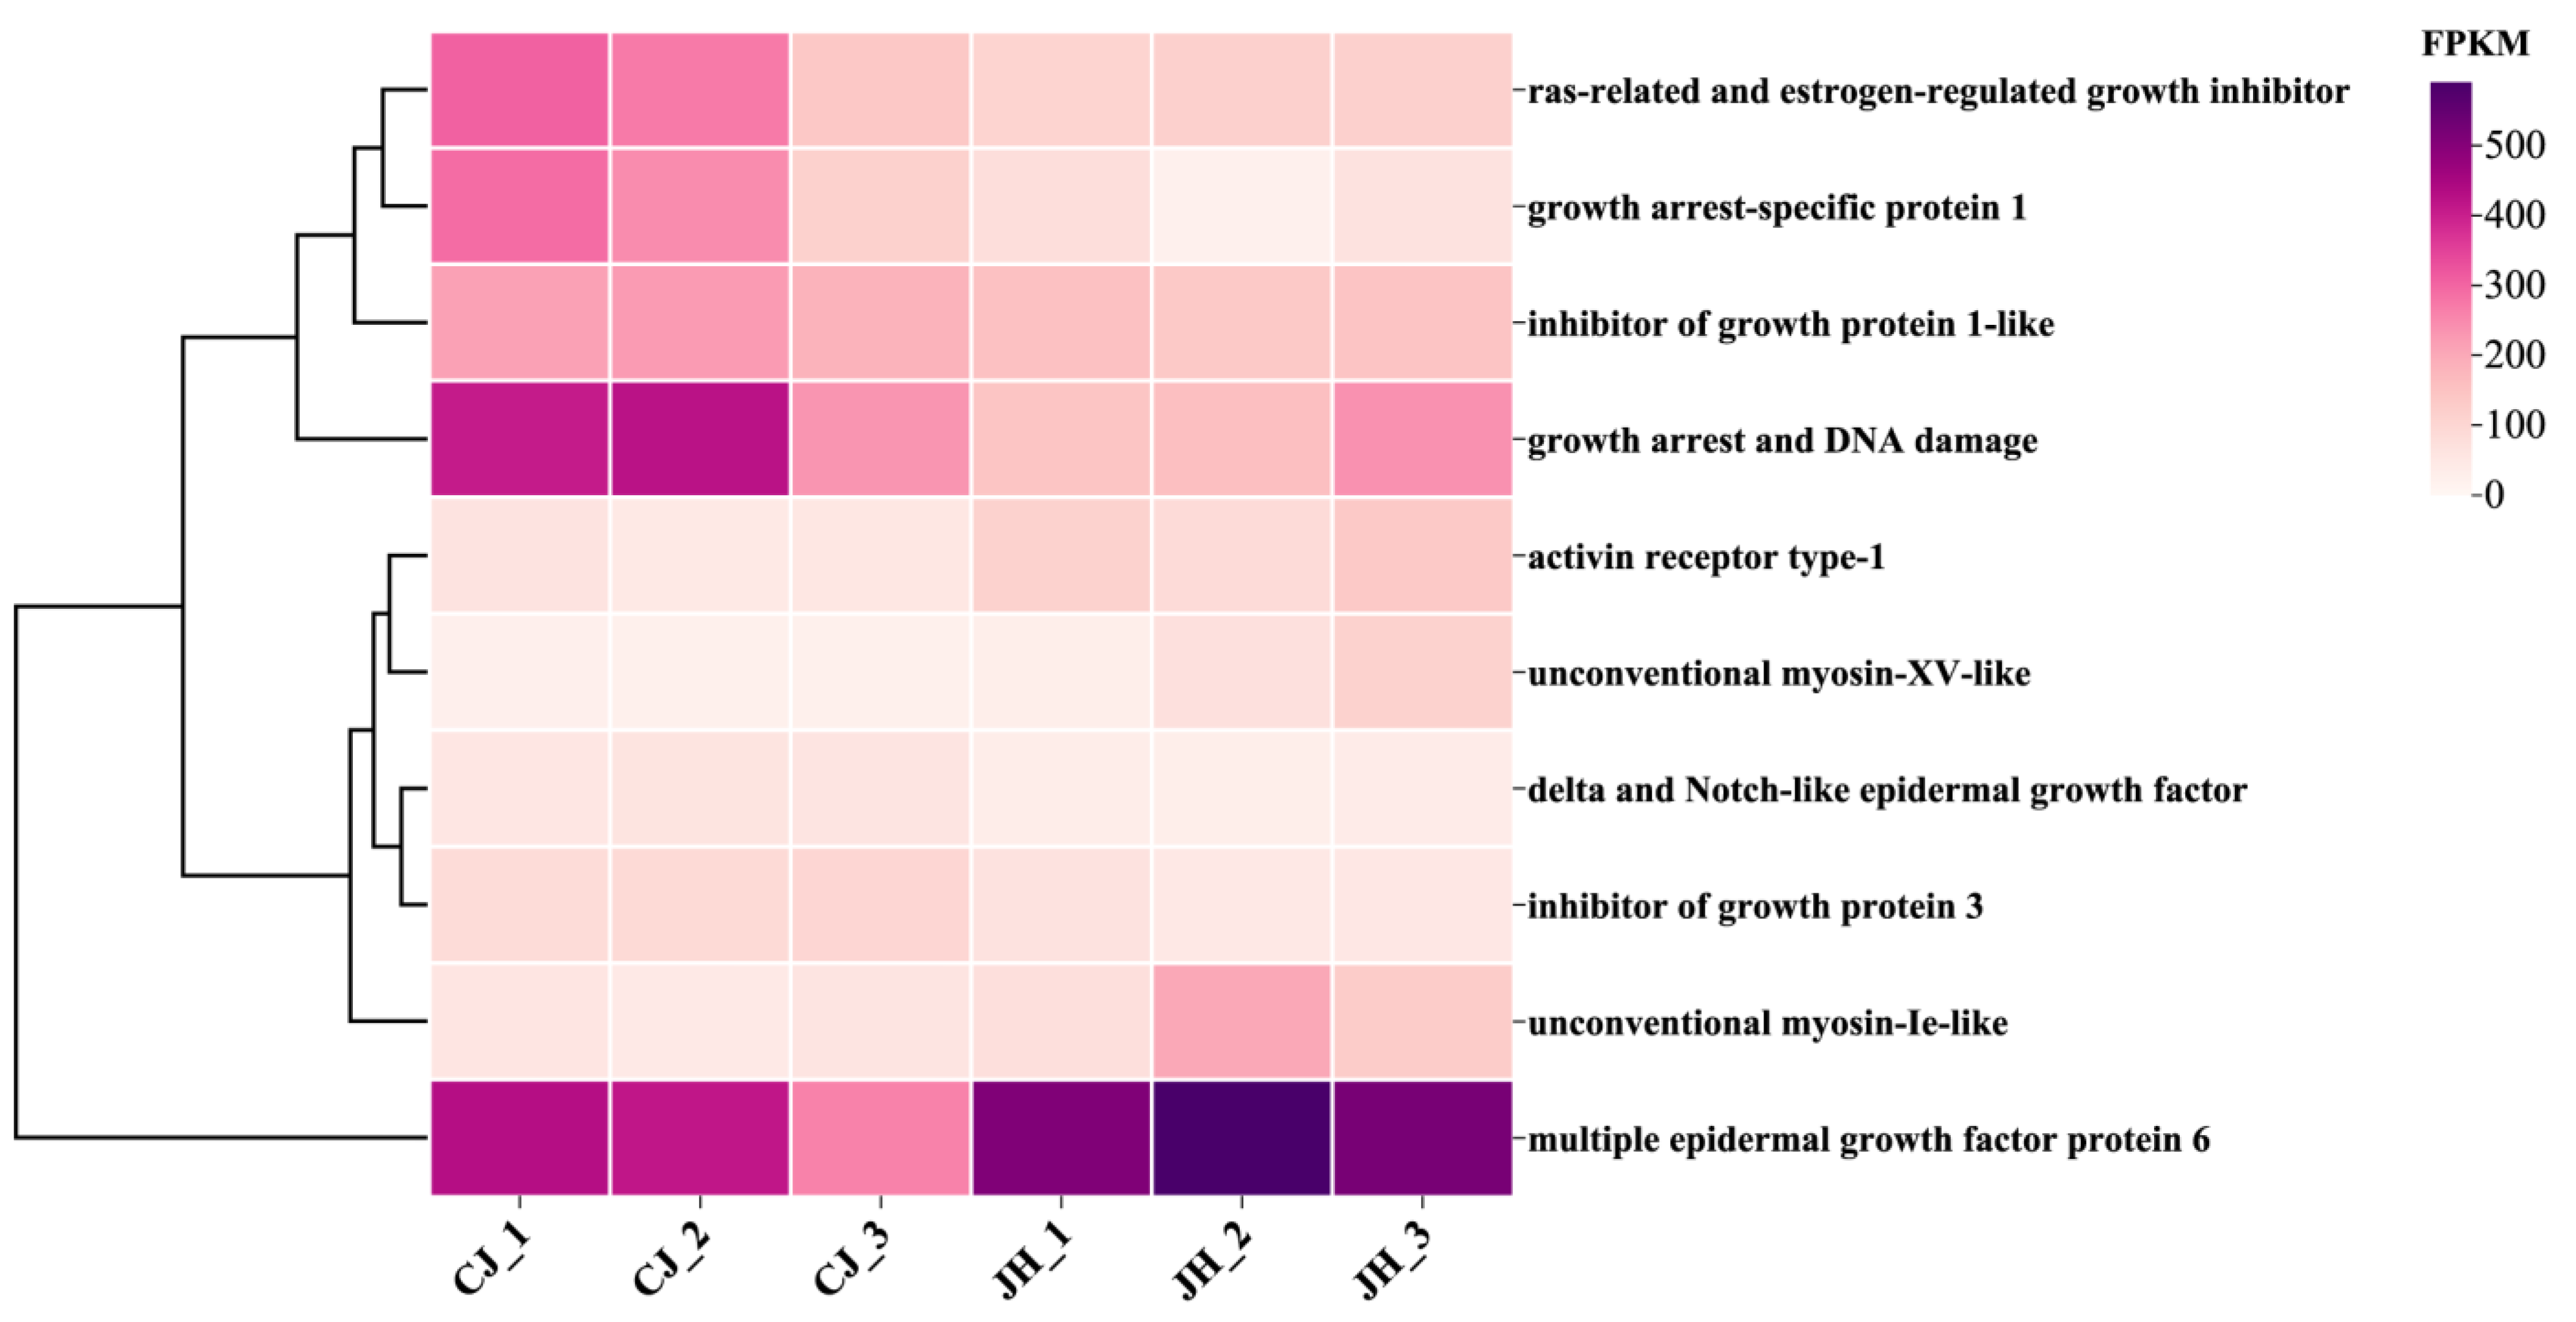
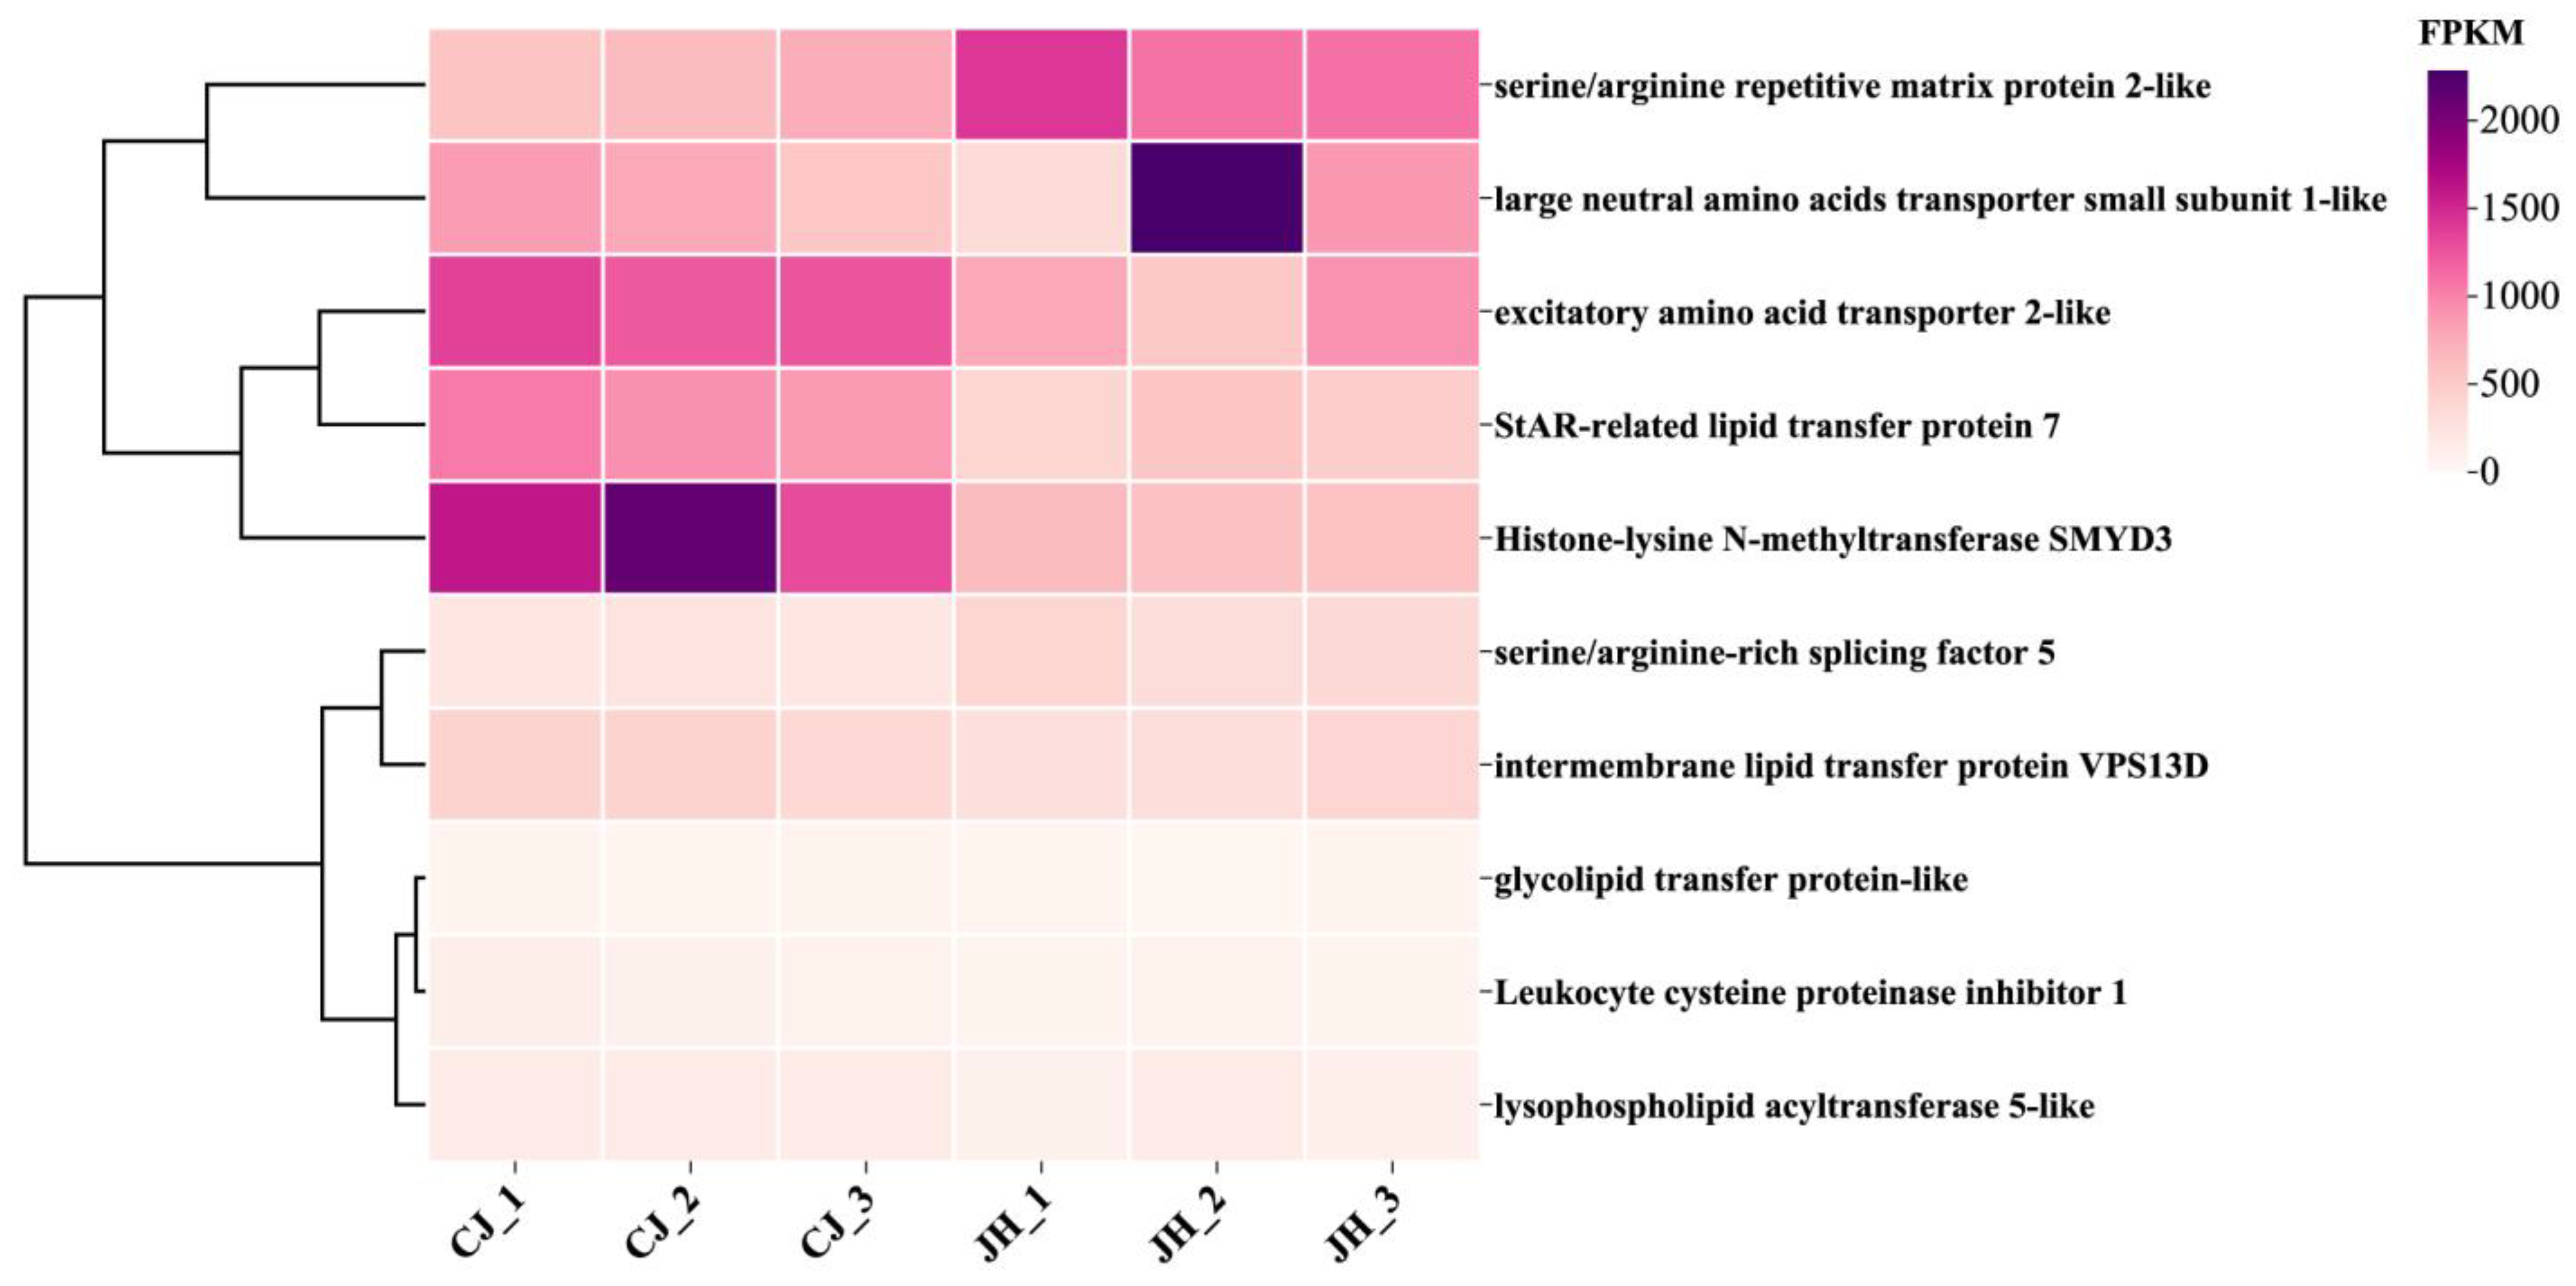
3.6. Clustering Heat Map Analysis of DEGs
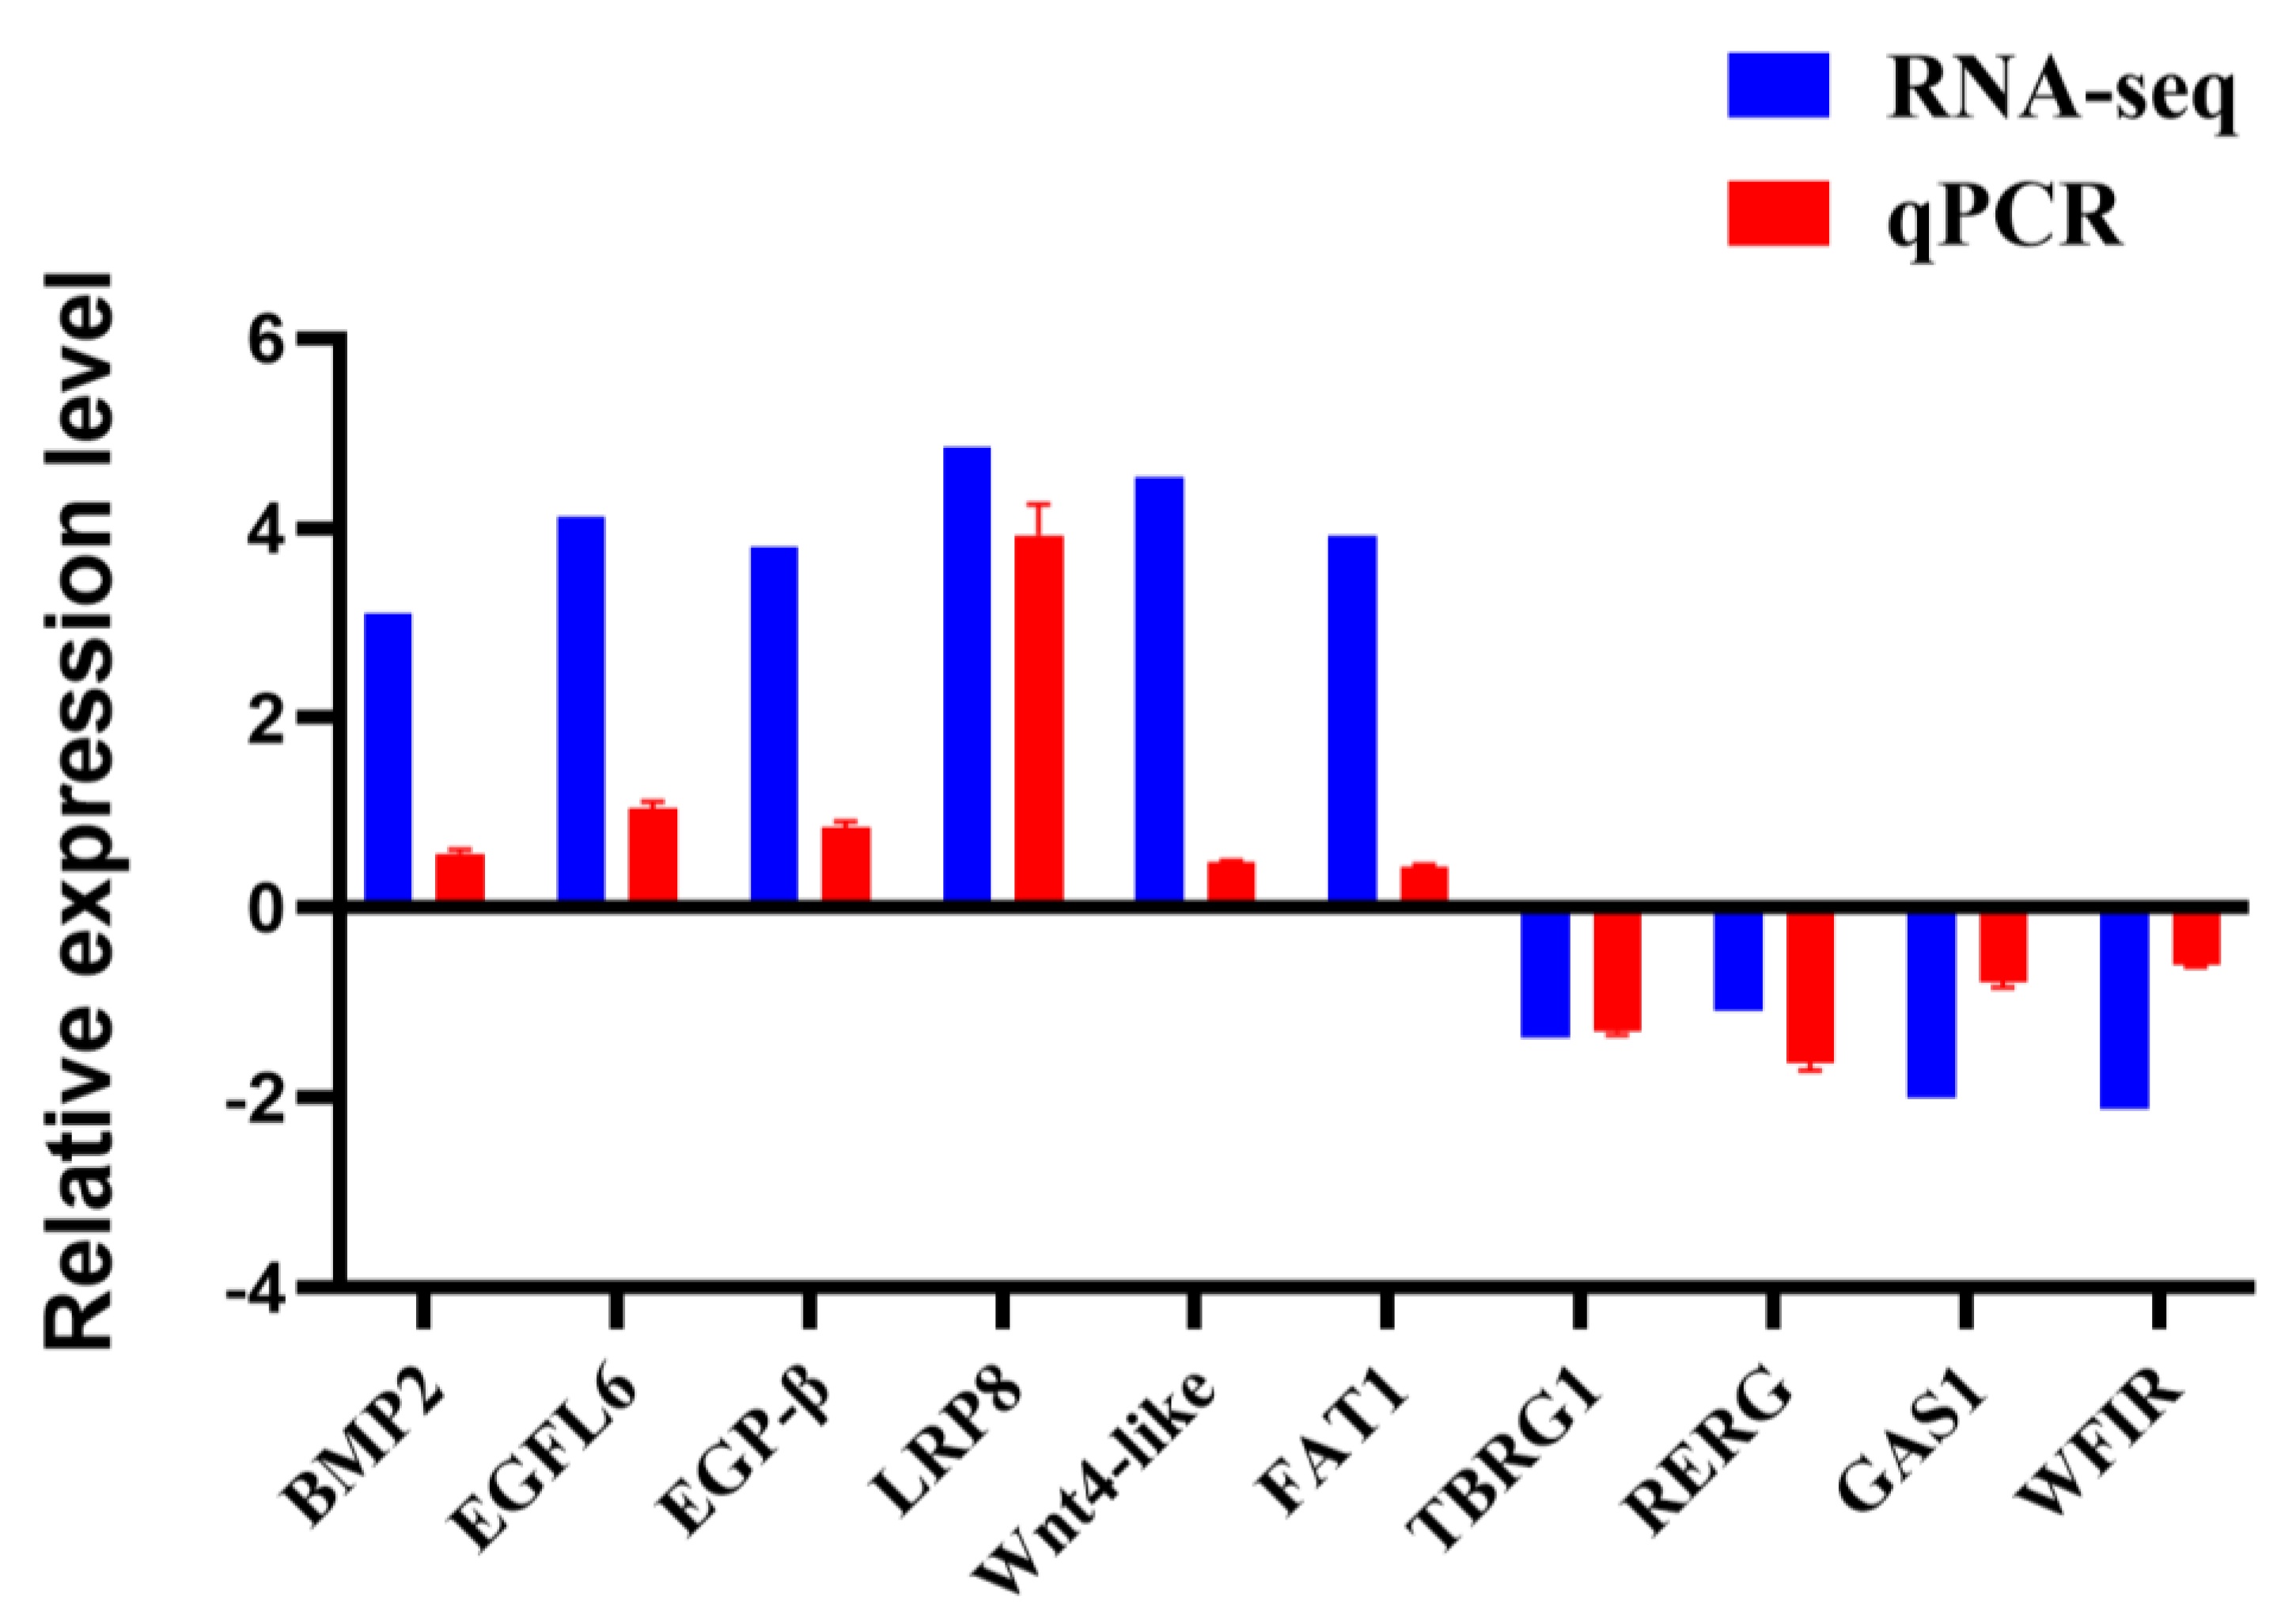
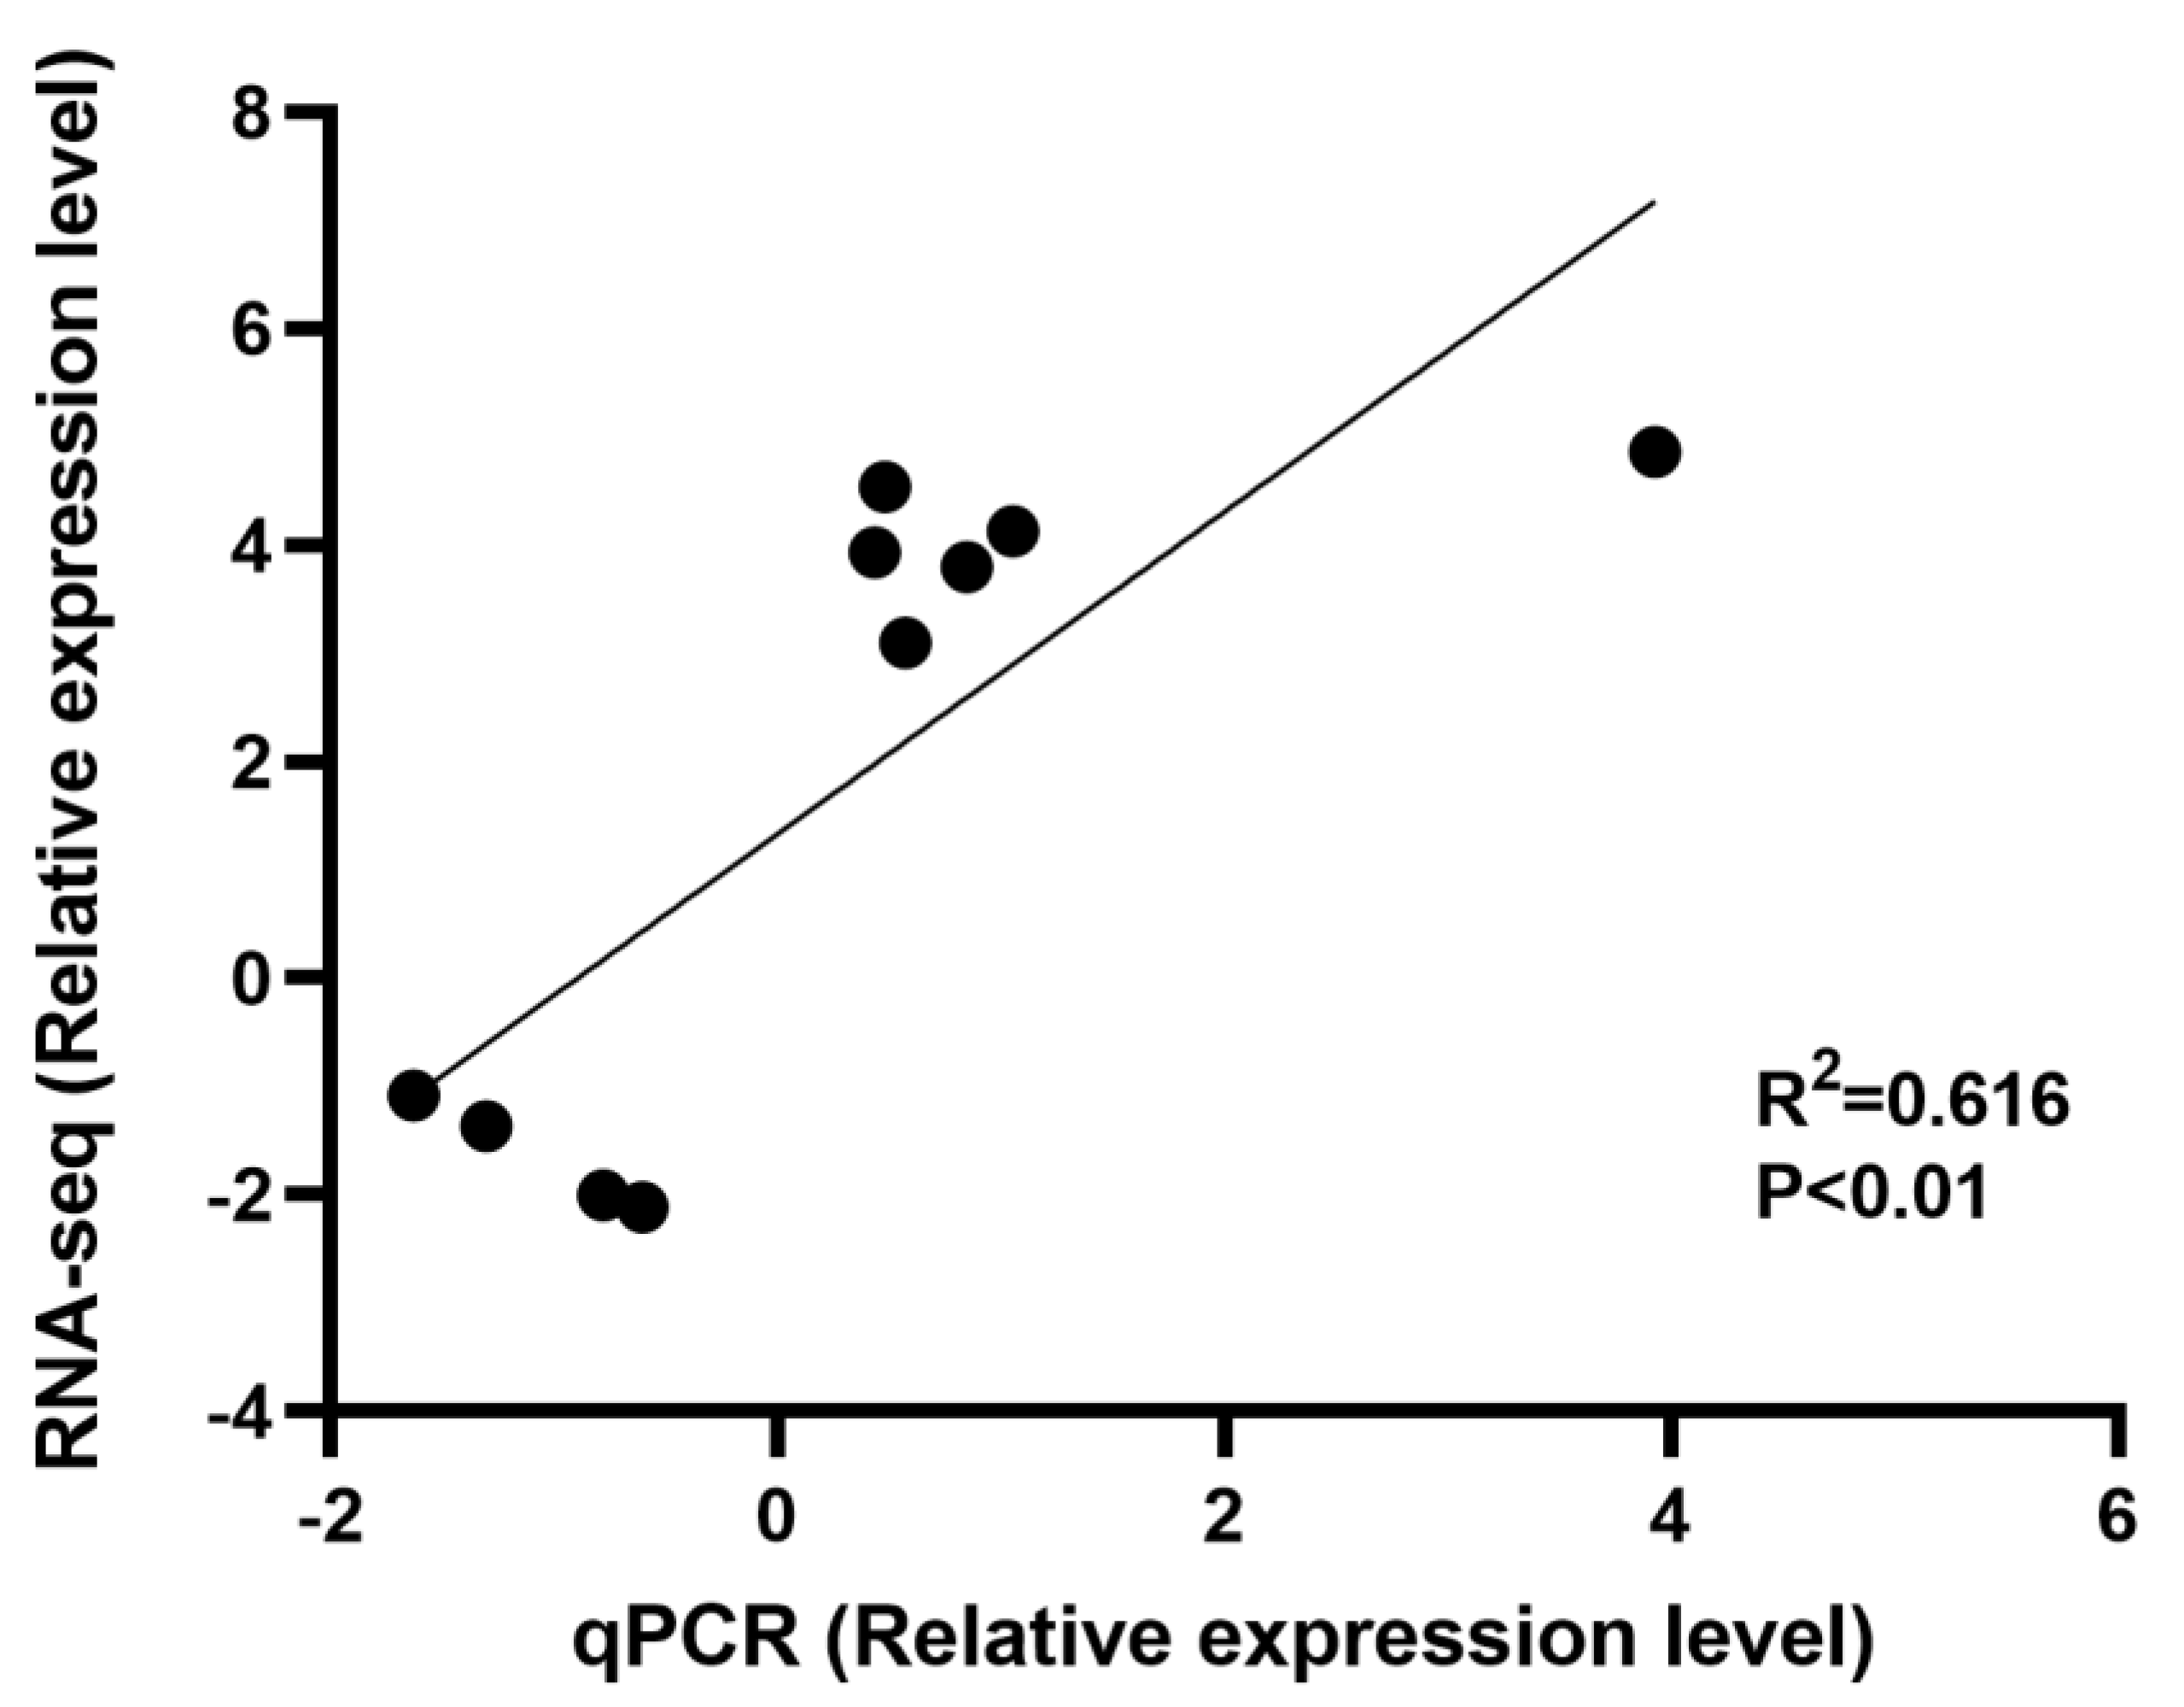
3.7. Validation of DEGs by qRT-PCR
4. Discussion
5. Conclusions
Supplementary Materials
Author Contributions
Funding
Institutional Review Board Statement
Data Availability Statement
Conflicts of Interest
References
- Gjedrem, T.; Akvaforsk, Å. Selection and Breeding Programs in Aquaculture; Springer: Berlin/Heidelberg, Germany, 2005; Volume 2005. [Google Scholar]
- Yue, G.H.; Tay, Y.X.; Wong, J.; Shen, Y.; Xia, J. Aquaculture species diversification in China. Aquac. Fish. 2023, 9, 206–217. [Google Scholar] [CrossRef]
- Jiang, K.; Chen, C.; Jiang, G.; Chi, Y.; Xu, C.; Kong, L.; Yu, H.; Liu, S.; Li, Q. Genetic improvement of oysters: Current status, challenges, and prospects. Rev. Aquac. 2023, 16, 796–817. [Google Scholar] [CrossRef]
- Duong, T.-Y.; Nguyen, N.-T.T.; Nguyen, T.T.; Huynh, L.T.T.; Bui, T.M.; Pham, L.T.; Dunham, R. Growth and survival of crossbreeds between wild and domestic strains of Mekong Delta bighead catfish (Clarias macrocephalus Günther, 1864) cultured in tanks. Aquaculture 2022, 547, 737507. [Google Scholar] [CrossRef]
- Ou, M.; Zhao, J.; Luo, Q.; Hong, X.; Zhu, X.; Liu, H.; Chen, K. Characteristics of hybrids derived from Channa argus ♀ × Channa maculata ♂. Aquaculture 2018, 492, 349–356. [Google Scholar] [CrossRef]
- Gladyshev, M.I.; Makhrov, A.A.; Sushchik, N.N.; Makhutova, O.N.; Rudchenko, A.E.; Balashov, D.A.; Vinogradov, E.V.; Artamonova, V.S. Differences in composition and fatty acid contents of different rainbow trout (Oncorhynchus mykiss) strains in similar and contrasting rearing conditions. Aquaculture 2022, 556, 738265. [Google Scholar] [CrossRef]
- Thanh, N.M.; Ponzoni, R.W.; Nguyen, N.H.; Vu, N.T.; Barnes, A.; Mather, P.B. Evaluation of growth performance in a diallel cross of three strains of giant freshwater prawn (Macrobrachium rosenbergii) in Vietnam. Aquaculture 2009, 287, 75–83. [Google Scholar] [CrossRef]
- Wang, X.; Zheng, R.-X.; Zhang, D.-M.; Lei, X.-Y.; Wang, S.; Wan, J.-W.; Liu, H.-J.; Chen, Y.-K.; Zhao, Y.-L.; Wang, G.-Q.; et al. Effects of different stocking densities on growth performance, nutritional quality and economic benefit of juvenile female Chinese mitten crab (Eriocheir sinensis) in rice-crab culture systems. Aquaculture 2022, 553, 738111. [Google Scholar] [CrossRef]
- Guo, H.; Hua, H.; Wang, J.; Qiang, W.; Xiang, X.; Liu, W.; Jiang, G. The Role of Cholesterol during the Ovarian Maturation and Lipid Metabolism of Female Chinese mitten crab (Eriocheir sinensis). Aquac. Nutr. 2024, 2024, 9933600. [Google Scholar] [CrossRef]
- Wang, D.; Fan, W.; Song, D.; Gao, H. Chinese Fishery Statistical Yearbook; Fisheries Agency of China Agriculture Ministry: Beijing, China, 2023. [Google Scholar]
- Deng, Y.F.; Xia, A.J.; Pan, J.L.; Li, Y.H.; Bai, R.F.; Zhu, Q.S. Breeding of the new variety of Eriocheir sinensis named “Changjiang 1”. J. Aquac. 2013, 34, 43–47. [Google Scholar]
- Fu, L.L.; Zhu, P. Healthy and efficient breeding technology of Chinese mitten crab “Changjiang 2”. J. Aquac. 2020, 41, 66–67+70. [Google Scholar]
- Wang, C.H.; Zhang, G.Y. Chinese mitten crab “Jianghai21”. China Fish. 2017, 01, 69–75. [Google Scholar]
- Xu, P.; Dong, Z.J.; Zhuang, H.G.; Zhu, W.B.; Guo, F.Y. Chinese mitten crab “Noah 1”. China Fish. 2017, 70–73. [Google Scholar]
- Tian, S.J.; Li, X.D.; Jiang, Y.S.; Liu, X.; Yang, H.W.; Yuan, Z.Z.; Zheng, Y. Microsatellite-enriched library construction and polymorphic microsatellite markerisolation in Chinese mitten crab Eriocheir sinensis strain “Guanghe 1”. J. Dalian Ocean. Univ. 2013, 28, 230–235. [Google Scholar]
- Wang, J.; Xu, P.; Zhou, G.; Li, X.; Lu, Q.; Liu, X.; Zhou, J.; Wang, C. Genetic improvement and breeding practices for Chinese mitten crab, Eriocheir sinensis. J. World Aquac. Soc. 2018, 49, 292–301. [Google Scholar] [CrossRef]
- Cui, W.; Ning, B. Development and application of crab culture in the development of Chinese mitten crab industry of Shanghai. Aquac. Res. 2019, 50, 367–375. [Google Scholar] [CrossRef]
- Han, W.; Sun, Y.; Liu, J.; Zhang, Y.; Lu, Z.; Cheng, Y. Effect of different feeding modes on the growth, biochemical composition, and living environment of the juvenile Chinese mitten crab Eriocheir sinensis. Aquaculture 2021, 541, 736687. [Google Scholar] [CrossRef]
- He, J.; Wu, X.; Li, J.; Huang, Q.; Huang, Z.; Cheng, Y. Comparison of the culture performance and profitability of wild-caught and captive pond-reared Chinese mitten crab (Eriocheir sinensis) juveniles reared in grow-out ponds: Implications for seed selection and genetic selection programs. Aquaculture 2014, 434, 48–56. [Google Scholar] [CrossRef]
- Zhang, B.Y.; Fang, W.H.; Zhu, R.; Wang, N.; Yao, Q.; Liu, H.J.; Wan, J.W.; Chen, Y.K.; Wang, Q.J.; Zhang, D.M. Comparative Study on Growth Index and Nutritional Quality of Female Chinese mitten crab Eriocheir sinensis Selected at Different Growth Periods in Rice-Crab Culture Systems. Aquac. Nutr. 2023, 2023, 4805919. [Google Scholar] [CrossRef] [PubMed]
- Wan, J.-J.; Pan, J.-L.; Shen, M.-F.; Xue, H.; Sun, M.-L.; Zhang, M.-Q.; Zhu, X.-H.; Ma, X.-K. Changes in the growth performance, antioxidant enzymes and stress resistance caused by dietary administration of synbiotic (fructooligosaccharide and probiotics) in juvenile Chinese mitten crab, Eriocheir sinensis. Aquac. Int. 2022, 30, 467–481. [Google Scholar] [CrossRef]
- Wang, Q.; Wu, X.; Long, X.; Zhu, W.; Ma, T.; Cheng, Y. Nutritional quality of different grades of adult male chinese mitten crab, Eriocheir sinensis. J. Food Sci. Technol. 2018, 55, 944–955. [Google Scholar] [CrossRef]
- Czerniejewski, P.; Bienkiewicz, G.; Tokarczyk, G. Nutritional Quality and Fatty Acids Composition of Invasive Chinese Mitten Crab from Odra Estuary (Baltic Basin). Foods 2023, 12, 3088. [Google Scholar] [CrossRef] [PubMed]
- Tang, M.; Qu, Z.; Shi, W.; Wang, X.; Wu, X. A comparative study on the flavour of wild Chinese mitten crab (Eriocheir sinensis) along the eastern coast of China. J. Food Compos. Anal. 2024, 127, 105949. [Google Scholar] [CrossRef]
- Wu, H.; Ge, M.; Chen, H.; Jiang, S.; Lin, L.; Lu, J. Comparison between the nutritional qualities of wild-caught and rice-field male Chinese mitten crabs (Eriocheir sinensis). LWT 2020, 117, 108663. [Google Scholar] [CrossRef]
- Yi, X.; Gao, J.; Li, L.; Du, J.; Nie, Z.; Zhang, X.; Xu, G. Effects of fattening diets on the nutritional quality and flavor of the adult female Chinese mitten crab (Eriocheir sinensis). Aquac. Rep. 2022, 25, 101223. [Google Scholar] [CrossRef]
- Wang, S.; Wang, Y.; Wu, X.; Zhang, X.; Zhao, J.; Yang, J.; Cheng, Y. Gonadal development and biochemical composition of Chinese mitten crabs (Eriocheir sinensis) from four sources. J. Food Sci. 2021, 86, 1066–1080. [Google Scholar] [CrossRef] [PubMed]
- Wang, S.; He, Y.; Wang, Y.; Tao, N.; Wu, X.; Wang, X.; Qiu, W.; Ma, M. Comparison of flavour qualities of three sourced Eriocheir sinensis. Food Chem. 2016, 200, 24–31. [Google Scholar] [CrossRef] [PubMed]
- Wang, T.; Yang, C.; Zhang, T.; Liang, H.; Ma, Y.; Wu, Z.; Sun, W. Immune defense, detoxification, and metabolic changes in juvenile Eriocheir sinensis exposed to acute ammonia. Aquat. Toxicol. 2021, 240, 105989. [Google Scholar] [CrossRef]
- Tian, Z.; Jiao, C. Molt-dependent transcriptome analysis of claw muscles in Chinese mitten crab Eriocheir sinensis. Genes Genom. 2019, 41, 515–528. [Google Scholar] [CrossRef]
- Shen, M.; Wang, Y.; Zhu, F.; Wei, M.; Xu, D.; Zhang, C.; Du, S.; Jiang, J.; Zhou, J.; Zhang, Z.; et al. Integrative transcriptomic and metabolomic analysis reveals the effects of a sudden drop in salinity on osmoregulation, metabolism, anti-oxidation, and immunity in Eriocheir sinensis megalopa and juvenile stages. Aquac. Rep. 2023, 31, 101656. [Google Scholar] [CrossRef]
- Mescher, A.L. The cellular basis of limb regeneration in urodeles. Int. J. Dev. Biol. 2004, 40, 785–795. [Google Scholar]
- Qi, H.-Y.; Li, Z.-F.; Wang, L.-M.; Zhao, Z.; Wang, J.-M.; Tan, F.-Q.; Yang, W.-X. Myosin VI stabilizes intercellular junctions in the testis through the LHR and MAPK signalling pathway during spermatogenesis in Eriocheir sinensis. Int. J. Biol. Macromol. 2023, 248, 125842. [Google Scholar] [CrossRef] [PubMed]
- Dvoretsky, A.G.; Bichkaeva, F.A.; Baranova, N.F.; Dvoretsky, V.G. Fatty acid composition of the Barents Sea red king crab (Paralithodes camtschaticus) leg meat. J. Food Compos. Anal. 2021, 98, 103826. [Google Scholar] [CrossRef]
- Zhang, Y.; Sully, P.; Spitzer, L.; Dutilleul, P.; Simpson, B.K. Comprehensive biorefinery of invasive European green crab (Carcinus maenas) into multiple high-value biomolecules. J. Clean. Prod. 2022, 374, 134052. [Google Scholar] [CrossRef]
- Bernal Astrain, G.; Nikolova, M.; Smith, M.J. Functional diversity in the RAS subfamily of small GTPases. Biochem. Soc. Trans. 2022, 50, 921–933. [Google Scholar] [CrossRef] [PubMed]
- Li, Q.; Qin, Y.; Wei, P.; Lian, P.; Li, Y.; Xu, Y.; Li, X.; Li, D.; Cai, S. Gas1 Inhibits Metastatic and Metabolic Phenotypes in Colorectal Carcinoma. Mol. Cancer Res. 2016, 14, 830–840. [Google Scholar] [CrossRef] [PubMed]
- Jia, Z.; Wang, M.; Wang, X.; Wang, L.; Song, L. The receptor for activated C kinase 1 (RACK1) functions in hematopoiesis through JNK activation in Chinese mitten crab Eriocheir sinensis. Fish Shellfish. Immunol. 2016, 57, 252–261. [Google Scholar] [CrossRef]
- Fili, N.; Toseland, C.P. Unconventional Myosins: How Regulation Meets Function. Int. J. Mol. Sci. 2020, 21, 67. [Google Scholar] [CrossRef]
- Shen, J.; Sun, Y.; Liu, X.; Zhu, Y.; Bao, B.; Gao, T.; Chai, Y.; Xu, J.; Zheng, X. EGFL6 regulates angiogenesis and osteogenesis in distraction osteogenesis via Wnt/β-catenin signaling. Stem Cell Res. Ther. 2021, 12, 415. [Google Scholar] [CrossRef]
- Xie, N.; Tian, J.; Meng, X.; Dong, L.; Jiang, M.; Wen, H.; Lu, X. DNA methylation profiling and transcriptome sequencing reveal the molecular mechanism of the high-carbohydrate diet on muscle growth of grass carp (Ctenopharyngodon idella). Aquac. Rep. 2023, 30, 101545. [Google Scholar] [CrossRef]
- Veldsman, W.P.; Ma, K.Y.; Hui, J.H.L.; Chan, T.F.; Baeza, J.A.; Qin, J.; Chu, K.H. Comparative genomics of the coconut crab and other decapod crustaceans: Exploring the molecular basis of terrestrial adaptation. BMC Genom. 2021, 22, 313. [Google Scholar] [CrossRef]
- Wan, Y.; Wang, Y.; Shi, Z.; Rentsch, D.; Ward, J.L.; Hassall, K.; Sparks, C.A.; Huttly, A.K.; Buchner, P.; Powers, S.; et al. Wheat amino acid transporters highly expressed in grain cells regulate amino acid accumulation in grain. PLoS ONE 2021, 16, e0246763. [Google Scholar] [CrossRef] [PubMed]
- Galano, M.; Venugopal, S.; Papadopoulos, V. Role of STAR and SCP2/SCPx in the Transport of Cholesterol and Other Lipids. Int. J. Mol. Sci. 2022, 23, 2115. [Google Scholar] [CrossRef] [PubMed]
- Sultan, T.; Scorrano, G.; Panciroli, M.; Christoforou, M.; Raza Alvi, J.; Di Ludovico, A.; Qureshi, S.; Efthymiou, S.; Salpietro, V.; Houlden, H. Clinical and molecular heterogeneity of VPS13D-related neurodevelopmental and movement disorders. Gene 2024, 899, 148119. [Google Scholar] [CrossRef] [PubMed]


| WT (°C) | NH3−N (mg/L) | NO2−N (mg/L) | pH | DO (mg/L) | S(−II) (mg/L) | PO43− (mg/L) | |
|---|---|---|---|---|---|---|---|
| Standard limit | Weekly difference 1~2 | ≤1.0 | ≤0.10 | 6–9 | ≥5 | ≤0.20 | ≤0.05 |
| E. sinensis “Changjiang 2” | |||||||
| 30th | 12.25 ± 0.01 | 0.07 ± 0.10 | 0.012 ± 0.005 | 7.46 ± 0.18 | 7.24 ± 0.11 | 0.008 ± 0.004 | 0.001 ± 0.005 |
| 60th | 15.57 ± 0.03 | 0.04 ± 0.01 | 0.006 ± 0.002 | 7.21 ± 0.15 | 7.54 ± 0.07 | 0.015 ± 0.008 | 0.003 ± 0.001 |
| 90th | 23.26 ± 0.01 | 0.01 ± 0.02 | 0.005 ± 0.003 | 6.32 ± 0.13 | 6.32 ± 0.04 | 0.007 ± 0.013 | 0.042 ± 0.006 |
| 150th | 28.02 ± 0.05 | 0.02 ± 0.05 | 0.015 ± 0.010 | 8.02 ± 0.07 | 8.02 ± 0.16 | 0.011 ± 0.004 | 0.035 ± 0.012 |
| 240th | 14.66 ± 0.02 | 0.05 ± 0.04 | 0.007 ± 0.007 | 7.02 ± 0.09 | 7.01 ± 0.26 | 0.003 ± 0.002 | 0.004 ± 0.001 |
| E. sinensis “Jianghai 21” | |||||||
| 30th | 12.68 ± 0.05 | 0.01 ± 0.13 | 0.004 ± 0.005 | 8.07 ± 0.06 | 8.68 ± 0.15 | 0.008 ± 0.001 | 0.002 ± 0.004 |
| 60th | 15.79 ± 0.08 | 0.05 ± 0.07 | 0.003 ± 0.006 | 8.54 ± 0.05 | 7.97 ± 0.13 | 0.009 ± 0.003 | 0.001 ± 0.001 |
| 90th | 23.69 ± 0.03 | 0.08 ± 0.02 | 0.002 ± 0.004 | 8.64 ± 0.17 | 8.67 ± 0.24 | 0.004 ± 0.024 | 0.004 ± 0.003 |
| 150th | 28.90 ± 0.02 | 0.01 ± 0.04 | 0.003 ± 0.015 | 8.25 ± 0.01 | 8.00 ± 0.04 | 0.002 ± 0.012 | 0.036 ± 0.018 |
| 240th | 14.12 ± 0.01 | 0.10 ± 0.06 | 0.001 ± 0.009 | 7.64 ± 0.12 | 8.12 ± 0.03 | 0.001 ± 0.002 | 0.006 ± 0.002 |
| Programs | ||
|---|---|---|
| Crab species | “Changjiang 2” | “Jianghai 21” |
| Seeding time | 2023.2.28 | 2023.2.28 |
| Crab specifications (g) | 6.25 ± 1.23 | 6.86 g ± 1.04 |
| Stocking density (inds/m2) | 2.1 | 2.1 |
| Types of aquatic plants | Elodea, black algae | Elodea, black algae |
| Primer Name | Primer Sequence/5′–3′ | Product Length/bp | Genbank Accession |
|---|---|---|---|
| BMP2-F | ACGGACCAGAGGACAAAG | 181 | XM050832375.1 |
| BMP2-R | GAACGGCGAGCATCAA | ||
| EGFL6-F | CCTGTGACCCTGAGACG | 263 | XM050832091.1 |
| EGFL6-R | GTGGCAGATGGCTTCG | ||
| EGF-β-F | TTTGTCCCTGATGTGAATG | 270 | NC066537.1 |
| EGF-β-R | CACGAAGGAGCCGAAC | ||
| LRP8-F | TCCGTCACCAGCACCA | 164 | XM050830481.1 |
| LRP8-R | CCCGACTCCCATCTTTC | ||
| Wnt4-like-F | CGACGATGCCATTGAGG | 285 | XM050836949.1 |
| Wnt4-like-R | GGCGAGGTGTTCTGATAGTG | ||
| FAT1-F | CGGCACAGCAAGGAT | 170 | XM050849542.1 |
| FAT1-R | TCTGGGCAGGTGTAGGA | ||
| TBRG1-F | CAGCGGATTGGTGAGG | 309 | XM050858362.1 |
| TBRG1-R | GCGGGTGATAGCGACA | ||
| RERG-F | GCGTGGCTGGTCGTGTA | 297 | XM050856896.1 |
| RERG-R | CGAGGTCTGTCCCTTGTG | ||
| GAS1-F | CGGAGGAAGGACACGA | 172 | NC066514.1 |
| GAS1-R | GCGGCACAGAGGGTAT | ||
| WFIR-F | CACTGCTCCTGCTGTCTGCT | 100 | XM050881384.1 |
| WFIR-R | TGTTTGCCACACCCGA | ||
| β-actin-F | GCATCCACGAGACCACTTACA | 266 | NC066571.1 |
| β-actin-R | CTCCTGCTTGCTGATCCACATC |
| Changjiang 2 | Jianghai 21 | |
|---|---|---|
| Wi (g) | 12.42 ± 2.14 | 11.96 ± 3.65 |
| Wf (g) | 148.10 ± 10.56 | 180.82 ± 11.37 *** |
| WGR (%) | 1081.03 ± 8.37 | 1513.70 ± 9.26 *** |
| SGR (%/day) | 3.80 ± 0.07 | 4.08 ± 0.16 |
| GRCL (%) | 113.74 ± 0.36 | 151.88 ± 0.54 *** |
| GRCW (%) | 117.18 ± 0.43 | 165.63 ± 0.59 *** |
| GRBH (%) | 138.87 ± 0.24 | 176.28 ± 0.44 *** |
| GRSSL (%) | 112.99 ± 0.56 | 155.39 ± 0.79 *** |
| GRTSL (%) | 119.89 ± 0.32 | 151.74 ± 1.36 *** |
| Amino Acid Composition of the Muscle | Changjiang 2 | Jianghai 21 |
|---|---|---|
| Aspartic acid | 18.37 ± 0.44 | 19.37 ± 0.46 |
| Threonine | 9.78 ± 0.37 | 9.87 ± 0.18 |
| Serine | 8.90 ± 0.26 | 9.67 ± 0.16 |
| Glutamic acid | 25.10 ± 0.24 | 27.17 ± 1.00 |
| Glycine | 10.90 ± 0.60 | 12.47 ± 0.95 |
| Alanine | 9.66 ± 0.11 | 10.27 ± 0.09 * |
| Cysteine | 4.54 ± 0.13 | 5.27 ± 0.12 * |
| Valine | 7.55 ± 0.19 | 8.23 ± 0.06 * |
| Methionine | 4.66 ± 0.10 | 4.87 ± 0.20 |
| Isoleucine | 6.20 ± 0.17 | 6.57 ± 0.14 |
| Leucine | 12.70 ± 0.13 | 13.27 ± 0.68 |
| Tyrosine | 9.53 ± 0.22 | 9.87 ± 0.06 |
| Phenylalanine | 8.46 ± 0.15 | 9.17 ± 0.15 * |
| Histidine | 5.74 ± 0.08 | 6.07 ± 0.12 |
| Lysine | 16.80 ± 0.30 | 18.67 ± 0.39 * |
| Arginine | 15.10 ± 0.46 | 17.37 ± 0.56 * |
| TAA | 173.00 ± 3.42 | 188.07 ± 3.95 *** |
| DAA | 81.80 ± 1.33 | 88.27 ± 2.14 *** |
| EAA | 72.0 ± 1.44 | 76.67 ± 1.33 * |
| DAA/TAA | 0.47 ± 0.00 | 0.47 ± 0.00 |
| EAA/TAA | 0.41 ± 0.00 | 0.47 ± 0.00 |
| Amino Acid Composition of the Hepatopancreas | Changjiang 2 | Jianghai 21 |
|---|---|---|
| Aspartic acid | 7.76 ± 0.85 | 8.00 ± 0.17 |
| Threonine | 5.20 ± 0.45 | 5.66 ± 0.26 |
| Serine | 3.83 ± 0.25 | 4.18 ± 0.12 |
| Glutamic acid | 9.23 ± 0.55 | 10.10 ± 0.29 |
| Glycine | 3.85 ± 0.35 | 4.43 ± 0.16 |
| Alanine | 3.67 ± 0.25 | 4.16 ± 0.20 |
| Cysteine | 4.29 ± 0.15 | 5.10 ± 0.22 * |
| Valine | 4.41 ± 0.35 | 5.10 ± 0.13 |
| Methionine | 2.06 ± 0.05 | 2.19 ± 0.17 |
| Isoleucine | 2.67 ± 0.35 | 2.79 ± 0.04 |
| Leucine | 5.38 ± 0.25 | 6.09 ± 0.13 |
| Tyrosine | 4.97 ± 0.45 | 4.81 ± 0.15 |
| Phenylalanine | 4.22 ± 0.25 | 4.73 ± 0.18 |
| Histidine | 3.08 ± 0.15 | 3.52 ± 0.15 |
| Lysine | 6.65 ± 0.35 | 7.11 ± 0.10 |
| Arginine | 5.06 ± 0.45 | 5.61 ± 0.18 |
| TAA | 76.30 ± 4.45 | 83.60 ± 0.19 *** |
| DAA | 33.70 ± 2.25 | 36.30 ± 0.30 |
| EAA | 33.70 ± 1.95 | 37.20 ± 0.16 * |
| DAA/TAA | 0.44 ± 0.05 | 0.43 ± 0.00 |
| EAA/TAA | 0.44 ± 0.05 | 0.44 ± 0.00 |
| Gene Title | p-Value | log2FC | Regulated |
|---|---|---|---|
| BMP2 | 0.002 | 3.099 | Up |
| EGFL6 | 0.006 | 4.13 | Up |
| EGF-β | 1.03 × 10⁶ | 3.8 | Up |
| LRP8 | 0.007 | 4.86 | Up |
| WNT4-like | 0.006 | 4.54 | Up |
| FAT1 | 0.004 | 3.93 | Up |
| SRMP2 | 2.32 × 10⁷ | 1.34 | Up |
| LAT1 | 0.009 | 1.68 | Up |
| SRSF5 | 0.002 | 1.73 | Up |
| TBRG1 | 3.10 × 10⁶ | −1.37 | Down |
| RERG | 0.002 | −1.08 | Down |
| GAS1 | 5.03 × 10⁵ | −2.001 | Down |
| WFIR | 0.007 | −2.11 | Down |
| EAAT2 | 0.002 | −1.79 | Down |
| STARD7 | 1.52 × 10⁵ | −1.00 | Down |
| SMYD3 | 3.13 × 10⁹ | −1.49 | Down |
| VPS13D | 0.004 | −1.31 | Down |
| GLTP | 0.008 | −1.03 | Down |
| CST1 | 0.001 | −1.05 | Down |
| LPEAT5 | 0.004 | −1.004 | Down |
Disclaimer/Publisher’s Note: The statements, opinions and data contained in all publications are solely those of the individual author(s) and contributor(s) and not of MDPI and/or the editor(s). MDPI and/or the editor(s) disclaim responsibility for any injury to people or property resulting from any ideas, methods, instructions or products referred to in the content. |
© 2024 by the authors. Licensee MDPI, Basel, Switzerland. This article is an open access article distributed under the terms and conditions of the Creative Commons Attribution (CC BY) license (https://creativecommons.org/licenses/by/4.0/).
Share and Cite
Wang, Z.; Huang, P.; Li, X.; Pei, J.; Liu, W.; Hou, J.; Li, L.; Fan, H.; Zeng, L.; Zhao, D. Comparison of Growth Performance, Nutritional Composition, and Muscle Transcriptome between Two Cultured Varieties of the Chinese Mitten Crab (Eriocheir sinensis). Fishes 2024, 9, 132. https://doi.org/10.3390/fishes9040132
Wang Z, Huang P, Li X, Pei J, Liu W, Hou J, Li L, Fan H, Zeng L, Zhao D. Comparison of Growth Performance, Nutritional Composition, and Muscle Transcriptome between Two Cultured Varieties of the Chinese Mitten Crab (Eriocheir sinensis). Fishes. 2024; 9(4):132. https://doi.org/10.3390/fishes9040132
Chicago/Turabian StyleWang, Ziyu, Peiying Huang, Xiaoyong Li, Jianmin Pei, Wenzhen Liu, Jiahao Hou, Linjie Li, Hongxiang Fan, Liugen Zeng, and Daxian Zhao. 2024. "Comparison of Growth Performance, Nutritional Composition, and Muscle Transcriptome between Two Cultured Varieties of the Chinese Mitten Crab (Eriocheir sinensis)" Fishes 9, no. 4: 132. https://doi.org/10.3390/fishes9040132