
Comparison of Morphometric Parameters, Nutritional Composition, and Textural Properties of Seven Crustaceans Species


 ,
,
Abstract
1. Introduction
2. Materials and Methods
2.1. Animals and Sample Collection
2.2. Experimental Parameters Measured
2.2.1. Morphometric Parameters
2.2.2. Proximate Composition Analysis
2.2.3. Amino Acids
2.2.4. Fatty Acids
2.2.5. Textural Properties
2.2.6. Physical and Chemical Properties
2.3. Statistical Analyses
3. Results
3.1. Morphometric Parameters of Seven Crustaceans Species
3.2. Proximate Composition of Muscle
3.3. Amino Acid Composition of Muscle
3.4. Fatty Acid Composition of Muscle
3.5. Textural Properties
3.6. Physical and Chemical Index
4. Discussion
5. Conclusions
Author Contributions
Funding
Institutional Review Board Statement
Informed Consent Statement
Data Availability Statement
Conflicts of Interest
References
- Lie, Ø. Flesh quality–the role of nutrition. Aquac. Res. 2001, 32, 341–348. [Google Scholar] [CrossRef]
- Wei, Q.H.; Sun, Q.X.; Dong, X.P.; Kong, B.H.; Ji, H.W.; Liu, S.C. Effect of static magnetic field-assisted freezing at different temperatures on muscle quality of pacific white shrimp (Litopenaeus vannamei). Food Chem. 2024, 438, 138041. [Google Scholar] [CrossRef] [PubMed]
- Huang, Z.H.; Guan, W.L.; Lyu, X.M.; Chen, R.C.; Wu, Y.Y.; Mao, L.C. Impacts of acute ammonia-N exposure on the muscle quality of whiteleg shrimp (Penaeus vannamei): Novel insights into lipid and protein oxidation. Food Chem. 2024, 437, 137701. [Google Scholar] [CrossRef] [PubMed]
- Zhong, Z.X.; Fan, J.J.; Su, H.H.; Zhu, H.P.; Ma, D.M. Proximate compositions evaluation, histology and transcriptome analysis revealed the effects of formulated diets on muscle quality in Micropterus salmoides. Reprod. Breed. 2023, 3, 50–58. [Google Scholar] [CrossRef]
- Menasveta, P.; Worawattanamateekul, W.; Latscha, T.; Clark, J.S. Correction of black tiger prawn (Penaeus monodon Fabrieius) coloration by astaxanthin. Aquacult. Eng. 1993, 12, 203–213. [Google Scholar] [CrossRef]
- Anders, N.; Breen, M.; Skara, T.; Roth, B.; Sone, I. Effects of capture-related stress and pre-freezing holding in refrigerated sea water (RSW) on the muscle quality and storage stability of Atlantic mackerel (Scomber scombrus) during subsequent frozen storage. Food Chem. 2023, 405, 134819. [Google Scholar] [CrossRef] [PubMed]
- Dong, B.; Wu, L.Y.; Wang, Y.; Han, D.; Liu, H.K.; Zhu, X.M.; Yang, Y.X.; Xie, S.Q.; Liu, Z.; Jin, J.Y. Glutamate improves flesh quality and muscle growth of triploid crucian carp. Aquacult. Rep. 2023, 33, 101832. [Google Scholar] [CrossRef]
- Chen, J.; Zhou, M.Q.; Jiang, J.L.; Yu, A.G.; Yu, D.H.; Huang, F. Effects of dietary lipid levels on fiber quality, lipidomic profiles, antioxidant and inflammation responses in muscle of yellow catfish Pelteobagrus fulvidraco. Aquacult. Rep. 2023, 33, 101855. [Google Scholar] [CrossRef]
- Jing, J.Z.; Wang, J.Y.; Xiang, X.Y.; Yin, S.G.; Tang, J.Y.; Wang, L.Q.; Jia, J.; Liu, G.M.; Chen, X.L.; Tang, G.; et al. Selenomethionine alleviates chronic heat stress-induced breast muscle injury and poor meat quality in broilers via relieving mitochondrial dysfunction and endoplasmic reticulum stress. Anim. Nutr. 2024, 16, 363–375. [Google Scholar] [CrossRef] [PubMed]
- Wu, Y.; Tian, S.J.; Yuan, J.; Zhang, Z.Y.; Zhou, H.H.; Gao, W.H.; Zhang, W.B.; Mai, K.S. Effects of Clostridium autoethanogenum protein as substitute for dietary fishmeal on the growth, feed utilization, intestinal health and muscle quality of large yellow croaker Larimichthys crocea. Aquaculture 2022, 561, 738591. [Google Scholar] [CrossRef]
- Tang, Z.Y.; Li, C.Y.; Xu, G.; Zhao, Q.; Wei, Z.H.; Liu, S.J. Effects of dietary glutathione on growth performance, muscle quality and lipid metabolism of hybrid crucian carp (Carassius auratus cuvieri ♀ × Carassius auratus red var. ♂) fed a high-fat die. Reprod. Breed. 2023, 3, 89–98. [Google Scholar] [CrossRef]
- Yang, H.C.; Li, Y.C.; Wang, G.J.; Xie, J.; Kaneko, G.; Yu, E.M. Dietary grape seed proanthocyanidin extract improved the chemical composition, antioxidant capacity, myofiber growth and flesh quality of Nile tilapia muscle. Aquacult. Rep. 2023, 33, 101878. [Google Scholar] [CrossRef]
- Meng, X.L.; You, F.; Cao, H.; Cai, H.M.; Li, Y.; Yang, G.K.; Zhang, Y.M.; Chang, X.L.; Zhang, X.D.; Tian, X. Effects of dietary licorice (Glycyrrhiza uralensis) supplementation on growth performance, muscle quality, and immunity in the common carp (Cyprinus carpio haematopterus). Aquacult. Rep. 2022, 27, 101331. [Google Scholar]
- Xu, J.; Feng, L.; Jiang, W.D.; Wu, P.; Liu, Y.; Jiang, J.; Kuang, S.Y.; Tang, L.; Zhou, X.Q. Different dietary protein levels affect flesh quality, fatty acids and alter gene expression of Nrf2-mediated antioxidant enzymes in the muscle of grass carp (Ctenopharyngodon idella). Aquaculture 2018, 493, 272–282. [Google Scholar] [CrossRef]
- Johnston, I.A.; Manthri, S.; Alderson, R.; Campbell, P.; Mitchell, D.; Whyte, D.; Dingwall, A.; Nickell, D.; Selkirk, C.; Robertson, B. Effects of dietary protein level on muscle cellularity and flesh quality in Atlantic salmon with particular reference to gaping. Aquaculture 2002, 210, 259–283. [Google Scholar] [CrossRef]
- Ma, H.G.; Xiong, K.D.; Wu, J.W.; Ji, X.R.; Yang, S.H. Noncontact photoacoustic angiography with an air-coupled ultrasonic transducer for evaluation of burn injury. Appl. Phys. Lett. 2019, 114, 133701. [Google Scholar] [CrossRef]
- Huang, S.T.; Chen, Q.; Zhang, M.M.; Chen, S.M.; Dai, J.Y.; Qian, Y.X.; Gong, Y.Y.; Han, T. Synthetic astaxanthin has better effects than natural astaxanthins on growth performance, body color and n-3 PUFA deposition in black tiger prawn (Penaeus monodon). Aquacult. Rep. 2023, 33, 101816. [Google Scholar] [CrossRef]
- Tang, J.Z.; Zhang, D.Y.; Cheng, J.; Liu, F.; Fu, G.H.; Zhang, J.S. Comparative analysis of the amino acid composition and proteomic patterns of the muscle proteins from two teleosts, Siniperca chuatsi L. and Hypophthalmichthys molitrix L. J. Fish. China 2007, 31, 361–368. [Google Scholar]
- Zhang, Y.; Wang, L.; Ma, X.; Guan, T.Y.; Shi, W.J.; Zhu, C.K.; Wang, H.; Li, J.L. Response of antioxidation and immunity to combined influences of ammonia and temperature in red swamp crayfish (Procambarus clarkii). Aquaculture 2023, 563, 738906. [Google Scholar] [CrossRef]
- Sun, C.; Tadese, D.A.; Wangari, M.R.; Zhou, Q.; Zheng, X.; Liu, B.; Tamiru, M.; Dagne, A.; Janssens, G.P.J.; Zhao, Y. Amelioration of ammonia-induced intestinal oxidative stress by dietary Clostridium butyricum in giant freshwater prawn (Macrobrachium rosenbergii). Fish Shellfish Immunol. 2022, 131, 1173–1181. [Google Scholar] [CrossRef] [PubMed]
- Yin, C.L.; Shen, X.J.; Wang, Y.; Hu, J.J.; Bao, Z.M.; Wang, M.Q. Comparative study of five anti-lipopolysaccharide factor genes in Litopenaeus vannamei. Dev. Comp. Immunol. 2022, 139, 104557. [Google Scholar] [CrossRef] [PubMed]
- Lu, Z.B.; Li, Y.D.; Jiang, S.G.; Yang, Q.B.; Jiang, S.; Huang, J.H.; Yang, L.S.; Chen, X.; Zhou, F.L. Transcriptome analysis of hepatopancreas in penaeus monodon under acute low pH stress. Fish Shellfish Immunol. 2022, 131, 1166–1172. [Google Scholar] [CrossRef]
- Zhang, Y.Q.; Yao, N.; Zhang, C.T.; Sun, X.S.; Huang, J.X.; Zhao, B.R.; Li, H.D. Genetic analysis of survival in Penaeus japonicus exposed to white spot syndrome virus. Aquaculture 2022, 559, 738424. [Google Scholar] [CrossRef]
- Sun, S.M.; Wu, Y.; Jakovlic, I.; Fu, H.T.; Ge, X.P.; Qiao, H.; Zhang, W.Y.; Jin, S.B. Identification of neuropeptides from eyestalk transcriptome profiling analysis of female oriental river prawn (Macrobrachium nipponense) under hypoxia and reoxygenation conditions. Comp. Biochem. Physiol. B Biochem. Mol. Biol. 2020, 241, 110392. [Google Scholar]
- Xu, W.Y.; Ma, Q.Y.; Sun, J.F.; Li, Y.L.; Wang, J.; Tang, Y.W.; Liu, Y.Q.; Mu, J.L.; Wang, W.X. Changes in quality characteristics of shrimp (Penaeus chinensis) during refrigerated storage and their correlation with protein degradation. J. Food Compos. Anal. 2022, 114, 104773. [Google Scholar] [CrossRef]
- AOAC (Association of Official Analytical Chemists). Official Methods of Analysis of the Association of Official Analytical Chemists International, 16th ed.; Association of Official Analytical Chemists: Arlington, VA, USA, 1995. [Google Scholar]
- Thiago, M.T.D.N.; Cleber, F.M.M.; Helena, P.; Fábio, H.F.R.; Kifayat, U.K.; Rafael, S.R.; Nilva, K.S.; João, B.K.F. Determination of the optimum dietary essential amino acid profile for growing phase of Nile tilapia by deletion method. Aquaculture 2020, 523, 135204. [Google Scholar]
- Ginés, R.; Valdimarsdottir, T.; Sveinsdottir, K.; Thorarensen, H. Effects of rearing temperature and strain on sensory characteristics, texture, colour and fat of Arctic charr (Salvelinus alpinus). Food Qual. Prefer. 2004, 15, 177–185. [Google Scholar] [CrossRef]
- CIE. Official Recommendations on Uniform Colour Space, Colour Difference Equations and Metric Colour Terms. Color. Publ. CIE No 1976, 15, 9–12. [Google Scholar]
- Cao, L.P.; Rasco, B.A.; Tang, J.M.; Niu, L.H.; Lai, K.Q.; Fan, Y.X.; Huang, Y.Q. Effects of freshness on the cook loss and shrinkage of grass carp (Ctenopharyngodon idellus) fillets following pasteurization. Int. J. Food Prop. 2016, 19, 2297–2306. [Google Scholar] [CrossRef]
- Sánchez-Alonso, I.; Haji-Maleki, R.; Borderias, A.J. Wheat fiber as a functional ingredient in restructured fish products. Food Chem. 2007, 100, 1037–1043. [Google Scholar] [CrossRef]
- Fuentes, A.; Fernandez-Segovia, I.; Serra, J.; Barat, J. Comparison of wild and cultured sea bass (Dicentrarchus labrax) quality. Food Chem. 2010, 119, 1514–1518. [Google Scholar] [CrossRef]
- Yu, Z.L.; Li, D.Y.; Yin, F.W.; Zhao, Q.; Liu, Z.Y.; Song, L.; Zhou, D.Y.; Wang, T. Lipid profiles in by-products and muscles of three shrimp species (Penaeus monodon, Penaeus vannamei, and Penaeus chinensis). Eur. J. Lipid Sci. Tech. 2020, 122, 1900309. [Google Scholar] [CrossRef]
- Tian, J.; Xu, Q.Q.; Tian, L.; Hu, W.; Yang, C.G.; Gao, W.H. The Muscle Composition Analysis and flesh quality of Procambarus clarlia in the dongting lake. Acta Hydrobiol. Sin. 2017, 41, 870–877. (In Chinese) [Google Scholar]
- Li, L.C. Analysis of muscle nutrient composition of Macrobrachium nipponense and Procambarus clarkii in Nanwan Reservoir. J. Hydroecology 2005, 03, 28–29. (In Chinese) [Google Scholar]
- Cai, L.; Tong, F.L.; Tang, T.; Ao, Z.P.; Wei, Z.H.; Yang, F.Z.; Shu, Y.Q.; Liu, S.J.; Mai, K.S. Comparative evaluation of nutritional value and flavor quality of muscle in triploid and diploid common carp: Application of genetic improvement in fish quality. Aquaculture 2021, 541, 736780. [Google Scholar] [CrossRef]
- Liu, L.; Liu, C.C.; Li, J.L. Comparison of biochemical composition and nutritional value of antarctic krill (Euphausia Superb) with several species of shrimps. Adv. Mater. Res. 2011, 361–363, 799–803. [Google Scholar] [CrossRef]
- Bermúdez, R.; Franco, D.; Carballo, J.; Sentandreu, M.Á.; Lorenzo, J.M. Influence of muscle type on the evolution of free amino acids and sarcoplasmic and myofibrillar proteins through the manufacturing process of Celta dry-cured ham. Food Res. Int. 2014, 56, 226–235. [Google Scholar] [CrossRef]
- Zhao, F.; Zhuang, P.; Song, C.; Shi, Z.H.; Zhang, L.Z. Amino acid and fatty acid compositions and nutritional quality of muscle in the pomfret, Pampus punctatissimus. Food Chem. 2010, 118, 224–227. [Google Scholar] [CrossRef]
- Who, J.; Consultation, F.E. Diet, nutrition and the prevention of chronic diseases. World Health Organ Tech. Rep. Ser. 2003, 916, 1–149. [Google Scholar]
- Zhu, T.Y.; Yang, R.; Xiao, R.G.; Ni, W.Q.; Liu, L.W.; Zhao, J.; Ye, Z.Y. Effect of swimming training on the flesh quality in Chinese Perch (Siniperca chuatsi) and its relationship with muscle metabolism. Aquaculture 2023, 577, 739926. [Google Scholar] [CrossRef]
- Xu, C.; Song, D.; Holck, A.L.; Zhou, Y.Y.; Liu, R. Identifying Lipid Letabolites Influenced by oleic acid administration using high-performance liquid chromatography–mass spectrometry-based lipidomics. ACS Omega 2020, 5, 11314–11323. [Google Scholar] [CrossRef]
- Jiang, W.D.; Wu, P.; Tang, R.J.; Liu, Y.; Kuang, S.Y.; Jiang, J.; Tang, L.; Tang, W.N.; Zhang, Y.A.; Zhou, X.Q.; et al. Nutritive values, flavor amino acids, healthcare fatty acids and flesh quality improved by manganese referring to up-regulating the antioxidant capacity and signaling molecules TOR and Nrf2 in the muscle of fish. Food Res. Int. 2016, 89, 670–678. [Google Scholar] [CrossRef]
- Carrapiso, A.I.; Tejeda, J.F.; Noguera, J.L.; Ibanez-Escriche, N.; Gonzalez, E. Effect of the genetic line and oleic acid-enriched mixed diets on the subcutaneous fatty acid composition and sensory characteristics of dry-cured shoulders from Iberian pig. Meat Sci. 2020, 159, 107933. [Google Scholar] [CrossRef] [PubMed]
- Zhang, X.; Wang, J.W.; Tang, R.; He, X.G.; Li, L.; Takagi, Y.; Li, D.P. Improvement of muscle quality of grass carp (Ctenopharyngodon idellus) with a bio-floating bed in culture ponds. Front. Physiol. 2019, 10, 683–693. [Google Scholar] [CrossRef] [PubMed]
- Larsson, T.; Koppang, E.O.; Espe, M.; Terjesen, B.F.; Krasnov, A.; Moreno, H.M.; Rørvik, K.A.; Thomassen, M.; Mørkøre, T. Fillet quality and health of Atlantic salmon (Salmo salar L.) fed a diet supplemented with glutamate. Aquaculture 2014, 426–427, 288–295. [Google Scholar] [CrossRef]
- Arechavala-Lopez, P.; Fernandez-Jover, D.; Black, K.D.; Ladoukakis, E.; Bayle-Sempere, J.T.; Sanchez-Jerez, P.; Dempster, T. Differentiating the wild or farmed origin of Mediterranean fish: A review of tools for sea bream and sea bass. Rev. Aquaculture. 2013, 5, 137–157. [Google Scholar] [CrossRef]
- Jeremiah, L.E.; Carpenter, Z.L.; Smith, G.C. Beef color as related to consumer acceptance and palatability. Food Sci. 1972, 31, 476–479. [Google Scholar] [CrossRef]
- Han, M.Y.; Wang, P.; Xu, X.L.; Zhou, G.H. Low-field NMR study of heat-induced gelation of pork myofibrillar proteins and its relationship with microstructural characteristics. Food Res. Int. 2014, 62, 1175–1182. [Google Scholar] [CrossRef]
- Cui, Y.; Zhu, L.; Shang, H.H.; Xuan, X.T.; Yu, J.F.; Lin, X.D.; Kang, M.L.; Lin, J.G. Effects of low temperature combined with high-humidity thawing on water holding capacity and biochemical properties of myofiberillar protein of Penaeus vannamei. J. Food Sci. Techn. 2020, 38, 81–89. [Google Scholar]
- El-Dengawy, R.; Sharaf, A.; El-Kadi, S.; Mahmoud, E.; Baidoon, E. Effect of frozen storage on the chemical, physical and microbiological quality of imported mackerel (Scomber scombrus). J. Food Dairy Sci. 2017, 8, 287–293. [Google Scholar] [CrossRef]
- Chen, S.M.; Chen, J.C. Effects of pH on survival, growth, molting and feeding of giant freshwater prawn Macrobrachium rosenbergii. Aquaculture 2003, 218, 613–623. [Google Scholar] [CrossRef]


| Crayfish | Freshwater Prawns | Pacific White Shrimp | Black Tiger Shrimp | Kuruma Prawns | River Prawns | Chinese Shrimp | |
|---|---|---|---|---|---|---|---|
| Weight (g) | 31.66 ± 1.03 a | 20.82 ± 0.96 b | 17.53 ± 0.89 b | 18.97 ± 0.98 b | 11.31 ± 0.62 c | 2.85 ± 0.23 d | 13.08 ± 0.52 c |
| Length (cm) | 8.10 ± 0.14 c | 8.30 ± 0.18 c | 10.94 ± 0.17 a | 10.52 ± 0.12 a | 9.19 ± 0.22 b | 4.40 ± 0.14 d | 9.70 ± 0.16 b |
| HSI (%) 1 | 7.60 ± 0.37 a | 8.46 ± 0.34 a | 4.86 ± 0.13 b | 4.68 ± 0.20 b | 3.50 ± 0.30 b | 3.95 ± 0.57 b | 3.89 ± 0.30 b |
| MC (%) 2 | 14.74 ± 1.08 e | 37.30 ± 0.82 c | 48.04 ± 1.39 a | 46.61 ± 0.81 ab | 44.60 ± 1.32 ab | 24.54 ± 0.49 d | 43.92 ± 0.56 b |
| CF 3 | 6.01 ± 0.31 a | 3.66 ± 0.16 b | 1.33 ± 0.03 c | 1.62 ± 0.05 c | 1.46 ± 0.05 c | 3.33 ± 0.13 b | 1.43 ± 0.03 c |
| Crayfish | Freshwater Prawns | Pacific White Shrimp | Black Tiger Shrimp | Kuruma Prawns | River Prawns | Chinese Shrimp | |
|---|---|---|---|---|---|---|---|
| Moisture (%) | 80.37 ± 0.81 a | 72.66 ± 2.50 bc | 69.27 ± 1.97 c | 75.12 ± 0.62 b | 76.67 ± 0.22 b | 80.70 ± 0.27 a | 75.87 ± 0.32 b |
| Crude protein (%) | 14.095 ± 0.57 c | 19.445 ± 1.80 ab | 21.232 ± 1.32 a | 20.513 ± 0.50 a | 19.115 ± 0.23 ab | 15.428 ± 0.21 bc | 19.599 ± 0.28 a |
| Crude lipid (%) | 2.27 ± 0.07 b | 3.26 ± 0.33 a | 3.86 ± 0.33 a | 1.08 ± 0.11 cd | 0.60 ± 0.09 d | 1.49 ± 0.15 bc | 1.02 ± 0.13 cd |
| Crude ash (%) | 1.36 ± 0.07 bc | 1.69 ± 0.19 ab | 1.81 ± 0.13 a | 1.48 ± 0.08 abc | 1.47 ± 0.03 abc | 1.09 ± 0.03 c | 1.42 ± 0.03 abc |
| Crayfish | Freshwater Prawns | Pacific White Shrimp | Black Tiger Shrimp | Kuruma Prawns | River Prawns | Chinese Shrimp | |
|---|---|---|---|---|---|---|---|
| Arg | 0.59 ± 0.03 | 0.51 ± 0.06 | 0.58 ± 0.06 | 0.61 ± 0.02 | 0.63 ± 0.02 | 0.47 ± 0.01 | 0.59 ± 0.02 |
| His | 0.06 ± 0.01 a | 0.05 ± 0.003 a | 0.03 ± 0.003 b | 0.01 ± 0.001 c | 0.02 ± 0.001 bc | 0.03 ± 0.001 b | 0.02 ± 0.001 bc |
| Ile | 0.01 ± 0.003 ab | 0.02 ± 0.003 ab | 0.02 ± 0.004 a | 0.01 ± 0.002 ab | 0.01 ± 0.001 ab | 0.01 ± 0.0003 b | 0.01 ± 0.001 b |
| Leu | 0.01 ± 0.0001 c | 0.04 ± 0.01 ab | 0.04 ± 0.01 a | 0.03 ± 0.004 abc | 0.02 ± 0.001 abc | 0.02 ± 0.001 bc | 0.02 ± 0.001 abc |
| Met | 0.01 ± 0.002 b | 0.02 ± 0.004 a | 0.02 ± 0.002 ab | 0.01 ± 0.002 b | 0.02 ± 0.001 ab | 0.01 ± 0.0003 b | 0.01 ± 0.002 b |
| Val | 0.03 ± 0.005 b | 0.05 ± 0.01 a | 0.05 ± 0.01 a | 0.03 ± 0.003 ab | 0.03 ± 0.001 ab | 0.02 ± 0.0004 b | 0.03 ± 0.001 ab |
| Phe | 0.01 ± 0.0004 c | 0.02 ± 0.004 a | 0.02 ± 0.003 a | 0.03 ± 0.004 ab | 0.01 ± 0.001 abc | 0.01 ± 0.0002 bc | 0.01 ± 0.002 abc |
| Lys | 0.03 ± 0.004 c | 0.07 ± 0.004 a | 0.06 ± 0.01 ab | 0.04 ± 0.01 bc | 0.03 ± 0.002 c | 0.04 ± 0.001 c | 0.04 ± 0.003 bc |
| Thr | 0.15 ± 0.02 a | 0.10 ± 0.01 bc | 0.11 ± 0.01 ab | 0.11 ± 0.01 abc | 0.07 ± 0.003 c | 0.13 ± 0.01 ab | 0.07 ± 0.01 c |
| Ala | 0.13 ± 0.02 b | 0.14 ± 0.01 b | 0.31 ± 0.04 a | 0.31 ± 0.01 a | 0.29 ± 0.01 a | 0.12 ± 0.001 b | 0.32 ± 0.01 a |
| Gly | 0.11 ± 0.01 c | 0.20 ± 0.04 c | 0.89 ± 0.060 a | 0.92 ± 0.02 a | 0.62 ± 0.02 b | 0.18 ± 0.004 c | 0.82 ± 0.03 a |
| Asp | 0.002 ± 0.0001 bc | 0.001 ± 0.0003 c | 0.001 ± 0.0001 c | 0.005 ± 0.001 a | 0.004 ± 0.001 ab | 0.001 ± 0.0001 c | 0.005 ± 0.001 a |
| Glu | 0.03 ± 0.004 a | 0.05 ± 0.01 a | 0.21 ± 0.02 a | 0.08 ± 0.01 a | 0.14 ± 0.01 b | 0.05 ± 0.001 a | 0.16 ± 0.01 ab |
| Tyr | 0.02 ± 0.002 bc | 0.03 ± 0.01 ab | 0.03 ± 0.003 a | 0.03 ± 0.004 ab | 0.03 ± 0.001 a | 0.01 ± 0.0003 c | 0.03 ± 0.002 ab |
| Ser | 0.04 ± 0.01 bc | 0.02 ± 0.003 c | 0.05 ± 0.01 ab | 0.02 ± 0.002 c | 0.03 ± 0.002 c | 0.06 ± 0.002 a | 0.02 ± 0.003 c |
| Pro | 0.03 ± 0.01 c | 0.13 ± 0.02 c | 0.58 ± 0.05 ab | 0.66 ± 0.04 a | 0.52 ± 0.02 b | 0.11 ± 0.003 c | 0.47 ± 0.04 b |
| Cys | 0.01 ± 0.001 b | 0.01 ± 0.0002 b | 0.01 ± 0.0014 a | ND | ND | ND | ND |
| 1 EAA | 0.90 ± 0.06 | 0.91 ± 0.04 | 0.93 ± 0.09 | 0.87 ± 0.05 | 0.85 ± 0.01 | 0.73 ± 0.02 | 0.81 ± 0.02 |
| 2 NEAA | 0.35 ± 0.04 c | 0.63 ± 0.10 c | 2.08 ± 0.17 a | 2.02 ± 0.03 a | 1.63 ± 0.04 b | 0.54 ± 0.01 c | 1.82 ± 0.05 ab |
| 3 UAA | 0.29 ± 0.04c | 0.40 ± 0.03 c | 1.47 ± 0.12 a | 1.35 ± 0.04 a | 1.10 ± 0.03 b | 0.38 ± 0.01 c | 1.34 ± 0.04 a |
| Crayfish | Freshwater Prawns | Pacific White Shrimp | Black Tiger Shrimp | Kuruma Prawns | River Prawns | Chinese Shrimp | |
|---|---|---|---|---|---|---|---|
| C16:0 | 18.44 ± 0.41 f | 21.90 ± 0.19 e | 24.95 ± 0.23 c | 28.26 ± 0.20 a | 26.81 ± 0.25 b | 22.95 ± 0.17 d | 25.85 ± 0.20 bc |
| C16:1 | 4.70 ± 0.22 b | 2.36 ± 0.13 d | 1.68 ± 0.06 e | 2.27 ± 0.05 d | 5.20 ± 0.10 a | 3.24 ± 0.04 c | 2.70 ± 0.09 d |
| C17:0 | 0.70 ± 0.03 bc | 0.47 ± 0.03 cd | 0.31 ± 0.01 d | 0.51 ± 0.05 cd | 1.38 ± 0.11 a | 0.64 ± 0.04 bc | 0.84 ± 0.12 b |
| C18:0 | 8.99 ± 0.26 d | 12.01 ± 0.18 c | 14.45 ± 0.23 a | 13.37 ± 0.13 b | 14.42 ± 0.27 a | 11.33 ± 0.12 c | 14.12 ± 0.13 ab |
| C18:1 | 23.83 ± 0.48 a | 23.81 ± 0.23 a | 18.81 ± 0.27 b | 18.54 ± 0.10 b | 18.57 ± 0.33 b | 22.70 ± 0.17 a | 18.99 ± 0.24 b |
| C18:2n-6 (LA) | 10.84 ± 0.53 d | 20.31 ± 0.63 a | 20.48 ± 0.16 a | 16.78 ± 0.14 b | 3.27 ± 0.15 e | 12.54 ± 0.15 c | 13.82 ± 0.36 c |
| C18:3n-3 (LNA) | 3.98 ± 0.13 a | 1.89 ± 0.10 c | 1.17 ± 0.04 d | 1.05 ± 0.04 d | 2.04 ± 0.13 c | 2.83 ± 0.07 b | 1.26 ± 0.06 d |
| C20:0 | 1.48 ± 0.07 ab | 0.74 ± 0.07 cd | 0.78 ± 0.02 cd | 0.99 ± 0.05 c | 1.78 ± 0.15 a | 0.66 ± 0.03 d | 1.35 ± 004 b |
| C20:1 | 0.98 ± 0.05 b | 1.14 ± 0.03 b | 1.71 ± 0.10 a | 0.99 ± 0.02 b | 1.00 ± 0.01 b | 1.02 ± 0.011 b | 1.02 ± 0.01 b |
| C20:2 | 0.29 ± 0.04 a | 0.12 ± 0.02 bc | ND | ND | ND | 0.08 ± 0.0004 cd | 0.173 ± 0.01 b |
| C20:3 | 6.90 ± 024 a | 4.74 ± 0.26 c | 3.67 ± 0.08 d | 3.74 ± 0.05 d | 5.94 ± 0.18 b | 7.32 ± 0.15 a | 4.206 ± 0.09 cd |
| C20:4n-6 (AA) | 0.52 ± 0.04 a | 0.30 ± 0.01 cd | 0.25 ± 0.001 de | 0.17 ± 0.02 e | 0.39 ± 0.02 bc | 0.50 ± 0.01 ab | 0.27 ± 0.03 de |
| C22:0 | 0.37 ± 0.01 ab | 0.18 ± 0.04 c | 0.18 ± 0.01 c | 0.22 ± 0.01 c | 0.40 ± 0.01 a | 0.11 ± 0.01 d | 0.34 ± 0.02 b |
| C22:1 | 15.47 ± 0.15 a | 8.88 ± 0.31 e | 10.86 ± 0.20 d | 11.79 ± 0.19 cd | 15.91 ± 0.31 a | 12.64 ± 0.24 bc | 13.65 ± 0.29 b |
| C22:2 | 0.63 ± 0.10 a | 0.34 ± 0.09 b | ND | 0.18 ± 0.03 bc | ND | 0.13 ± 0.01 bc | 0.28 ± 0.04 b |
| C22:3 | 0.52 ± 0.03 b | 0.25 ± 0.02 c | 0.24 ± 0.01 c | 0.27 ± 0.01 c | 0.74 ± 0.04 a | 0.25 ± 0.01 c | 0.33 ± 0.01 c |
| C22:4 | 0.55 ± 0.03 b | 0.36 ± 0.02 cd | 0.31 ± 0.03 d | 0.37 ± 0.01 cd | 0.92 ± 0.07 a | 0.48 ± 0.01 bc | 0.41 ± 0.01 bcd |
| C24:0 | 0.93 ± 0.02 b | 0.51 ± 0.06 c | 0.64 ± 0.05 c | 0.65 ± 0.01 c | 1.24 ± 0.04 a | 0.66 ± 0.03 c | 0.59 ± 0.04 c |
| SFA | 30.94 ± 0.85 c | 35.13 ± 0.89 bc | 39.93 ± 1.39 ab | 43.26 ± 0.75 a | 45.11 ± 0.65 a | 39.77 ± 2.04 ab | 40.93 ± 1.60 ab |
| UFA | 69.06 ± 0.85 a | 64.87 ± 0.85 ab | 60.07 ± 1.39 bc | 56.75 ± 0.75 c | 54.89 ± 0.65 c | 60.23 ± 2.04 bc | 59.07 ± 1.60 bc |
| MUFA | 44.81 ± 0.86 a | 37.85 ± 1.58 bc | 33.65 ± 0.56 cd | 33.27 ± 0.22 d | 38.57 ± 1.51 b | 39.76 ± 0.16 b | 37.39 ± 0.77 bcd |
| PUFA | 24.25 ± 0.63 ab | 27.02 ± 0.73 a | 26.42 ± 0.86 ab | 23.48 ± 0.78 ab | 16.32 ± 2.03 c | 20.47 ± 2.18 bc | 21.68 ± 0.87 abc |
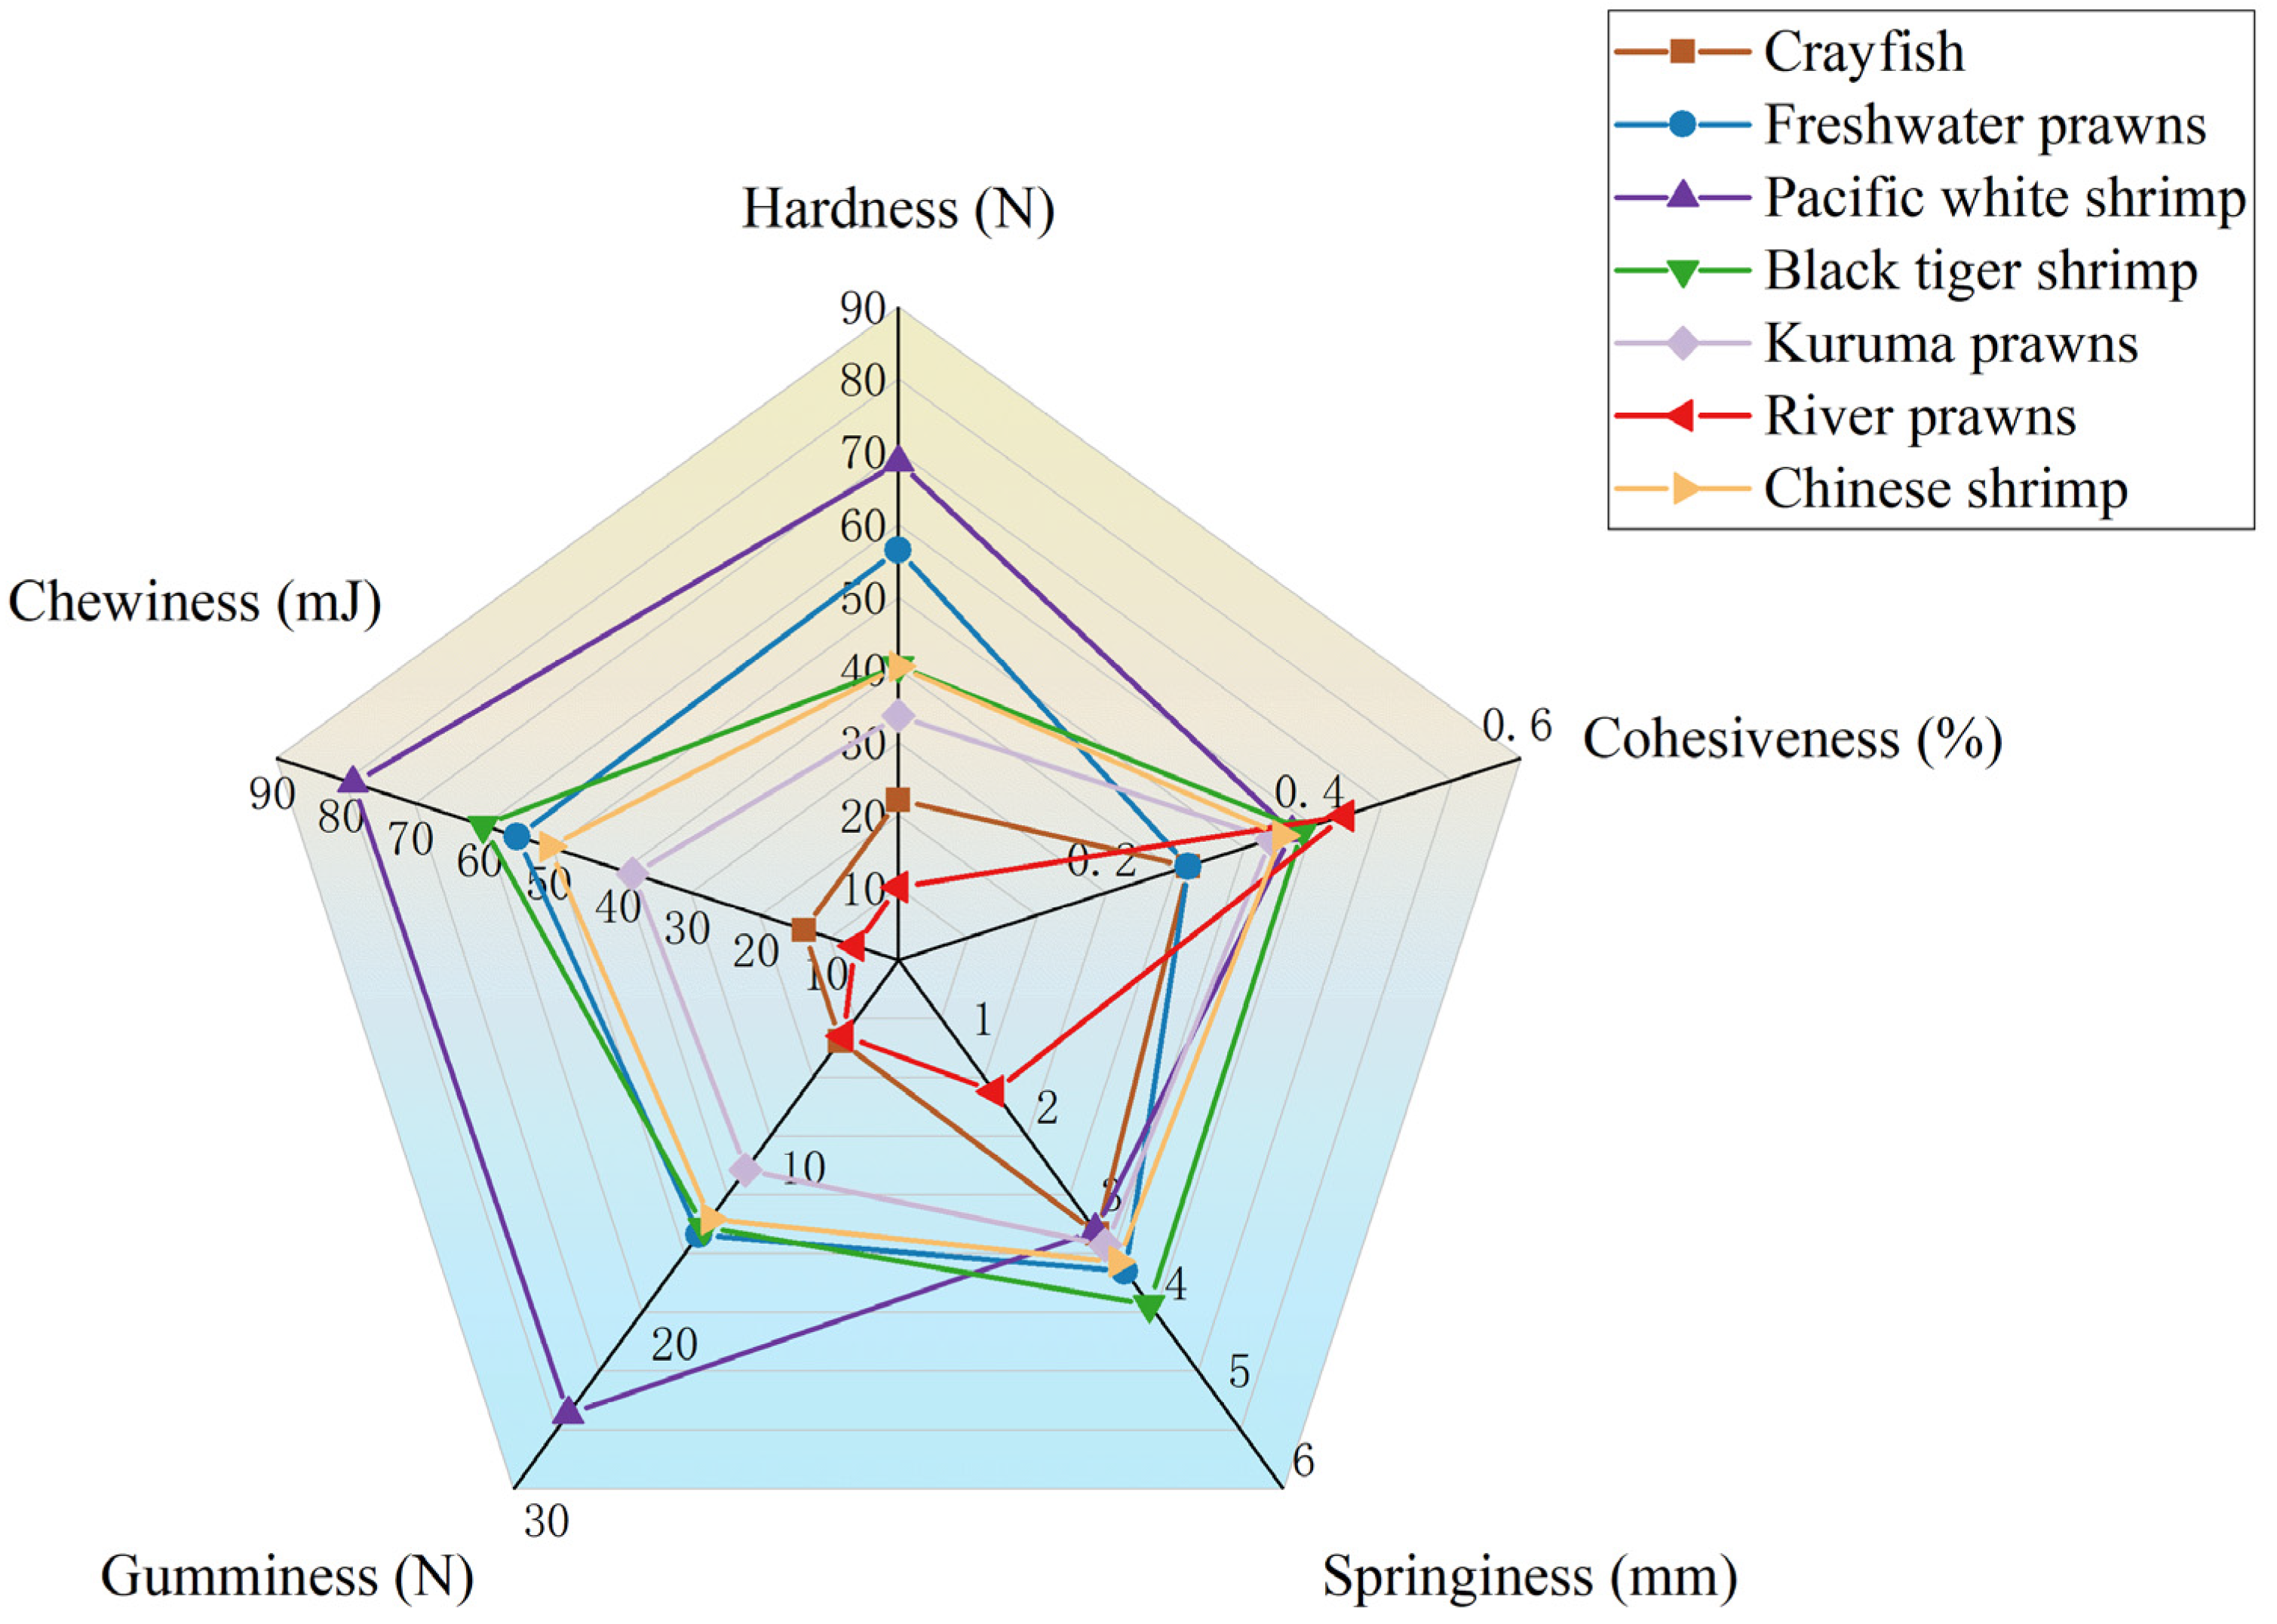
| Crayfish | Freshwater Prawns | Pacific White Shrimp | Black Tiger Shrimp | Kuruma Prawns | River Prawns | Chinese Shrimp | |
|---|---|---|---|---|---|---|---|
| Hardness (N) | 22.05 ± 3.56 cd | 56.50 ± 1.95 a | 68.58 ± 3.26 a | 40.62 ± 4.22 b | 33.63 ± 2.36 bc | 10.11 ± 0.67 d | 40.43 ± 3.52 b |
| Cohesiveness (%) | 0.28 ± 0.02 b | 0.28 ± 0.02 b | 0.38 ± 0.02 a | 0.39 ± 0.03 a | 0.36 ± 0.02 ab | 0.43 ± 0.02 a | 0.37 ± 0.02 ab |
| Springiness (mm) | 3.10 ± 0.10 b | 3.53 ± 0.10 ab | 3.07 ± 0.07 b | 3.91 ± 0.25 a | 3.23 ± 0.26 b | 1.49 ± 0.12 c | 3.42 ± 0.09 ab |
| Gumminess (N) | 4.57 ± 0.50 c | 15.58 ± 0.72 b | 25.76 ± 1.89 a | 15.16 ± 0.87 b | 11.89 ± 0.49 b | 4.28 ± 0.29 c | 14.69 ± 1.10 b |
| Chewiness (mJ) | 13.6 ± 1.8 c | 55.12 ± 3.70 b | 78.88 ± 5.96 a | 60.03 ± 6.59 ab | 38.39 ± 3.46 b | 6.31 ± 0.54 c | 50.52 ± 4.34 b |
| Crayfish | Freshwater Prawns | Pacific White Shrimp | Black Tiger Shrimp | Kuruma Prawns | River Prawns | Chinese Shrimp | ||
|---|---|---|---|---|---|---|---|---|
| Chroma | L* 1 | 38.84 ± 0.85 b | 34.41 ± 1.16 c | 32.87 ± 0.91 cd | 29.77 ± 0.59 d | 36.14 ± 0.50 bc | 48.09 ± 0.82 a | 34.76 ± 1.00 c |
| a* 2 | 5.12 ± 0.40 a | 0.46 ± 0.33 c | 1.37 ± 0.25 c | 5.13 ± 0.27 a | 4.49 ± 0.31 ab | 3.41 ± 0.36 b | 5.28 ± 0.44 a | |
| b* 3 | 0.27 ± 0.44 bc | −6.10 ± 0.39 e | −3.72 ± 0.28 d | −4.70 ± 0.53 de | 1.67 ± 0.28 b | 7.29 ± 0.49 a | −0.01 ± 0.83 c | |
| Drip loss (%) 4 | 15.27 ± 1.36 b | 12.65 ± 0.82 b | 16.07 ± 1.61 b | 15.31 ± 1.30 b | 15.44 ± 0.97 b | 46.32 ± 2.64 a | 17.51 ± 0.78 b | |
| Cooking loss (%) 5 | 6.89 ± 1.09 bc | 11.79 ± 1.04 ab | 13.97 ± 1.29 a | 4.74 ± 0.86 c | 6.97 ± 0.38 bc | 16.75 ± 2.50 a | 3.94 ± 0.57 c | |
| pH | 6.53 ± 0.06 c | 7.04 ± 0.03 ab | 6.84 ± 0.08 b | 6.98 ± 0.05 b | 7.30 ± 0.06 a | 7.11 ± 0.09 ab | 7.03 ± 0.07 ab | |
Disclaimer/Publisher’s Note: The statements, opinions and data contained in all publications are solely those of the individual author(s) and contributor(s) and not of MDPI and/or the editor(s). MDPI and/or the editor(s) disclaim responsibility for any injury to people or property resulting from any ideas, methods, instructions or products referred to in the content. |
© 2024 by the authors. Licensee MDPI, Basel, Switzerland. This article is an open access article distributed under the terms and conditions of the Creative Commons Attribution (CC BY) license (https://creativecommons.org/licenses/by/4.0/).
Share and Cite
Yang, Z.; Jiang, Q.; Zhang, W.; Xia, S.; Tian, H.; Liu, F.; Yang, W.; Yu, Y.; Wu, Y.; Zhu, Y.; et al. Comparison of Morphometric Parameters, Nutritional Composition, and Textural Properties of Seven Crustaceans Species. Fishes 2024, 9, 141. https://doi.org/10.3390/fishes9040141
Yang Z, Jiang Q, Zhang W, Xia S, Tian H, Liu F, Yang W, Yu Y, Wu Y, Zhu Y, et al. Comparison of Morphometric Parameters, Nutritional Composition, and Textural Properties of Seven Crustaceans Species. Fishes. 2024; 9(4):141. https://doi.org/10.3390/fishes9040141
Chicago/Turabian StyleYang, Zhigang, Qingqing Jiang, Wuxiao Zhang, Silei Xia, Hongyan Tian, Fei Liu, Wenping Yang, Yebing Yu, Yanmin Wu, Yongzhi Zhu, and et al. 2024. "Comparison of Morphometric Parameters, Nutritional Composition, and Textural Properties of Seven Crustaceans Species" Fishes 9, no. 4: 141. https://doi.org/10.3390/fishes9040141
APA StyleYang, Z., Jiang, Q., Zhang, W., Xia, S., Tian, H., Liu, F., Yang, W., Yu, Y., Wu, Y., Zhu, Y., Xu, Z., Gu, Z., Wang, A., & Chen, A. (2024). Comparison of Morphometric Parameters, Nutritional Composition, and Textural Properties of Seven Crustaceans Species. Fishes, 9(4), 141. https://doi.org/10.3390/fishes9040141