Article

Flood Pulse Effects on the Growth of Pseudoplatystoma fasciatum in the Amazon Basin

by
Luciana Alves Pereira
1,*,
Leandro Castello
1,
Eric Hallerman
1,
Edson Rubens Ferreira Rodrigues
2,
Carolina Rodrigues da Costa Doria
2 and
Fabrice Duponchelle
3
1
Department of Fish & Wildlife Conservation, Virginia Tech, Blacksburg, VA 24061, USA
2
Laboratory of Ichthyology and Fisheries—Department of Biology, Federal University of Rondonia, Porto Velho 76801-059, Brazil
3
Institut de Recherche Pour le Développement (IRD), MARBEC (University of Montpellier, CNRS, Ifremer, IRD), 34095 Montpellier, France
*
Author to whom correspondence should be addressed.
Fishes 2024, 9(6), 223; https://doi.org/10.3390/fishes9060223
Submission received: 5 April 2024 / Revised: 23 May 2024 / Accepted: 7 June 2024 / Published: 12 June 2024
(This article belongs to the Section Biology and Ecology)

Abstract

:
Fish growth is a fundamental biological process driven by a multitude of intrinsic (within-individual) and extrinsic (environmental) factors that underpin individual fitness and population dynamics. Interannual variability in river hydrology regarding the intensity and duration of floods and droughts can induce interannual variations in the biotic and abiotic variables that regulate fish growth. However, the understanding of how interannual variability in river hydrology affects fish growth remains limited for most species and ecosystems. We evaluated how inter-annual hydrological variations within the Amazon River basin influence the growth of the catfish Pseudoplaystoma fasciatum. Our research questions were as follows: Do floods lead to the faster growth of P. fasciatum and droughts lead to the slower growth? And do floods and droughts affect all age classes in the same manner? We sampled 364 specimens of P. fasciatum from five sites in the Amazon basin, estimated their growth rates, and related the growth rates to indices of the intensity of floods and droughts. We fitted linear mixed-effects models to test the relationship between growth increments and hydrological indices (with F and D quantifying the intensities of floods and droughts, respectively), age as fixed effects, and basins and Fish ID as random effects. We found an inverse relationship between the increment width in the fish hard parts and hydrological indices. That is, intense floods and droughts negatively affected the growth rates. We also found that the growth of P. fasciatum was no different in years with intense and mild floods across age classes 1–5, although was different for age class 6. However, the growth of P. fasciatum was faster in years of mild droughts for all age classes. Our results showing that the growth of P. fasciatum was slower in years of intense droughts are supported by those of previous studies in the Amazon basin and elsewhere. However, our results showing for the first time that the growth of P. fasciatum is slower in years of intense flooding is the opposite of patterns found in other studies. These results thus suggest that the growth of P. fasciatum is maximized within an optimum range of hydrological conditions, where neither floods nor droughts are intense.
Key Contribution: This study evaluated how inter-annual hydrological variations within the Amazon basin influence the growth of the catfish P. fasciatum. We found the growth of P. fasciatum is maximized within an optimum range of hydrological conditions, when neither floods nor droughts are intense.

Graphical Abstract

1. Introduction

Somatic growth is a fundamental biological process in the life cycle and population dynamics of fish [1]. Along with recruitment and natural and fishing mortality, growth is a major determinant of harvestable fish production and yield models, with growth parameters often being used to estimate sustainable harvest levels [2]. Discerning how intrinsic (within-individual) and extrinsic (environmental) factors affect fish growth promotes the understanding of the complex dynamics that drive the fitness and dynamics of whole fish populations.
Environmental factors—such as temperature, prey availability, and hydrology—influence fish growth [3]. In river floodplain ecosystems, seasonal fluctuations in river water levels, termed flood pulses, influence fish growth [4,5,6], as well as most aspects of fish life [7]. Seasonally, flood pulses lead to patterns of fish growth [4,8,9,10]. In general, fish grow faster during the high-water season and slower during the low-water season [4,9,11,12], as shown by studies on four continents [4,9,10,11,12,13,14,15,16,17,18,19,20,21]. During the rising and high-water season, most fish species grow faster due to the increased availability of food, primary production, and inorganic nutrients, which cause fish fat reserves to grow to a seasonal maximum [22]. During the low-water season, food generally becomes less abundant, dissolved oxygen is often low, interspecific competition is high, and the water pH is often more acidic [23], causing fish growth rates to slow down [4]. Variations of this general seasonal pattern of fish growth may occur depending on the trophic level [4], individual age [13], species [11,13], and habitat [19].
Similar environmental influences on fish growth can occur over the course of multiple years. In many ecosystem types, interannual fluctuations in water temperature [24,25] and primary productivity [26] have been shown to cause interannual variations in the somatic growth of marine and freshwater fish species. In general, interannual fluctuations in water temperature result in a curvilinear growth curve. Fish growth is maximized in years when the temperature is in the optimum range, with growth rates decreasing in years when the temperature is above or below the optimum temperature range [26]. Interannual variations in primary productivity also affect fish growth, with higher growth rates occurring in years with more primary productivity and lower growth rates in years of less primary productivity [26].
Similar to the intra-annual effects of temperature and primary production, interannual variability in flood pulses have been shown to affect fish growth. Interannual variability in the intensity and duration of floods and droughts in river floodplains can induce variations in the biotic and abiotic variables that regulate fish growth, such as prey availability, competition, temperature, acidity, dissolved nutrients, and primary production. Years of higher- or longer-than-normal floods have been shown to lead to faster fish growth rates. Dudley [11] and Kapesky [5] studied the growth of the cichlids Tilapia rendalli, Oreochromis andersoni, and O. macrochir in Zambia and concluded that their growth rates varied yearly, with higher growth occurring in years of extended floods. Also, the growth patterns of Hyperopisus bebe, Brachysynodontis batensoda, Marcusenius cyprinoides, Oreochromis aureus, and O. niloticus were positively correlated with the intensity of floods on the Logone River in West Africa [27]. Negative effects on fish growth have been observed to occur with severe droughts. For example, Citharinus citharus, Hydrocyon brevis, and H. forskahlii grew less during a severe drought period in the Niger and Logone rivers in Senegal [28]. As a result, no fish from the first-year class survived this extreme drought, and fish older than the third-year class grew considerably slower.
Such effects of interannual variability in flood pulses on fish growth can affect the dynamics of fish populations and associated fish catches [10]. Fish growth rates can be higher during years of higher or longer floods. Consequently, the fish biomass available for harvesting can increase and result in greater-than-normal fish catches in the same or subsequent years [29]. On the other hand, in years of severe droughts, fish growth rates can decrease, causing a decrease in the biomass available for harvest. These interannual fluctuations are often observed in terms of catch per unit of effort [29].
Despite the importance of the effects of interannual variability in flood pulses on fish growth, the topic remains poorly understood for most species, including several of the most economically important species sustaining intense fishing pressure in river floodplains. For example, a literature search on the Web of Science using the terms “hydrological variation” and “fish growth”, “flood pulse variation,” “fish growth”, and “interannual water level variation” and “fish growth” returned only 28 results. Of those, only four studies investigated the interannual hydrological variation effect on fish growth. Given the fast-growing trends in the hydrological alteration of freshwater ecosystems [30], there is an urgent need to comprehend this topic.
One species for which no studies have investigated the effects of interannual variability in flood pulses on growth is Pseudoplatystoma fasciatum. This catfish species transports nutrients and connects habitats through migration [31,32]. It is also a source of food security and income for riverine people in the Amazon basin. This species is heavily fished and may be threatened by the growing construction of hydropower dams [33]. P. fasciatum is distributed in four countries of the Amazon basin, including the Amazon mainstem and the Madeira, Solimões, and Tapajós tributary rivers [31]. Understanding how interannual variability in flood pulses affects its growth is key to managing and conserving it.
P. fasciatum grows to more than one meter in length [32,34]. Its growth rates are higher during the rising-water season (typically referred to as the ascending limb of the hydrograph) and lower during the low-water season (typically referred to as the base-flow period), like most fishes in river floodplains [35]. Female P. fasciatum become sexually mature later and reach larger sizes than males [34]. P. fasciatum performs feeding and reproductive migrations accompanying seasonal hydrological variations, migrating upstream to spawn during the rising-water season [34]. The eggs and larvae of P. fasciatum drift downstream with the current during the high-water season (typically referred to as the peak-flow period) when adults and juveniles migrate laterally to the floodplains to prey on other fish and grow faster. During the falling-water season (typically referred to as the descending limb), P. fasciatum migrates back to the mainstream river and stays there for the low-water season, where it predates less and grows more slowly [31]. In line with this migratory ecology, growth studies showed that the vertebrae of P. fasciatum deposit one growth ring per year [32,34], with slower growth (opaque ring formation) occurring during the low-water season and faster growth (the hyaline ring) in the rising-water season.
Here, we evaluated how interannual variability in flood pulses influences the growth of P. fasciatum. We addressed two main research questions as follows: Do floods lead to the faster growth of P. fasciatum and droughts lead to the slower growth? Do floods and droughts affect all age classes in the same manner?

2. Materials and Methods

2.1. Study Area

We conducted this study on five sites in the Amazon River basin (Figure 1). The Amazon is a dynamic and heterogeneous basin, where fish growth rates vary over time [4,8] and likely over space, depending on variability in the biotic and abiotic factors controlling fish growth. Amazonian rivers can be classified [36,37] as (1) whitewater rivers, which originate in the Andes Mountains and are characterized by heavy suspended sediment loads and high pH; (2) blackwater rivers, which drain sandy and nutrient-poor soils, carry few suspended sediments, and have low pH and high tannin levels; and (3) clearwater rivers, which originate in the southeast region of the Amazon basin and drain the weathered highlands with neutral pH [6]. The water levels in all of these types of rivers fluctuate seasonally and interannually [38], possibly causing changes in fish growth rates.

2.2. Fish Sampling and Vertebrae Processing

We sampled a total of 364 specimens of P. fasciatum from five sites (Figure 1, Table 1) as follows: (1) 38 fish at Santarem in the Amazon River; (2) 44 fish in Manacapuru in the Solimoes River; (3) 24 fish at Itacoatiara in the Amazon River; (4) 21 fish at Guajara-Mirim in the Mamoré River; and (5) 237 fish at Porto Velho in the Madeira River, where we sampled around 30 fish per month during a year. All samples came from fish harvested by fishers who informed us of the locations where they caught them. We measured the total length of all individuals and extracted the first five vertebrae (Table 2).
We cleaned the vertebrae by boiling them in water several times and brushing away extra muscle tissue. We then stored them in 90% alcohol and dried them in an oven at 50 °C for 48 h. After drying, we photographed the first vertebra of each specimen using a reflected-light stereoscopic microscope coupled with a camera (Zeiss Group, Aalen, Germany). The images obtained were analyzed with the software AxioVision v4.8 (Zeiss Group).
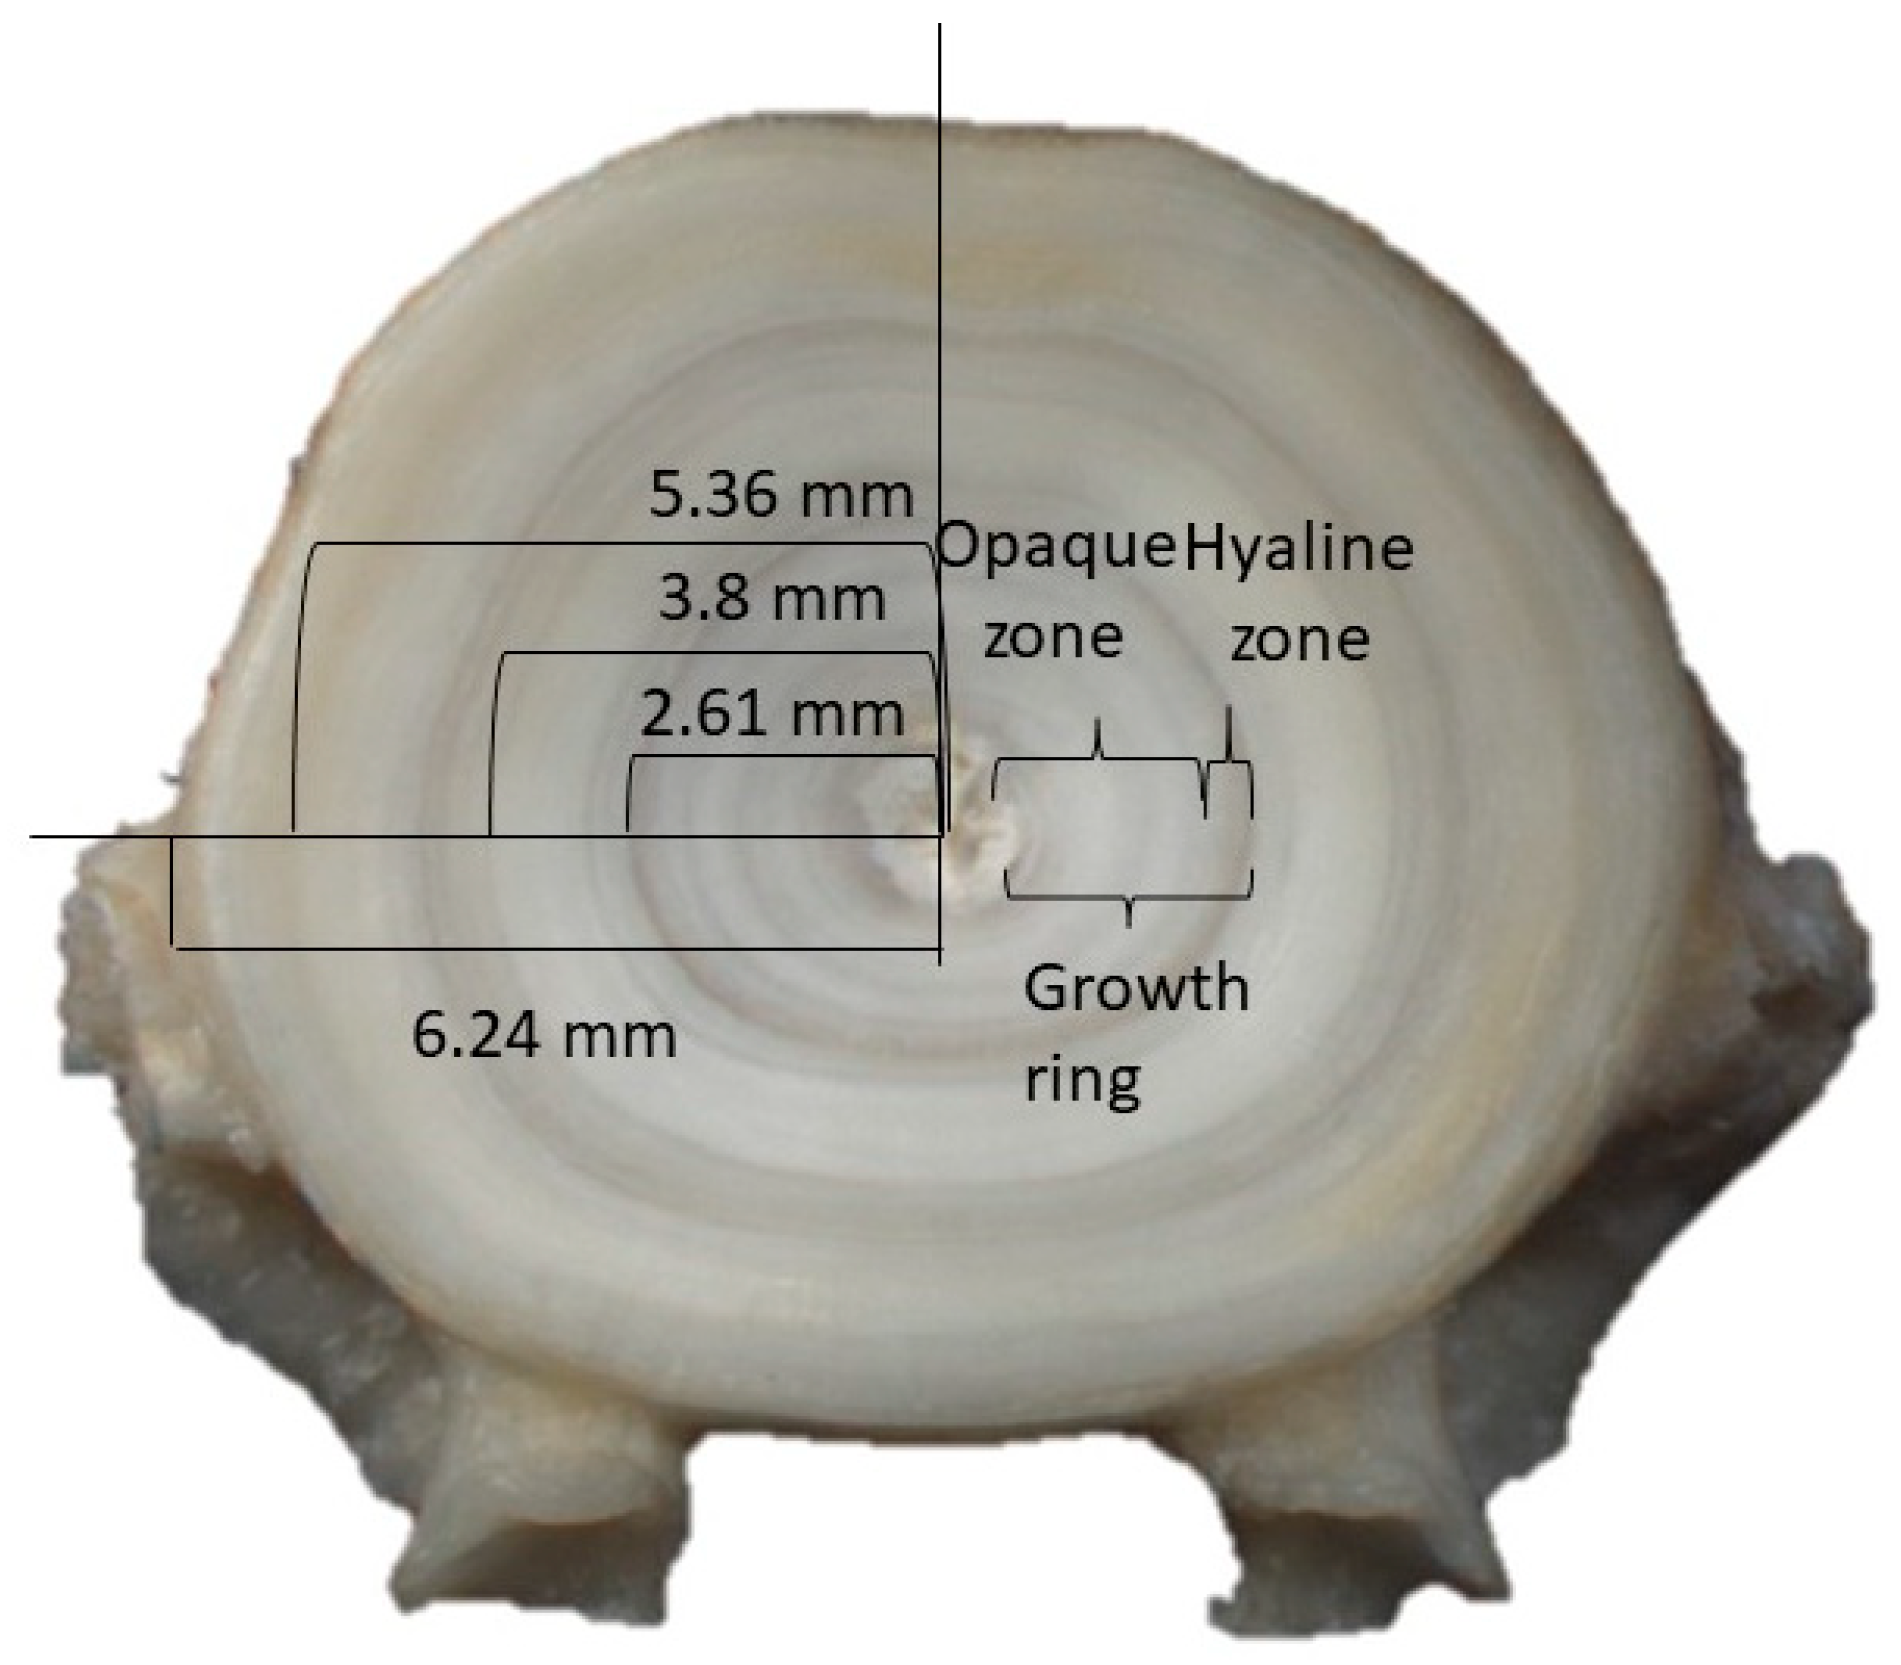
We measured the increment widths observed in the vertebra. Two independent readers (LP and FD) identified growth rings from the vertebral core to the edge. A growth ring was defined as a light larger band (opaque zone) which was deposited when the fish grew faster and a darker band (hyaline ring), which was deposited during slower growth [39] (Figure 2). In case of a disagreement between the readings, both readers conducted a third reading together. The two readers agreed on 100% of all third readings. Finally, the two readers measured the distance between each dark mark (hyaline zone) to the core and the vertebra’s radius and calculated increment widths as the length difference between the growth marks. The total number of increment widths read was 1312, following Weisberg et al. [40]. We tested the assumption that vertebral growth is proportional to somatic growth [39] by correlating the vertebrate size with the fish size.

2.3. Data Analysis

2.3.1. Age and Growth

To determine the age of the specimens and evaluate interannual patterns in the growth rates in relation to flood pulse variability, we used data concerning the increment width, month of capture, number of growth rings, and month of birth [32]. We considered the month of birth as the month beginning the reproductive period in each river. P. fasciatum usually reproduces at the beginning of the rising-water season [31]. Thus, for Porto Velho, the rising-water period was in November, for Santarem, it was February, for Manacapuru, it was April, for Itacoatiara, it was February, and for Guajara-Mirim, it was December. We calculated the age of each specimen using the following equations [34]:
E q u a t i o n   ( 1 ) :   F o r   f i s h   c a u g h t   b e f o r e   t h e   b i r t h   m o n t h :  
A = 6 N + 6 + C B 12
E q u a t i o n   ( 2 ) :   F o r   t h o s e   f i s h   c a u g h t   a f t e r   t h e   b i r t h   m o n t h :  
A = 6 N + C B 12
where A is the fish’s age, n is the number of growth rings, C is the month the fish was caught, and B is the month of birth.
To model the growth of P. fasciatum, we fitted the Von Bertalanffy growth model (VBGF) to data from all specimens in the five sites [41], as shown in Equation (3):
  L t = L [ 1 e ( k t t o ) ] ,
where Lt is the estimated length at the time t, L is the asymptotic or theoretical maximum length, k is the growth coefficient, and t0 is the theoretical age when the length is equal to zero.

2.3.2. Hydrological Indexes

We calculated two hydrological indices for each river, estimating the intensity and duration of floods (F) and droughts (D) (Figure 3). To calculate these indexes, we first estimated the bankfull level, which is the level at which rising waters, on average, overflow the river channel and flood the adjacent floodplains. We used the approach used by Castello et al. [29], who estimated the bankfull level based on field estimates of flooding of vegetated floodplain habitats near the municipality of Tefe on the Solimões River of the Amazon basin [42,43]. Castello et al. [29] estimated that low, swampy chavascal woodland vegetation in várzea floodplain ecosystems similar to those in this study become flooded each year at 42% and 45%, respectively, of water-level differences between the minimum and maximum water levels during the years the studies were conducted. We used these same estimates of bankfull levels for our five study sites by applying those percentages to equivalent historical hydrological data from 1998 to 2022. Although the resulting bankfull estimates lack validation, they should not affect our analyses much because it is the interannual variability in flood and drought indices, and not their specific absolute magnitude, that is the main subject of investigation here.
Using the bankfull estimates, we calculated F and D. To calculate F, we first plotted the curve of the daily water level specific to each sampling location per year and the bankfull curve. The daily water levels were obtained in the database of the Brazilian National Water Agency for each sampling site. Then, we summed the daily water levels of the high-water season and subtracted the values of the bankfull. Similarly, we calculated D per year by summing the daily water levels during the low-water season and subtracted the bankfull level (Figure 3).

2.3.3. Statistical Analysis

To evaluate whether floods lead to faster growth and droughts lead to slower growth, we fitted linear mixed effects models (Equation (3)) to the data following Weisberg et al. [40]. We tested the relationship between the log of increment widths (continuous variable), the scaled flood pulses indices (F and D) (continuous variables), and the age (continuous variable) as fixed effects, and basins (categorical) and Fish ID (numerical) as random effects. Linear mixed-effect models are helpful for this objective because they use random effects to represent data hierarchy while testing for differences in growth along environmental gradients at a population level, as shown in Weisberg et al. [40]. We first explored the data, looking for outliers, collinearity, relationships, and independence in our data, following the protocol described in [44]. This data set consisted of multiple width increments, F and D, the fish age in each basin, and Fish ID. We used the lme4 package [45] within the software environment R to fit the model in Equation (4):
I = β 0 + β 1 A g e + β 2 F + β 3 D + 1 :   B a s i n + 1 :   F i s h   I D + ε i
where I is the increment width, Age is the age of capture, F and D are the flood pulse indices, Basin is the basin where each fish originated, Fish ID is a random number attributed to each fish in which the increments were analyzed, and β0, β1, β2, and β3 are the random intercepts, which are assumed to be normally distributed with mean 0 and variance σ2.
Model assumptions were assessed through plotting residuals versus fitted values, versus each covariate in the model, and versus each covariate not in the model. We assessed the residuals for temporal and spatial dependency.
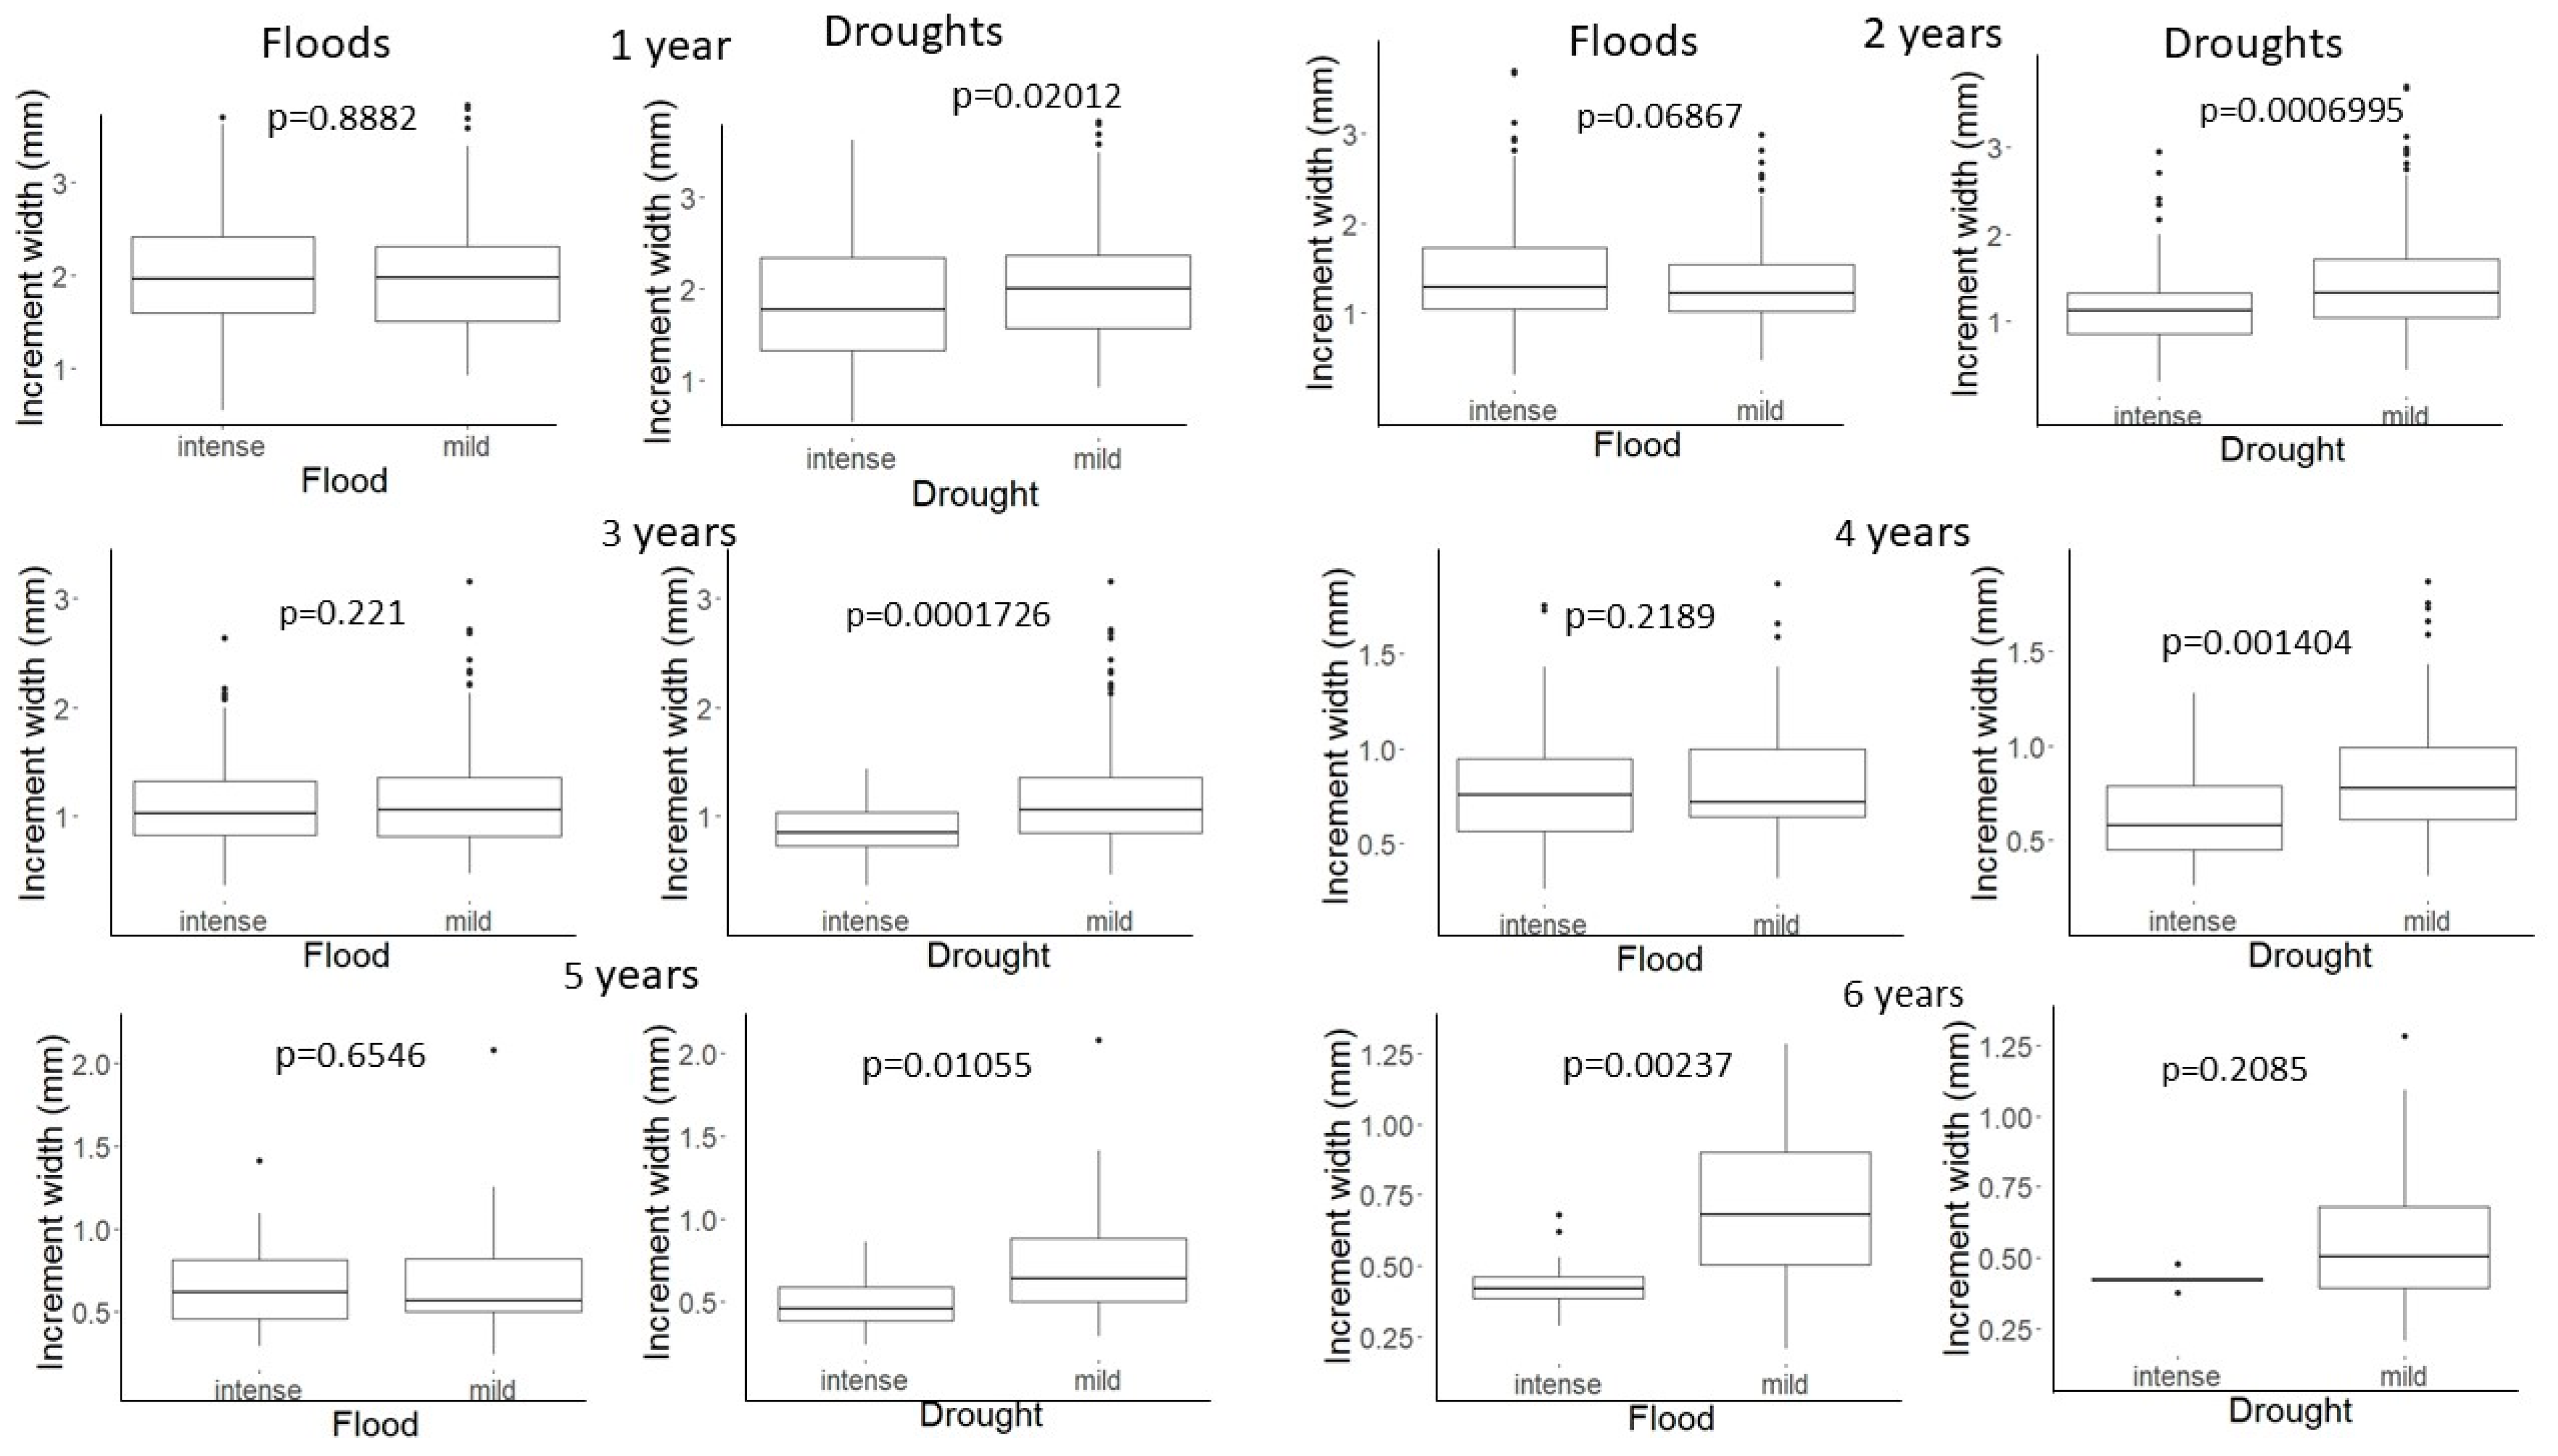
Finally, to assess whether floods and droughts affect all age classes in the same manner, we performed several analyses of variance (ANOVAs). For each age class, we compared increment widths where F and D were “intense” and “mild”; in other words, we tested whether the growth rates increased or decreased when the intensity of F and D were greater. We evaluated whether particular years were “intense” or “mild” hydrologically by first calculating F indices for every year during an eight-year period for each site, and then classifying them as ‘intense’ if F was greater than the average and ‘mild’ if F was smaller than the average. We used the same procedure to classify D for intense and mid drought years, as shown in Figure 2. All statistical analyses were made using original code implemented within the RStudio 2023.09.1+494 software [46].

3. Results

3.1. General Growth

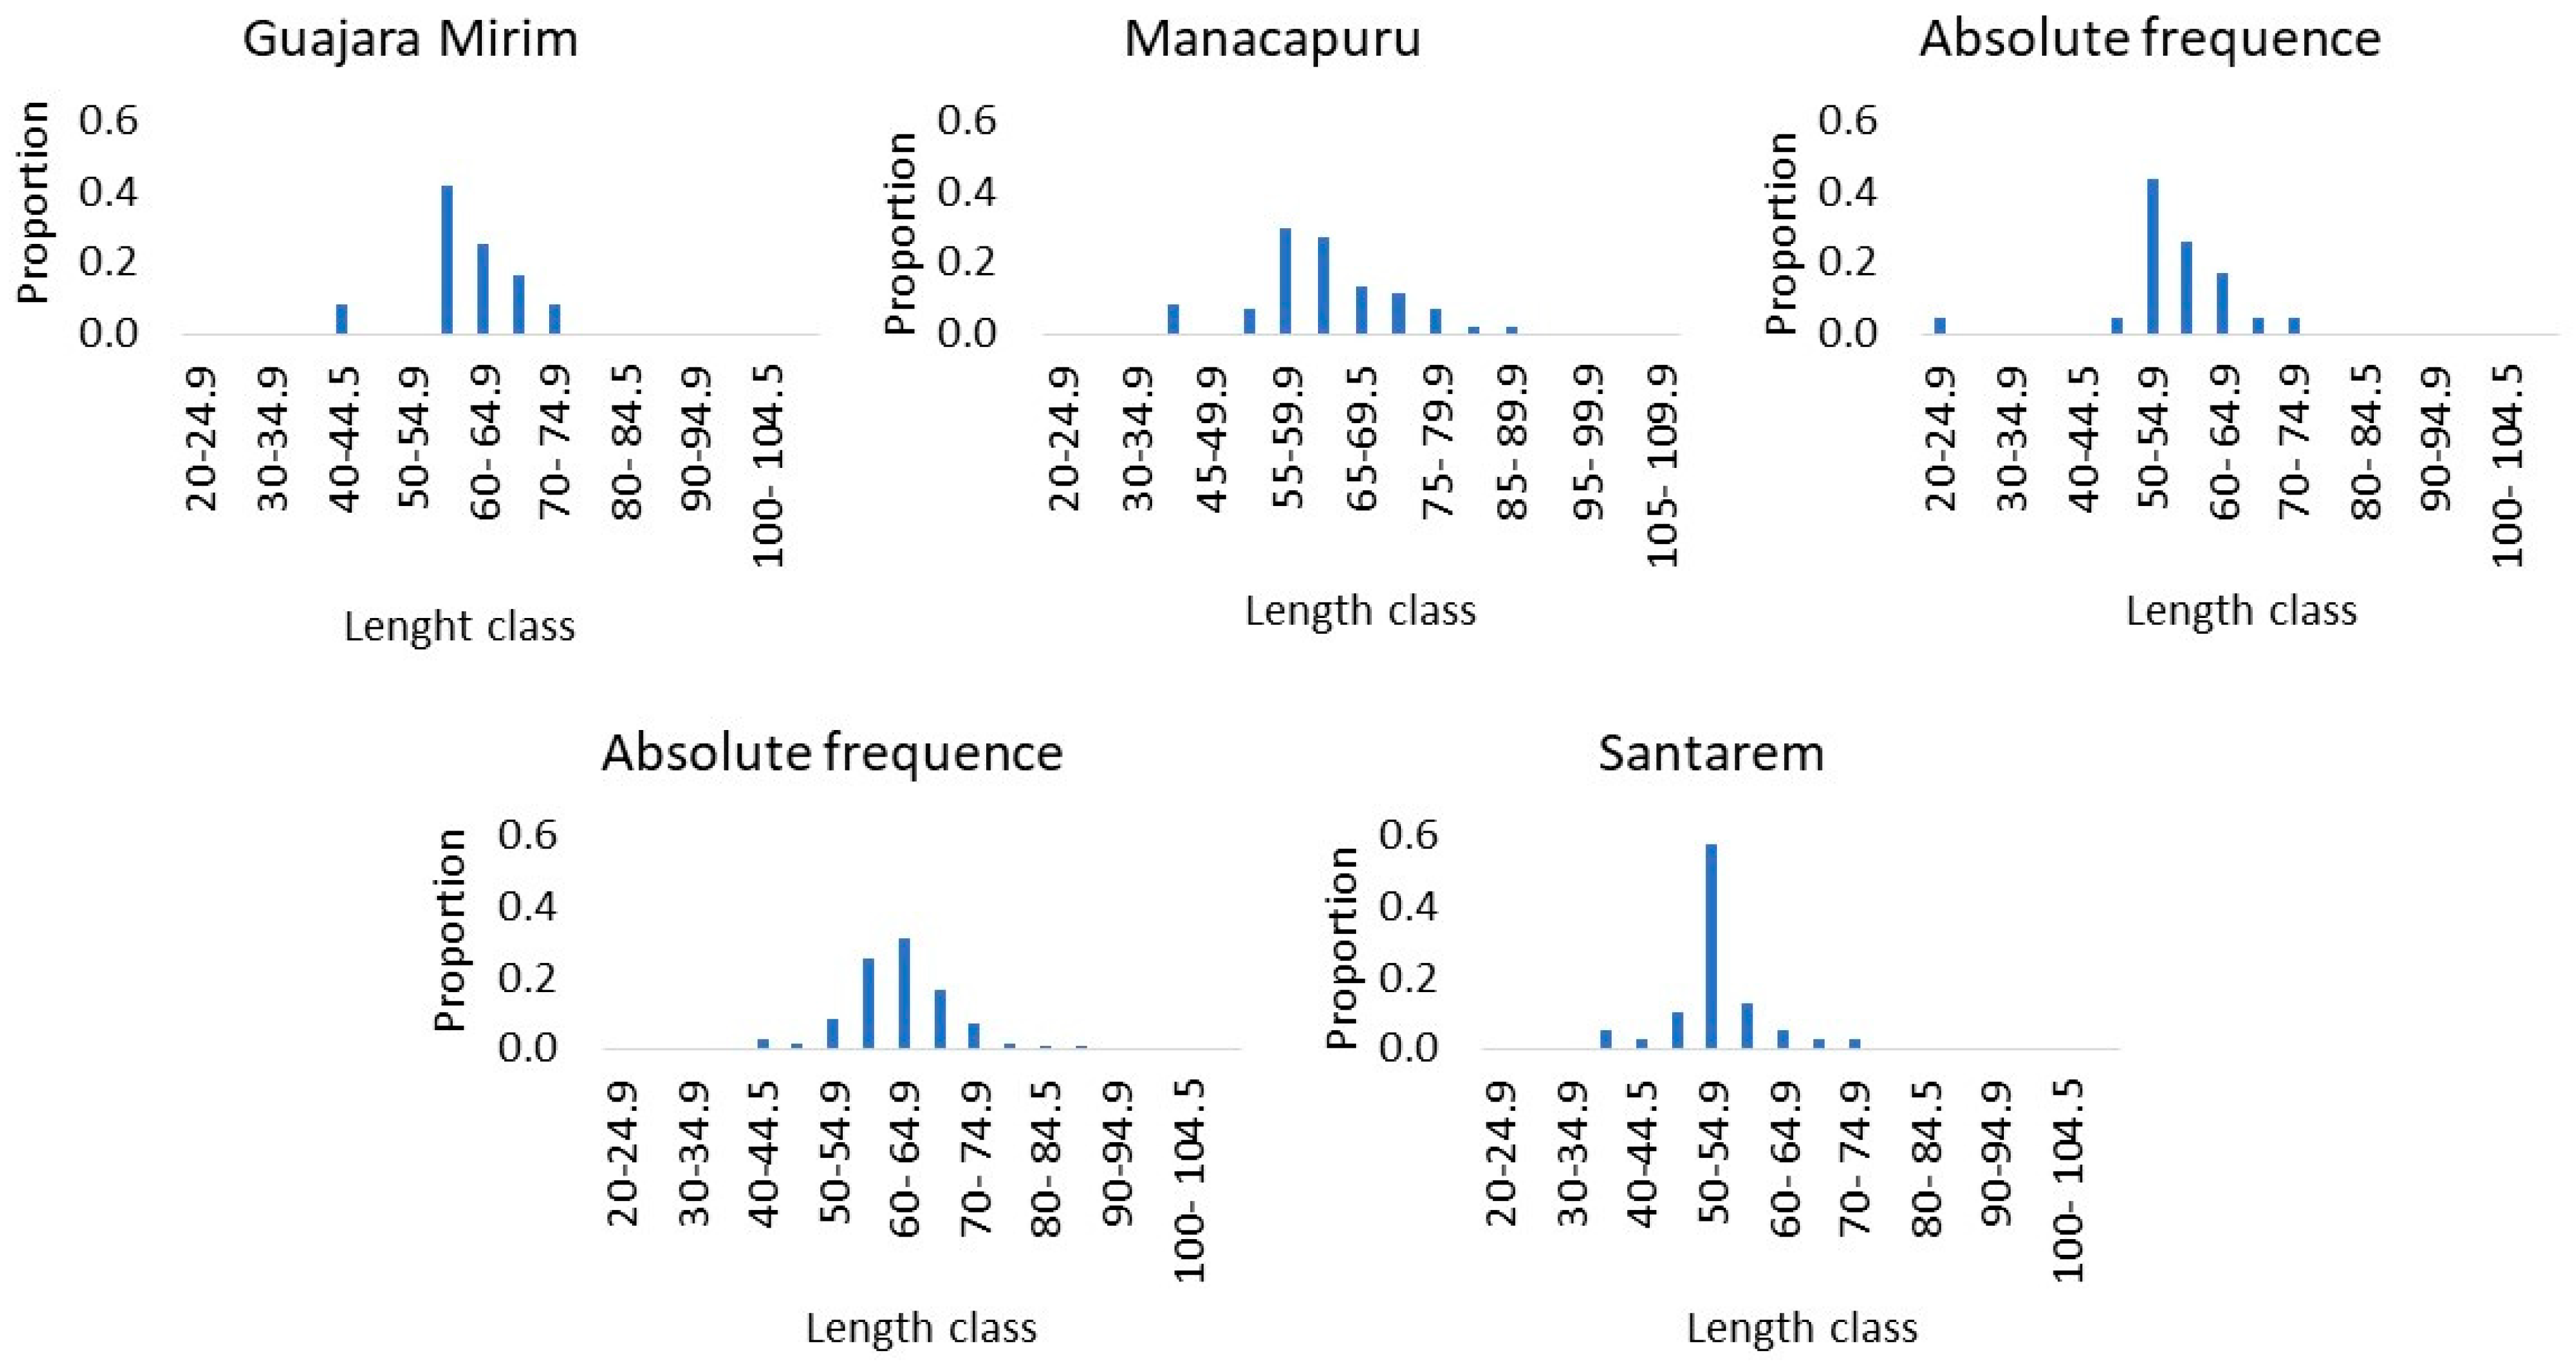
The length of the specimens collected varied among basins and ranged from 23 to 105 cm in total length (TL), with the bulk of the sampled specimens measuring between 35 and 80 cm TL (Figure 4; Table 1).
The width of the growth increments varied substantially across the five sites and inversely with the mean radius of the growth marks (Figure 5). For example, the mean increment width for the first growth ring at Guajara-Mirim was 2.4 mm ± 0.3; at Itacoatiara, it was 2.3 mm ± 0.4; at Porto Velho, it was 2.12 mm ± 0.57; at Manacapuru, it was 1.5 ± 0.4; and at Santarem, it was 1.7 mm ± 0.4. All the other increment widths also varied considerably, with a 23% variation in the second growth ring, 27% in the third, 30% in the fourth, and 34% in the fifth growth ring.
We performed our VBGF analysis with the data pooled between all sites because we did not have a sufficient sample size to adequately perform it per site (Table 3). However, we acknowledge that these are probably distinct populations with distinct growth patterns.
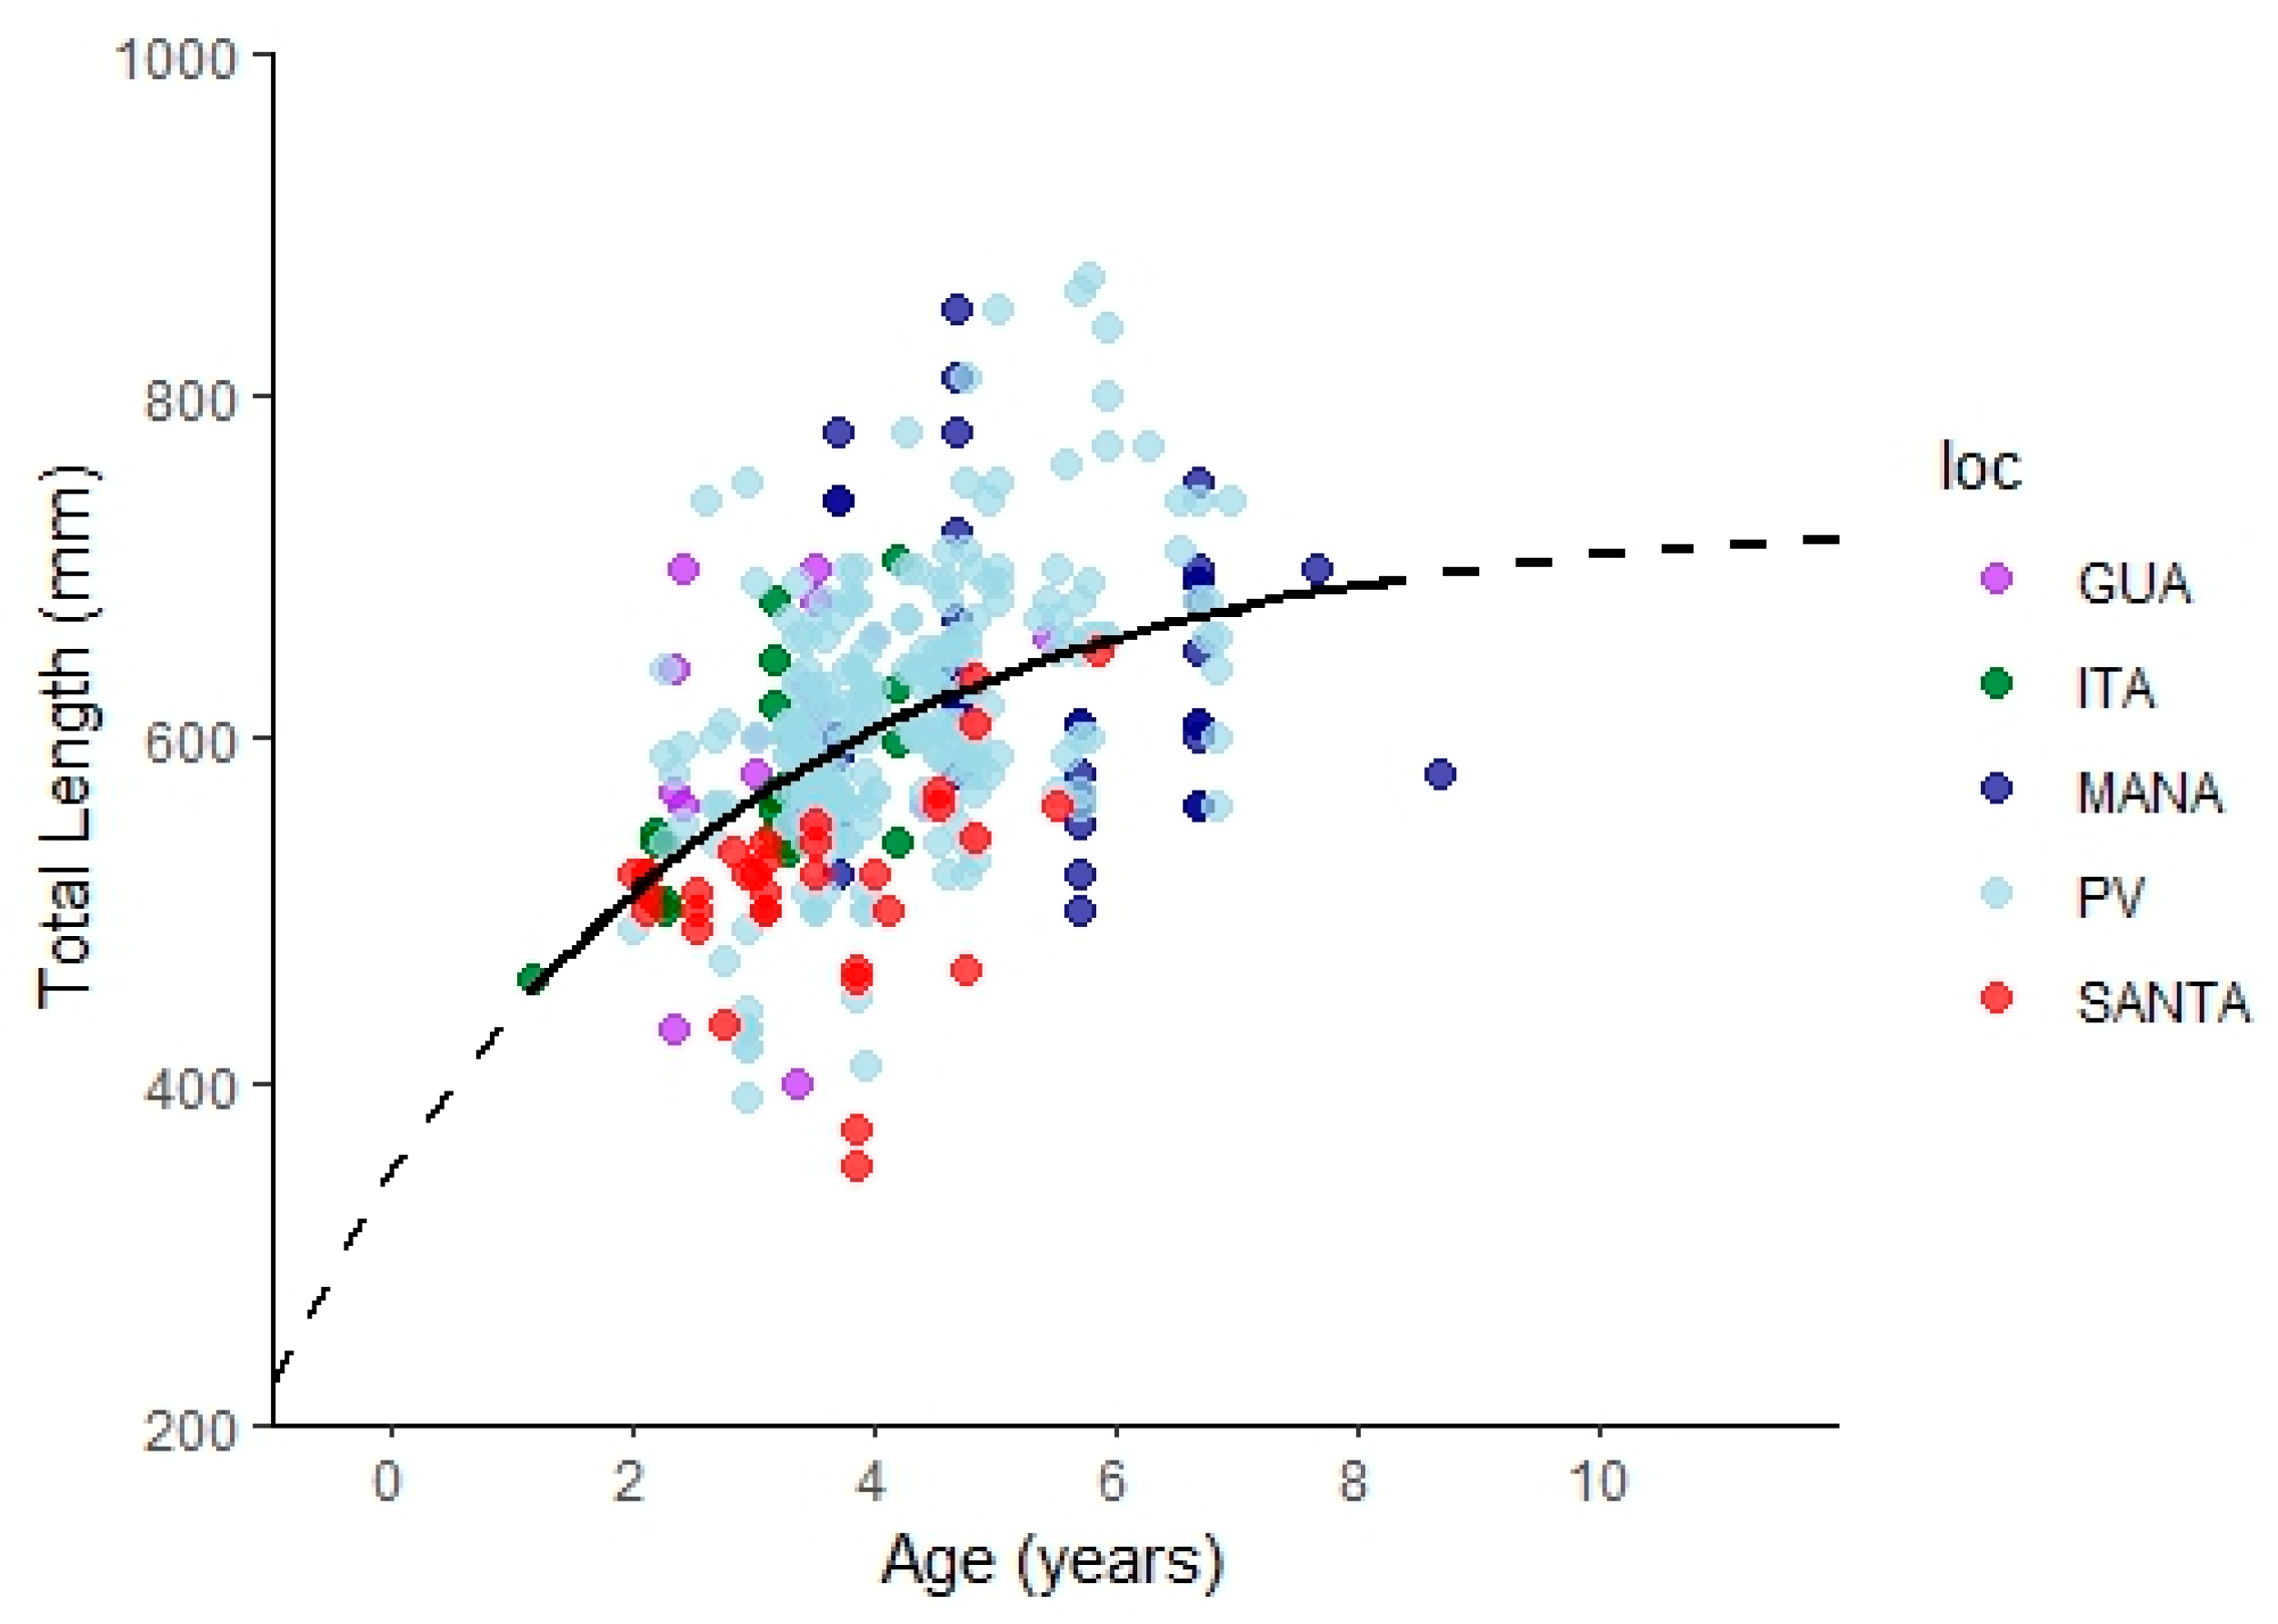
We assessed the congruence of our growth data (Figure 6; Table 3) with equivalent data from the literature in order to assess the support for our results. We found that our length-at-age estimates were roughly but not fully congruent with those of prior studies (Table 4). For age class one, our estimated length-at-age was longer than those by Loubens and Panfilli [34], who studied in the Mamore Basin in the Bolivian Amazon, and Armas et al. [32] in the Peruvian Amazon. For age classes two to five, our estimated lengths were roughly in line with those of previous studies. For age classes six to eight, our estimated length-at-age was shorter than previous studies.

3.2. Do Floods Lead to the Faster Growth of P. fasciatum and Droughts Lead to the Slower Growth?

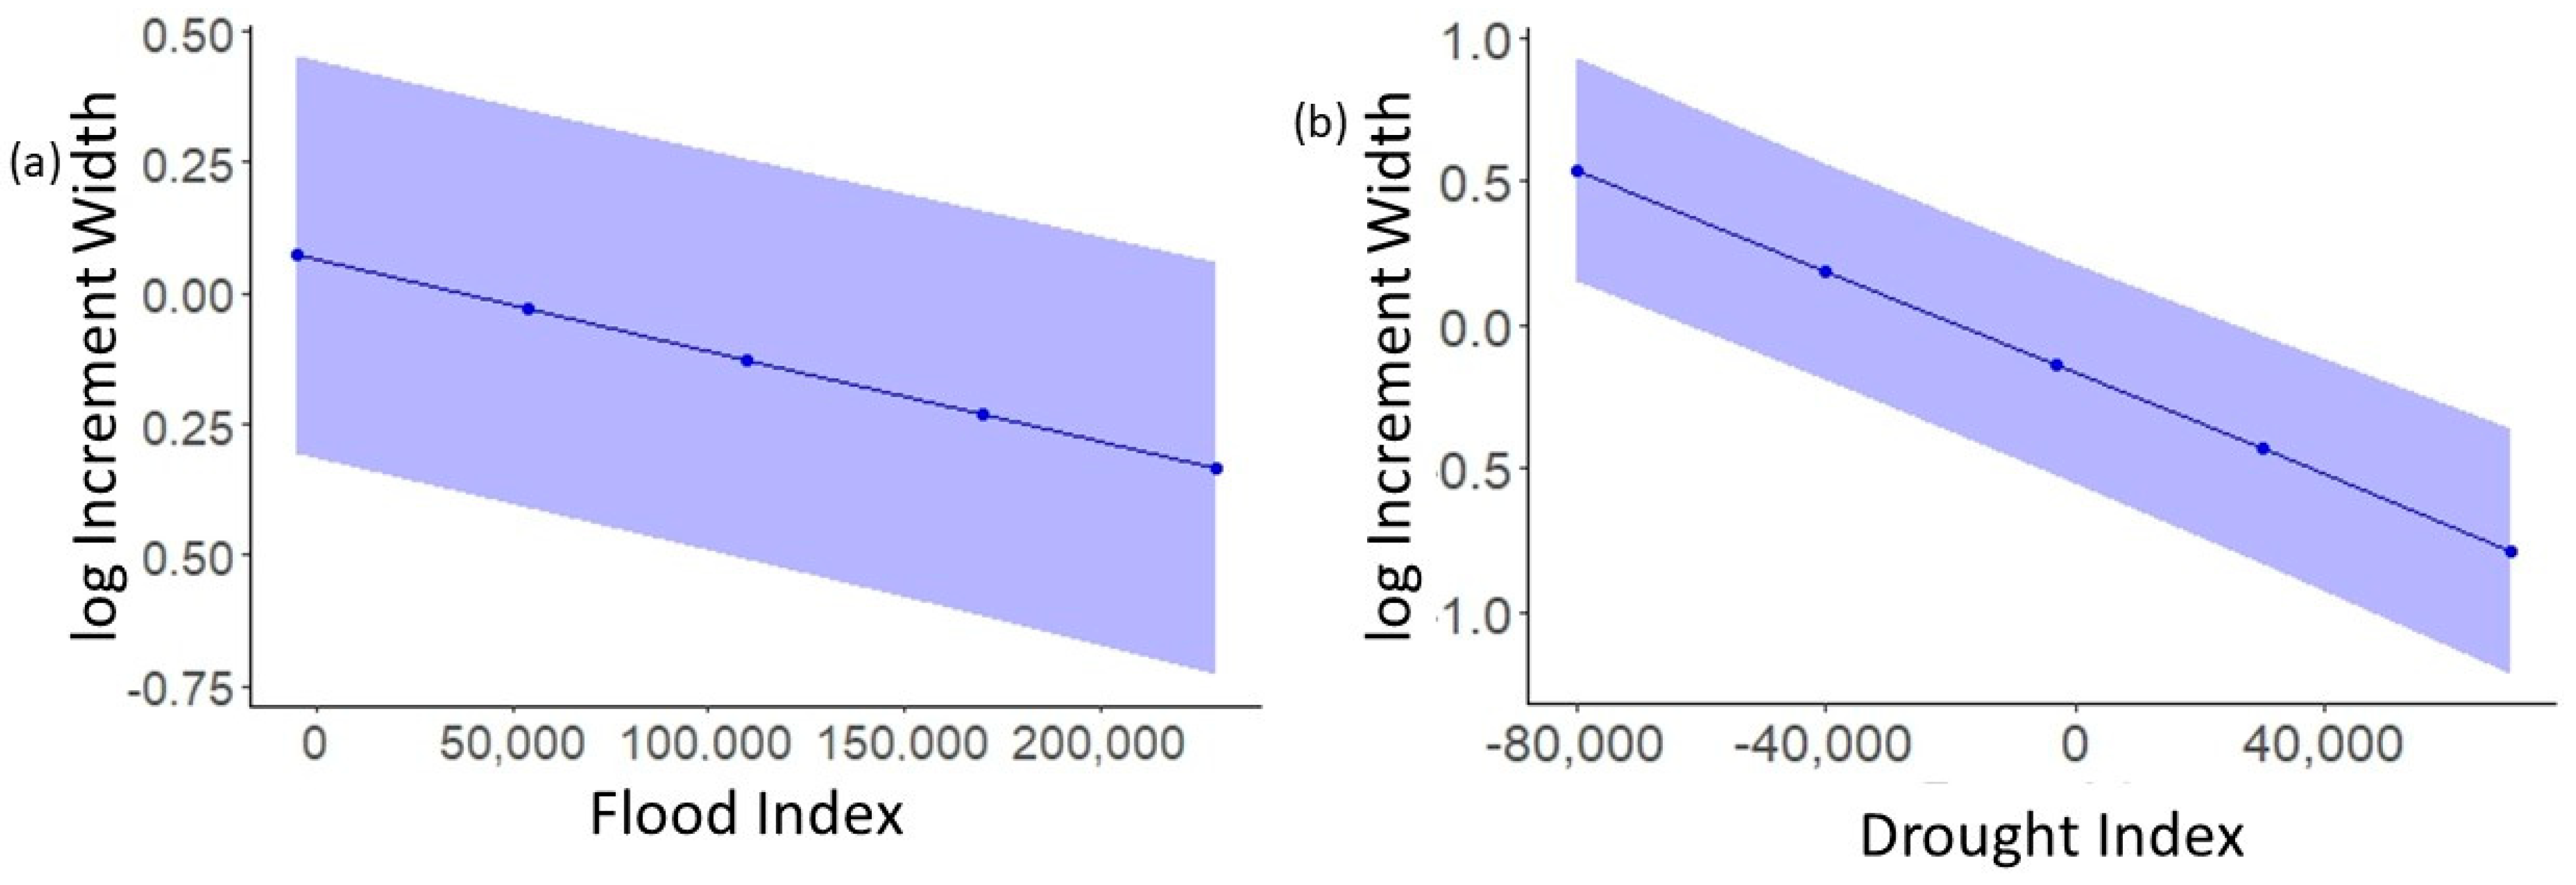
Regarding our first question of whether floods lead to faster growth and droughts lead to slower growth in P. fasciatum, we found an inverse relationship between increment width and flood pulse indices. The flood magnitude negatively affected growth rates (Figure 7), as the estimate of F was −1.731 × 10⁻⁶, and there was strong evidence in support of this effect (p = 1.65 × 10⁻⁸) as the C.I. ranged from −2.342 × 10⁻⁶ to −1.117 × 10⁻⁶ (Table 5). Similarly, we found that growth rates were negatively affected by drought (Figure 7), as the estimate of D was −8.838 × 10⁻⁶ (Table 4), and it also had strong evidence in support of this effect (p = 1 × 10⁻⁷) as the C.I. ranged from −1.086 × 10⁻⁵ to −6.801 × 10⁻⁶ (Table 5). The magnitude of the effect of D was greater than that of F on the growth of P. fasciatum (Table 4).
Overall, our modeling of interannual flood pulse effects on growth explained only a small portion of the variability in age and flood pulse indices (marginal R2 = 0.247), indicating that other variables that were not accounted for influenced the growth of P. fasciatum. Age was the predictor that most influenced growth, as expected; its effect was five orders of magnitude greater than the effect of F and D (Table 4).

3.3. Do Floods and Droughts Affect All Age Classes in the Same Manner?

We found that the effect of flood and drought on growth rates varied across age classes (ANOVA, p < 0.05). For floods, P. fasciatum had similar growth rates between “intense” and “mild” floods across all age classes with the exception of age-class six, in which “mild” floods led to an increase in growth rates (Figure 8). On the other hand, for droughts, P. fasciatum had higher growth rates in years of “mild” droughts in all age classes. The lack of statistical significance for age-class six could be due to the small sample size for this age class. (Table 1; Figure 8).

4. Discussion

The inverse relationships that we found between the growth of P. fasciatum and flood and drought intensity are consistent with some, but not all studies reported in the literature. Our results showing that the growth of P. fasciatum is slower in years of intense droughts are supported by those of Bayley [4] on characiform fishes in the Amazon basin and in other ecosystems [5,11,12,13,14,19]. However, our results showing that the growth of P. fasciatum is slower in years of intense flood is the opposite of the pattern found by other studies for multiple taxa [5,10,11]. These results collectively suggest that the growth of P. fasciatum is maximized within an optimum range of hydrological conditions, with floods and droughts both decreasing growth rates in direct proportion with their intensity.
Our results showing that the growth of P. fasciatum is slower in years of intense droughts are supported by those of other studies on other species. Bayley [4] found that growth rates of Acarichthys heckli, Colossoma macropomum, Triportheus albus, T. aungulatus, T. elongatus, Brycon melanopterus, and Prochilodus nigricans decreased with the drought intensity. He suggested that this decrease in growth rates occurs because food availability and living space are at a minimum during such events [4]. Also, the data on fish conditions in the Amazon basin reported by Junk [22] show that the maximum fat content for piscivorous species occurs during the low-water season, supporting our findings. Moreover, although we do not have a full understanding of the ecological mechanisms driving the growth of P. fasciatum, we find it difficult to conceive that food availability would be a limiting factor during droughts in the Amazon basin, given that piscivorous species such as P. fasciatum are likely to find a greater availability of prey in the high-density conditions created by intense droughts. More than food availability, it is possible that intense droughts may entail physiological constraints, such as sub-optimal high temperatures and/or low oxygen concentrations [47,48,49], limiting the growth of P. fasciatum. We suggest that more studies are needed to better comprehend the growth of river floodplain fishes such as P. fasciatum.
Our result showing that the growth of P. fasciatum is slower in years of intense floods was not supported by some other studies [4,11,12]. Previous studies show that fish grow faster in years of intense floods; this was the case for T. andersoni, T. macrochir, T. rendalii, Acarichthys heckli, Colossoma macropomum, Triportheus albus, T. aungulatus, T. elongatus, Brycon melanopterus, and Prochilodus nigricans [4]. One possible explanation for this lack of support for our results is that these fishes are herbivorous and omnivorous species, which do find greater food availability during the high-water season when new terrestrial areas are inundated, favoring primary production [4]. However, P. fasciatum is a piscivorous species whose growth appears to be affected differently by seasonal floods. Both biotic and abiotic factors could explain a decrease in the growth rates as a function of flood intensity. One abiotic factor that could explain why the growth of P. fasciatum is slower in years of intense floods is anoxia. Junk et al. [23] showed that after the peak of the flood, dissolved oxygen levels are minimal, creating anoxic conditions that could possibly lead to lower growth rates in P. fasciatum. One biotic factor that likely influences the growth of P. fasciatum is prey density, which can decrease with the dilution effect during increasing flood intensity, thereby decreasing the growth rates. Supporting this explanation are results from the study by Junk [22], showing that the lowest fat content occurs at the peak of the flood season for three predatory species in the Amazon, likely reflecting the ecological mechanisms that, in our study, may have led to slower growth for P. fasciatum during intense floods. Junk [22] inferred that seasonality in fat content in fishes occurs because fish need to accumulate energy to perform spawning migrations. P fasciatum performs spawning migration at the beginning of the rising-water season, so they had probably consumed all fat content after spawning in the high-water season.
Our finding that the growth of P. fasciatum is inversely related to the intensity of floods and droughts is partially supported by our age-specific assessment of flood pulse effects on growth. Our finding of an inverse relationship between the growth of P. fasciatum and the intensity of droughts is supported by our age-specific assessment, showing that all age classes grew faster in years of mild droughts (F (1,364) = 5.45, p = 0.02). However, our findings that the growth of P. fasciatum was inversely related to the intensity of floods was not supported by our age-specific assessment, as there were no differences in growth in the years of mild and intense floods in all but age class six (F (1,25) = 11.438, p = 0.002). One possible explanation for the age-specific results not supporting the inverse relationship between the intensity of floods could be due to the limited statistical power of our study for age-specific assessment. The sample size of each age class varied with a few specimens younger than 2 years and older than 4 years old, which limited the ability of the ANOVA to reject the null hypothesis of there being no differences in growth between mild and intense floods. This limited statistical power was exacerbated by the effect of floods on growth being one-fifth that of droughts.
Our study had limitations regarding spatial sample heterogeneity, size–length variability among rivers, and variations in growth increments among basins. First, our sample sizes were not the same across the five sites. However, we note that this sample set should not affect the analysis of our assessment of whether floods and droughts affect growth rates. This is because, to address this question, we used a linear mixed modeling approach that leads to improved estimates for groups (e.g., sites) with small sample sizes through partial pooling across sites.
Second, the length distribution of our sampled specimens varied among rivers, having very few large and small specimens, which might explain the differences in our length–age data. For example, these length data do not have an ideal representation of the full spectrum of sizes of the P. fasciatum described by Loubens and Panfilli [34] (Table 1). However, this less-than-ideal representativity of length in our samples does not compromise our main analysis of focus here. For our first research question, we do not need an ideal representation of length distribution to evaluate the effects of interannual hydrological variation on the growth rates of P. fasciatum. For our second research question, our dataset contained few observations of very young and old fish, so, despite the low size representation, we were still able to analyze whether all age classes were affected by the hydrological variation.
Finally, our data on the widths of growth increments varied among rivers. However, that variation in the widths of growth increments might have affected the results from our ANOVAs by introducing variability, hence decreasing its statistical ability to differentiate the growth between intense and mild hydrological years. The observed variability in growth increments could be due to ecological reasons reflecting the different river environments, including time magnitude and the intensity of flood pulses and different anthropogenic pressures, such as deforestation, pollution, and fishing pressure. For example, the population from Santarem seems to be growing more slowly than populations at other sites (Figure 6, red circles) and is known to have been overexploited [46].
Our results have implications for the conservation and management of P. fasciatum, particularly in relation to the effects of the construction of hydropower dams and climate change. Dams alter upstream and downstream river hydrology [50]. Upstream of dams, the effects of floods and droughts are quite effectively moderated, while downstream, their intensity generally decreases, becoming milder in most cases [50,51], which, according to our results, might be beneficial for the growth of P. fasciatum. However, the impacts of dams go far beyond the modulation of hydrological events, and include the disruption of migration or access to spawning sites [30], impacts that could overcome any growth benefits of milder hydrological events. That is, even though the growth of P. fasciatum might increase downstream of the dam with milder hydrological variation, the negative effects of dams on migratory species might be more harmful to P. fasciatum because they threaten the completion of the species’ life cycle. Another implication of our study concerns the impacts of climate change. Climate change in the Amazon basin is expected to increase the frequency and intensity of extreme flood and drought events [52,53], which would be expected to induce the slower growth of P. fasciatum. Our results thus provide a hypothesis for testing the use of growth data to be collected over time.

5. Conclusions

We conclude that the growth of P. fasciatum is maximized within an optimum range of hydrological conditions, when neither floods nor droughts are intense. Thus, our results have implications for the conservation and management of P. fasciatum, particularly in relation to the construction and operation of hydropower dams and climate change.

Author Contributions

Conceptualization, L.A.P. and L.C.; sampling, E.R.F.R.; methodology, L.A.P., C.R.d.C.D.; validation, L.A.P. and F.D.; formal analysis, L.A.P.; data curation, L.A.P.; writing—original draft preparation, L.A.P.; writing—review and editing, L.A.P., F.D., E.H., and L.C.; supervision, L.C., F.D., and E.H. All authors have read and agreed to the published version of the manuscript.

Funding

This research was funded by NSF grant number 1852113 and Rufford Foundation, grant number 33099-1.

Institutional Review Board Statement

Not applicable. All samples came from fish harvested by fishers who informed us of the locations where they caught them.

Informed Consent Statement

Not applicable.

Data Availability Statement

The data are available on request from the corresponding author.

Acknowledgments

The authors thank the National Science Foundation, Rufford Foundation, and the Department of Fish and Wildlife Conservation at Virginia Polytechnic Institute and State University, as well as the handling editor and anonymous peer reviewers for comments that strengthened the manuscript.

Conflicts of Interest

The authors declare no conflicts of interest.

References

  1. Isely, J.J.; Grabowski, T.B. Age and Growth. In Analysis and Interpretation of Freshwater Fisheries Data; Guy, C.S., Brown, M.L., Eds.; American Fisheries Society: Bethesda, MD, USA, 2007; Volume 187228, pp. 1–43. [Google Scholar]
  2. Hüssy, K.; Radtke, K.; Plikshs, M.; Oeberst, R.; Baranova, T.; Krumme, U.; Sjöberg, R.; Walther, Y.; Mosegaard, H. Challenging ICES Age Estimation Protocols: Lessons Learned from the Eastern Baltic Cod Stock. ICES J. Mar. Sci. 2016, 73, 2138–2149. [Google Scholar] [CrossRef]
  3. Jobling, M. Environmental Factors and Rates of Development and Growth. In Handbook of Fish Biology and Fisheries; Wiley: Hoboken, NJ, USA, 2002; Volume 1, pp. 97–121. [Google Scholar]
  4. Bayley, P.B. Factors Affecting Growth Rates of Young Tropical Floodplain Fishes: Seasonality and Density-Dependence. Environ. Biol. Fishes 1988, 21, 127–142. [Google Scholar] [CrossRef]
  5. Kapetsky, J.M. Growth, Mortality, and Production of Five Fish Species of the Kafue River Floodplain, Zambia. Ph.D. Dissertation, University of Michigan, Ann Arbor, MI, USA, 1974. [Google Scholar]
  6. Junk, W.J. General Aspects of Floodplain Ecology with Special Reference to Amazonian Floodplains. In The Central Amazon Floodplain: Ecology of a Pulsing System; Springer: Berlin/Heidelberg, Germany, 1989; pp. 3–20. [Google Scholar]
  7. Bayley, P.B. Understanding Large River Floodplain Ecosystems. Bioscience 1995, 45, 153–158. [Google Scholar] [CrossRef]
  8. Perez, A.; Fabre, N. Seasonal Growth and Life istory of the Catfish Calophysus macropterus (Lichtenstein, 1819) (Siluriformes: Pimelodidae) from the Amazon Floodplain. J. Appl. Ichthyol. 2009, 25, 343–349. [Google Scholar] [CrossRef]
  9. Pérez, A.; Fabré, N.N. Life-History Characteristics of Pseudoplatystoma metaense (Teleostei: Siluriformes: Pimelodidae) from the Northwestern Orinoco River Basin. Neotrop. Ichthyol. 2018, 16, 160140. [Google Scholar] [CrossRef]
  10. Graaf, G. The Flood Pulse and Growth of Floodplain Fish in Bangladesh. Fish Manag. Ecol. 2003, 10, 241–247. [Google Scholar] [CrossRef]
  11. Dudley, R.G. Growth of Tilapia of the Kafue Floodplain, Zambia: Predicted Effects of the Kafue Gorge Dam. Trans. Am. Fish Soc. 1974, 103, 281–291. [Google Scholar] [CrossRef]
  12. Welcomme, R.L. River Fisheries; FAO Fisheries Technical Paper 262; Food and Agriculture Organization of the United Nations: Rome, Italy, 1985; ISBN 9251022992. [Google Scholar]
  13. Bartels, A.D. Growth of Selected Fishes in Navigation Pool 8 of the Upper Mississippi River: A Test of the Flood-Pulse Concept. Master’s Thesis, University of Wisconsin, La Crosse, WI, USA, 1997. [Google Scholar]
  14. Gutreuter, S.; Bartels, A.D.; Irons, K.; Sandheinrich, M.B. Evaluation of the Flood-Pulse Concept Based on Statistical Models of Growth of Selected Fishes of the Upper Mississippi River System. Can. J. Fish. Aquat. Sci. 1999, 56, 2282–2291. [Google Scholar] [CrossRef]
  15. Nelson, B.D. Hydrologic and Temperature Regime Influence on Growth and Recruitment of Fishes in an Upper Midwest Riverine Ecosystem. Master Thesis, Minnesota State University, Mankato, MN, USA, 2015. [Google Scholar]
  16. Perry, R.C.; Casselman, J.M. Factors Affecting Year-Class Strength and Growth of Lake Whitefish (Coregonus clupeaformis) in Impounded Lakes as Revealed by Otolith Chronologies. J. Fish Biol. 2022, 100, 1510–1527. [Google Scholar] [CrossRef]
  17. Porter, J.M.; Schramm, H.L. Effects of Temperature and Hydrology on Growth of Shovelnose Sturgeon Scaphirhynchus platorynchus (Rafinesque, 1820) in the Lower Mississippi River. J. Appl. Ichthyol. 2018, 34, 21–28. [Google Scholar] [CrossRef]
  18. Reckahn, J.A. Long-Term Cyclical Trends in Growth of Lake Whitefish in South Bay, Lake Huron. Trans. Am. Fish. Soc. 1986, 115, 787–804. [Google Scholar] [CrossRef]
  19. Sommer, T.R.; Nobriga, M.L.; Harrell, W.C.; Batham, W.; Kimmerer, W.J. Floodplain Rearing of Juvenile Chinook Salmon: Evidence of Enhanced Growth and Survival. Can. J Fish. Aquat. Sci. 2001, 58, 325–333. [Google Scholar] [CrossRef]
  20. Sweetman, P.C.; Haddy, J.A.; Robertson, S.G. Multi-Decadal Variation in Cohort Specific Sex Ratios and Otolith Increment Growth Characteristics of Juvenile Blue Grenadier (Macruronus novaezelandiae). Fish Res. 2018, 201, 79–87. [Google Scholar] [CrossRef]
  21. Tonkin, Z.D.; King, A.J.; Robertson, A.I.; Ramsey, D.S.L. Early Fish Growth Varies in Response to Components of the Flow Regime in a Temperate Floodplain River. Freshw. Biol. 2011, 56, 1769–1782. [Google Scholar] [CrossRef]
  22. Junk, W.J. Temporary Fat Storage, an Adaptation of Some Fish Species to the Water Level Fluctuations and Related Environmental Changes of the Amazon River. Amazoniana 1985, IX, 315–351. [Google Scholar]
  23. Junk, W.J.; Soares, G.M.; Carvalho, F.M. Distribution of Fish Species in a Lake of the Amazon River Floodplain near Manaus (Lago Camaleão), with Special Reference to Extreme Oxygen Conditions. Amaz. Limnol. Oecologia Reg. Syst. Fluminis Amazon. 1983, 7, 397–431. [Google Scholar]
  24. Morrongiello, J.R.; Thresher, R.E.; Hobbs, N.T. A Statistical Framework to Explore Ontogenetic Growth Variation among Individuals and Populations: A Marine Fish Example. Ecol. Monogr. 2015, 85, 93–115. [Google Scholar] [CrossRef]
  25. Nicolle, P.; Hughes, J.; Fowler, A.; Schilling, H.T. Long-Term Increase in Growth of an Estuarine Predator, Mulloway Argyrosomus japonicus, Predicted to Continue under Future Warming Scenarios. Mar. Ecol. Prog. Ser. 2022, 688, 1–17. [Google Scholar] [CrossRef]
  26. Martino, J.C.; Fowler, A.J.; Doubleday, Z.A.; Grammer, G.L.; Gillanders, B.M. Using Otolith Chronologies to Understand Long-Term Trends and Extrinsic Drivers of Growth in Fisheries. Ecosphere 2019, 10, e02553. [Google Scholar] [CrossRef]
  27. Benech, V.; Quensiere, J. Migrations de Poissons Vers Le Lac Tchad à La Décrue de La Plaine Inondée Du Nord-Cameroun. Rev. Hydrobiol. Trop. 1982, 15, 253–270. [Google Scholar]
  28. Reizer, C. Definition d’une Politique d’Amanagement Des Resources Halieutiques d’un Ecosysteme Aquatique Complexe Par 1’Etude de Son Environnement Abiotique, Biotique et Anthropique. Le Fleuve Senegal, Moyen et Inferieur. Ph.D. Dissertation, University of Luxembourg, Luxembourg, 1974; 226p. [Google Scholar]
  29. Castello, L.; Isaac, V.J.; Thapa, R. Flood Pulse Effects on Multispecies Fishery Yields in the Lower Amazon. R Soc. Open Sci. 2015, 2, 150299. [Google Scholar] [CrossRef] [PubMed]
  30. Duponchelle, F.; Isaac, V.J.; Rodrigues Da Costa Doria, C.; Van Damme, P.A.; Herrera-R, G.A.; Anderson, E.P.; Cruz, R.E.A.; Hauser, M.; Hermann, T.W.; Agudelo, E.; et al. Conservation of Migratory Fishes in the Amazon Basin. Aquat. Conserv. 2021, 31, 1087–1105. [Google Scholar] [CrossRef]
  31. Pereira, L.A.; Castello, L.; Orth, D.J.; Duponchelle, F.; Hallerman, E.M. A Synthesis of the Ecology and Conservation of Pseudoplatystoma Catfishes in the Neotropics. Fishes 2023, 8, 306. [Google Scholar] [CrossRef]
  32. Armas, M.; Ortega, H.; García-Vasquez, A.; García-Dávila, C.; Vargas, G.; Nuñez, J.; Renno, J.-F.; Duponchelle, F. Age Validation and Contrasted Growth Performances of Pseudoplatystoma punctifer (Siluriformes: Pimelodidae) in Two River Systems of the Western Amazon. Neotropl. Ichthyol. 2022, 20, e210099. [Google Scholar] [CrossRef]
  33. De Jesús, M.J.; Kohler, C.C. The Commercial Fishery of the Peruvian Amazon. Fisheries 2004, 29, 10–16. [Google Scholar] [CrossRef]
  34. Loubens, G.; Panfili, J. Biologie de Pseudoplatystoma fasciatum et P. tigrinum (Teleostei: Pimelodidae) Dans Le Bassin Du Mamoré (Amazonie Bolivienne). Ichthyol. Explor. Freshw. 2000, 11, 13–34. [Google Scholar]
  35. Araujo-Lima, C.A.; Ruffino, M.L. Migratory Fishes of the Brazilian Amazon. In Migratory Fishes of South America; Carolsfeld, J., Harvey, B., Ross, C., Ross, C., Eds.; World Fisheries Trust: Victoria, BC, USA, 2003; pp. 233–301. [Google Scholar]
  36. Sioli, H. The Amazon and Its Main Affluents: Hydrography, Morphology of the River Courses, and River Types. In The Amazon: Limnology and Landscape Ecology of a Mighty Tropical River and Its Basin; Sioli, H., Ed.; Springer: Dordrecht, Netherlands, 1984; pp. 127–165. [Google Scholar]
  37. Junk, W.J.; Piedade, M.T.F.; Schöngart, J.; Cohn-Haft, M.; Adeney, J.M.; Wittmann, F. A Classification of Major Naturally-Occurring Amazonian Lowland Wetlands. Wetlands 2011, 31, 623–640. [Google Scholar] [CrossRef]
  38. Junk, W.J.; Bayley, P.B.; Sparks, R.E. The Flood Pulse Concept in River-Floodplain Systems. In Proceedings of the International Large River Symposium, Honey Harbour, Canada, 14–21 September 1986; Dodge, D.P., Ed.; Canadian Special Publication of Fisheries and Aquatic Sciences: Ottawa, Canada, 1989; Volume 106, pp. 110–127. [Google Scholar]
  39. Campana, S.E. Accuracy, Precision and Quality Control in Age Determination, Including a Review of the Use and Abuse of Age Validation Methods. J. Fish Biol. 2001, 59, 197–242. [Google Scholar] [CrossRef]
  40. Weisberg, S.; Spangler, G.; Richmond, L.S. Mixed Effects Models for Fish Growth. Can. J. Fish. Aquat. Sci. 2010, 67, 269–277. [Google Scholar] [CrossRef]
  41. Von Bertalanffy, L. A Quantitative Theory of Organic Growth (Inquiries on Growth Laws). Hum. Biol. 1938, 10, 181–213. [Google Scholar]
  42. Ayres, J.M. As Matas de Várzea Do Mamirauá; Conselho Nacional de Desenvolvimento Científico e Tecnológico, Sociedade Civil Mamirauá: Tefe, Brazil, 1995. [Google Scholar]
  43. Castello, L. Lateral Migration of Arapaima gigas in Floodplains of the Amazon. Ecol. Freshw. Fish 2008, 17, 38–46. [Google Scholar] [CrossRef]
  44. Zuur, A.F.; Ieno, E.N.; Elphick, C.S. A Protocol for Data Exploration to Avoid Common Statistical Problems. Methods Ecol. Evol. 2010, 1, 3–14. [Google Scholar] [CrossRef]
  45. Bates, D.; Mächler, M.; Bolker, B.; Walker, S. Fitting Linear Mixed-Effects Models Using Lme4. J. Stat. Softw. 2014, 67, 1–48. [Google Scholar]
  46. Ruffino, M.L.; Isaac, V.J. Dinamica Populacional de Surubim-Tigre, Pseudoplatystoma. Acta Amazon 1999, 29, 463–476. [Google Scholar] [CrossRef]
  47. Val, A.L.; de Almeida-Val, V.M.F. Fishes of the Amazon and Their Environment: Physiological and Biochemical Aspects; Springer Science & Business Media: Berlin/Heidelberg, Germany, 2012; Volume 32, ISBN 3642792294. [Google Scholar]
  48. Val, A.L.; Duarte, R.M.; Campos, D.; de Almeida-Val, V.M.F. Environmental Stressors in Amazonian Riverine Systems. Fish Physiol. 2022, 39, 209–271. [Google Scholar]
  49. Val, A.L.; Fearnside, P.M.; Almeida-Val, V.M.F. Environmental Disturbances and Fishes in the Amazon. J. Fish Biol. 2016, 89, 192–193. [Google Scholar] [CrossRef]
  50. Poff, N.L.; Olden, J.D. Can Dams Be Designed for Sustainability? Science 2017, 358, 1252–1253. [Google Scholar] [CrossRef]
  51. Marmulla, G. Dams, Fish and Fisheries Opportunities, Challenges and Conflict Resolution; FAO Fisheries Technical Paper 419; Food and Agriculture Organiztion of the United Nations: Rome, Italy, 2001. [Google Scholar]
  52. Konapala, G.; Mishra, A.K.; Wada, Y.; Mann, M.E. Climate Change Will Affect Global Water Availability through Compounding Changes in Seasonal Precipitation and Evaporation. Nat. Commun. 2020, 11, 3044. [Google Scholar] [CrossRef]
  53. Gloor, M.; Brienen, R.J.W.; Galbraith, D.; Feldpausch, T.R.; Schöngart, J.; Guyot, J.L.; Espinoza, J.C.; Lloyd, J.; Phillips, O.L. Intensification of the Amazon Hydrological Cycle over the Last Two Decades. Geophys. Res. Lett. 2013, 40, 1729–1733. [Google Scholar] [CrossRef]
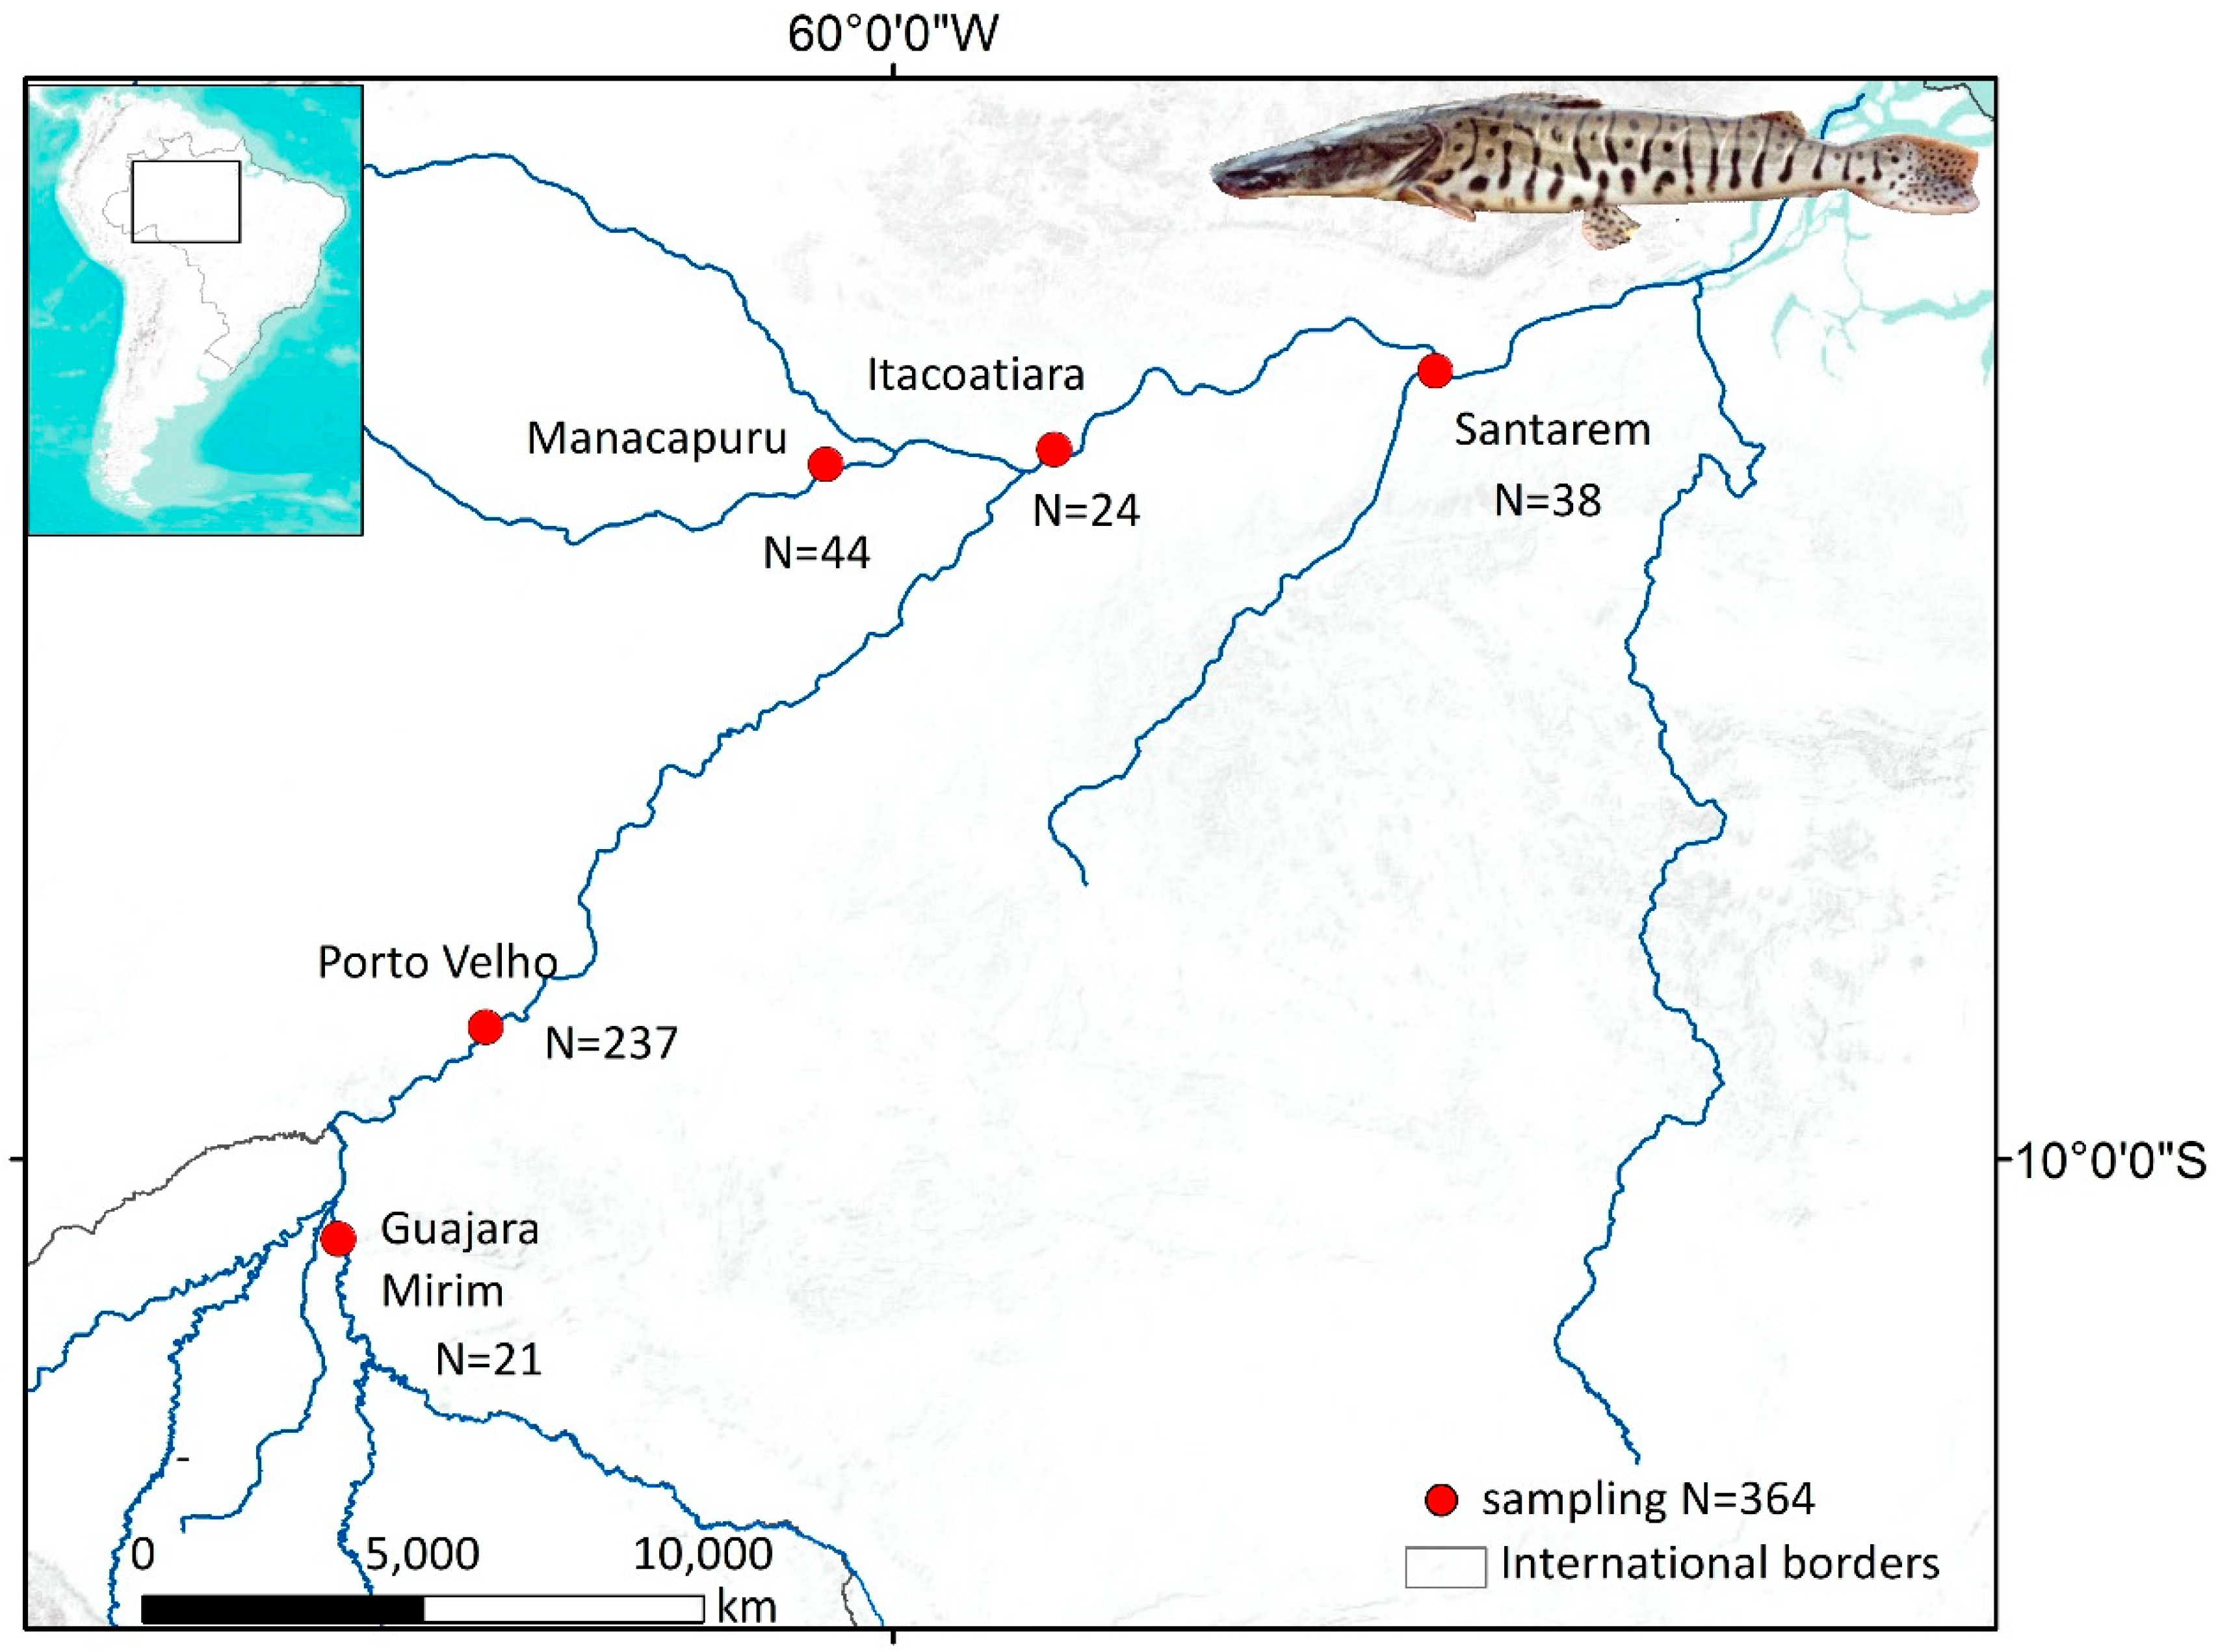
Figure 1. Map showing locations of five sites for the sampling of 364 P. fasciatum within four white water rivers in the Amazon basin. Numbers sampled at each site are shown.
Fishes 09 00223 g001
Figure 2. Vertebra of P. fasciatum showing increment width measurements and a growth ring with opaque and hyaline zones.
Fishes 09 00223 g002
Figure 3. Hydrograph of one hydrological year showing bankfull, intense, moderate, and mild flood and drought levels.
Fishes 09 00223 g003
Figure 4. Length-class frequencies of P. fasciatum by site. At Guajara-Mirim, Manacapuru, and Porto Velho, most of the specimens ranged from 55 to 75 cm. At Itacoatiara, most of specimens ranged from 50 to 65 cm, and at Santarem, most of the specimens ranged from 50 to 60 cm. A few smaller specimens (<45 cm) and larger specimens (>75 cm) were sampled at all sites.
Fishes 09 00223 g004
Figure 5. Calculated mean radius of growth marks (in blue) and mean increments (in orange) of P. fasciatum at five sites in the Amazon basin.
Fishes 09 00223 g005
Figure 6. Von Bertalanffy growth function fitted to data from all 364 P. fasciatum in five sub-basins within the Amazon basin. Fish from Guajara-Mirim are represented in purple, Manacapuru in dark blue, Itacoatiara in green, Porto Velho in light blue, and Santarem in red.
Fishes 09 00223 g006
Figure 7. Mixed-effects models of flood (a) and droughts indices (b) in relation to log (increment width) for P. fasciatum in the Amazon basin. Higher F and D indices corresponded to a decrease in the increment width.
Fishes 09 00223 g007
Figure 8. Box and whisker plots showing the growth (increment width) of six age classes of P. fasciatum for “intense” and “mild” years of floods and droughts in the Amazon with their respective p-values. The box plots indicate the lower and upper quartiles and the means (line in the boxplots).
Fishes 09 00223 g008
Table 1. Sample size distribution per age class for P. fasciatum at five sites in the Amazon basin.
Age ClassGuajara (n) Itacoatiara (n)Manacapuru (n)Porto Velho (n) Santarem (n)
101000
25602414
391209513
4648748
51012322
60011120
7001100
800200
Table 2. Sample size distribution, average length, and length range of P. fasciatum at five sites in the Amazon basin.
RivernMean Total Length (cm) ± SDTotal Length Range (cm)
Guajara Mirim2159.54 ± 7.1240–70
Itacoatiara2455.42 ± 8.7823–70.5
Manacapuru4463.41 ± 8.1550–85
Porto Velho23761.60 ± 8.1839–105
Santarem3852.25 ± 6.5235.2–73
Table 3. Von Bertalanffy growth function parameters for P. fasciatum from this study.
ParametersC.I.
2.5%97.5%
k0.290.110.48
t0−2.3−6.1−0.9
Lꝏ (mm)72.266.793.1
Table 4. Comparison of length-at-age using Von Bertalanffy growth function parameters for P. fasciatum from this study with Loubens and Panfilli [34] and Armas et al. [32].
AgeLength-at-Age (mm)
This StudyLoubens and Panfilli [34]Armas et al. [32]
1447332350
2518528463
3600669555
4570771631
5610844693
6639896743
7677934785
8690961819
Table 5. Parameter estimates of model intercept, age, F and D indices of flood and drought, respectively, associated confidence intervals and p-values, and conditional and marginal R2 calculated in the mixed-effects model analysis of the log of increments for P. fasciatum in the Amazon basin. The total number of increments analyzed was 1312 for 364 specimens of P. fasciatum. Indices F and D corresponded to each year of increment deposition.
Log (Increment) C.I.
PredictorsEstimates5%95%p-Value
Intercept−0.1291−0.010.280.5059
Age−0.1415−0.1680.11551 × 10−6
F−1.731 × 10⁻⁶−2.342 × 10⁻⁶−1.117 × 10−61.65 × 10−8
D−8.838 × 10⁻⁶−1.086 × 10⁻⁵−6.801 × 10−61 × 10−7
Marginal R20.247
Conditional R20.633
Disclaimer/Publisher’s Note: The statements, opinions and data contained in all publications are solely those of the individual author(s) and contributor(s) and not of MDPI and/or the editor(s). MDPI and/or the editor(s) disclaim responsibility for any injury to people or property resulting from any ideas, methods, instructions or products referred to in the content.