
Flood Pulse Effects on the Growth of Pseudoplatystoma fasciatum in the Amazon Basin
 ,
,  , , and
Abstract
:
1. Introduction
2. Materials and Methods
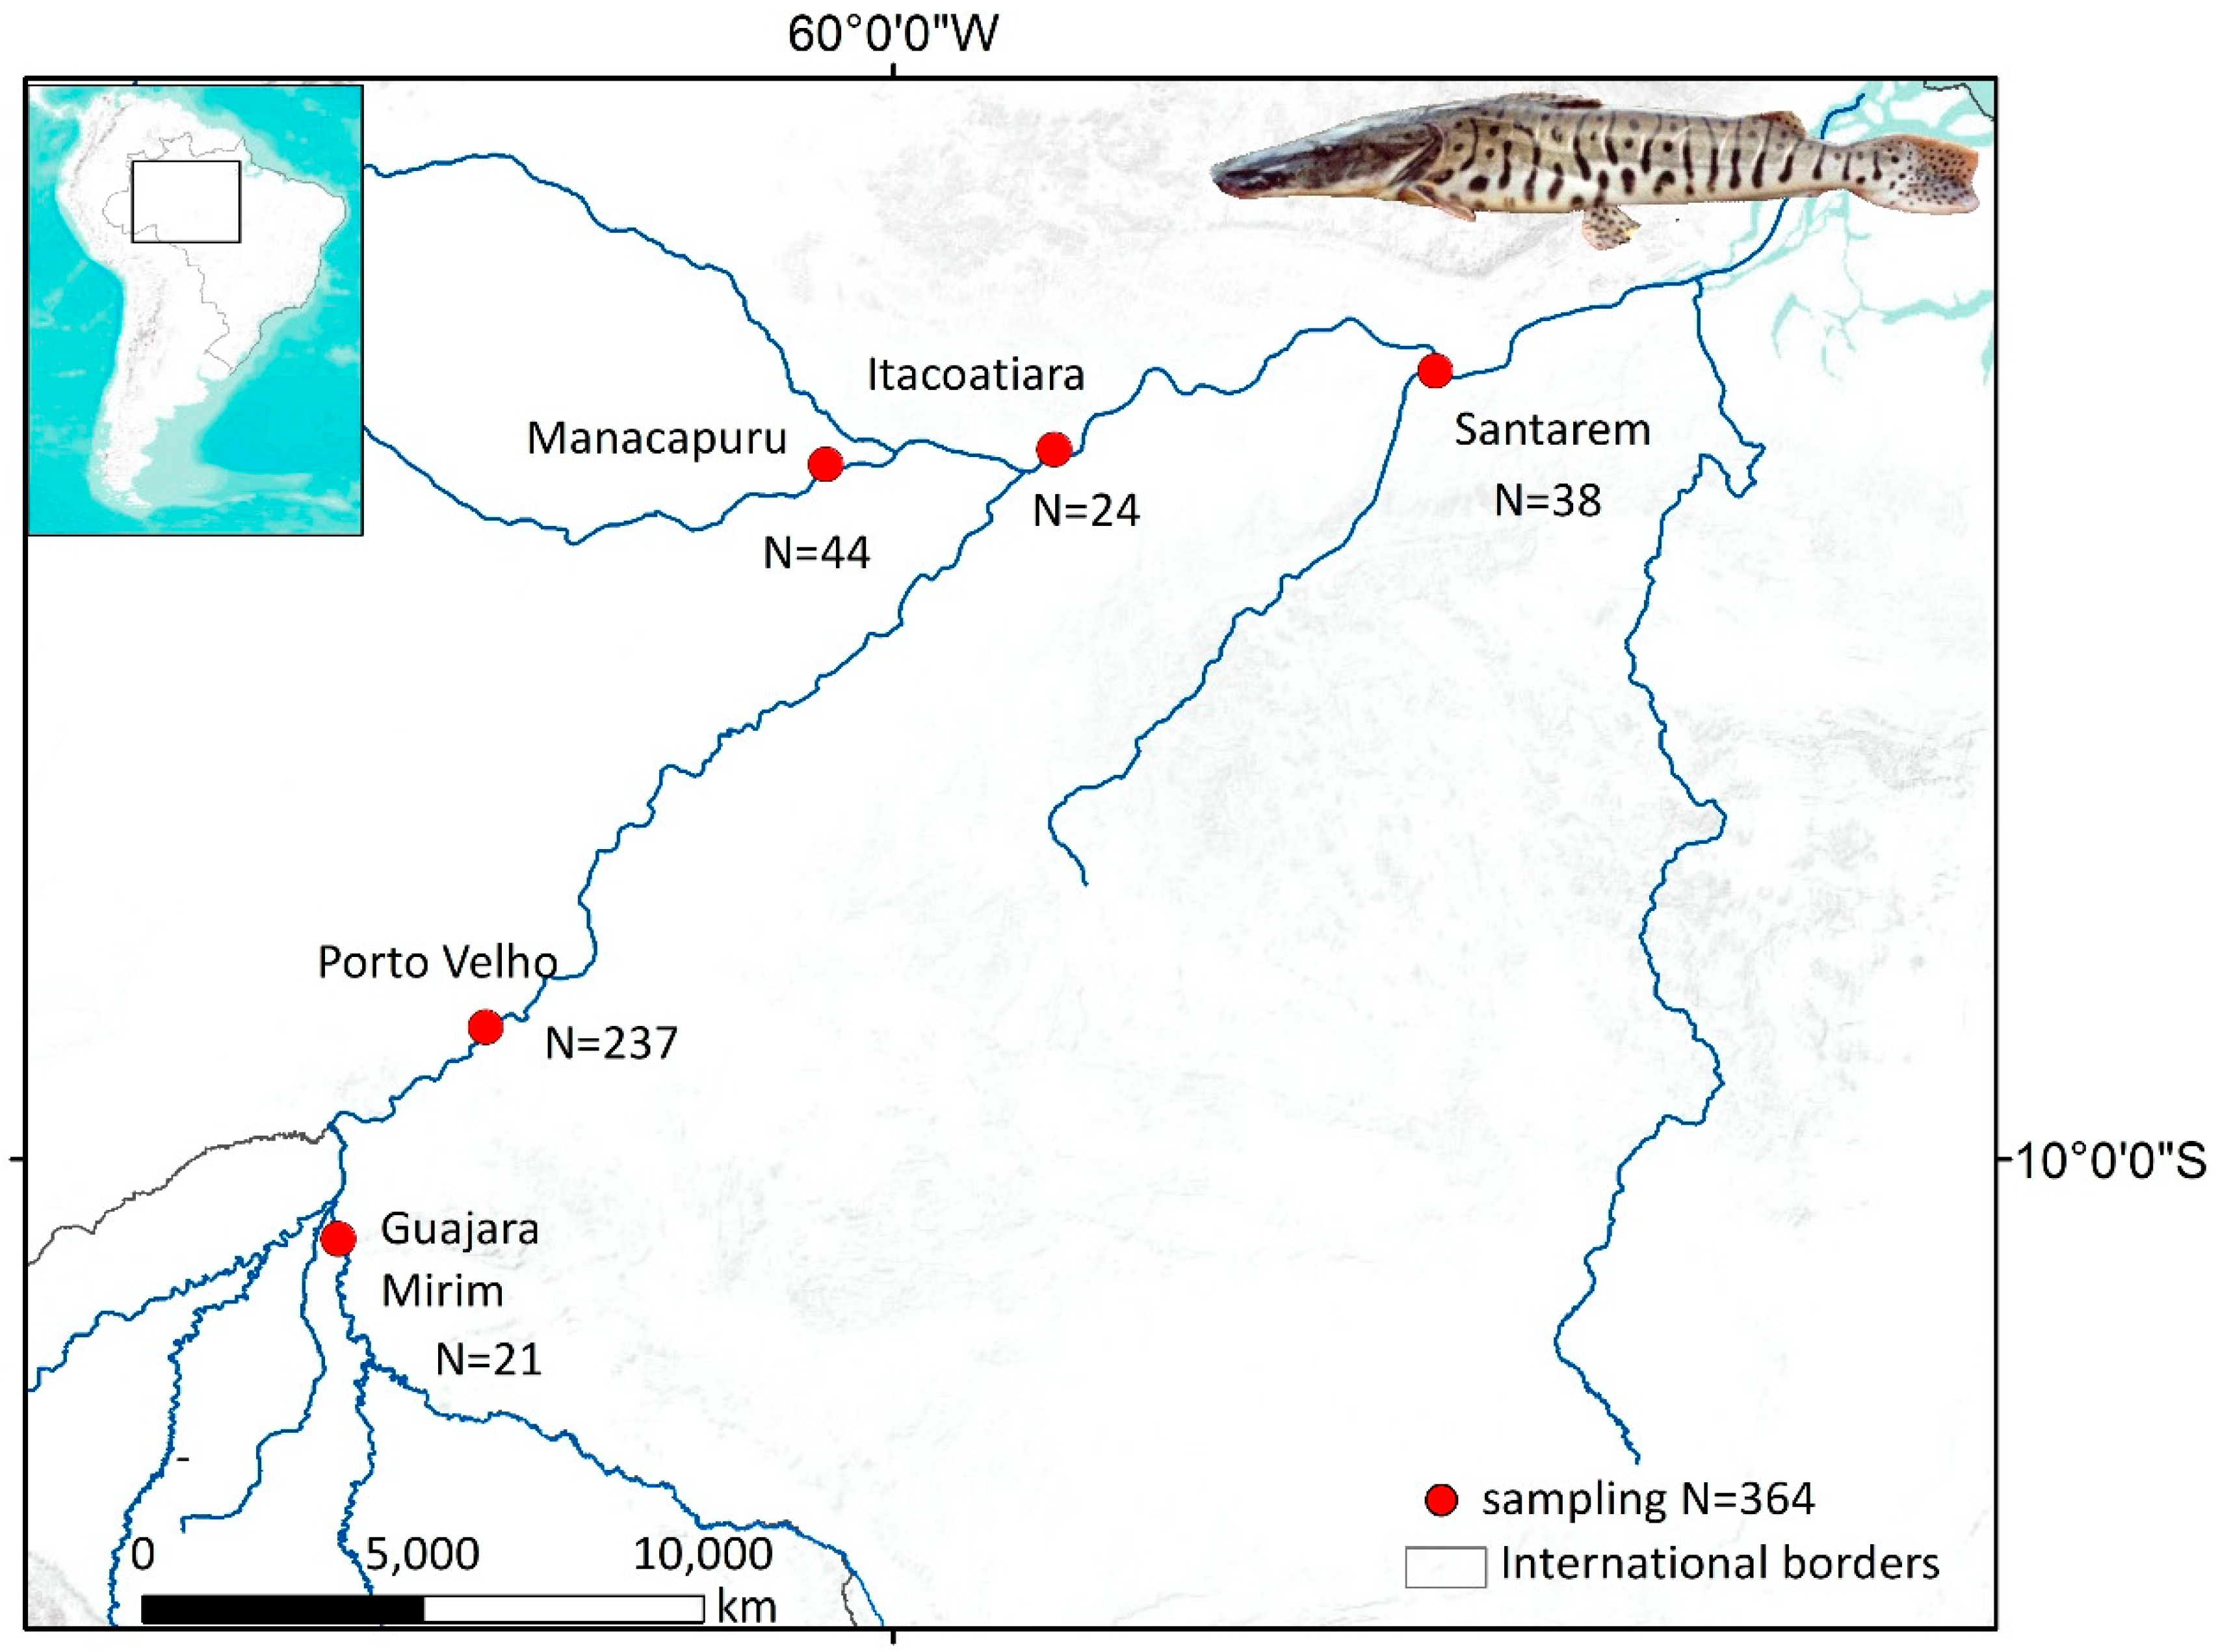
2.1. Study Area
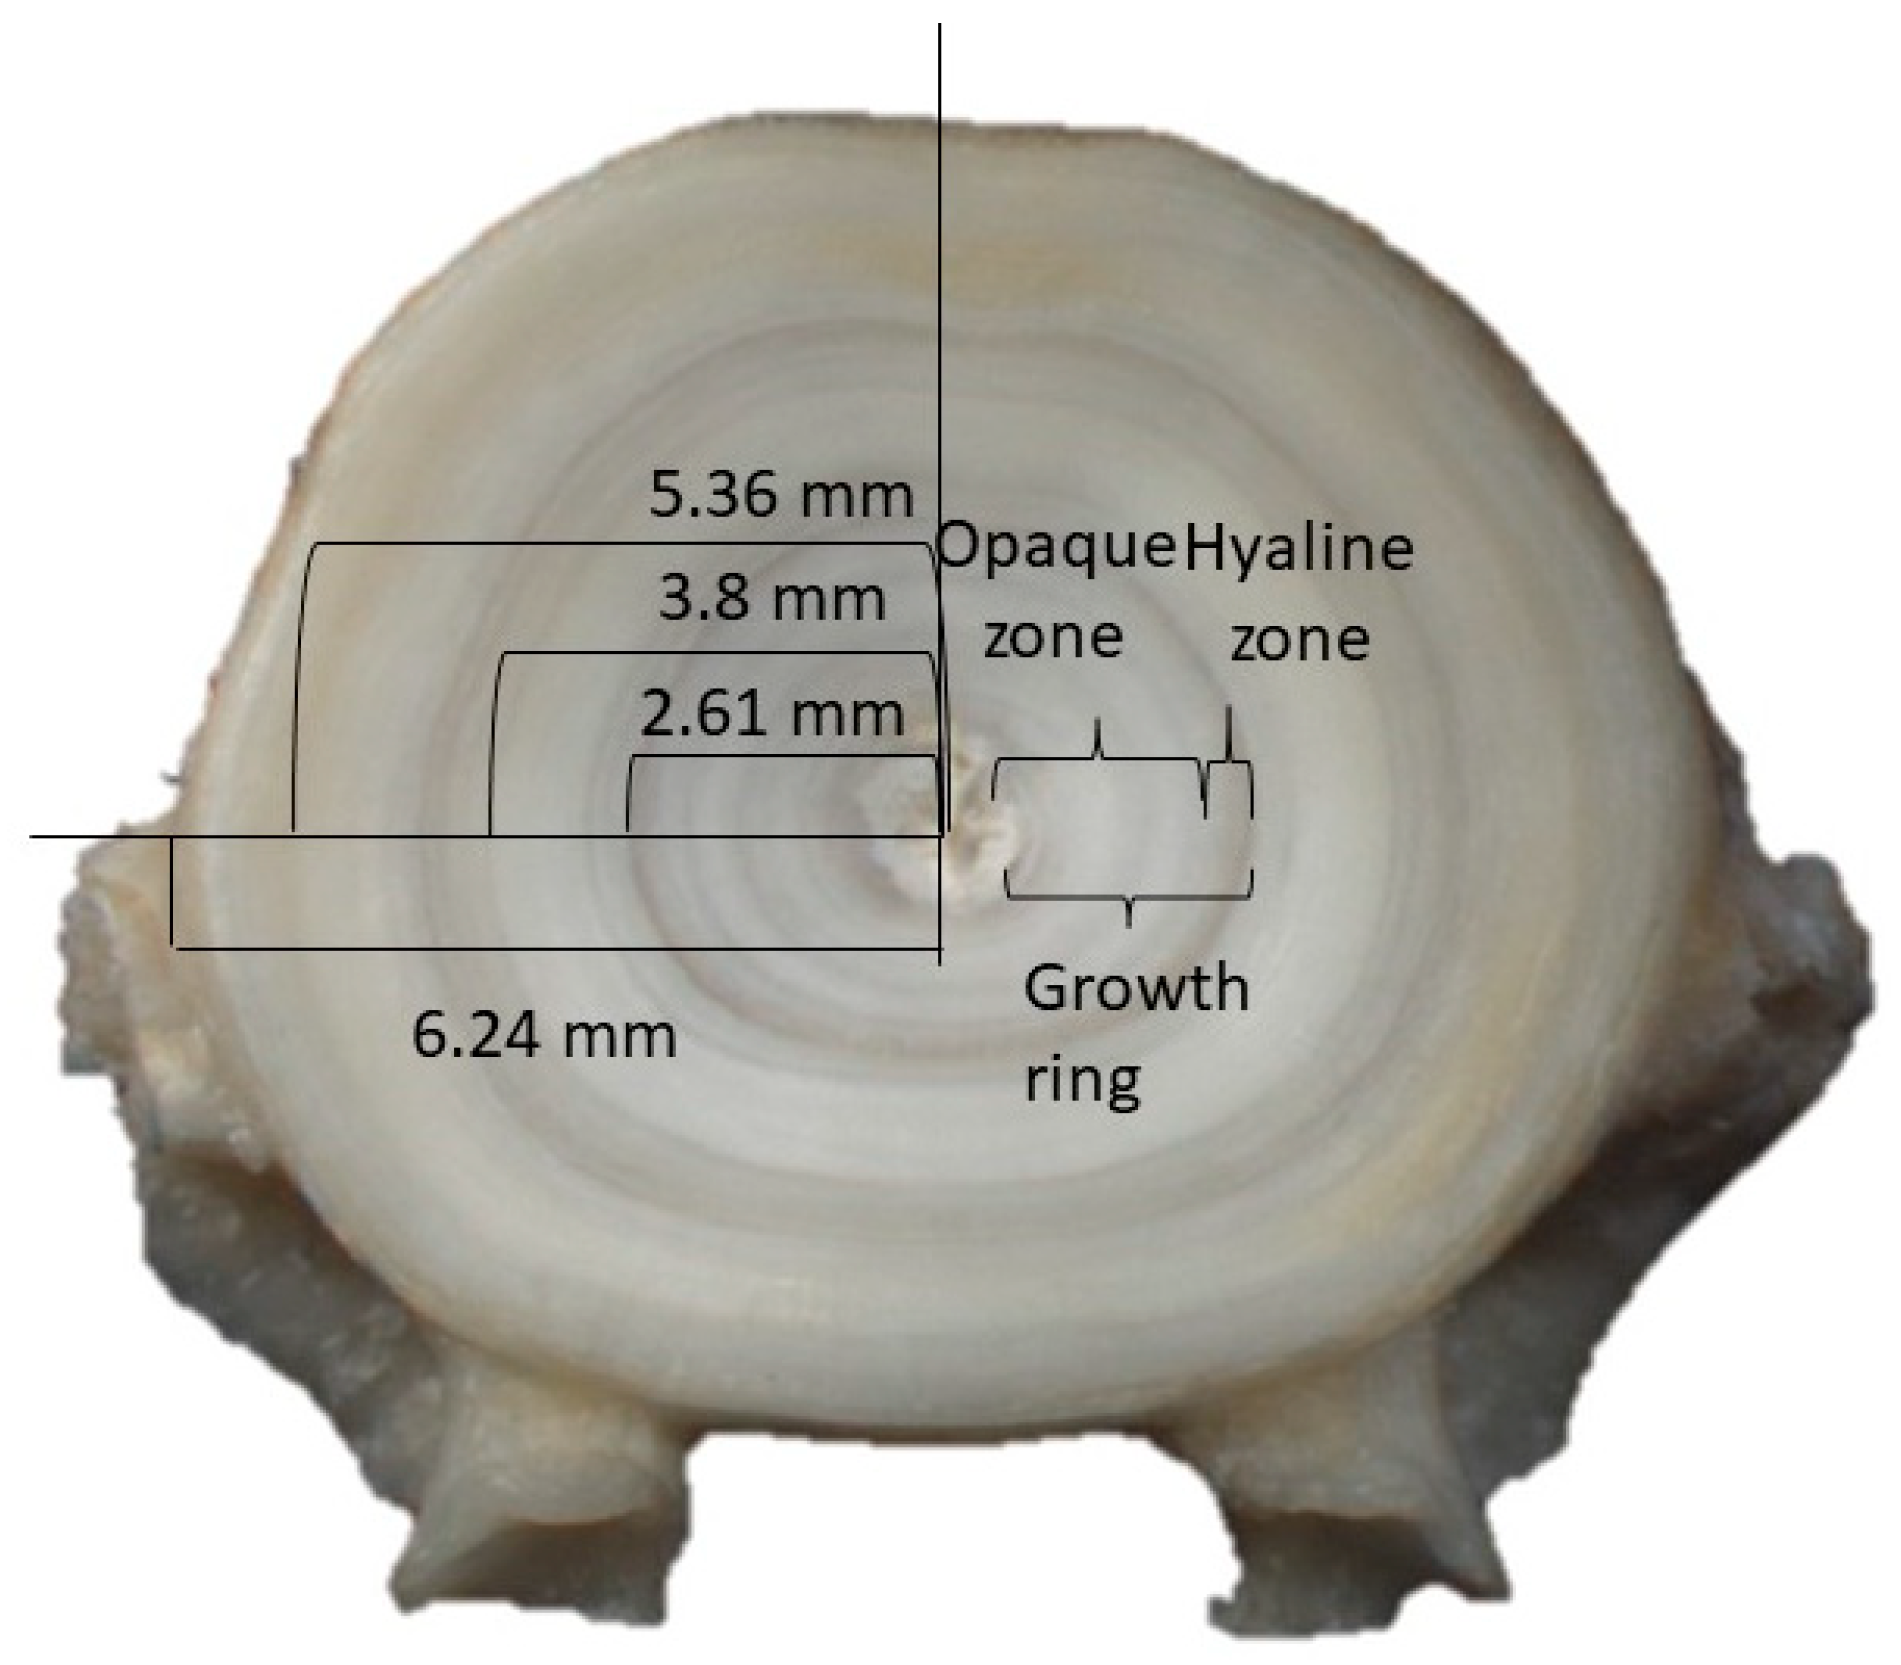
2.2. Fish Sampling and Vertebrae Processing
2.3. Data Analysis
2.3.1. Age and Growth
2.3.2. Hydrological Indexes
2.3.3. Statistical Analysis
3. Results
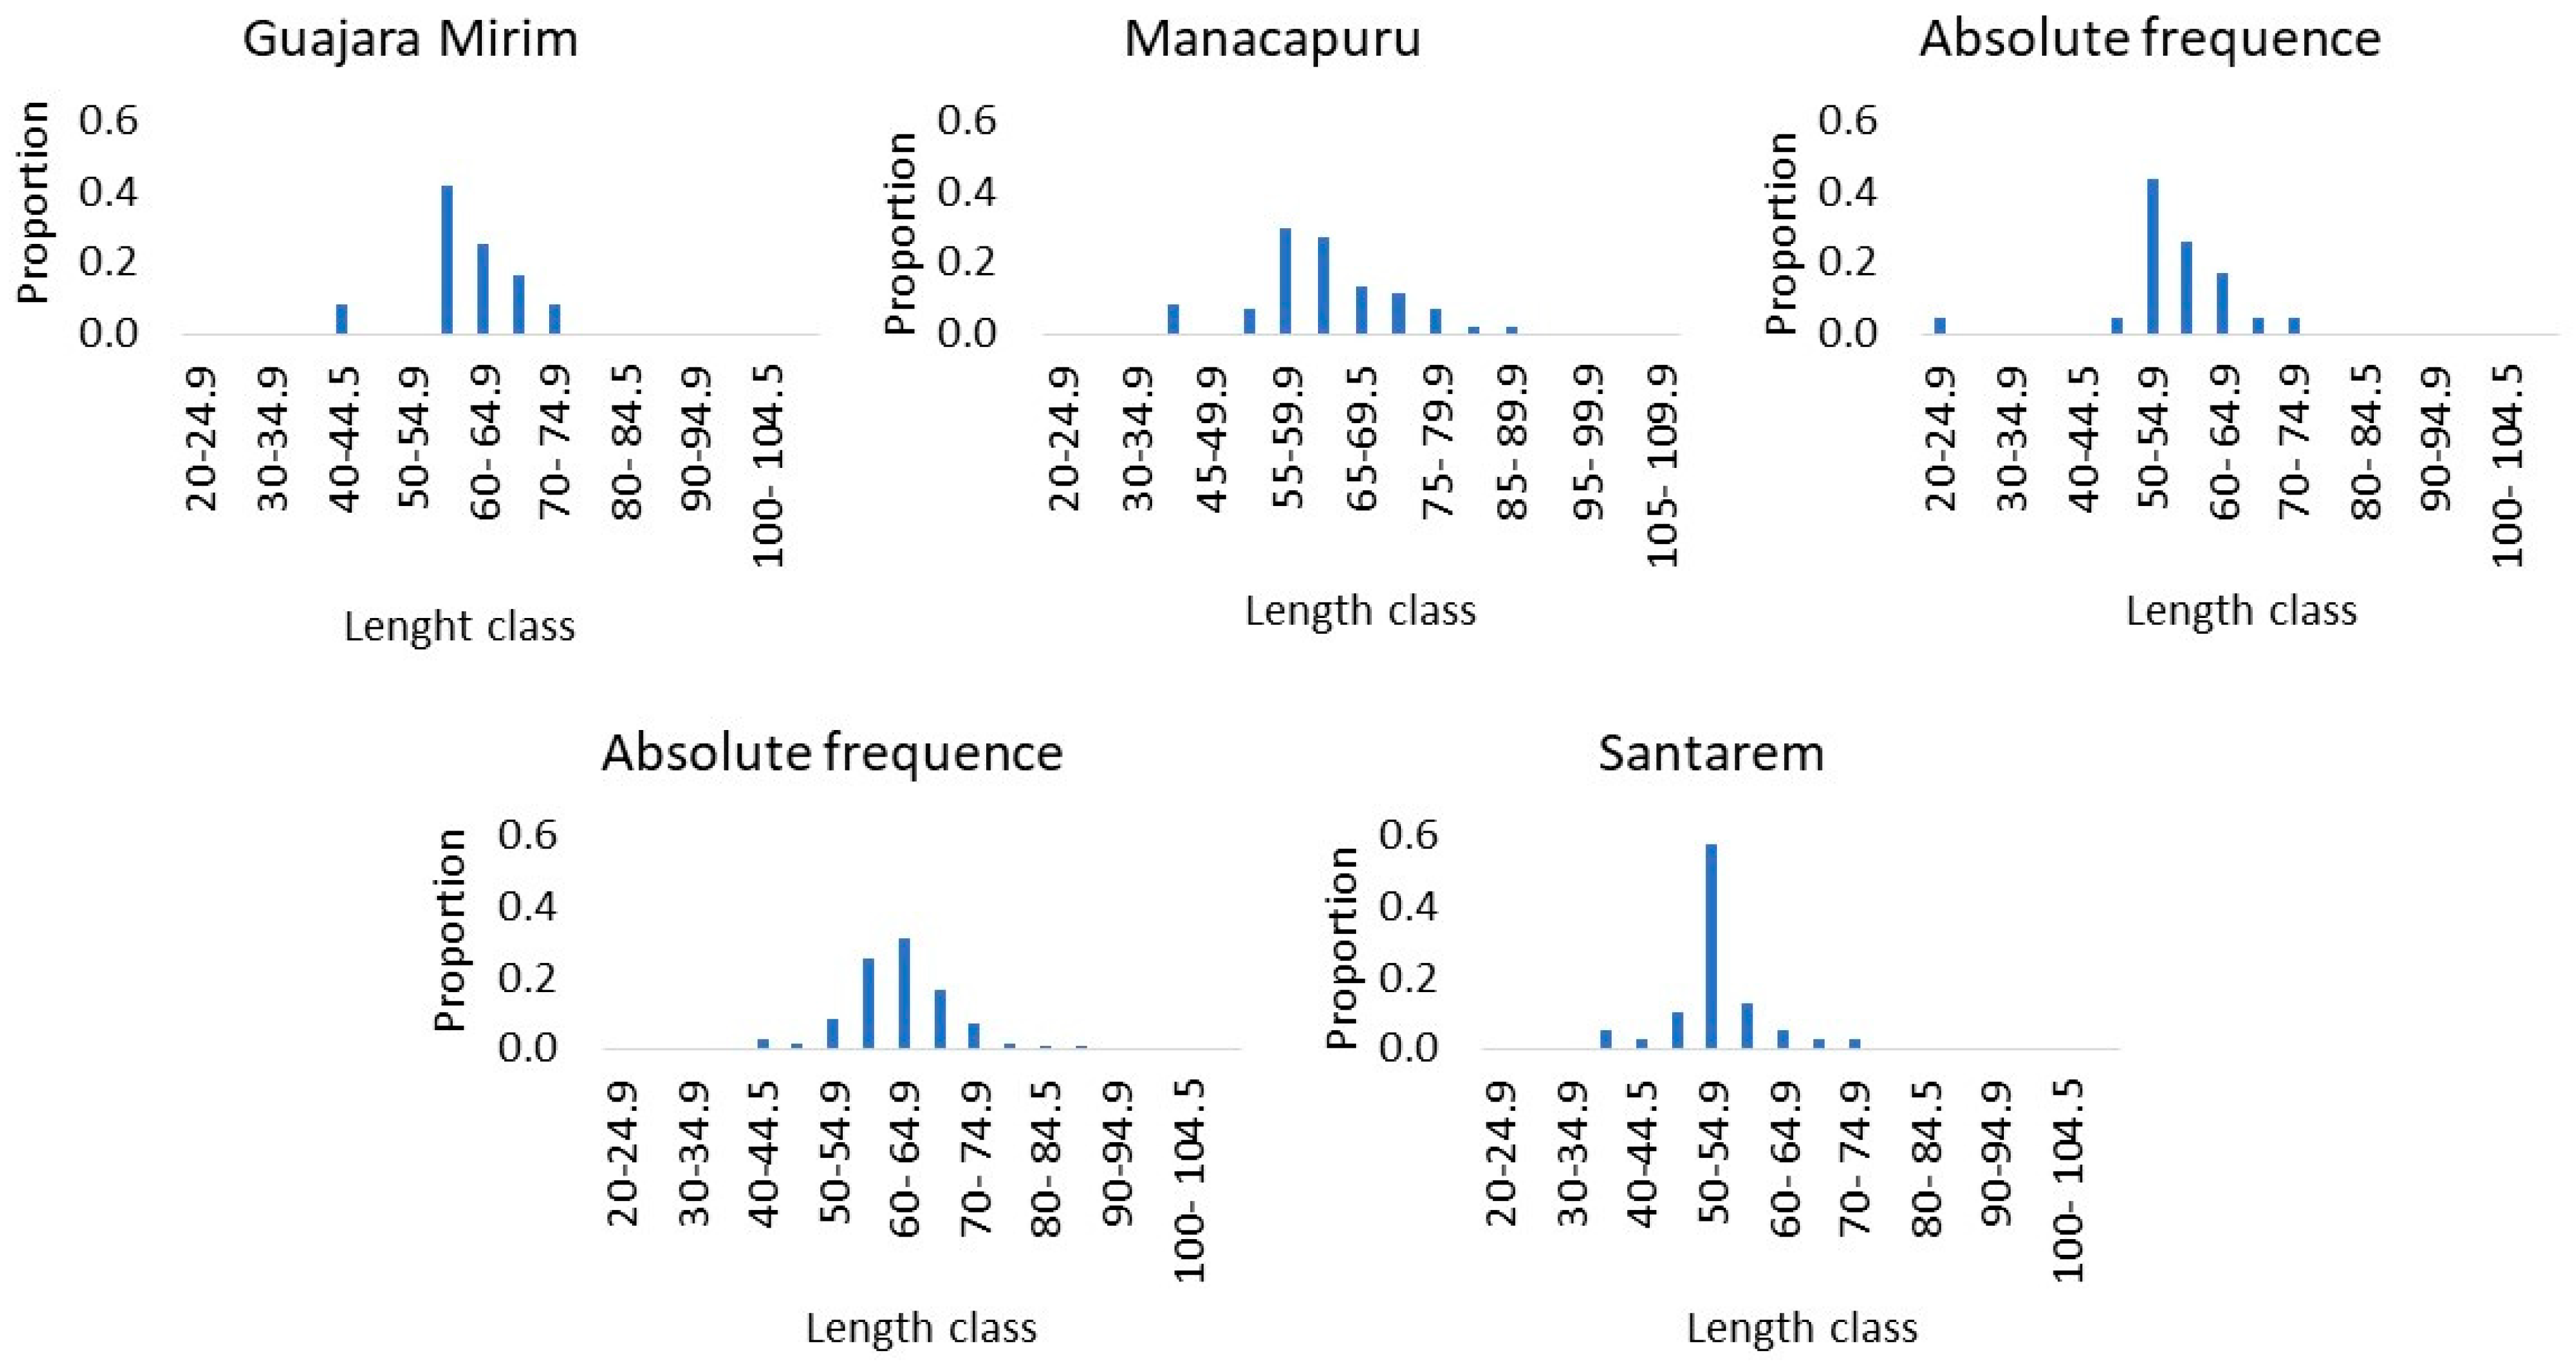
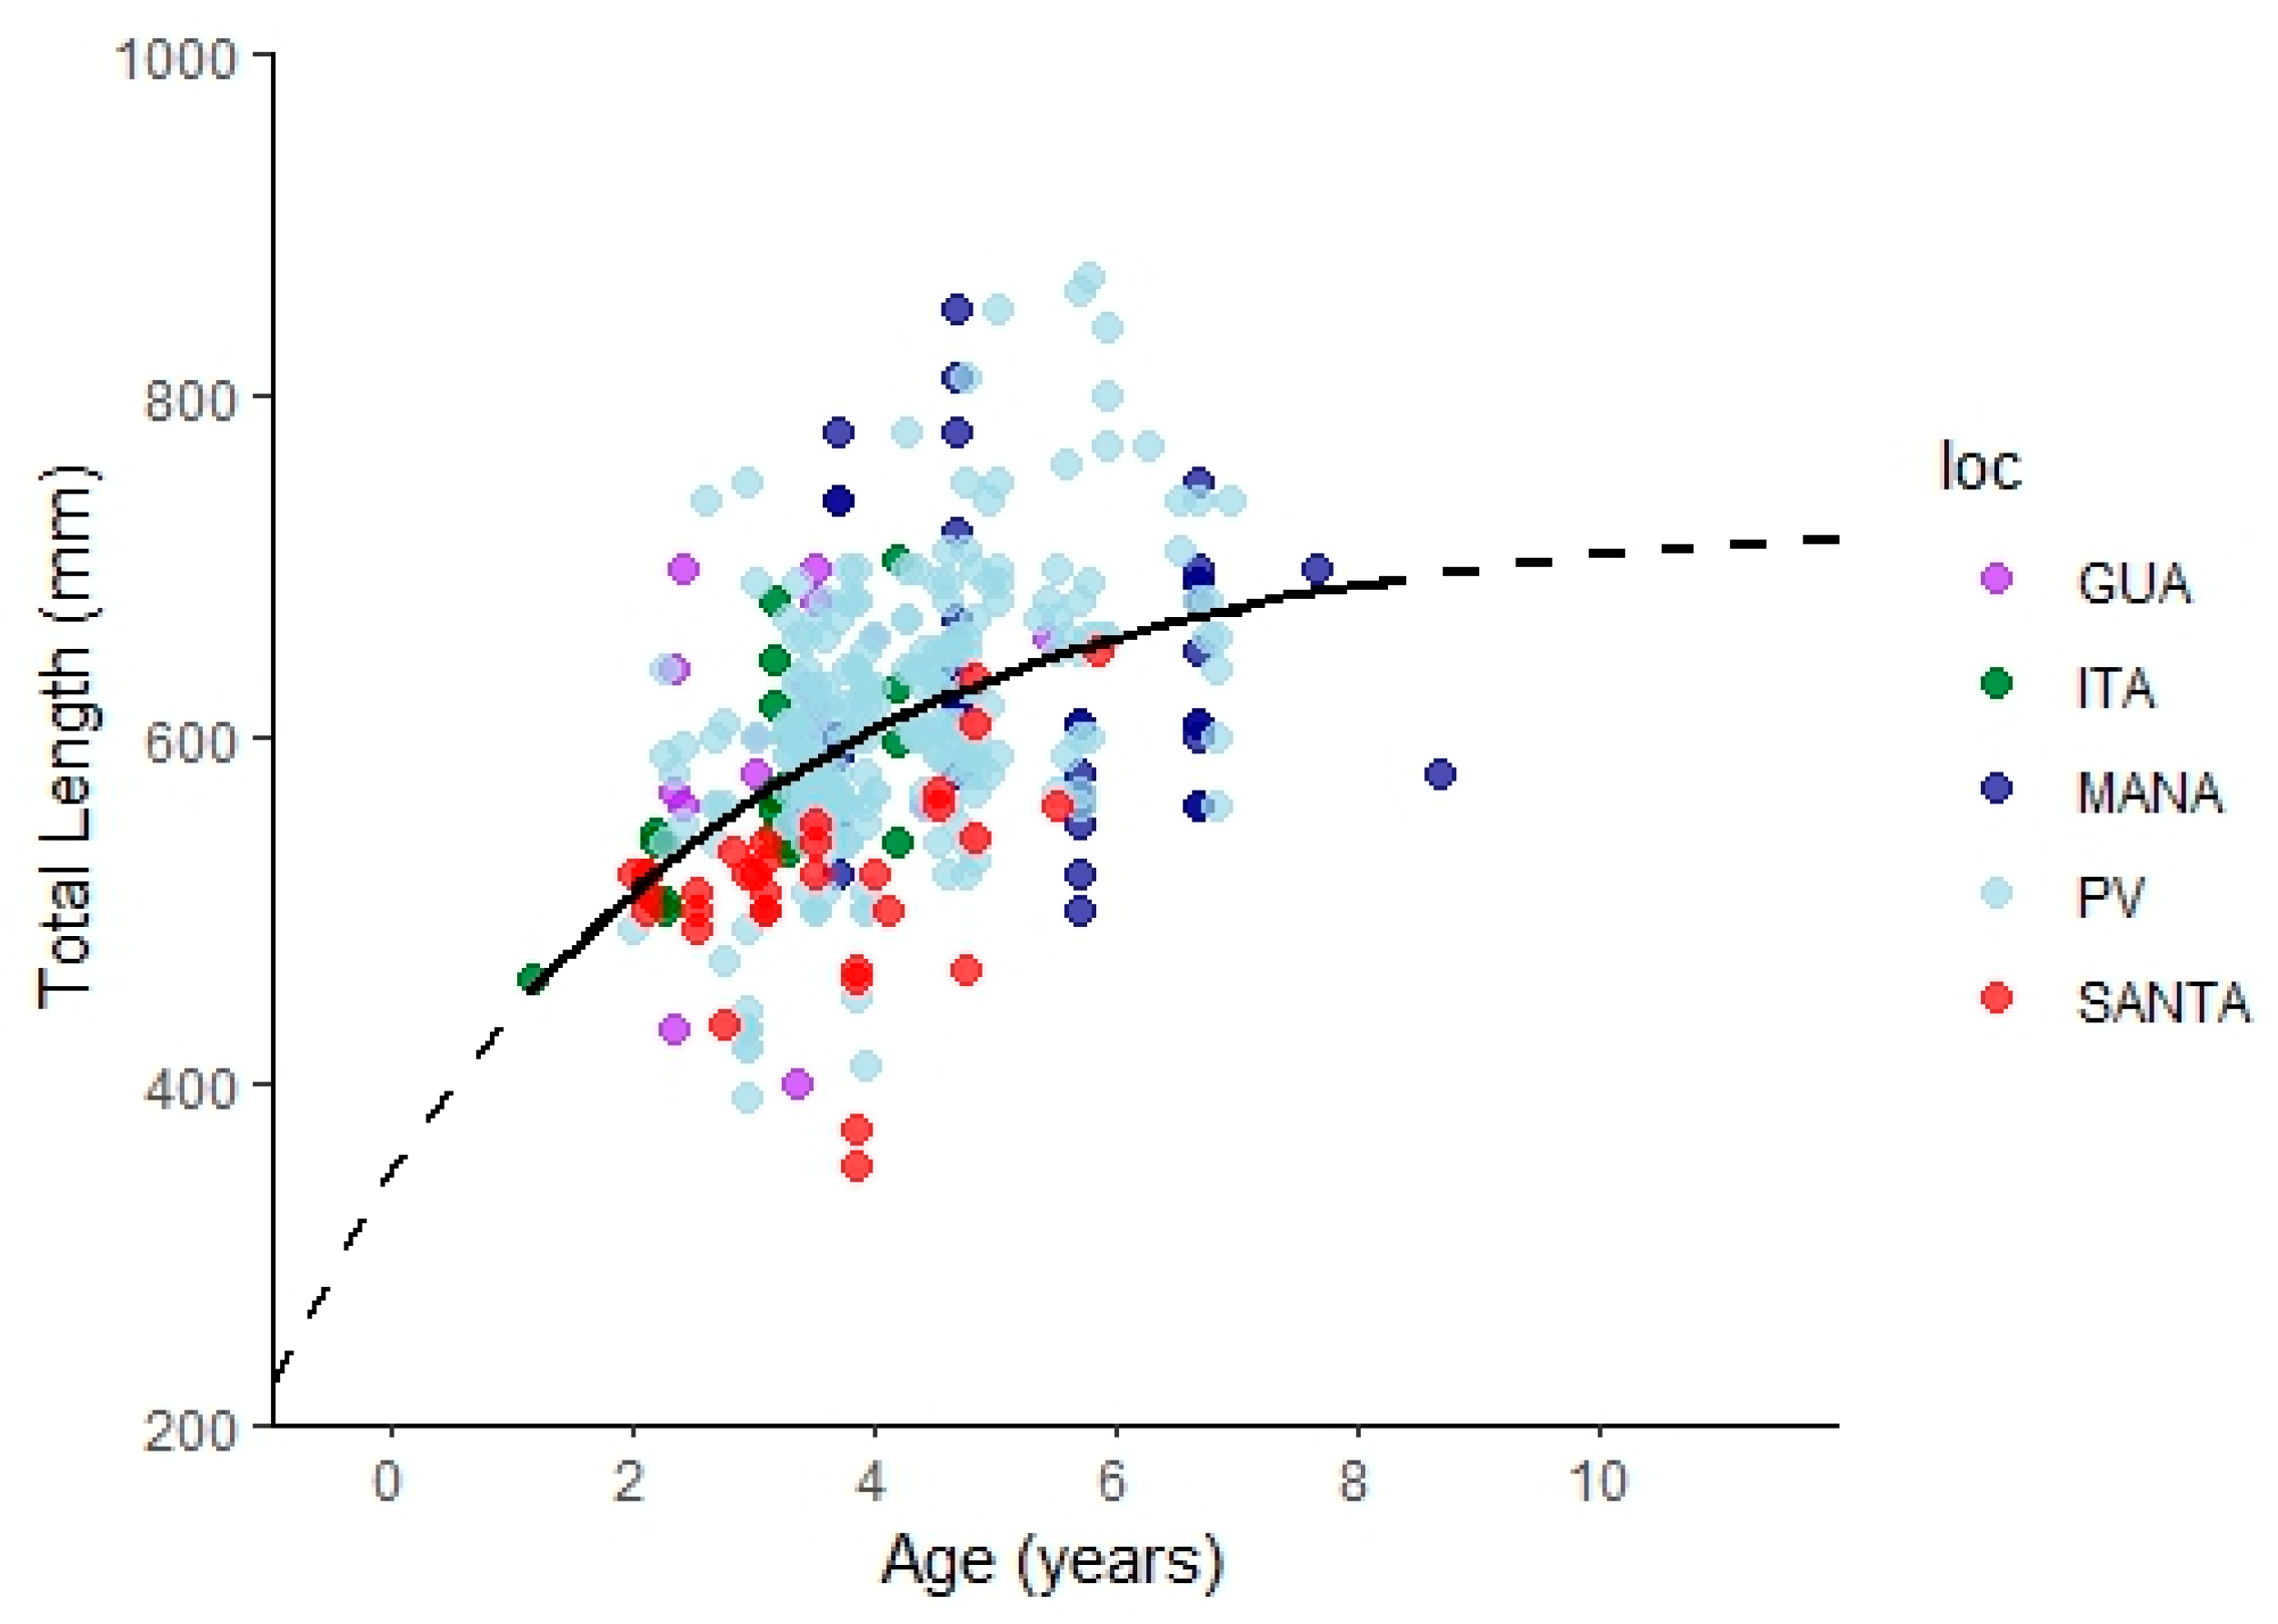
3.1. General Growth
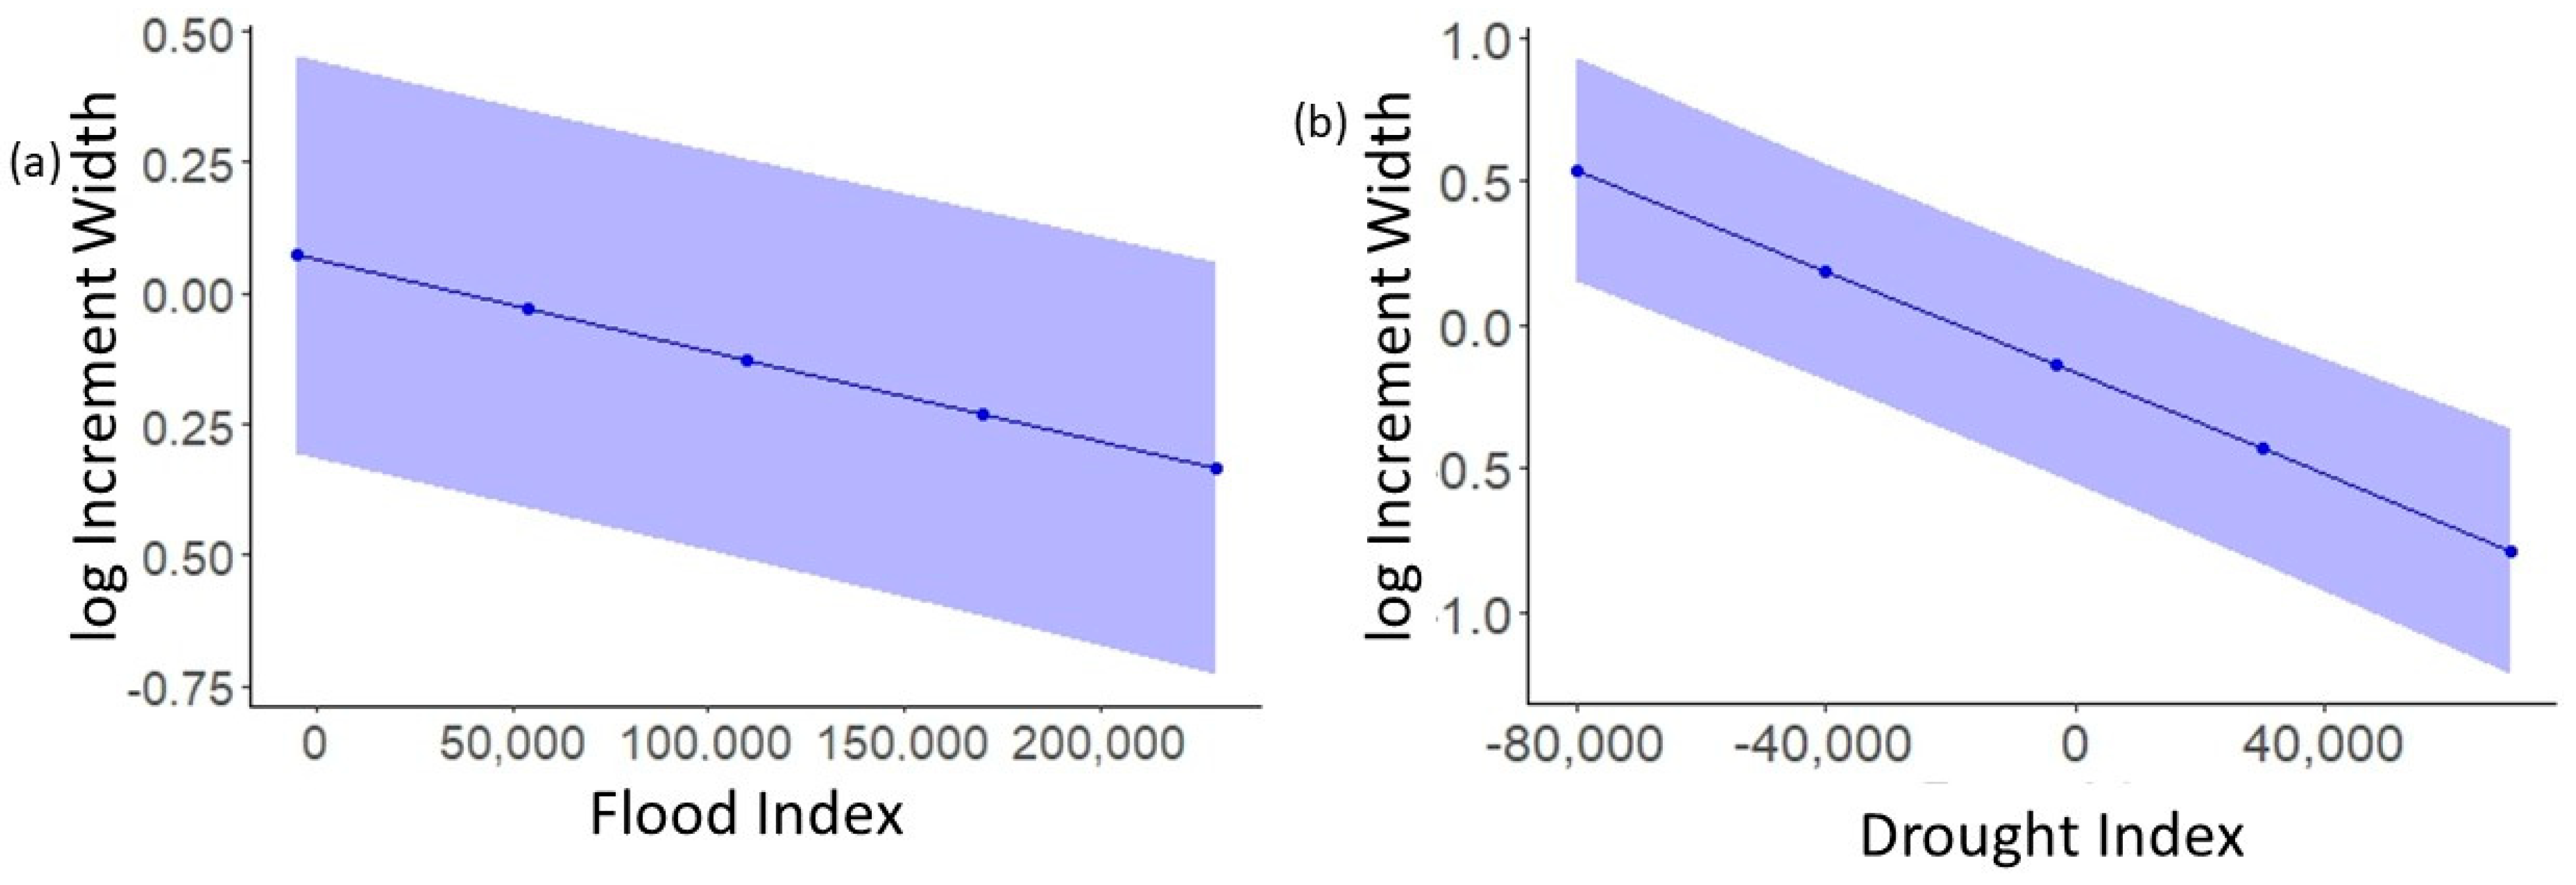
3.2. Do Floods Lead to the Faster Growth of P. fasciatum and Droughts Lead to the Slower Growth?
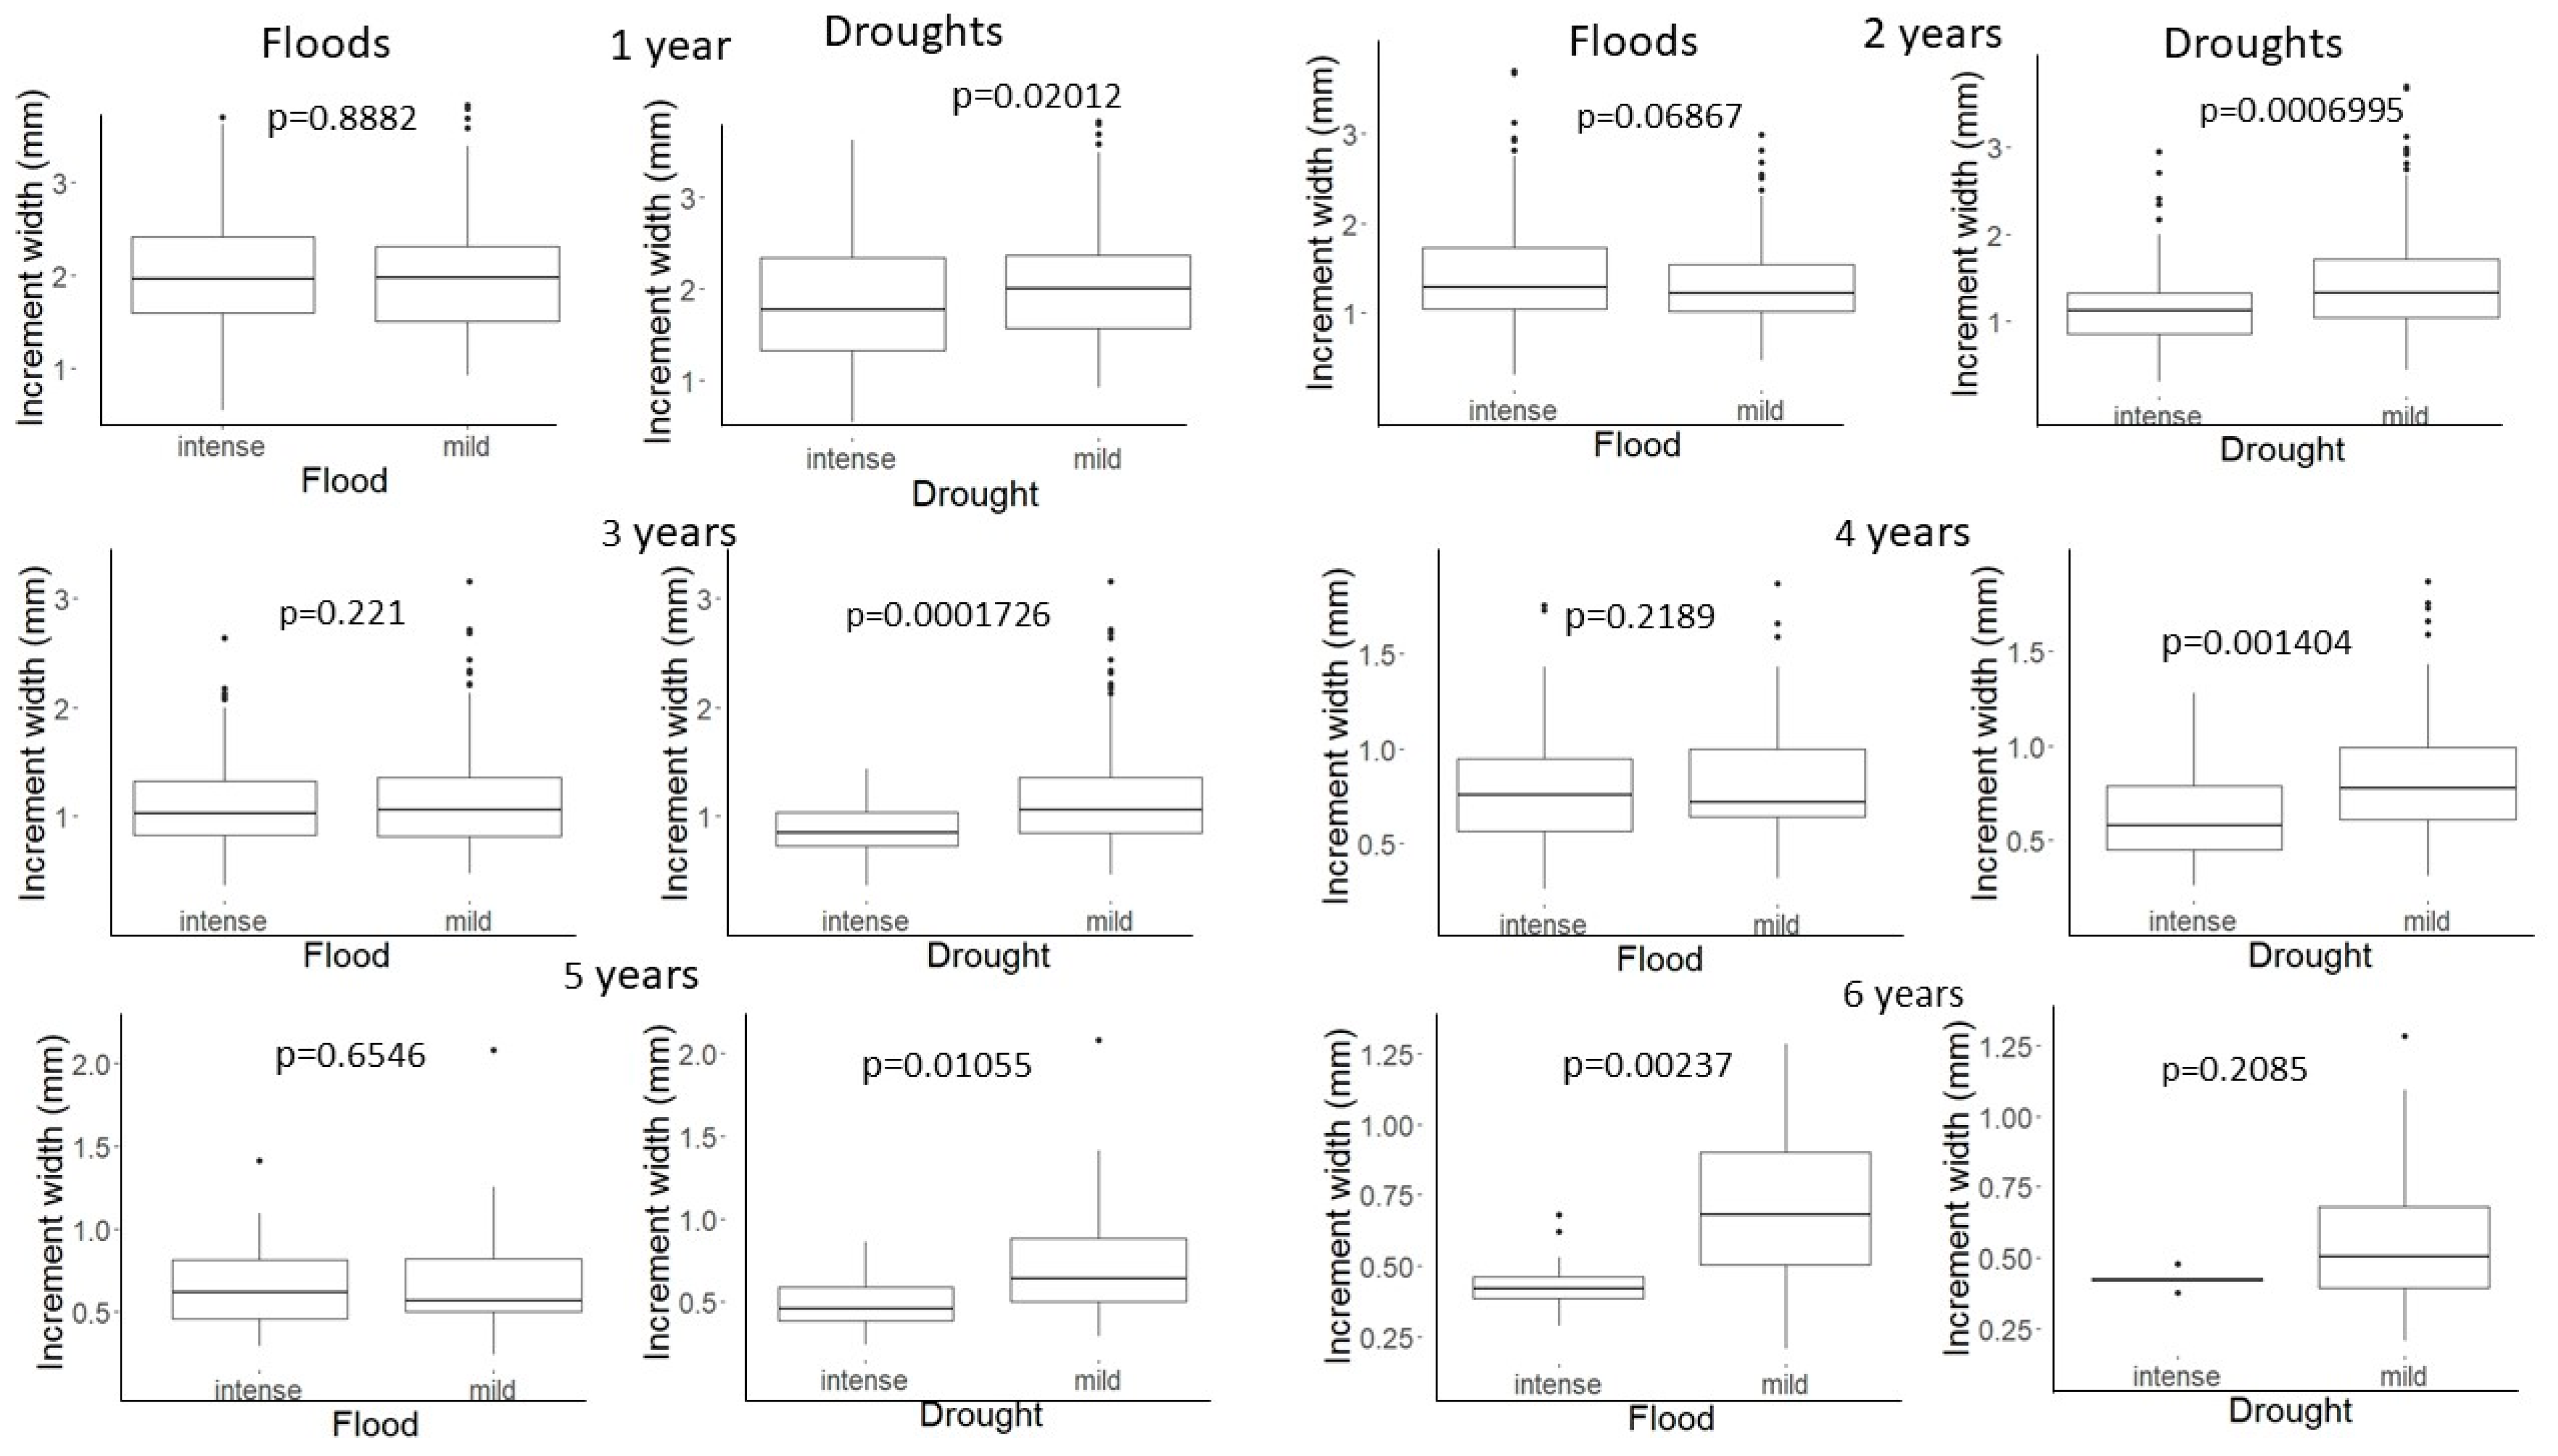
3.3. Do Floods and Droughts Affect All Age Classes in the Same Manner?
4. Discussion
5. Conclusions
Author Contributions
Funding
Institutional Review Board Statement
Informed Consent Statement
Data Availability Statement
Acknowledgments
Conflicts of Interest
References
- Isely, J.J.; Grabowski, T.B. Age and Growth. In Analysis and Interpretation of Freshwater Fisheries Data; Guy, C.S., Brown, M.L., Eds.; American Fisheries Society: Bethesda, MD, USA, 2007; Volume 187228, pp. 1–43. [Google Scholar]
- Hüssy, K.; Radtke, K.; Plikshs, M.; Oeberst, R.; Baranova, T.; Krumme, U.; Sjöberg, R.; Walther, Y.; Mosegaard, H. Challenging ICES Age Estimation Protocols: Lessons Learned from the Eastern Baltic Cod Stock. ICES J. Mar. Sci. 2016, 73, 2138–2149. [Google Scholar] [CrossRef]
- Jobling, M. Environmental Factors and Rates of Development and Growth. In Handbook of Fish Biology and Fisheries; Wiley: Hoboken, NJ, USA, 2002; Volume 1, pp. 97–121. [Google Scholar]
- Bayley, P.B. Factors Affecting Growth Rates of Young Tropical Floodplain Fishes: Seasonality and Density-Dependence. Environ. Biol. Fishes 1988, 21, 127–142. [Google Scholar] [CrossRef]
- Kapetsky, J.M. Growth, Mortality, and Production of Five Fish Species of the Kafue River Floodplain, Zambia. Ph.D. Dissertation, University of Michigan, Ann Arbor, MI, USA, 1974. [Google Scholar]
- Junk, W.J. General Aspects of Floodplain Ecology with Special Reference to Amazonian Floodplains. In The Central Amazon Floodplain: Ecology of a Pulsing System; Springer: Berlin/Heidelberg, Germany, 1989; pp. 3–20. [Google Scholar]
- Bayley, P.B. Understanding Large River Floodplain Ecosystems. Bioscience 1995, 45, 153–158. [Google Scholar] [CrossRef]
- Perez, A.; Fabre, N. Seasonal Growth and Life istory of the Catfish Calophysus macropterus (Lichtenstein, 1819) (Siluriformes: Pimelodidae) from the Amazon Floodplain. J. Appl. Ichthyol. 2009, 25, 343–349. [Google Scholar] [CrossRef]
- Pérez, A.; Fabré, N.N. Life-History Characteristics of Pseudoplatystoma metaense (Teleostei: Siluriformes: Pimelodidae) from the Northwestern Orinoco River Basin. Neotrop. Ichthyol. 2018, 16, 160140. [Google Scholar] [CrossRef]
- Graaf, G. The Flood Pulse and Growth of Floodplain Fish in Bangladesh. Fish Manag. Ecol. 2003, 10, 241–247. [Google Scholar] [CrossRef]
- Dudley, R.G. Growth of Tilapia of the Kafue Floodplain, Zambia: Predicted Effects of the Kafue Gorge Dam. Trans. Am. Fish Soc. 1974, 103, 281–291. [Google Scholar] [CrossRef]
- Welcomme, R.L. River Fisheries; FAO Fisheries Technical Paper 262; Food and Agriculture Organization of the United Nations: Rome, Italy, 1985; ISBN 9251022992. [Google Scholar]
- Bartels, A.D. Growth of Selected Fishes in Navigation Pool 8 of the Upper Mississippi River: A Test of the Flood-Pulse Concept. Master’s Thesis, University of Wisconsin, La Crosse, WI, USA, 1997. [Google Scholar]
- Gutreuter, S.; Bartels, A.D.; Irons, K.; Sandheinrich, M.B. Evaluation of the Flood-Pulse Concept Based on Statistical Models of Growth of Selected Fishes of the Upper Mississippi River System. Can. J. Fish. Aquat. Sci. 1999, 56, 2282–2291. [Google Scholar] [CrossRef]
- Nelson, B.D. Hydrologic and Temperature Regime Influence on Growth and Recruitment of Fishes in an Upper Midwest Riverine Ecosystem. Master Thesis, Minnesota State University, Mankato, MN, USA, 2015. [Google Scholar]
- Perry, R.C.; Casselman, J.M. Factors Affecting Year-Class Strength and Growth of Lake Whitefish (Coregonus clupeaformis) in Impounded Lakes as Revealed by Otolith Chronologies. J. Fish Biol. 2022, 100, 1510–1527. [Google Scholar] [CrossRef]
- Porter, J.M.; Schramm, H.L. Effects of Temperature and Hydrology on Growth of Shovelnose Sturgeon Scaphirhynchus platorynchus (Rafinesque, 1820) in the Lower Mississippi River. J. Appl. Ichthyol. 2018, 34, 21–28. [Google Scholar] [CrossRef]
- Reckahn, J.A. Long-Term Cyclical Trends in Growth of Lake Whitefish in South Bay, Lake Huron. Trans. Am. Fish. Soc. 1986, 115, 787–804. [Google Scholar] [CrossRef]
- Sommer, T.R.; Nobriga, M.L.; Harrell, W.C.; Batham, W.; Kimmerer, W.J. Floodplain Rearing of Juvenile Chinook Salmon: Evidence of Enhanced Growth and Survival. Can. J Fish. Aquat. Sci. 2001, 58, 325–333. [Google Scholar] [CrossRef]
- Sweetman, P.C.; Haddy, J.A.; Robertson, S.G. Multi-Decadal Variation in Cohort Specific Sex Ratios and Otolith Increment Growth Characteristics of Juvenile Blue Grenadier (Macruronus novaezelandiae). Fish Res. 2018, 201, 79–87. [Google Scholar] [CrossRef]
- Tonkin, Z.D.; King, A.J.; Robertson, A.I.; Ramsey, D.S.L. Early Fish Growth Varies in Response to Components of the Flow Regime in a Temperate Floodplain River. Freshw. Biol. 2011, 56, 1769–1782. [Google Scholar] [CrossRef]
- Junk, W.J. Temporary Fat Storage, an Adaptation of Some Fish Species to the Water Level Fluctuations and Related Environmental Changes of the Amazon River. Amazoniana 1985, IX, 315–351. [Google Scholar]
- Junk, W.J.; Soares, G.M.; Carvalho, F.M. Distribution of Fish Species in a Lake of the Amazon River Floodplain near Manaus (Lago Camaleão), with Special Reference to Extreme Oxygen Conditions. Amaz. Limnol. Oecologia Reg. Syst. Fluminis Amazon. 1983, 7, 397–431. [Google Scholar]
- Morrongiello, J.R.; Thresher, R.E.; Hobbs, N.T. A Statistical Framework to Explore Ontogenetic Growth Variation among Individuals and Populations: A Marine Fish Example. Ecol. Monogr. 2015, 85, 93–115. [Google Scholar] [CrossRef]
- Nicolle, P.; Hughes, J.; Fowler, A.; Schilling, H.T. Long-Term Increase in Growth of an Estuarine Predator, Mulloway Argyrosomus japonicus, Predicted to Continue under Future Warming Scenarios. Mar. Ecol. Prog. Ser. 2022, 688, 1–17. [Google Scholar] [CrossRef]
- Martino, J.C.; Fowler, A.J.; Doubleday, Z.A.; Grammer, G.L.; Gillanders, B.M. Using Otolith Chronologies to Understand Long-Term Trends and Extrinsic Drivers of Growth in Fisheries. Ecosphere 2019, 10, e02553. [Google Scholar] [CrossRef]
- Benech, V.; Quensiere, J. Migrations de Poissons Vers Le Lac Tchad à La Décrue de La Plaine Inondée Du Nord-Cameroun. Rev. Hydrobiol. Trop. 1982, 15, 253–270. [Google Scholar]
- Reizer, C. Definition d’une Politique d’Amanagement Des Resources Halieutiques d’un Ecosysteme Aquatique Complexe Par 1’Etude de Son Environnement Abiotique, Biotique et Anthropique. Le Fleuve Senegal, Moyen et Inferieur. Ph.D. Dissertation, University of Luxembourg, Luxembourg, 1974; 226p. [Google Scholar]
- Castello, L.; Isaac, V.J.; Thapa, R. Flood Pulse Effects on Multispecies Fishery Yields in the Lower Amazon. R Soc. Open Sci. 2015, 2, 150299. [Google Scholar] [CrossRef] [PubMed]
- Duponchelle, F.; Isaac, V.J.; Rodrigues Da Costa Doria, C.; Van Damme, P.A.; Herrera-R, G.A.; Anderson, E.P.; Cruz, R.E.A.; Hauser, M.; Hermann, T.W.; Agudelo, E.; et al. Conservation of Migratory Fishes in the Amazon Basin. Aquat. Conserv. 2021, 31, 1087–1105. [Google Scholar] [CrossRef]
- Pereira, L.A.; Castello, L.; Orth, D.J.; Duponchelle, F.; Hallerman, E.M. A Synthesis of the Ecology and Conservation of Pseudoplatystoma Catfishes in the Neotropics. Fishes 2023, 8, 306. [Google Scholar] [CrossRef]
- Armas, M.; Ortega, H.; García-Vasquez, A.; García-Dávila, C.; Vargas, G.; Nuñez, J.; Renno, J.-F.; Duponchelle, F. Age Validation and Contrasted Growth Performances of Pseudoplatystoma punctifer (Siluriformes: Pimelodidae) in Two River Systems of the Western Amazon. Neotropl. Ichthyol. 2022, 20, e210099. [Google Scholar] [CrossRef]
- De Jesús, M.J.; Kohler, C.C. The Commercial Fishery of the Peruvian Amazon. Fisheries 2004, 29, 10–16. [Google Scholar] [CrossRef]
- Loubens, G.; Panfili, J. Biologie de Pseudoplatystoma fasciatum et P. tigrinum (Teleostei: Pimelodidae) Dans Le Bassin Du Mamoré (Amazonie Bolivienne). Ichthyol. Explor. Freshw. 2000, 11, 13–34. [Google Scholar]
- Araujo-Lima, C.A.; Ruffino, M.L. Migratory Fishes of the Brazilian Amazon. In Migratory Fishes of South America; Carolsfeld, J., Harvey, B., Ross, C., Ross, C., Eds.; World Fisheries Trust: Victoria, BC, USA, 2003; pp. 233–301. [Google Scholar]
- Sioli, H. The Amazon and Its Main Affluents: Hydrography, Morphology of the River Courses, and River Types. In The Amazon: Limnology and Landscape Ecology of a Mighty Tropical River and Its Basin; Sioli, H., Ed.; Springer: Dordrecht, Netherlands, 1984; pp. 127–165. [Google Scholar]
- Junk, W.J.; Piedade, M.T.F.; Schöngart, J.; Cohn-Haft, M.; Adeney, J.M.; Wittmann, F. A Classification of Major Naturally-Occurring Amazonian Lowland Wetlands. Wetlands 2011, 31, 623–640. [Google Scholar] [CrossRef]
- Junk, W.J.; Bayley, P.B.; Sparks, R.E. The Flood Pulse Concept in River-Floodplain Systems. In Proceedings of the International Large River Symposium, Honey Harbour, Canada, 14–21 September 1986; Dodge, D.P., Ed.; Canadian Special Publication of Fisheries and Aquatic Sciences: Ottawa, Canada, 1989; Volume 106, pp. 110–127. [Google Scholar]
- Campana, S.E. Accuracy, Precision and Quality Control in Age Determination, Including a Review of the Use and Abuse of Age Validation Methods. J. Fish Biol. 2001, 59, 197–242. [Google Scholar] [CrossRef]
- Weisberg, S.; Spangler, G.; Richmond, L.S. Mixed Effects Models for Fish Growth. Can. J. Fish. Aquat. Sci. 2010, 67, 269–277. [Google Scholar] [CrossRef]
- Von Bertalanffy, L. A Quantitative Theory of Organic Growth (Inquiries on Growth Laws). Hum. Biol. 1938, 10, 181–213. [Google Scholar]
- Ayres, J.M. As Matas de Várzea Do Mamirauá; Conselho Nacional de Desenvolvimento Científico e Tecnológico, Sociedade Civil Mamirauá: Tefe, Brazil, 1995. [Google Scholar]
- Castello, L. Lateral Migration of Arapaima gigas in Floodplains of the Amazon. Ecol. Freshw. Fish 2008, 17, 38–46. [Google Scholar] [CrossRef]
- Zuur, A.F.; Ieno, E.N.; Elphick, C.S. A Protocol for Data Exploration to Avoid Common Statistical Problems. Methods Ecol. Evol. 2010, 1, 3–14. [Google Scholar] [CrossRef]
- Bates, D.; Mächler, M.; Bolker, B.; Walker, S. Fitting Linear Mixed-Effects Models Using Lme4. J. Stat. Softw. 2014, 67, 1–48. [Google Scholar]
- Ruffino, M.L.; Isaac, V.J. Dinamica Populacional de Surubim-Tigre, Pseudoplatystoma. Acta Amazon 1999, 29, 463–476. [Google Scholar] [CrossRef]
- Val, A.L.; de Almeida-Val, V.M.F. Fishes of the Amazon and Their Environment: Physiological and Biochemical Aspects; Springer Science & Business Media: Berlin/Heidelberg, Germany, 2012; Volume 32, ISBN 3642792294. [Google Scholar]
- Val, A.L.; Duarte, R.M.; Campos, D.; de Almeida-Val, V.M.F. Environmental Stressors in Amazonian Riverine Systems. Fish Physiol. 2022, 39, 209–271. [Google Scholar]
- Val, A.L.; Fearnside, P.M.; Almeida-Val, V.M.F. Environmental Disturbances and Fishes in the Amazon. J. Fish Biol. 2016, 89, 192–193. [Google Scholar] [CrossRef]
- Poff, N.L.; Olden, J.D. Can Dams Be Designed for Sustainability? Science 2017, 358, 1252–1253. [Google Scholar] [CrossRef]
- Marmulla, G. Dams, Fish and Fisheries Opportunities, Challenges and Conflict Resolution; FAO Fisheries Technical Paper 419; Food and Agriculture Organiztion of the United Nations: Rome, Italy, 2001. [Google Scholar]
- Konapala, G.; Mishra, A.K.; Wada, Y.; Mann, M.E. Climate Change Will Affect Global Water Availability through Compounding Changes in Seasonal Precipitation and Evaporation. Nat. Commun. 2020, 11, 3044. [Google Scholar] [CrossRef]
- Gloor, M.; Brienen, R.J.W.; Galbraith, D.; Feldpausch, T.R.; Schöngart, J.; Guyot, J.L.; Espinoza, J.C.; Lloyd, J.; Phillips, O.L. Intensification of the Amazon Hydrological Cycle over the Last Two Decades. Geophys. Res. Lett. 2013, 40, 1729–1733. [Google Scholar] [CrossRef]


| Age Class | Guajara (n) | Itacoatiara (n) | Manacapuru (n) | Porto Velho (n) | Santarem (n) |
|---|---|---|---|---|---|
| 1 | 0 | 1 | 0 | 0 | 0 |
| 2 | 5 | 6 | 0 | 24 | 14 |
| 3 | 9 | 12 | 0 | 95 | 13 |
| 4 | 6 | 4 | 8 | 74 | 8 |
| 5 | 1 | 0 | 12 | 32 | 2 |
| 6 | 0 | 0 | 11 | 12 | 0 |
| 7 | 0 | 0 | 11 | 0 | 0 |
| 8 | 0 | 0 | 2 | 0 | 0 |
| River | n | Mean Total Length (cm) ± SD | Total Length Range (cm) |
|---|---|---|---|
| Guajara Mirim | 21 | 59.54 ± 7.12 | 40–70 |
| Itacoatiara | 24 | 55.42 ± 8.78 | 23–70.5 |
| Manacapuru | 44 | 63.41 ± 8.15 | 50–85 |
| Porto Velho | 237 | 61.60 ± 8.18 | 39–105 |
| Santarem | 38 | 52.25 ± 6.52 | 35.2–73 |
| Parameters | C.I. | ||
|---|---|---|---|
| 2.5% | 97.5% | ||
| k | 0.29 | 0.11 | 0.48 |
| t0 | −2.3 | −6.1 | −0.9 |
| Lꝏ (mm) | 72.2 | 66.7 | 93.1 |
| Age | Length-at-Age (mm) | ||
|---|---|---|---|
| This Study | Loubens and Panfilli [34] | Armas et al. [32] | |
| 1 | 447 | 332 | 350 |
| 2 | 518 | 528 | 463 |
| 3 | 600 | 669 | 555 |
| 4 | 570 | 771 | 631 |
| 5 | 610 | 844 | 693 |
| 6 | 639 | 896 | 743 |
| 7 | 677 | 934 | 785 |
| 8 | 690 | 961 | 819 |
| Log (Increment) | C.I. | |||
|---|---|---|---|---|
| Predictors | Estimates | 5% | 95% | p-Value |
| Intercept | −0.1291 | −0.01 | 0.28 | 0.5059 |
| Age | −0.1415 | −0.168 | 0.1155 | 1 × 10⁻⁶ |
| F | −1.731 × 10⁻⁶ | −2.342 × 10⁻⁶ | −1.117 × 10⁻⁶ | 1.65 × 10⁻⁸ |
| D | −8.838 × 10⁻⁶ | −1.086 × 10⁻⁵ | −6.801 × 10⁻⁶ | 1 × 10⁻⁷ |
| Marginal R2 | 0.247 | |||
| Conditional R2 | 0.633 | |||
Disclaimer/Publisher’s Note: The statements, opinions and data contained in all publications are solely those of the individual author(s) and contributor(s) and not of MDPI and/or the editor(s). MDPI and/or the editor(s) disclaim responsibility for any injury to people or property resulting from any ideas, methods, instructions or products referred to in the content. |
© 2024 by the authors. Licensee MDPI, Basel, Switzerland. This article is an open access article distributed under the terms and conditions of the Creative Commons Attribution (CC BY) license (https://creativecommons.org/licenses/by/4.0/).
Share and Cite
Pereira, L.A.; Castello, L.; Hallerman, E.; Rodrigues, E.R.F.; Doria, C.R.d.C.; Duponchelle, F. Flood Pulse Effects on the Growth of Pseudoplatystoma fasciatum in the Amazon Basin. Fishes 2024, 9, 223. https://doi.org/10.3390/fishes9060223
Pereira LA, Castello L, Hallerman E, Rodrigues ERF, Doria CRdC, Duponchelle F. Flood Pulse Effects on the Growth of Pseudoplatystoma fasciatum in the Amazon Basin. Fishes. 2024; 9(6):223. https://doi.org/10.3390/fishes9060223
Chicago/Turabian StylePereira, Luciana Alves, Leandro Castello, Eric Hallerman, Edson Rubens Ferreira Rodrigues, Carolina Rodrigues da Costa Doria, and Fabrice Duponchelle. 2024. "Flood Pulse Effects on the Growth of Pseudoplatystoma fasciatum in the Amazon Basin" Fishes 9, no. 6: 223. https://doi.org/10.3390/fishes9060223