Article

Two Distinct Maternal Lineages of Threespine Stickleback (Gasterosteus aculeatus) in a Small Norwegian Subarctic Lake

by
Bård Ove Karlsen
1,
Dhurba Adhikari
2,
Tor Erik Jørgensen
2,
Ida Klykken Hanssen
2,
Truls Borg Moum
2,
Jarle Tryti Nordeide
2,* and
Steinar Daae Johansen
2
1
Department of Laboratory Medicine, Nordland Hospital Trust, 8092 Bodø, Norway
2
Genomic Division, Faculty of Biosciences and Aquaculture, Nord University, 8049 Bodø, Norway
*
Author to whom correspondence should be addressed.
Fishes 2024, 9(7), 285; https://doi.org/10.3390/fishes9070285
Submission received: 18 May 2024 / Revised: 4 July 2024 / Accepted: 9 July 2024 / Published: 18 July 2024
(This article belongs to the Section Genetics and Biotechnology)

Abstract

:
A subarctic Norwegian watercourse is known for its population of threespine sticklebacks (Gasterosteus aculeatus Linnaeus 1758) with unusual pelvic spine polymorphism; the upper lake contains a mixture of specimens that are normal-spined, asymmetric-spined, and spineless. In contrast, the downstream lakes and the nearby marine site contain only the normal spined morph. We investigated the maternal-line genetic structure in the watercourse using mitogenomics. A total of 242 sticklebacks representing two lakes and a marine site were assessed based on individual and pooled DNA sequencing. While two distinct mitogenome clades were detected in the upper lake (Lake Storvatnet), only one of these clades was present in the downstream lake. The marine site pooled DNA sample, however, contained several mitogenome haplotypes. We present mitogenome sequence features that include gene-specific single nucleotide polymorphisms, molecular phylogeny, and genetic differentiation assessments based on pairwise comparisons of pooled population samples from each site. The Lake Storvatnet mitogenomes belong to two distinct Euro-North American (ENA) clades; one of the ancestral lineages likely corresponds to the original maternal lineage in the watercourse, and the other was introduced more recently. We hypothesize that the second invader carried nuclear genomic features responsible for the observed present-day pelvic spine polymorphism in Lake Storvatnet.
Key Contribution: Complete mitogenome sequencing of numerous of stickleback individuals in a small subarctic lake identified two distinct haplotype clades, suggesting a recent invader event.

1. Introduction

The threespine stickleback (Gasterosteus aculeatus), which represents a well-established fish model system in phenotypic evolution and evolutionary genomics, has been reported to repeatedly colonize freshwater lakes across the northern hemisphere since the last ice age [1]. Transitions from marine to freshwater environments have resulted in notable morphological changes in body armor, such as reduction or loss of lateral plates and pelvic spines, which represents a classic example of parallel evolution. The genetics of body armor reduction has recently been investigated in more detail, including the molecular mechanism of pelvic reduction [1]. These studies, based on pelvic-reduced stickleback from Paxton Lake in British Columbia, Canada, revealed interesting mutation features linked to the PelA enhancer region of the Pitx1 transcription factor gene [2,3,4].
Pelvic-reduced stickleback morphologies have been observed in northern Europe, and one of the best-studied examples is from the Vesterålen archipelago in subarctic Norway. Here, Klepaker and co-workers reported complete or partial loss of pelvic spines in 60% of the stickleback population in a small lake (Lake Storvatnet) on the island of Langøya [5,6,7]. Recently, we performed molecular genetic analyses of the Lake Storvatnet population, with a focus on Pitx1 enhancer structures [8]. While interesting mutational features were observed in the PelA enhancer, there was no clear association with pelvic status, suggesting a more complex genetic mechanism compared to that of the Paxton Lake sticklebacks.
To gain more information about the genetic background, and probably also the long-term evolutionary history of Lake Storvatnet sticklebacks, we analyzed complete mtDNAs and reconstructed maternal lineage relationships using the mitogenome as a molecular marker. Different pelvic spine morphs were included in this study, as follows: normal-spined, spineless, and asymmetric-spined. The asymmetric group consists of specimens with >0.2 mm length difference between the two pelvic spines. In addition, we investigated stickleback mitogenomes from a downstream lake in the same watercourse and a nearby marine site. The latter two sample sites contain normally spined sticklebacks only [8].
MtDNA appears as a suitable and applicable genetic marker in vertebrates due to its maternal inheritance and multi-copy nature [9]. The structure, gene content, and function are highly conserved and involve 37 canonical genes [10,11,12,13]. The derived gene products represent a subset of hydrophobic proteins essential to oxidative phosphorylation, two rRNAs of the highly specialized mitochondrial ribosome, and a complete set of 22 tRNAs important for decoding and protein synthesis. The threespine stickleback has previously been investigated using specific mtDNA markers at the population level. Most studies include cytochrome b gene sequences in combination with the non-coding control region [14,15,16,17]. More recently, complete stickleback mitogenome sequences have become available and applied in taxonomic analyses. Among these are US specimen isolates from Alaska and Wisconsin [18] and complete mitogenomes derived from whole-genome sequencing datasets of sticklebacks sampled in Norway, Denmark, and Japan [19,20]. A recent mitogenomic analysis of the threespine stickleback revealed two main clades designated Trans-North Pacific (TNP) and the Euro-North American (ENA) [20]. In the current study, we investigated mitogenome molecular features and mitogenome diversity among sticklebacks from Lake Storvatnet, a downstream lake, and a nearby marine site by single specimen and pooled specimen datasets. The analyses revealed that Lake Storvatnet sticklebacks harbor mitogenome haplotypes that belong to two divergent ENA clades.

2. Materials and Methods

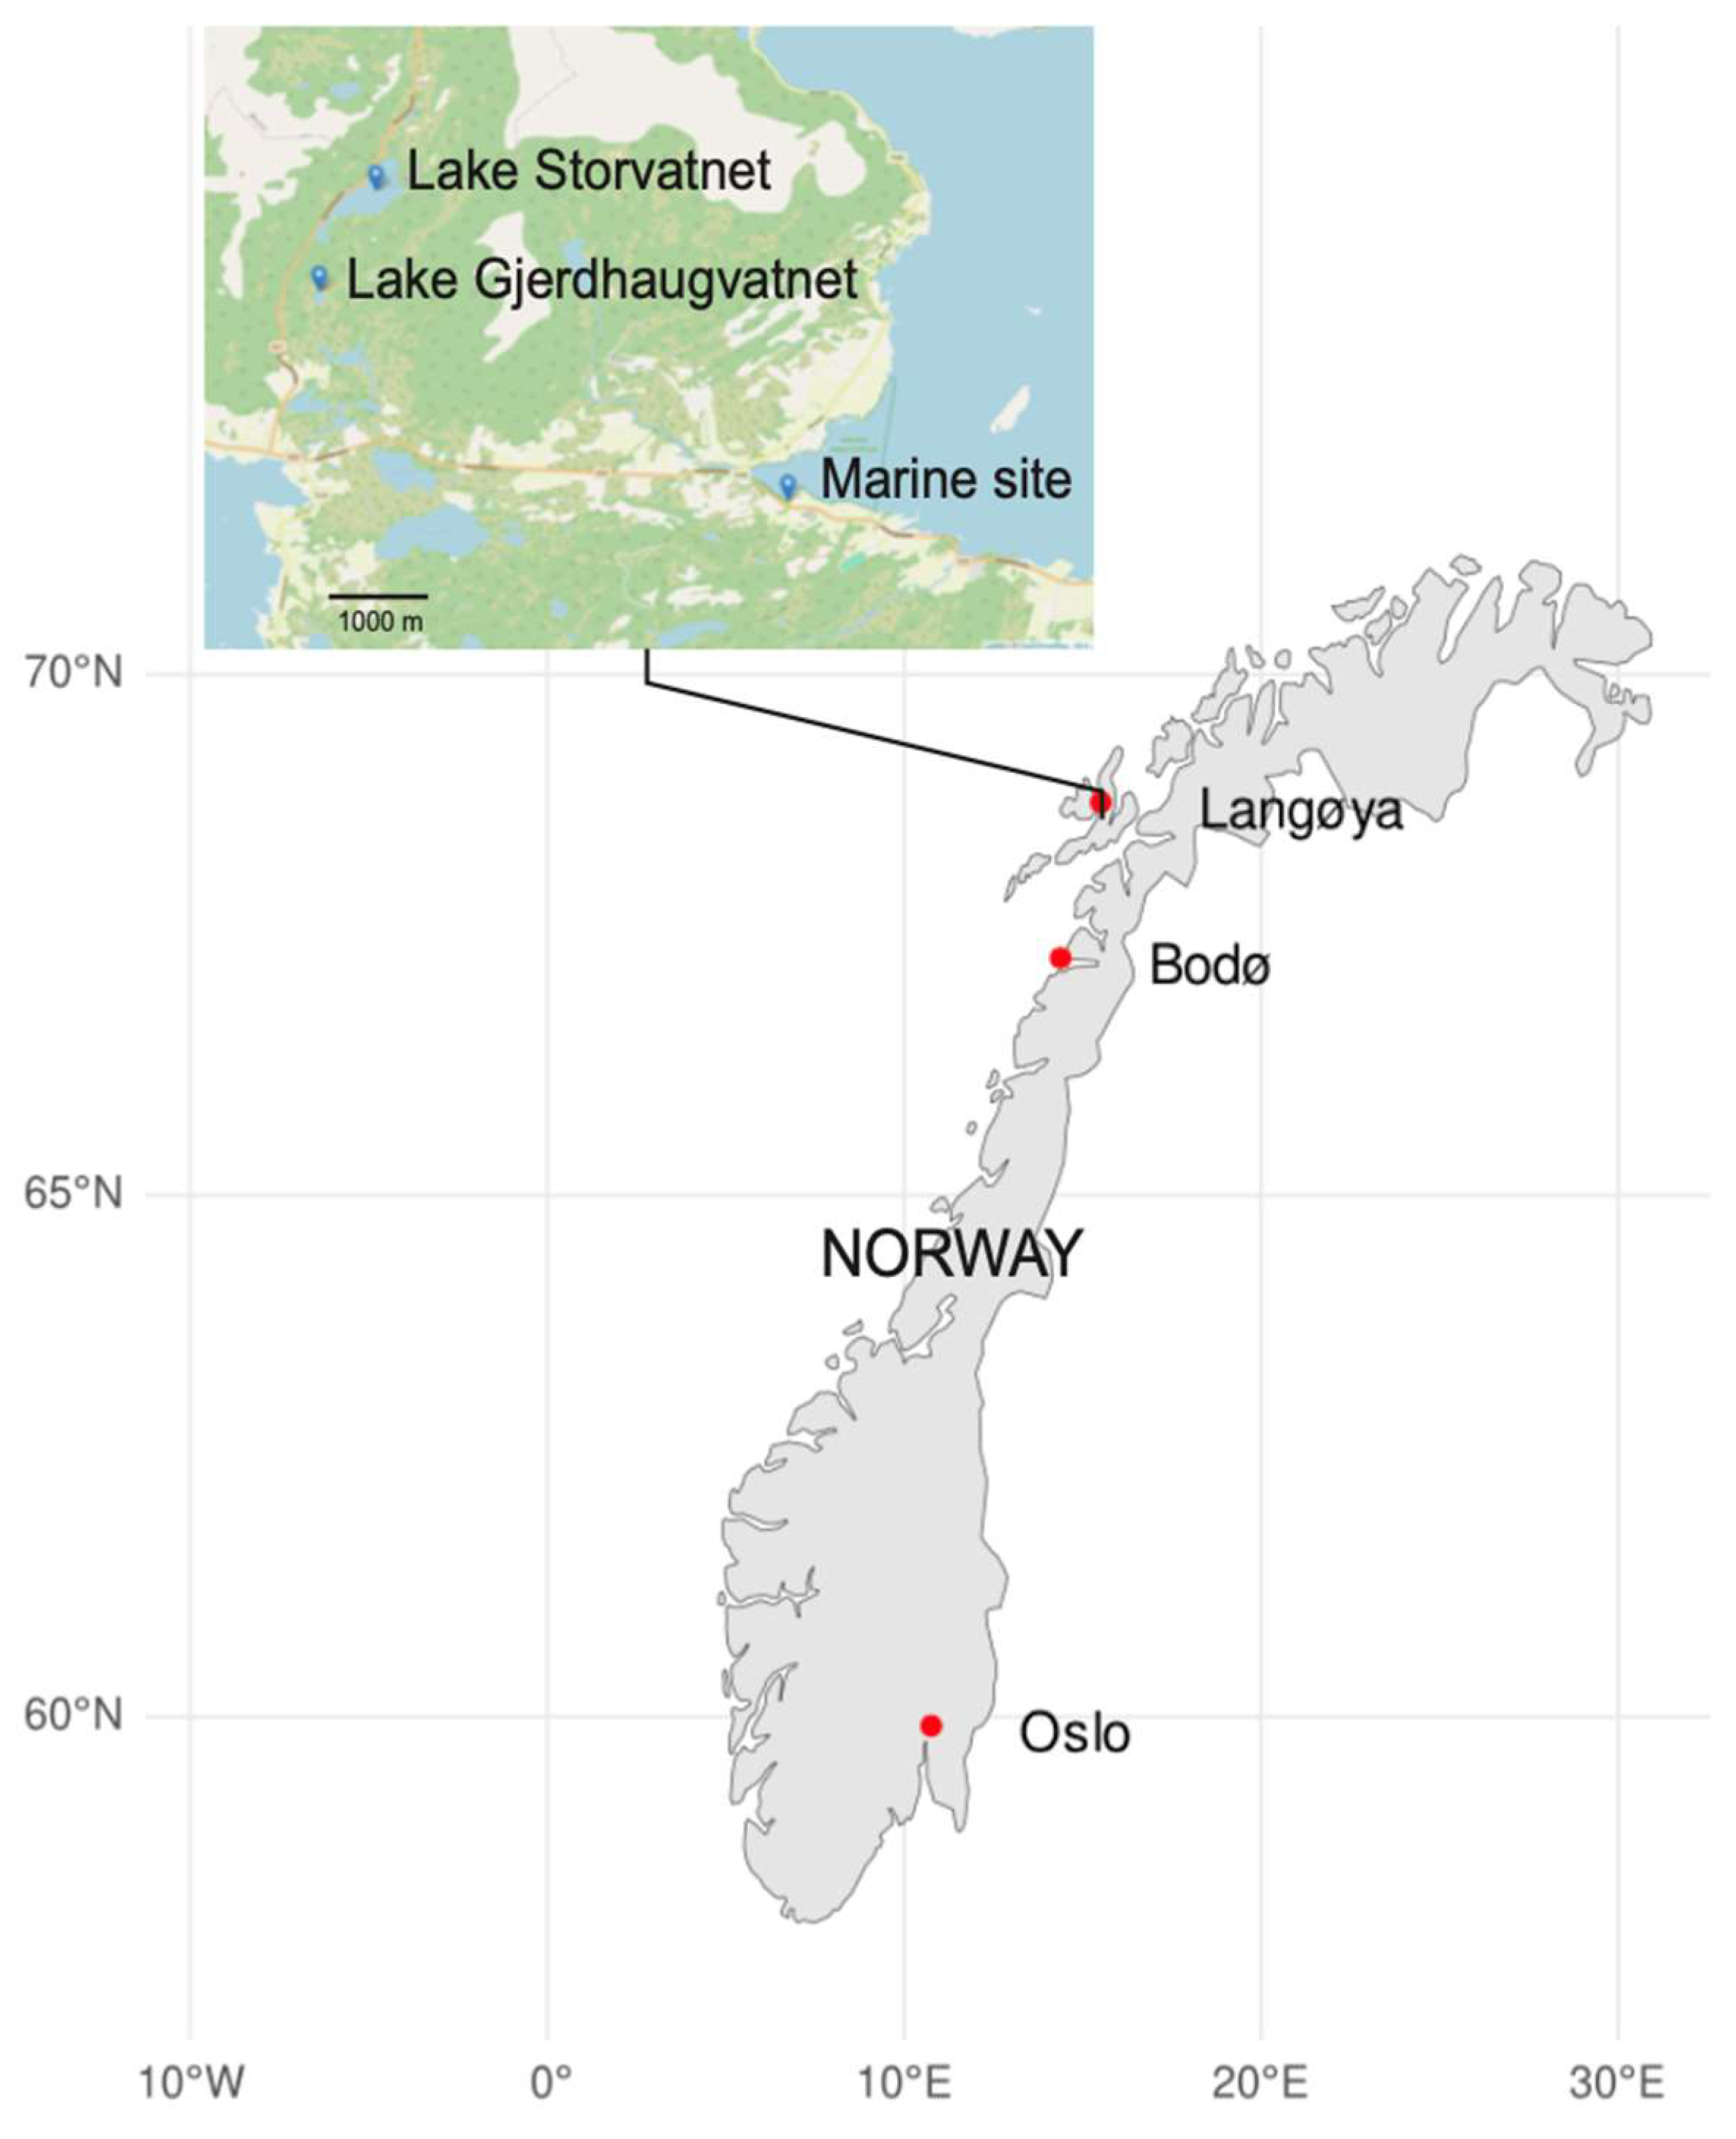
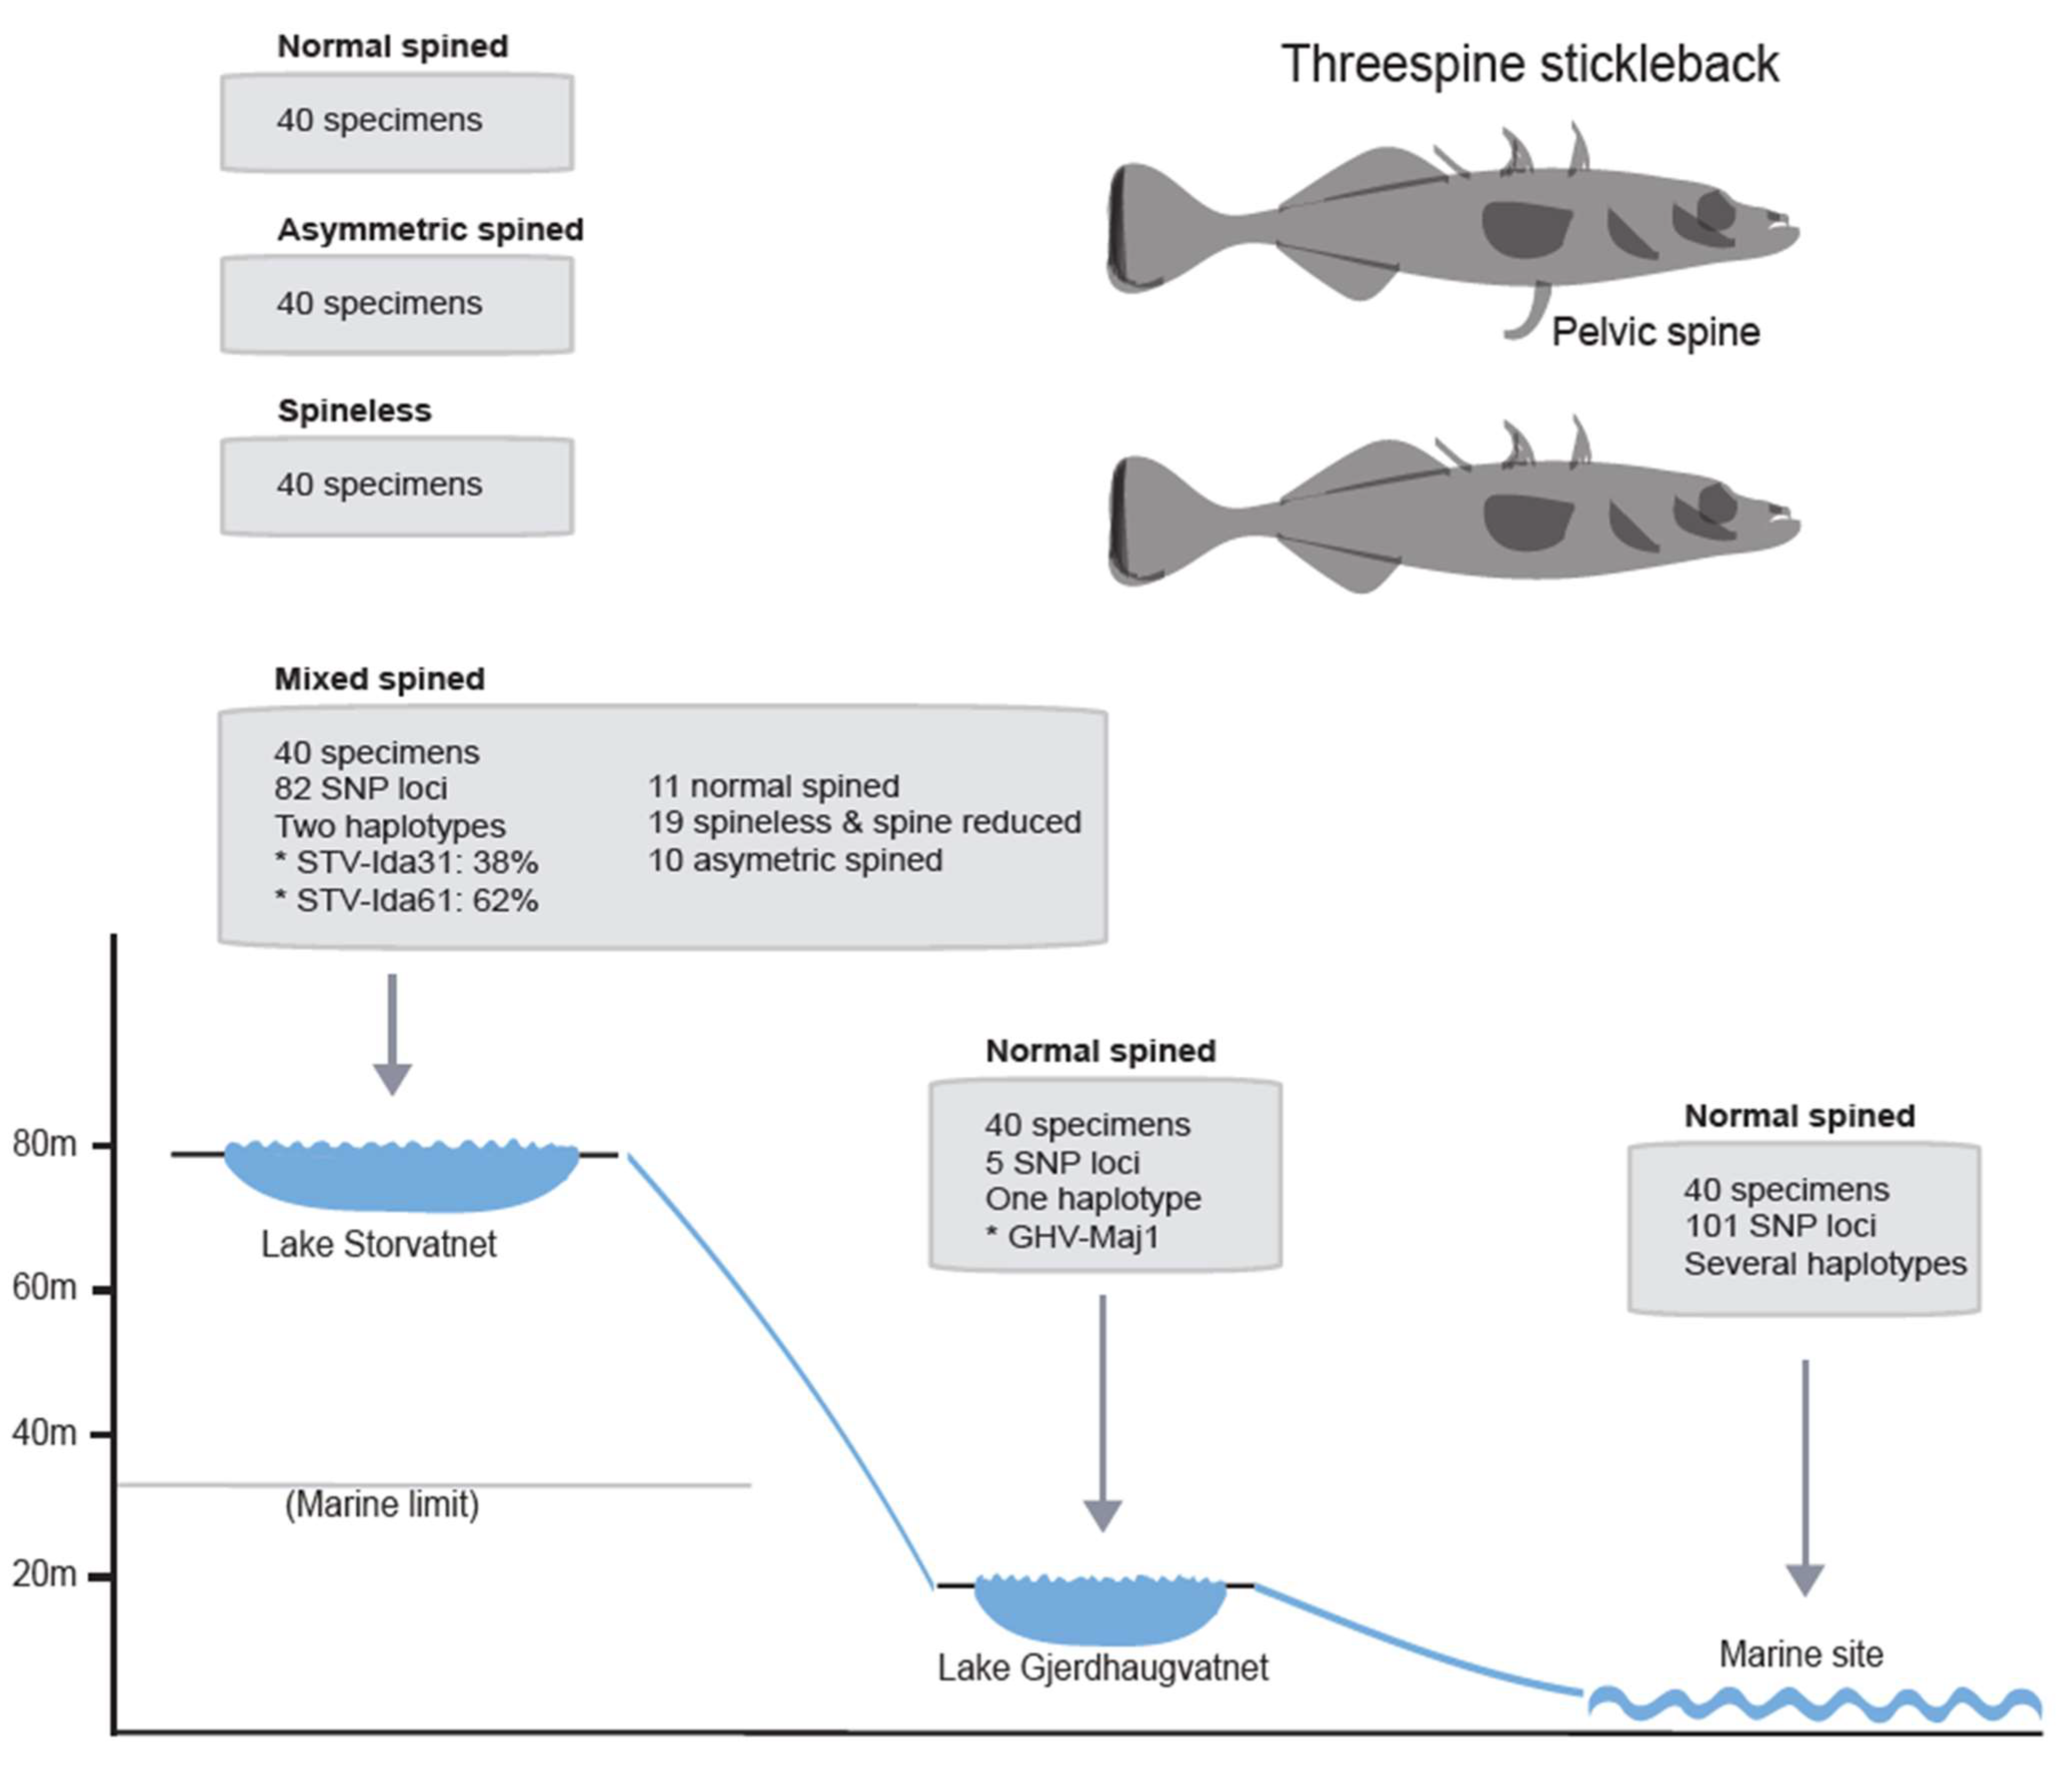
2.1. Fish Sampling and Morphology Scores

Sticklebacks were sampled at three locations in Vesterålen, Northern Norway (Figure 1). A total of 162, 40, and 40 specimens were collected and included in the mitogenome analyses from Lake Storvatnet, Lake Gjerdhaugvatnet, and a nearby marine site, respectively. Specimens were assessed for pelvic spine morphology features. All sticklebacks from Lake Gjerdhaugvatnet and the marine site were normal-spined. Lake Storvatnet sticklebacks (160 specimens) were divided into four population samples (40 specimens in each) based on their pelvic spine morphology, as follows: normal-spined, asymmetric-spined, spineless, and mixed-spined. The latter group (mixed-spined) was included as a representative population sample from Lake Storvatnet, consisting of 11 normal-spined specimens, 19 spineless and spine-reduced specimens, and 10 asymmetric-spined (left and right) specimens. Thus, a total of six population samples, each consisting of 40 specimens, were targeted for pooled sequencing. In addition, mitogenomes from two Lake Storvatnet specimens (one normal spine and one spineless) were sequenced individually.

2.2. DNA Isolation and DNA Pooling

DNA was isolated from a muscle sample anterior to the caudal fin. Tissue was homogenized using bead beating in DNA/RNA Shield solution (Zymo Research, Irvine, CA, USA) using a Dremel 8220 rotary tool (MP Biomedicals, Solon, OH, USA), as previously reported [8]. DNA was extracted from homogenized samples either with the MasterPureTM DNA Purification kit (Biosearch Technologies, Hoddesdon, UK) or the Monarch genomic DNA purification kit (New England Biolabs, Ipswich, MA, USA) following the standard protocols described in the kit manuals. The quality and concentrations of DNA in samples were further measured as previously described [8]. The final total DNA concentration of each specimen sample was ≥20 ng/µL. Six pooled population samples from the three locations, Lake Storvatnet, Lake Gjerdhaugvatnet, and the marine site, were prepared, each pool consisting of an equal amount of total DNA (100 ng) of each of the 40 specimens.

2.3. DNA Sequencing

Two specimens from Lake Storvatnet, one normal-spined (STV-Ida31) and one spineless (STV-Ida61), were subjected to whole-genome sequencing based on the Ion PGMTM system and IonTM 318 v2 chips. Sequencing libraries were constructed from approximately 400 bp DNA fragments, and Ion Torrent sequencing was performed essentially as previously described [21]. About 47 billion and 102 billion sequence nucleotides were obtained from STV-Ida31 and STV-Ida61 libraries, respectively, with average read lengths of 239 bp and 328 bp. The pooled DNA samples were shipped to the Norwegian Sequencing Center, University of Oslo, for whole-genome sequencing using Illumina technology. Sequencing was performed on an Illumina NovaSeq instrument generating paired-end reads of 150 bp.

2.4. Mitogenome Assembly and Analysis

The mitogenomes were assembled using QIAGEN CLC Genomics Workbench 23 (https://digitalinsights.qiagen.com/, accessed on 8 July 2024), and reads were mapped to a published stickleback reference sequence (MH205729 from Bear Pew Lake, AK, USA). The average mitogenome coverages of STV-Ida31 (16,545 bp) and STV-Ida61 (16,540 bp) correspond to 72 times and 154 times coverages, respectively. All positions were unambiguously determined. Each pooled DNA sample generated 796 to 1146 million paired Illumina reads. In the PoolSeq analysis, mitochondrial reads were mapped to STV-Ida31 as the reference sequence. Approximately 14,000 times coverages of the mitogenome were estimated in each pool sample, which correspond to an average coverage of 350 times for each specimen. The Alta-region mitogenome sequences were assembled using a synthetic pool creation approach, based on downloaded whole genome reads from the Sequence Read Archive under the BioProject accession number PRJNA693136 [19]. Three different locations were assessed, including one marine site (Altafjord) and two lake sites (Lake Klubbvatnet and Lake Jossavannet). Ten samples were downloaded for each location. For each location, the forward and reverse FASTQ files from downloaded samples were concatenated to create synthetic pools. Concatenated FASTQ files were then aligned to the mitochondrial reference genome STV-Ida31 using the Spliced Transcripts Alignment to a Reference (STAR) aligner (https://github.com/alexdobin/STAR, accessed on 8 July 2024). The mapping produced a sorted BAM file for each synthetic pool, enabling subsequent analyses of location-specific mitochondrial variations. Sequence information of the Alta-region mitogenomes is given in Table S4. Two mitogenomes from Limfjord (Denmark) and two from Akkeshi River (Japan) were assembled from whole genome sequencing data [20] available at Sequence Read Achieve (SRA) under accession numbers ERR104980, ERR104981, DRR032282, and DRR032292, respectively.

2.5. Molecular Phylogeny

Molecular phylogeny was inferred by using the tree-building method in QIAGEN CLC Genomics Workbench 23 (https://digitalinsights.qiagen.com/, accessed on 8 July 2024) based on maximum likelihood. The sequence alignment includes 15,650 nucleotide positions representing the complete mitogenome, excluding the control region. The sequence alignment was model-tested prior to tree construction using QIAGEN CLC Genomics Workbench 23. The best-fit model was general time reversible (GTR + G + T), and tree topologies were evaluated through bootstrapping (1000 bootstrap replicates).

2.6. Genetic Differentiation Statistics

Genetic differentiation between mitogenome populations was quantified using FST statistics [22]. FST values range from 0 to 1, where smaller values indicate lesser differentiation between populations while larger values indicate allele frequencies that are highly differentiated [23]. FST assessments were performed on pairwise pooled samples, essentially as described by [24]. A sliding window strategy of 30 nt with 15 nt overlap was used that included the FST-sliding.pl Perl script, which is part of the PoPoolation2 software toolkit (version 2_1201) [25]. The FST data were imported into R (version 4.2.0, R studio v 1.4.1717) for graphical population comparisons and downstream analysis.

3. Results

3.1. Mitogenome Sequence of the Reference Specimen STV-Ida31

Complete mitogenome sequences of two G. aculeatus specimens (fully spined STV-Ida31 and pelvic spineless STV-Ida61) from Lake Storvatnet, Norway (Figure 1), were determined using the Ion Torrent technology. The sequences of STV-Ida31 and STV-Ida61 were found to be 16,545 bp and 16,540 bp, respectively, and possessed a gene content and organization typical of vertebrates (Figure 2A). STV-Ida31 was selected as a reference sequence in our study and thoroughly annotated according to vertebrate mitogenome convention, conserved mRNA polyadenylation sites, and tRNA and rRNA secondary structure folding (Table S1). All 13 protein genes showed TAA as their predicted stop codons, and 7 of these were generated by posttranscriptional polyadenylation. Secondary structure predictions of the mt-tRNAs (Figure S1), mtSSU rRNA (Figure S2), and mtLSU rRNA (Figure S3) followed the typical patterns of teleost mitochondrial RNAs [11,12,21]. The 892 bp control region contained a heteroplasmic tandem repeat (HTR) array consisting of an 11 bp motif that varies both in primary sequence and in copy number [26]. Variants of four copies are shown in the mitogenome sequences (Figure 2A). The HTR array region (corresponding to positions 15,669–15,729 in STV-Ida31) was excluded in downstream comparisons and analyses.

3.2. Mitogenome Comparison between STV-Ida31 and STV-Ida61

The two mitogenomes from Lake Storvatnet differed at 88 nucleotide positions (excluding the HTR array), which show the co-occurrence of two divergent mitochondrial genotypes within a small, presumably isolated lake population (Table S2, columns 1 and 2). Two of the tRNAs were found to have variable sites in their structures (Figure 2B and Table S1). Furthermore, three and four single nucleotide polymorphisms (SNPs) were noted in mtSSU and mtLSU rRNAs, respectively, all located in regions known as variable in vertebrates (Figure 2C, Tables S2 and S3). We detected 67 SNPs in protein-coding regions, and all 13 mitochondrial genes were represented (Table S3). Here, thirteen SNPs were non-synonymous and resulted in conservative amino acid changes (Figure 2A). The remaining 12 SNPs were located in non-coding regions (Table S2, column 2).
To further assess the relationship between the two mitogenome haplotypes, STV-Ida31 and STV-Ida61, we performed a phylogenetic analysis. In addition to the Lake Storvatnet mitogenomes, we included available G. aculeatus mitogenome sequences in GenBank (two from Lake Superior, Wisconsin, USA, and one from Bear Paw Lake, Alaska, USA) and retrieved several mitogenome sequences from available genomic datasets. The latter included a mitogenome consensus sequence (GHV-maj1) from the nearby Lake Gjerdhaugvatnet located downstream in the same watercourse (Table S2, column 3), three Alta-region (Finnmark County, Norway) mitogenomic sequences, two mitogenomes from Limfjord (Denmark), and two from Akkeshi River (Japan) (Table S4). G. wheatlandi (Blackspotted stickleback) was used as an outgroup in the analysis. The alignment was based on complete mitogenome sequences, excluding the control region (CR). A representative maximum likelihood (ML) phylogenetic tree is presented in Figure 3. The phylogenetic analysis showed that the mitogenomes belong to the following two ancient clades, which is highly supported by the bootstrap analysis (100%): the TNP haplotype group represented by specimens from Japan and the ENA haplotype group consisting of specimens from Norway, Denmark, and the USA. Interestingly, the two mitogenome types from Lake Storvatnet clustered separately, one with each of the two main clades of the ENA (supported by a bootstrap of 100%). While STV-Ida31 clusters together with mitogenomes from the nearby Lake Gjerdhaugvatnet and a Lake Superior specimen (Wisconsin, US), STV-Ida61 appears more related to a marine mitogenome from the Alta-region and additional samples from Norway, Denmark, and the USA.

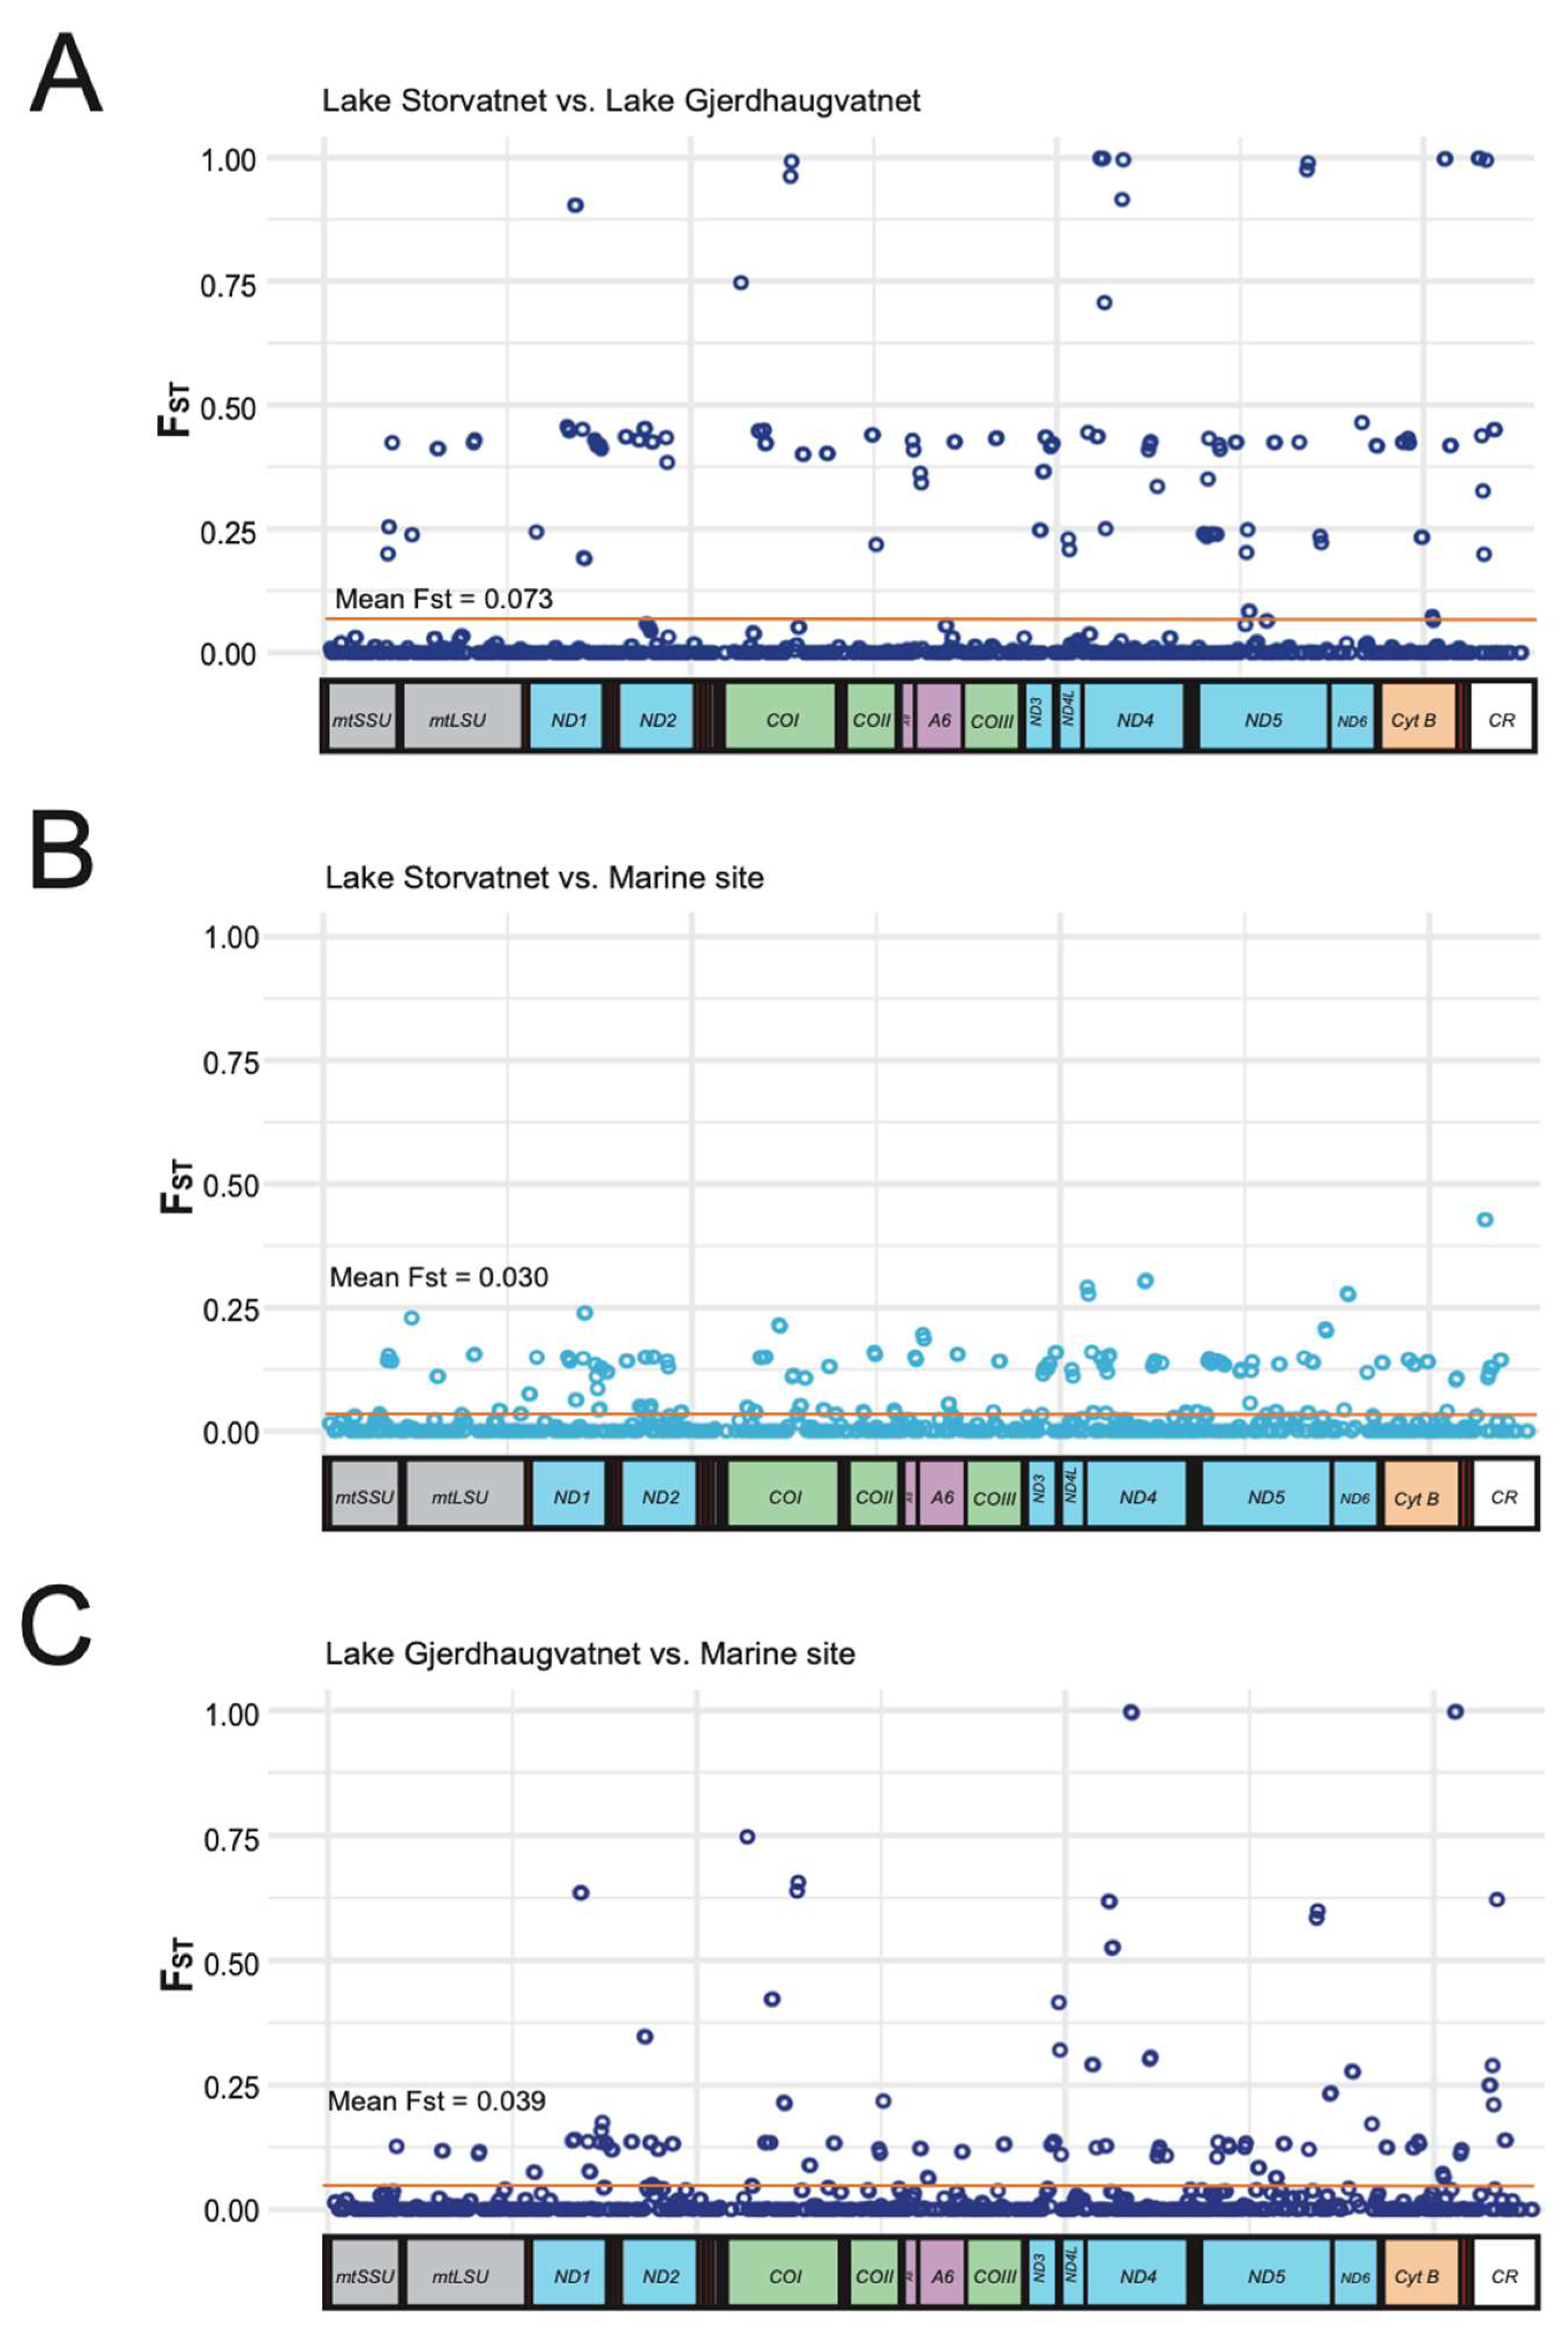
3.3. Pairwise Comparisons of Populations Based on Pooled DNA

We investigated mitogenome diversity in Lake Storvatnet, Lake Gjerdhaugvatnet, and a nearby marine site using an approach based on pairwise comparisons of datasets based on pooled DNA sequencing (PoolSeq). Pooled DNA samples were obtained using equimolar pooling of total DNA isolated from the muscle tissue of 40 specimens from each location (Figure 4), and the pooled samples were sequenced using Illumina technology. Approximately 14,000 times coverage of the mitogenomes was generated for each pool sample, corresponding to 350 times coverage of individual mitogenomes. Lake Storvatnet was originally represented by four different datasets (4 × 40 specimens) based on pelvic spine morphology (normal-spined, asymmetric-spined, spineless, and mixed-spined). Since the initial analysis concluded that the four datasets from Lake Storvatnet were practically identical in mitogenome SNPs and distribution of variants (see Figure S4), we used the mixed dataset as a representative for Lake Storvatnet in the mitogenome analyses below.
When applying a stringent SNP criterion (minimum variant frequency of ≥5%), we identified 82 SNP loci in the mixed dataset from Lake Storvatnet, mainly with two alleles corresponding to that of the STV-Ida31 and STV-Ida61 haplotypes (Figure 4; Table S2, column 4). Furthermore, the SNP allele frequency was largely stable at most sites at an average of 38% for the STV-Ida31 variant and 62% for the STV-Ida61 variant (Figure 4; Table S2, column 4). This result supports that the STV-Ida31 and STV-Ida61 haplotypes represent two clearly divergent clades, which are represented by approximately 15 and 25 specimens, respectively, in the mixed pooled 40 specimen sample from Lake Storvatnet. A similar SNP frequency trend was noted in the three additional pooled samples from Lake Storvatnet.
The SNP frequencies of stickleback mitogenomes from Lake Gjerdhaugvatnet (Figure 4; Table S2, column 3) suggest the presence of only one major haplotype that is strongly affiliated with the STV-Ida31 haplotype (see Figure 3). Only five SNP loci were identified within the dataset, all with two alleles with variant frequencies of approximately 40% (minor) and 60% (major). The Lake Gjerdhaugvatnet mitogenome haplotype (GHV-maj1) was reconstructed and applied in the phylogenetic analysis presented in Figure 3.
More variations were observed within the marine dataset with 101 variable positions compared to the STV-Ida31 sequence (Figure 4; Table S2, column 5). Here, 71 SNPs had two alleles and one had three alleles, but the allele frequencies were highly variable between loci indicating a mix of haplotypes. The marine dataset also contained 11 private SNP loci not found in Lake Storvatnet or Lake Gjerdhaugvatnet (Table S2, column 5). Finally, we note that most SNP loci allele variants (72%) present at Lake Storvatnet also were present in the marine dataset.

3.4. Mitogenome Genetic Differentiation between Sample Sites

Genetic differentiation between Lake Storvatnet datasets and between sample sites was assessed by pairwise comparisons using a window-based method to calculate the fixation index FST across the mitogenomes. We used the same setting as previously described for the Atlantic cod mitogenome [24] of sliding windows of 30 nt, with a 15 nt overlap. First, we assessed possible mitogenomic genetic differentiation between pelvic morph specimens in Lake Storvatnet (normal-spined, asymmetric-spined, spineless, and mixed pooled datasets). As expected, no differentiation was detected giving an FST value at or close to 0 (Figure S4), which strongly supports that mitogenome haplotypes are not associated with present-day pelvic morphs.
Next, we analyzed the genetic differentiation between the Lake Storvatnet pooled dataset and that of Lake Gjerdhaugvatnet (Figure 5A). Most positions were identical (FST = 0) among the mitogenomes assessed. However, some of the mitochondrial genes (e.g., COI, ND4, and ND5) contained positions that were fixed for different nucleotides in the two lakes (FST = 1.0; Table S2, columns 2, 3, and 4). Interestingly, and in accordance with the SNP analyses (Table S2), a number of sites throughout the mitogenome are divergent between the Lake Gjerdhaugvatnet, which is an observation that corresponds well to the two-mitogenome haplotype situation in Lake Storvatnet. The marine SNP analysis (Table S2, column 5) concluded that several mitogenome haplotypes appear present among the 40 specimens in the pool sample. This result is reflected in the genetic differentiation pairwise analysis comparing the marine population to that of Lake Storvatnet (Figure 5B) and Lake Gjerdhaugvatnet (Figure 5C). Here, most SNPs noted in Lake Storvatnet were also found in the marine sample. Lake Gjerdhaugvatnet harbors some private alleles not seen in Lake Storvatnet or the marine sample, an observation explained by the fact that only one major mitochondrial haplotype (GHV-Maj1) is present.

4. Discussion

We report mitogenome analyses of sticklebacks sampled from two freshwater lakes in a small watercourse and a nearby marine site in subarctic Norway. While the marine sample contained a mixture of several mitogenome haplotypes, the downstream lake (Lake Gjerdhaugvatnet) harbored only one major single lineage among the 40 specimens assessed in the dataset. The upper lake (Lake Storvatnet), however, contained two distinct mitogenome clades. Interestingly, sticklebacks in Lake Storvatnet have been reported to be unusual due to different morph features regarding the pelvic spines [6,8].
The complete primary mitogenome sequence of two individuals, STV-Ida31 and STV-Ida61, was determined, and their mitogenomes were compared in more detail. The haplotype sequences were highly divergent, differing in rRNA and tRNA genes, all protein-coding genes, and non-coding regions. Complex I genes (encoding NADH dehydrogenase subunits) were found to harbor most non-synonymous substitutions, an observation corroborating recent findings [20]. A phylogenetic analysis based on mitogenome sequences revealed interesting and surprising relationships. (1) STV-Ida31 and STV-Ida61 were both members of the ENA mitogenome clades but located in different clusters. (2) STV-Ida31 was closely related to the mitochondrial haplotype (GHV-Maj1) found in downstream Lake Gjerdhaugvatnet. This implies that STV-Ida31 and GHV-Maj1 represent the original maternal lineage of sticklebacks in the watercourse. (3) STV-Ida61, on the other hand, was more closely related to a marine haplotype from Altafjord, Northern Norway, a sampling site that corresponds to an aerial line distance of approximately 400 km compared to Lake Storvatnet. (4) Each of the two ENA mitogenome clusters was interspersed with US haplotypes from Lake Superior (Wisconsin), a situation resembling that of Lake Storvatnet. However, it is important to note the enormous difference in size between Lake Storvatnet (0.2 km2) and Lake Superior (82,103 km2).
What could be the origin of STV-Ida61 in Lake Storvatnet? Based on the observed close relationship between STV-Ida61 and the marine haplotype in Altafjord, it is tempting to speculate that STV-Ida61 is a result of a more recent colonization by marine sticklebacks. Repeated colonization of freshwater habitats is relatively common in sticklebacks [15,17,27,28], and the PoolSeq data from the assessed marine site was found to carry almost all private STV-Ida61 SNPs compared to that of STV-Ida31. To further challenge the idea of a marine invader, there will be a need to sequence characterize individual mitogenome haplotypes from nearby marine sites to assess nucleotide-level relationships to the STV-Ida61 haplotype.
Is there a link between the mitochondrial haplotypes and pelvic spine morphology in Lake Storvatnet? The STV-Ida31 and STV-Ida61 mitogenomes were isolated and analyzed from normal-spined and spineless stickleback specimens, respectively. However, mitogenome PoolSeq analyses representing all morph types (see Figure 4 and Table S4) unambiguously conclude that there is no obvious connection between the mitogenome haplotypes and pelvic morphs in the present-day sticklebacks in Lake Storvatnet. However, these results may not exclude a possible linkage at an earlier stage in the past. There are fundamental differences in inheritance patterns between the uniparental mitogenome and the biparental nuclear genome in which the phenotypic traits are encoded. Thus, we speculate that one plausible explanation could be that Lake Storvatnet was invaded and subsequently experienced a second colonization by pelvic spineless sticklebacks carrying the STV-Ida61 mitogenome haplotype. While the mitogenome haplotype became preserved in the population due to uniparental inheritance and a lack of intermolecular recombination, nuclear genome traits responsible for the spineless morph were soon randomized due to Mendelian inheritance and meiotic recombination. This hypothesis could be further challenged by whole genome sequence analyses of specimens representing different morphs and sample site locations.

5. Conclusions

In the present study, we investigated the mitogenomic sequence features of threespine sticklebacks in a Norwegian watercourse known for its population of sticklebacks with unusual pelvic spine morphs. Two distinct mitogenome haplotypes were detected in the upper lake, and we argue that these haplotypes represent different mitogenome clusters of the Euro-North American sticklebacks. While one of the mitogenome haplotypes represents the original maternal line in the watercourse, the other could have been introduced through a more recent colonization event. We hypothesize that the marine invader was carrying genomic features responsible for the present-day mixture of pelvic spine morphs in Lake Storvatnet.

Supplementary Materials

The following supporting information can be downloaded at https://www.mdpi.com/article/10.3390/fishes9070285/s1: Supplementary Figure S1: Secondary structure diagram of the complete 22 mitochondrial tRNAs in G. aculeatus. Anticodon nucleotides are boxed, and the non-template coded CCA is added at the 3′ end. The STV-Ida31 sequences are shown, and substitutions in STV-Ida61 are indicated in tRNA-Cys and tRNA-Tyr. Supplementary Figure S2: Secondary structure diagram of G. aculeatus mitochondrial small subunit rRNA. The four structural domains (domain 5′, domain C, domain 3′, and domain 3′m) are shown (green boxes). The STV-Ida31 sequences are shown, and 3 SNPs in STV-Ida61 are indicated. Supplementary Figure S3: Secondary structure diagram of G. aculeatus mitochondrial large subunit rRNA. The six structural domains I to VI are shown (green boxes). The STV-Ida31 sequences are shown, and 4 SNPs in STV-Ida61 are indicated. Supplementary Figure S4: Pairwise mitogenome genetic differentiation analyses between pooled populations in Lake Storvatnet. (A) Normal-spined versus spineless. (B) Normal-spined versus asymmetric-spined. (C) Spineless versus asymmetric-spined. (D) Normal-spined versus mixed-spined. (E) Spineless versus mixed-spined. (F) Asymmetric-spined versus mixed-spined. All detected FST values were close to 0 (average FST values 0.0014–0.0076), indicating that no variation was detected in the mitogenome between pelvic morph types. See legends to Figure 5 for additional information. Supplementary Table S1: Annotation of stickleback complete mitochondrial genome STV-Ida31. Supplementary Table S2: Mitogenome variation in Lake Storvatnet, Lake Gjerdhaugvatnet, and nearby marine site. Supplementary Table S3: Polymorphic sites in protein-coding genes in the mitochondrial genomes of stickleback specimens STV-Ida31 vs. STV-Ida61. Supplementary Table S4: Mitogenome variability in the Alta-region (Norway), Limfjord (Denmark), and Akkeshi River (Japan) datasets.

Author Contributions

All authors participated in the conceptualization of the research. D.A., I.K.H., T.B.M., J.T.N. and S.D.J. performed fish sampling. PoolSeq experiments and data analyses were performed by B.O.K. and D.A., with contributions from S.D.J., T.B.M. and J.T.N. DNA sequencing was performed by D.A., T.E.J. and I.K.H., with contributions from all coauthors. B.O.K. and T.E.J. assembled mitogenomes from whole genome sequence reds available in the Sequence Read Archive (SRA) database. T.E.J. and S.D.J. performed phylogenetic analysis and figure design, respectively. S.D.J. wrote the manuscript, with contributions from all coauthors. All authors have read and agreed to the published version of the manuscript.

Funding

This work received no external funding but was supported by general grants from Nord University.

Institutional Review Board Statement

This study was performed according to ethical guidelines stated by the Norwegian Ministry of Agriculture and Food through the Animal Welfare Act. According to guidelines we were not required to, and therefore do not, have a specific approval or approval number.

Informed Consent Statement

No humans are involved.

Data Availability Statement

All the sequencing data reported in this study can be downloaded through www.ncbi.nlm.nih.gov, accessed on 8 July 2024, Bioproject PRJNA1073316.

Acknowledgments

We thank the genomics facility at Nord University for its general support.

Conflicts of Interest

The authors declare that they have no conflicts of interest.

References

  1. Reid, K.; Bell, M.A.; Veeramah, K.R. Treespine stickleback: A model system for evolutionary genomics. Ann. Rev. Genom. 2021, 22, 357–383. [Google Scholar] [CrossRef] [PubMed]
  2. Chan, Y.F.; Marks, M.E.; Jones, F.C.; Villarreal, G., Jr.; Shapiro, M.D.; Brady, S.D.; Southwick, A.M.; Absher, D.M.; Grimwood, J.; Schmutz, J.; et al. Adaptive evolution of pelvic reduction in sticklebacks by recurrent deletion of a Pitx1 enhancer. Science 2010, 327, 302–305. [Google Scholar] [CrossRef] [PubMed]
  3. Thompson, A.C.; Capellini, T.D.; Guenther, C.A.; Chan, Y.F.; Infante, C.R.; Menke, D.B.; Kingsley, D.M. A novel enhancer near the Pitx1 gene influences development and evolution of pelvic appendages in vertebrates. eLife 2018, 7, e38555. [Google Scholar] [CrossRef] [PubMed]
  4. Xie, K.T.; Wang, G.; Thompson, A.C.; Wucherpfennig, J.I.; Reimchen, T.E.; MacColl, A.D.C.; Schluter, D.; Bell, M.A.; Vasquez, K.M.; Kingsley, D.M. DNA fragility in the parallel evolution of pelvic reduction in stickleback fish. Science 2019, 363, 81–84. [Google Scholar] [CrossRef]
  5. Klepaker, T.O.; Østbye, K. Pelvic anti-predator armour reduction in Norwegian populations of the threespine stickleback: A rare phenomenon with adaptive implications? J. Zool. 2008, 276, 81–88. [Google Scholar] [CrossRef]
  6. Klepaker, T.; Ostbye, K.; Bernatchez, L.; Vollestad, L.A. Spatio-temporal patterns in pelvic reduction in threespine stickleback (Gasterosteus aculeatus L.) in Lake Storvatnet. Evol. Ecol. Res. 2012, 14, 169–191. [Google Scholar]
  7. Klepaker, T.; Østbye KBell, M.A. Regressive evolution of the pelvic complex in stickleback fishes: A study of convergent evolution. Evol. Ecol. Res. 2013, 15, 413–435. [Google Scholar]
  8. Adhikari, D.; Hanssen, I.; Johansen, S.D.; Moum, T.; Nordeide, J.T. Pitx1 enhancer variants in spined and spine-reduced European sticklebacks. Fishes 2023, 8, 164. [Google Scholar] [CrossRef]
  9. Rackham, O.; Filipovska, A. Organization and expression of the mammalian mitochondrial genome. Nat. Rev. Genet. 2022, 23, 606–623. [Google Scholar] [CrossRef]
  10. Boore, J.L. Animal mitochondrial genomes. Nucleic Acids Res. 1999, 27, 1767–1780. [Google Scholar] [CrossRef]
  11. Satoh, T.P.; Miya, M.; Mabuchi, K.; Nishida, M. Structure and variation of the mitochondrial genome of fishes. BMC Genom. 2016, 17, 719. [Google Scholar] [CrossRef] [PubMed]
  12. Jørgensen, T.E.; Johansen, S.D. Expanding the coding potential of vertebrate mitochondrial genomes: Lesson learned from the Atlantic cod. In Mirochondrial DNA–New Insights; IntechOpen: Rijeka, Croatia, 2018. [Google Scholar] [CrossRef]
  13. Formenti, G.; Rhie, A.; Balacco, J.; Haase, B.; Mountcasle, J.; Fedrigo, O.; Brown, S.; Capodiferro, M.R.; Al-Ajli, F.O.; Ambrosini, R.; et al. Complete vertebrate mitogenomes reveal widespread repeats and gene duplications. Genome Biol. 2021, 22, 120. [Google Scholar] [CrossRef] [PubMed]
  14. Orti, G.; Bell, M.A.; Reimchen, T.E.; Meyer, A. Global survey of mitochondrial DNA sequence in the threespine stickleback: Evidence for recent migrations. Evolution 1994, 48, 608–622. [Google Scholar] [CrossRef] [PubMed]
  15. Makinen, H.S.; Merila, J. Mitochondrial DNA phylogeography of the three-spined stickleback (Gasterosteus aculeatus) in Europe–Evidence for multiple glacial refugia. Mol. Phylogenet Evol. 2008, 46, 167–182. [Google Scholar] [CrossRef] [PubMed]
  16. DeFaveri, J.; Zanella, L.N.; Zanella, D.; Markovcic, M.; Merila, J. Phylogeography of isolated freshwater three-spined stickleback Gasterosteus aculeatus populations in the Adriatic Sea basin. J. Fish. Biol. 2012, 80, 61–85. [Google Scholar] [CrossRef] [PubMed]
  17. Ravinet, M.; Harrod, C.; Eizaguirre, C.; Prodohl, P.A. Unique mitochondrial DNA lineages in Irish stickleback populations: Cryptic refugium or rapid recolonization? Evol. Evol. 2013, 4, 2488–2504. [Google Scholar] [CrossRef] [PubMed]
  18. Jiang, J.Q.; Wang, Q.X.; Liu, J.W.; Liu, C.Z. Characterization of the complete mitochondrial genome of tree-spined stickleback, Gasterosteus aculeatus. Mitochondrial DNA Part B 2018, 3, 1133–1134. [Google Scholar] [CrossRef] [PubMed]
  19. Kirch, M.; Romundset, A.; Gilbert, M.T.P.; Jones, F.C.; Foote, A.D. Ancient and modern stickleback genomes reveal the demographic constraints on adaptation. Curr. Biol. 2021, 31, 2027–2036. [Google Scholar] [CrossRef]
  20. Beck, E.A.; Bassham, S.; Cresko, W.A. Extreme intraspecific divergence in mitochondrial haplotypes makes the threespine stickleback fish an emerging evolutionary mutant model for mito-nuclear interactions. Front. Genet. 2022, 13, 925786. [Google Scholar] [CrossRef]
  21. Dubin, A.; Jørgensen, T.E.; Jakt, L.M.; Johansen, S.D. The mitochondrial transcriptome of the anglerfish Lophius piscatorius. BMC Res. Notes 2019, 12, 800. [Google Scholar] [CrossRef]
  22. Gregorius, H.R. The relationship between the concepts of genetic diversity and differentiation. Theor. Appl. Genet. 1987, 74, 397–401. [Google Scholar] [CrossRef]
  23. Holsinger, K.E.; Weir, B.S. Genetics in geographically structures populations: Defining, estimating and interpreting FST. Nat. Rev. Genet. 2009, 10, 639–650. [Google Scholar] [CrossRef]
  24. Karlsen, B.O.; Emblem, Å.; Jørgensen, T.E.; Klingan, K.A.; Nordeide, J.T.; Moum, T.; Johansen, S.D. Mitogenome sequencing variation in migratory and stationary ecotypes of North-east Atlantic cod. Mar. Genom. 2014, 15, 103–108. [Google Scholar] [CrossRef]
  25. Kofler, R.; Orozco-terWengel, P.; De Maio, N.; Pandey, R.V.; Nolte, V.; Futschik, A.; Kosiol, C.; Schlotterer, C. Popoolation: A toolbox for population genetic analysis of next generation sequencing data from pooled individuals. PLoS ONE 2011, 6, e15925. [Google Scholar] [CrossRef]
  26. Starner, H.; Påhlsson, C.; Linden, M. Tandem repeat polymorphism and heteroplasmy in the mitochondrial DNA control region of threespine stickleback (Gasterosteus aculeatus). Behaviour 2004, 141, 1357–1369. [Google Scholar] [CrossRef]
  27. Lescak, E.A.; Bassham, S.L.; Catchen, J.; Gelmond, O.; Sherbick, M.L.; von Hippel, F.A.; Cresko, W.A. Evolution of stickleback in 50 years on earthquake-uplifted island. Proc. Natl. Acad. Sci. USA 2015, 112, E7204–E7212. [Google Scholar] [CrossRef]
  28. Aquirre, W.E.; Reid, K.; Rivera, J.; Heins, D.C.; Veeramah, K.R.; Bell, M.A. Freshwater colonization, adaptation, and genomic divergence in threespine stickleback. Integr. Comp. Biol. 2022, 62, 388–405. [Google Scholar] [CrossRef]
Figure 1. Map view of sampling sites in a Norwegian subarctic watercourse. Sampling sites were located north of the Arctic Circle, Norway, on the island of Langøya (Vesterålen). The marine site at Sandstrand and the two sites (Lake Storvatnet and Lake Gjerdhaugvatnet) are indicated. The figure was generated in “R” (version 4.4.1).
Fishes 09 00285 g001
Figure 2. Mitogenome organization and sequence variation of STV-Ida31 and STV-Ida61 of the threespine stickleback (G. aculeatus). (A) Mitogenome presented as a linear map of the circular mtDNA. Number of single nucleotide polymorphisms (SNPs) and SNP density in rRNA and protein-coding genes (PCGs) in STV-Ida61 compared to the reference STV-Ida31 are shown above the gene map. Number of non-synonymous amino acid shifts in PCGs is indicated. The heteroplasmic tandem repeat (HTR) array in the control region (CR) is shown below the gene map. W represents nucleotides A or T, and S represents nucleotides G or C. Gene abbreviations: mtSSU and mtLSU, mitochondrial small and large subunit ribosomal RNA (color gray); ND1-6, NADH dehydrogenase subunit 1 to 6 (color blue); COI-III, cytochrome c oxidase subunit I to III (color green); A6 and A8, ATPase subunit 6 and 8 (color violet); and Cyt B, cytochrome b (color orange). Ori L and Ori H, origins of light (L) and heavy (H) strands, respectively. tRNA genes are indicated by the standard one-letter symbols for amino acids. All genes are H-strand specific, except Q, A, N, C, Y, S1, E, P, and ND6 (L-strand). (B) Secondary structure of tRNA-Cys and tRNA-Tyr in STV-Ida31. SNPs in STV-Ida61 at positions 5344 and 5497 are indicated by arrows. Note that SNPs are annotated on H-strand, but the tRNA sequences correspond to L-strand. (C) Secondary structure of mtLSU rRNA (Domain IV) in STV-Ida31. The terminal loop of helix 66 contains an SNP in STV-Ida61 at position 2041 (indicated by arrow). See Figures S2 and S3 for complete rRNA secondary structures and SNPs.
Fishes 09 00285 g002
Figure 3. Mitogenome phylogeny of threespine stickleback (G. aculeatus) sampled in Norway, Denmark, Japan, and the USA. The phylogenetic tree was based on an alignment of 15,650 nt positions (complete mitogenome, except control region) and obtained using the maximum likelihood method and 1000 bootstrap replicates. High-confidence relationships are indicated by bold lines and red dots at branching sites (bootstrap values 100%). Gray dots indicate bootstrap values above 65%. The blackspotted stickleback (Gasterosteus wheatlandi, NC_011570) was included as an outgroup. TNP, Trans-North Pacific; ENA, Euro-North American. The two high confident ENA clusters are indicated by blue and orange boxes. Species abbreviations, sampling sites, and NCBI data accession numbers: STV_Ida31, Lake Storvarnet—Norway (PP411914; PRJNA1073316); STV_Ida61, Lake Storvatnet—Norway (PRJNA1073316); GHV_Maj1, Lake Gjerdhaugvatnet—Norway (PRJNA1073316); Alta_LJ, Lake Jossavannet—Norway (PRJNA693236); Alta _LK, Lake Klubbvatnet—Norway (PRJNA693236); Alta_AF-marine, Altafjord—Norway (PRJNA693236); LF1-marine, Limfjord—Denmark (ERR104980); LF2-marine. Limfjord—Denmark (ERR104981); Wisconsin_LS1, Lake Superior—USA (MW856890); Wisconsin_LS2, Lake Superior—USA (MW856891); Alaska_BPL, Bear Paw Lake—USA (MH205729); AR1, Akkeshi River—Japan (DRR032282); AR2, Akkeshi River—Japan (DRR032292). The scale bar indicates the fraction of substitutions per site. Note that branches shorter than 0.0011 are shown as having length 0.0011.
Fishes 09 00285 g003
Figure 4. Pooled dataset sampling strategy and summary of results. Four pooled datasets (40 specimens each) were assessed from Lake Storvatnet (altitude 80 m). Normal-spined dataset: mitogenomes isolated from stickleback with two normally developed pelvic spines. Spineless dataset: mitogenomes from sticklebacks lacking pelvic spines. Asymmetric-spined dataset: mitogenomes from sticklebacks with only one of the pelvic spines > 0.2 mm longer than the other. Mixed dataset: mitogenomes from different stickleback morphs in numbers as indicated in the figure. In addition, one dataset of 40 specimens represented Lake Gjerdhaugvatnet (altitude 20 m). The two lakes were separated by a small 500 m brook containing several waterfalls. The areal marine limit in this area is 35 m. The marine site was located approximately 8 km from the watercourse and was represented by one pooled dataset of 40 specimens. The mixed-spined dataset was representative of the stickleback population in Lake Storvatnet (see Figure S4) and analyzed in more detail. Numbers of single nucleotide polymorphic (SNP) loci and estimated haplotypes are indicated for each sampling site. See Figure 1 for map locations.
Fishes 09 00285 g004
Figure 5. Mitogenome genetic differentiation in pairwise analyses. The fixation index FST was calculated across the mitogenome pooled populations using a sliding window of 30 nt, with a 15 nt overlap. FST values vary from 0 (no differentiation detected) to 1 (highly differentiated). A schematic view of the mitogenome organization is shown below each plot. (A) Lake Storvatnet versus Lake Gjerdhaugvatnet. (B) Lake Storvatnet versus marine site. (C) Lake Gjerdhaugvatnet versus marine site.
Fishes 09 00285 g005
Disclaimer/Publisher’s Note: The statements, opinions and data contained in all publications are solely those of the individual author(s) and contributor(s) and not of MDPI and/or the editor(s). MDPI and/or the editor(s) disclaim responsibility for any injury to people or property resulting from any ideas, methods, instructions or products referred to in the content.

