Abstract
In fisheries’ stock assessments, the concept of “growth plasticity”—the ability of organisms to modulate their growth rates in response to environmental conditions—has gained attention in recent years. Historically, the impacts of fishing activities and environmental fluctuations were considered separately, while their combined effects have recently come into focus. This study collected 834 adult small yellow croakers (Larimichthys polyactis) from the northern Yellow Sea, the central Yellow Sea, the southern Yellow Sea, and the northern East Sea by trawling during 2020–2021. Using otolith increments as a proxy for annual somatic growth, the study reconstructed otolith chronologies during 2015–2020 for these four stocks. The results of the mixed-effects modeling suggested that temperature during spawning and previous overwintering seasons had comparable importance for the annual growth of small yellow croakers, with higher temperature promoting growth. The growth of small yellow croakers was also found to be correlated with ENSO events, with a lag of 1 to 2 years. A further investigation into combined effects revealed that higher fishing pressure might inhibit the small yellow croaker’s response to favorable environmental conditions. Furthermore, considering the potential differences in growth plasticity among stocks, an analysis was conducted on the spatial variations in growth response to these factors. The analysis revealed that, compared to the stocks in the Yellow Sea, the stock from the East China Sea could exhibit higher growth, superior adaptability to temperature, and a distinctive response to fishing pressure. In conclusion, the present study, while primarily focusing on temperature, preliminarily analyzed the combined effects of fishing and environment and underscored the differences in growth plasticity between stocks in the Yellow Sea and the East China Sea. Despite the limited factors analyzed in this study, it suggests a direction for future studies, highlighting the necessity to include more environmental factors, and even population factors (e.g., the biomass of preys), for a more comprehensive understanding of the combined effects. Based on the observed differences between the two potential subpopulations, this study also provides new insights for the management of the small yellow croaker based on metapopulation dynamics.
Keywords:
small yellow croaker; otolith chronology; growth plasticity; climate change; fisheries’ selectivity Key Contribution:
The present study suggests that increased fishing pressure may potentially reduce the environmental adaptability of the small yellow croaker. Additionally, differences in growth plasticity between the East China Sea and Yellow Sea subpopulations were discovered, providing valuable information for the metapopulation management of small yellow croakers.
1. Introduction
The small yellow croaker (Larimichthys polyactis), distributed in the northwest Pacific Ocean, is essential to China’s fishing industry. In the last decade, the annual landing of small yellow croaker in China has fluctuated between 268,730 and 406,868 tons, ranking ninth in the marine fishery catch statistics [1]. However, the resources of small yellow croaker once experienced a period of low yield in the 1970s and 1980s, with landings falling to 16,000 tons in 1989, approximately one-tenth of the level in 1957 [2]. Since the 1990s, the Chinese government has implemented fisheries’ conservation measures, such as fishing moratoria [3], with a rebound in the annual catch of small yellow croaker (Larimichthys crocea). In contrast, the large yellow croaker, a species closely related to the small yellow croaker both taxonomically and ecologically, has not yet recovered from the resource collapse that occurred in the 1980s [4]. Regarding the distinct recovery of the small yellow croaker, researchers have observed that the rebound was accompanied by a shift in life-history strategy towards r-selection [5,6], characterized explicitly by earlier sexual maturation [7], increased relative fecundity [8], smaller body size [9,10], and a younger age structure within the population [11,12]. However, the delicate state of the resources and the limited self-regulatory capacity of populations [13,14] highlight the imperative for additional information for effective fisheries management.
Modeling of body growth is an essential part of fisheries’ stock assessments. Variation in growth rates has a direct impact on the size-at-age of fish individuals, which in turn affects population dynamics, including biomass [15], fecundity [16,17], natural mortality [18,19], as well as predatory interactions and competitive abilities [20]. In recent years, the assumption of “constant growth” in growth modeling has been challenged, and “growth plasticity” has gained increasing attention [21]. Plasticity allows the organisms to vary their growth rate in response to various extrinsic factors, such as temperature [22,23], climatic shifts [24], and population density [25,26,27]. For the small yellow croaker, the relationship between growth and either resource abundance or fishing pressure has consistently been a focal point of research [6,12]. Similarly, the correlation with temperature has been tested both in wild populations [28] and in laboratory settings [29]. However, these factors have traditionally been considered separately. In recent years, the combined impact of fishing and environmental factors gained attention [30] and was detected in many fish species [31,32,33]. Therefore, against the backdrop of current global warming, it is necessary to investigate the combined effect of human activities and environmental changes on the small yellow croaker’s population dynamics.
Furthermore, growth plasticity is genetically based and has the potential to evolve in response to environmental changes and exploitation pressures [21,34]. Consequently, phenotypic responses to extrinsic environmental conditions may exhibit variability across different species, among populations, and even within geographically widespread populations [35]. The distribution of small yellow croaker in China’s coastal waters extends from 26° N to 41° N, including the East China Sea, the Yellow Sea, and the Bohai Sea. In each region, the main distribution areas for small yellow croakers were located at the intersections of different currents and water masses [36,37]. Specifically, the East China Sea is subject to the combined influences of the Taiwan Warm Current [38,39], the runoff from the Yangtze River [40,41], and the Yellow Sea Cold Water Mass [42]. In the Yellow Sea, the dominant hydrological processes are shaped by the Yellow Sea Cold Water Mass [43,44,45] and the Yellow Sea Warm Current [46,47]. The complex dynamics of these ocean currents and water masses modulate the thermohaline characteristics of various marine regions, potentially leading to significant variations in the habitat conditions for different stocks of small yellow croaker [48,49]. Therefore, it is essential to consider spatial heterogeneity when studying the growth plasticity of the small yellow croaker.
Moreover, a series of studies have been conducted on the population structure of the small yellow croaker using various methods. Based on fishery surveys, it was historically proposed that there were four distinct stocks of small yellow croaker: in the Bohai Sea-northern Yellow Sea, the central Yellow Sea, the southern Yellow Sea, and the East China Sea [50]. This finding was also supported by recent otolith isotope analysis results [51]. However, alternative perspectives and findings challenged this view: (a) there was no clear stock distinction between the central and southern Yellow Sea; (b) clustering results of otolith morphology indicated the presence of two distinct stocks in the East China Sea, namely, the northern and southern stocks [52]; (c) the southern Yellow Sea stock and the northern East China Sea stock likely constituted a single subpopulation [53]; (d) based on fishery data analysis and migration routes, the stocks in the southern Yellow Sea and the East China Sea was considered as one subpopulation [54]; and (e) genetic analyses showed no significant difference among stocks across the Bohai Sea, the Yellow Sea, and the East China Sea [55,56]. There remains a need for continued research into the population structure of the small yellow croaker. The heterogeneity or similarity in growth plasticity among different stocks in this study are expected to offer new insights into the population subdivision of this species.
Otoliths, internal calcified structures within fish, were demonstrated to grow in close relation with somatic growth [57,58]. These structures reflect the annual growth of individual fish through otolith increments and provide researchers with a means to trace and reconstruct the fish’s growth history [59]. Compared to size-at-age data, otolith increment data could reflect the current growth status of individual fish and correspond to environmental conditions at specific periods, making it an essential tool for studying factors that influence fish growth [60,61]. Previous studies have proven spatial differences and environmental sensitivity in the otolith increments of the small yellow croaker [28,52]. Therefore, it is possible to compare growth patterns of different stocks of small yellow croaker over years and identify the differences and similarities in regional responses to environmental changes.
In this study, the samples of small yellow croakers were collected from the northern Yellow Sea, the central Yellow Sea, the southern Yellow Sea, and the northern East China Sea. Using a combination of otolith chronology and mixed-effects models, the growth patterns of these four stocks were initially established. After accounting for the effects of intrinsic factors, this study further analyzed the influences of fishing pressure and environmental variables, along with their interactions. The objectives of the present study were to: (a) reveal the impact of human fishing activities on the environmental adaptability of the small yellow croaker; (b) analyze differences or similarities among stocks in their growth response to influencing factors, offering critical supplementary insights for the population structure of the small yellow croaker.
2. Materials and Methods
2.1. Sample Collection
Small yellow croaker samples were collected from four spawning grounds along the Chinese coastline, as illustrated in Figure 1a, which were chosen to represent the stocks from the northern Yellow Sea (NYS), the central Yellow Sea (CYS), the southern Yellow Sea (SYS), and the northern East China Sea (NECS). During 2020 and 2021, sample collections were conducted twice a year: once in early April at the start of the spawning season, and once at the end of September, before the winter migration. Samples were randomly collected by bottom trawlers and immediately frozen at −20 °C before being transported to the laboratory for further analysis, which involved measuring each individual’s standard body length (SL) in millimeters (mm). Furthermore, sagittal otoliths were extracted through gills, cleaned in fresh water, air-dried, and stored in labeled plastic tubes for later analysis. The number of fish individuals sampled from each area is indicated in Figure 1b, and more detailed information about each sample is listed in Table S1.
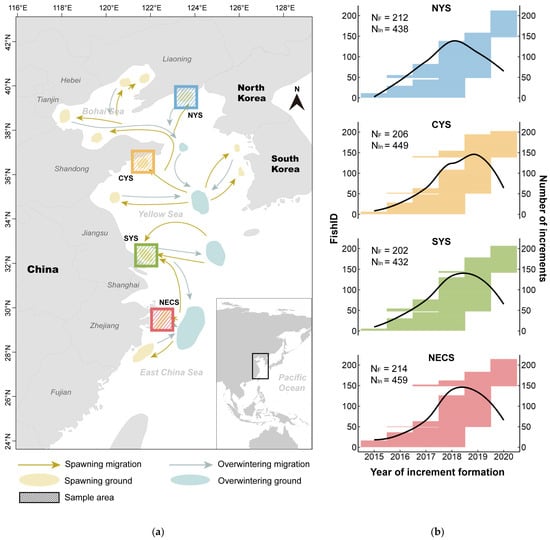
Figure 1.
Sampling information for the present study. (a) Map of the China Sea illustrating the migration routes of L. polyactis [62,63] and the four sampling areas: northern Yellow Sea (NYS), central Yellow Sea (CYS), southern Yellow Sea (SYS), and northern East China Sea (NECS). (b) Information on the increment data used in the analysis. The length of the horizontal line corresponding to each individual fish (FishID, the left y-axis; the FishID for small yellow croakers from each area has been simplified to numerical form) represents the span of years from the second to the last increments. The right y-axis indicates the cumulative count of otolith increments measured for each year, depicted by the black curve. The total number of fish individuals (NF) and the total number of increments (NIn) for each area are annotated, respectively.
2.2. Otolith Measurement
The right otolith was embedded in clear epoxy resin (EpoThin, Buehler Ltd., Shanghai, China). Then, a transverse section with a thickness of 0.8 mm was obtained by cutting through the center of the otolith along the dorsal–ventral axis [28,50] using an IsoMet low-speed saw (Buehler Ltd., Shanghai, China). Each section was mounted on a microscope slide and sequentially ground with waterproof abrasive paper of 240, 600, 1200, and 2500 grit to improve the visibility of annual marks. Subsequently, otolith sections were photographed at 40× magnification using an Olympus BX53 microscope with a DP74 digital camera (Olympus, Tokyo, Japan). Measurements of the otolith sections were performed using ImageJ software (version 1.53). Initially, the otolith radius (OR) was measured from the core to the edge along the axis on the medial side of the otolith (as shown in Figure 2). Annual growth increments, identified by alternating translucent and opaque bands, were then marked along the same axis, starting from the marginal increment corresponding to the year of capture and moving toward the otolith core. The age and increment estimation for each section was performed twice by an experienced otolith reader, blind to the fish information. In cases of inconsistency between the two age readings, a third reading was performed, or, if necessary, the sample was excluded.
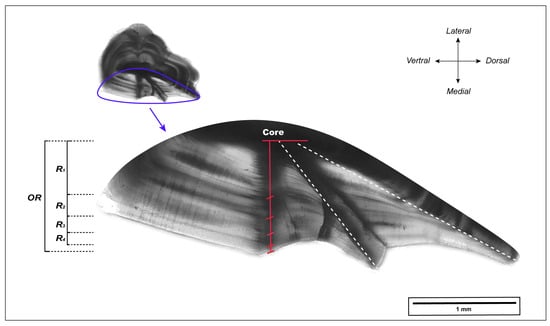
Figure 2.
L. polyactis otolith transverse section of a 4-year-old individual. OR and Ri (i = 1, 2, …) indicate the measured otolith radius and width of annual increment, respectively. The opaque zone of each annual increment is marked in red. Some illustrations are referenced from [50].
Each increment was assigned a “Year” and an “Age”, determined by back-calculating from the year of capture and the age-at-capture (AAC). Since the spawning season of the small yellow croaker begins in spring, the growth year of the otolith increment spans two calendar years. For clarity and conciseness in reporting the results, we defined the calendar year in which the increment began to form—specifically, the first calendar year—as the “Year” corresponding to that increment. Specifically, the marginal increments, which did not represent a complete year of growth, were excluded from further analysis to ensure accuracy. Additionally, given the observed spatial separation in the distribution between juvenile and adult small yellow croakers [64], as well as the ontogenetic changes in growth characteristics [65,66], it is possible that the key factors influencing growth may differ during the juvenile and adult stages. Consequently, the increments corresponding to the first year after birth of each individual were separately identified and extracted from the overall increment data (termed “Increment”). However, these first-year increments were still included in the analysis and were considered as an intrinsic factor (termed “FI”) to explore the potential relationship between the growth conditions during the juvenile stage and subsequent growth in the adult stage. Ultimately, measurements of 1778 increments, ranging from age 2 to 5 and covering the growth year from 2015 to 2020, were included in the analysis, as detailed in Figure 1b.
2.3. Environmental Data
The small yellow croaker is a migratory demersal fish species. Figure 1a depicts the migration routes of different stocks. In spring, these stocks disperse to coastal spawning grounds and subsequently move to deeper nearby waters for feeding and growth; by autumn, they migrate to overwintering grounds in the central and southern Yellow Sea and the northern East China Sea [67,68]. Given the extensive migratory range of the small yellow croaker throughout the year, this study calculated average sea bottom temperature during the seasons: May to August (warm season) and November to February (cold season). These periods align with when the stocks are mainly concentrated in spawning and overwintering grounds. To align with the years covered by all the otolith increments and to consider the potential lag effect of temperature, monthly temperature-at-depth data from May 2014 to February 2021 were derived from the product published by the Copernicus Marine Service (Product: Multi Observation Global Ocean 3D Temperature Salinity Height Geostrophic Current and MLD). Based on the depth distribution within the study area (see Figure S1), this study extracted the temperature at the maximum depth level recorded within each 0.25° × 0.25° grid cell, referred to as the sea bottom temperature (SBT).
The Southern Oscillation Index (SOI) was incorporated in the research to explore the impact of large-scale climate events on the growth of the small yellow croaker. Considering the potential lag effect of 1–2 years, monthly SOI data (2013–2020), standardized with a base period of 1981–2010, were obtained from the National Oceanographic Atmospheric Administration (NOAA) website (https://www.cpc.ncep.noaa.gov/data/indices/soi, accessed on 7 January 2022). Positive values of the SOI are typically associated with La Niña events, while negative values indicate El Niño events. To further accurately identify the occurrences of El Niño and La Niña events during the study period, the Oceanic Niño Index (ONI) data were obtained from NOAA (https://www.cpc.ncep.noaa.gov/data/indices/oni.ascii.txt, accessed on 20 March 2024). The ONI is the 3-month running mean of sea surface temperature anomalies within the Niño 3.4 region, which spans the central–eastern equatorial Pacific Ocean, demarcated by 5° N to 5° S and 170° W to 120° W. An El Niño (La Niña) event is identified by five consecutive seasonal ONIs above (below) the threshold of +0.5 °C (−0.5 °C).
The annual catch data for small yellow croakers, from 2014 to 2020, were obtained from the China Fishery Statistical Yearbooks (2015–2021). The yearbooks provide detailed records of annual marine catch for small yellow croakers by each coastal province/region and the total marine catch, including all species, within the Bohai Sea, Yellow Sea, East China Sea, and South China Sea. To estimate the annual catch of small yellow croakers specifically in the Yellow Sea and the East China Sea, this study calculated the proportion of total catch by each province/region attributed to either sea area (Figure S2) and applied these proportions to the known provincial catch of small yellow croakers (see details in Appendix A). Based on the correlation analysis between catch data and fishing vessel power data (Figure S3), the present study considered catch data as an effective indicator of the fishing pressure (FP) exerted on the stocks of small yellow croaker. However, due to the spatial resolution limitations of the available data, it was unfeasible to obtain the FP at a finer scale, such as for the northern, central, and southern regions of the Yellow Sea.
2.4. Otolith Radius–Body Length Relationship
To investigate the linear relationship between standard body length (SL) and otolith radius (OR) and explore potential regional differences in this relationship, five simple linear regression models were fitted individually using area-specific datasets as well as a dataset aggregated across the four areas. Initially, the linear relationship in each area was assessed through separate models structured as follows:
where β0 is the intercept, β1 is the slope coefficient, and ε denotes the error term. Subsequently, an interaction term between OR and Area was introduced in the aggregated model to assess potential variations in this relationship across different areas:
where , , and are dummy variables representing the first three levels of Area, , , and are the coefficients for the main effects of Areas 1, 2, and 3, and , , and are the coefficients for the interaction effects between OR and each of Areas 1, 2, and 3. A subsequent analysis of variance (ANOVA) was employed to test for significant differences in the regression coefficients across the areas.
2.5. Mixed-Effects Modeling
The present study followed the mixed-effects modeling framework [69] to reconstruct the growth patterns and to investigate intrinsic and extrinsic sources of growth variation. The final model consisted of three components: random effects, intrinsic fixed effects, and extrinsic fixed effects. The optimal structure for each component was obtained sequentially through a model selection process. All the variables used in the model selection are presented in Table 1. The most complex model can be represented by:
where is the annual otolith growth for the fish at age from area , is the population average annual growth intercept, and are the random extrinsic effect and the random slope of age for area at year , is the random intrinsic fish effect ( = 1, …, 834), is the random slope of age for fish , describes the age-dependent ( = 2, …, 5) decline in growth specific to each area ( = 1, 2, 3, 4), and denotes additional fixed effects (e.g., AAC, FI, SBT, SOI, and FP).

Table 1.
Description of variables used in the mixed-effects modeling.
All modeling was conducted using the statistical program R 4.1.2 (R Development Core Team 2021). The packages lme4, AICcmodavg, and effects were used for selecting the optimal linear mixed-effects model, and the climwin package was used to identify the optimal time windows for environmental variables. Before modeling, all the increment measurements, age at increment formation (Age), and age at capture (AAC) were log-transformed to linearize the relationship and meet model assumptions. Additionally, all the intrinsic and extrinsic factors were mean-centered to facilitate model convergence and interpretation of random slopes and interaction terms.
2.5.1. Intrinsic Effect Selection
To accommodate inherent data properties, this study initially optimized the random-effect structure. Random intercepts for FishID and Year were included in models to account for the fact that increments from the same fish individual/growth year were expected to be more similar. This intra-individual similarity was attributed to individual-specific growth rates and potential measurement errors, whereas temporal similarity was associated with shared environmental conditions. The introduction of interaction terms “Area” with the Year random intercept was to further account for the environmental variations across different regions. Based on the simplest random-effect structure, (1|FishID) + (1|Area:Year), random Age slopes for FishID or/and Year were additionally incorporated in models, aiming to investigate differences in age-dependent growth among individuals and years. Different random-effect combinations were fitted with the maximal intrinsic fixed structure (see detail in Section 2.5.2) using restricted maximum likelihood (REML). Model comparisons were conducted using Akaike’s information criterion corrected for small sample sizes (AICc) [70].
For the selection of the intrinsic fixed-effect structure, a series of models of increasing complexity were fitted with the previously selected random-effect structure using maximum likelihood (ML). The most basic model hypothesized a log-linear relationship between annual growth and age, with subsequent models introducing additional complexity by incorporating AAC and FI. To further investigate regional differences in these intrinsic effects on growth, interaction terms with Area were incorporated in the modeling, and the most comprehensive structure was Age × Area + AAC × Area + FI × Area. The optimal model, indicated by the lowest AICc value, was subsequently refitted using REML to yield unbiased estimates of parameters.
Using the optimal intrinsic effect model, the best linear unbiased predictor (BLUP) for the area-specific Year random effects was extracted to visualize the interannual variation in fish growth. This area-specific random intercept for Year, showing higher or lower growth than the average for each combination of Area and Year, reflected pooled extrinsic sources of variation after accounting for the intrinsic effects. Moreover, several models were compared to identify the best one for evaluating average growth differences among the four stocks. These models differed in their fixed-effect structures, ranging from Age exclusively, a combination of Age and Area, to the interaction between Age and Area. Meanwhile, the term Area was excluded from the random effect structure. For comparison, the NECS stock was set as the reference level, and the lmerTest package provided p-values for the other three stocks with a Type III ANOVA with Satterthwaite degrees of freedom approximation.
2.5.2. Extrinsic Effect Selection
In further modeling, the impact of fishery activity and environmental variation on the annual growth of individuals in four stocks was assessed by including additional extrinsic variables to the best intrinsic model structure. There were two sets of models: one that included SOI as a large-scale environmental driver and another that included a more regionalized environmental driver (i.e., SBT). In the SBT model sets, SBTwarm and SBTcold were added separately, and a potential one-year lag was also considered. Additionally, to explore the relative importance of these spatial and temporal temperature components, the analysis incorporated the area-specific average SBT (AvSBTw and AvSBTc, see details in Table 1) as an addition or interaction term.
For large-scale models, to explore the potential lag effect of ENSO on small yellow croaker, a sliding window analysis was performed on SOI using the R package “climwin” prior to incorporating the SOI into the intrinsic models. By examining a broad array of competing hypotheses, this technique identifies the period in which the climate variable of interest most effectively explains the observed changes in measured biological traits [71]. To assess competing models’ performance, the previously established intrinsic model was set as a baseline. Subsequently, a list of candidate models was compiled by identifying all competing hypotheses, encompassing different time windows of the analyzed variables. Given the time resolution of the SOI data, the minimum unit for the analysis window was set to one month. Within the 36 months preceding the end month of the growth year, namely, April, every possible combination of window start times and durations was considered. The mean values of SOI within these windows were incorporated into the models, assuming a linear relationship between SOI and growth. In the final step, all models were compared to identify the optimal SOI signal. An additional randomization test was performed to quantify the likelihood of obtaining the AICc of the best model by chance. Then, the average SOI during the critical time window was incorporated into the mixed-effects modeling process.
After testing the potential lag effect of the FP, the FP was included in both model sets to test for interactions between these fishing and environmental drivers. An interaction term with Area for all extrinsic variables was also incorporated so that growth responses could be conditional on areas. Candidate models were fitted with ML and compared using AICc. The optimal extrinsic model for each set was then reanalyzed with REML to obtain unbiased estimates of parameters.
3. Results
3.1. Spatial Variation in Otolith Radius–Body Length Relationship
The present study confirmed a significant positive correlation between standard body length and otolith radius across the four stocks of small yellow croaker (Figure 3). A further statistical analysis revealed significant differences in the slope coefficients among these stocks (p < 0.001). Notably, compared to the three stocks in the Yellow Sea, the stock from the northern East China Sea exhibited the most positive relationship between standard body length and otolith radius. This difference indicates that for the NECS stock, each unit increase in OR corresponds to more considerable somatic growth than that observed in the other stocks.
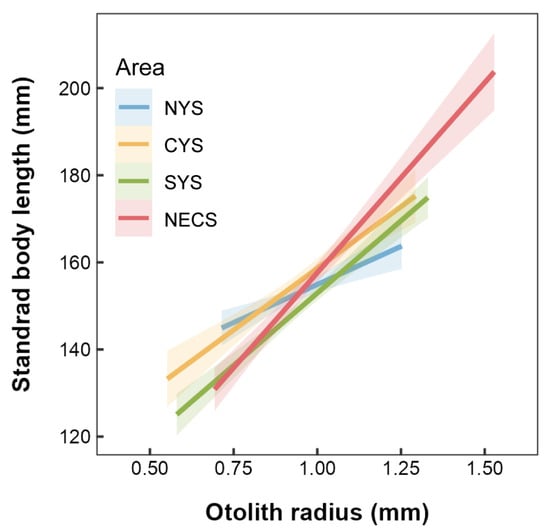
Figure 3.
Linear relationships between standard body length and otolith radius for L. polyactis stocks sampled from the northern Yellow Sea (NYS), the central Yellow Sea (CYS), the southern Yellow Sea (SYS), and the northern East China Sea (NECS). The shaded areas denote the 95% confidence interval.
3.2. Model-Derived Otolith Growth Variation
In this study, otolith increments aged 2–5 generated a biochronology covering the period from 2015 to 2020 for each stock. As predicted by BLUPs, the growth patterns indicated an overall increase in annual otolith growth of individuals, except for a decline observed between 2015 and 2016 in both the CYS and SYS stocks (Figure 4a). As for average annual otolith growth on the stock level, the NECS stock showed significant differences compared to the three stocks in the Yellow Sea, while no significant difference was observed among the latter three stocks (Figure 4b). Specifically, the individuals of the NECS stock exhibited the largest annual otolith growth, with those from the NYS, CYS, and SYS stocks being lower by 6.09%, 4.62%, and 4.91%, respectively.
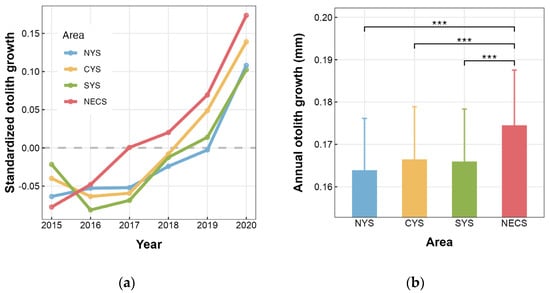
Figure 4.
Spatial variation in otolith growth of L. polyactis sampled from the northern Yellow Sea (NYS), the central Yellow Sea (CYS), the southern Yellow Sea (SYS), and the northern East China Sea (NECS). (a) Annual otolith growth patterns predicted by area-specific Year random effect conditional modes (BLUPs). The gray dashed line indicates that the data were normalized in such a way that the average growth rate across the entire chronology was set to zero. (b) Annual otolith growth predicted by Area effect. *** indicates p < 0.001. Vertical lines in (b) denote the 95% confidence interval (CI).
3.3. Optimal Intrinsic-Effect Structure
The best-supported random-effect structure was the most complex one, including random Age slopes for individual fish and each “Area–Year” combination (Table 2a). With this selected random-effect structure, incorporating FI into the baseline “Age” model significantly improved the model performance, while the AAC term was excluded (Table 2b). Age was identified as the primary factor influencing otolith growth, accounting for a substantial portion of the variance (63.2%, as indicated by the conditional R2). The significant FI × Area interaction suggested that FI also had a great impact on the growth of the small yellow croaker during its subsequent adult stage, with this effect exhibiting significant spatial variation.
Table 2.
Model selection results for (a) random effects and (b) fixed intrinsic effects of L. polyactis otolith growth.
3.4. Optimal Extrinsic-Effect Structure
The analysis of sea bottom temperature during the warm and cold seasons from 2014 to 2020 revealed an overall upward trend in the SBT of spawning and overwintering grounds for four stocks of small yellow croaker (Figure 5c). During the warm season, the average sea bottom temperature (SBT) at spawning grounds in the southern Yellow Sea and the northern East China Sea was relatively high, reaching 20.32 °C and 21.05 °C, respectively (Figure 5a). In contrast, the spawning grounds in the central and northern Yellow Sea exhibited lower average SBT, at only 10.20 °C and 10.63 °C, respectively (Figure 5a). In the cold season, the NECS stock experienced the highest average SBT in its overwintering ground, at 18.39 °C (Figure 5b). The average SBT of the other three overwintering grounds decreased with increasing latitude, averaging 14.38 °C, 8.77 °C, and 8.69 °C, respectively (Figure 5b). Incorporating the SBT from both the warm and previous cold seasons individually into the optimal intrinsic model resulted in an improved fit for each model (Table 3). Specifically, among the extrinsic models that exclusively considered SBT, the best-supported model was the one that included the interaction between SBTwarm and Area (Table S2a). Following closely was the model that incorporated the interaction between the SBT during the overwintering period and the average temperature, with the difference in AICc values between these two models being less than two (Table 3).

Figure 5.
Spatio-temporal variation in sea bottom temperature (SBT) in study area during spawning season and overwintering season. (a) Average SBT distribution during warm season (May to Aug). (b) Average SBT distribution during cold season (Nov to Feb). (c) Inter-annual variations in the SBT of the spawning grounds and overwintering grounds for L. polyactis stocks in the northern Yellow Sea (NYS), the central Yellow Sea (CYS), the southern Yellow Sea (SYS), and the northern East China Sea (NECS).
Table 3.
Model selection results for extrinsic effects of L. polyactis otolith growth.
As the SOI and ONI indicated, two El Niño events occurred during the study period: 2014–2016 and 2018–2019 (Figure 6a). The sliding window analysis revealed that the SOI in December had the most significant impact on the growth of the small yellow croaker, with a lag effect of 17 months (Figure 6b). Randomization test indicated that the likelihood of obtaining this result by chance was p < 0.001. Incorporating the SOI signal into the mixed-effects modeling process further validated improved model performance compared with the optimal intrinsic model (Table 3).

Figure 6.
(a) Monthly standardized SOI values from 2013 to 2021, with shaded regions indicating warm (red) and cold (blue) phases as defined by ONI. (b) Results of optimal time window identification for SOI. ΔAICc (indicated by the gradient) are the differences in AICc between the alternative models and base model.
From 2014 to 2020, the fishing pressure on the stocks of small yellow croaker in the Yellow Sea exhibited a declining trend, while an upward trend was observed in the East China Sea (Figure 7). The model that included the previous year’s FP, with an interaction term Area, outperformed both the optimal intrinsic model and the one incorporating the current year’s FP, as indicated by a lower AICc value (Table 3). Subsequently, when the FP of the preceding year was integrated into the selected optimal SBT-only and SOI-only models, it was found that the models with the interaction between SBT/SOI and FP exhibited superior performance (Table 3).
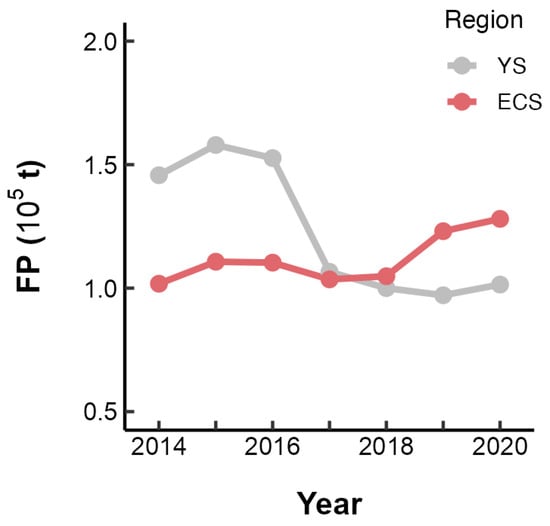
Figure 7.
Annual variation in the fishing pressure (FP) on L. polyactis in the East China Sea (ECS) and Yellow Sea (YS).
4. Discussion
Using an otolith-based approach, the present study reconstructed the growth histories of four adult small yellow croaker stocks from 2015 to 2020. Through a mixed-effects modeling framework, this study initially accounted for the age-dependent growth decline and the positive effect of juvenile growth conditions on the adult stage. A subsequent analysis identified significant effects of environmental fluctuations at both the local scale (i.e., sea bottom temperature) and broader scale (i.e., Southern Oscillation Index), in addition to the impact of fishing activities. The results suggested that fishing pressure might have negatively impacted the environmental adaptability of the small yellow croaker. Moreover, heterogeneity in growth plasticity across stocks was also considered in the analysis. The East China Sea stock seemed to exhibit higher growth rates than those of the three stocks in the Yellow Sea, with pronounced differences in their response magnitudes to various influencing factors.
4.1. Sources of Growth Acceleration
The growth acceleration indicated by otolith chronologies aligns with findings from previous studies, which primarily analyzed temporal variations in von Bertalanffy growth function parameters within the same stock. Specifically, since the 1960s, a continuous increase was observed in the growth rate parameter k for stocks in the Bohai Sea [11], the Yellow Sea [6,7], and the East China Sea [10,14]. However, the otolith increments used in this study, which reflect annual growth in body size, revealed the current growth conditions and could be associated with current environmental conditions [21]. This approach allowed us to capture the fluctuations in growth throughout an individual fish’s lifetime, without being masked by the typical size-at-age data [27].
The results from mixed-effects modeling indicated a positive correlation between the accelerated growth and SBT variation within their habitats (Figure 8a). Importantly, the present study suggests that there might be critical periods when the SBT significantly impacted the annual growth of the small yellow croaker. The small yellow croaker annually migrated between the spawning and overwintering grounds [68]. Previous studies suggested that the abundant food supply at the spawning grounds facilitated fish’s growth, whereas growth nearly ceased during the overwintering period as feeding stopped [72,73]. However, the results revealed that the overwintering temperature might have a significant impact on the growth in the following year, an effect almost as important as the spawning temperature. It was speculated that the importance of winter temperature was related to the allocation of energy within fish. Specifically, at the overwintering grounds, fish faced challenges such as low temperature and reduced food availability. Instead of directing energy toward immediate growth, the fish relied on the reserves accumulated during the pre-winter feeding period to sustain vital life functions [74,75]. Higher winter temperature could reduce the energy loss associated with basal metabolism [76], thus conserving more energy for reproduction and growth in the next year.
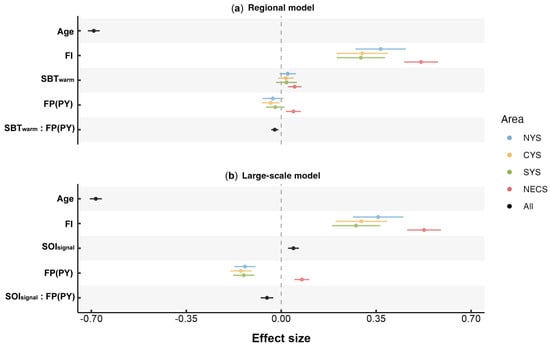
Figure 8.
Parameter estimates (±95% confidence intervals) of fixed effects for the optimal (a) regional and (b) large-scale model. “:” denotes the interaction between two factors, excluding the main effects of each individual factor.
On a broader climatic scale, this study identified that there might be a significant positive effect of winter SOI on the growth of the small yellow croaker (Figure 8b), with the effect exhibiting a lag of 1 to 2 years. The SOI’s negative and positive values correspond to the pressure variations in the equatorial Pacific during El Niño and La Niña events, respectively. The climate processes, including El Niño–Southern Oscillation (ENSO), were generally most active during winter [77]. The mechanisms through which the ENSO affects the growth of the small yellow croaker are multifaceted. Firstly, elevated temperature in the Northwest Pacific during La Niña years may foster favorable conditions for fish growth. Secondly, previous research demonstrated that ENSO events significantly impacted the population resources of the small yellow croaker [78], suggesting the potential for density-dependent growth that is influenced by the ENSO. Thirdly, the ENSO could impact food resources available to small yellow croakers, such as crustaceans [79], thus indirectly affecting the stability of their food chains. The adverse impacts of El Niño events, which may increase in frequency and intensity in the future [80], on the growth conditions of the small yellow croaker and other marine species [34,81], merit an in-depth investigation into their underlying mechanisms.
The variation in fishing pressure was identified as another potentially significant factor contributing to the improved growth conditions of small yellow croakers. Prior studies showed an acceleration in the early growth rate of small yellow croakers [10] to the extent that a substantial number of individuals born within that current year achieved the minimum size for fishing trawl following the restricted fishing season [3]. Consequently, the improved early growth resulted in a composition of captured fish where one-year-old individuals comprised over 90% of the population [9,12]. Thus, the fishing pressure in this study was considered as the removal of individuals approximately at the age of one year. Current theories generally suggest two mechanisms through which fishing pressure impacts the biological characteristics of fish: the first suggests that intensified fishing activity reduces the population density, consequently diminishing competition for food resources and theoretically supporting individual growth. This theory may account for the positive effect of FP on the otolith growth of NECS stock (Figure 8). The second is that current fishing practices selectively capture larger individuals, leaving behind smaller individuals and potentially removing genes associated with rapid growth [82,83]. Although the model selection excluded potential biases related to growth-rate-based selectivity among adult small yellow croakers, the fishing selectivity for juveniles under one-year-old was not explored. Consequently, a possible explanation for the negative impact of increased fishing pressure on the stocks in the Yellow Sea (Figure 8) is that under increased fishing pressure, the disproportionately high removal of faster-growing individuals born within a current year may suppress the overall growth rate of the remaining population. The stock in the East China Sea may also exhibit fishing selectivity; however, it was likely obscured by compensatory growth promoted by reduced competition for resources [84,85].
4.2. Synergetic Effect of Fishing and Environment on Growth
In this study, a higher temperature in specific areas and positive SOI values associated with La Niña events were considered as favorable conditions for the growth of the small yellow croaker. However, further analysis revealed that these growth advantages were constrained under higher fishing pressure (Figure 9). The present study suggest that the positive impact of temperature changes on the growth of the small yellow croaker might diminish with increased fishing pressure. On the contrary, in species such as pollock and hoki, reduced population density due to higher fishing pressures was considered to facilitate the expression of environmental adaptability [30,33]. It was speculated that this difference in interaction effects might be attributed to the dominant role of fishing selectivity towards younger small yellow croaker individuals under fishing pressure, and well-growing young individuals, who might also be the most adaptable to temperature changes, were removed from the population. Consequently, the remaining population might exhibit poorer adaptability to temperature changes. In recent years, the catch of small yellow croakers in the East China Sea maintained a relative stability, while a notable decrease was observed in the Yellow Sea. Based on the findings here related only to temperature, it is essential for future studies to include a wider range of environmental variables to facilitate a comprehensive analysis of environmental adaptability. This analysis would allow us to assess whether decreasing fishing pressure in the future might contribute to fostering an improved adaptive response to environmental conditions for the small yellow croaker.
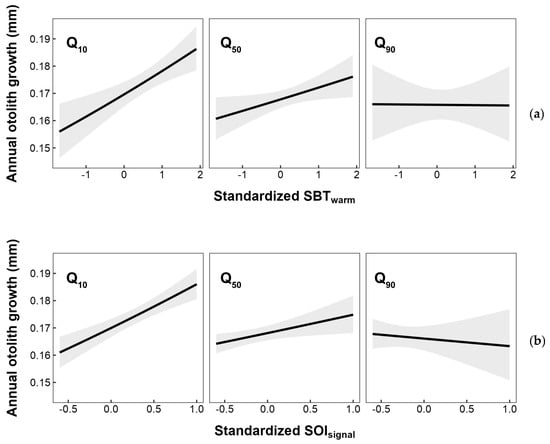
Figure 9.
Annual otolith growth response to interaction between the previous year’s FP and (a) sea bottom temperature during warm season and (b) SOI signal selected by a sliding window analysis. Q10, Q50, and Q90 represent the 10th, 50th, and 90th percentiles of the observed annual FP on L. polyactis from 2014 to 2020. Shaded areas denote the 95% CI.
In this study of the synergistic effects of environmental and fishing pressures, there are several limitations that need to be considered. Firstly, changes in feeding activities were also a crucial component influencing the biological responses of fish species, which included variations in the diet composition and feeding intensity. Denechaud [27] found that collapses in the biomass of capelin might be related to the decline in growth of Northeast Arctic cod. Temporal variations in density-dependent growth have been observed when there were significant changes in ecosystem conditions, especially when resources became scarce [86,87]. Moreover, the scarcity of key prey species might lead to shifting towards less preferred fish. For the small yellow croaker, previous study showed that the feeding habits of the southern Yellow Sea stock have undergone significant changes since the 1960s, switching from Engraulis japonicus to Euphausia pacifica [88], and the changes in diet composition significantly correlated with the temporal variations in the biological characteristics of the small yellow croaker [6,7]. Other studies also indicated that the diet composition of the small yellow croaker was influenced by factors such as offshore distances, water depths, and seasons [89,90]. Additionally, notable differences in diet composition were also found among different stocks of small yellow croaker. In addition to Decapoda and Euphausiacea, the dominant prey species for the central Yellow Sea stock included Thryssa kammalensis [91,92], while the southern Yellow Sea and northern East China Sea stocks also primarily feed on Benthosema pterotum and Decapterus maruadsi [93]. Moreover, there was a difference observed in the magnitude of variation in the trophic levels of small yellow croakers between the Yellow Sea and East China Sea [6,8,94]. The fluctuations in the biomass of prey populations across different marine areas may be influenced by environmental changes and fishing pressure. Therefore, including feeding dynamics is essential for further exploring the synergistic effects of fishing pressure and environmental changes on the small yellow croaker in future studies.
Secondly, since the growth data in this study were derived from the annual increment widths recorded in otoliths, it was challenging to accurately match the extrinsic conditions corresponding to the annual growth periods of fish. Although we identified the distribution of small yellow croakers through historical studies [62,63], the minor interannual variability in their distribution [2,95,96] remains a limitation when correlating growth data with environmental data. Additionally, the spatial resolution of the fishing pressure data limited the ability to analyze the effects at finer scales comparable to that of the SBT. It was assumed that the three stocks within the Yellow Sea were subjected to equivalent levels of fishing pressure. However, this assumption may not hold true, which could potentially, to some extent, impact the results. Furthermore, due to the prevalence of younger age classes [9,12], in the small yellow croaker population, the two-year sampling in this study resulted in an otolith chronology covering only six years. Future efforts will require a longer-term sampling plan to refine the understanding of combined effects, especially over extended periods, which may help in providing a more comprehensive analysis of the regime shift of climate on the growth patterns of the small yellow croaker.
4.3. Differences in Growth Plasticity among Subpopulations
Spatial growth difference was observed between stocks in the Yellow Sea and the East China Sea in this study. The NECS stock was observed to exhibit higher annual otolith growth and a stronger linear relationship between otolith and body growth. This otolith-derived result indicated that the NECS stock seemed to experience faster somatic growth, consistent with previous studies [4,65]. Further analyses in this study revealed that there might be significant differences in the phenotypic response to environmental conditions (also known as reaction norms) between the stocks in the East China Sea and Yellow Sea (Figure 10b,c,e). These differences may account for the superior growth performance observed in the NECS stock. Firstly, the growth response of the NECS stock to sea bottom temperature during the spawning season was observed to be more pronounced (Figure 10c). The preferred temperature of the small yellow croaker was estimated to range between 9.4 and 24.2 °C [97], with the optimal range inferred to be 18.8–20.3 °C [98]. The proximity of SBTwarm in the East China Sea to the optimal range may give the NECS stock a certain advantage in thermal adaptability. Additionally, previous studies indicated that the habitat of the small yellow croaker in the East China Sea showed a trend of eastward movement and expansion into the open sea [36,88]. The movement suggests possible strong adaptability and implies the potential for the NECS stock to have developed an increased tolerance to temperature variations. In contrast, as an indicator of large-scale climate fluctuations, the SOI’s indirect effect typically manifests as relatively uniform changes over extensive areas, making it challenging to discern noticeable ecological or biological response differences in smaller regions. This difficulty might account for the inability to detect significant regional variations in the impact of SOI in this research (Table S2b, Figure 10d).
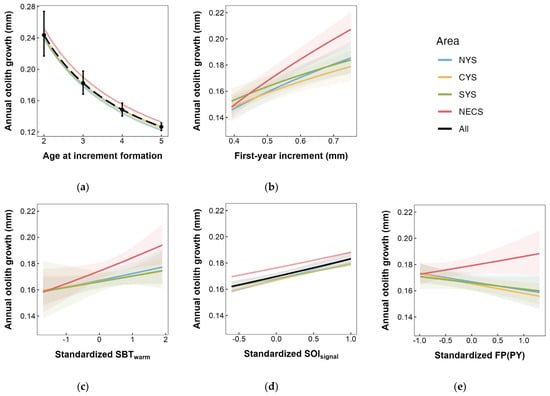
Figure 10.
Area-specific annual otolith growth response to (a) age, (b) otolith growth of the first year after birth, (c) SBT (sea bottom temperature) during warm season, (d) SOI (Southern Oscillation Index) signal selected by sliding window analysis, and (e) FP (fishing pressure) in previous year. Shaded areas denote the 95% CI.
The present study also incorporated the first-year growth rate of individuals as an intrinsic factor for analysis. The findings suggest that early-stage growth could positively influence subsequent growth during the adult stage, with this effect being particularly pronounced in the NECS Stock (Figure 10b). This might be one of the reasons for the superior growth conditions observed in this stock. This positive relationship may be seen as a “carry-over effect” [99,100], where individuals experiencing favorable environmental conditions in the early stages exhibit higher growth, resulting in larger body sizes, increased competitiveness, and higher survival rates. These advantages provide substantial support during critical transitional stages in their life cycle, further promoting growth performance in the adult phase. Given the catch was primarily composed of age-one fish [9,12], it is crucial to study the growth characteristics of the small yellow croaker during its early life history stages.
The observed differences in reaction norms between the Yellow Sea and East China Sea stocks may depend not only on environmental conditions but also on genetic differences. Although previous studies indicated no significant genetic differences between the small yellow croaker stocks in the East China Sea and the Yellow Sea [55,56,101,102,103], the connectivity during the juvenile phase [104], which leads to frequent gene flow, may render the detection of variation in neutral genetic markers among regional stocks challenging [35]. Therefore, it cannot be ruled out that there may be adaptive genetic differences between the two subpopulations. Although age-dependent growth constituted a substantial portion (Figure 8) and this effect showed no variation among stocks, the significant impact of extrinsic factors on the growth of the small yellow croaker cannot be disregarded. Consequently, given the spatial variations in partially gene-controlled responses to environmental changes, the present study recommends that the Yellow Sea and the East China Sea stocks of small yellow croaker be regarded as distinct subpopulations and managed separately in fisheries.
5. Conclusions
The present study reconstructed the growth histories of four small yellow croaker stocks over the period from 2015 to 2020. An accelerated trend was observed in annual otolith growth across all studied stocks, which, to some extent, reflects the somatic growth condition of the small yellow croaker in recent years. Moreover, despite some limitations in matching extrinsic factors with annual growth data, this study focused on temperature and preliminarily detected the negative impacts of fishing pressure on the environmental adaptability of the small yellow croaker. Given the limited factors analyzed in this study, future investigations should incorporate a wider range of environmental factors, and even population factors (e.g., the population size of preys), to conduct a more comprehensive analysis of the combined effects between environmental factors and fishing pressures. Additionally, this study considered the spatial heterogeneity among different stocks. The analysis revealed that the stock from the East China Sea could exhibit superior growth performance compared to the three stocks in the Yellow Sea, with different responses to the investigated factors. These differences between the two potential subpopulations provide crucial supplementary information for the fisheries’ management of metapopulations, aiding in developing more precise and effective management strategies.
Supplementary Materials
The following supporting information can be downloaded at: https://www.mdpi.com/article/10.3390/fishes9090367/s1, Figure S1: Depth distribution in the study sea area; Figure S2: Proportional distribution of marine catch by sea area in annual total marine catch of 11 coastal provinces/regions in China; Figure S3: Scatter plot illustrating the positive correlation between the total power of marine fishing vessels and the catch of L. polyactis; Table S1: Detailed information on each sample of small yellow croaker. Table S2: Complete results of model selection for extrinsic effects of L. polyactis’s otolith growth.
Author Contributions
Conceptualization, Z.Y., Y.L. and C.Z.; methodology, Z.Y. and Y.X.; software, Z.Y. and Y.X.; validation, Y.X.; formal analysis, Z.Y. and Y.X.; investigation, C.Z., Z.Y., R.Z. and D.L.; resources, Y.L.; data curation, Z.Y., R.Z. and D.L.; writing—original draft preparation, Z.Y. and Y.X.; writing—review and editing, Y.L. and C.Z.; visualization, Z.Y. and Y.X.; supervision, Y.L.; project administration, R.Z.; funding acquisition, Y.L. All authors have read and agreed to the published version of the manuscript.
Funding
This study was supported by the National Key R&D Program of China (2018YFD0900902) and “R&D and Industrialization Project of Key Technologies for Smart Detection System of Digital Marine Fisheries Satellite” by China’s Ministry of Education (202482230112900600).
Institutional Review Board Statement
Our study subject was a commercial species in the fisheries of China and only dead specimens from the surveys were used in the study. The study was conducted based on regulations for animal experiments at Ocean University of China (OUC). The Academic Committee of OUC determined in the preliminary review that there were no animal ethical issues involved in this study and no further submission to the specialized ethics committee of OUC for approval was required.
Data Availability Statement
The raw data supporting the conclusions of this article will be made available by the corresponding author on request.
Acknowledgments
The temperature data and SOI data were obtained from Copernicus and NOAA, respectively. We extend our gratitude to S. Kim and Z. Ye for their valuable advice. We thank the fishermen and researchers who worked on the sampling. Additionally, we express our appreciation to the anonymous reviewers and the editor of the journal for their invaluable feedback.
Conflicts of Interest
The authors declare no conflicts of interest.
Appendix A
To estimate the annual catch of small yellow croaker specifically in the Yellow Sea and the East China Sea (Cik), based on data from the China Fishery Statistical Yearbook, the proportion of the total catch by j province/region in year i attributed to either sea areas was first calculated:
where Sijk is the catch of all species by province/region j during year i in sea area k (either the Yellow Sea or the East China Sea); Tij is the total annual catch of all species by province/region j across all sea areas, including the Bohai Sea, the Yellow Sea, the East China Sea, and the South China Sea.
Assuming proportional distributions between total catch and the species-specific catch in the designated sea areas, the estimated catch of the small yellow croaker in the Yellow Sea or East China Sea (Cik) were assessed by distributing provincial annual catch of the small yellow croaker (Cij) according to the proportions Pijk:
References
- Bureau of Fishery of Ministry of Agriculture of China. China Fishery Statistical Yearbook, 2011th–2023rd ed.; China Agriculture Press: Beijing, China, 2023. [Google Scholar]
- Zhang, R.; Liu, Y.; Tian, H.; Liu, S.; Zu, K.; Xia, X. Impact of Climate Change on Long-Term Variations of Small Yellow Croaker (Larimichthys polyactis) Winter Fishing Grounds. Front. Mar. Sci. 2022, 9, 915765. [Google Scholar] [CrossRef]
- Cheng, J.; Lin, L.; Ling, J.; Li, J.; Ding, F. Effects of Summer Close Season and Rational Utilization on Redlip Croaker (Larimichthys polyactis Bleeker) Resource in the East China Sea Region. J. Fish. Sci. China 2004, 11, 554–560. [Google Scholar]
- Lin, L. Study on the Fishery Biology and Management Strategy of Larimichthys polyactis in the Southern Yellow Sea and the East China Sea. Ph.D. Thesis, Ocean University of China, Qingdao, China, 2009. [Google Scholar]
- Zhu, X.; Fang, Y.; Yan, L.; Zhang, G.; Huang, L. The Ecological Strategy Evolution of Marine Fishes under High Intensity Fishing Environment. Bull. Sci. Technol. 2009, 25, 51–55. [Google Scholar]
- Shan, X.; Li, X.; Yang, T.; Sharifuzzaman, S.M.; Zhang, G.; Jin, X.; Dai, F. Biological Responses of Small Yellow Croaker (Larimichthys polyactis) to Multiple Stressors: A Case Study in the Yellow Sea, China. Acta Oceanol. Sin. 2017, 36, 39–47. [Google Scholar] [CrossRef]
- Zhang, G.; Li, X.; Jin, X.; Zhu, J.; Dai, F. Changes of Biological Characteristics of Small Yellow Croaker (Larimichthys polyactis) in the Central and Southern Yellow Sea. Acta Ecol. Sin. 2010, 30, 6854–6861. [Google Scholar]
- Lin, L.; Jiang, Y.; Yan, L.; Gao, T.; Wang, J. Study on the Distribution Characteristics and Fecundity of Spawning Stock of Larimichthys polyactis in the Southern Yellow Sea and the East China Sea. J. Shanghai Ocean Univ. 2009, 18, 453–459. [Google Scholar]
- Shui, B. Study on the Age and Growth of Pseudosciaena polyactis in the South of the Yellow Sea and the North of the East China Sea. J. Zhejiang Ocean Univ. Nat. Sci. 2003, 22, 16–20. [Google Scholar]
- Cheng, J.; Ren, Y.; Ling, J. Analysis of Population Biology of Small Yellow Croaker Pseudosciaena polyactis in the East China Sea Region. J. Fish. Sci. China 2004, 11, 333–338. [Google Scholar]
- Guo, X.; Jin, X.; Dai, F. Growth Variations of Small Yellow Croaker (Pseudosciaena polyactis Bleeker) in the Bohai Sea. J. Fish. Sci. China 2006, 13, 243–249. [Google Scholar]
- Yan, L.; Hu, F.; Ling, J.; Li, S. Study on Age and Growth of Larimichthys polyactis in the East China Sea. J. Ocean Univ. China Nat. Sci. Ed. 2006, 36, 95–100. [Google Scholar] [CrossRef]
- Yan, L.; Liu, Z.; Zhang, H.; Ling, J.; Yuan, X.; Li, S. On the Evolution of Biological Characteristics and Resources of Small Yellow Croaker. Mar. Fish. 2014, 36, 481–488. [Google Scholar] [CrossRef]
- Gao, C.; Ma, Q.; Tian, S.; Dai, X.; Kindong, R.; Gou, X.; Lan, J. Growth, Mortality and Yield per Recruitment of Small Yellow Croaker in Offshore Waters of Southern Zhejiang. J. Fish. Sci. China 2019, 26, 925–937. [Google Scholar] [CrossRef]
- Audzijonyte, A.; Kuparinen, A.; Gorton, R.; Fulton, E.A. Ecological Consequences of Body Size Decline in Harvested Fish Species: Positive Feedback Loops in Trophic Interactions Amplify Human Impact. Biol. Lett. 2013, 9, 20121103. [Google Scholar] [CrossRef] [PubMed]
- Hixon, M.A.; Johnson, D.W.; Sogard, S.M. BOFFFFs: On the Importance of Conserving Old-Growth Age Structure in Fishery Populations. ICES J. Mar. Sci. 2014, 71, 2171–2185. [Google Scholar] [CrossRef]
- Barneche, D.R.; Robertson, D.R.; White, C.R.; Marshall, D.J. Fish Reproductive-Energy Output Increases Disproportionately with Body Size. Science 2018, 360, 642–645. [Google Scholar] [CrossRef]
- Lorenzen, K. The Relationship between Body Weight and Natural Mortality in Juvenile and Adult Fish: A Comparison of Natural Ecosystems and Aquaculture. J. Fish Biol. 1996, 49, 627–642. [Google Scholar] [CrossRef]
- Gislason, H.; Daan, N.; Rice, J.C.; Pope, J.G. Size, Growth, Temperature and the Natural Mortality of Marine Fish. Fish Fish. 2010, 11, 149–158. [Google Scholar] [CrossRef]
- Graeb, B.D.S.; Dettmers, J.M.; Wahl, D.H.; Cáceres, C.E. Fish Size and Prey Availability Affect Growth, Survival, Prey Selection, and Foraging Behavior of Larval Yellow Perch. Trans. Am. Fish. Soc. 2004, 133, 504–514. [Google Scholar] [CrossRef]
- Lorenzen, K. Toward a New Paradigm for Growth Modeling in Fisheries Stock Assessments: Embracing Plasticity and Its Consequences. Fish. Res. 2016, 180, 4–22. [Google Scholar] [CrossRef]
- Barrow, J.; Ford, J.; Day, R.; Morrongiello, J. Environmental Drivers of Growth and Predicted Effects of Climate Change on a Commercially Important Fish, Platycephalus laevigatus. Mar. Ecol. Prog. Ser. 2018, 598, 201–212. [Google Scholar] [CrossRef]
- Neves, J.; Giacomello, E.; Menezes, G.M.; Fontes, J.; Tanner, S.E. Temperature-Driven Growth Variation in a Deep-Sea Fish: The Case of Pagellus bogaraveo (Brünnich, 1768) in the Azores Archipelago. Front. Mar. Sci. 2021, 8, 703820. [Google Scholar] [CrossRef]
- Moyano, G.; Plaza, G.; Cerna, F.; Muñoz, A.A. Local and Global Environmental Drivers of Growth Chronologies in a Demersal Fish in the South-Eastern Pacific Ocean. Ecol. Indic. 2021, 131, 108151. [Google Scholar] [CrossRef]
- Smoliński, S. Sclerochronological Approach for the Identification of Herring Growth Drivers in the Baltic Sea. Ecol. Indic. 2019, 101, 420–431. [Google Scholar] [CrossRef]
- Tanner, S.E.; Vieira, A.R.; Vasconcelos, R.P.; Dores, S.; Azevedo, M.; Cabral, H.N.; Morrongiello, J.R. Regional Climate, Primary Productivity and Fish Biomass Drive Growth Variation and Population Resilience in a Small Pelagic Fish. Ecol. Indic. 2019, 103, 530–541. [Google Scholar] [CrossRef]
- Denechaud, C.; Smoliński, S.; Geffen, A.J.; Godiksen, J.A.; Campana, S.E. A Century of Fish Growth in Relation to Climate Change, Population Dynamics and Exploitation. Glob. Chang. Biol. 2020, 26, 5661–5678. [Google Scholar] [CrossRef] [PubMed]
- Zhang, C.; Ye, Z. Inter-Annual Otolith Growth Pattern of Adult Small Yellow Croaker in the East China Sea and Its Response to Environmental Changes. Environ. Biol. Fishes 2021, 104, 1643–1653. [Google Scholar] [CrossRef]
- Sun, Y.; Xie, Q.; Lou, B. Effect of Temperature on Early Growth Stage in Little Yellow Croaker, Larimichthys polyactis. J. Zhejiang Ocean Univ. Nat. Sci. 2018, 37, 208–214. [Google Scholar]
- Morrongiello, J.R.; Horn, P.L.; Maolagáin, C.Ó.; Sutton, P.J.H. Synergistic Effects of Harvest and Climate Drive Synchronous Somatic Growth within Key New Zealand Fisheries. Glob. Chang. Biol. 2021, 27, 1470–1484. [Google Scholar] [CrossRef]
- Rogers, L.A.; Dougherty, A.B. Effects of Climate and Demography on Reproductive Phenology of a Harvested Marine Fish Population. Glob. Chang. Biol. 2019, 25, 708–720. [Google Scholar] [CrossRef]
- Morrongiello, J.R.; Sweetman, P.C.; Thresher, R.E. Fishing Constrains Phenotypic Responses of Marine Fish to Climate Variability. J. Anim. Ecol. 2019, 88, 1645–1656. [Google Scholar] [CrossRef]
- Ciannelli, L.; Chan, K.-S.; Bailey, K.M.; Stenseth, N.C. Nonadditive Effects of the Environment on the Survival of a Large Marine Fish Population. Ecology 2004, 85, 3418–3427. [Google Scholar] [CrossRef]
- Martino, J.C.; Fowler, A.J.; Doubleday, Z.A.; Grammer, G.L.; Gillanders, B.M. Using Otolith Chronologies to Understand Long-Term Trends and Extrinsic Drivers of Growth in Fisheries. Ecosphere 2019, 10, e02553. [Google Scholar] [CrossRef]
- Conover, D.O.; Clarke, L.M.; Munch, S.B.; Wagner, G.N. Spatial and Temporal Scales of Adaptive Divergence in Marine Fishes and the Implications for Conservation. J. Fish Biol. 2006, 69, 21–47. [Google Scholar] [CrossRef]
- Lin, L.; Cheng, J.; Jiang, Y.; Yuan, X.; Li, J.; Gao, T. Spatial Distribution and Environmental Characteristics of the Spawning Grounds of Small Yellow Croaker in the Southern Yellow Sea and the East China Sea. Acta Ecol. Sin. 2008, 28, 3485–3494. [Google Scholar]
- Lin, L.; Liu, Z.; Jiang, Y.; Huang, W.; Gao, T. Current Status of Small Yellow Croaker Resources in the Southern Yellow Sea and the East China Sea. Chin. J. Ocean. Limnol. 2011, 29, 547–555. [Google Scholar] [CrossRef]
- Ichikawa, H.; Beardsley, R.C. The Current System in the Yellow and East China Seas. J. Oceanogr. 2002, 58, 77–92. [Google Scholar] [CrossRef]
- Liu, Z.; Gan, J.; Hu, J.; Wu, H.; Cai, Z.; Deng, Y. Progress on Circulation Dynamics in the East China Sea and Southern Yellow Sea: Origination, Pathways, and Destinations of Shelf Currents. Prog. Oceanogr. 2021, 193, 102553. [Google Scholar] [CrossRef]
- Delcroix, T.; Murtugudde, R. Sea Surface Salinity Changes in the East China Sea during 1997–2001: Influence of the Yangtze River. J. Geophys. Res. Oceans 2002, 107, SRF 9-1–SRF 9-11. [Google Scholar] [CrossRef]
- Yuan, D.; Zhu, J.; Li, C.; Hu, D. Cross-Shelf Circulation in the Yellow and East China Seas Indicated by MODIS Satellite Observations. J. Mar. Syst. 2008, 70, 134–149. [Google Scholar] [CrossRef]
- Quan, Q.; Mao, X.; Yang, X.; Hu, Y.; Zhang, H.; Jiang, W. Seasonal Variations of Several Main Water Masses in the Southern Yellow Sea and East China Sea in 2011. J. Ocean Univ. China 2013, 12, 524–536. [Google Scholar] [CrossRef]
- Zhang, S.W.; Wang, Q.Y.; Lü, Y.; Cui, H.; Yuan, Y.L. Observation of the Seasonal Evolution of the Yellow Sea Cold Water Mass in 1996–1998. Cont. Shelf Res. 2008, 28, 442–457. [Google Scholar] [CrossRef]
- Park, S.; Chu, P.C.; Lee, J.-H. Interannual-to-Interdecadal Variability of the Yellow Sea Cold Water Mass in 1967–2008: Characteristics and Seasonal Forcings. J. Mar. Syst. 2011, 87, 177–193. [Google Scholar] [CrossRef]
- Li, A.; Yu, F.; Si, G.; Wei, C. Long-Term Temperature Variation of the Southern Yellow Sea Cold Water Mass from 1976 to 2006. Chin. J. Oceanol. Limnol. 2017, 35, 1032–1044. [Google Scholar] [CrossRef]
- Mask, A.C.; O’Brien, J.J.; Preller, R. Wind-Driven Effects on the Yellow Sea Warm Current. J. Geophys. Res. Oceans 1998, 103, 30713–30729. [Google Scholar] [CrossRef]
- Yu, F.; Zhang, Z.; Diao, X.; Guo, J. Observational Evidence of the Yellow Sea Warm Current. Chin. J. Oceanol. Limnol. 2010, 28, 677–683. [Google Scholar] [CrossRef]
- Chi, L.; Song, X.; Yuan, Y.; Zhou, P.; Cao, X.; Yu, Z. Distribution of Dissolved Oxygen in the Yellow Sea and East China Sea in Summer and Winter. Oceanol. Limnol. Sin. 2017, 48, 1337–1345. [Google Scholar]
- Li, W.; Wang, Y.; Wang, J.; Wei, H. Distributions of Water Masses and Hydrographic Structures in the Yellow Sea and East China Sea in Spring and Summer 2011. Oceanol. Limnol. Sin. 2012, 43, 615–623. [Google Scholar]
- Liu, X.; Yang, C.; Ye, J. The Primary Research of Annuli Characteristics and Formation Patterns of Scale and Otolith for Small Yellow Croaker in Northern Yellow Sea and Bohai Sea. In Proceedings of the Collection of Papers on Marine Fisheries Resources; China Agriculture Press: Beijing, China, 1964; pp. 136–148. [Google Scholar]
- Wang, Y.; Huang, J.; Tang, X.; Jin, X.; Sun, Y. Stable Isotopic Composition of Otoliths in Identification of Stock Structure of Small Yellow Croaker (Larimichthys polyactis) in China. Acta Oceanol. Sin. 2016, 35, 29–33. [Google Scholar] [CrossRef]
- Zhang, C.; Ye, Z.; Wan, R.; Ma, Q.; Li, Z. Investigating the Population Structure of Small Yellow Croaker (Larimichthys polyactis) Using Internal and External Features of Otoliths. Fish. Res. 2014, 153, 41–47. [Google Scholar] [CrossRef]
- Wang, Y. Fishery Resource; China Agricultural Press: Beijing, China, 1962. [Google Scholar]
- Xu, Z.; Chen, J. Population Division of Larimichthys polyactis in China Sea. Chin. J. Appl. Ecol. 2010, 21, 2856–2864. [Google Scholar] [CrossRef]
- Xiao, Y.; Zhang, Y.; Gao, T.; Yanagimoto, T.; Yabe, M.; Sakurai, Y. Genetic Diversity in the mtDNA Control Region and Population Structure in the Small Yellow Croaker Larimichthys polyactis. Environ. Biol. Fishes 2009, 85, 303–314. [Google Scholar] [CrossRef]
- Cheng, Q.; Chen, W.; Ma, L. Genetic Diversity and Population Structure of Small Yellow Croaker (Larimichthys polyactis) in the Yellow and East China Seas Based on Microsatellites. Aquat. Living Resour. 2019, 32, 16. [Google Scholar] [CrossRef]
- Campana, S.E. How Reliable Are Growth Back-Calculations Based on Otoliths? Can. J. Fish. Aquat. Sci. 1990, 47, 2219–2227. [Google Scholar] [CrossRef]
- Vigliola, L.; Meekan, M.G. The Back-Calculation of Fish Growth From Otoliths. In Tropical Fish Otoliths: Information for Assessment, Management and Ecology; Green, B.S., Mapstone, B.D., Carlos, G., Begg, G.A., Eds.; Springer: Dordrecht, The Netherlands, 2009; pp. 174–211. ISBN 978-1-4020-5775-5. [Google Scholar]
- Black, B.A.; Matta, M.E.; Helser, T.E.; Wilderbuer, T.K. Otolith Biochronologies as Multidecadal Indicators of Body Size Anomalies in Yellowfin Sole (Limanda aspera). Fish. Oceanogr. 2013, 22, 523–532. [Google Scholar] [CrossRef]
- Weisberg, S.; Spangler, G.; Richmond, L.S. Mixed Effects Models for Fish Growth. Can. J. Fish. Aquat. Sci. 2010, 67, 269–277. [Google Scholar] [CrossRef]
- Morrongiello, J.R.; Thresher, R.E.; Smith, D.C. Aquatic Biochronologies and Climate Change. Nat. Clim. Chang. 2012, 2, 849–857. [Google Scholar] [CrossRef]
- Xu, Z.; Chen, J. Analysis on Migratory Routine of Larimichthy polyactis. J. Fish. Sci. China 2009, 16, 931–940. [Google Scholar]
- Ren, J.S.; Jin, X.; Yang, T.; Kooijman, S.A.L.M.; Shan, X. A Dynamic Energy Budget Model for Small Yellow Croaker Larimichthys polyactis: Parameterisation and Application in Its Main Geographic Distribution Waters. Ecol. Modell. 2020, 427, 109051. [Google Scholar] [CrossRef]
- Li, J.; Lin, L.S.; Cheng, J. Distribution Characteristic of Small Yellow Croaker (Larimichthys polyactis Bleeker) and Its Relationship with Bottom Water Temperature and Salinity in the Northern East China Sea in Autumn. J. Fish. Sci. China 2009, 16, 348–356. [Google Scholar]
- Liu, Z.; Yuan, X.; Yan, L.; Yang, L.; Cheng, J. Spatial Heterogeneity in Body Condition of Small Yellow Croaker in Yellow Sea and East China Sea Based on Mixed-Effects Model and Quantile Regression Analysis. Chin. J. Appl. Ecol. 2013, 24, 2631–2642. [Google Scholar] [CrossRef]
- Zhang, G.; Li, X.; Zhu, J.; Dai, F.; Jin, X. The Growth Characteristics of Small Yellow Croaker Larimichthys polyactis (Bleeker, 1987) under Yearling in the Central and Southern Yellow Sea. Prog. Fish. Sci. 2010, 31, 15–22. [Google Scholar]
- Zhao, C.; Chen, Y.; Hong, G. Survey and Zoning of Fishery Resources in the East China Sea; East China Normal University Press: Shanghai, China, 1990. [Google Scholar]
- Chen, J.; Xu, Z.; Chen, X. The Spatial Distribution Pattern of Fishing Ground for Small Yellow Croaker in China Seas. J. Fish. China 2010, 34, 236–244. [Google Scholar] [CrossRef]
- Morrongiello, J.R.; Thresher, R.E. A Statistical Framework to Explore Ontogenetic Growth Variation among Individuals and Populations: A Marine Fish Example. Ecol. Monogr. 2015, 85, 93–115. [Google Scholar] [CrossRef]
- Burnham, K.P.; Anderson, D.R. (Eds.) Model Selection and Multimodel Inference; Springer: New York, NY, USA, 2004; ISBN 978-0-387-95364-9. [Google Scholar]
- van de Pol, M.; Bailey, L.D.; McLean, N.; Rijsdijk, L.; Lawson, C.R.; Brouwer, L. Identifying the Best Climatic Predictors in Ecology and Evolution. Methods Ecol. Evol. 2016, 7, 1246–1257. [Google Scholar] [CrossRef]
- Buscher, E.; Olson, A.M.; Pascoe, E.S.; Weil, J.; Juanes, F.; David, H. Secor: Migration Ecology of Marine Fishes. Rev. Fish Biol. Fish. 2016, 26, 609–610. [Google Scholar] [CrossRef]
- Morais, P.; Daverat, F. An Introduction to Fish Migration; CRC Press: Boca Raton, FL, USA, 2016. [Google Scholar] [CrossRef]
- Hurst, T.P. Causes and Consequences of Winter Mortality in Fishes. J. Fish Biol. 2007, 71, 315–345. [Google Scholar] [CrossRef]
- Ren, Y.; Ye, Z. Distribution and Migration of Fishes. In Fishery Resource Biology; China Agriculture Press: Beijing, China, 2020; pp. 40–61. [Google Scholar]
- Carey, M.P.; Keith, K.D.; Schelske, M.; Lean, C.; McCormick, S.D.; Regish, A.; Zimmerman, C.E. Energy Depletion and Stress Levels in Sockeye Salmon Migrating at the Northern Edge of Their Distribution. Trans. Am. Fish. Soc. 2019, 148, 785–797. [Google Scholar] [CrossRef]
- Ma, S.; Tian, Y.; Li, J.; Yu, H.; Cheng, J.; Sun, P.; Fu, C.; Liu, Y.; Watanabe, Y. Climate Variability Patterns and Their Ecological Effects on Ecosystems in the Northwestern North Pacific. Front. Mar. Sci. 2020, 7, 546882. [Google Scholar] [CrossRef]
- Kim, S.; Jung, S.; Zhang, C.I. The Effect of Seasonal Anomalies of Seawater Temperature and Salinity on the Fluctuation in Yields of Small Yellow Croaker, Pseudosciaena polyactis, in the Yellow Sea. Fish. Oceanogr. 1997, 6, 1–9. [Google Scholar] [CrossRef]
- Killeen, H.; Dorman, J.; Sydeman, W.; Dibble, C.; Morgan, S. Effects of a Marine Heatwave on Adult Body Length of Three Numerically Dominant Krill Species in the California Current Ecosystem. ICES J. Mar. Sci. 2022, 79, 761–774. [Google Scholar] [CrossRef]
- Pörtner, H.-O.; Roberts, D.C.; Masson-Delmotte, V.; Zhai, P.; Tignor, M.; Poloczanska, E.; Mintenbeck, K.; Alegría, A.; Nicolai, M.; Okem, A.; et al. IPCC, 2019: IPCC Special Report on the Ocean and Cryosphere in a Changing Climate; Cambridge University Press: Cambridge, UK; New York, NY, USA, 2019. [Google Scholar]
- Ong, J.J.L.; Rountrey, A.N.; Black, B.A.; Nguyen, H.M.; Coulson, P.G.; Newman, S.J.; Wakefield, C.B.; Meeuwig, J.J.; Meekan, M.G. A Boundary Current Drives Synchronous Growth of Marine Fishes across Tropical and Temperate Latitudes. Glob. Chang. Biol. 2018, 24, 1894–1903. [Google Scholar] [CrossRef] [PubMed]
- Liang, Z.; Sun, P.; Tang, Y.; Huang, L.; Lu, Q.; Liu, C.; Liu, Q. Numeric Simulation on Impact of Trawl Mesh Selectivity on Phenotypic Traits of Fish Population. Oceanol. Limnol. Sin. 2008, 39, 488–493. [Google Scholar]
- Kuparinen, A.; Merilä, J. Detecting and Managing Fisheries-Induced Evolution. Trends Ecol. Evol. 2007, 22, 652–659. [Google Scholar] [CrossRef] [PubMed]
- Rijnsdorp, A.D.; van Leeuwen, P.I. Changes in Growth of North Sea Plaice since 1950 in Relation to Density, Eutrophication, Beam-Trawl Effort, and Temperature. ICES J. Mar. Sci. 1996, 53, 1199–1213. [Google Scholar] [CrossRef]
- Rochet, M.-J. Short-Term Effects of Fishing on Life History Traits of Fishes. ICES J. Mar. Sci. 1998, 55, 371–391. [Google Scholar] [CrossRef]
- Casini, M.; Rouyer, T.; Bartolino, V.; Larson, N.; Grygiel, W. Density-Dependence in Space and Time: Opposite Synchronous Variations in Population Distribution and Body Condition in the Baltic Sea Sprat (Sprattus sprattus) over Three Decades. PLoS ONE 2014, 9, e92278. [Google Scholar] [CrossRef]
- Rueda, L.; Massutí, E.; Alvarez-Berastegui, D.; Hidalgo, M. Effect of Intra-Specific Competition, Surface Chlorophyll and Fishing on Spatial Variation of Gadoid’s Body Condition. Ecosphere 2015, 6, art175. [Google Scholar] [CrossRef]
- Shan, X.; Li, Z.; Dai, F.; Jin, X. Seasonal and Annual Variations in Biological Characteristics of Small Yellow Croaker Larimichthys polyactis in the Central and Southern Yellow Sea. Prog. Fish. Sci. 2011, 32, 7–16. [Google Scholar]
- Song, Y.; Xu, C.; Ren, Y.; Xu, B.; Ji, Y.; Zhang, C.; Xue, Y. Effects of Environmental Factors on the Feeding Ecology of Small Yellow Croaker (Larimichthys polyactis) in Haizhou Bay Based on Hurdle GAMMs. J. Fish. Sci. China 2021, 28, 646–657. [Google Scholar] [CrossRef]
- Wei, X.; Zhang, B.; Shan, X.; Jin, X.; Ren, Y. Feeding Habits of Small Yellow Croaker Larimichthys polyactis in the Bohai Sea. J. Fish. Sci. China 2018, 25, 1289–1298. [Google Scholar] [CrossRef]
- Song, Y.; Xue, Y.; Xu, B.; Zhang, C.; Ren, Y. Composition of Food and Niche Overlap of Three Sciaenidae Species in Haizhou Bay. J. Fish. China 2020, 44, 2017–2027. [Google Scholar] [CrossRef]
- Xue, Y.; Jin, X.; Zhang, B.; Liang, Z. Diet Composition and Seasonal Variation in Feeding Habits of Small Yellow Croaker Pseudosciaena polyactis Bleeker in the Central Yellow Sea. J. Fish. Sci. China 2004, 11, 237–243. [Google Scholar]
- Yan, L.; Li, J.; Shen, D.; Yu, L.; Ling, L. Variations in Diet Composition and Feeding Intensity of Small Yellow Croaker Larimichthys polyactis Bleeker in the Southern Yellow Sea and Northern East China Sea. Mar. Fish. 2006, 28, 117–123. [Google Scholar]
- Zhang, B.; Tang, Q. Study on Trophic Level of Important Resources Species at High Trophic Levels in the Bohai Sea, Yellow Sea and East China Sea. Adv. Mar. Sci. 2004, 22, 393–404. [Google Scholar]
- Li, G.; Xiong, Y.; Zhong, X.; Song, D.; Kang, Z.; Li, D.; Tang, J.; Wang, Y.; Wu, L. Changes in Overwintering Ground of Small Yellow Croaker (Larimichthys polyactis) Based on MaxEnt and GARP Models: A Case Study of the Southern Yellow Sea Stock. J. Fish Biol. 2023, 102, 1358–1372. [Google Scholar] [CrossRef] [PubMed]
- Han, Q.; Shan, X.; Jin, X.; Gorfine, H.; Chen, Y.; Su, C. Changes in Distribution Patterns for Larimichthys polyactis in Response to Multiple Pressures in the Bohai Sea Over the Past Four Decades. Front. Mar. Sci. 2022, 9. [Google Scholar] [CrossRef]
- Larimichthys polyactis Summary Page. Available online: https://www.fishbase.us/summary/Larimichthys-polyactis.html (accessed on 28 July 2024).
- Cheung, W.W.L.; Watson, R.; Pauly, D. Signature of Ocean Warming in Global Fisheries Catch. Nature 2013, 497, 365–368. [Google Scholar] [CrossRef]
- Smith, A.C.; Shima, J.S. Variation in the Effects of Larval History on Juvenile Performance of a Temperate Reef Fish. Austral Ecol. 2011, 36, 830–838. [Google Scholar] [CrossRef]
- Landaeta, M.F.; Gómez, A.; Contreras, J.E.; Figueroa-González, Y.; Pinilla, E.; Reche, P.; Castillo, M.I.; Plaza, G. Linking Shape and Growth in Young-of-the-Year Rockfish: An Ecological Carry-over Effect? Mar. Biol. 2023, 170, 103. [Google Scholar] [CrossRef]
- Wu, R.; Liu, S.; Zhuang, Z.; Jin, X.; Su, Y.; Tang, Q. Genetic Structure of Small Yellow Croaker (Larimichthys polyactis) Populations in the Yellow Sea and East China Sea Based on Mitochondrial Cyt b Gene. Prog. Nat. Sci. 2009, 19, 924–930. [Google Scholar]
- Li, Y.; Han, Z.; Song, N.; Gao, T. New Evidence to Genetic Analysis of Small Yellow Croaker (Larimichthys polyactis) with Continuous Distribution in China. Biochem. Syst. Ecol. 2013, 50, 331–338. [Google Scholar] [CrossRef]
- Zhang, B.; Li, Y.; Xue, D.; Liu, J. Population Genomic Evidence for High Genetic Connectivity among Populations of Small Yellow Croaker (Larimichthys polyactis) in Inshore Waters of China. Fish. Res. 2020, 225, 105505. [Google Scholar] [CrossRef]
- Wang, P.; Li, S.; Liu, Z.; Jin, Y.; Jiang, Y.; Zhang, H.; Zhang, Y. Spatial Connectivity in Juvenile Larimichthys polyactis from Otolith Microchemistry in Coastal Areas of Southern Yellow Sea and East China Sea. Mar. Fish. 2022, 44, 140–151. [Google Scholar] [CrossRef]
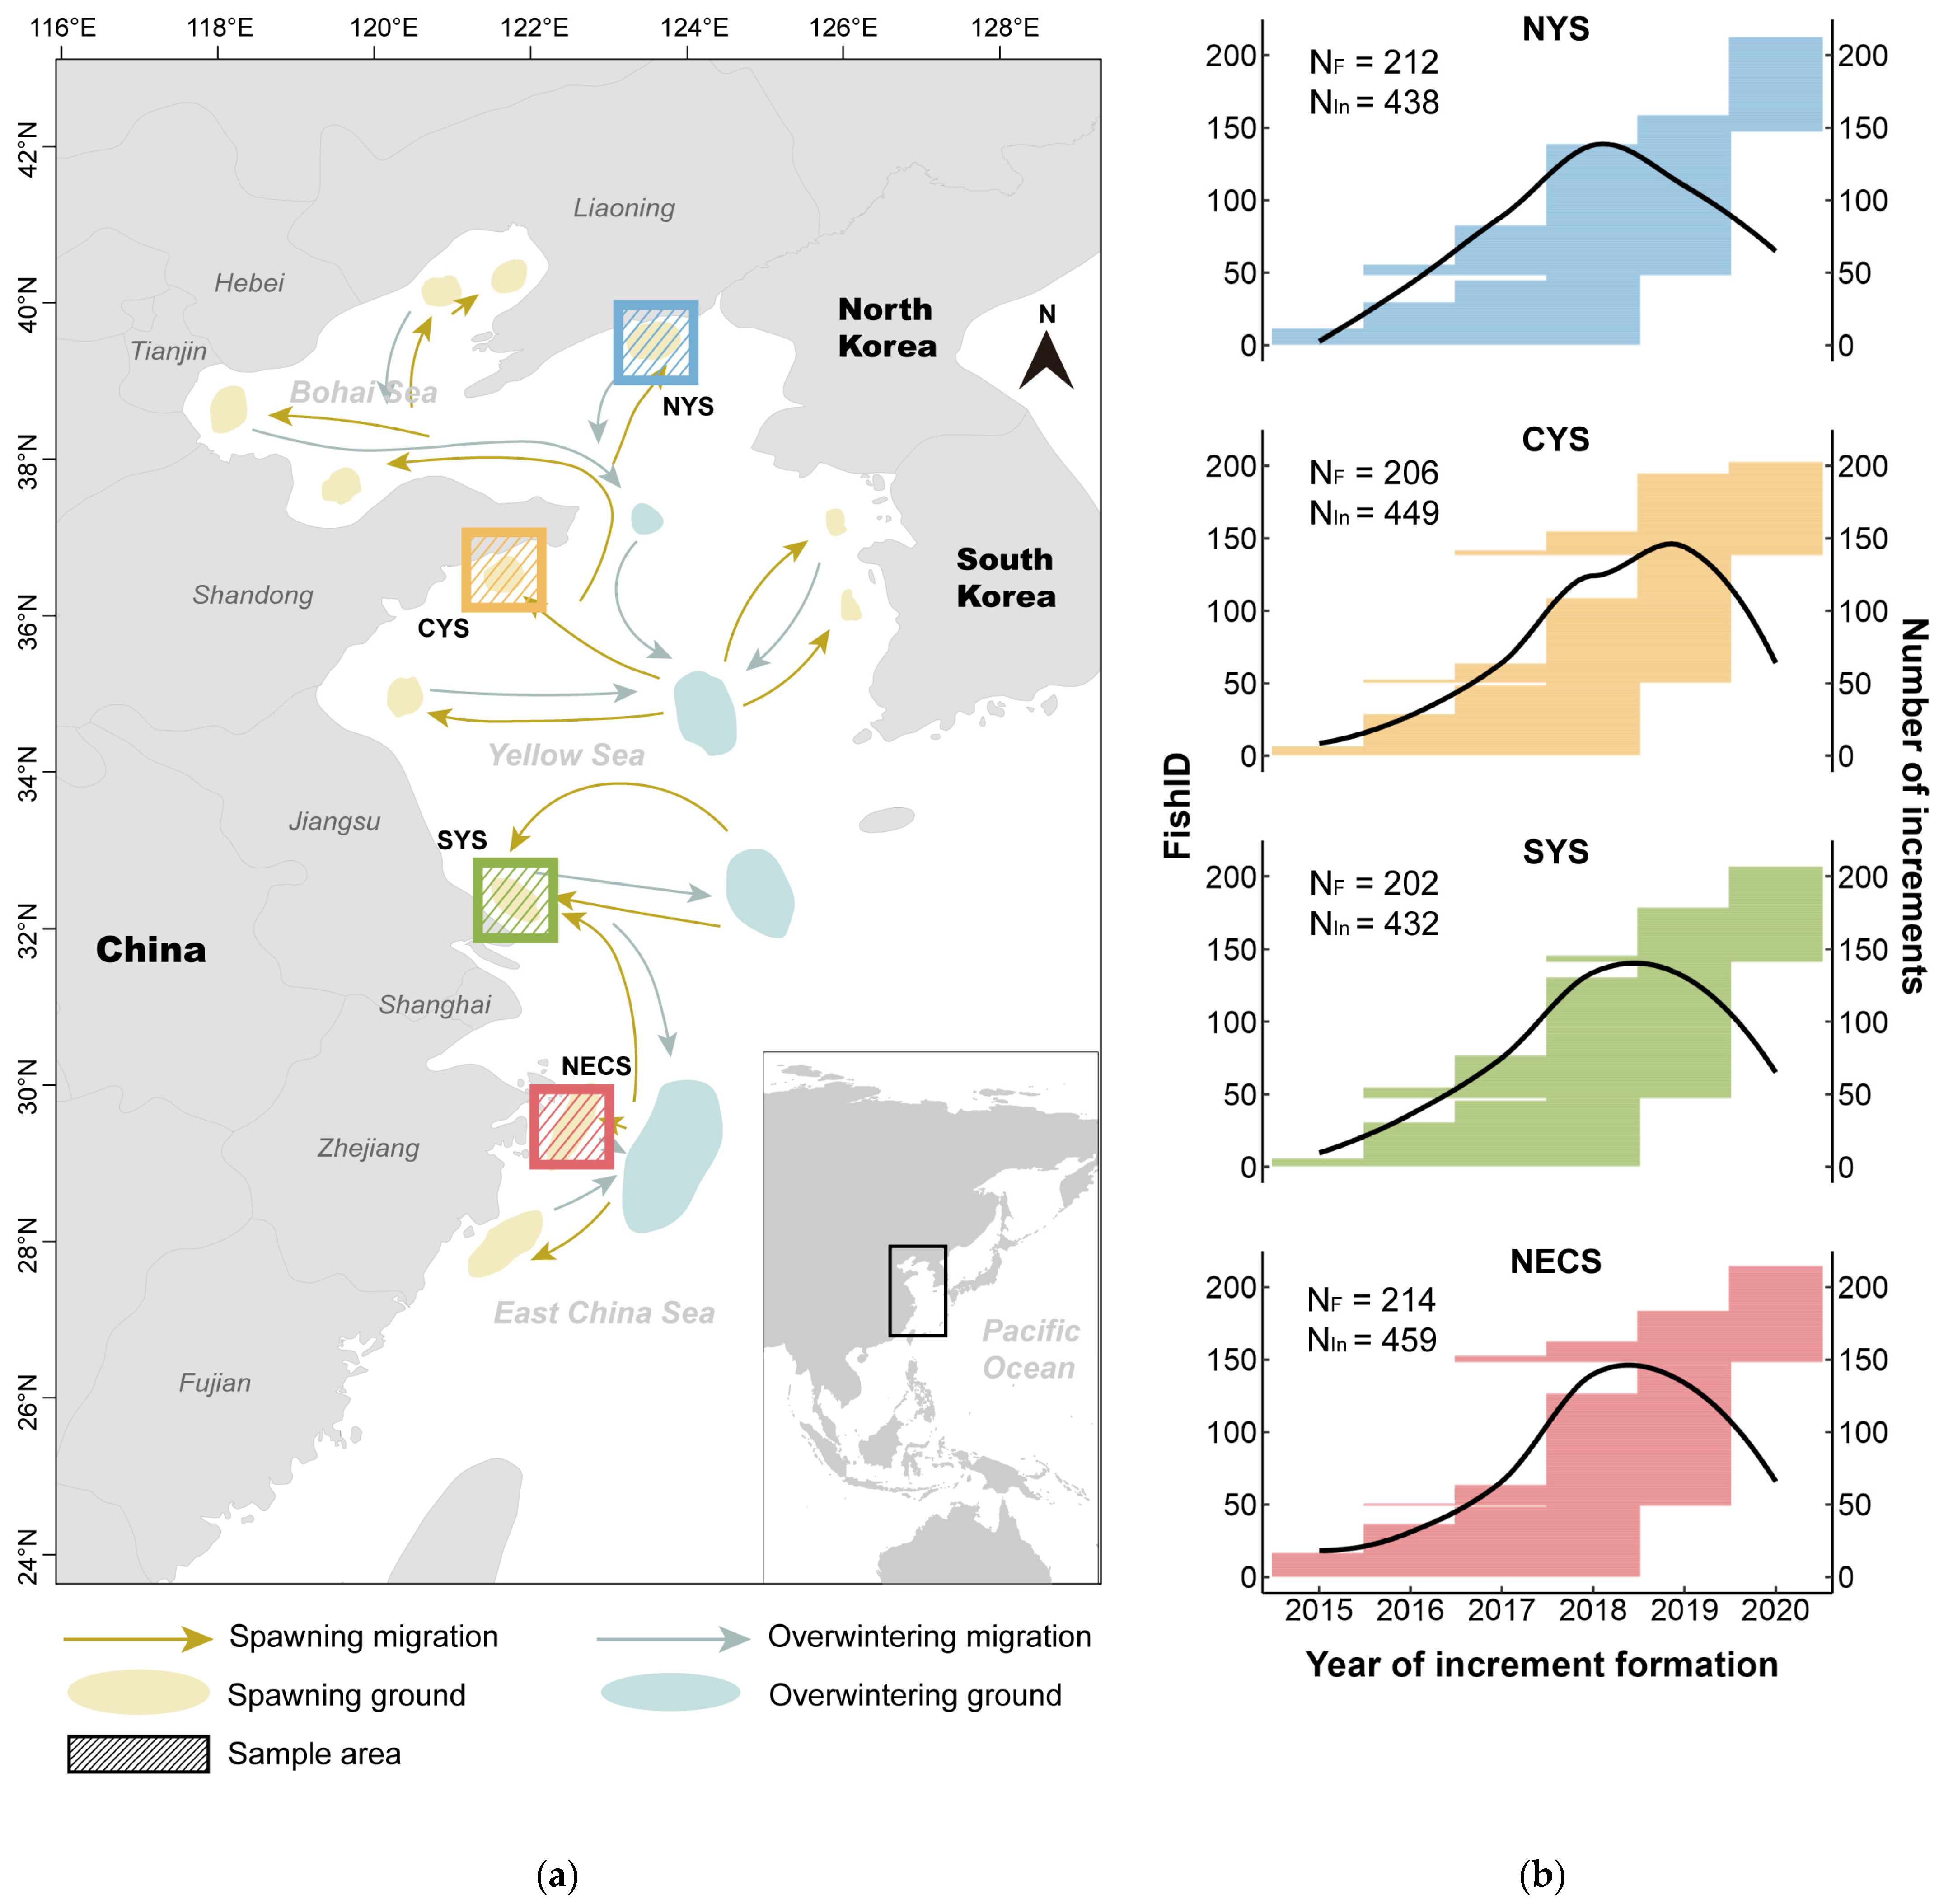
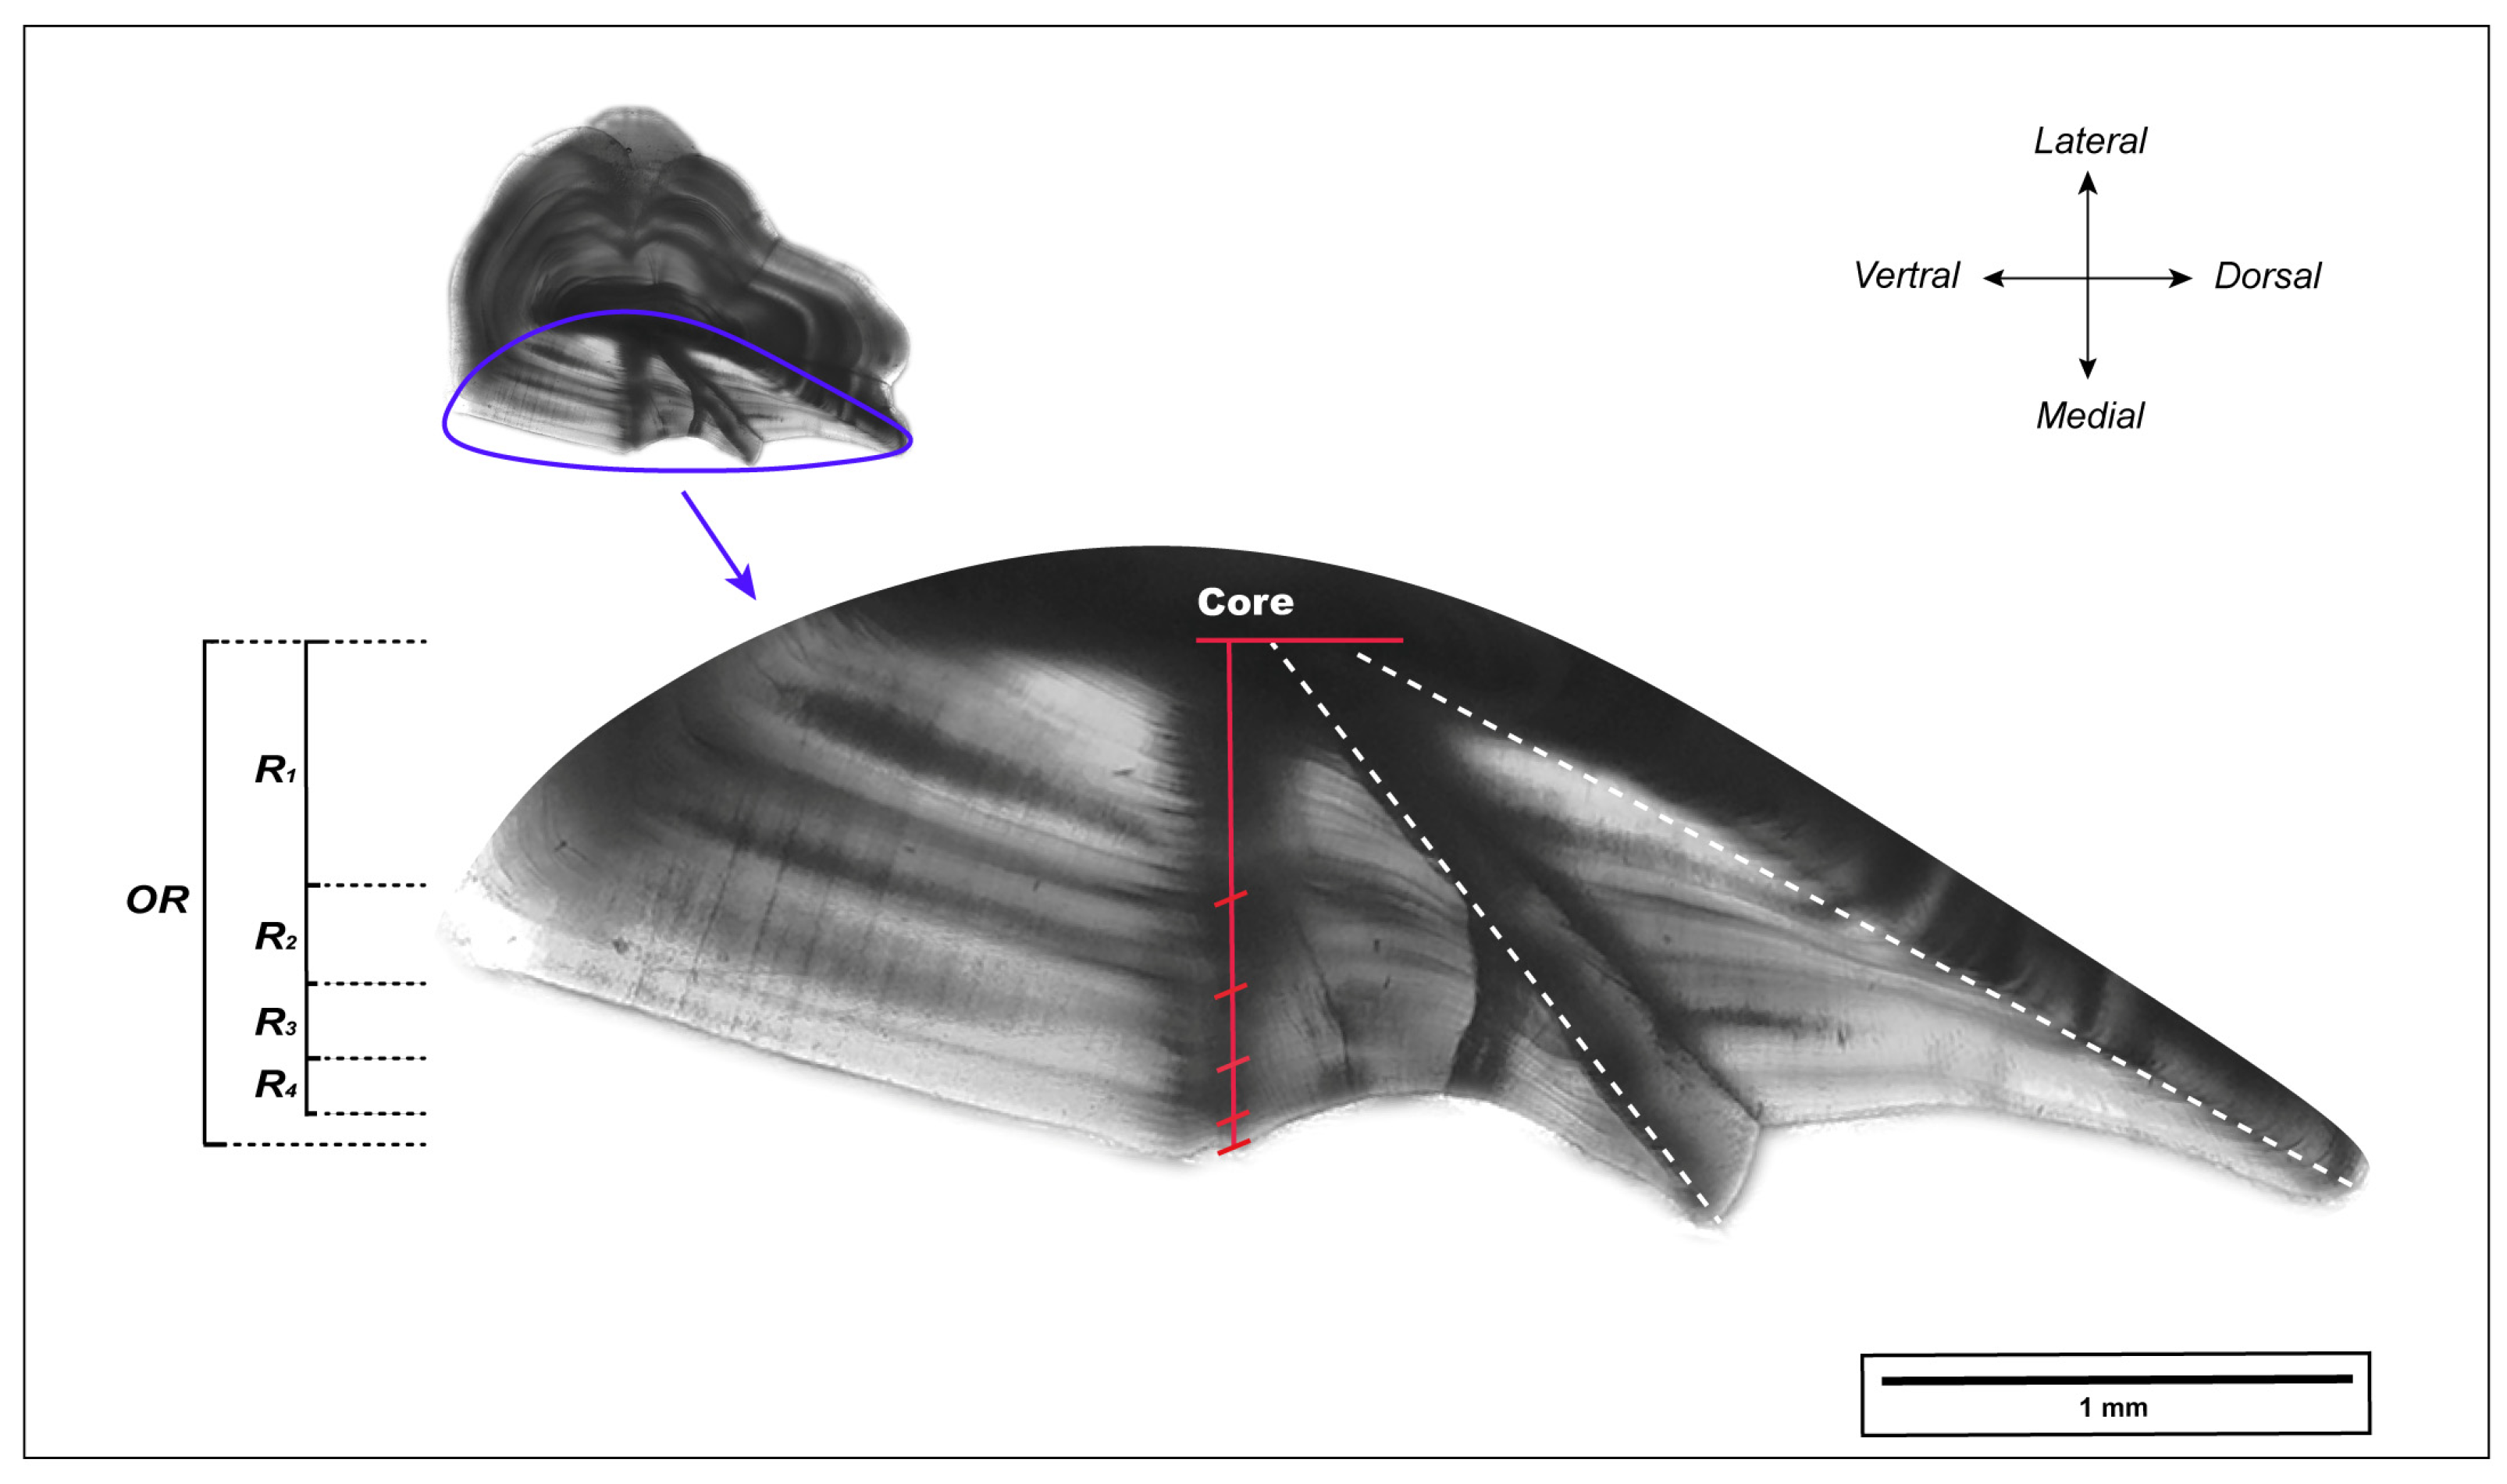


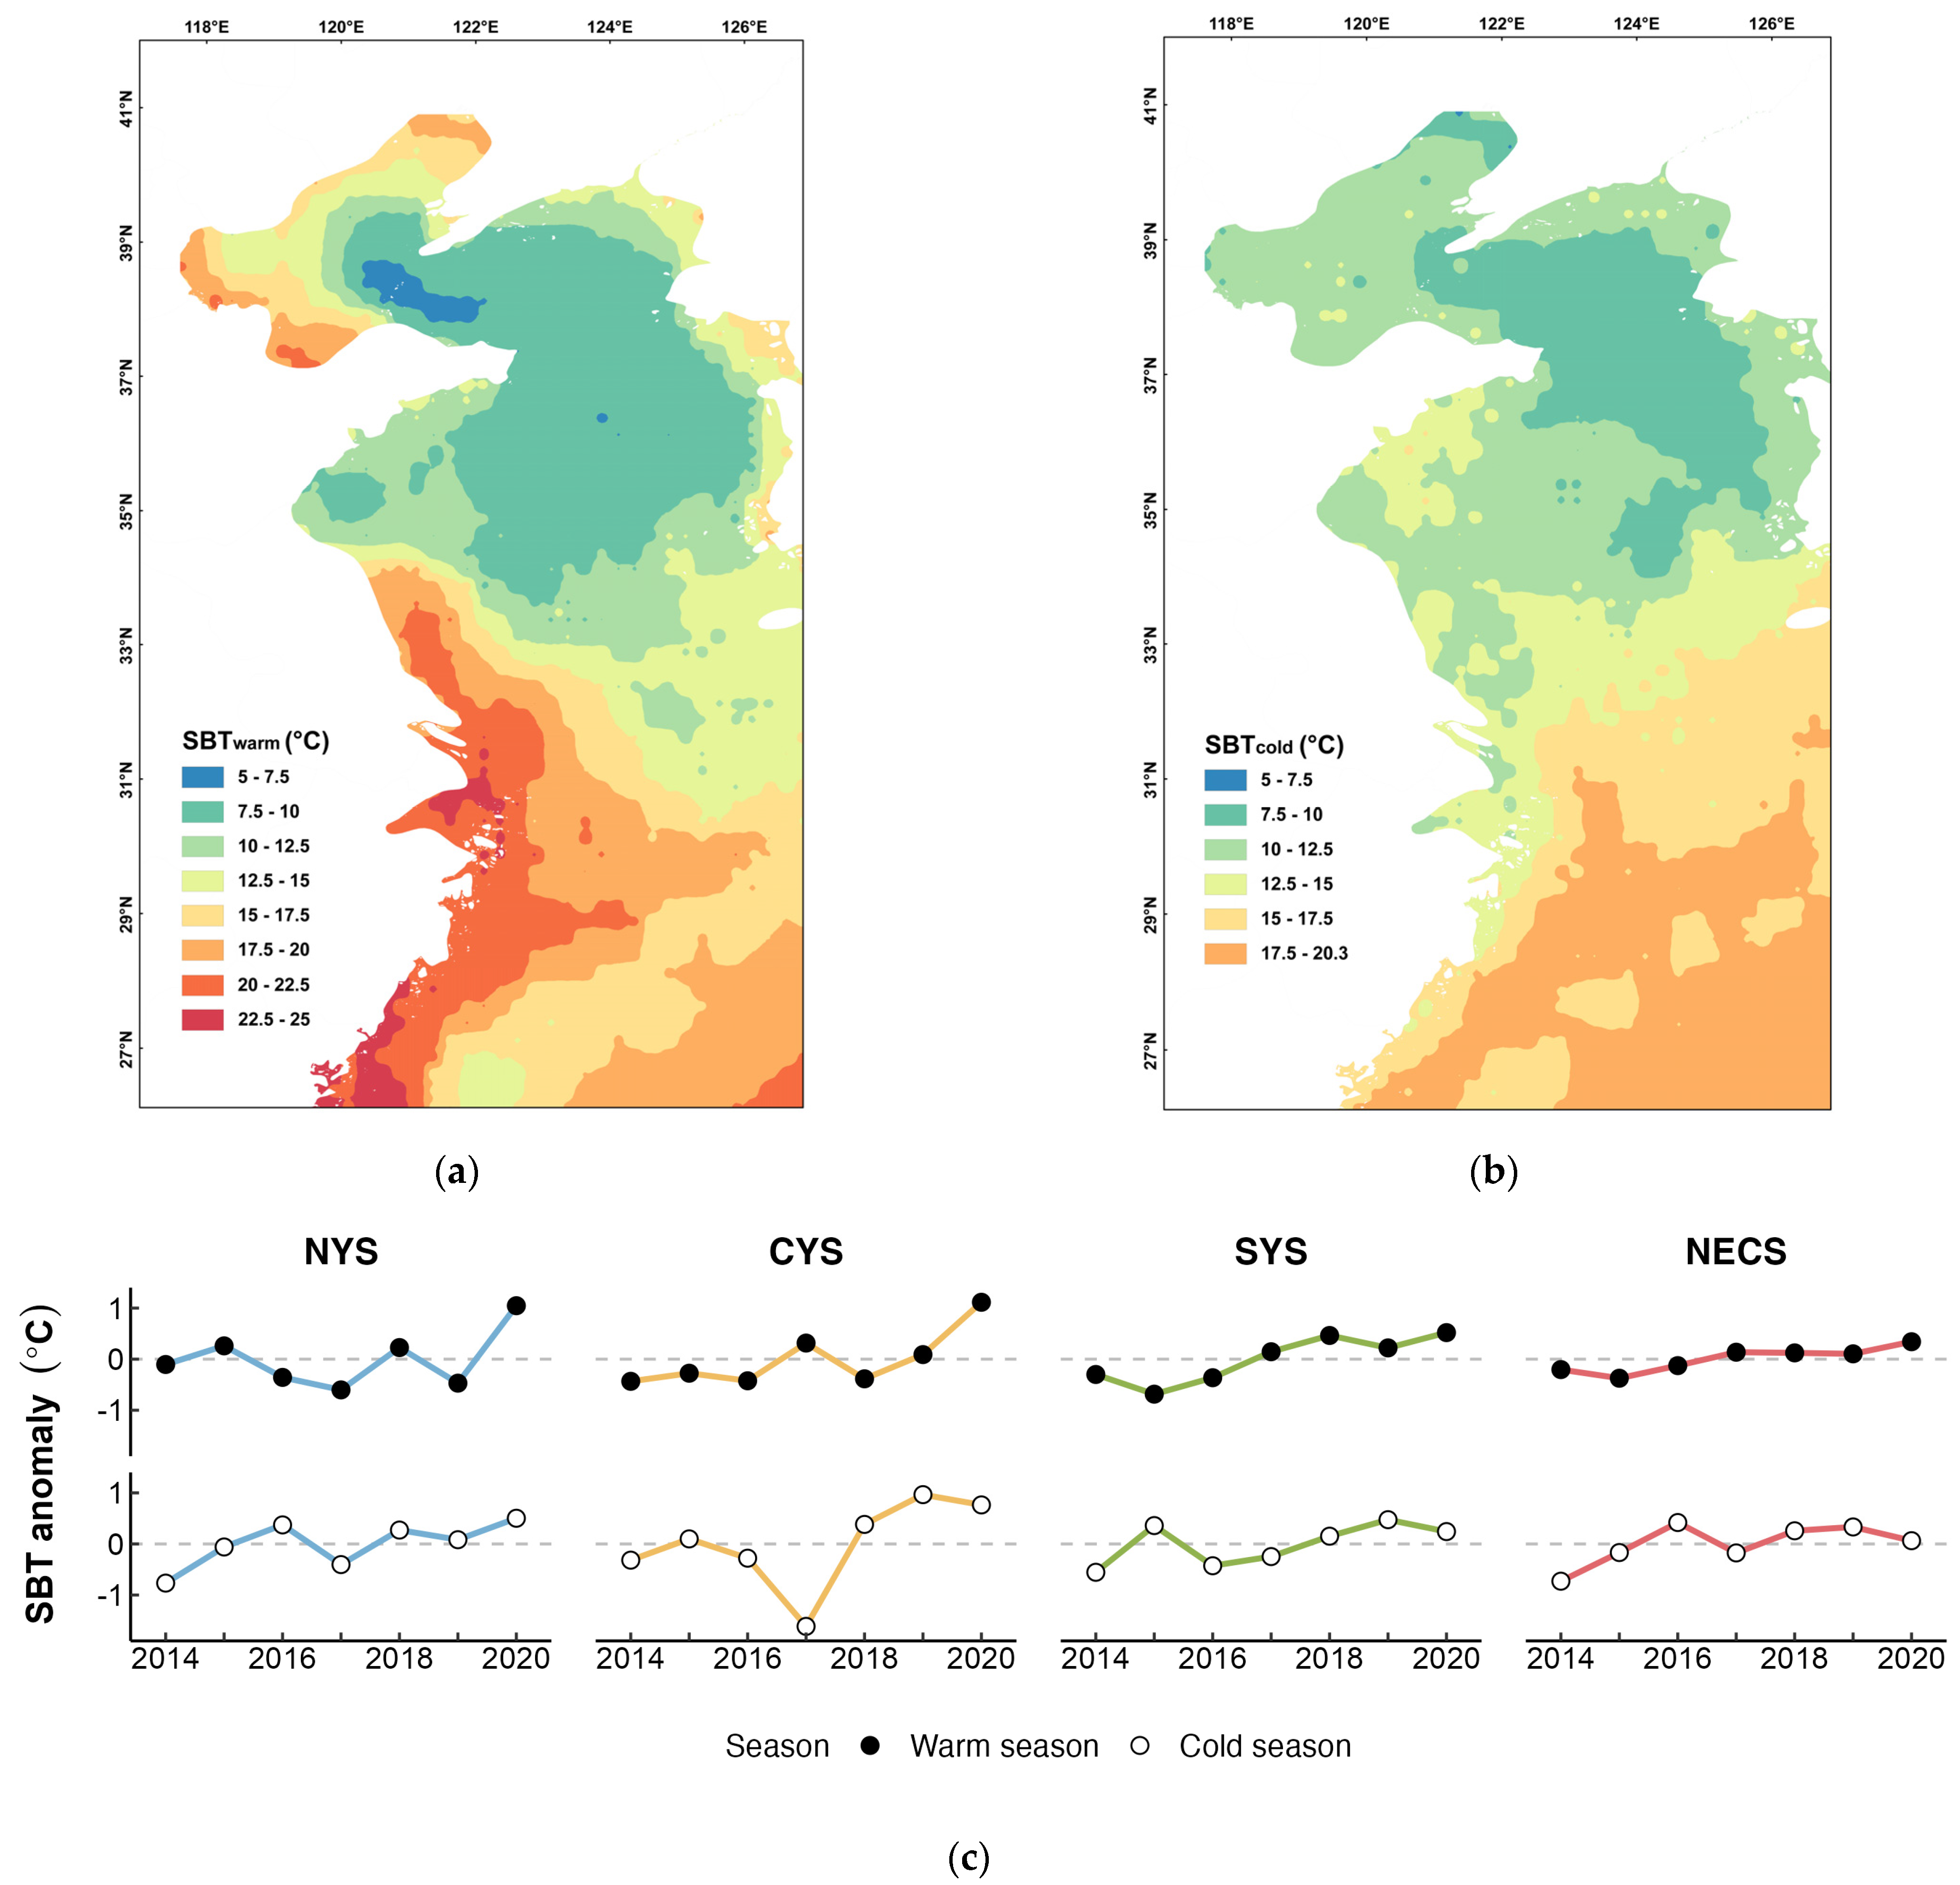
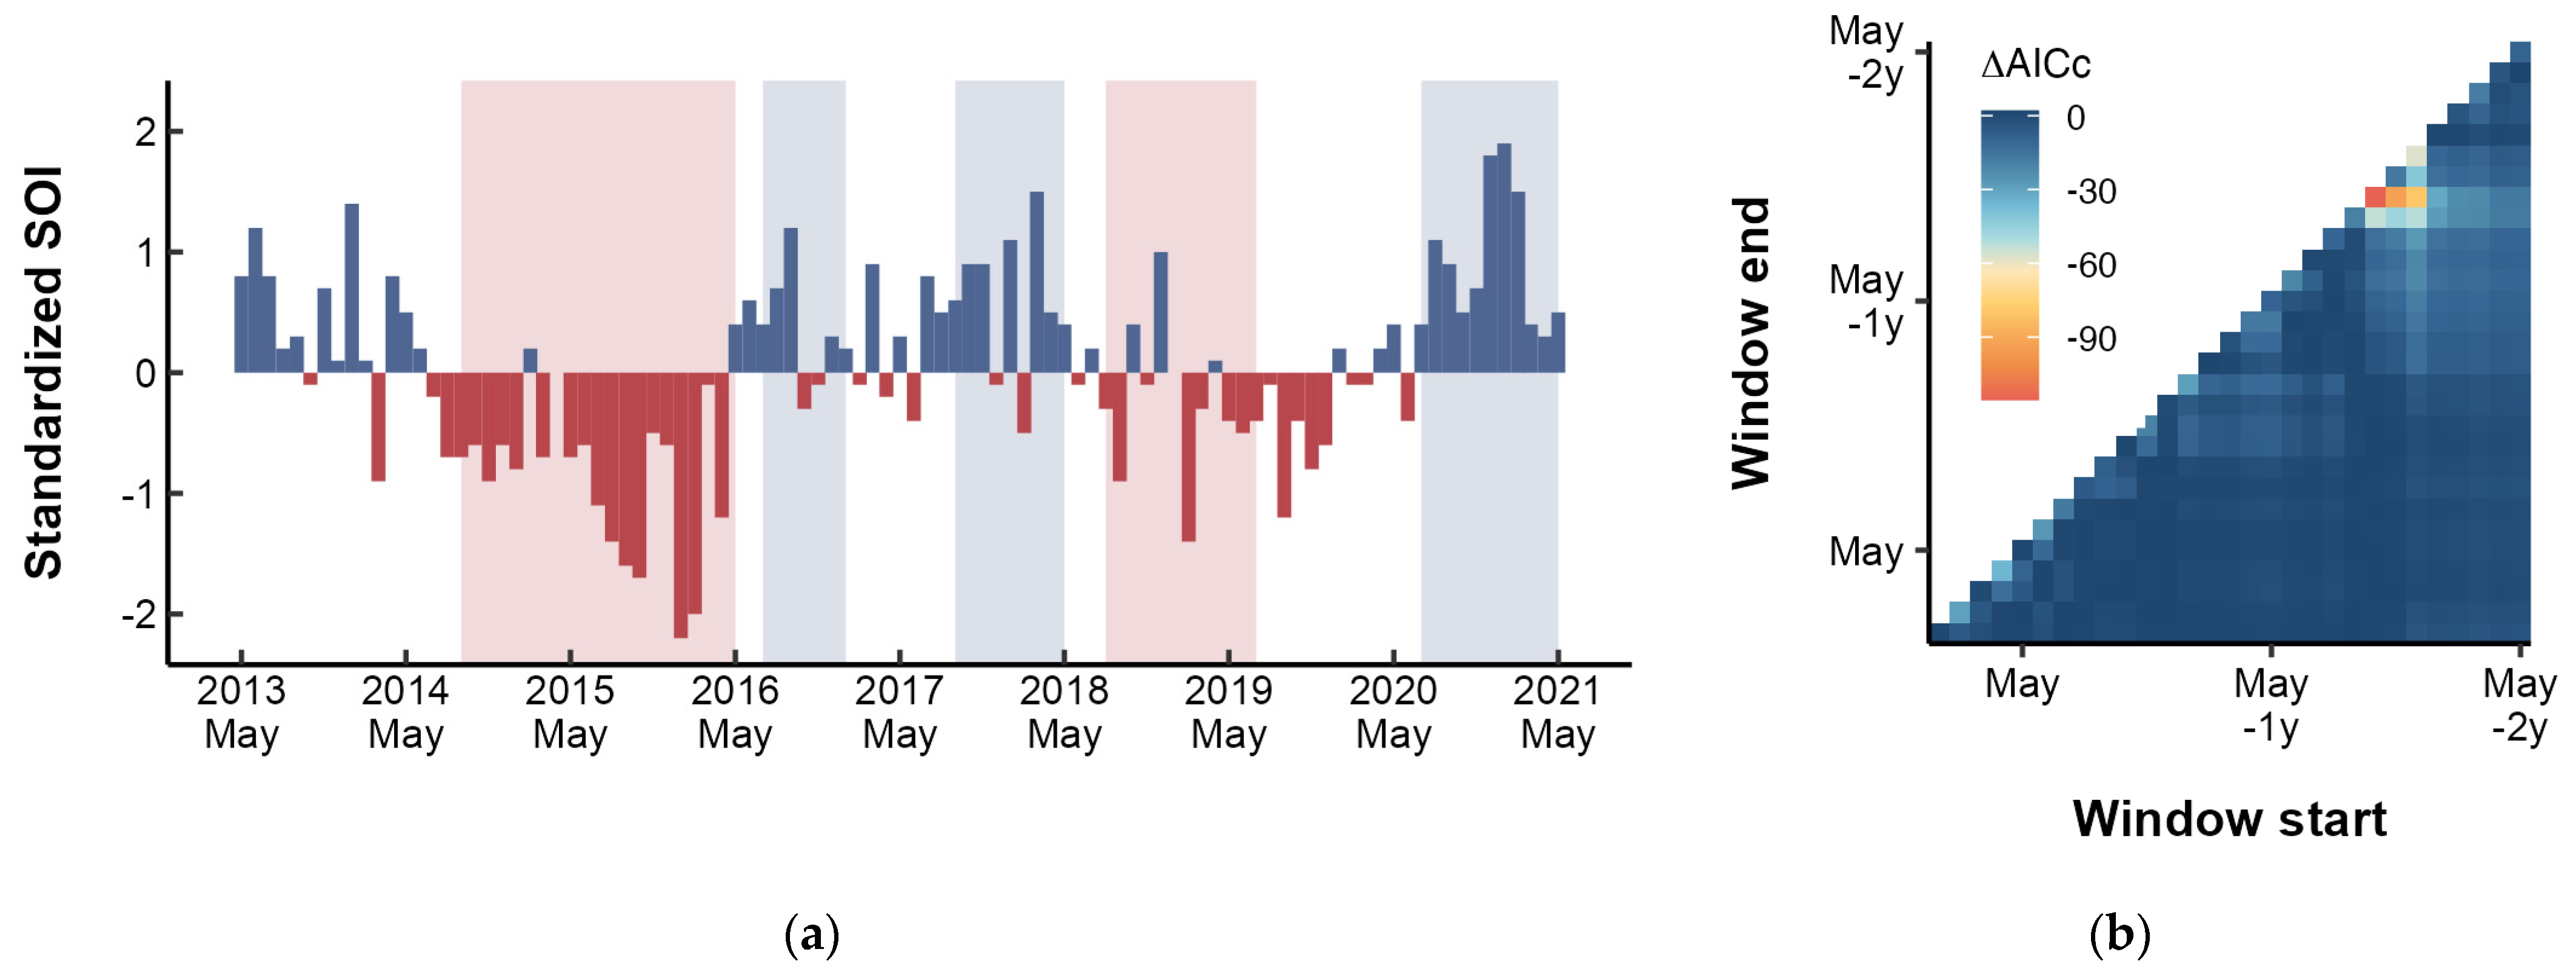
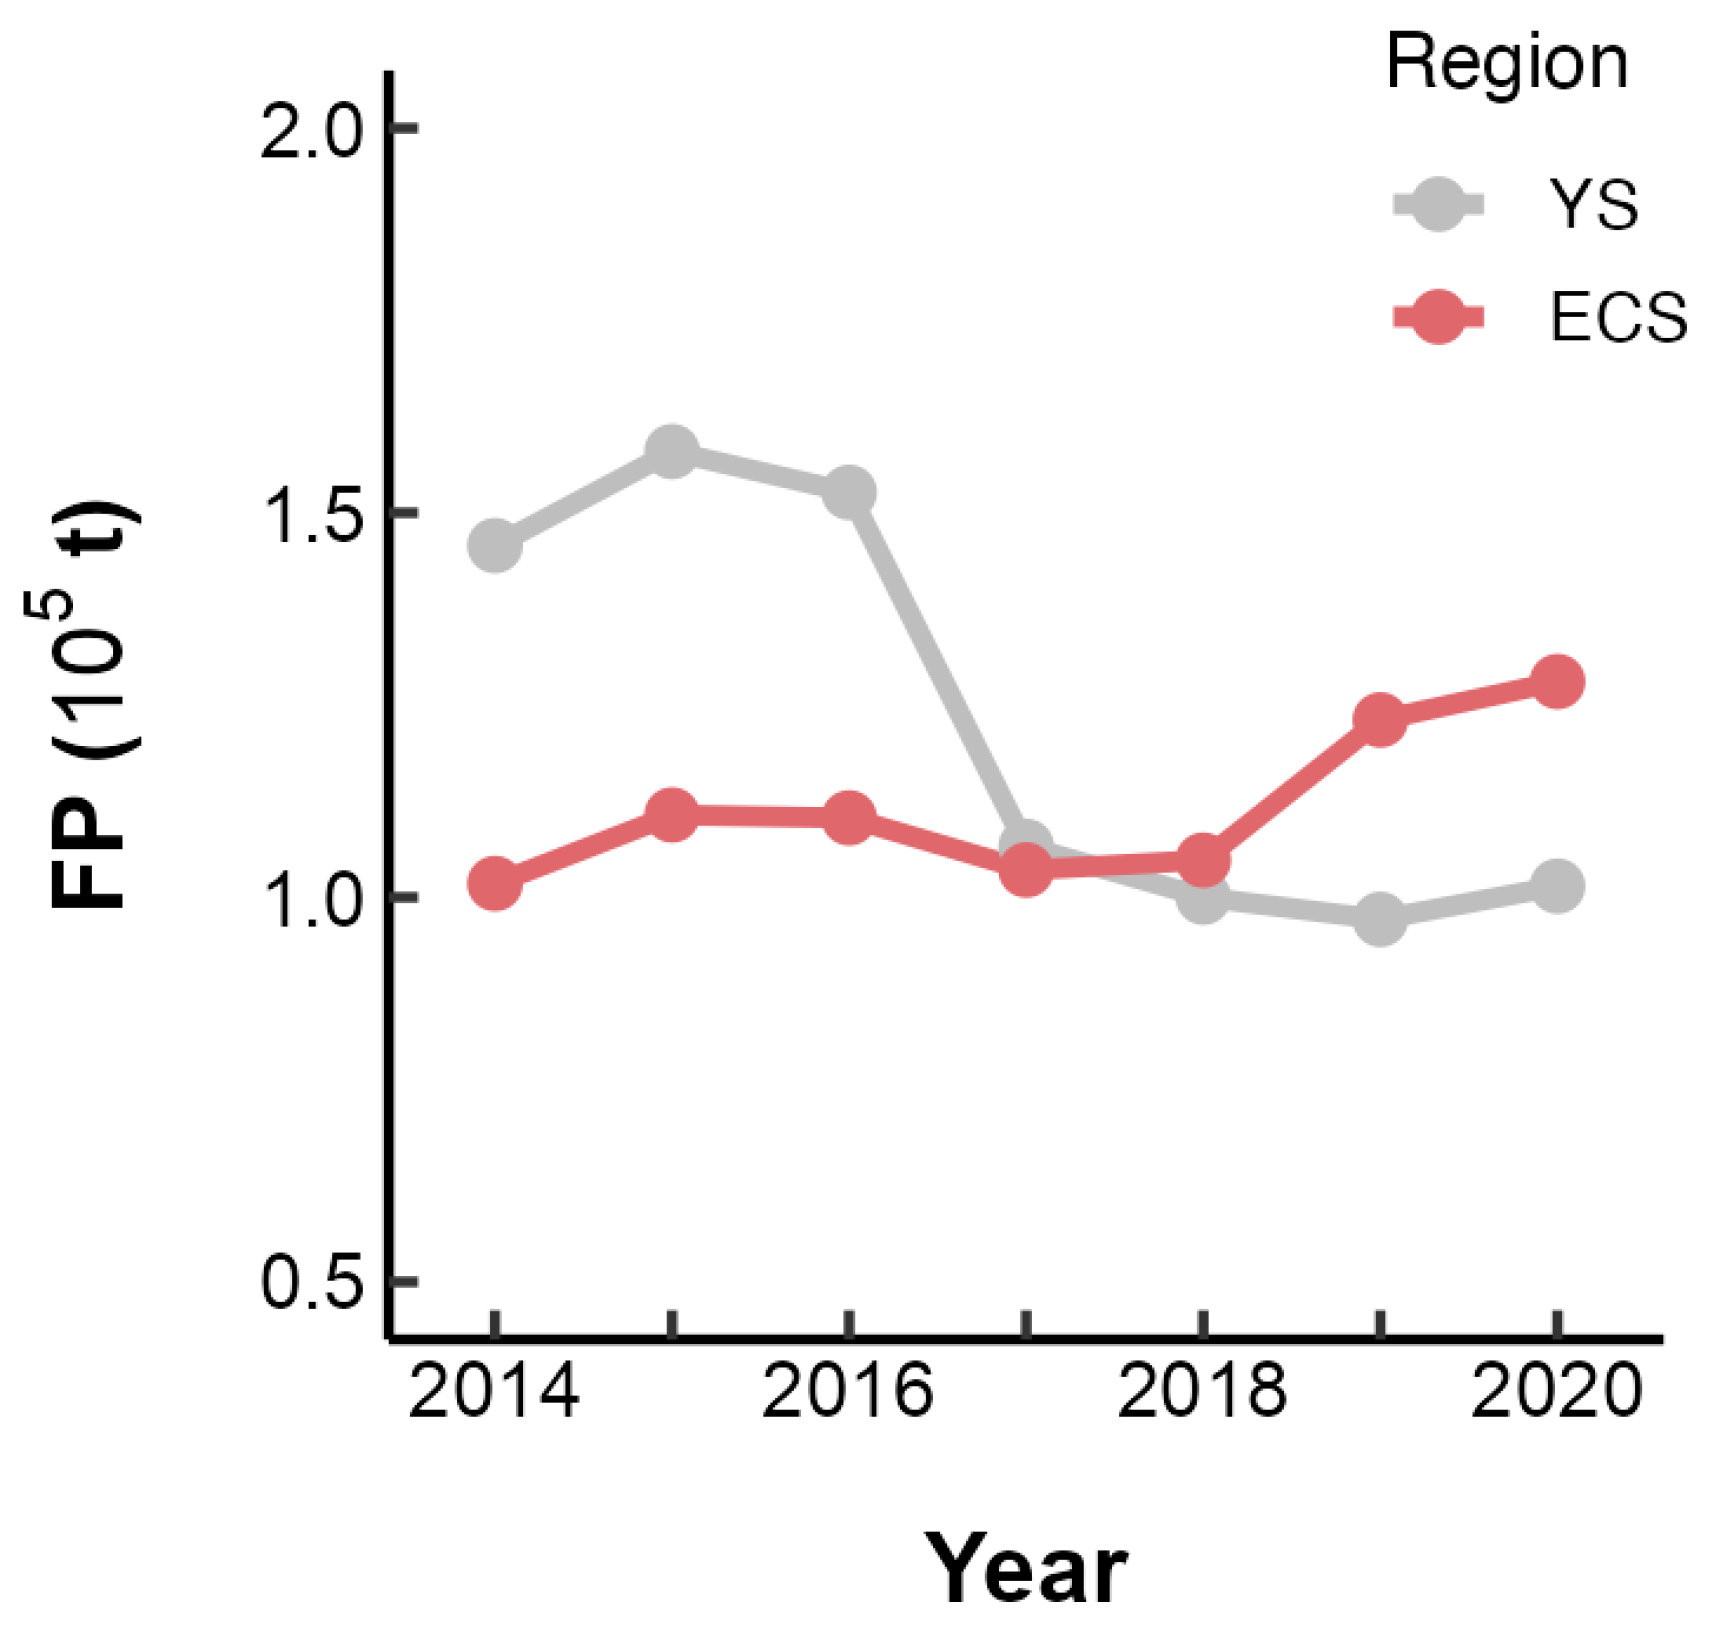
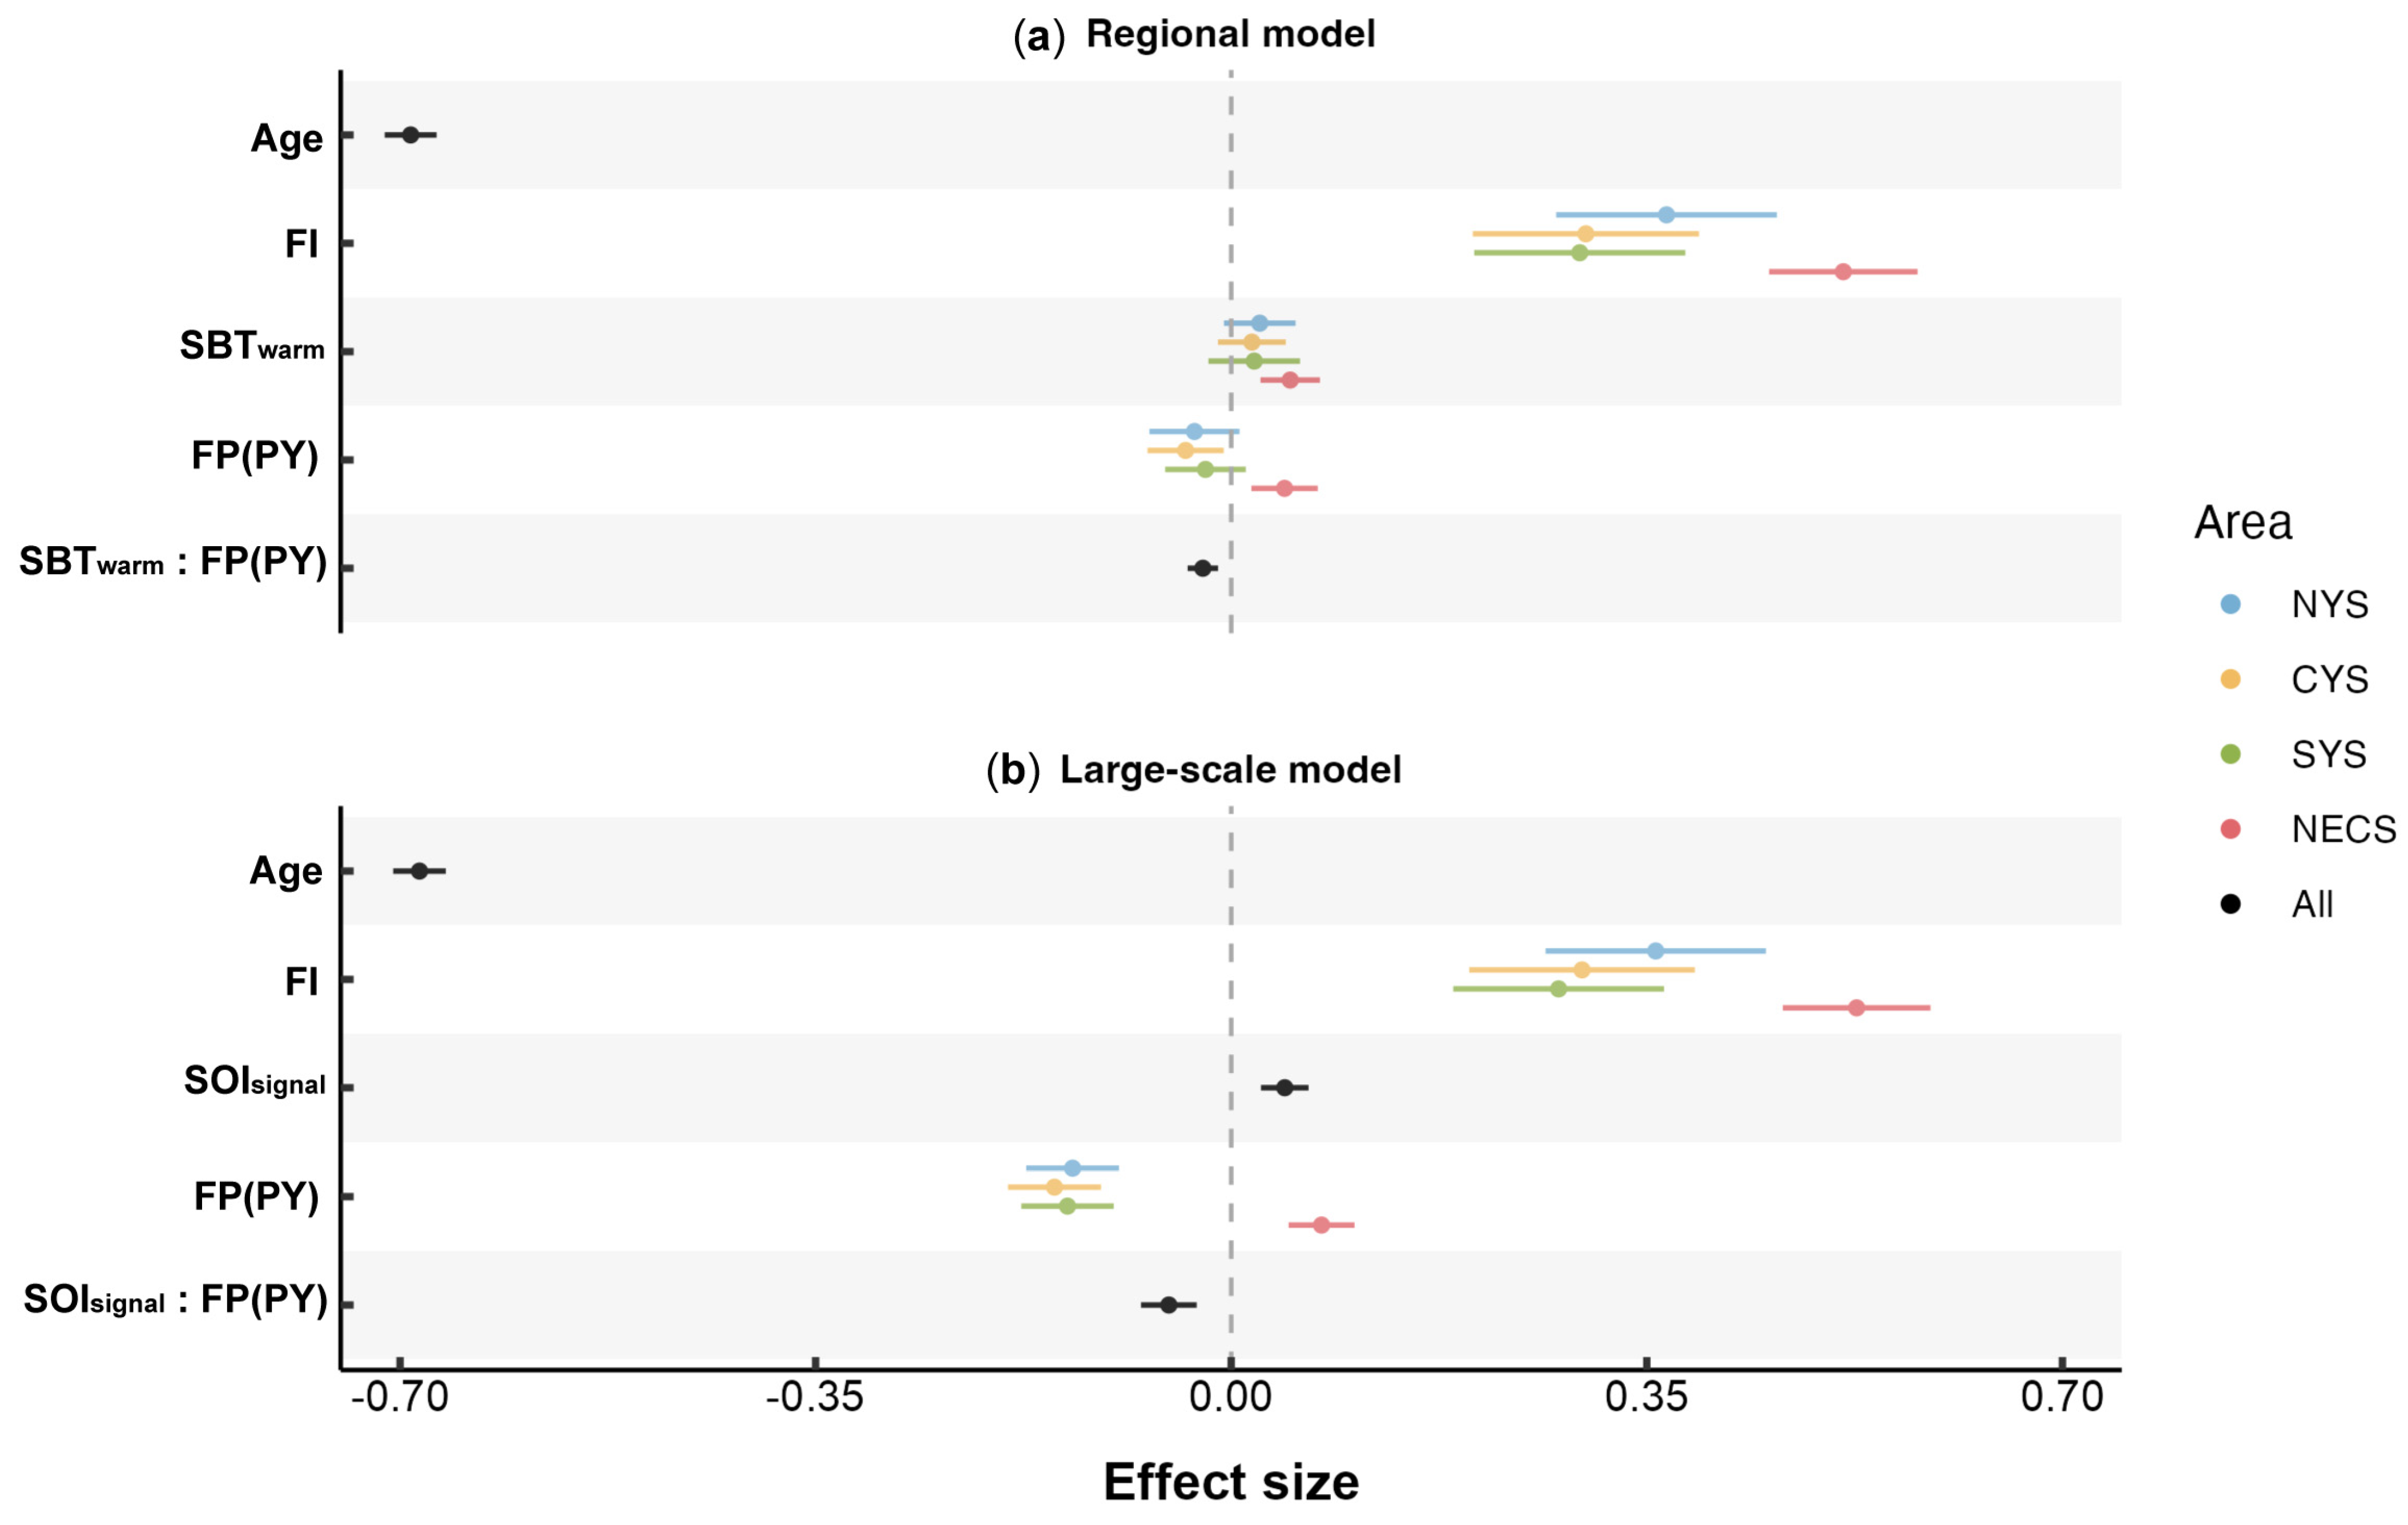
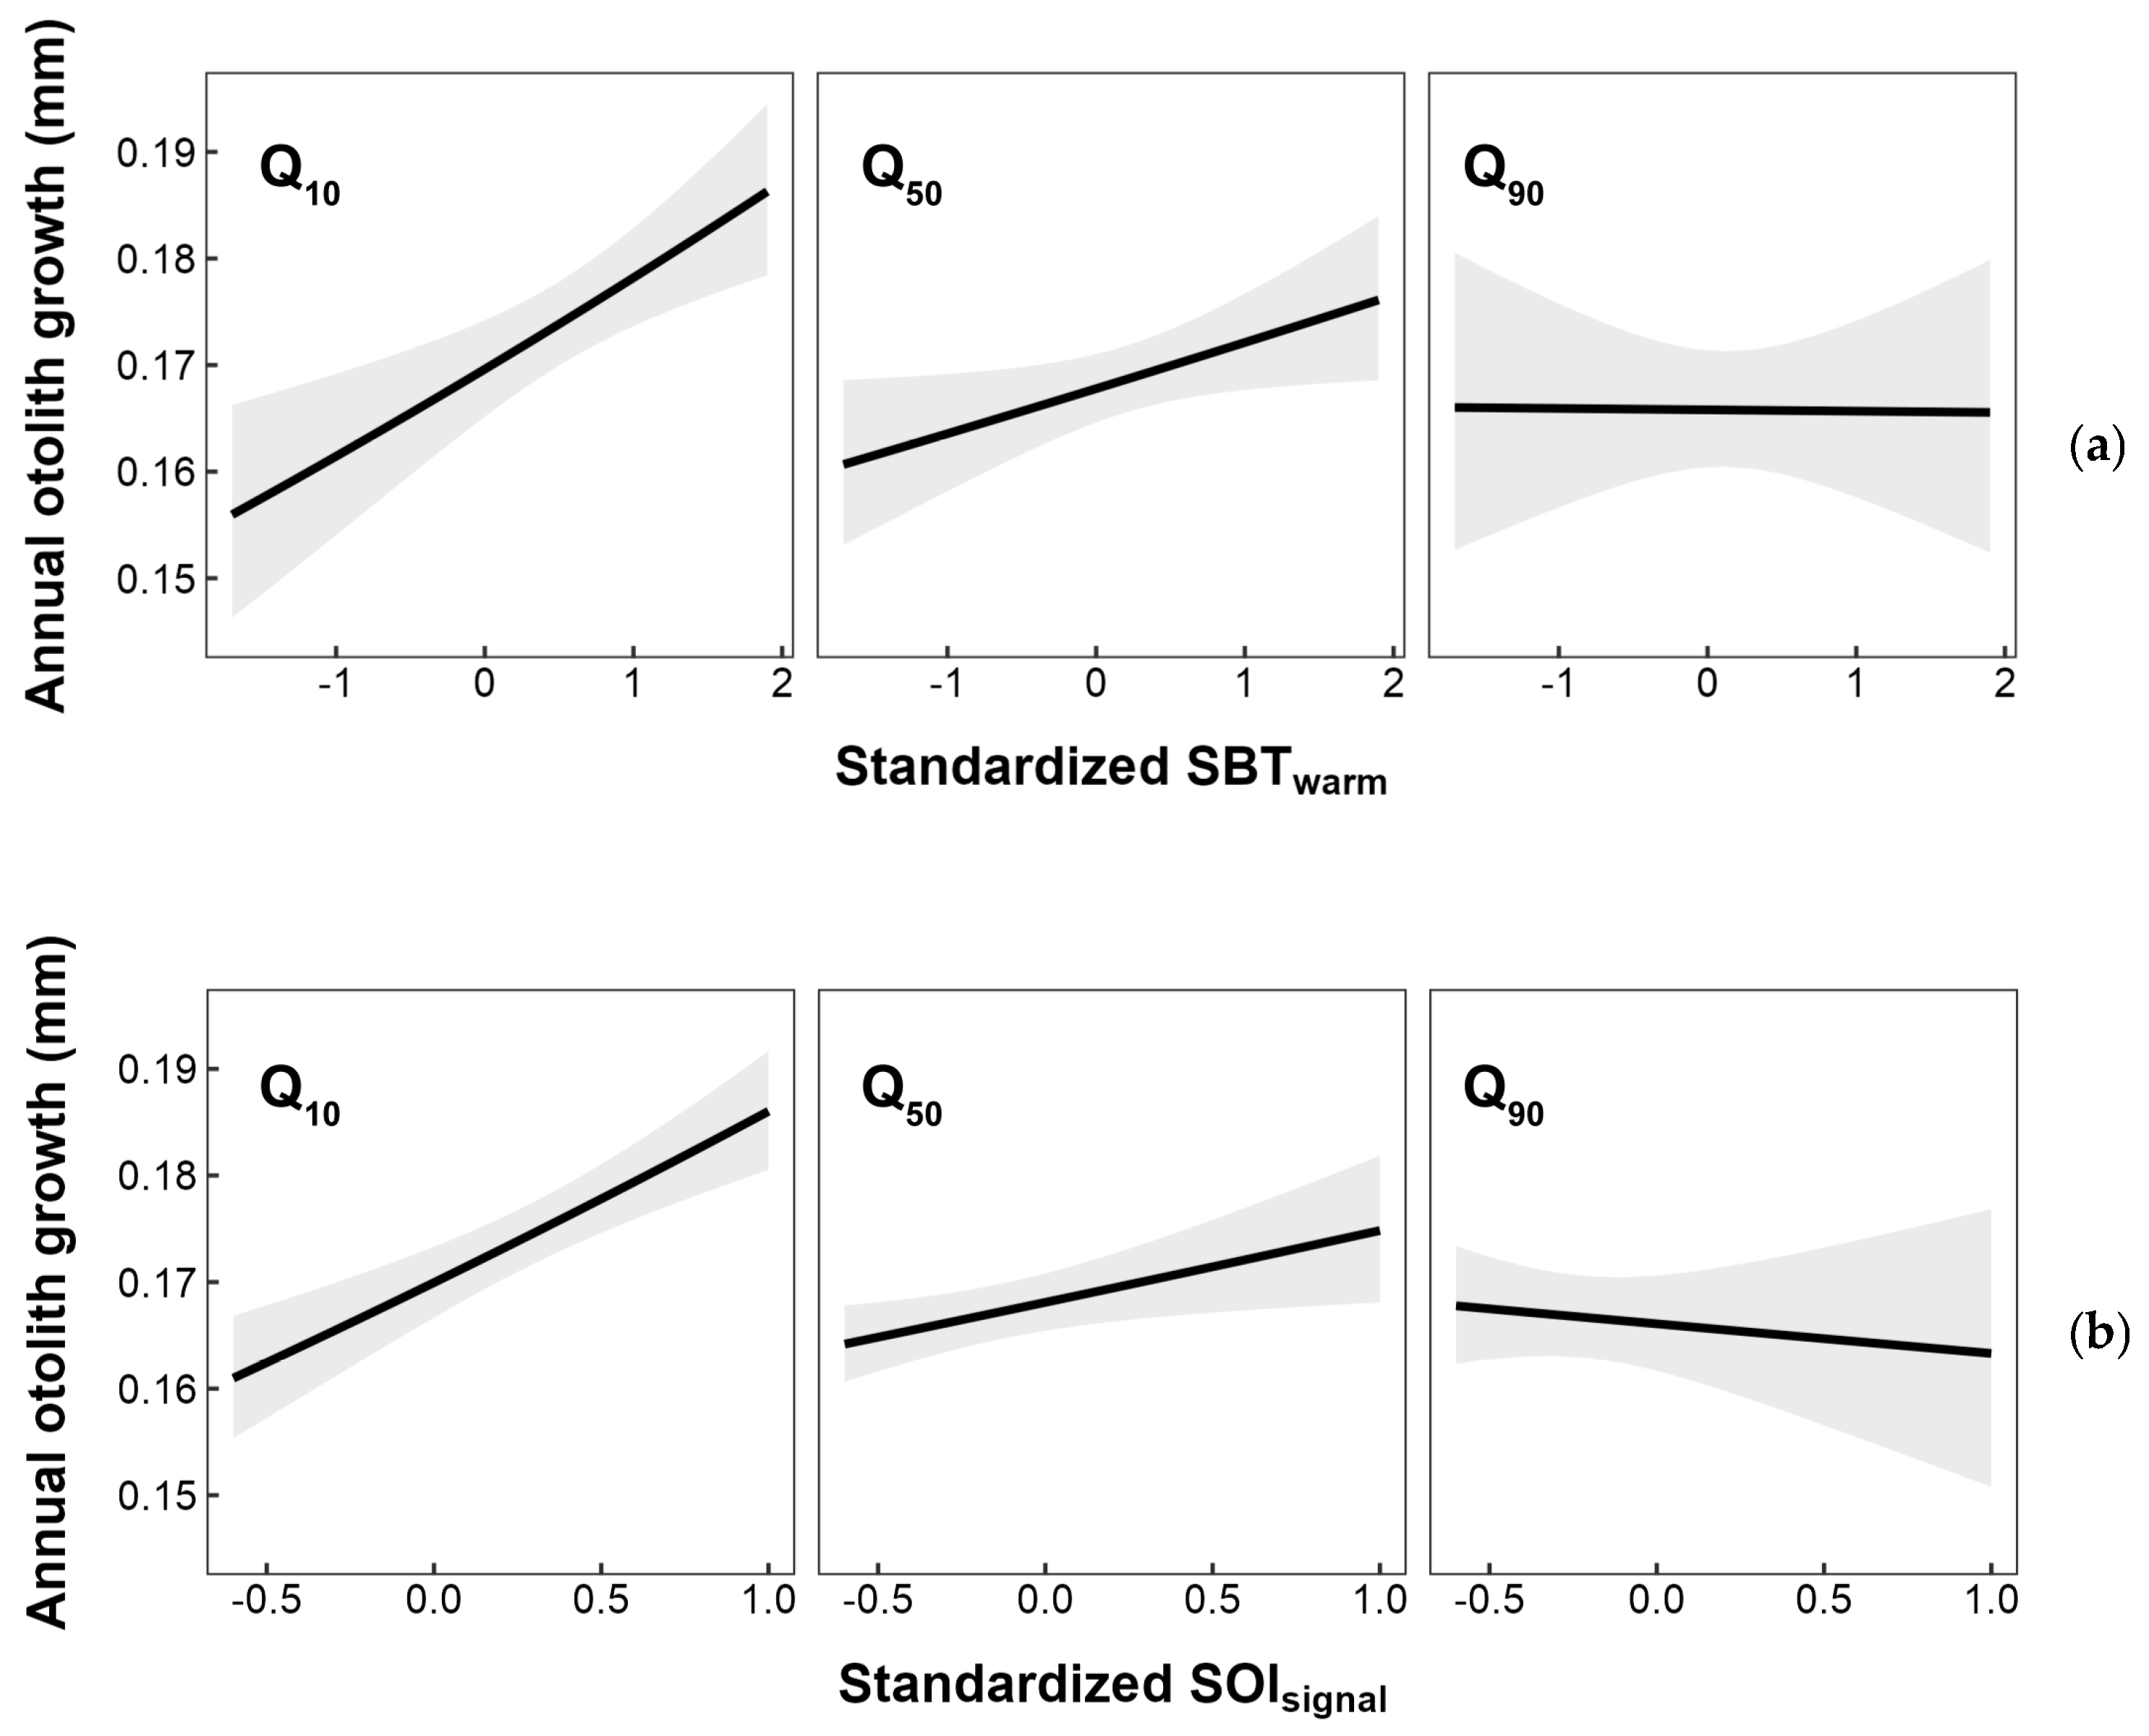
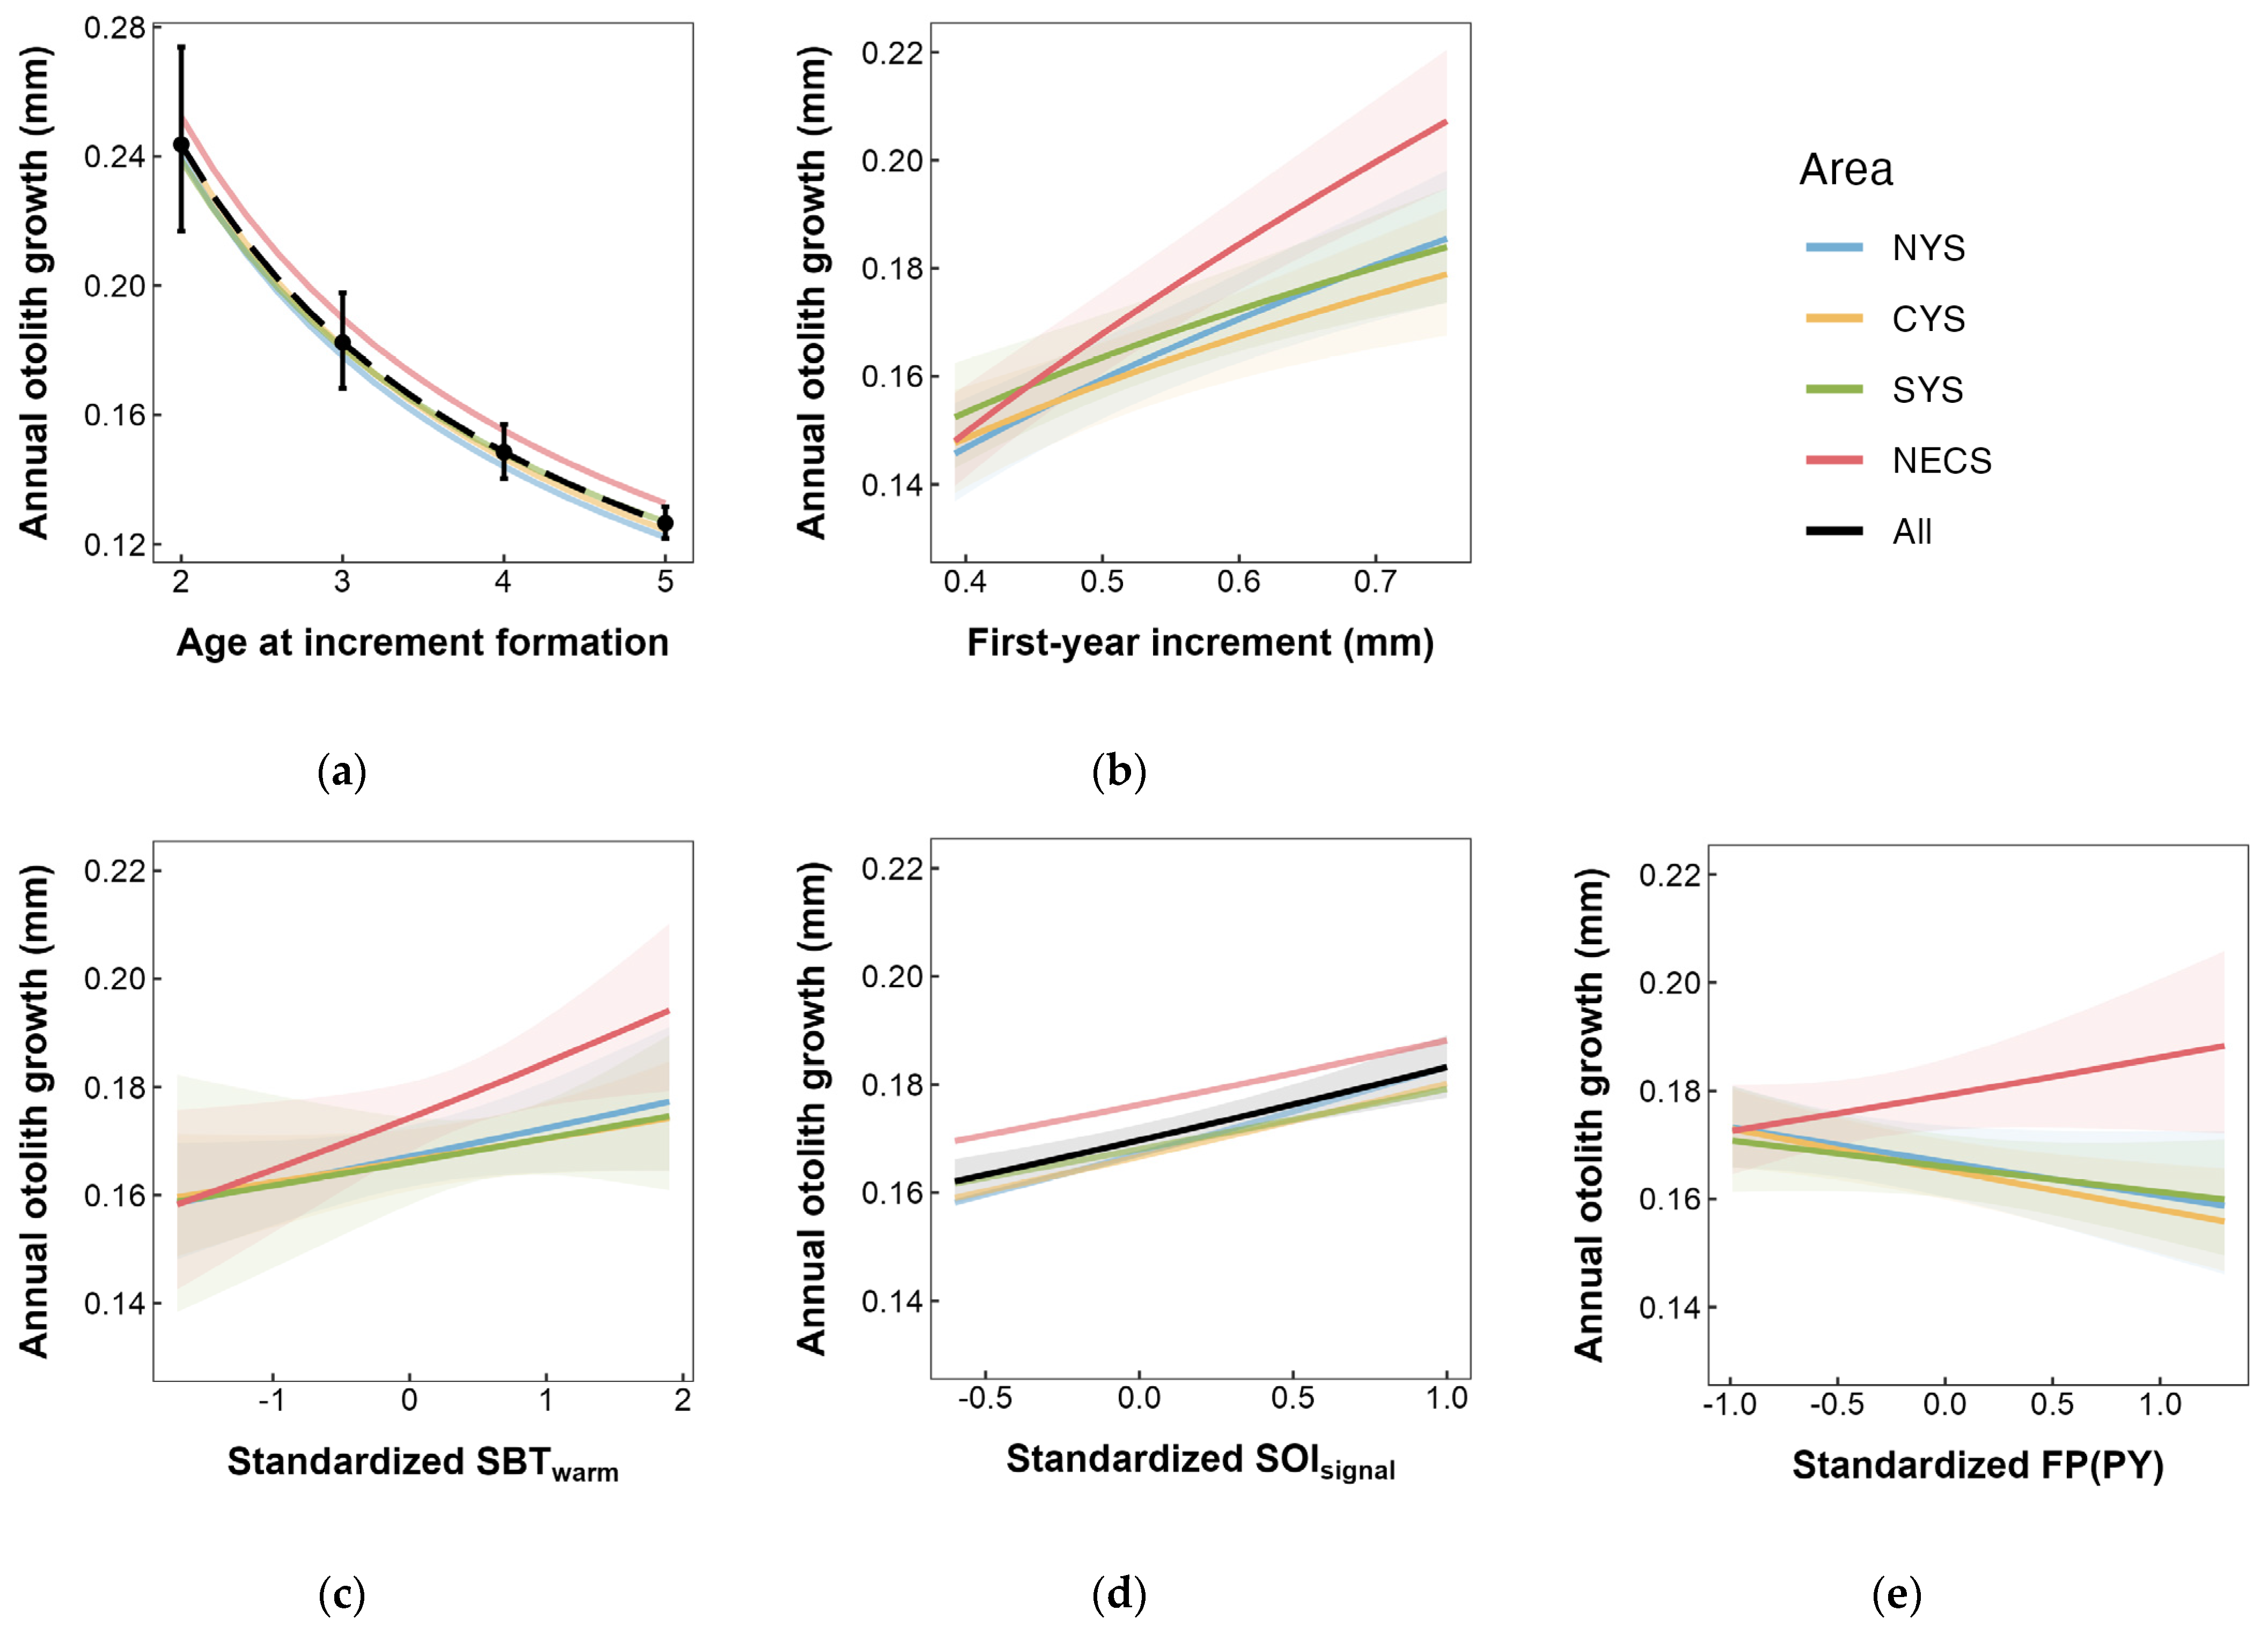
Disclaimer/Publisher’s Note: The statements, opinions and data contained in all publications are solely those of the individual author(s) and contributor(s) and not of MDPI and/or the editor(s). MDPI and/or the editor(s) disclaim responsibility for any injury to people or property resulting from any ideas, methods, instructions or products referred to in the content. |
© 2024 by the authors. Licensee MDPI, Basel, Switzerland. This article is an open access article distributed under the terms and conditions of the Creative Commons Attribution (CC BY) license (https://creativecommons.org/licenses/by/4.0/).