Article

Simple Model for Tc and Pairing Symmetry Changes in Sr2RuO4 Under (100) Uniaxial Strain

1
H. H. Wills Physics Laboratory, University of Bristol, Tyndall Ave, Bristol BS8 1TL, UK
2
Institute of Physics, Johannes Gutenberg University Mainz, Staudingerweg 7, 55128 Mainz, Germany
*
Author to whom correspondence should be addressed.
Condens. Matter 2024, 9(4), 44; https://doi.org/10.3390/condmat9040044
Submission received: 30 September 2024 / Revised: 17 October 2024 / Accepted: 23 October 2024 / Published: 1 November 2024
(This article belongs to the Special Issue Superstripes Physics, 3rd Edition)

Abstract

:
Uniaxial strain in the (100) direction has the effect of increasing the superconducting T c in Sr2RuO4 from 1.5 K to over 3 K. The enhanced T c corresponds to a Lifshitz transition in the Fermi surface topology of this unconventional superconductor. We model this using a simple two-dimensional one-band model for the γ sheet of the Fermi surface. This reproduces the experimental T c results well if we assume a d x 2 y 2 singlet pairing state. On the other hand, the triplet state p x + i p y does not show any distinct peaks in T c associated with the Lifshitz transition. A mixed symmetry state pairing of the form d + i g can both describe the T c changes and show a distinct transition temperature for time-reversal symmetry breaking (TRSB).

1. Introduction

The unconventional superconductivity of Sr 2 RuO 4 has been intensively studied for more than two decades [1,2,3]. The material was initially of interest as a layered perovskite structurally similar to the high T c cuprate superconductors. Although the superconducting T c was limited to 1.5 K, the fact that the normal state was clearly a Fermi liquid led to an early proposal by Rice and Sigrist that this material could be regarded as a solid state analogue of superfluid 3He [4]. Weak coupling spin-fluctuation-driven pairing was shown to lead to both spin singlet d-wave and spin triplet p-wave [5,6,7,8]. More recently, a better understanding of the normal state as a strongly correlated Hund metal has emerged from Dynamical Mean Field and Numerical Renormalization Group (NRG) methods. This correlated normal state also has instabilities towards various superconducting symmetry states of both singlet and triplet pairing [9,10,11,12].
Experimentally, it has also proved surprisingly difficult to determine the pairing state fully. The strong sensitivity of T c to non-magnetic impurity disorder [13] confirmed an unconventional pairing state. Evidence for a vertical line node in the gap emerged from both specific heat experiments [14] and thermal conductivity [15]. More recently, quasiparticle interference experiments uniquely pointed towards a line node structure consistent with a bulk d x 2 y 2 pairing state [16]. However, it has proved difficult to also rule out completely the possibility of a horizontal line node [3]. A spin singlet state, such as d-wave, is consistent with the most recent Knight shift and spin susceptibility and experiments [17,18,19,20].
However, another set of experiments appear inconsistent with this d x 2 y 2 pairing state, at least in its simplest form. Evidence for a time-reversal symmetry breaking state (TRSB) was first seen in μ SR [21] and later in the Kerr effect [22]. TRSB requires a pairing state with two degenerate or near-degenerate components, and evidence for such degeneracy was reported in [23,24]. A possible d-wave state with TRSB would be the E g symmetry state, d x z + i d y z [25]. However, this state requires by symmetry a horizontal line node in the plane k z = 0 , not a vertical one. But detailed models suggest that this d x z + i d y z state could have a vertical gap minimum on at least one of the Fermi surface sheets [20,25] in the location indicated by the quasiparticle interference experiments [16]. A very different route to reconciling the vertical line node with TRSB, suggested by Kivelson et al. [26], was a state of the form d + i g . This mixes two distinct symmetries of the BCS gap equation, B 1 g and A 2 g , which are not normally degenerate in a tetragonal crystal, and so it is necessary to assume that, for microscopic reasons, they become degenerate or nearly degenerate because of specific features of the fundamental electronic structure of Sr 2 RuO 4 .
An alternative set of constraints on the pairing state in bulk Sr 2 RuO 4 are provided by uniaxial strain experiments, especially the application of ( 100 ) strain [27,28,29,30,31,32,33]. Remarkably, a uniaxial strain of about 0.6 % , either compressive or expansive, is sufficient to increase the superconducting T c from 1.5 K to about 3.5 K [27,28]. The maximum T c coincides with a Lifshitz topological Fermi surface transition, in which the γ Fermi surface sheet changes from a closed cylinder around Γ to become open [29,34,35]. Furthermore, the ( 100 ) uniaxial strain separates the superconducting state T c from the temperature where TRSB becomes apparent [32]. In principle, such a splitting would be expected in a pairing state of E g or E u character, such as d x z + i d y z or p x + i p y , where the degeneracy of the order parameter in the tetragonal crystal becomes broken. However, such splitting of a symmetry required degeneracy would lead to a linear change in T c for small ( 100 ) strains, which is not consistent with the quadratic behaviour observed [36]. On the other hand, an accidental degeneracy (such as d + i g ) would most likely become split by either hydrostatic pressure or disorder, which is not seen in experiments [37]. Finally, it is also surprising that uniaxial compression along the c-axis does not significantly increase T c , despite the fact that this strain should also move the Fermi surface towards a Lifshitz transition [38].
The purpose of this paper is to examine the effect of ( 100 ) strain in Sr 2 RuO 4 using a simple theoretical framework suggested by Fermi liquid theory, inspired by the original Fermi liquid approach to the phases of superfluid 3He [39]. To apply these simple but general methods, we first simplify the Fermi surface to a two-dimensional one-band model describing the γ Fermi surface sheet. With this model, we study the changes in T c induced by uniaxial strain for a variety of different pairing models. Under the assumption that the effective electron–electron pairing interaction is unchanged during the Lifshitz topological transition, the model becomes independent of specific microscopic details of the pairing interaction. This approach allows us to make a direct link between changes in T c and a pairing symmetry weighted density of states (DOS) at the Fermi level. The largest changes in T c (consistent with experiments) are seen for the states with the largest weighted DOS, while pairing states with gap nodes at the Lifshitz transition point show small or no increases in T c . The simple model results are compared with both experiments and multi-band theories [40,41,42,43,44].
The structure of this paper is as follows. We first present our Fermi surface model, derived from fitting ab initio DFT band structures for strained and unstrained Sr 2 RuO 4 . We develop the BCS-like gap equation for different pairing symmeties, relating T c to the appropriate weighted DOS. The main results for T c in each pairng channel of interest are presented in Section 3. Finally, we explore the case where two distinct pairing symmerties are degenerate in unstrained Sr 2 RuO 4 so that the unstrained material has a TRSB temperature identical, or close to, the superconducting T c . We examine in detail the cases of d + i g mixed symmetry pairing with such a near degeneracy.

2. Materials and Methods

2.1. Normal State Band Structure

The starting point for our work is a tight binding fit to the band structure as the system goes through the Lifshitz transition under ( 100 ) applied strain. Using the PBE96 [45] DFT energy functional and the all-electron LAPW Elk code [46], we find that the zero strain optimised crystal structure parameters for Sr2RuO4 are given by a = 0.38895 nm and c = 1.2922 nm, which are close to the experimental values of a = 0.3862 and c = 1.2722 nm [47].
The internal Wykoff structure parameters are z ( O 2 ) = 0.1619 and z ( S r ) = 0.3528 , compared to 0.16210 and 0.35298 , respectively [47]. This is comparable to many earlier DFT calculations, for example, Refs. [48,49]. The calculated Fermi surface and band structure are well known from previous work, but for completeness, they are shown here in Figure 1.
Under ( 100 ) uniaxial strain, the Fermi surface distorts and passes through a Lifshitz topological transition, as shown in Figure 2. This shows the Fermi surface under either a 2 % compressive or expansive strain along the crystal a-axis, ϵ x x = 0.02 . The corresponding b-axis strain was chosen as ϵ y y = ± 0.008 based on a Poisson ratio of 0.4 [50]. As can be seen in Figure 2a, a 2 % compression along a leads to an opening of the Fermi surface along the b direction, as a result of lattice expansion in that direction. Conversely, Figure 2b shows that a 2 % expansion of a (with a corresponding reduction of b by about 0.8 % ) now opens up the γ band Fermi surface cylinder along the a direction in the Brillouin zone. Figure 2c shows the band structure in the compressive strain case. In comparison to the unstrained band structure, Figure 1d, one can see that the band peak along the Γ M Σ line has moved below the Fermi level at point k = ( 0 , π / b , 0 ) . This k point is, therefore, the point where a Lifshitz topological change in Fermi surface geometry occurs. This Lifshitz transition will also coincide with a corresponding van Hove peak in the density of states (DOS), which, in turn, will be expected to lead to changes in the superconducting transition temperature T c , as observed experimentally [27].
The Fermi surface and band structure changes under strain shown in Figure 2 are consistent with both earlier DFT calculations and direct measurements using ARPES [30,35]. Although the DFT calculations do not include strong correlation effects, as, for example, studied in Ref. [41], the Fermi surface of both distorted and undistorted lattices evolves in a way consistent with experiments. While the unstrained bulk Fermi surface topology is well described, the DFT band structure in bulk is well known to overestimate the bandwidth by about a factor of 3 for the γ -band compared to experiments [1]. Our DFT total energy calculations also overestimate the stress corresponding to the critical strain to be about 2–3 GPa, compared to the experimental value of 0.75 GPa [32].
DFT + DMFT calculations [30] for strained Sr2RuO4 show that strong Coulomb correlations make the unstrained system closer to the Lifshitz transition than the DFT calculations, such as those shown in Figure 2, alone would predict.

2.2. γ -Band Tight Binding Model

The changes in the Fermi surface under strain, as shown in Figure 1 and Figure 2, show that among the three Fermi surface sheets, it is only the γ -band that changes significantly. Therefore, it seems natural to focus on superconductivity within the γ -band in developing a simple model of the dominant strain effects on T c . The idea that only one of the three Fermi surface sheets in Sr2RuO4 is dominant in driving the system towards the superconductivity has been discussed for many years [51]. More recent theories [9,10,11,12] of unstrained Sr2RuO4 show that all bands are closely coupled in the superconducting state below T c . Nevertheless, it is a plausible model to suggest that, specifically at T c , one of the bands has a stronger tendency to Cooper pairing than the others, even if the dominant pairing interaction itself arises from a combination of spin fluctuations within all three bands. In this picture, the linearized gap equation at T c would have a dominant eigenvector which has the majority of its weight on the dominant band. The gap on the other bands would be smaller initially at T c but would grow rapidly below T c due to interband coupling within the non-linear gap equation. If the γ -band did not have such a dominant role in determining T c , then it seems unlikely that a Fermi surface change affecting essentially only the γ -band could increase the critical temperature so significantly. In contrast to other multi-band theories [42,44] of strain-induced changes in T c , we therefore focus on a γ -band-only model. A previous one-band theory [52] was based upon a generic model of a circular Fermi surface, rather than a realistic model of the γ -band.
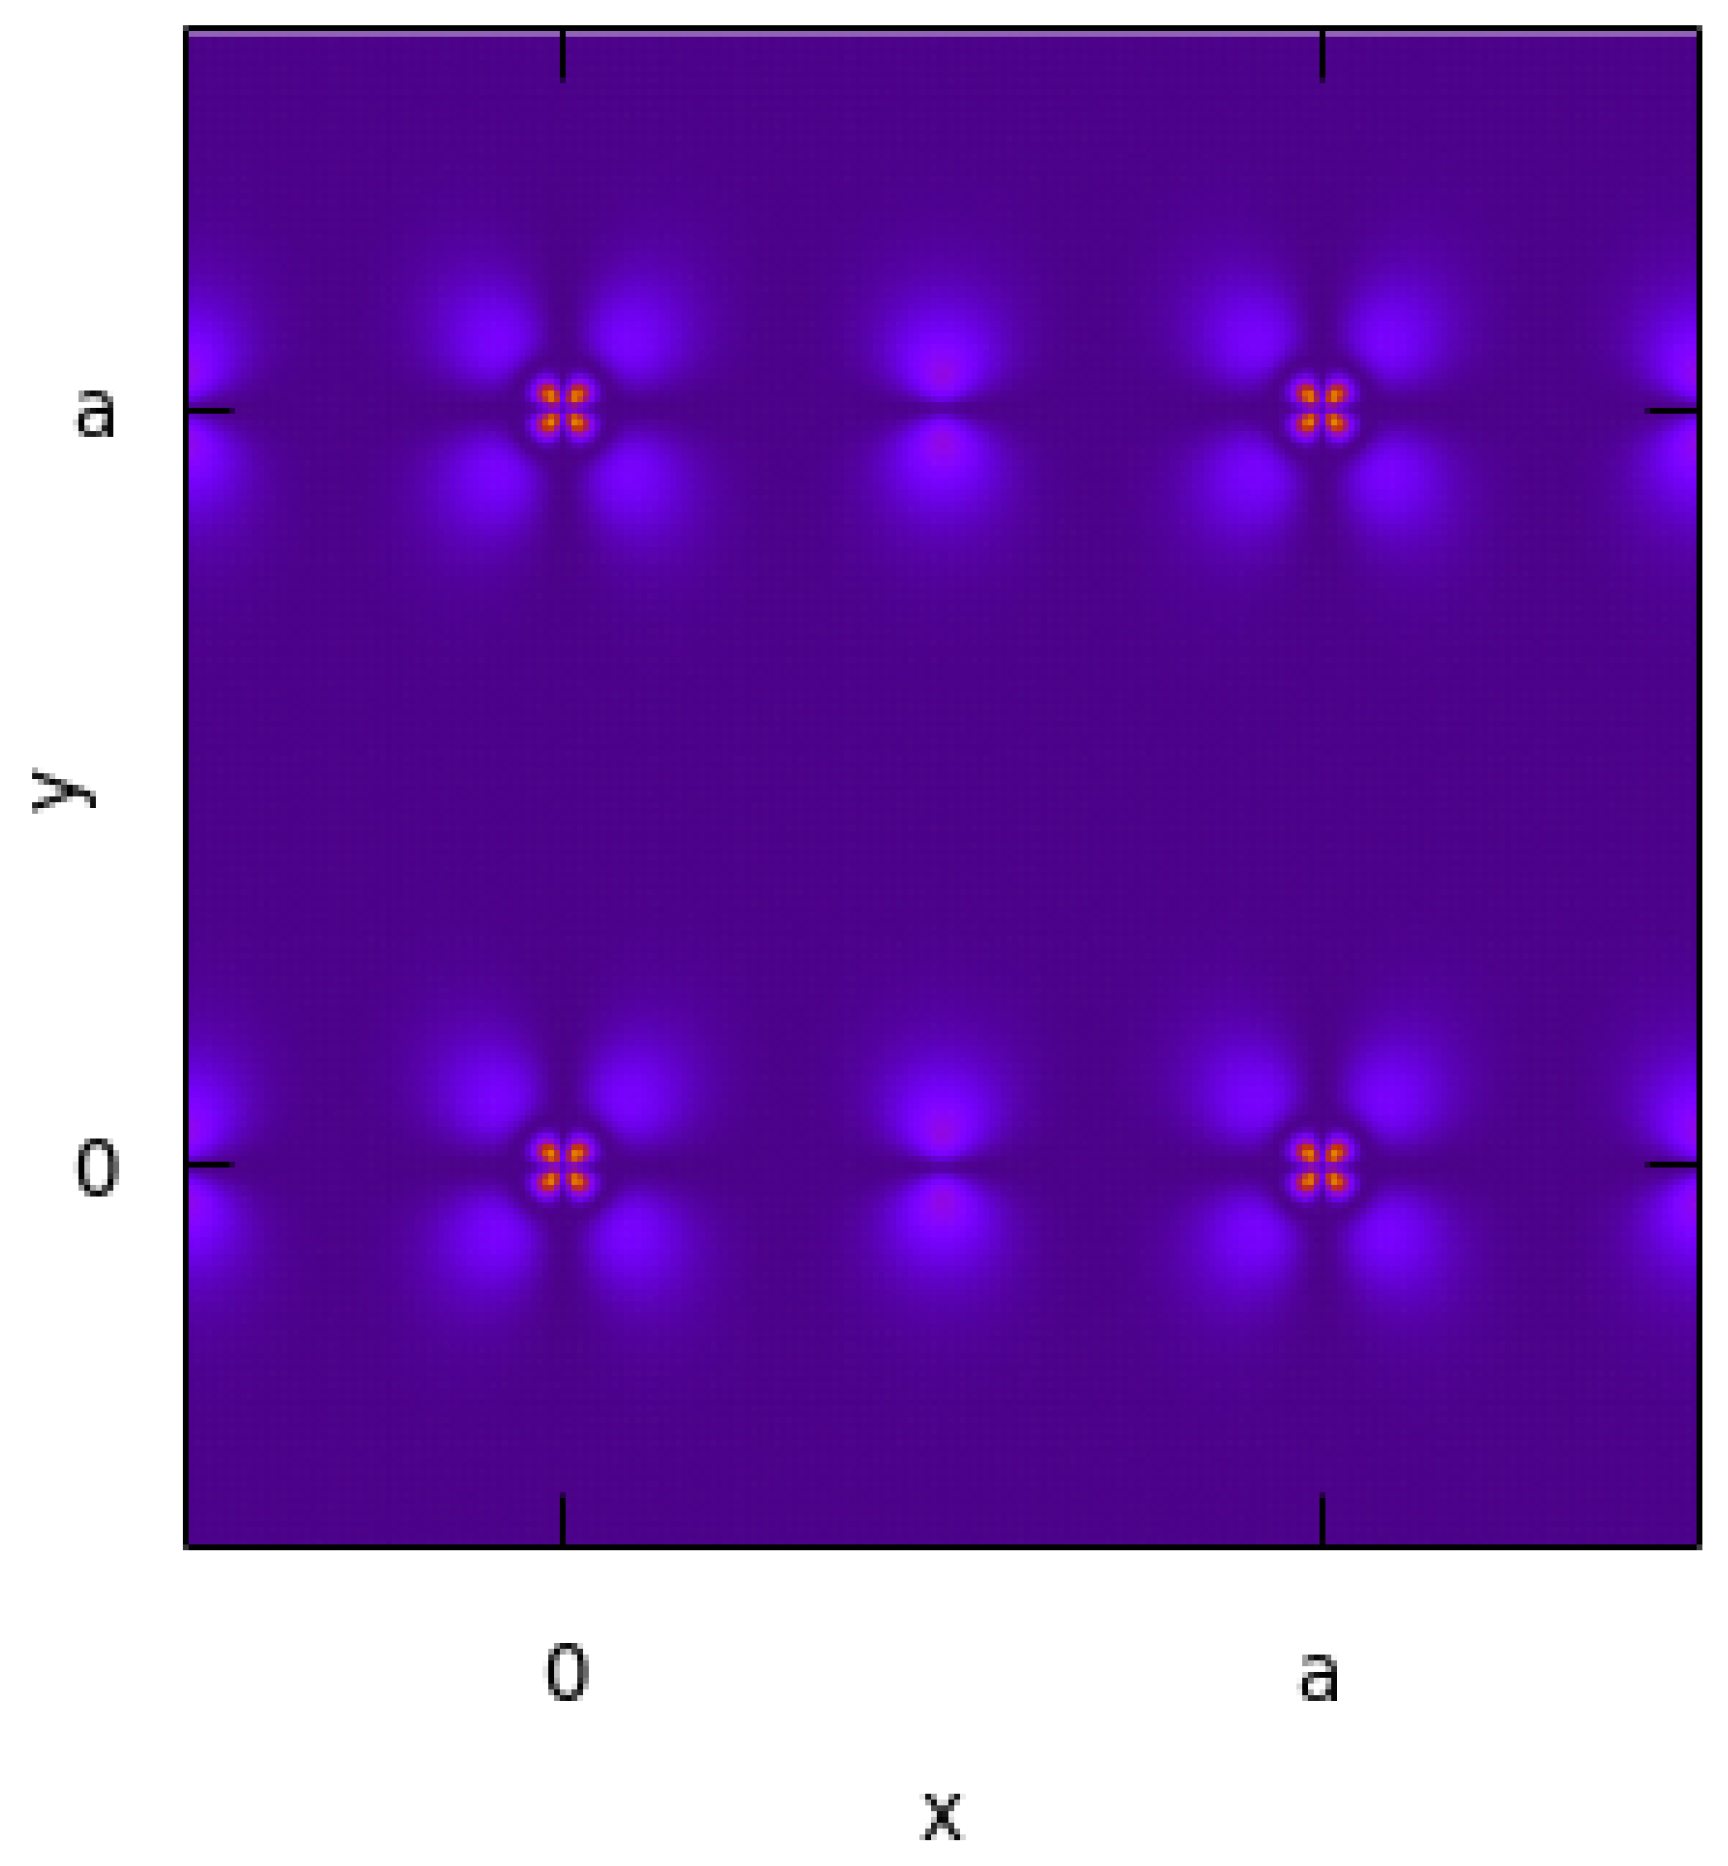
With this motivation, we therefore make a tight binding fit to the γ -band of Sr2RuO4. The γ -band is predominantly derived from the R u d x y orbitals hybridized with neighbouring in-plane oxygen atoms. First, it is useful to directly examine the Bloch function at the Lifthitz transition point k = ( π / a , 0 , 0 ) , as shown in Figure 3. In this wave function density plot, we can clearly see the d x y orbital symmetry at each Ru atom in the a b plane. We can also see the in-plane p y orbitals of the oxygen atoms at ( a / 2 , 0 , 0 ) , forming a π -bonded band with hopping along the k x direction. The corresponding p x orbitals of the oxygen atoms at ( 0 , a / 2 , 0 ) cannot be seen, which is because these coincide with a line node of the wave function at y = a / 2 . This nodal line is required by symmetry. The nodal lines of the d x y Ru orbitals at y = 0 and y = a combined with translational symmetry along y ( k y = 0 ) force an additional nodal line at y = a / 2 . There is no corresponding nodal line at x = a / 2 because the Bloch wave crystal momentum k x = π / a changes the wave function sign between the d x y Ru orbital at ( 0 , 0 , 0 ) and its neighbour along x at ( a , 0 , 0 ) , removing the need for an additional node between these atoms.
This pattern of nodal lines, shown in Figure 3, has an important implication for the Lifthitz topological transition with strain. The nodal lines prevent direct interplane hopping between d x y Ru orbitals in adjacent planes, making this Lifthitz topological transition point essentially a purely two-dimensional band structure feature. To see why, we can note that the nodal lines in Figure 3 imply that interlayer hopping is forbidden at this critical k -point. This is because the pattern of nodes at the Ru atoms in the basal plane (two perpendicular nodal lines, x = 0 , y = 0 ) is orthogonal to the pattern of nodes at the Ru atoms in the next layer of the body-centred tetragonal crystal structure. At x = a / 2 , y = a / 2 . We see in Figure 3 a horizontal line node at y = a / 2 , but no corresponding vertical line node along x = a / 2 . The wave function shown in the figure is, therefore, orthogonal to its corresponding counterpart in the neighbouring Ru planes at z = ± c / 2 . Because of this, the Lifshitz transition wave vectors k = ( π / a , 0 , 0 ) and k = ( 0 , π / a , 0 ) , exactly coincide with nodes in the c-axis interlayer hopping, giving the Lifshitz topological transition an almost purely two-dimensional character. It also follows that the corresponding peak in the density of states at the transition point will more closely correspond to a two-dimensional van Hove singularity (logarithmic divergence) rather than a three-dimensional one (square root singularities) expected in a typical three-dimensional band structure.
Considering only the γ -band, a standard tight-binding expansion of the band structure takes the form
ε k = ε 0 2 t 0 cos ( k x a ) + cos ( k y a ) 4 t cos ( k x a ) cos ( k y a ) 8 t cos ( k x a 2 ) cos ( k y a 2 ) cos ( k z c 2 ) 2 t z cos ( k z c ) .
As expected from the arguments given above, the nearest-neighbour interlayer hopping term vanishes when k x = π / a or k y = π / a . The only remaining term for band dispersion along k z is direct hopping along the c-axis between second neighbour planes, indicated by the term t z above. This hopping is expected to be very small, both because of the large distance between these planes ( c = 1.2 nm, in contrast to the in-plane lattice constant of a = 0.39 nm), and also because the Ru d x y orbital symmetry forbids any direct hopping to the p-orbitals of the apical oxygen. The extreme two-dimensionality of the band structure is apparent in Figure 1b, which is a direct c-axis projection of the Fermi surface. Some dispersion in the γ -band is visible at the Fermi surface in the Γ X direction (visible as a widening of the Fermi surface line here), but no such dispersion is visible for the γ band near the Lifshitz transition points k = ( π / a , 0 , 0 ) and k = ( 0 , π / a , 0 ) . The tight binding band structure fit using Equation (1) is shown in the blue line in Figure 1c, where the parameters were chosen to be ε 0 = 393 meV, t 0 = 245 meV, and t = 110 meV. The effects of the k z dispersion in the γ -band are estimated by fitting the DFT band dispersion with k z along the lines k = ( π / a , 0 , k z ) and k = ( 0.8 × π / a , 0 , k z ) , giving t 6 meV and t z 3 meV. These parameters are similar to the d x y hopping parameters found in previous fits of all three bands, e.g., Ref. [49]. The effects of inter-orbital hybridization between the Ru d x y - and d x z / d y z -derived α and β bands are strictly zero in the planes k z = 0 and k z = 2 π / c because the crystal lattice mirror planes z = 0 , z = c / 2 , etc. (in the absence of spin–orbit coupling). In the k z = 0 plane, as shown in the band structure in Figure 1d, spin–orbit coupling does have a significant effect on the bands along the Γ X direction; however, the effect of spin–orbit coupling is entirely concentrated in this part of the band structure and there is no significant spin–orbit effect on the band structure along the Σ line, or near the Lifshitz transition points [48,53]. For this reason, we do not explicitly include a SOC term within the band fitting model, although the fitted band dispersion ε ( k ) along the Γ X line in Figure 1d was calculated including SOC.
We fit the uniaxially strained band structure, Figure 2c, by simply assuming a small linear change in the nearest-neighbor hopping integrals. Considering only the γ -band, a standard tight-binding expansion of the band structure takes the form
ε k = ε 0 + δ ε 0 2 ( t 0 + δ t x ) cos ( k x a ) + ( t 0 + δ t y ) cos ( k y b ) 4 ( t + δ t ) cos ( k x a ) cos ( k y b ) ,
where, for simplicity, we now drop the small k z dispersion terms. For the 2 % compressive strain corresponding to Figure 2a,c, we find that a good fit is obtained with δ ε 0 = + 36 meV, δ t x = 0.17 t 0 , δ t y = 0.4 × 0.17 t 0 , and δ t 0 . The factor of 0.4 is consistent with the Poisson ratio of 0.4 [50] used in the strained lattice structure. Again, this single-band fit is consistent with the d x y component of earlier multi-band tight binding models of strained Sr2RuO4, e.g., Refs. [28,40].
Equation (2) will provide our model of the γ -band structure changes as a function of strain. We will assume that the nearest-neighbour hopping parameters vary linearly with strain given by
δ t x = 8.5 ϵ x x t 0 δ t y = 8.5 ϵ y y t 0 = 0.4 δ t x
with δ t 0 . The only remaining strain-dependent band parameter, δ ε 0 , can be found for any given value of the strain by the assumption that the total band occupancy of the γ -band does not change significantly near the Lifshitz transition point. We therefore choose δ ε 0 to ensure a constant occupancy for the γ -band,
N e = 2 k f ( ε k ) ,
where f ( ε k ) is the Fermi–Dirac function, and the Fermi energy is always set to zero. This simplifying assumption has also been used in earlier models, e.g., Ref. [28], and its accuracy is confirmed directly in ARPES experiments [35].

2.3. Fermi Liquid Theory and Pairing

Using the band structure model in Equation (2), we introduce superconductivity via the usual BCS gap equation,
Δ k = k V k , k Δ k E k ( 1 2 f ( E k ) ) .
Here, as usual, E k = ε k 2 + | Δ k | 2 and f ( E k ) is the Fermi–Dirac function evaluated at eigenenergy E k . For simplicity, we omit spin indices, assuming that the pairing state is opposite spin pairing ( ) type, which is valid for all the singlet and chiral p-wave p x + i p y states of interest. The case of opposite spin pairing ( and ) is assumed to be ruled out for Sr2RuO4 by the Knight shift measurements [17,18,19,20].
We assume that the pairing interaction has its origin in the strong electronic correlations, rather than electron–phonon interaction, and corresponds to the effective interactions within a Landau Fermi liquid state, or Hund metal, derived from intra-atomic and inter-atomic spin fluctuations within the Ru d-bands. These spin fluctuations appear in the spin response functions as a broad incommensurate background as well as specific peaks associated with nesting vectors of the Fermi surface, such as Q = ( 2 3 π / a , 2 3 π / a ) [5,6,7,8].
To analyse different Cooper pair symmetries, it is useful to redefine the pairing interaction into symmetry distinct pairing channels. In superfluid 3He, the Landau Fermi liqud parameters are described by various spherical harmonics [39]. Here, we must use the corresponding cubic harmonics of the crystal point group. Noting that the pairing interaction is a linear integral operator in k -space, it is possible to rewrite V k , k as a sum of diagonal terms corresponding to its eigenvectors,
V k , k = i U i Γ i ( k ) Γ i ( k ) .
The properties of the group representations will ensure that the eigenvectors Γ i ( k ) can be classified according to the different irreducible group representations of the appropriate symmetry group. For body-centred tetragonal Sr2RuO4, the eigenfunctions Γ i ( k ) can be chosen as real-valued functions for the cases of the D 4 h and D 2 h point groups for unstrained and strained crystals. The corresponding eigenvalue, U i , is the effective pairing strength in that symmetry channel.
In general, the BCS gap function can be a superposition of eigenvectors,
Δ k = i Δ i Γ i ( k ) .
However, at T c , the BCS gap equation becomes linear and therefore T c is defined in terms of the eigenfunction with the largest eigenvalue. We recover the usual BCS expression for T c ,
1 = U i 2 ρ ( ε ) 1 ε ( 1 2 f ( ε ) ) d ε ,
but where the effective density of states is weighted by the eigenvector Γ i ( k ) of the specific pairing channel which becomes non-zero at T c ,
ρ ( ε ) = k Γ i ( k ) 2 δ ( ε ε k ) .
Note that if there are two degenerate eigenvalues (either a degeneracy required by symmetry or accidental), Equation (8) remains valid to define T c . However, the full non-linear BCS gap equation is then required to determine the nature of the gap function (e.g., p x + i p y or d + i g , etc.) below T c . For simplicity, in Equation (8), we neglect retardation, on the basis that the energy scale of magnetic fluctuations in a Hund metal, J, is large compared to the energy scale of the pairing and the effective J may even be comparable to the electronic quasiparticle bandwidth, which is renormalized down by a factor of 3 from the original DFT bandwidth [1].
In principle, we have an infinite set of eigenvectors for each symmetry channel. But if we assume a short-ranged pairing interaction in real space, e.g., from spin fluctuations between nearby R u  d-orbitals, we can represent the gap function Δ k with the simplest Fourier expansion consistent with the relevant crystal point group symmetry. This then gives the set of functions given in Table 1.
In Table 1, we have only included pairing states which can be obtained in a purely two-dimensional band structure. Therefore, we do not include pairing states of the E g form d x z + i d y z [20,44]. We also omit triplet pairing states of and type, such as B 1 u and B 2 u , which appear to be ruled out by Knight shift experiments [17,18,19,20].

3. Results

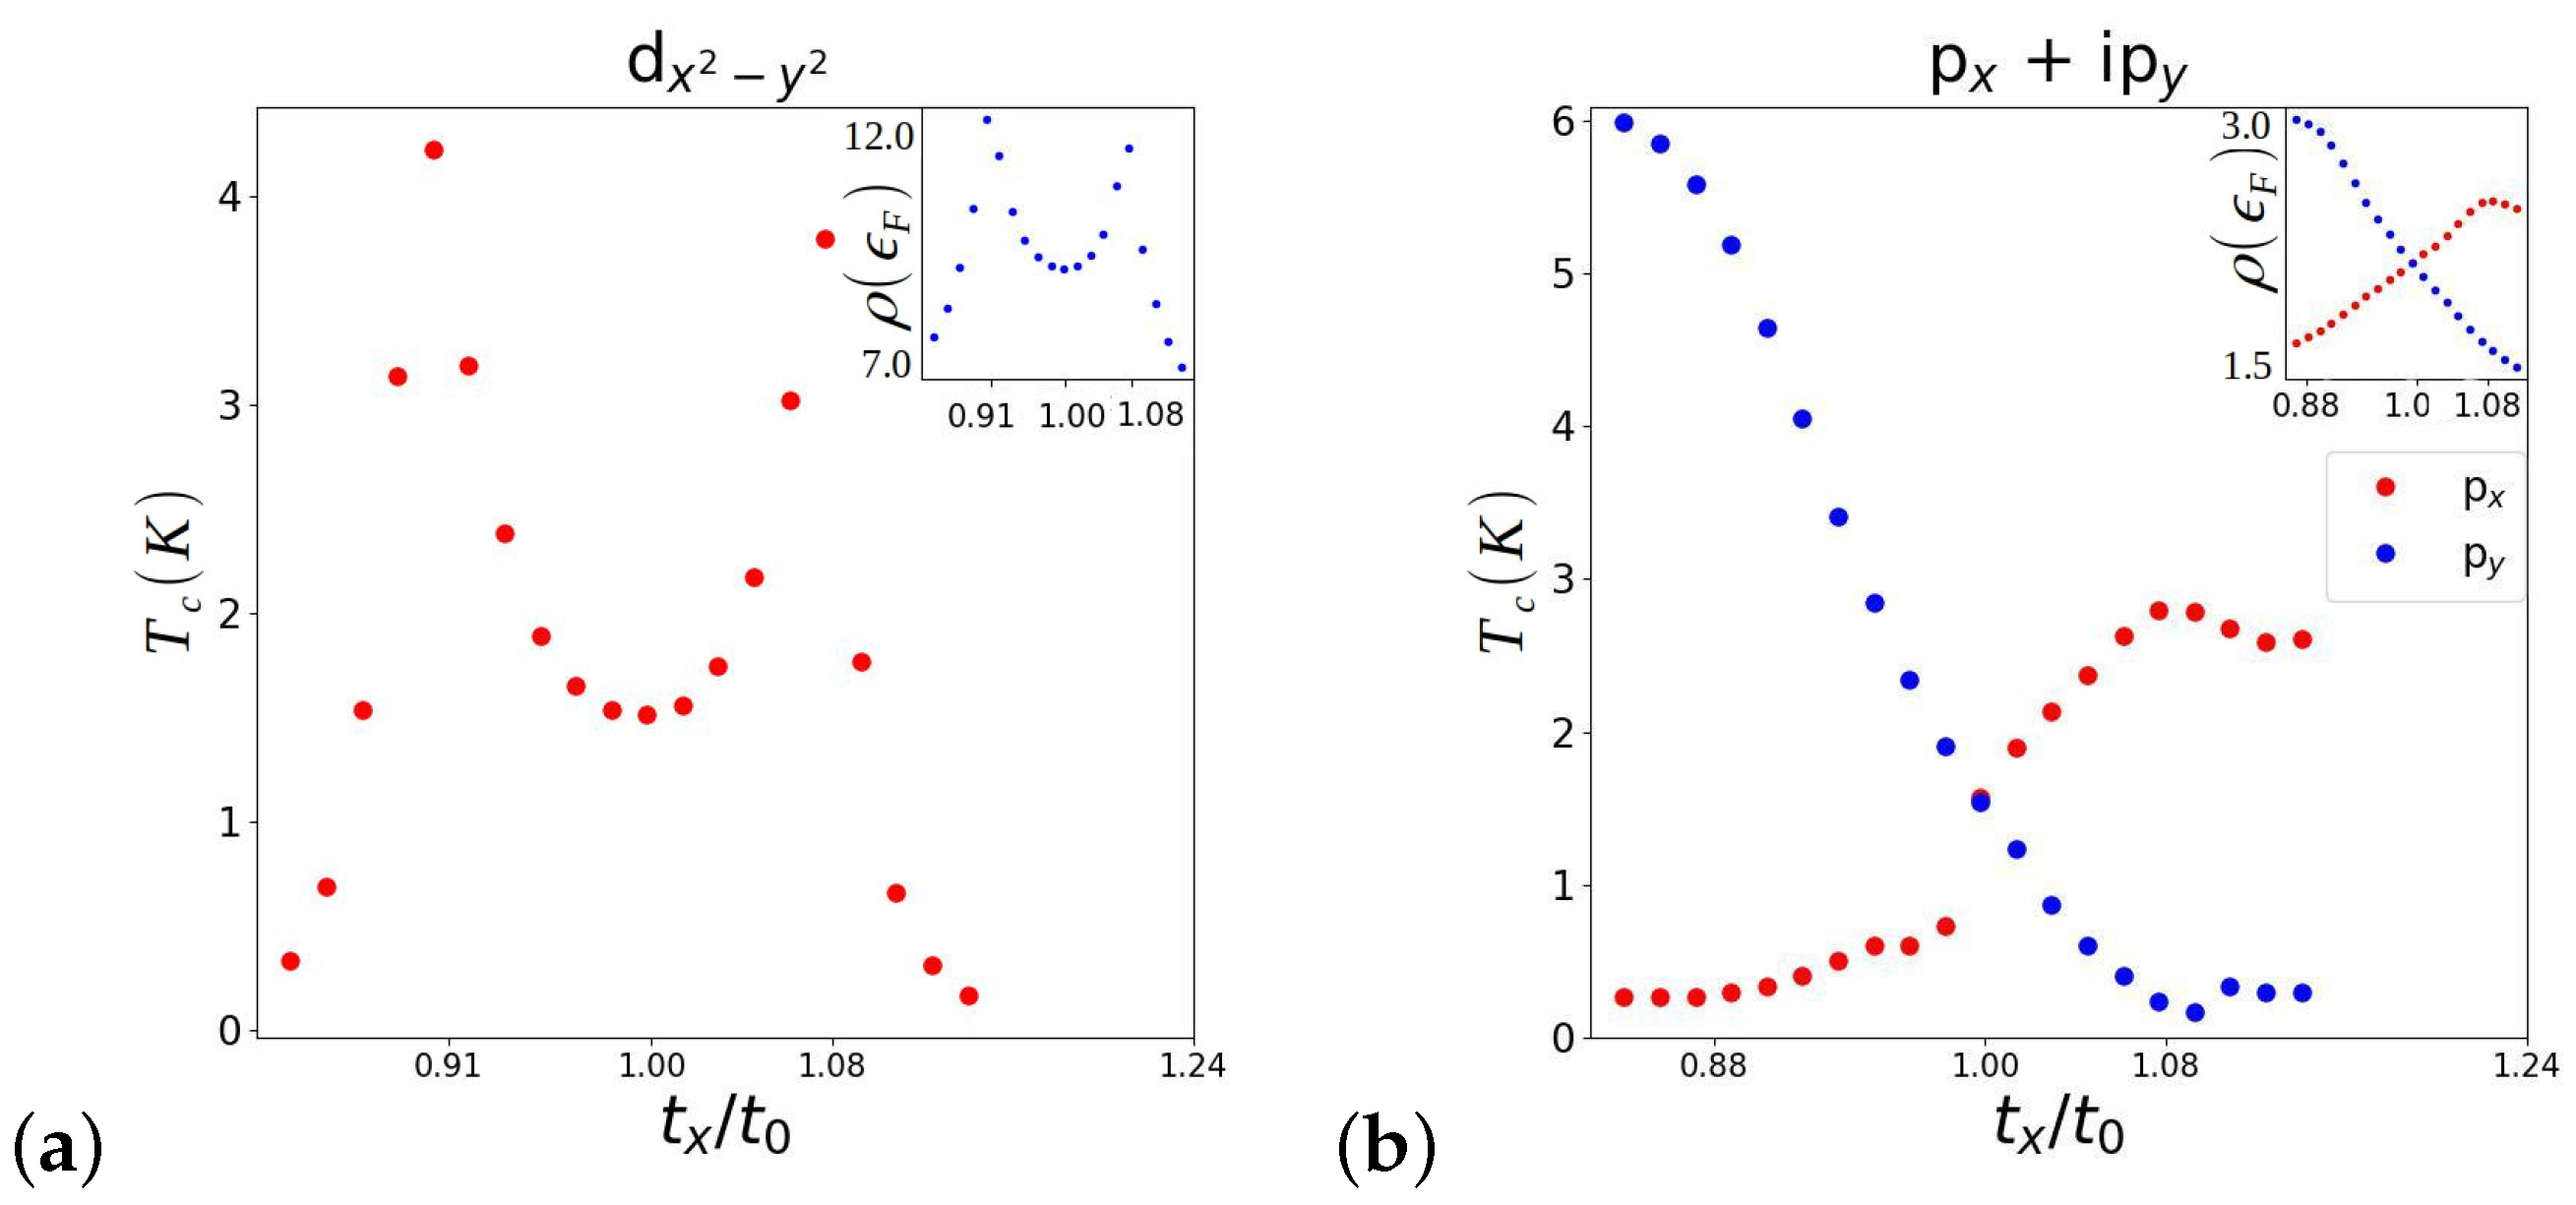
Figure 4 shows our main results for T c under different pairing models from Table 1. In Figure 4a, we show the corresponding expected changes in T c assuming d x 2 y 2 pairing. We set the effective d-wave pairing interaction U to give T c = 1.5 K in the unstrained case. Applying uniaxial strain by changing the t x and t y hoppings, as described above, leads to maxima in T c as a function of strain for both compressive and expansive uniaxial ( 100 ) strain. There is a slight asymmetry between the expansive and compressive T c maxima, but, in both cases, the maximum T c is 3.5 K or higher, similar to the value seen experimentally [27]. As expected, the peaks in T c correspond to van Hove peaks in the d-wave-weighted density of states at the Fermi level, ρ ( ε F ) .
Very different behaviour is seen in Figure 4b, in the case of p x + i p y chiral p-wave pairing. There are two T c values corresponding to the two different basis functions sin ( k x a ) and sin ( k y b ) . These are degenerate in the unstrained case. Then, under strain, one of these T c values increases while the other decreases. The change in T c is linear for small strains, leading to a cusp-like change in T c as a function of uniaxial strain. As noted above in the introduction, such a cusp-like feature is not seen experimentally [36]. Although the calculated maximum T c rises for both signs of the strain, there are no clearly defined peaks in T c , and there is a significant asymmetry which is quite different from what is observed [27]. There are also no distinct van Hove-like peaks in the weighted DOS at the Fermi level.
The origin of the different behaviours for T c and ρ ( ε F ) , shown in Figure 4, is explored more fully in Figure 5. The d-wave-weighted DOS shown in Figure 5a has a distinct van Hove peak, which passess through the Fermi energy at the critical value of strain where the Lifshitz transition occurs. The gap nodes of the d-wave function, shown in the inset, are located along the Γ X directions in the Brillouin zone, and so are far from the Lifshitz transition points k = ( π / a , 0 , 0 ) and k = ( 0 , π / b , 0 ) . In contrast, for the p x and p y weighted DOS, no van Hove peaks are visible at all. Under compressive ( 100 ) strain, the p x weighted DOS shows an increase at ε F , but no sharp peak. The p y -weighted DOS at ε F decreases with strain with no van Hove peak. Overall, these lead to the increase in T c for p x and the suppression of T c for p y visible in Figure 4b. The insets to Figure 5b,c show that the absence of any distinct van Hove peak in the weighted DOS is because of the nodal structres of the p x and p y functions. In this compressive strain case, where the Lifthitz transition occurs at k = ( 0 , π / b , 0 ) , this point obviously lies on the nodal line of p x ( k x = 0 ). The fact that this Lifshitz point is also a nodal point of p y is more subtle. p y has an obvious nodal line along k y = 0 . However, the condition of periodicity in the extended Brillouin zone ( Δ k = Δ k + G , where G is a reciprocal lattice vector) forces an additional nodal line to occur at k y = π / b , exactly running through the Lifshitz transition point. The effect of this node is clear in the inset to Figure 5c.
Overall, from the above discussion, it is clear that the d x 2 y 2 pairing model provides a much better description of the T c changes under uniaxial ( 100 ) strain than the chiral p x + i p y model. However, the pure d-wave case has no TRSB. To include a state with TRSB, we therefore model a d + i g pairing state of the general type proposed by Kivelson et al. [26]. The results for this mixed symmetry state are shown in Figure 6. We can see in the figure that the mixed symmetry pairing state retains the two distinct maxima in T c , consistent with experiment. The second transition where the g-wave component first becomes non-zero is assumed degenerate with the d-wave case for the unstrained case, but then it is suppressed slightly for both compressive and expansive uniaxial strains. For both expansive and compressive strains, in our model, there is a second point of degeneracy where d and g pairing states cross, so that at larger strains, the higher T c state is a pure g-wave state. Near this crossover point, we can see competition between the two pairing channels where the one with the higher T c suppresses T c for the alternative pairing channel. The lack of a van Hove peak in the g-wave channel is apparent from its DOS and nodal structure, as shown in Figure 6b.

4. Discussion

The results presented here show that the changes in T c of Sr 2 RuO 4 under ( 100 ) uniaxial strain are most closely similar to the experiments [27] for the d-wave case than other scenarios, such as p x + i p y pairing. The p-wave model does not show distinct peaks in T c with strain, and has a cusp feature in T c in the small strain limit, which is not seen experimentally [36]. The pure d-wave case has no separate transition to TRSB, as found by [32]; however the d + i g state, proposed by Kivelson et al. [26] does allow for both the peaks in T c at critical strains for the Lifshitz transition and a distinct TRSB temperature. While the broad picture in Figure 6a looks similar to these experiments, there are some differences of detail, namely, that the temperature for TRSB is effectively independent of strain experimentally, while, in our model, TRSB is suppressed slowly as a function of uniaxial strain.
Our simple one-band model of the γ -band is unable to capture more complex multi-band pairing scenarios, such as those proposed in Refs. [40,41,42,43,44]. By examining only two-dimensional pairing states, we are also unable to consider alternative pairing states such as d x z + i d y z in our model. Despite these limitations, the simple model has some advantages. Firstly, the link between T c and a single weighted DOS is simple to understand in a one-band picture, but more complex in the case of multi-band pairing, since the relative weights of DOS on all three bands must be considered. Secondly, the one-band model has the advantage of being essentially parameter-free given the simple band model chosen. The only empirically chosen parameter is the choice of the Fermi liquid interaction parameter U i in the specific symmetry channel considered, chosen to give the observed T c = 1.5 K in the unstrained sample. In a multi-band model, there may be different parameters for intra-band pairing in each band as well as separate intra-band pairing parameters. In our model, the case of the d + i g pairing scenario does require some fine-tuning of parameters to obtain the assumed degeneracy of both pairing states in the unstrained case. It remains to be seen if such degeneracy occurs in more detailed microscopic pictures. The fact that no splitting of this degeneracy is observed experimentally for disordered samples or under hydrostatic pressure [37] remains unexplained, and is beyond the scope of the present paper. The simple one-band van Hove model here is also unable to explain the lack of enhanced T c under ( 001 ) compressive strain [38], as shown in detail in Ref. [54].

Author Contributions

The numerical results shown in Figure 3, Figure 4, Figure 5 and Figure 6 were obtained by M.C., under supervision by J.F.A. and M.G. The DFT band calculations shown in Figure 1, Figure 2 and Figure 3 were obtained by J.F.A. The manuscript was drafted by J.F.A. with corrections by M.C. and M.G. All authors have read and agreed to the published version of the manuscript.

Funding

This work was supported by the UK Engineering and Physical Sciences Research Council (EPSRC) grant EP/R513179/1 for the University of Bristol, Faculty of Science.

Data Availability Statement

The code used in this work is publicly available at: https://github.com/macauley-curtis/2D_Superconductor_strain_model (accessed on 22 October 2024).

Acknowledgments

This study was carried out using the computational facilities of the Advanced Computing Research Centre, University of Bristol, http://www.bris.ac.uk/acrc/ (accessed on 22 October 2024). M.G. thanks the visiting professorship program of the Centre for Dynamics and Topology at Johannes Gutenberg-University Mainz.

Conflicts of Interest

The authors declare no conflicts of interest.

Abbreviations

The following abbreviations are used in this manuscript:
TRSBTime-reversal symmetry breaking
DOSDensity of states
SOCSpin–orbit coupling
BCSBardeen–Cooper–Scrieffer

References

  1. Mackenzie, A.P.; Maeno, Y. The superconductivity of Sr2RuO4 and the physics of spin-triplet pairing. Rev. Mod. Phys. 2003, 74, 657–712. [Google Scholar] [CrossRef]
  2. Mackenzie, A.P.; Scaffidi, T.; Hicks, C.W.; Maeno, Y. Even odder after twenty-three years: The superconducting order parameter puzzle of Sr2RuO4. Npj Quantum Mater. 2008, 2, 40. [Google Scholar] [CrossRef]
  3. Maeno, Y.; Yonezawa, S.; Ramirez, A. Still Mystery after All These Years—Unconventional Superconductivity of Sr2RuO4. J. Phys. Soc. Jpn. 2024, 93, 062001. [Google Scholar] [CrossRef]
  4. Rice, T.M.; Sigrist, M. Sr2RuO4—An electronic analog of He-3. J. Phys.-Condens. Matter 1995, 7, L643–L648. [Google Scholar] [CrossRef]
  5. Mazin, I.I.; Singh, D.J. Competitions in layered ruthenates: Ferromagnetism versus antiferromagnetism and triplet versus singlet pairing. Phys. Rev. Lett. 1999, 82, 4324–4327. [Google Scholar] [CrossRef]
  6. Nomura, T.; Yamada, K. Perturbation theory of spin-triplet superconductivity for Sr2RuO4. J. Phys. Soc. Jpn. 2000, 69, 3678–3688. [Google Scholar] [CrossRef]
  7. Eremin, I.; Manske, D.; Ovchinnikov, S.G.; Annett, J.F. Unconventional superconductivity and magnetism in Sr2RuO4 and related materials. Ann. Phys. 2004, 13, 149–174. [Google Scholar] [CrossRef]
  8. Raghu, S.; Kapitulnik, A.; Kivelson, S.A. Hidden Quasi-one-dimensional superconductivity in Sr2RuO4. Phys. Rev. Lett. 2010, 105, 136401. [Google Scholar] [CrossRef]
  9. Røising, H.S.; Scaffidi, T.; Flicker, F.; Lange, G.F.; Simon, S.H. Superconducting order of Sr2RuO4 from a three-dimensional microscopic model. Phys. Rev. Res. 2019, 1, 033108. [Google Scholar] [CrossRef]
  10. Kugler, F.B.; Zingl, M.; Strand, H.U.R.; Lee, S.B.; von Delft, J.; Georges, A. Strongly Correlated Materials from a Numerical Renormalization Group Perspective: How the Fermi-Liquid State of Sr2RuO4 Emerges. Phys. Rev. Lett. 2020, 124, 016401. [Google Scholar] [CrossRef]
  11. Roig, M.; Rømer, A.T.; Kreisel, A.; Hirschfeld, P.J.; Andersen, B.M. Superconductivity in multiorbital systems with repulsive interactions: Hund’s pairing versus spin-fluctuation pairing. Phys. Rev. B 2022, 106, L100501. [Google Scholar] [CrossRef]
  12. Scaffidi, T. Degeneracy between even- and odd-parity superconductivity in the quasi-one-dimensional Hubbard model and implications for Sr2RuO4. Phys. Rev. B 2023, 107, 014505. [Google Scholar] [CrossRef]
  13. Mackenzie, A.P.; Haselwimmer, R.K.W.; Tyler, A.W.; Lonzarich, G.G.; Mori, Y.; Nishizaki, S.; Maeno, Y. Extremely Strong Dependence of Superconductivity on Disorder in Sr2RuO4. Phys. Rev. Lett. 1998, 80, 161, Erratum in Phys. Rev. Lett. 1998, 80, 3890.. [Google Scholar] [CrossRef]
  14. Deguchi, K.; Mao, Z.Q.; Yaguchi, H.; Maeno, Y. Gap Structure of the Spin-Triplet Superconductor Sr2RuO4 Determined from the Field-Orientation Dependence of the Specific Heat. Phys. Rev. Lett. 2004, 92, 047002. [Google Scholar] [CrossRef] [PubMed]
  15. Hassinger, E.; Bourgeois-Hope, P.; Taniguchi, H.; René de Cotret, S.; Grissonnanche, G.; Anwar, M.S.; Maeno, Y.; Doiron-Leyraud, N.; Taillefer, L. Vertical Line Nodes in the Superconducting Gap Structure of Sr2RuO4. Phys. Rev. X 2017, 7, 011032. [Google Scholar] [CrossRef]
  16. Sharma, R.; Edkins, S.D.; Wang, Z.; Kostin, A.; Sow, C.; Maeno, Y.; Mackenzie, A.P.; Davis, J.C.S.; Madhavan, V. Momentum-resolved superconducting energy gaps of Sr2RuO4 from quasiparticle interference imaging. Proc. Natl. Acad. Sci. USA 2020, 117, 5222. [Google Scholar] [CrossRef]
  17. Pustogow, A.; Luo, Y.; Chronister, A.; Su, Y.-S.; Sokolov, D.A.; Jerzembeck, F.; Mackenzie, A.P.; Hicks, C.W.; Kikugawa, N.; Raghu, S.; et al. Constraints on the superconducting order parameter in Sr2RuO4 from oxygen-17 nuclear magnetic resonance. Nature 2019, 574, 72–75. [Google Scholar] [CrossRef]
  18. Petsch, A.N.; Zhu, M.; Enderle, M.; Mao, Z.Q.; Maeno, Y.; Mazin, I.I.; Hayden, S.M. Reduction of the spin susceptibility in the superconducting state of Sr2RuO4 observed by polarized neutron scattering. Phys. Rev. Lett. 2020, 125, 217004. [Google Scholar] [CrossRef]
  19. Gupta, R.; Saunderson, T.; Shallcross, S.; Gradhand, M.; Quintanilla, J.; Annett, J. Superconducting subphase and substantial knight shift in Sr2RuO4. Phys. Rev. B 2020, 102, 235203. [Google Scholar] [CrossRef]
  20. Gupta, R.; Shallcross, S.; Quintanilla, J.; Gradhand, M.; Annett, J. Distinguishing dxz + idyz and dx2−y2 pairing in Sr2RuO4 by high magnetic field H-T phase diagrams. Phys. Rev. B 2022, 106, 115126. [Google Scholar] [CrossRef]
  21. Luke, G.M.; Fudamoto, Y.; Kojima, K.M.; Larkin, M.I.; Merrin, J.; Nachumi, B.; Uemura, Y.J.; Maeno, Y.; Mao, Z.Q.; Mori, Y.; et al. Time-reversal symmetry-breaking superconductivity in Sr2RuO4. Nature 1998, 394, 558–561. [Google Scholar] [CrossRef]
  22. Xia, J.; Maeno, Y.; Beyersdorf, P.T.; Fejer, M.M.; Kapitulnik, A. High resolution polar kerr effect measurements of Sr2RuO4: Evidence for broken time-reversal symmetry in the superconducting state. Phys. Rev. Lett. 2006, 97, 167002. [Google Scholar] [CrossRef] [PubMed]
  23. Benhabib, S.; Lupien, C.; Paul, I.; Berges, L.; Dion, M.; Nardone, M.; Zitouni, A.; Mao, Z.Q.; Maeno, Y.; Georges, A.; et al. Ultrasound evidence for a two- component superconducting order parameter in Sr2RuO4. Nat. Phys. 2020, 17, 194–198. [Google Scholar] [CrossRef]
  24. Ghosh, S.; Shekhter, A.; Jerzembeck, F.; Kikugawa, N.; Sokolov, D.A.; Brando, M.; Mackenzie, A.P.; Hicks, C.W.; Ramshaw, B.J. Thermodynamic evidence for a two- component superconducting order parameter in Sr2RuO4. Nat. Phys. 2020, 17, 199–204. [Google Scholar] [CrossRef]
  25. Suh, H.G.; Menke, H.; Brydon, P.M.R.; Timm, C.; Ramires, A.; Agterberg, D.F. Stabilizing even-parity chiral superconductivity in Sr2RuO4. Phys. Rev. Res. 2020, 2, 032023(R). [Google Scholar] [CrossRef]
  26. Kivelson, S.A.; Yuan, A.C.; Ramshaw, B.; Thomale, R. A proposal for reconciling diverse experiments on the superconducting state in Sr2RuO4. Npj Quantum Mater. 2020, 5, 43. [Google Scholar] [CrossRef]
  27. Hicks, C.W.; Brodsky, D.O.; Yelland, E.A.; Gibbs, A.S.; Bruin, J.A.N.; Barber, M.E.; Edkins, S.D.; Nishimura, K.; Yonezawa, S.; Maeno, Y.; et al. Strong increase of tc of Sr2RuO4 under both tensile and compressive strain. Science 2014, 344, 283. [Google Scholar] [CrossRef]
  28. Steppke, A.; Zhao, L.; Barber, M.E.; Scaffidi, T.; Jerzembeck, F.; Rosner, H.; Gibbs, A.S.; Maeno, Y.; Simon, S.H.; Mackenzie, A.P.; et al. Strong peak in Tc of Sr2RuO4 under uniaxial pressure. Science 2017, 355, 148. [Google Scholar] [CrossRef]
  29. Barber, M.E.; Gibbs, A.S.; Maeno, Y.; Mackenzie, A.P.; Hicks, C.W. Resistivity in the vicinity of a van hove singularity: Sr2RuO4 under uniaxial pressure. Phys. Rev. Lett. 2018, 120, 076602. [Google Scholar] [CrossRef]
  30. Barber, M.E.; Lechermann, F.; Streltsov, S.V.; Skornyakov, S.L.; Ghosh, S.; Ramshaw, B.J.; Kikugawa, N.; Sokolov, D.A.; Mackenzie, A.P.; Hicks, C.W.; et al. Role of correlations in determining the Van Hove strain in Sr2RuO4. Phys. Rev. B 2019, 100, 245139. [Google Scholar] [CrossRef]
  31. Li, Y.-S.; Kikugawa, N.; Sokolov, D.A.; Jerzembeck, F.; Gibbs, A.S.; Maeno, Y.; Hicks, C.W.; Schmalian, J.; Nicklas, M.; Mackenzie, A.P. High-sensitivityheat-capacity measurements on Sr2RuO4 under uniaxial pressure. Proc. Natl. Acad. Sci. USA 2021, 118, e2020492118. [Google Scholar] [CrossRef] [PubMed]
  32. Grinenko, V.; Ghosh, S.; Sarkar, R.; Orain, J.-C.; Nikitin, A.; Elender, M.; Das, D.; Guguchia, Z.; Bruckner, F.; Barber, M.E.; et al. Split superconducting and time-reversal symmetry-breaking transitions in Sr2RuO4 under stress. Nat. Phys. 2021, 17, 748–754. [Google Scholar] [CrossRef]
  33. Li, Y.-S.; Garst, M.; Schmalian, J.; Ghosh, S.; Kikugawa, N.; Sokolov, D.A.; Hicks, C.W.; Jerzembeck, F.; Ikeda, M.S.; Hu, Z.; et al. Elastocaloric determination of the phase diagram of Sr2RuO4. Nature 2022, 607, 276. [Google Scholar] [CrossRef]
  34. Burganov, B.; Adamo, C.; Mulder, A.; Uchida, M.; King, P.D.C.; Harter, J.W.; Shai, D.E.; Gibbs, A.S.; Mackenzie, A.P.; Uecker, R.; et al. Strain Control of Fermiology and Many-Body Interactions in Two-Dimensional Ruthenates. Phys. Rev. Lett. 2016, 116, 197003. [Google Scholar] [CrossRef]
  35. Sunko, V.; Morales, E.A.; Marković, I.; Barber, M.E.; Milosavljević, D.; Mazzola, F.; Sokolov, D.A.; Kikugawa, N.; Cacho, C.; Dudin, P.; et al. Direct observation of a uniaxial stress-driven Lifshitz transition in Sr2RuO4. Npj Quantum Mater. 2019, 4, 46. [Google Scholar] [CrossRef]
  36. Watson, C.A.; Gibbs, A.S.; Mackenzie, A.P.; Hicks, C.W.; Moler, K.A. Micron-scale measurements of low anisotropic strain response of local Tc in Sr2RuO4. Phys. Rev. B 2018, 98, 094521. [Google Scholar] [CrossRef]
  37. Grinenko, V.; Das, D.; Gupta, R.; Zinkl, B.; Kikugawa, N.; Maeno, Y.; Hicks, C.W.; Klauss, H.-H.; Sigrist, M.; Khasanov, R. Unsplit superconducting and time reversal symmetry breaking transitions in Sr2RuO4 under hydrostatic pressure and disorder. Nat. Commun. 2021, 12, 3920. [Google Scholar] [CrossRef]
  38. Jerzembeck, F.; Røising, H.S.; Steppke, A.; Rosner, H.; Sokolov, D.A.; Kikugawa, N.; Scaffidi, T.; Simon, S.H.; Mackenzie, A.P.; Hicks, C.W. The superconductivity of Sr2RuO4 under c-axis uniaxial stress. Nat. Comms. 2022, 13, 4596. [Google Scholar] [CrossRef] [PubMed]
  39. Vollhardt, D.D.; Woelfle, P. The Superfluid Phases Of Helium 3; CRC Press: London, UK, 1990. [Google Scholar]
  40. Scaffidi, T.; Romers, J.C.; Simon, S.H. Pairing symmetry and dominant band in Sr2RuO4. Phys. Rev. B 2014, 89, 220510R. [Google Scholar] [CrossRef]
  41. Liu, Y.-C.; Zhang, F.C.; Rice, T.M.; Wang, Q.-H. Theory of the evolution of superconductivity in Sr2RuO4 under anisotropic strain. Npj Quantum Mater. 2017, 2, 12. [Google Scholar] [CrossRef]
  42. Scaffidi, T. Weak-Coupling Theory of Topological Superconductivity; Springer Thesis; Springer: Cham, Switzerland, 2017. [Google Scholar]
  43. Rømer, A.T.; Kreisel, A.; Müller, M.A.; Hirschfeld, P.J.; Eremin, I.M.; Andersen, B.M. Theory of strain-induced magnetic order and splitting of Tc and TTRSB in Sr2RuO4. Phys. Rev. B 2020, 102, 054506. [Google Scholar] [CrossRef]
  44. Beck, S.; Hampel, A.; Zingl, M.; Timm, C.; Ramires, A. Effects of strain in multiorbital superconductors: The case of Sr2RuO4. Phys. Rev. Res. 2022, 4, 023060. [Google Scholar] [CrossRef]
  45. Perdew, J.P.; Burke, K.; Ernzerhof, M. Generalized Gradient Approximation Made Simple. Phys. Rev. Lett. 1996, 77, 3865. [Google Scholar] [CrossRef] [PubMed]
  46. The Elk Code. Available online: http://elk.sourceforge.net/ (accessed on 22 October 2024).
  47. Chmaissem, O.; Jorgensen, J.D.; Shaked, H.; Ikeda, S.; Maeno, Y. Thermal expansion and compressibility of Sr2RuO4. Phys. Rev. B 1998, 57, 5067. [Google Scholar] [CrossRef]
  48. Pavarini, E.; Mazin, I. First-principles study of spin-orbit effects and NMR in Sr2RuO4. Phys. Rev. B 2006, 74, 035115, Erratum in Phys. Rev. B 2007, 76, 079901.. [Google Scholar] [CrossRef]
  49. Autieri, C.; Cuoco, M.; Noce, C. Structural and electronic properties of heterostructures Sr2RuO4/Sr3Ru2O7. Phys. Rev. B 2014, 89, 075102. [Google Scholar] [CrossRef]
  50. Paglione, J.; Lupien, C.; MacFarlane, W.A.; Perz, J.M.; Taillefer, L.; Mao, Z.Q.; Maeno, Y. Elastic tensor of Sr2RuO4. Phys. Rev. B 2002, 65, 220506(R). [Google Scholar] [CrossRef]
  51. Zhitomirsky, M.E.; Rice, T.M. Interband Proximity Effect and Nodes of Superconducting Gap in Sr2RuO4. Phys. Rev. Lett. 2001, 87, 057001. [Google Scholar] [CrossRef]
  52. Røising, H.S.; Wagner, G.; Roig, M.; Rømer, A.T.; Andersen, B.M. Heat capacity double transitions in time-reversal symmetry broken superconductors. Phys. Rev. B 2022, 106, 174518. [Google Scholar] [CrossRef]
  53. Rozbicki, E.J.; Annett, J.F.; Souquet, J.-R.; Mackenzie, A.P. Spin–orbit coupling and k-dependent Zeeman splitting in strontium ruthenate. J. Phys. Condens. Matter. 2011, 23, 094201. [Google Scholar] [CrossRef]
  54. Curtis, M. Effects of Strain Induced Topological Changes on the Superconducting Critical Temperature. Ph.D. Thesis, University of Bristol, Bristol, UK, 2024. [Google Scholar]
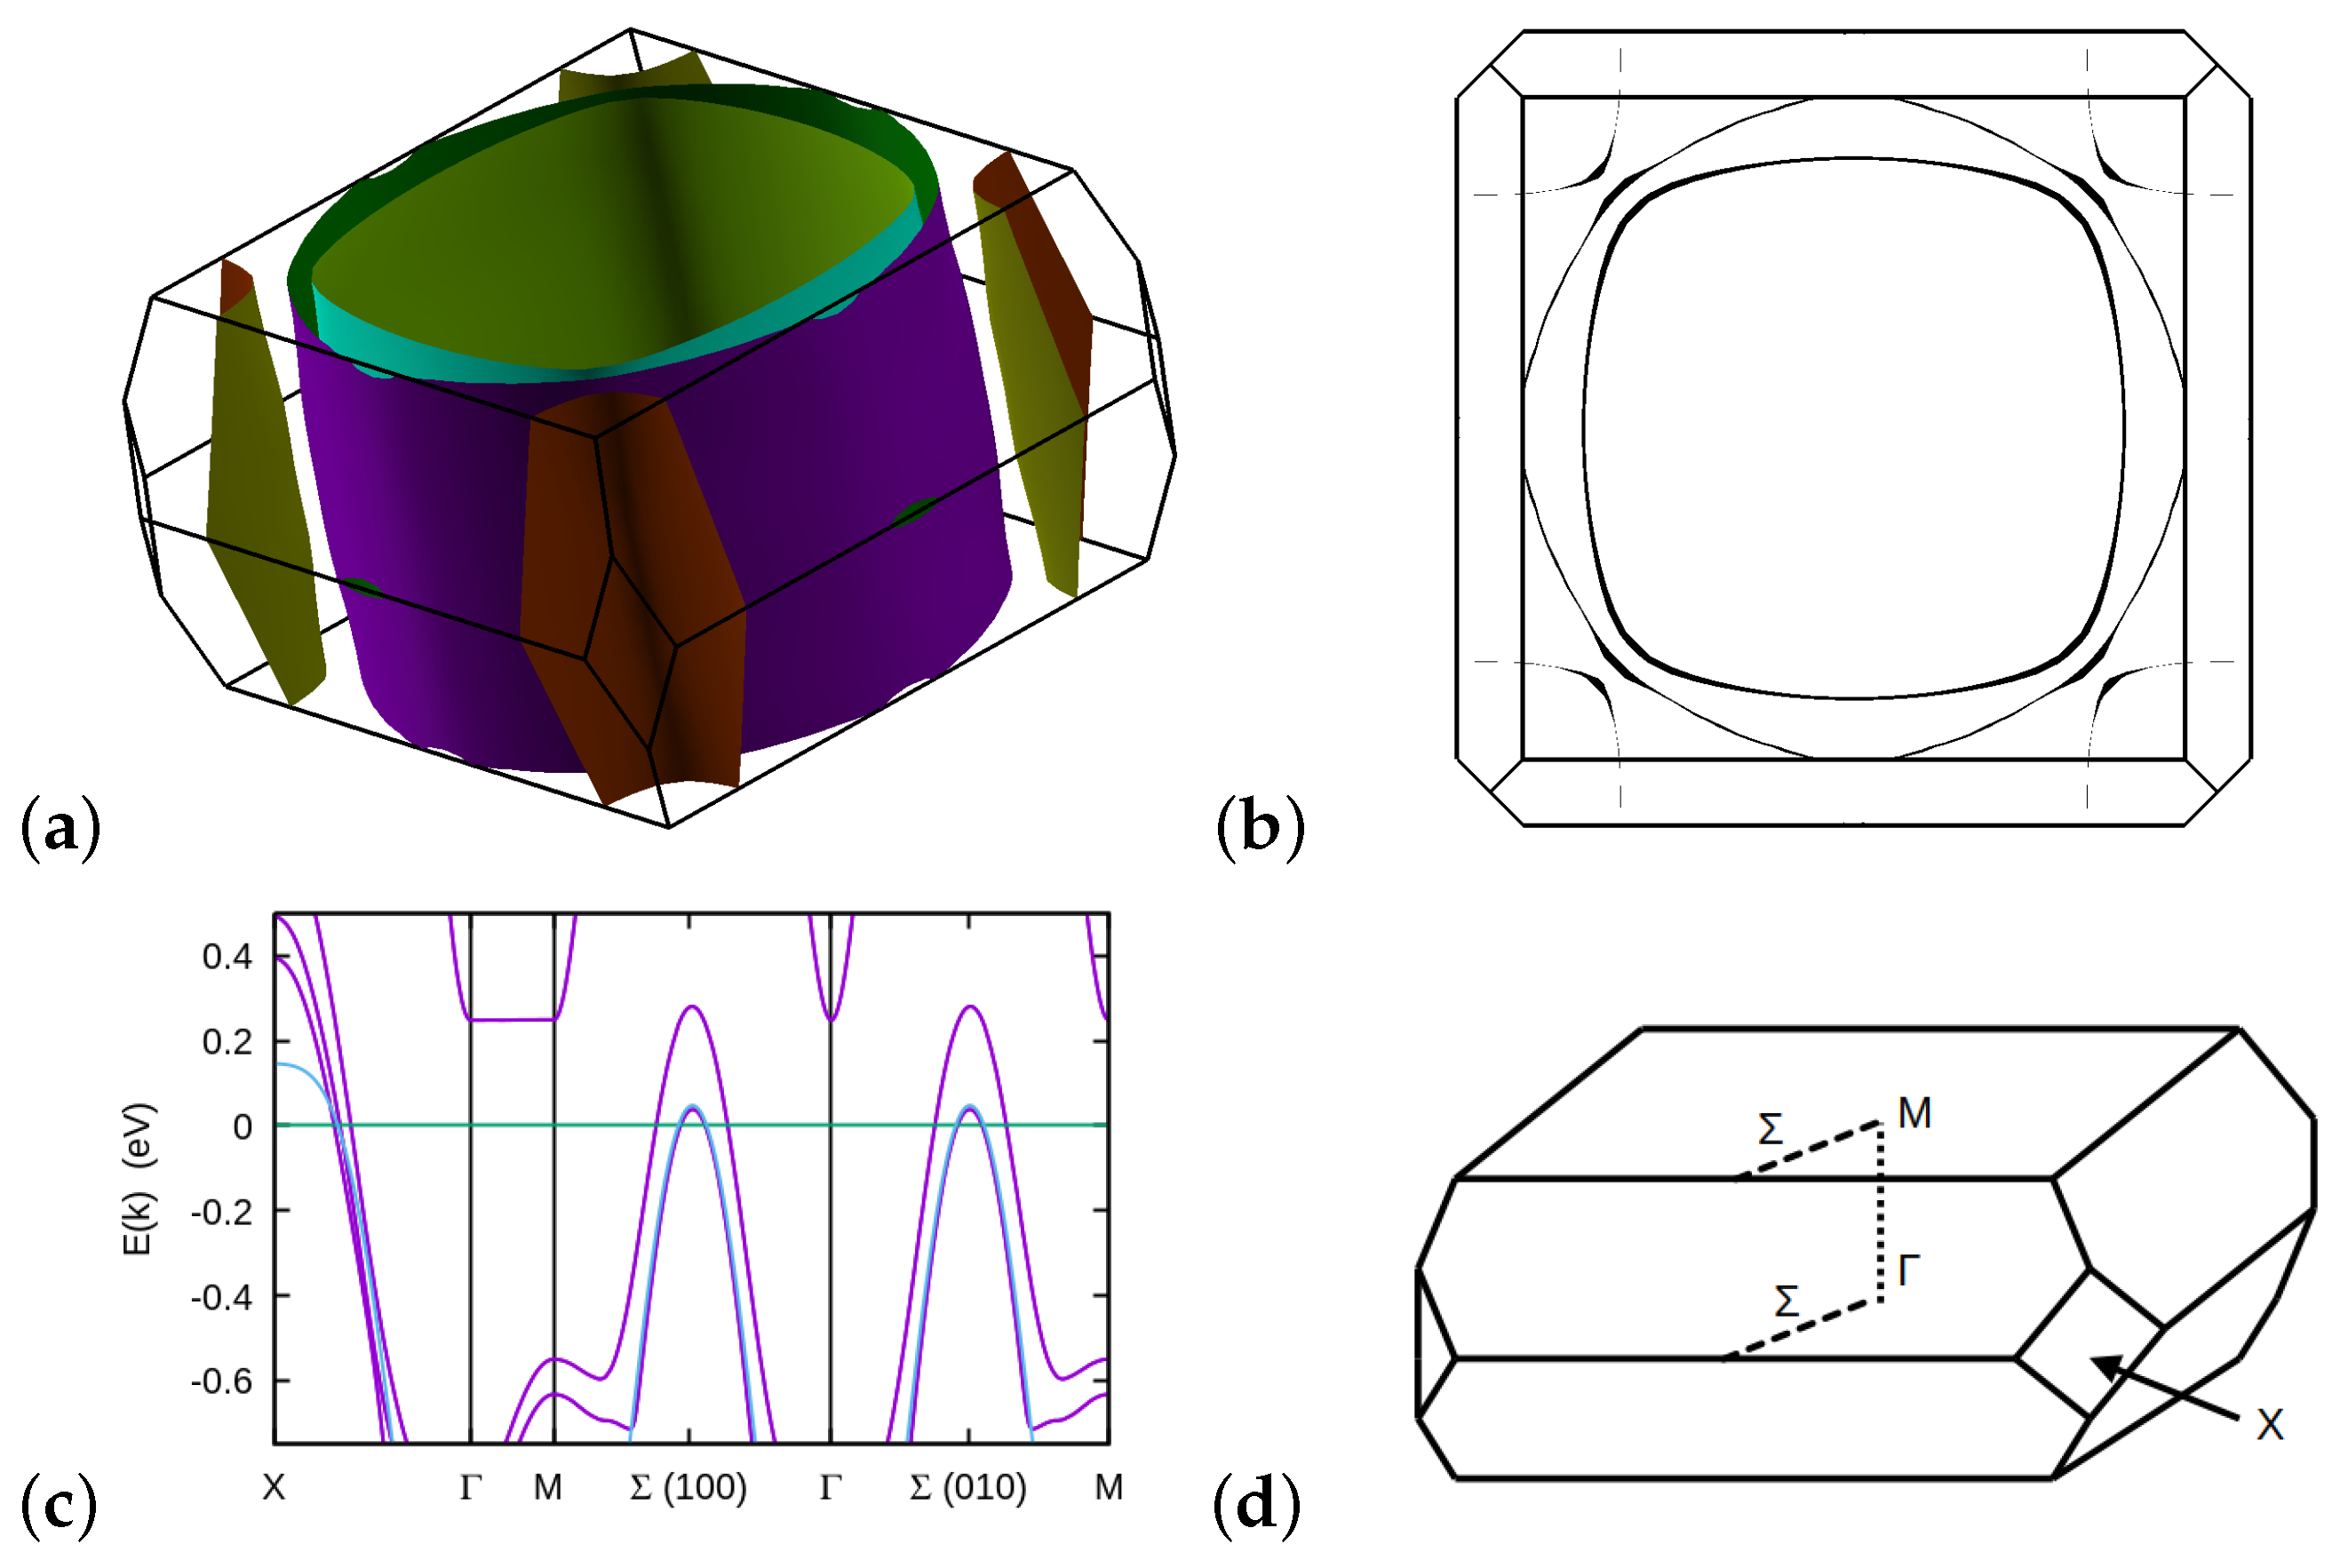
Figure 1. Fermi surface and band structure of unstrained Sr2RuO4. (a) View of Fermi surface. The three sheets α , γ , and β are, respectively, the small cylinder in the Brillouin zone corner and the outer and inner cylinders centred on Γ . (b) Top view of the Fermi surface, showing the highly two-dimensional dispersion of all three Fermi surface sheets. (c) Band structure showing all bands near the Fermi level (purple lines), as well as a tight binding fit for the γ band only (blue line), as described below. (d) Schematic view of Brillouin zone noting the symmetry points used in band plot (c). Note that the Σ line from Γ to M is continuous in the extended zone picture. Also, the Σ lines along ( 100 ) and ( 010 ) are exactly equivalent in this unstrained tetragonal case.
Condensedmatter 09 00044 g001
Figure 2. Fermi surface and band structure of ( 100 ) compressive or expansive strained Sr2RuO4. (a) Top view of Fermi surface under 2 % compressive strain along ( 100 ) . The γ Fermi surface cylindrical sheet has opened along the ( 010 ) direction. (b) Top view of Fermi surface under 2 % expansive strain along ( 100 ) . The γ Fermi surface cylindrical sheet has opened along the ( 100 ) direction. (c) Band structure corresponding to Fermi surface plot (a) (purple lines), including tight binding fit to γ band (blue line).
Condensedmatter 09 00044 g002
Figure 3. Bloch wave function density for the γ band at k = ( π / a , 0 , 0 ) in the a b plane. Nodal lines along x = 0 and y = 0 occur because of the d x y Ru orbital symmetry and an additional nodal line at y = a / 2 is required by translational symmetry along y ( k y = 0 ) . The pattern of nodal lines visible implies that the Lifshitz transition points of the Fermi surface coincide with zeros of the interlayer hopping between Ru d x y symmetry orbitals.
Condensedmatter 09 00044 g003
Figure 4. (a) Uniaxial strain-induced changes to T c assuming d x 2 y 2 pairing and corresponding weighted DOS. (b) Uniaxial strain-induced changes to T c assuming p x + i p y pairing and corresponding weighted DOS in both p x and p y channels.
Condensedmatter 09 00044 g004
Figure 5. (a) Evolution of d x 2 y 2 -weighted DOS as a function of strain. We can see the van Hove peak move through the Fermi level at the Lifshitz transition. (b) p x -weighted DOS as a function of strain. This shows that no van Hove peak occurs at the Lifshitz transition. (c) p y -weighted DOS as a function of strain. Again, no van Hove peak occurs at the Lifshitz transition. The figure insets show the gap function-weighted Fermi surface in each case for both unstrained (blue) and strained (red) lattices. In both p-wave cases, a gap node occurs at the Lifshitz transition point ( 0 , π ) , implying that there is no corresponding van Hove singularity in the pairing symmetry-weighted DOS.
Condensedmatter 09 00044 g005
Figure 6. (a) T c for the mixed symmetry d + i g case. TRSB should occur below the lower of the two T c values shown. The inset shows that the g-wave-weighted DOS at the Fermi level has no van Hove peak. (b) The g-wave-weighted DOS, showing a small decrease at ε F in the case of compressive strain shown. The inset shows the gap function-weighted Fermi surface for both unstrained (blue) and strained (red) lattices. The g-wave gap nodal structure shown in the inset leads to the absence of a distinct van Hove peak in the g -wave-weighted DOS.
Condensedmatter 09 00044 g006
Table 1. Gap symmetry. The table shows the specific gap function forms considered in our calculations. The functions are labelled by the irreducible representations for the unstrained square lattice case, the D 4 h point group. For convenience, we omit normalization constants. The mixed symmetry case d + i g assumes the accidental degeneracy or near-degeneracy of distinct symmetries. In both the p x + i p y and d + i g cases, breaking the degeneracy by strain implies that the temperature for TRSB will become distinct from T c .
D 4 h Symmetry Rep. Γ ( k ) Name
B 1 g cos ( k x a ) cos ( k y b ) d-wave
E u sin ( k x a ) , sin ( k y b ) chiral p x + i p y
mixed B 1 g   A 2 g cos ( k x a ) cos ( k y b ) ,
            cos ( k x a ) cos ( k y b ) sin ( k x a ) sin ( k y b ) d + i g
Disclaimer/Publisher’s Note: The statements, opinions and data contained in all publications are solely those of the individual author(s) and contributor(s) and not of MDPI and/or the editor(s). MDPI and/or the editor(s) disclaim responsibility for any injury to people or property resulting from any ideas, methods, instructions or products referred to in the content.