Abstract
The present author’s general correlation for condensation in mini and macro channels which has been verified with an extreme range of data was further evaluated at quality x close to 1. Large deviations were found at quality x ≥ 0.99. The correlation was modified to improve the accuracy in this range of quality. The improved correlation has a MAD (mean absolute deviation) of 22.1% in this range of quality compared to 95% in the published correlation. This improvement is important for the calculation of heat transfer in the condensation of superheated vapor as it requires the value of the heat transfer coefficient at quality x = 1. The new correlation is presented together with a comparison of data. Various aspects of the correlation are discussed. Results of the comparison of all data with the new correlation as well as other correlations are given.
1. Introduction
Condensation of vapors inside channels is involved in many industries including refrigeration, chemical processes, power plants, etc. Hence accurate prediction of heat transfer during condensation is needed. Many correlations have been published for this purpose. The present author, Shah [1], presented a correlation that was verified with data for mini and macro channels from 130 sources for 51 fluids covering an extreme range of parameters. However, there were very few data points close to quality x = 1. This was because most experimental studies conducted in the past were limited to lower qualities. In the author’s continued efforts to further test and verify this correlation, the results were recently compared to additional data which included qualities very near x = 1. It was found that the correlation was overpredicting many of the data points for x ≥ 0.99. As this quality range occupies only a very small part of a condenser, this inaccuracy may seem insignificant. However, the ability to correctly predict the heat transfer coefficient at x = 1 is very important for use in widely-used models for the condensation of superheated vapors as is discussed later. It was, therefore, decided that this problem should be investigated to try to modify the correlation and improve its accuracy in this range. This effort has been successful, and an improved correlation has been developed. This paper presents the improved correlation and discusses various related matters. Before taking it up, the published Shah correlation is described as the present correlation is an improved version of it.
2. Shah Correlation
The various versions of the Shah correlation including the latest published one are briefly described in the following.
Shah [2] presented the following correlation:
It was verified with data for pr up to about 0.4 and moderate to high flow rates.
Shah [3,4] modified it so that it could also be applied to high reduced pressures and low flow rates. Three heat transfer regimes named I, II, and III were identified. Two heat transfer equations are used. The first is:
At pr < 0.4, Equation (2) approximates to Equation (1). The other equation is:
This is the Nusselt equation for condensation in vertical tubes, multiplied by 1.2 as recommended by McAdams [5]. In Regime I, Equation (2) is used. In Regime III, Equation (3) is used. In Regime II, the heat transfer coefficient is the sum of those predicted by Equations (2) and (3).
Shah [6] compared the data for horizontal tubes in the three regimes with the flow pattern map of El Hajal et al. [7]. It was found that Regime I occurs when the flow pattern is annular, mist, or intermittent. Regime II occurs when the flow pattern is stratified wavy, and Regime III occurs when the flow pattern is stratified.
Shah [8] found that heat transfer coefficients are higher than predicted by Shah [4] correlation when WeGT < 100. It is defined as:
When this happens, Regime I changes to Regime 2. This was attributed to the effect of surface tension. Weber number is the ratio of inertia force and surface tension force. A low Weber number indicates that surface tension force is dominant and therefore WeGT < 100 is the boundary between mini and macro channels.
More modifications were performed in Shah [1,9,10] to improve accuracy. These included factors to take into consideration the effects of low Reynolds and Froude numbers, type of fluid, and an alternative equation of hLS.
3. Present Research
Although the database which was used to validate the Shah [1] correlation was vast in the quantity of data and the range of parameters, it included very few data points at x = 1 or qualities very close to it. This is because most experimental studies did not include data at such high quality. During recent research on the condensation of superheated vapor, high-quality data was compared to the Shah [1] correlation. It was found that many data points at x > 0.99 were being overpredicted to a considerable extent. As accurate prediction of heat transfer in this range of quality is very important for the calculation of heat transfer during condensation of superheated vapor, it was decided to make an attempt to improve it in this range. Before going into the efforts for improvement of the correlation, it is desirable to explain why accurate prediction in this range is needed. This is accomplished in the next section.
3.1. Superheated Vapor Condensation Heat Transfer Models
Vapor enters the condenser in a superheated state in a number of applications including refrigeration evaporators. Superheated vapor begins to condense when the wall temperature falls below the saturation temperature of the vapor. A number of models have been proposed for the calculation of heat transfer during condensation of superheated vaporthat require the value of heat transfer coefficient at x = 1. These are discussed below.
Lee et al. [11] condensed R-22 in a horizontal tube. Superheat was up to 65 K and pressure was 7.64 to 13.55 bar. They found that their saturated condensation data were in good agreement with Shah’s [2] correlation. For condensation of superheated vapor, they proposed that superheated vapor loses heat to the condensate layer by forced convection heat transfer and the condensate transfers heat to the coolant through the wall in the same way as for condensation of saturated vapor. Accordingly, they gave the following relation for local heat flux q.
hSAT is the heat transfer coefficient of saturated vapor at x = 1 which they calculated by the Shah [2] correlation. hFC is the forced convection heat transfer coefficient between the vapor and the condensate layer which is considered to be of uniform thickness around the tube. This is to be calculated by a single-phase heat transfer equation; they used the Gnielinski [12] correlation. Their own test data was in good agreement with this model.
Kondou and Hrnjak [13] found Equation (5) to be in good agreement with their data for CO2 and R-410A at high pressures up to near critical. They used a modified form of the Cavallini et al. [14] correlation for calculating hSAT. For hFC, they used the Gnielinski [12] correlation with wall temperature correction by Pethukov [15].
Agarwal and Hrnjak [16,17] found Equation (5) to be in good agreement with their measured heat transfer coefficients during condensation of superheated R-134a, R-32, and R-1234ze in a 6.1 mm horizontal tube. hSAT was calculated with the Cavallini et al. [14] correlation and hFC by the Gnielinski [12] correlation.
Webb [18] was of the view that mass transfer from the superheated vapor to the condensate film causes bulk convection in the superheated vapor thus enhancing heat transfer. He modified Equation (5) to take into account this enhancement to the following form.
qlat is the heat flux removed during the change of phase only. He compared Equation (6) only to the data of Lee et al. [11] mentioned above and reported good agreement. hSAT was calculated with the Shah [2] correlation.
Longo et al. [19] incorporated the Webb model into their procedure for calculating the mean heat transfer coefficient for plate-type heat exchangers. They report good agreement with mean heat transfer coefficients for complete condensation of several fluids.
It is seen that the models of Equations (5) and (6) have had considerable success in predicting heat transfer during condensation of superheated vapor. Each of them requires the prediction of heat transfer during saturated vapor condensation of vapor at x = 1. Hence accurate prediction at x = 1 is important. Therefore, the present effort to improve the Shah correlation was undertaken.
Note that the correlations of Shah [1] and Cavallini et al. [14] are indeterminate at x = 1. Hence calculations have to be performed at a quality very close to 1, such as x = 0.999.
3.2. Development of Improved Shah Correlation
As the original database had very few data at qualities close to 1, a search was undertaken to locate more such data. A few sources were identified, and their data was added to the database. The results for x > 0.9 were carefully examined for deviations from the Shah [1] correlation. It was found that the deviations for x < 0.99 were comparable to those at lower qualities. Deviations became large at x > 0.99 with most of them being overpredicted. All the data in this range were from horizontal channels. The cause for this was sought. It was noted that such data had been predicted to be in Regime II and therefore predicted heat transfer coefficient as the sum of those given by Equations (2) and (3). The measured heat transfer coefficients were close to those given by Equation (2) which is for Regime I.
Shah [6] determined that Regime I occurs when the flow pattern is annular, mist, or intermittent; Regime II occurs with a wavy-stratified flow, and Regime III with a stratified flow. This was accomplished by comparing the data with the flow pattern map of El Hajal et al. [7]. At x ≥ 0.99, there is very little condensate and vapor velocity is high; hence the occurrence of Regime II or III (stratified or wavy-stratified flow patterns) is not possible. The only flow patterns possible at x very close to 1 are annular or mist and hence the regime has to be I. Therefore, the criteria for determining heat transfer regimes need to be modified to take this into account.
The new criterion is that if x ≥ 0.99, it is always Regime I irrespective of any other factors. Although this modification is based entirely on data for horizontal channels, it has tentatively been extended also to vertical channels. The Shah [1] correlation has been modified to incorporate this change. The complete modified correlation is given in Section 3.3.
3.3. The Modified/Improved Shah Correlation
The complete Shah correlation including the present modification is given below in detail to ensure its correct use.
There are three heat transfer regimes called I, II, and III.
In Regime I,
In Regime II,
In Regime III:
There are the following two alternative formulas for hI.
Equation (11) was given by Shah [3]. Equation (12) was given by Cavallini et al. [14]. For vertical channels, Equation (11) is always used. For horizontal channels, Equation (11) is used for DHYD > 6 mm and Equation (12) for DHYD ≤ 6 mm.
In the above equations,
hLT is obtained by substituting ReLT in place of ReLS in Equation (13).
3.3.1. Determining Regimes
Regimes are determined as follows using the dimensionless vapor velocity Jg defined as,
Vertical Downflow
Regime I occurs when x ≥ 0.99 and/or,
Regime III occurs when:
Regime III also occurs if ReLT < 600 together with WeGT < 100.
If the regime is not determined to be I or III by the above criteria, it is Regime II.
Horizontal Channels
When fluid is hydrocarbon or if ReLT < 100 for any fluid,
Regime I occurs when x ≥ 0.99 and/or,
Regime III occurs when:
If neither of the above conditions is satisfied, it is Regime II.
For all fluids other than hydrocarbons with ReLT ≥ 100,
Regime I occurs if WeGT > 100 and FrLT > 0.026 and:
Regime I also occurs if x ≥ 0.99 irrespective of the values of WeGT, FrLT, and JG.
Regime III occurs if FrL > 0.026 and:
If it is not Regime I or III, it is Regime II.
3.3.2. Choice of Equivalent Diameter for Non-Circular Channels
The following two equivalent diameters are used for non-circular channels.
Use DHP in calculating ReLS, ReLT, hLS, and hLT. Use DHYD for all other parameters including Jg, WeGT, and FrLT.
4. Data Analysis
As the database used in Shah [1] had very few data points for x ≥ 0.99, other sources for such data were sought. Two such sources were found. These are Kondou and Hrnjak [13] and Agarwal and Hrnjak [17]. These included vapor qualities from near zero to one for five fluids. These data together with all other data from the previous database were compared to the present modified correlation, the Shah [1] correlation, as well as all correlations which were tested in Shah [1]. Fluid properties were obtained from REFPROP 9.1, Lemmon et al. [20].
As R-410A is a zeotropic fluid, the predictions of all correlations were corrected for mass transfer effect using the Bell and Ghaly [21] correlation as below.
where,
hc is the condensing heat transfer coefficient calculated with mixture properties using a correlation for pure fluids. hGS is the superficial heat transfer coefficient of the vapor phase, i.e., assuming vapor phase to be flowing alone in the tube, calculated by the following equation.
This is the recommended method when applying the present calculation to any zeotropic mixture. The same method is also recommended by many other authors for various correlations.
In calculations with the Shah [1] correlation, DHP and DHYD were used as stated in Section 3.3.2. The same was also performed with other correlations except those of Kim and Mudawar [22], Dorao and Fernandino [23], Hosseini et al. [24], and Moradkhani et al. [25]. For these correlations, DHYD was used as the diameter in all calculations because that was specified by these authors.
Table 1 gives the results of a comparison of data for x ≥ 0.99 with the Shah [1] correlation and the present correlation. The deviations listed in the table are the mean absolute deviation (MAD) and the average deviation (AD). These are defined as below.
Average deviation (AD) is defined as:
It is seen that the Shah [1] correlation has a MAD of 95% while the present correlation has a MAD of 22.1%. Thus, the new correlation is far more accurate than the published correlation in this range of quality.
Table 2 gives the comparison of the new data with the correlations which were found to be better among all correlations evaluated in Shah [1]. These are the correlations of Kim and Mudawar [22], Dorao and Fernandino [23], Hosseini et al. [24], Moradkhani et al. [25], and Ananiev et al. [26]. The present correlation has a MAD of 14.9% while the Shah [1] correlation has a MAD of 24.6%. The larger MAD of the Shah [1] correlation is because of its large deviations with data for x ≥ 0.99. Among the other correlations, only that of Dorao and Fernandino [23] gives reasonable agreement with MAD of 22.4%. All these data had WeGT > 100 and hence were in the macrochannel range.

Table 2.
Range of new data analyzed and deviations of various correlations.
Table 1.
Range of new data analyzed and deviations of the present and Shah [1] correlations. All channels were horizontal.
Table 1.
Range of new data analyzed and deviations of the present and Shah [1] correlations. All channels were horizontal.
| Source | Geometry (Aspect Ratio) # | Dhyd (DHP) * mm | Fluid (Glide, K) ** | pr | G kg·m−2s−1 | x | ReLT | WeGT | FrLT | N | Deviation, % Mean Absolute Average | |
|---|---|---|---|---|---|---|---|---|---|---|---|---|
| Shah [1] | Present | |||||||||||
| Al-Zaidi et al. [27] | Multi, rect. (0.4) | 5.7 (6.66) | HFE 7100 | 0.0455 | 86 | 0.990 | 164 | 32 | 0.702 | 1 | 92.7 92.7 | 2.1 −2.1 |
| Agarwal and Hrnjak [17] | Round | 6.1 | R-134a | 0.1889 0.3243 | 100 300 | 1.0 | 3325 12882 | 221 1692 | 0.118 1.24 | 2 | 138.0 138.0 | 1.1 1.1 |
| R-32 | 0.3321 0.5414 | 100 | 1.0 | 5679 7315 | 186 201 | 0.189 0.237 | 3 | 192.7 192.7 | 33.9 −33.9 | |||
| R-1234ze | 0.1584 0.2733 | 100 200 | 0.994 1.0 | 3239 8227 | 199 794 | 0.127 0.579 | 5 | 125.8 125.8 | 15.3 −7.3 | |||
| Kondu and Hrnjak [13] | Round | 6.1 | CO2 | 0.8109 0.9460 | 100 | 1.0 | 9692 12500 | 300 1101 | 0.295 0.406 | 2 | 152.5 152.5 | 39.5 −39.5 |
| R-410A | 0.5489 0.9438 | 100 200 | 0.99 1.0 | 7890 13592 | 235 1269 | 0.215 0.745 | 6 | 78.0 66.4 | 19.8 −18.5 | |||
| Azzolin et al. [28] | Multi, rect. | 3.38 | HFE-7000 | 0.0593 | 70 | 0.99 | 642 | 130 | 0.081 | 1 | 63.2 –63.2 | 63.2 −63.2 |
| Baird et al. [29] | Round, single | 1.95 | R-123 | 0.0789 | 550 | 0.99 | 1789 | 1232 | 17.9 | 1 | 59.0 59.0 | 59.0 59.0 |
| Zhuang et al. [30] | Round, single | 4.0 | Methane | 0.6489 | 254 | 0.99 | 30720 | 3241 | 199.0 | 1 | 9.6 9.6 | 9.6 9.6 |
| Matkovic et al. [31] | Round, single | 0.96 | R-32 | 0.4271 | 600 | 0.99 | 6052 | 1050 | 479 | 1 | 7.5 −7.5 | 7.5 −7.5 |
| Koyama et al. [32] | Multi, rect. | 0.807 | R-134a | 0.4177 | 273 652 | 0.99 | 1791 4278 | 184 1052 | 8.5 48.6 | 2 | 13.6 13.6 | 13.6 13.6 |
| Azer et al. [33] | Round, single | 12.7 | R-12 | 0.2498 | 210 | 0.99 | 213578 | 1495 | 0.23 | 1 | 26.9 −26.9 | 26.9 −26.9 |
| Jung et al. [34] | Round, single | 8.82 | R-410A (0.05 to 0.430 | 0.4917 | 200 | 0.99 | 18304 | 1057 | 0.48 | 1 | 23.7 −23.7 | 23.7 −23/7 |
| All sources | 0.807 12.7 | 0.0455 0.9460 | 70 652 | 0.99 1.0 | 164 213578 | 32 1692 | 0.081 479 | 27 | 95.0 83.5 | 22.1 −13.1 | ||
# Aspect ratio is width/height, listed only when it differs from 1. * DHP listed only if it is not the same as DHYD. ** Glide is given only if not 0).
5. Discussion
The following discussions are for x ≥ 0.99 except if stated otherwise.
5.1. Data Showing Large Deviations
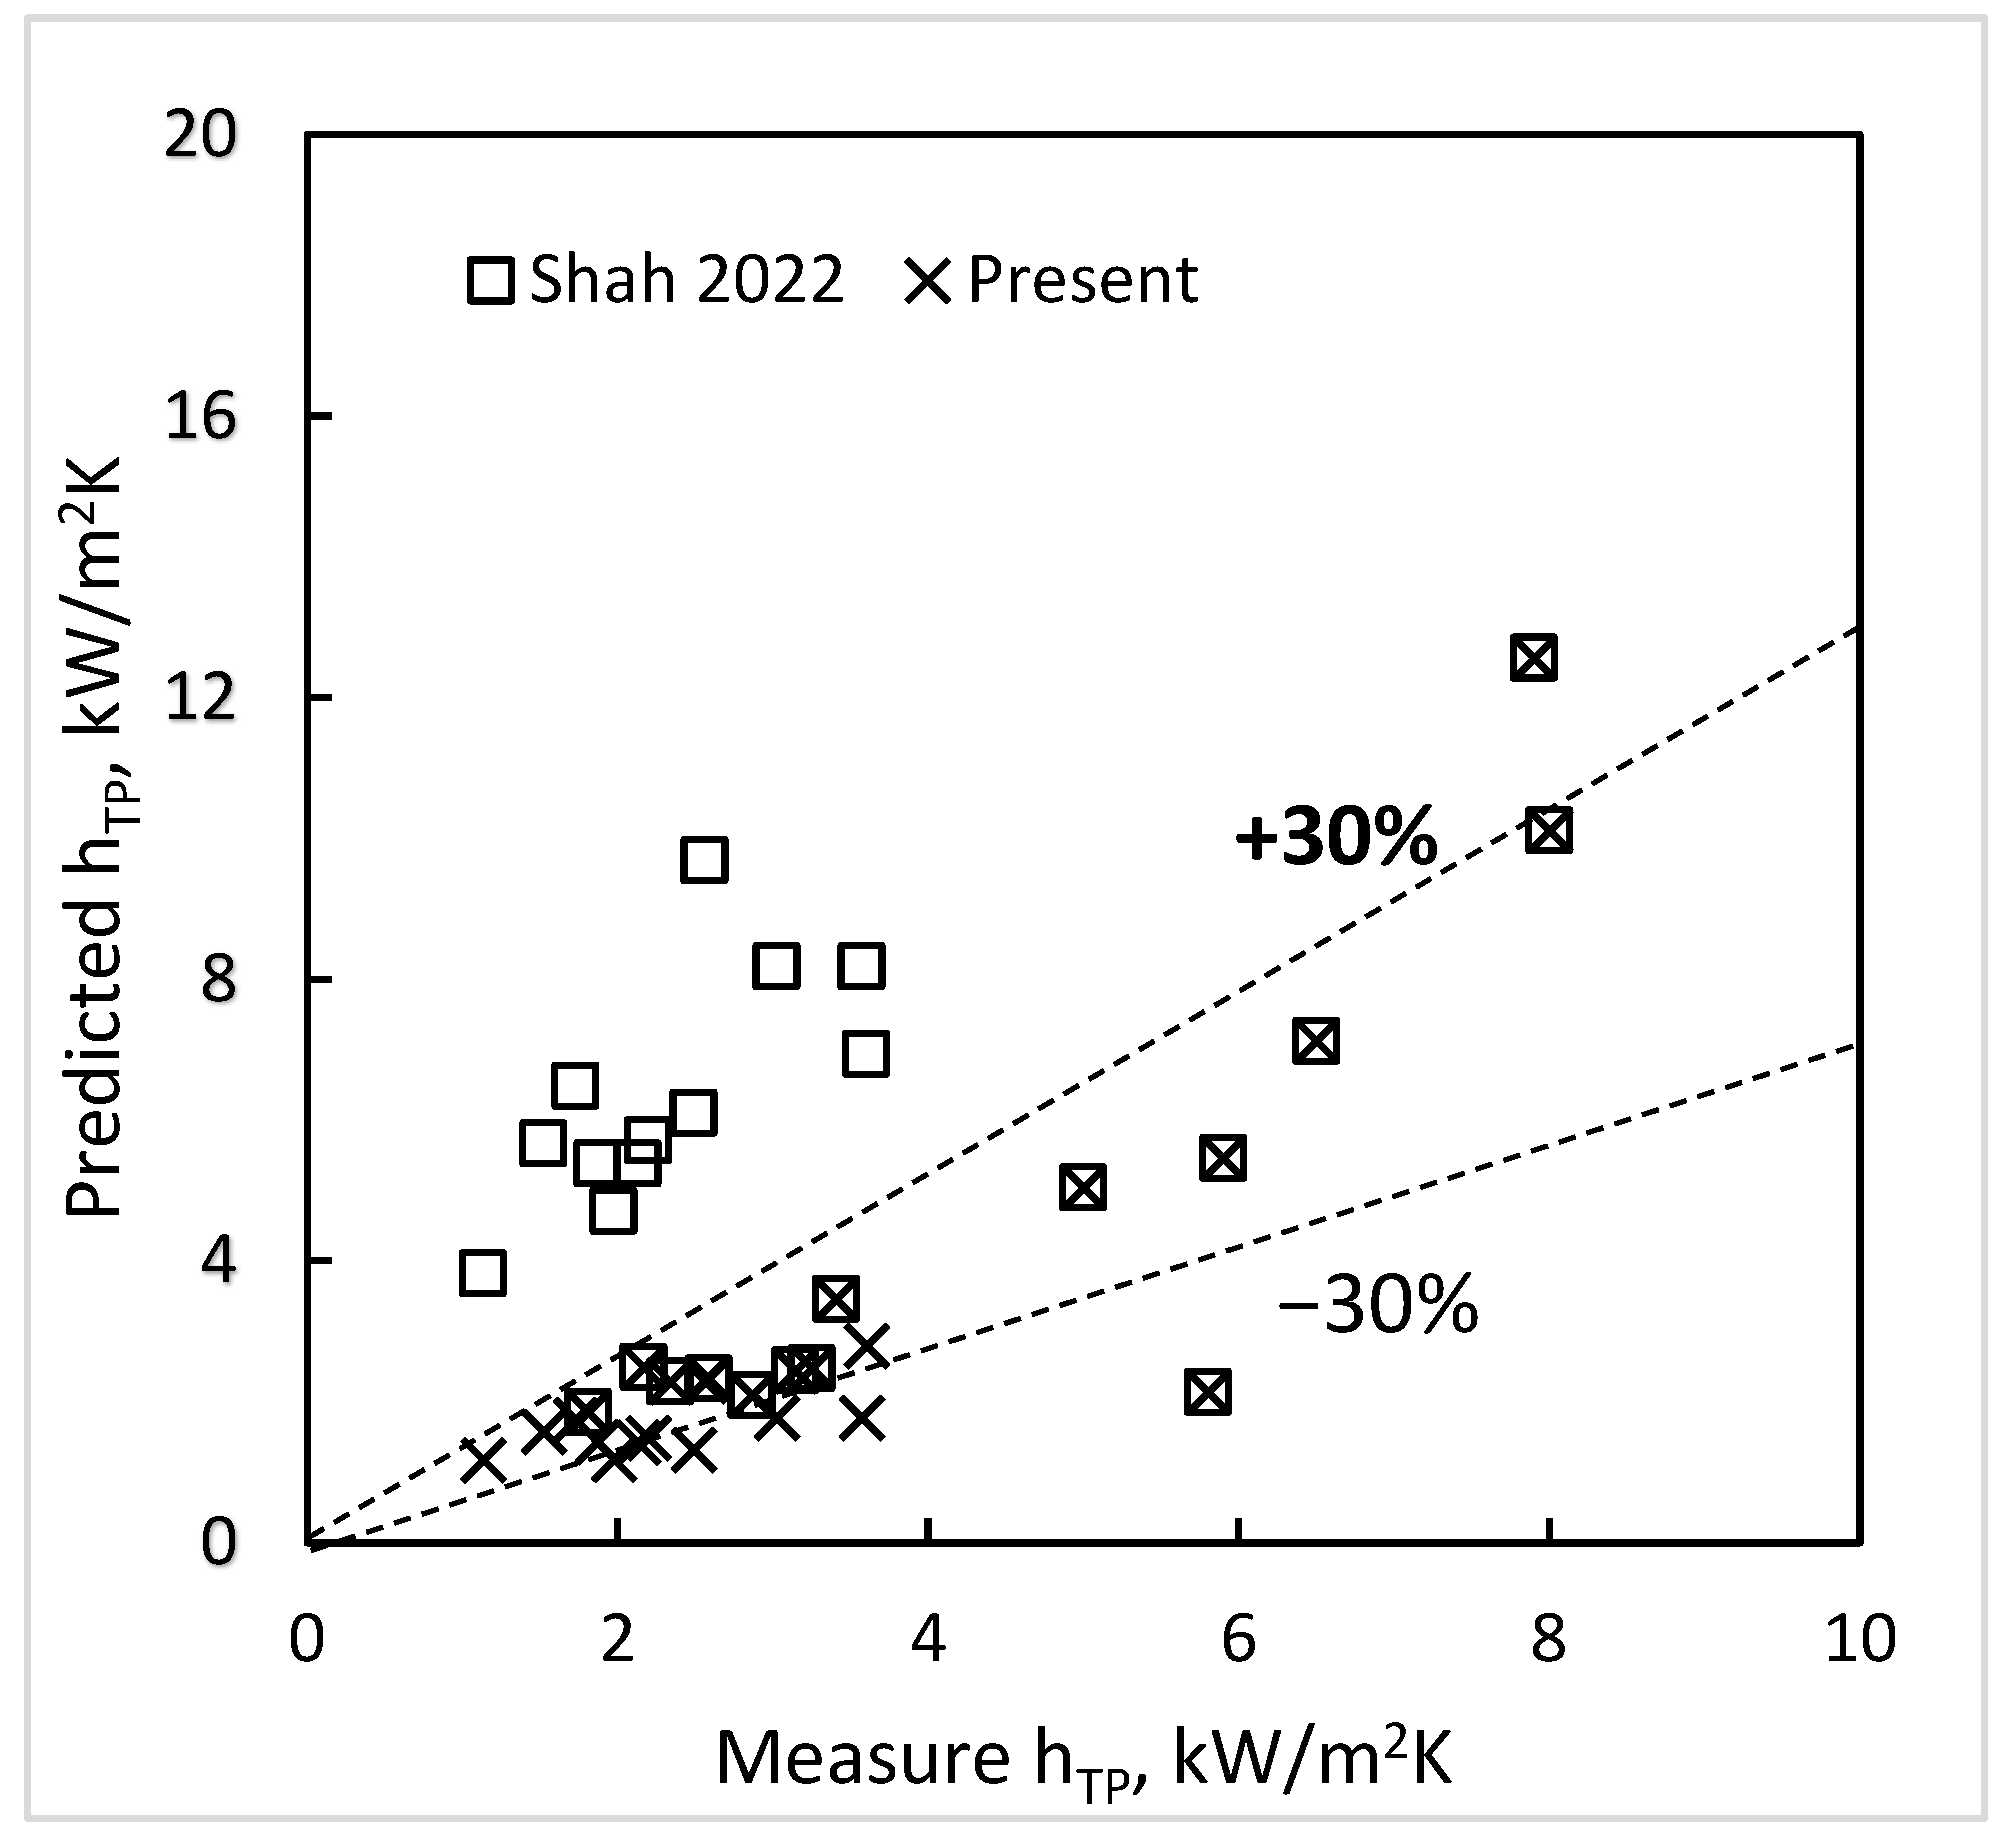
Table 1 and Figure 1 show the comparison of data for x ≥ 0.99 with the present and Shah [1] correlation. It is seen that the present correlation has far better accuracy. Most of the data points are within ±30% of the present correlation while a large number have much higher deviations with the Shah [1] correlation. The data showing large deviations are discussed now.

Figure 1.
Data for x ≥ 0.99 compared to the present and the Shah [1] correlation.
The one data point of Azzolin et al. [27] for HFE 7000 in a rectangular channel has a deviation of −63% with the present as well as the Shah [1] correlation. It is to be noted that all their data at all levels of quality are similarly underpredicted by almost all correlations. It indicates that these data are unusually high.
The one data point of Baird et al. [28] for R-123 in a round tube has a deviation of +59% with the present as well as the Shah [1] correlation. All their data at all qualities are similarly overpredicted by most correlations. For example, the correlation of Moradkhani et al. has an AD of +81.7% and the Kim and Mudawar correlation has an AD of +61.1%.
If the above two data points are deleted, the MAD of the present correlation drops from 22% to 19%.
5.2. Effect of Weber Number
Among the data for x ≥ 0.99, there was only one data point for WeGT < 100. That data point is from Al-Zaidi et al. [27] in a rectangular channel with DHYD of 0.57 mm. The channel was horizontal. The deviation of Shah [1] is 95% while that of the present correlation is −2.1%. According to Shah’s [1] correlation, the regime changes from I to II when WeGT < 100 because of the effect of surface tension; the predicted heat transfer coefficient is then the sum of those given by Equations (10) and (12). According to the present correlation, regime is always I when x ≥ 0.99; therefore, the predicted heat transfer coefficient is given by Equation (12) only.
There were no data for x ≥ 0.99 for vertical channels. At x ≥ 0.99, the flow pattern will also be annular and hence regime will be I.
As there is only one data point for WeGT < 100 and that is for horizontal channels, there is a need for further verification through data analysis for both horizontal and vertical channels.
5.3. Data for All Qualities
The new data collected during the present research included data qualities from zero to one. Table 2 shows the comparison of those data with the present and some other correlations. It is seen that the present correlation has by far the least MAD at 14.9%. The next best is the correlation of Moradkhani et al. with MAD of 21.6%. The MAD of the Shah [1] correlation is higher than the present correlation entirely due to the high deviations of data at x ≥ 0.99.
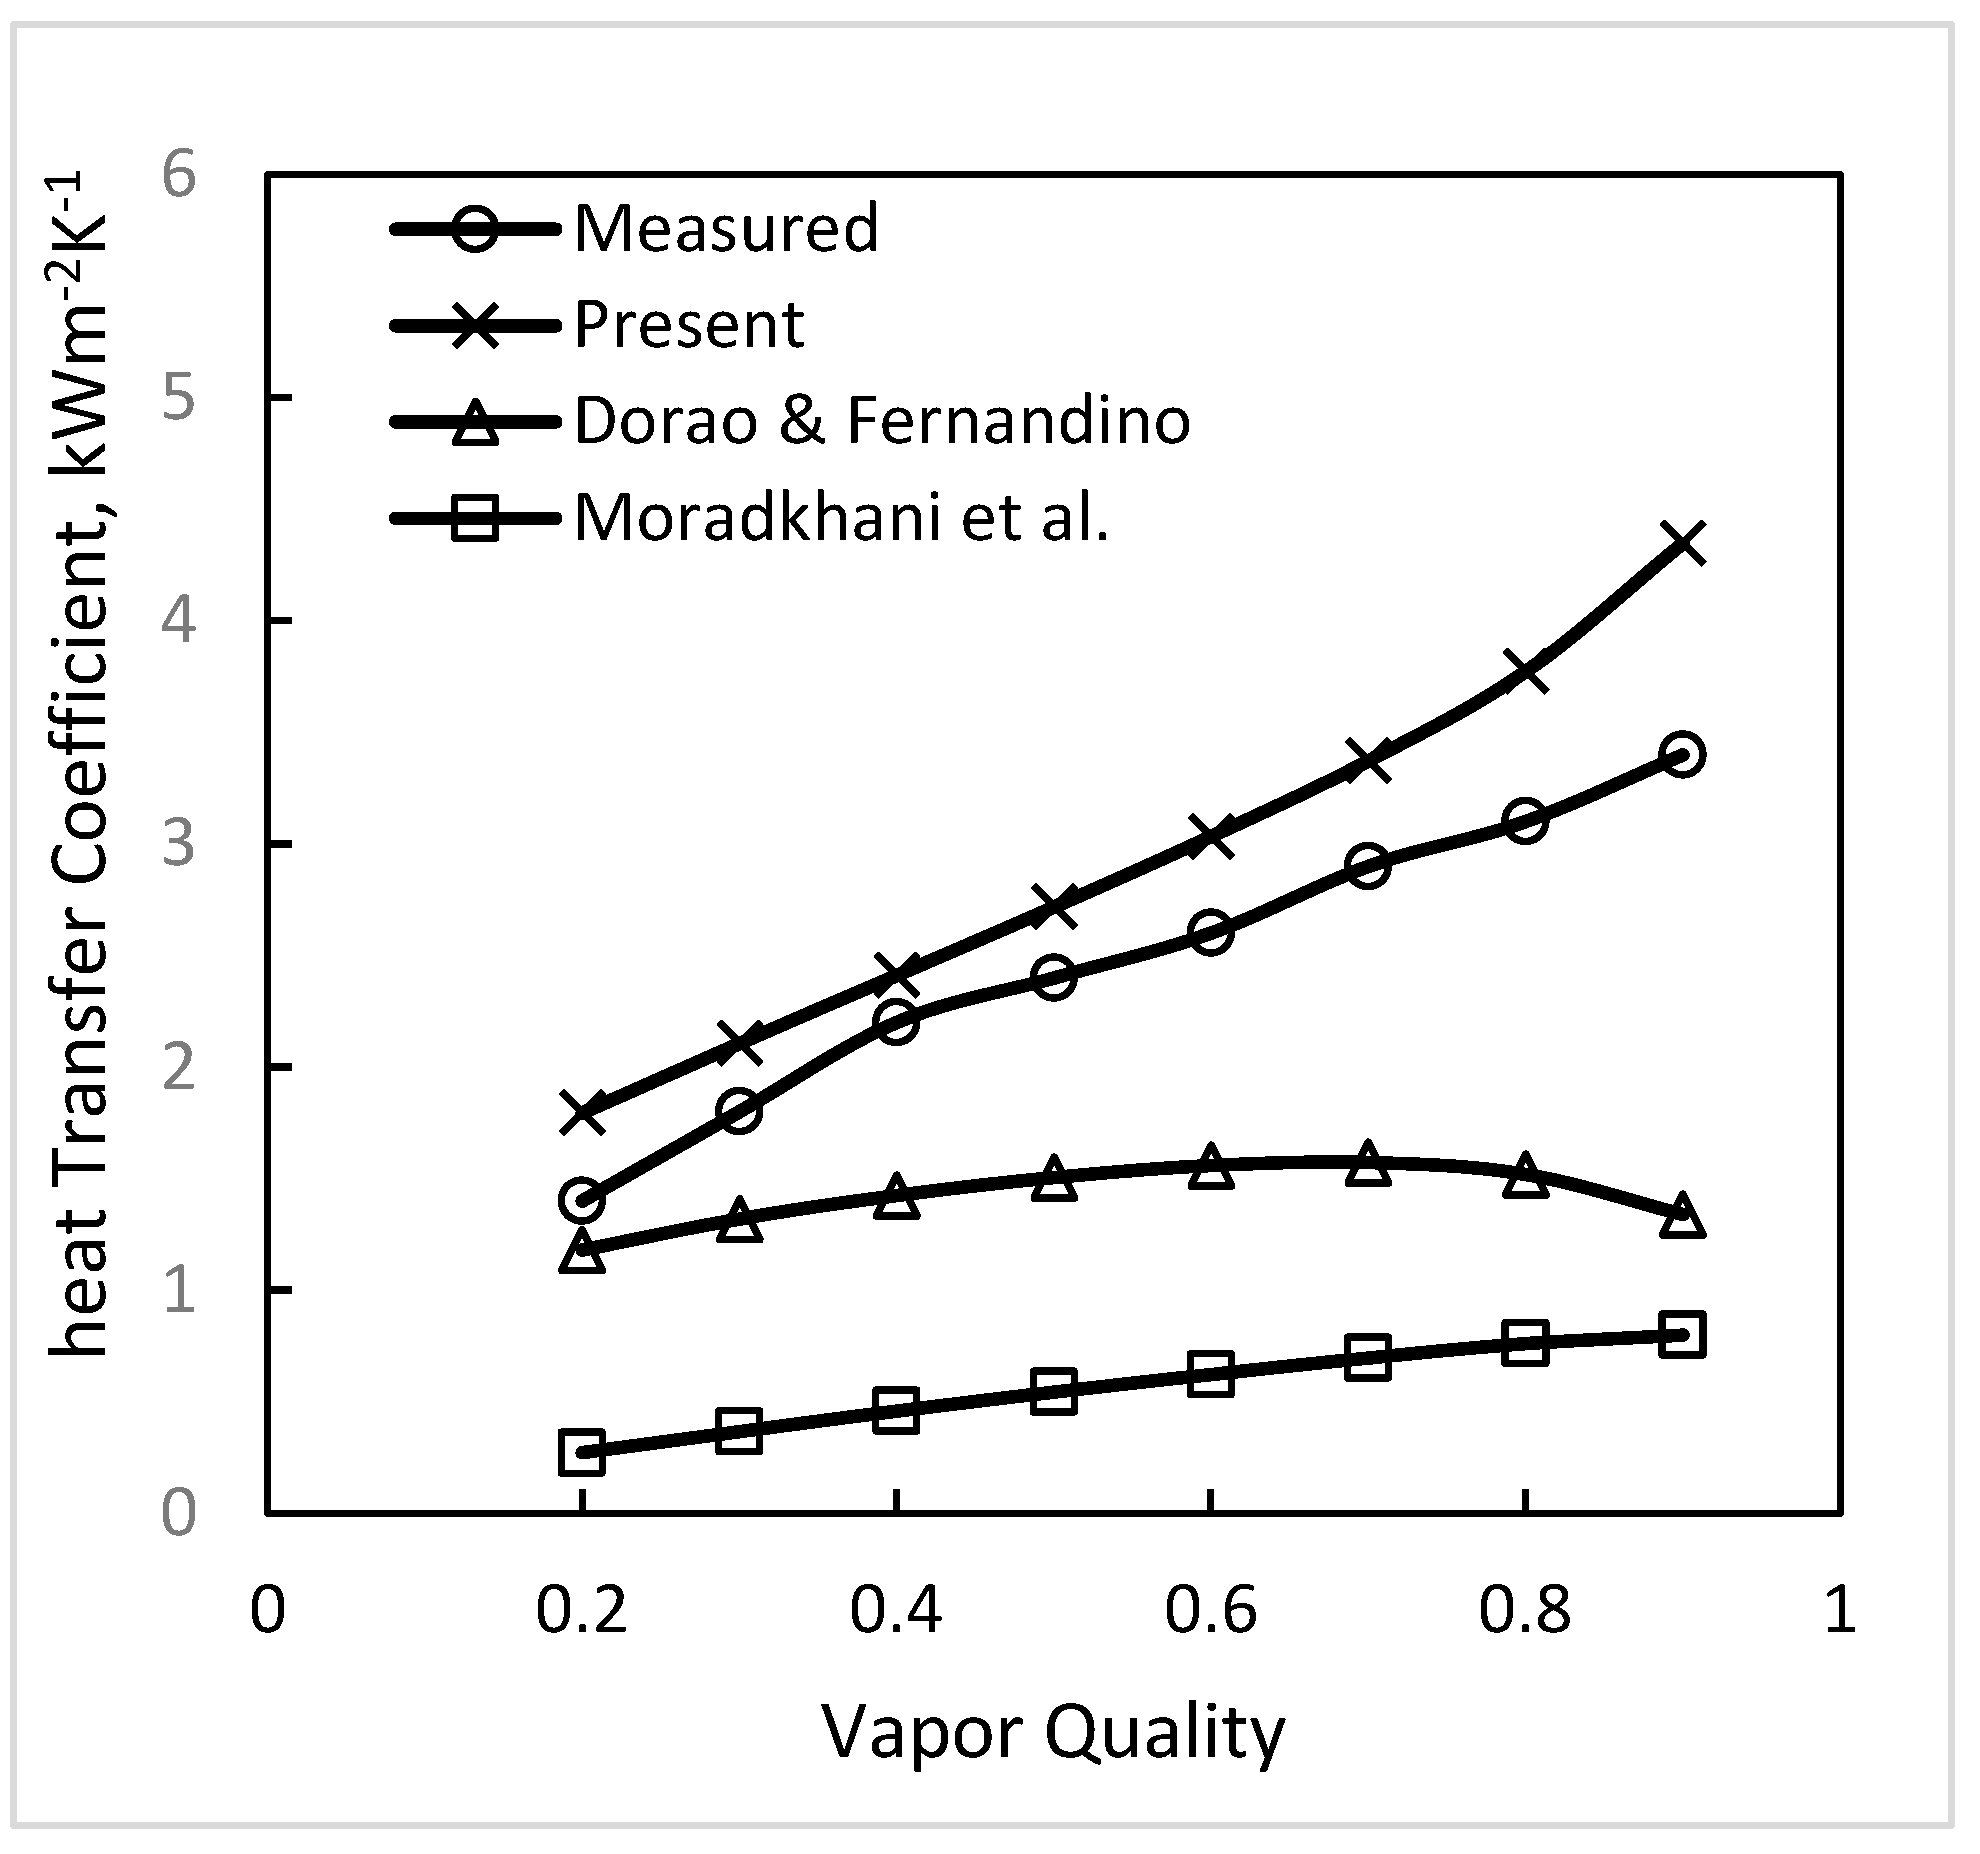
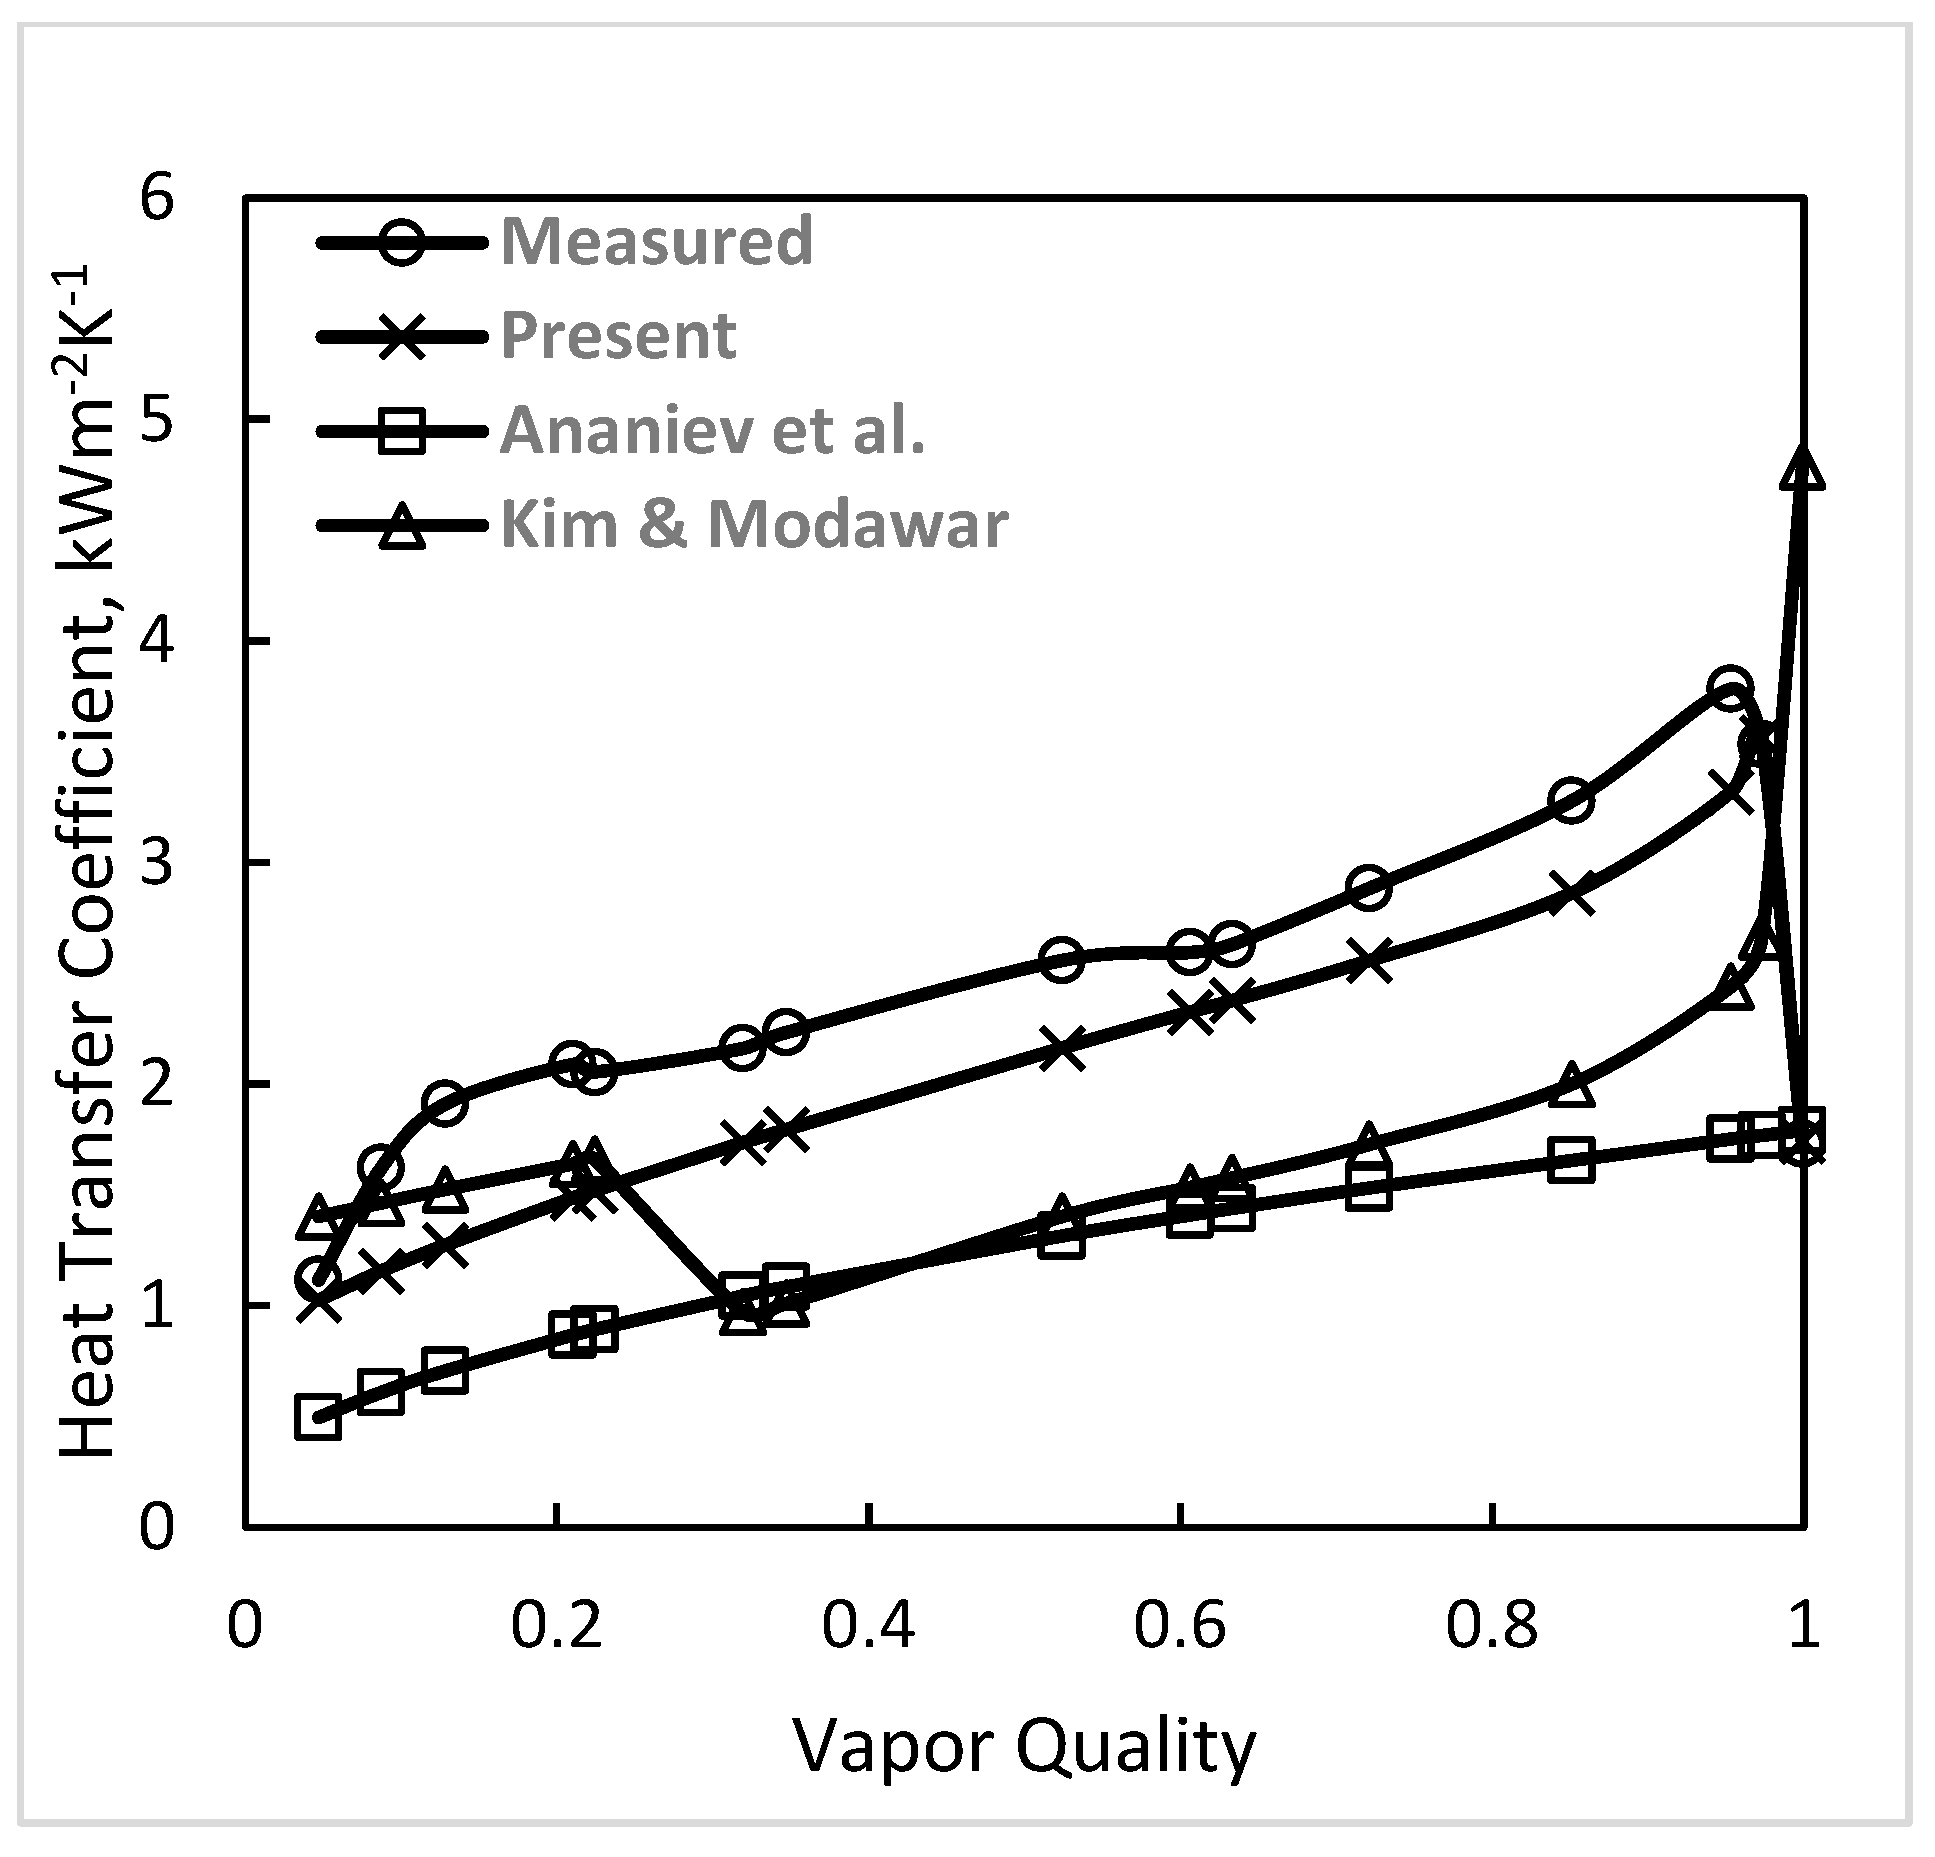
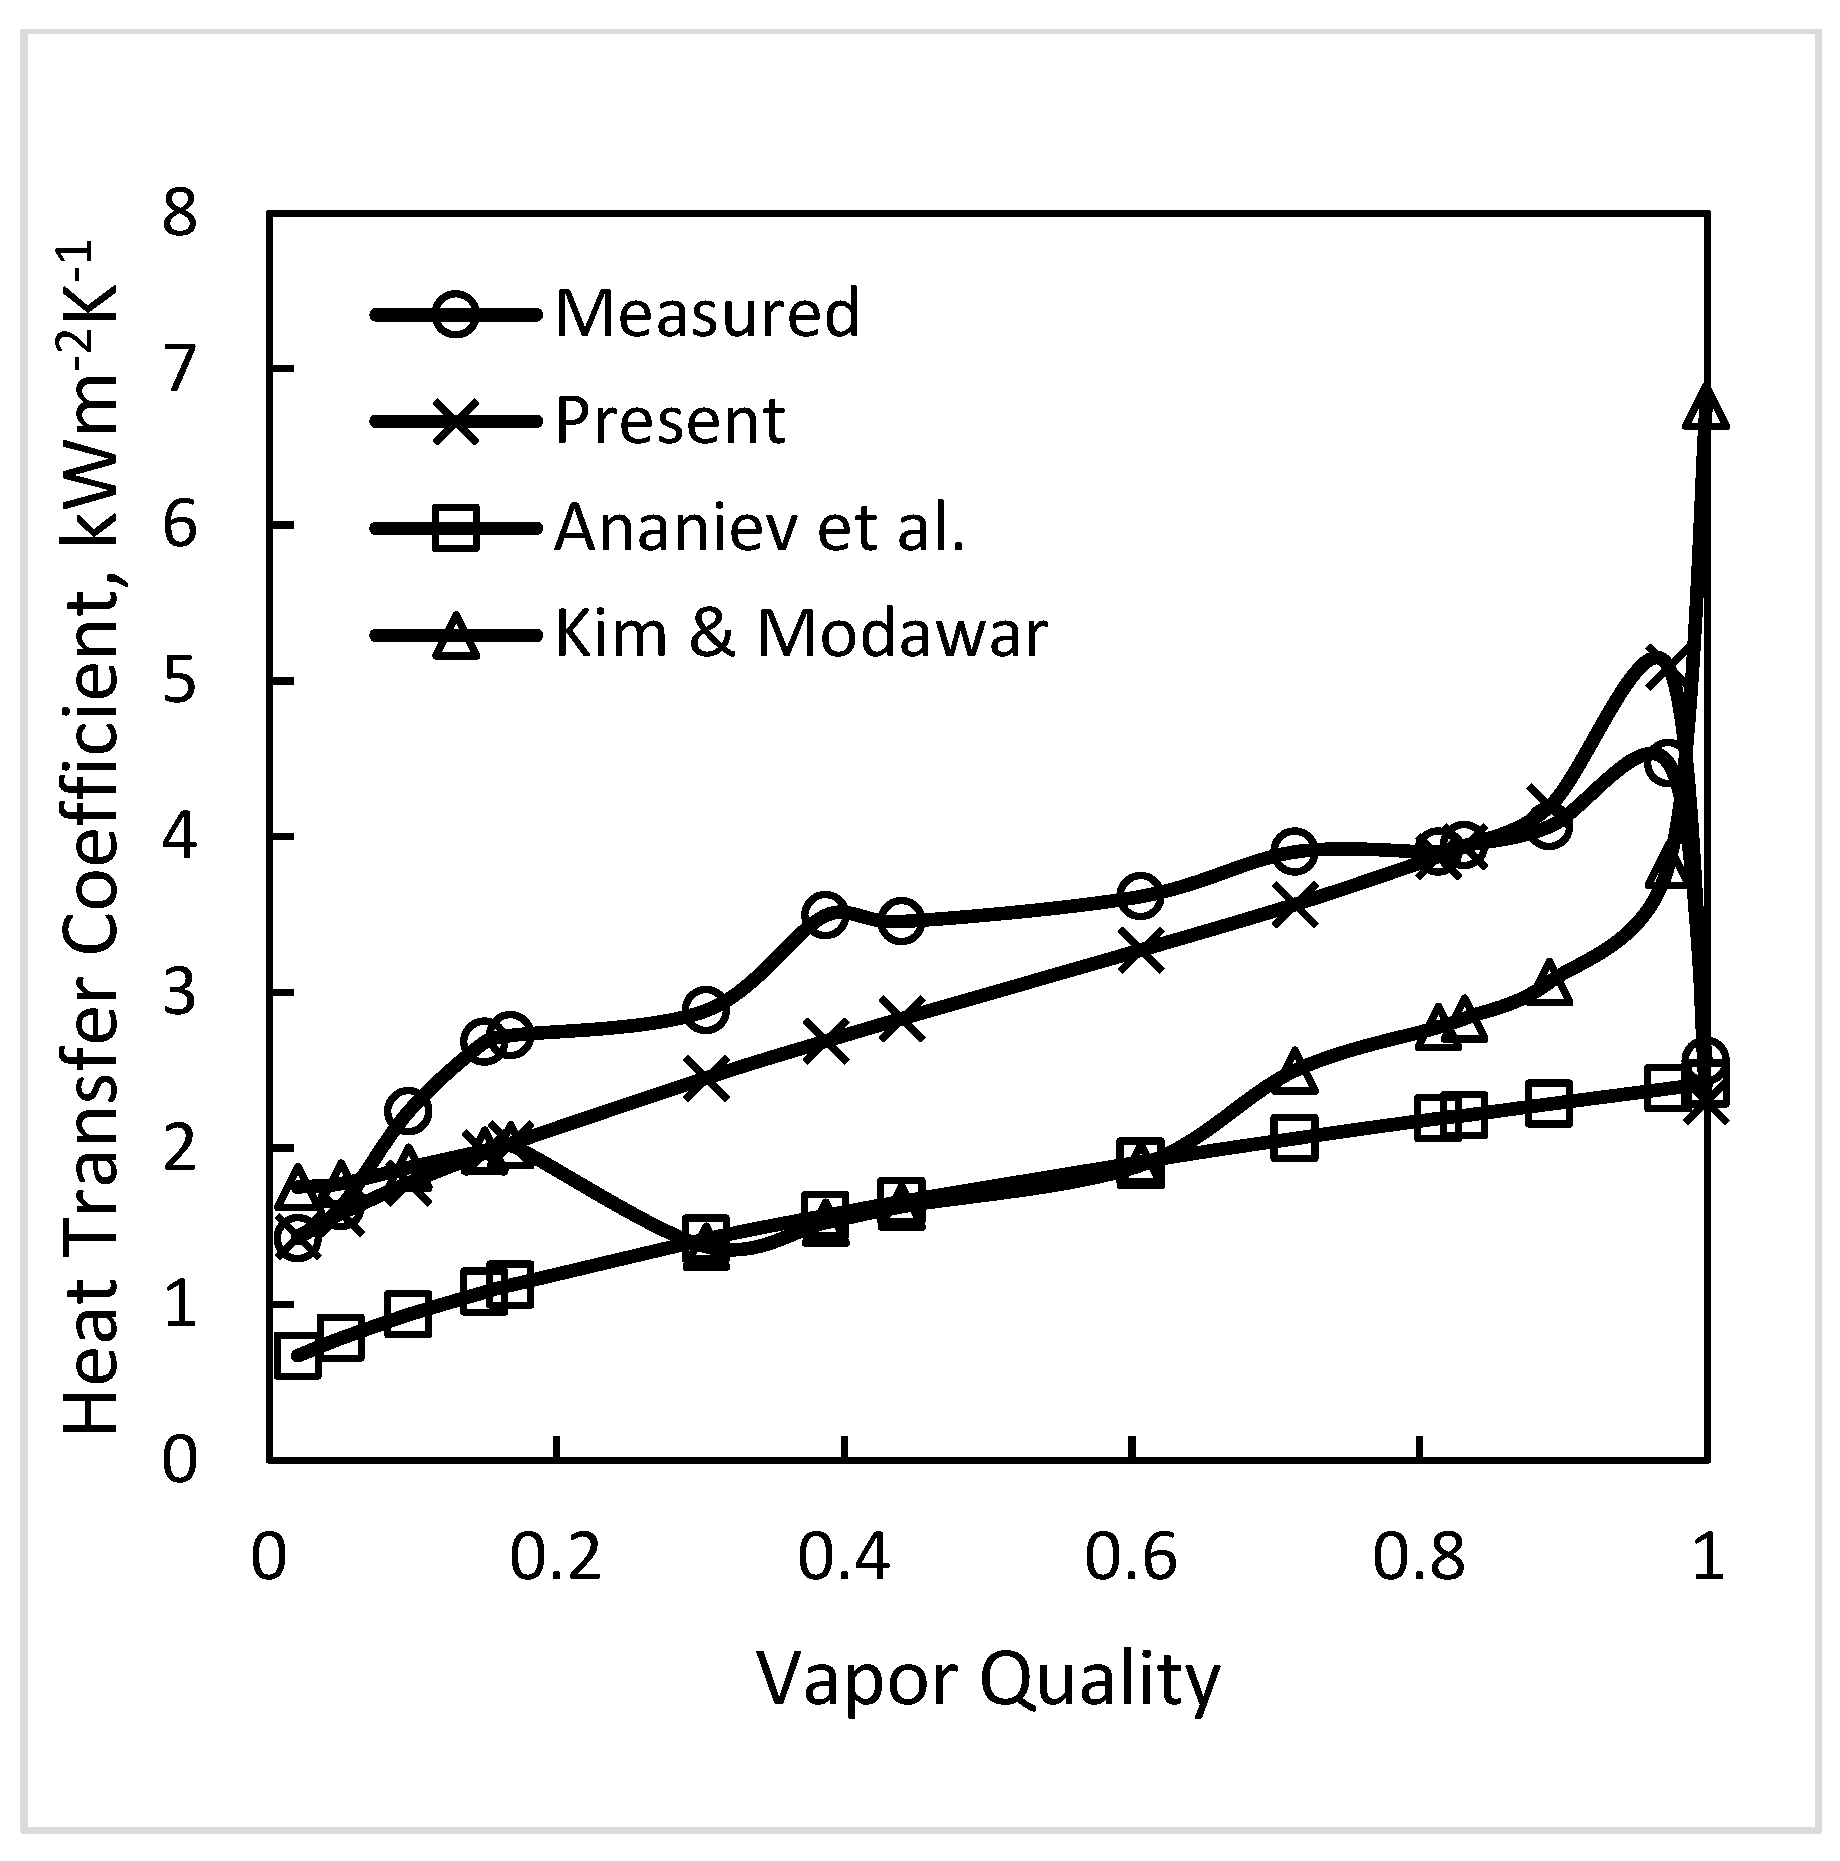
Figure 2, Figure 3, Figure 4 and Figure 5 show the comparison of newly collected data with several correlations. The considerable superiority of the present correlation is seen.

Figure 2.
Data of Al-Zaidi et al. [27] compared to the present and some other correlations. HFE 7100, G = 64 kg·m−2s−1, TSAT = 60 °C.
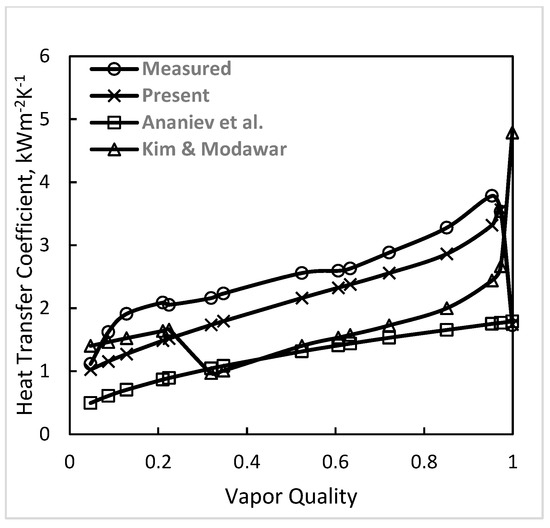
Figure 3.
Data of Agarwal and Hrnjak [17] for R-134a compared to some correlations. TSAT = 30 °C, G = 100 kg·m−2s−1.
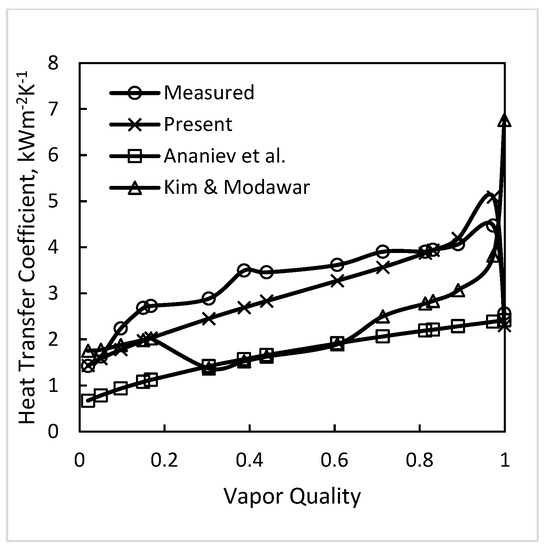
Figure 4.
Data of Agarwal and Hrnjak [17] for R-32 compared to some correlations. TSAT = 30 °C, G = 100 kg·m−2s−1.
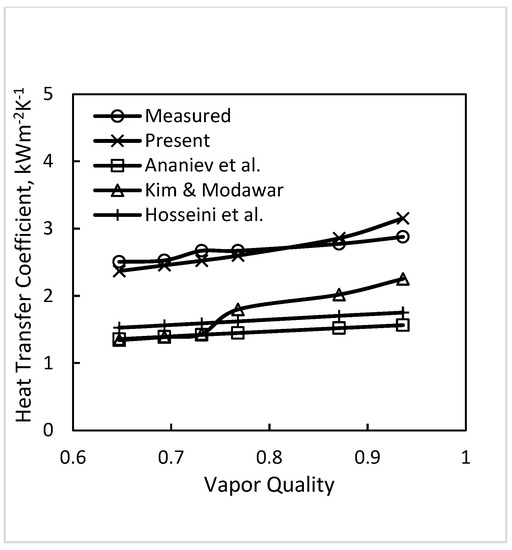
Figure 5.
Data of Kondou and Hrnjak [13] for carbon dioxide compared to some correlations. TSAT = 14.3 °C, G = 100 kg·m−2s−1.
5.4. Results for the Entire Database
The database used in Shah [1] included 51 fluids (water, refrigerants, chemicals, cryogens), diameters 0.08 to 49.0 mm, reduced pressures 0.0006 to 0.949, mass flux from 1.1 to 1400 kg·m−2s−1, various shapes (round, rectangular, triangular, etc.), single and multi-channels, annuli, horizontal and vertical downflow. The data added during this study have been listed in Table 2.
Table 3 lists the deviations of all correlations for the entire database. The conclusions that can be drawn from them are the same as were stated in Shah [1] but are briefly stated here for the sake of completeness. It is seen that for vertical tubes, only the Shah correlation gives good agreement with MAD of 17.4%. The MAD of other correlations ranges from 27.2% to 37.9%. Similar is the situation for horizontal channels with WeGT < 100, the MAD of the present correlation being 21.8% while that of others ranges from 30.9% to 45.2%. For horizontal channels with WeGT > 100, the correlations of others perform better with their MAD ranging from 18.8% to 26.3%, the MAD of the present correlation is 17.1%. Thus, the other correlations perform fairly well in the macro channel range but fare poorly in the mini channel range. The Moradkhani et al. correlation performs best among other correlations but the detailed analysis in Shah [1] showed that it works poorly for water and heat transfer fluids (HFEs, FC-72, Dowtherm).
Table 3.
Results for the entire database, deviations of various correlations.
6. Conclusions
- An improved version of the Shah [1] correlation has been presented. The improvement is in the range of quality ≥0.99. In this range, the present correlation has a MAD of 22.1% while that of the Shah [1] correlation is 95.0%.
- This improved accuracy is very important for the calculation of heat transfer during condensation of superheated vapors as widely used models for it require the heat transfer coefficient at x = 1.
- The present correlation has a MAD of 17.7% for the 8492 data points from 132 sources for horizontal and vertical channels. These include 51 fluids (water, refrigerants, chemicals, cryogens), diameters 0.08 to 49.0 mm, reduced pressures 0.0006 to 0.949, mass flux from 1.1 to 1400 kg·m−2s−1, various shapes (round, rectangular, triangular, etc.), single and multi-channels, and annuli.
- The MAD of other correlations was considerably higher. Their agreement was very poor for horizontal channels with WeGT < 100 (mini channel range) and for vertical channels.
Funding
This research received no external funding.
Informed Consent Statement
Not applicable.
Data Availability Statement
All data used in this paper were read from the refrenced papers.
Conflicts of Interest
The author declares no conflict of interest.
Nomenclature
| AD | Average deviation, (-) |
| CPG | Specific heat of vapor at constant pressure, J kg−1K−1 |
| D | inside diameter of tube, m |
| DHP | equivalent diameter based on perimeter with heat transfer, defined by Equation (21), m |
| DHYD | hydraulic equivalent diameter defined by Equation (22), m |
| FrLT | , (-) |
| G | total mass flux (liquid + vapor), kg m−2s−1 |
| g | acceleration due to gravity, m s−2 |
| h | heat transfer coefficient, W m−2 K−1 |
| hFC | forced convection singl-phase heat transfer coefficient of vapor, W m−2 K−1 |
| hI | heat transfer coefficient given by Equation (2), W m−2 K−1 |
| hGS | heat transfer coefficient assuming vapor phase flowing alone in the tube, W m−2 K−1 |
| hLS | heat transfer coefficient assuming liquid phase flowing alone in the tube, W m−2 K−1 |
| hLT | heat transfer coefficient with total mass flowing as liquid, W m−2 K−1 |
| hmix | heat transfer coefficient of mixture during condensation, W m−2 K−1 |
| hNu | heat transfer coefficient given by Eq.(3), the Nusselt equation, W m−2 K−1 |
| hSAT | Heat transfer coefficient of saturated vapor at x = 1, W m−2 K−1 |
| hTP | two-phase heat transfer coefficient, W m−2 K−1 |
| Jg | dimensionless vapor velocity defined by Equation (14) |
| k | thermal conductivity, W m−1 K−1 |
| MAD | Mean absolute deviation, (-) |
| N | number of data points, (-) |
| pr | reduced pressure, (-) |
| Pr | Prandtl number, (-) |
| q | Heat flux, Wm−2 |
| qlat | Heat flux due to phase change only, Wm−2 |
| ReGT | Reynolds number for all mass flowing as vapor = GDμG−1, (-) |
| ReLS | Reynolds number assuming liquid phase flowing alone, = G (1 − x)DμL−1, (-) |
| ReLT | Reynolds number for all mass flowing as liquid = GDμL−1, (-) |
| T | Temperature, K |
| TBP | Bubble point of mixture, K |
| TDP | Dew point of temperature, K |
| Tglide | (TDP − TBP), K |
| TSAT | saturation temperature, °C |
| Tw | wall temperature, °C |
| ΔT | = (TSAT − Tw), K |
| WeGT | Weber number for all mass flowing as vapor, defined by Equation (4), (-) |
| x | vapor quality, (-) |
| Z | Shah’s correlating parameter, =(1/x − 1)0.8 pr0.4, (-) |
| Greek | |
| μ | dynamic viscosity, Pa. s |
| ρ | density, kg m−3 |
| ∑ | Mathematical symbol for summation |
| σ | Surface tension, Nm−1 |
| Subscripts | |
| G | vapor |
| L | liquid |
References
- Shah, M.M. Improved correlation for heat transfer during condensation in mini and macrochannels. Int. J. Heat Mass Transf. 2022, 194, 123069. [Google Scholar] [CrossRef]
- Shah, M.M. A general correlation for heat transfer during film condensation inside pipes. Int. J. Heat Mass Transf. 1979, 22, 547–556. [Google Scholar] [CrossRef]
- Shah, M.M. An improved and extended general correlation for heat transfer during condensation in plain tubes. HVAC&R Res. 2009, 15, 889–913. [Google Scholar]
- Shah, M.M. General correlation for heat transfer during condensation in plain tubes: Further development and verification. ASHRAE Trans. 2013, 119, 3–11. [Google Scholar]
- McAdams, W.H. Heat Transmission, 3rd ed.; McGraw Hill: New York, NY, USA, 1954. [Google Scholar]
- Shah, M.M. A new flow pattern based general correlation for heat transfer during condensation in horizontal tubes. In Proceedings of the 15th International Heat Transfer Conference (IHTC-15), Kyoto, Japan, 10–15 August 2014. [Google Scholar]
- El Hajal, J.; Thome, J.R.; Cavallini, A. Condensation in horizontal tubes, part I: Two-phase flow pattern map. Int. J. Heat Mass Trans. 2003, 46, 3349–3363. [Google Scholar] [CrossRef]
- Shah, M.M. A new correlation for heat transfer during condensation in horizontal mini/micro channels. Int. J. Refrig. 2016, 64, 187–202. [Google Scholar] [CrossRef]
- Shah, M.M. Comprehensive correlations for heat transfer during condensation in conventional and mini/micro channels in all orientations. Int. J. Refrig. 2016, 67, 22–41. [Google Scholar] [CrossRef]
- Shah, M.M. Improved correlation for heat transfer during condensation in conventional and mini/micro channels. Int. J. Refrig. 2019, 98, 222–237. [Google Scholar] [CrossRef]
- Lee, C.C.; Teng, Y.J.; Lu, D.C. Investigation of condensation heat transfer of superheated R-22 vapor in a horizontal tube. In Experimental Heat Transfer, Fluid Mechanics, and Thermodynamics, Proceedings of the Second World Conference on Experimental Heat Transfer, Fluid Mechanics, and Thermodynamics, Dubrovnik, Yugoslavia, 23–28 June 1991; Keffer, J.F., Shah, R.K., Ganic, E.N., Eds.; Elsevier: New York, NY, USA, 1991; pp. 1051–1057. [Google Scholar]
- Gnielinski, V. New equation of heat and mass transfer in turbulent pipe and channel flow. Int. Chem. Eng. 1976, 16, 359–367. [Google Scholar]
- Kondou, C.; Hrnjak, P.S. Condensation from superheated vapor flow of R744 and R410A at subcritical pressures in a horizontal smooth tube. Int. J. Heat Mass Transf. 2012, 55, 2779–2791. [Google Scholar] [CrossRef]
- Cavallini, A.; Del Col, D.; Doretti, L.; Matkovic, M.; Rossetto, L.; Zilio, C. Condensation in horizontal smooth tubes: A new heat transfer model for heat exchanger design. Heat Transf. Eng. 2006, 27, 31–38. [Google Scholar] [CrossRef]
- Petukhov, B.S. Heat transfer and friction in turbulent pipe flow with variable physical properties. Adv. Heat Transf. 1970, 6, 503–564. [Google Scholar]
- Agarwal, R.; Hrnjak, P.S. Effect of sensible heat, condensation in superheated and subcooled region incorporated in unified model for heat rejection in condensers in horizontal round smooth tubes. Appl. Therm. Eng. 2014, 71, 378–388. [Google Scholar] [CrossRef]
- Agarwal, R.; Hrnjak, P.S. Condensation in two phase and desuperheating zone for R1234ze(E), R134a and R32 in horizontal smooth tubes. Int. J. Refrig. 2015, 50, 172–183. [Google Scholar] [CrossRef]
- Webb, R.L. Convective condensation of superheated vapor. ASME J. Heat Transf. 1998, 120, 418–421. [Google Scholar] [CrossRef]
- Longo, G.A.; Righetti, G.; Claudio Zilio, C. A new computational procedure for refrigerant condensation inside herringbone-type Brazed Plate Heat Exchangers. Int. J. Heat Mass Transf. 2015, 82, 530–536. [Google Scholar] [CrossRef]
- Lemmon, E.W.; Huber, L.; McLinden, M.O. NIST Reference Fluid Thermodynamic and Transport Properties; REFPROP Version 9.1; NIST: Gaithersburg, MD, USA, 2013. [Google Scholar]
- Bell, K.; Ghaly, M. An approximate generalized design method for multicomponent/partial condenser. Am. Inst. Chem. Eng. Symp. Ser. 1973, 69, 72–79. [Google Scholar]
- Kim, S.; Mudawar, I. Universal approach to predicting heat transfer coefficient for condensing mini/micro-channel flow. Int. J. Heat Mass Transf. 2013, 56, 238–250. [Google Scholar] [CrossRef]
- Dorao, C.A.; Fernandino, M. Simple and general correlation for heat trans- fer during flow condensation inside plain pipes. Int. J. Heat Mass Transf. 2018, 122, 290–305. [Google Scholar] [CrossRef]
- Hosseini, S.H.; Moradkhani, M.A.; Valizadeh, M.; Zendehboudi, A.; Olazar, M. A general heat transfer correlation for flow condensation in single port mini and macro channels using genetic programming. Int. J. Refrig. 2020, 119, 376–389. [Google Scholar] [CrossRef]
- Moradkhani, M.A.; Hosseini, S.H.; Song, M. Robust and general predictive models for condensation heat transfer inside conventional and mini/micro channel heat exchangers. Appl. Therm. Eng. 2022, 201, 117737. [Google Scholar] [CrossRef]
- Ananiev, E.P.; Boyko, I.D.; Kruzhilin, G.N. Heat transfer in the presence of steam condensation in horizontal tubes. Int. Dev. Heat Transf. 1961, 2, 290–295. [Google Scholar]
- Al-Zaidi, A.H.; Mahmoud, M.M.; Karayiannis, T.G. Condensation flow patterns and heat transfer in horizontal microchannels. Exp. Therm. Fluid Sci. 2018, 90, 153–173. [Google Scholar] [CrossRef]
- Azzolin, M.; Bortolina, S.; Nguyen, L.P.L.; Lavieilleb, P.; Glushchuk, A.; Queeckers, P.; Miscevic, M.; Iorioc, C.S.; Del Col, D. Experimental investigation of in-tube condensation in microgravity. Int. Commun. Heat Mass Transf. 2018, 96, 69–79. [Google Scholar] [CrossRef]
- Baird, J.R.; Fletcher, D.F.; Haynes, B.S. Local condensation heat transfer rates in fine passages. Int. J. Heat Mass Transf. 2003, 46, 4453–4466. [Google Scholar] [CrossRef]
- Zhuang, X.R.; Chen, G.F.; Zou, X.; Song, Q.L.; Gong, M.Q. Experimental investigation on flow condensation of methane in a horizontal smooth tube. Int. J. Refrig. 2017, 78, 193–214. [Google Scholar] [CrossRef]
- Matkovic, M.; Cavallini, A.; Bortolin, S.; Del Col, D.; Rossetto, L. Heat transfer coefficient during condensation of a high pressure refrigerant inside a circular minichannel. In Proceedings of the 5th European Thermal-Sciences Conference, Eindhoven, The Netherland, 18–22 May 2008. [Google Scholar]
- Koyama, S.; Kuwahara, K.; Nakashita, K. Condensation of refrigerant in a multi-port channel. In Proceedings of the ASME 2003 1st International Conference on Microchannels and Minichannels, Rochester, NY, USA, 24–25 April 2003; pp. 193–205. [Google Scholar]
- Azer, N.Z.; Abis, L.V.; Soliman, H.M. Local heat transfer coefficients during annular flow con densation. ASHRAE Trans. 1972, 78, 135–143. [Google Scholar]
- Jung, D.; Cho, Y.; Park, K. Flow condensation heat transfer coefficients of R22, R134a, R407C, and R410A inside plain and microfin tubes. Int. J. Refrig. 2004, 27, 25–32. [Google Scholar] [CrossRef]

Publisher’s Note: MDPI stays neutral with regard to jurisdictional claims in published maps and institutional affiliations. |
© 2022 by the author. Licensee MDPI, Basel, Switzerland. This article is an open access article distributed under the terms and conditions of the Creative Commons Attribution (CC BY) license (https://creativecommons.org/licenses/by/4.0/).