
Sensing Spontaneous Combustion in Agricultural Storage Using IoT and ML
 , , , , and
Abstract
:1. Introduction
- The phenomenon of SC is a harmful event that may become active and remain unnoticed for a long period and, once sparked, can lead to a large fire outbreak, as it is also accepted by the NFPA that SC causes huge damage to agricultural storage areas. Therefore, if cotton is intended to be stored, there must be some mechanisms to maintain a check on SC within the storage area.
- The second challenge is the preservation of cotton quality during long storage times. Many harmful events and processes can alter cotton’s quality attributes during long storage., i.e., changes in cotton color, damage to seeds in raw cotton, spotted cotton and damage to cotton fineness, and the maturity of fiber [15].
- Self-heating works like a slow poison for cotton, as it not only increases the chances of big fire outbreaks upon extreme ignition, but also damages its quality silently; as a result, the stored cotton’s market value decreases.
- The above three research challenges highlight the requirement of such a mechanism by which storage owners can maintain a check on SC so that they may be able to decrease the chances of big fire outbreaks and the reduction in cotton quality caused by SC.
- Very limited research is available on self-heating and SC. The available research uses traditional methods to investigate SC factors and self-heating, and does not focus on the sensing of SC in real time. The previous systems for the identification of self-heating used laboratory methods and traditional tools and instruments. Hence, these old methods of self-heating detection did not incorporate modern mechanisms for the real-time monitoring of cotton in storage areas to identify self-heating and any abnormal circumstances.
- In the past few years, very limited research has been done in the domain of cotton quality and storage environment. Although some researchers have proposed efficient systems to improve and monitor the growth of crops, but they do not focus on the maintenance of quality during storage.
- In the field of agriculture, instrumental based quality measurements for cotton are extensively undertaken, but research grounding the adoption of processes and practices that can help in the maintenance of quality cotton during storage is still deficient. However, the most common external environmental factors that affect cotton’s quality during long storage were investigated, e.g., moisture and temperature. However, it is still required to investigate SC’s effects on cotton’s quality.
2. Related Work
3. Material and Methods
3.1. Background of SC and Its Effect on Cotton Quality
- Thermal self-heating occurs as a result of increases in temperature. This temperature rise may occur for two reasons—the storage area is very warm, or high temperatures occur due to internal reactions within the cotton;
- Chemical self-heating occurs due to moisture, fats/oils, the action of acids such as nitric or sulfuric acid, or by contact with oxidizing agents and with goods with a tendency to self-heat;
- Microbial heating occurs as a result of the presence of microbes in wet cotton bales that may produce small amounts of methane gas.
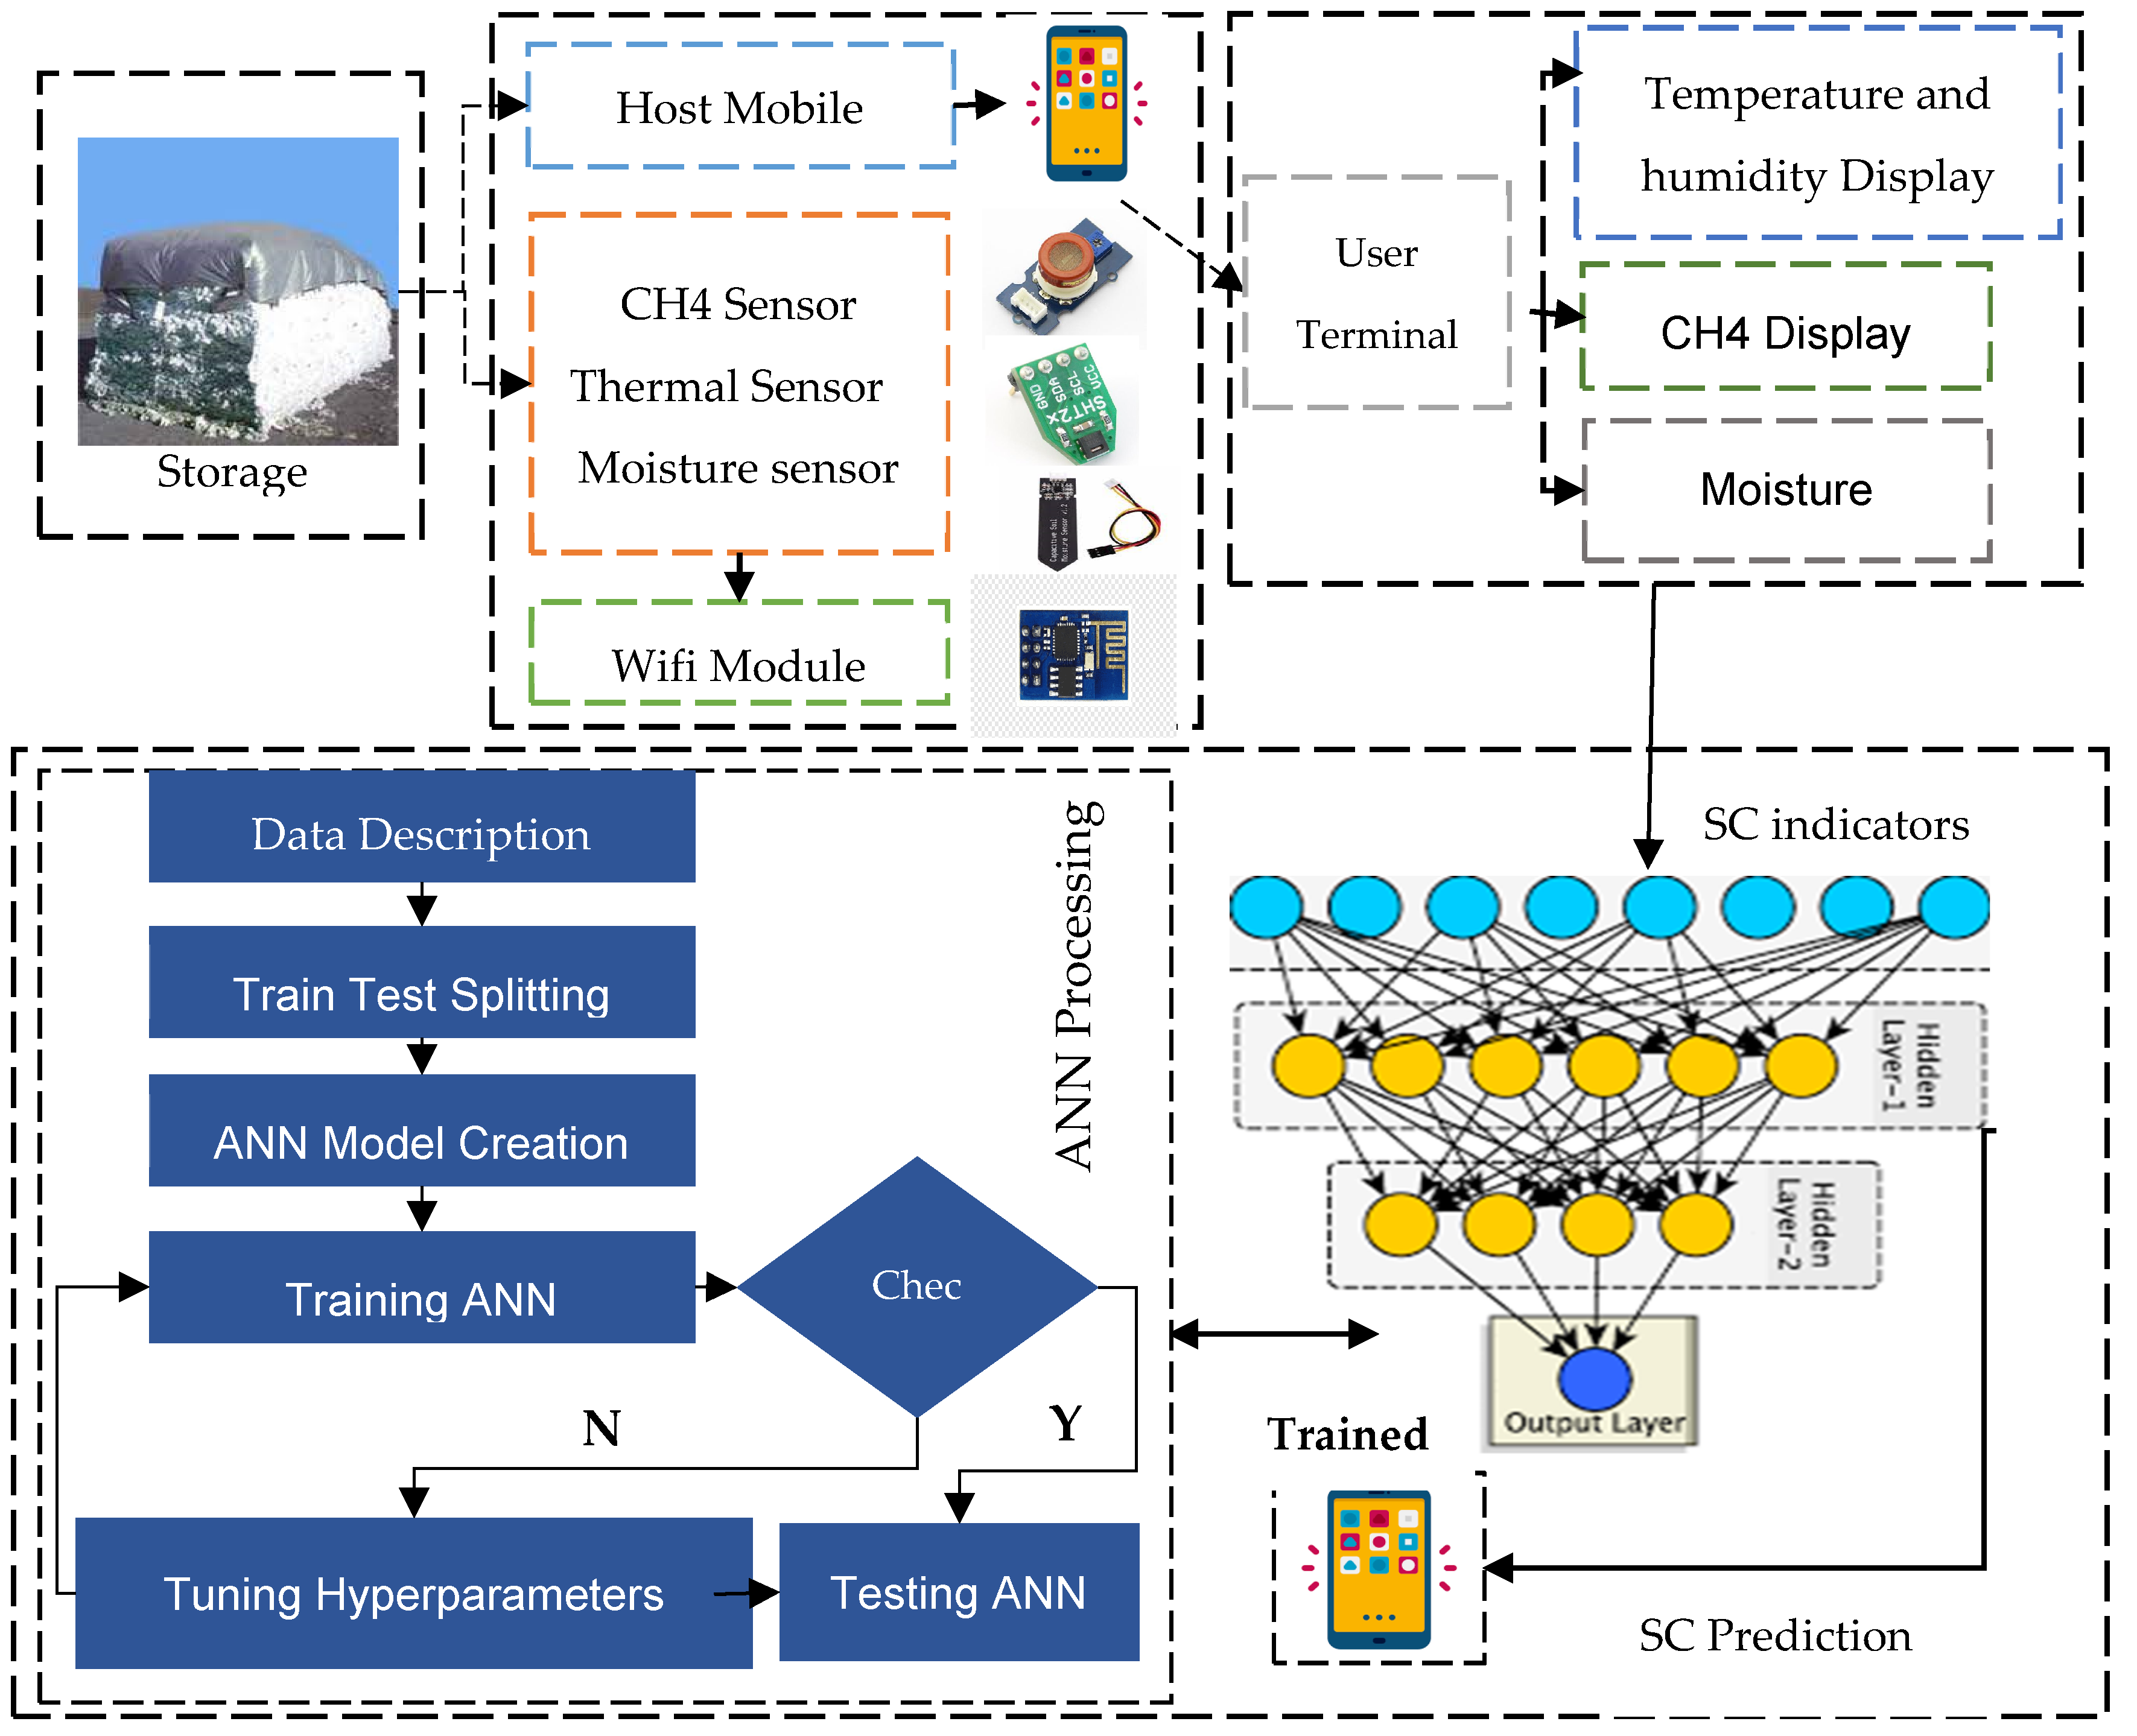
3.2. Architecture of Sensning Spontanous Combustion SSC
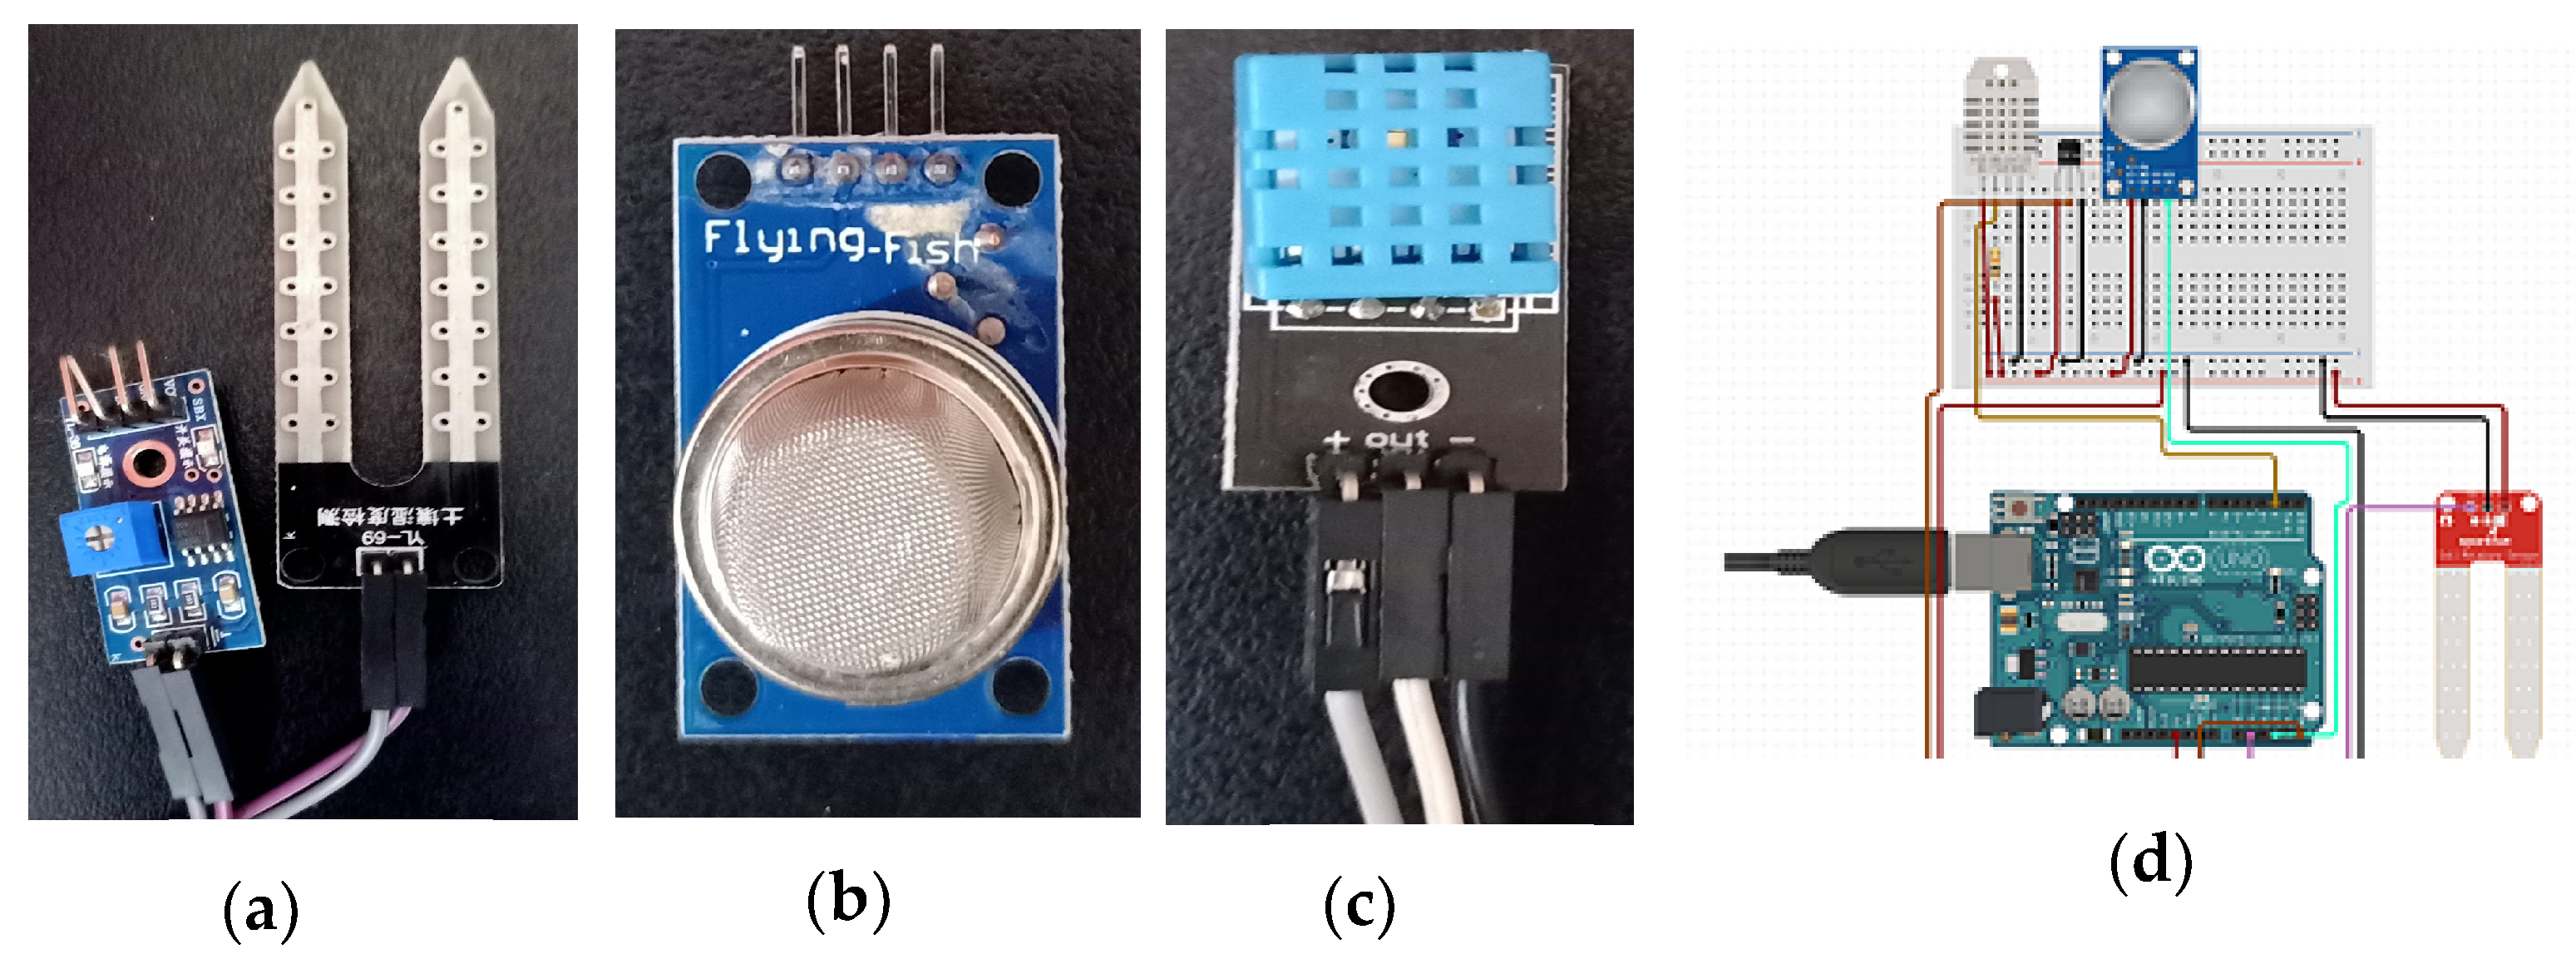
3.3. Implemented IoT Circuit Design
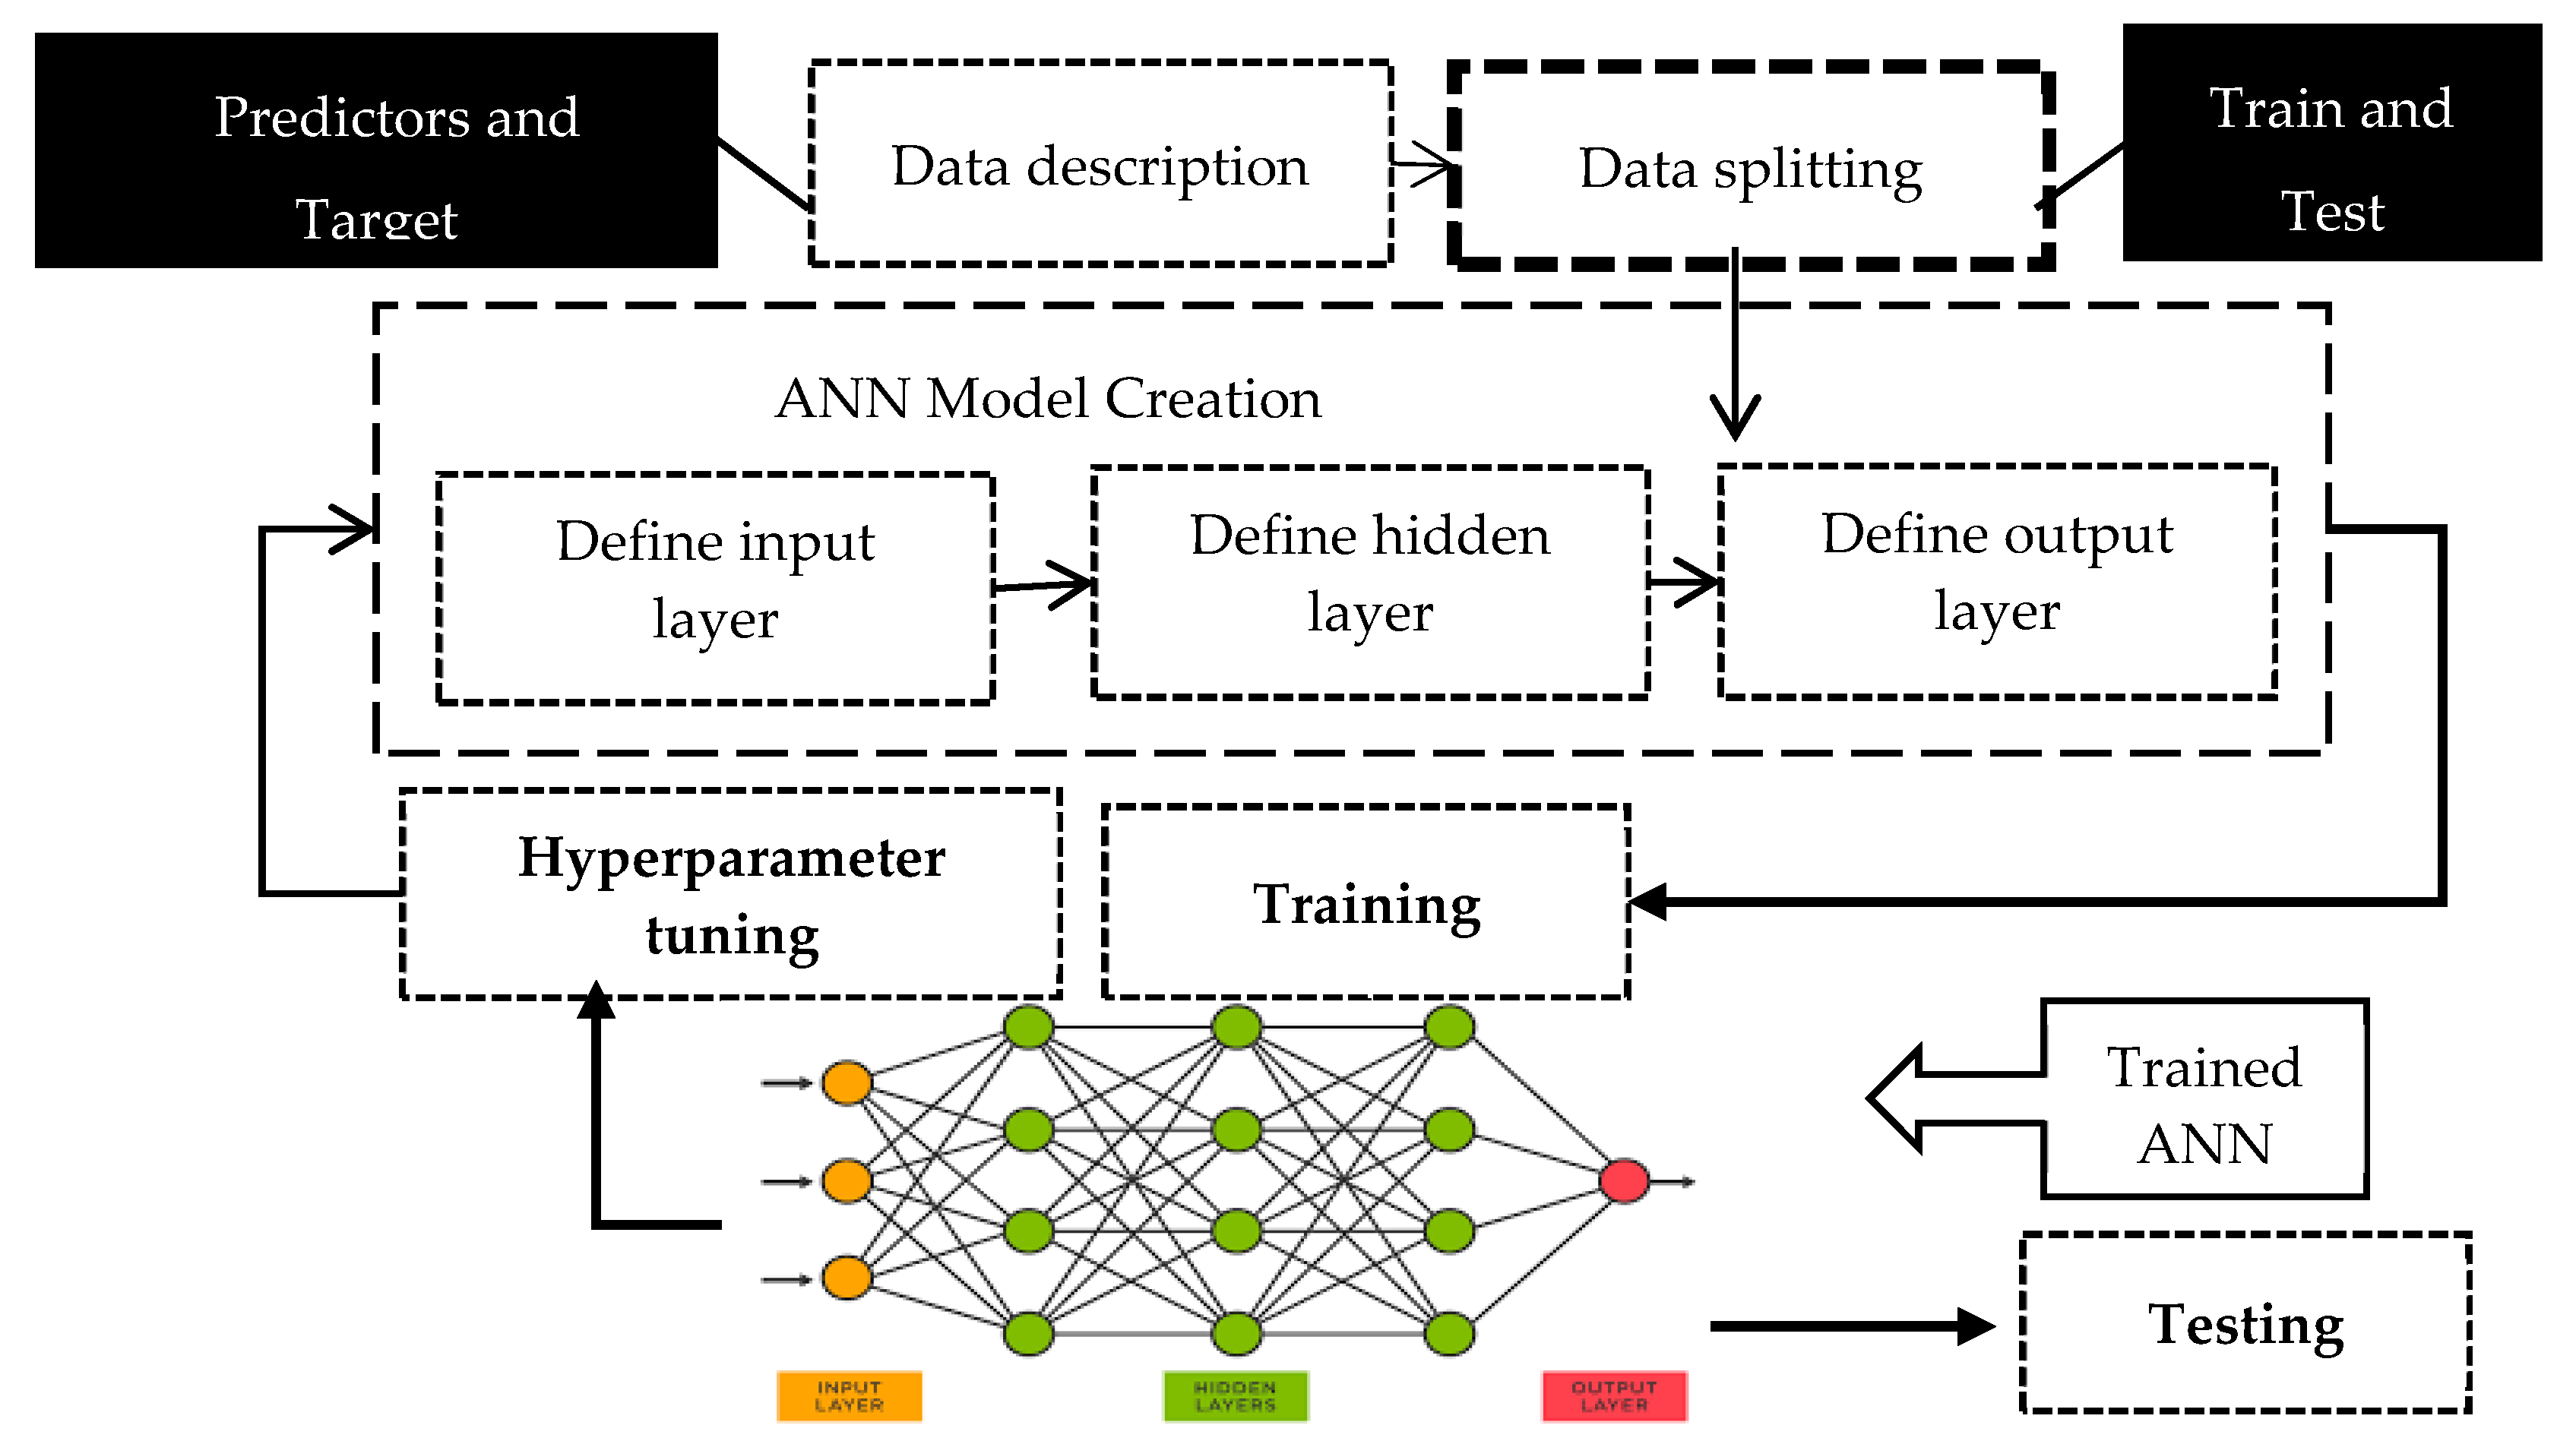
3.4. Machine Learning (ML)-Based Analysis
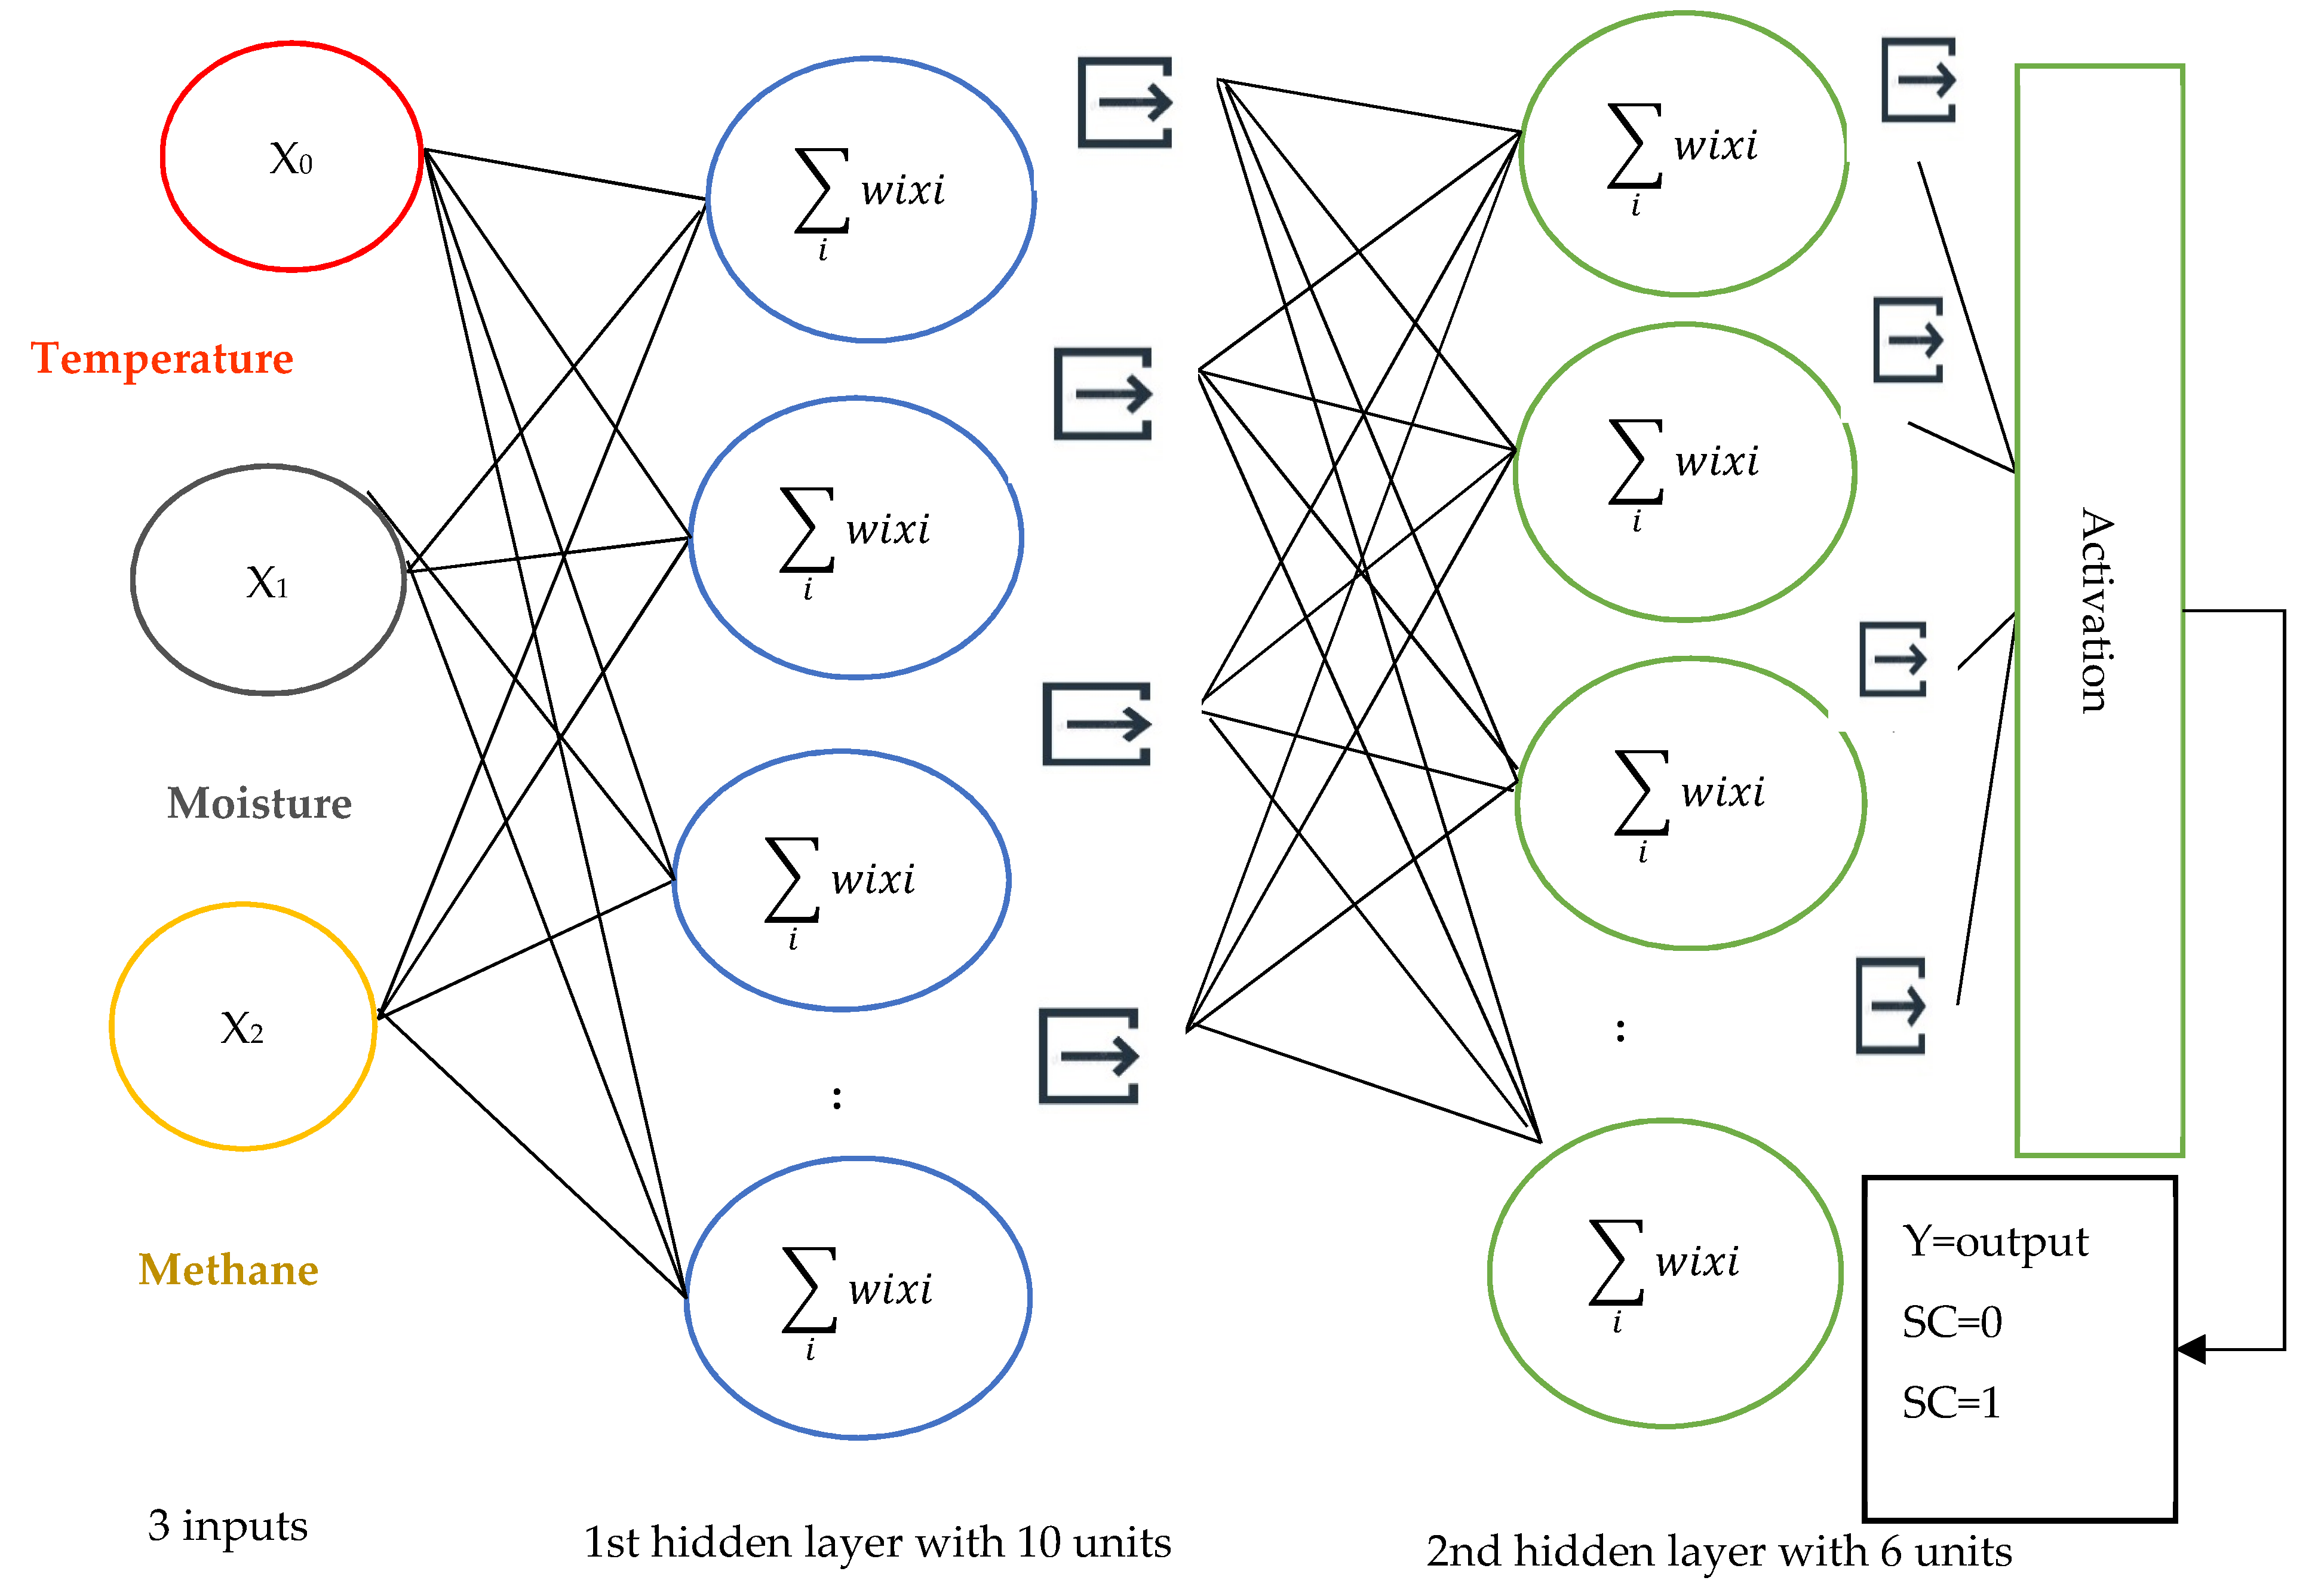
Implemented ANN Model
| Algorithm 1: ANN basic working algorithm |
|
- Xi = hidden layer input;
- Xi = input value;
- Wi = weight of Xi;
- ϑi = bias.
| Algorithm 2: Python algorithm used to implement ANN. |
activation = ‘relu’))
activation = ‘sigmoid’))
metrics = [‘accuracy’])
|
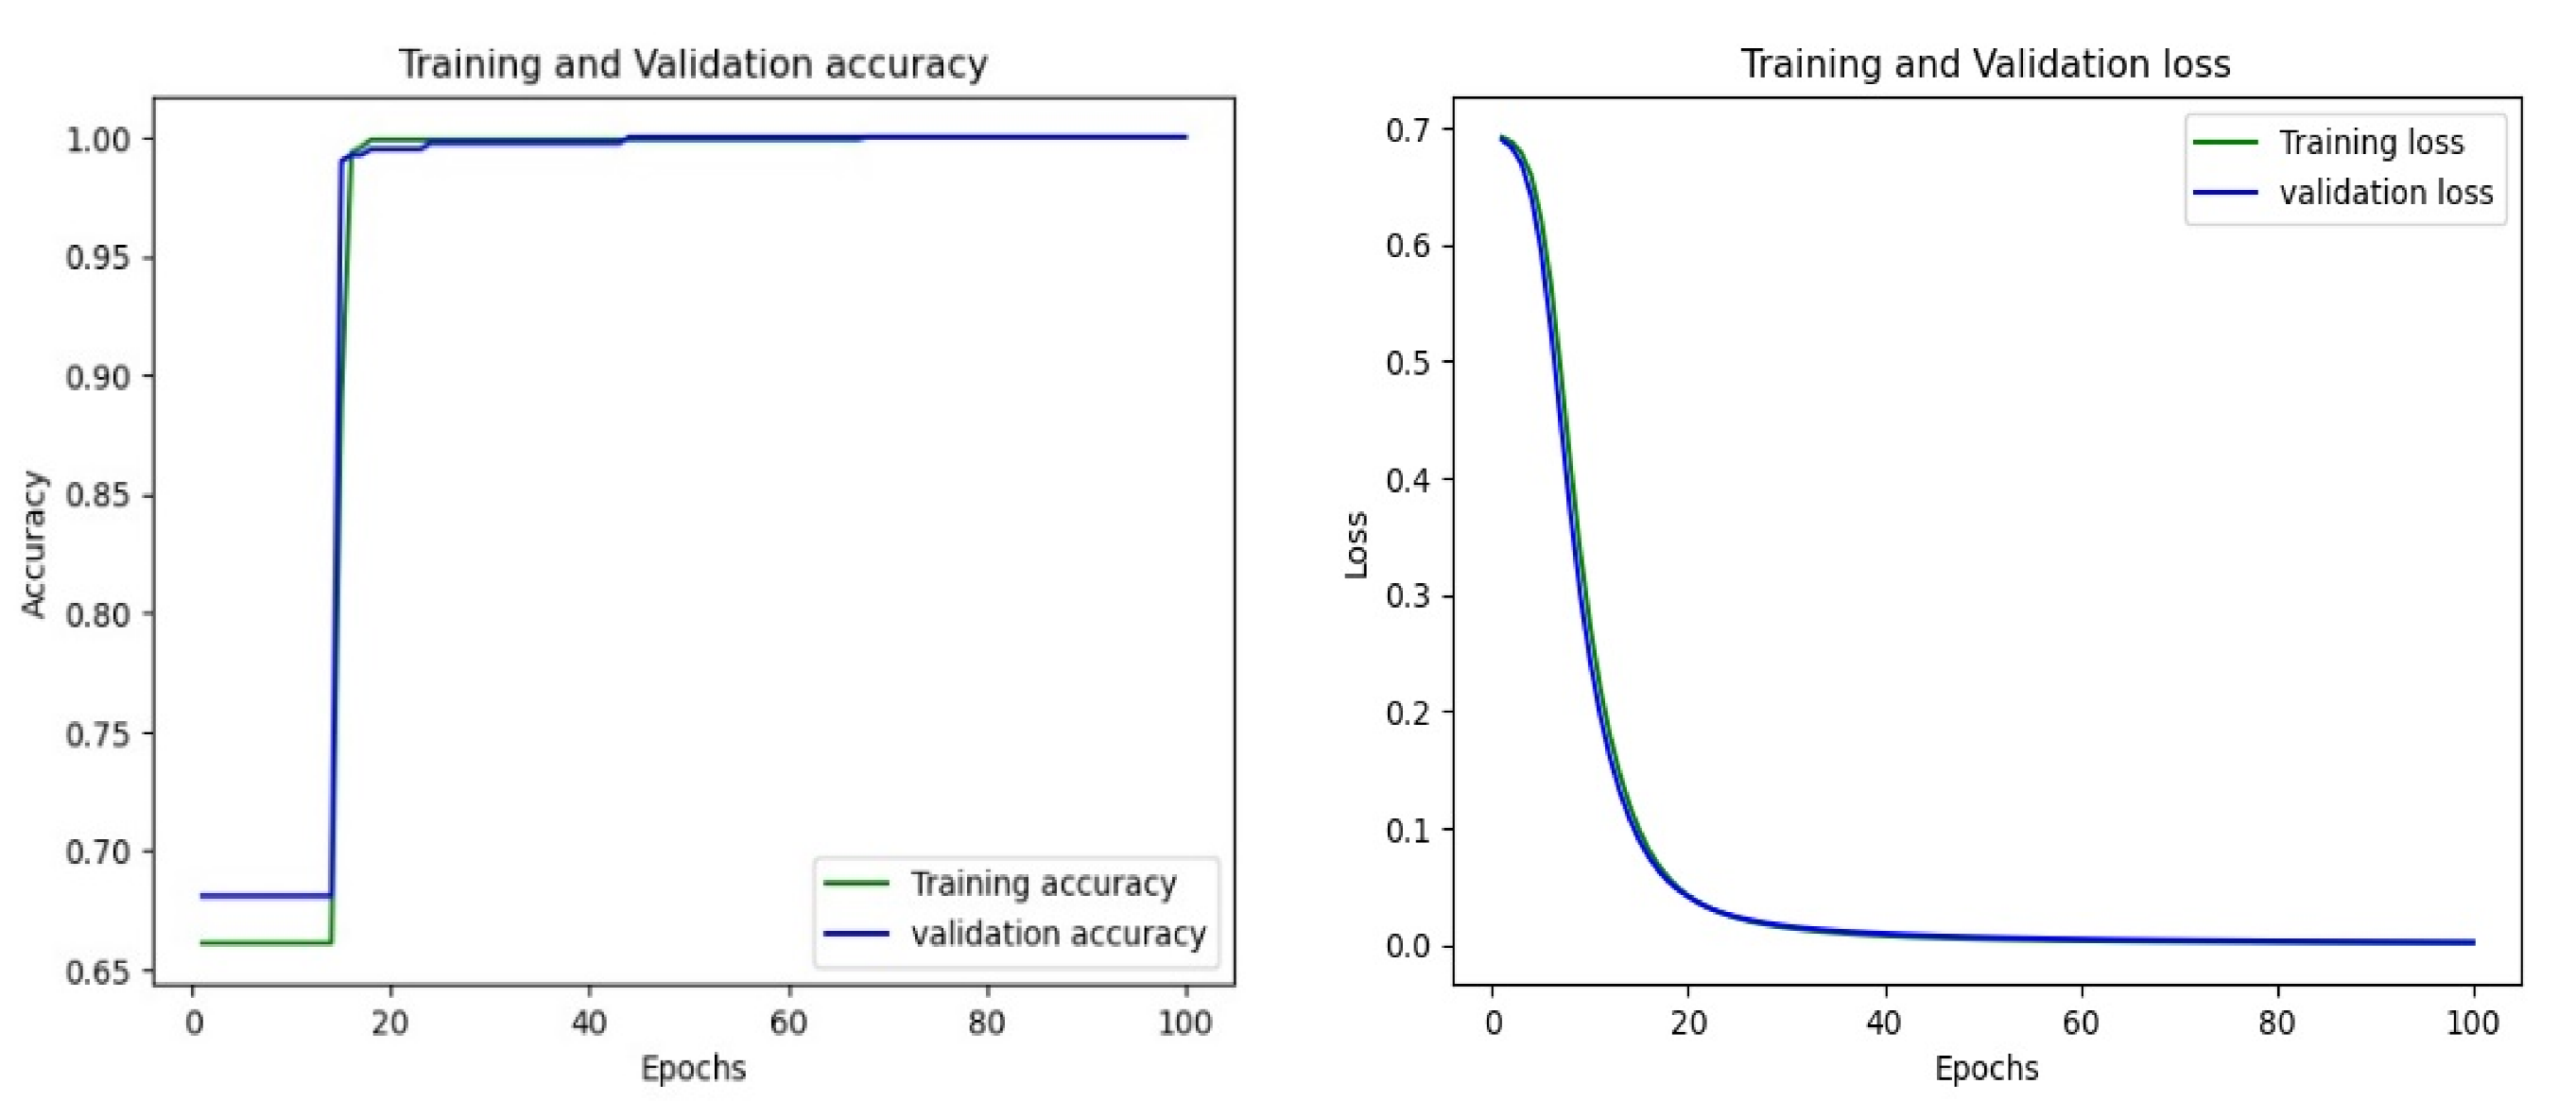
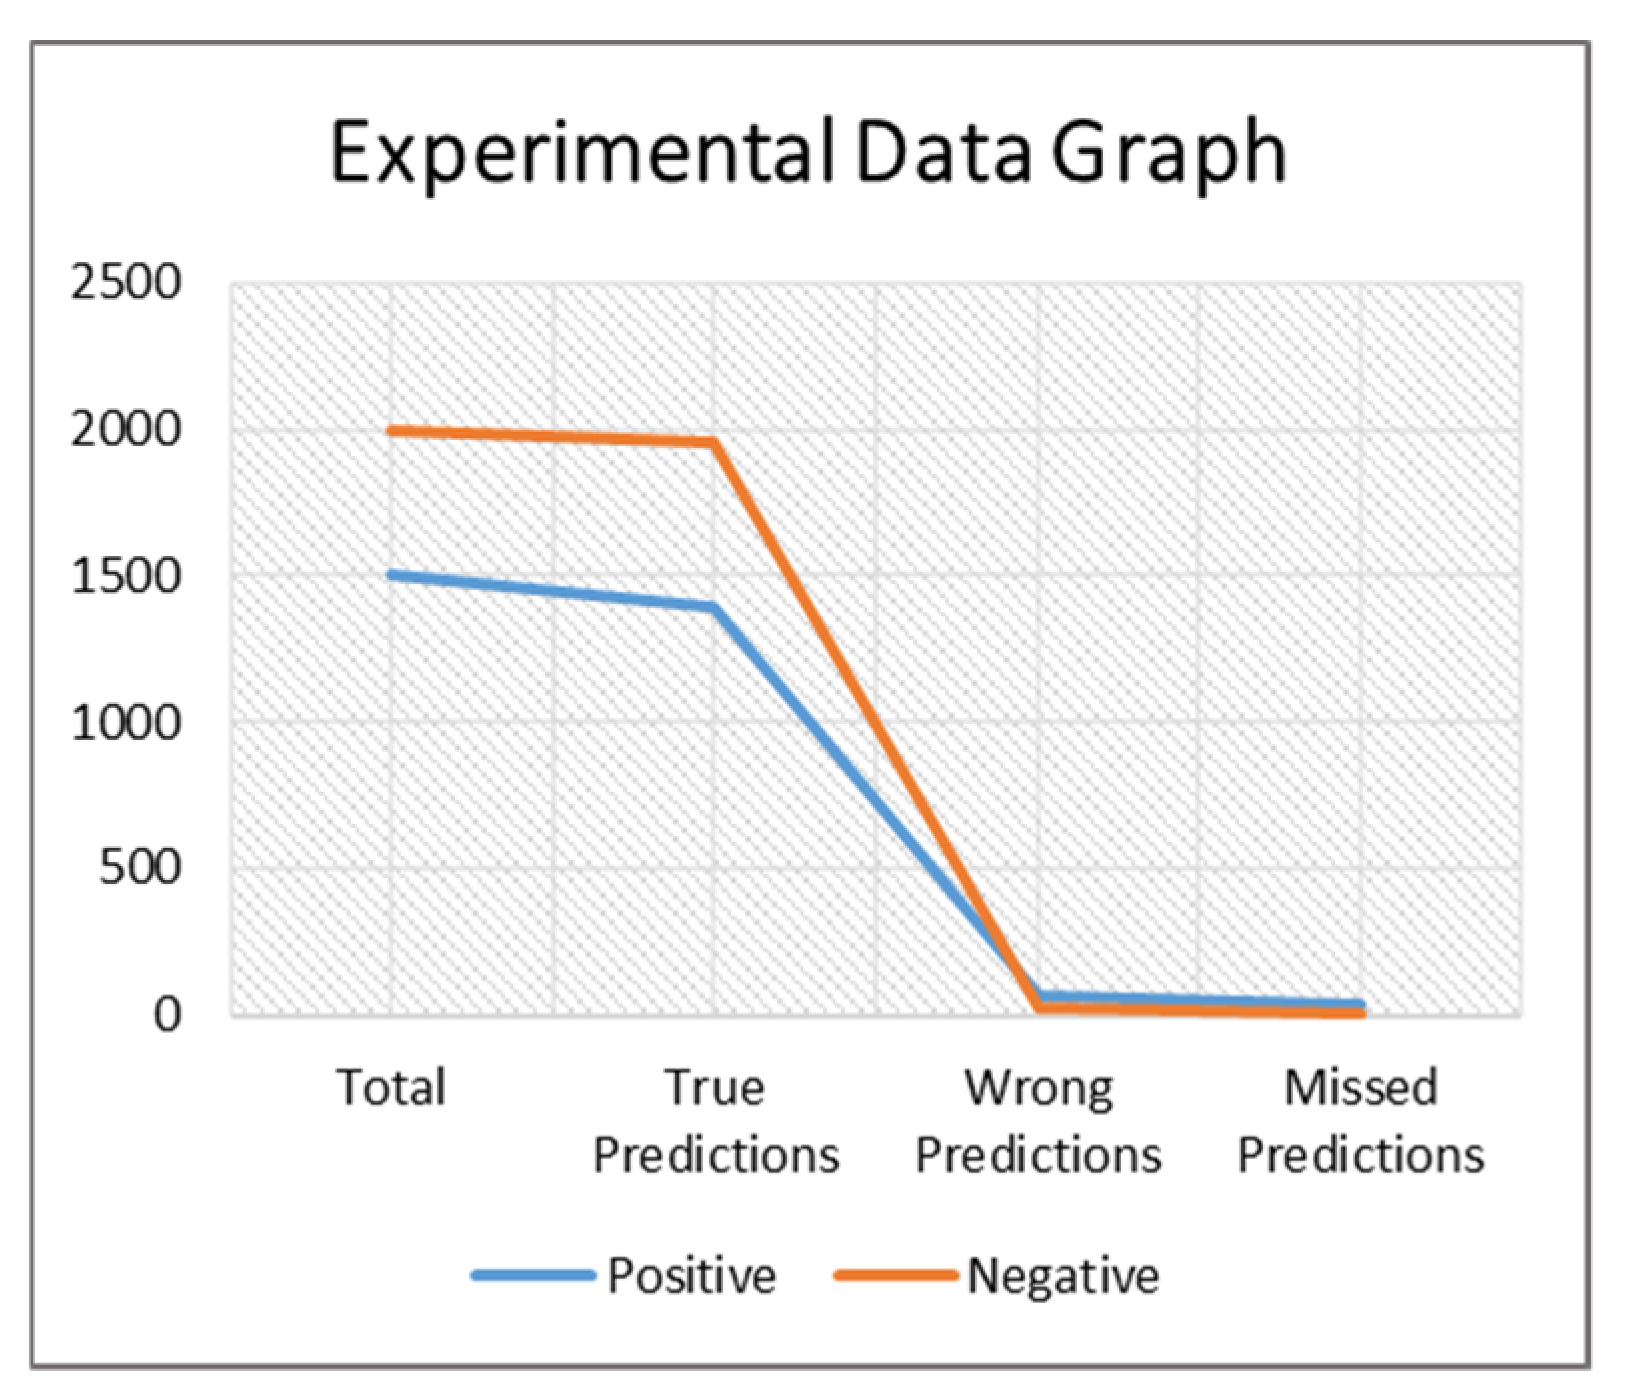
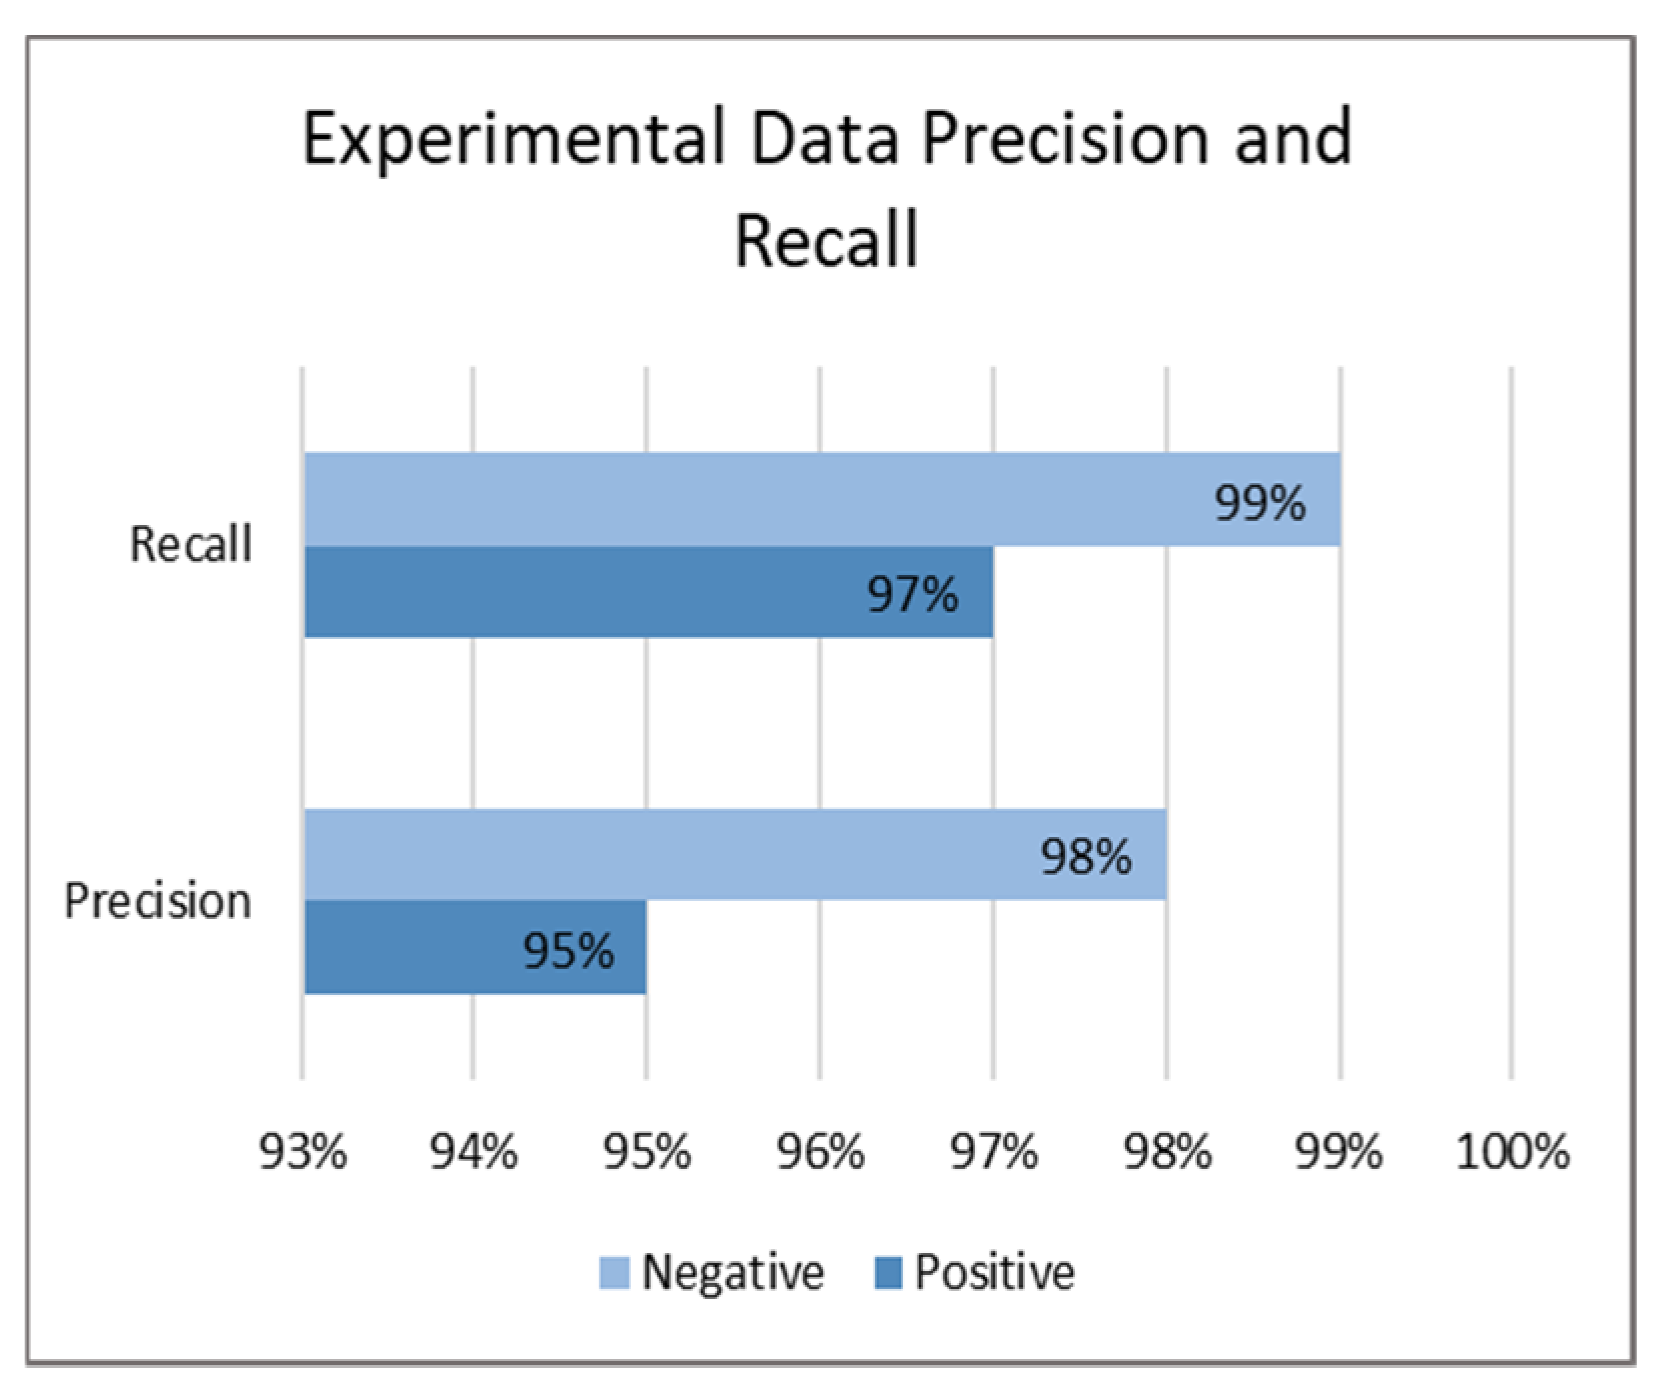
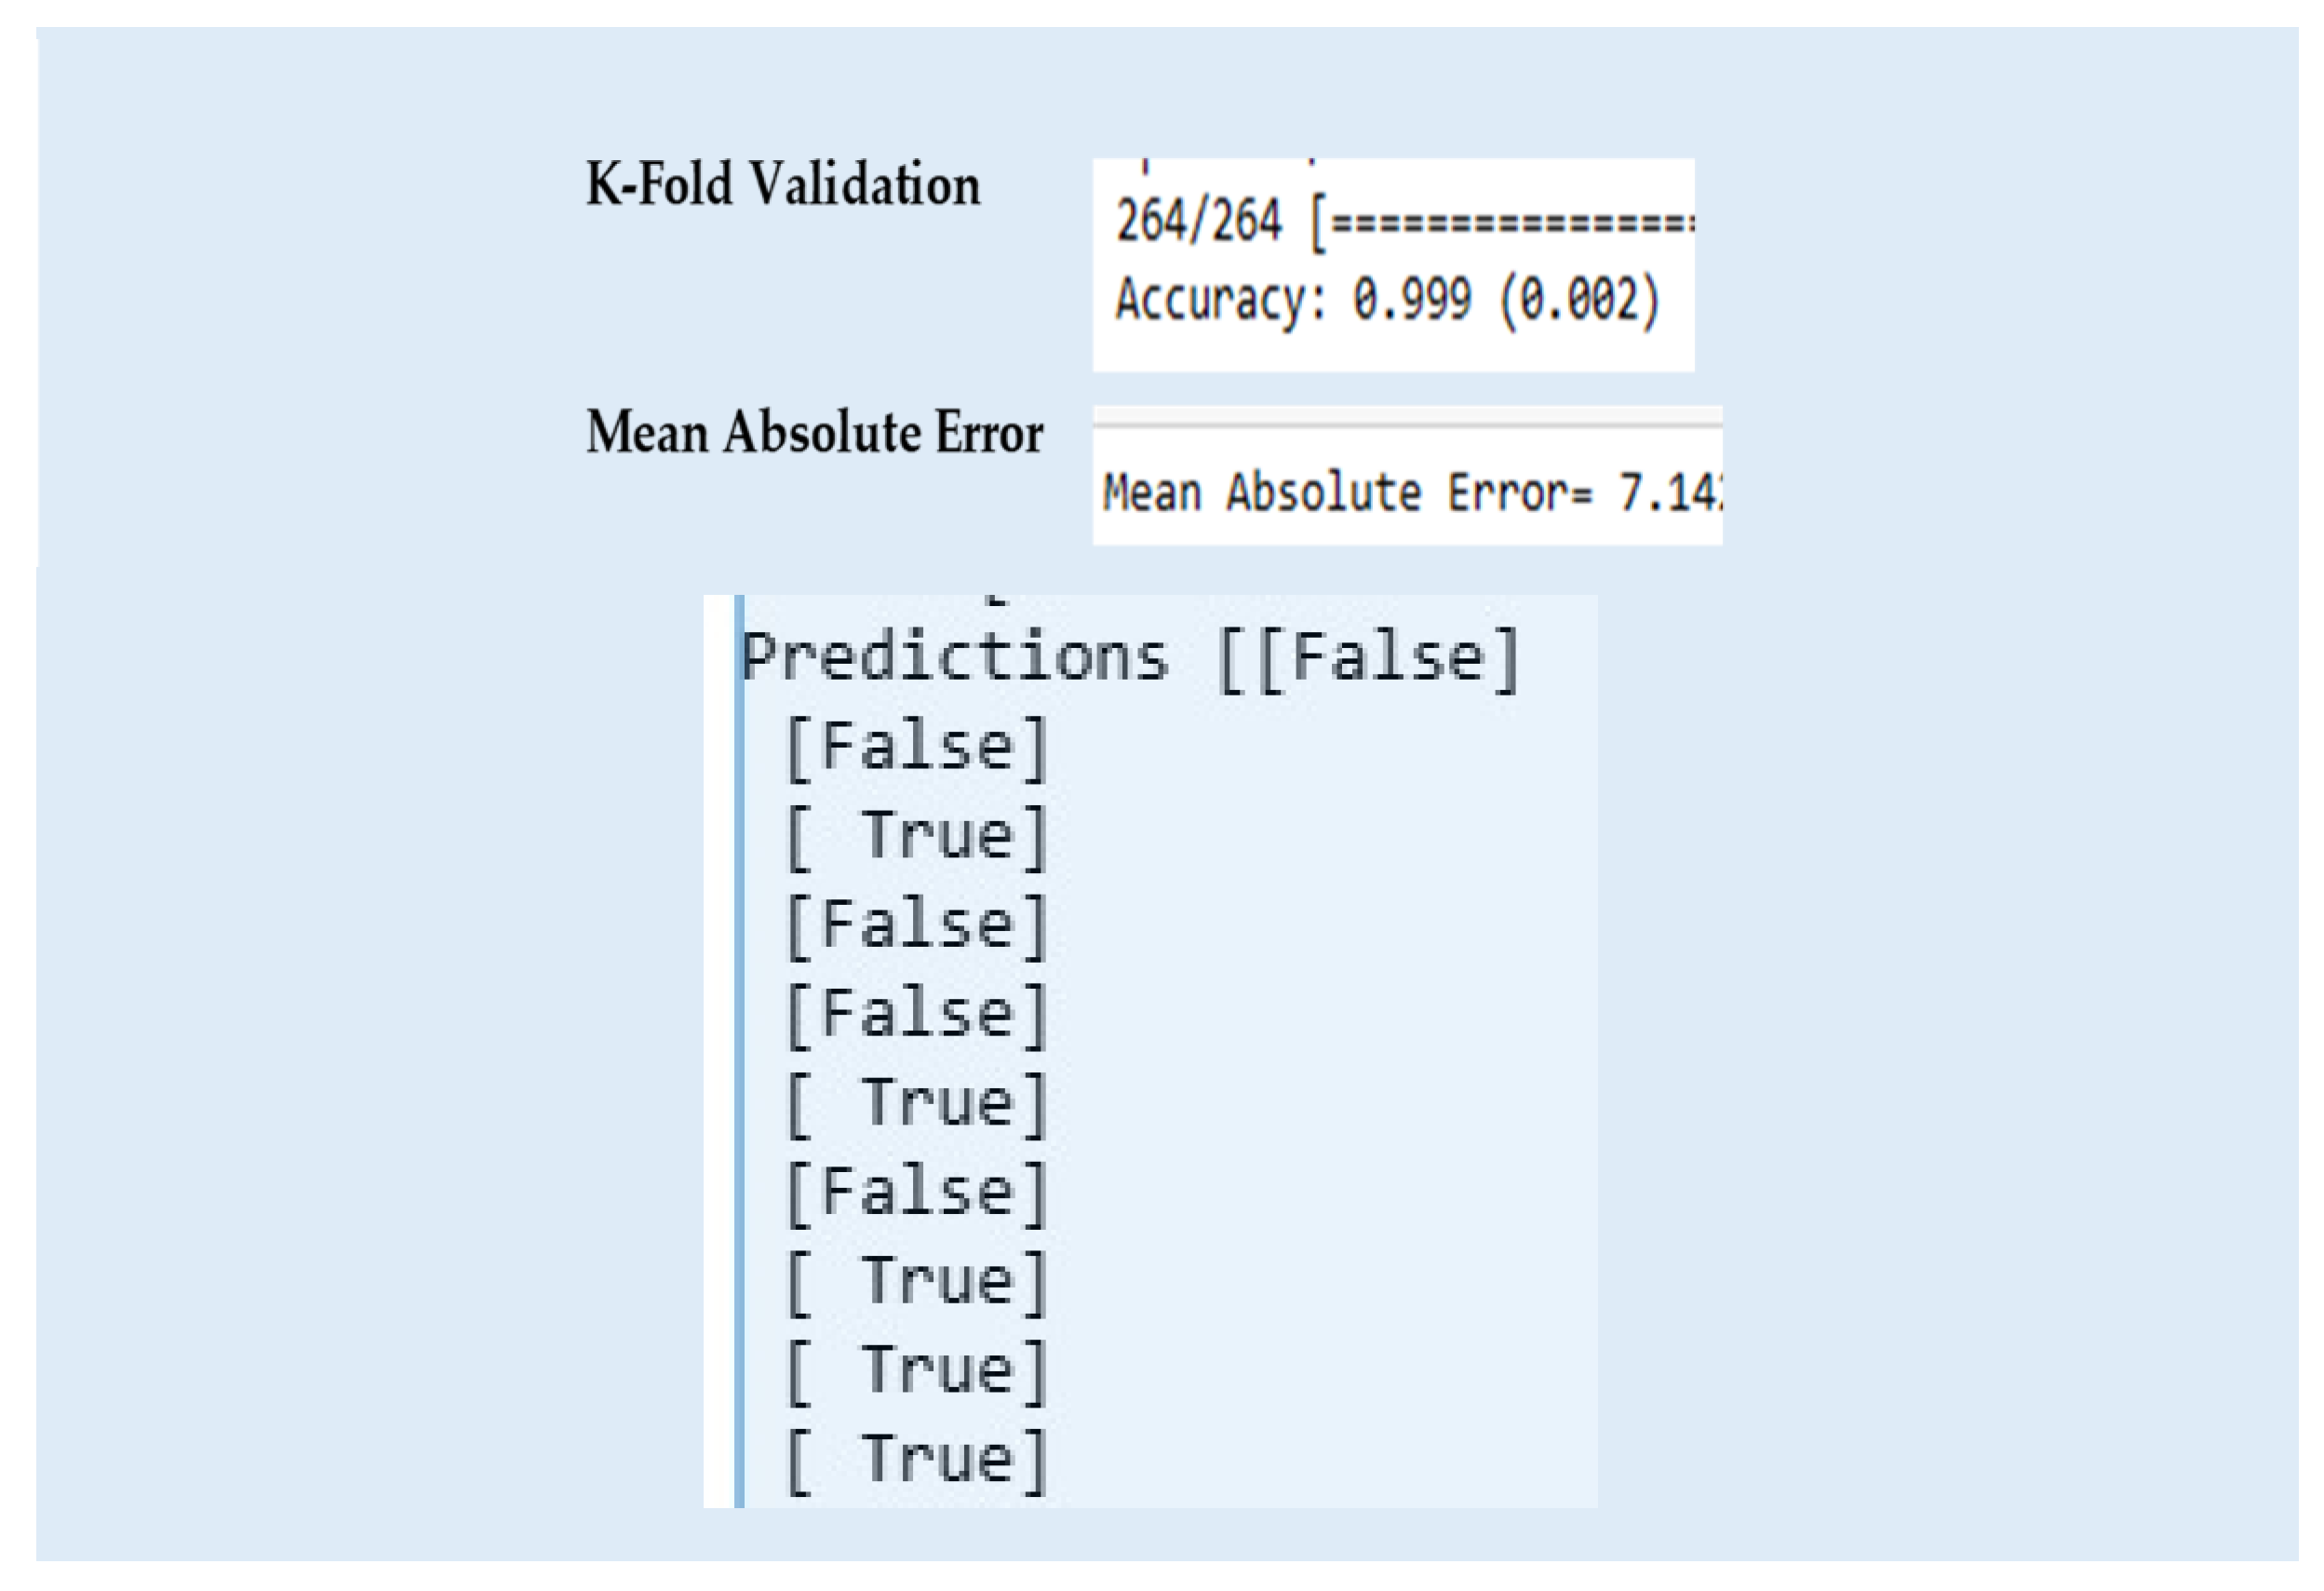
4. Experiments and Results
- TP = true positive—the instances that are positive and also classified as positive by the ANN model;
- FP = false positive—the instances that are negative but classified as positive by the ANN model;
- FN = false negative—the instances that are positive and classified as negative by the ANN model.
5. Discussions and Limitations
5.1. Dataset Analysis
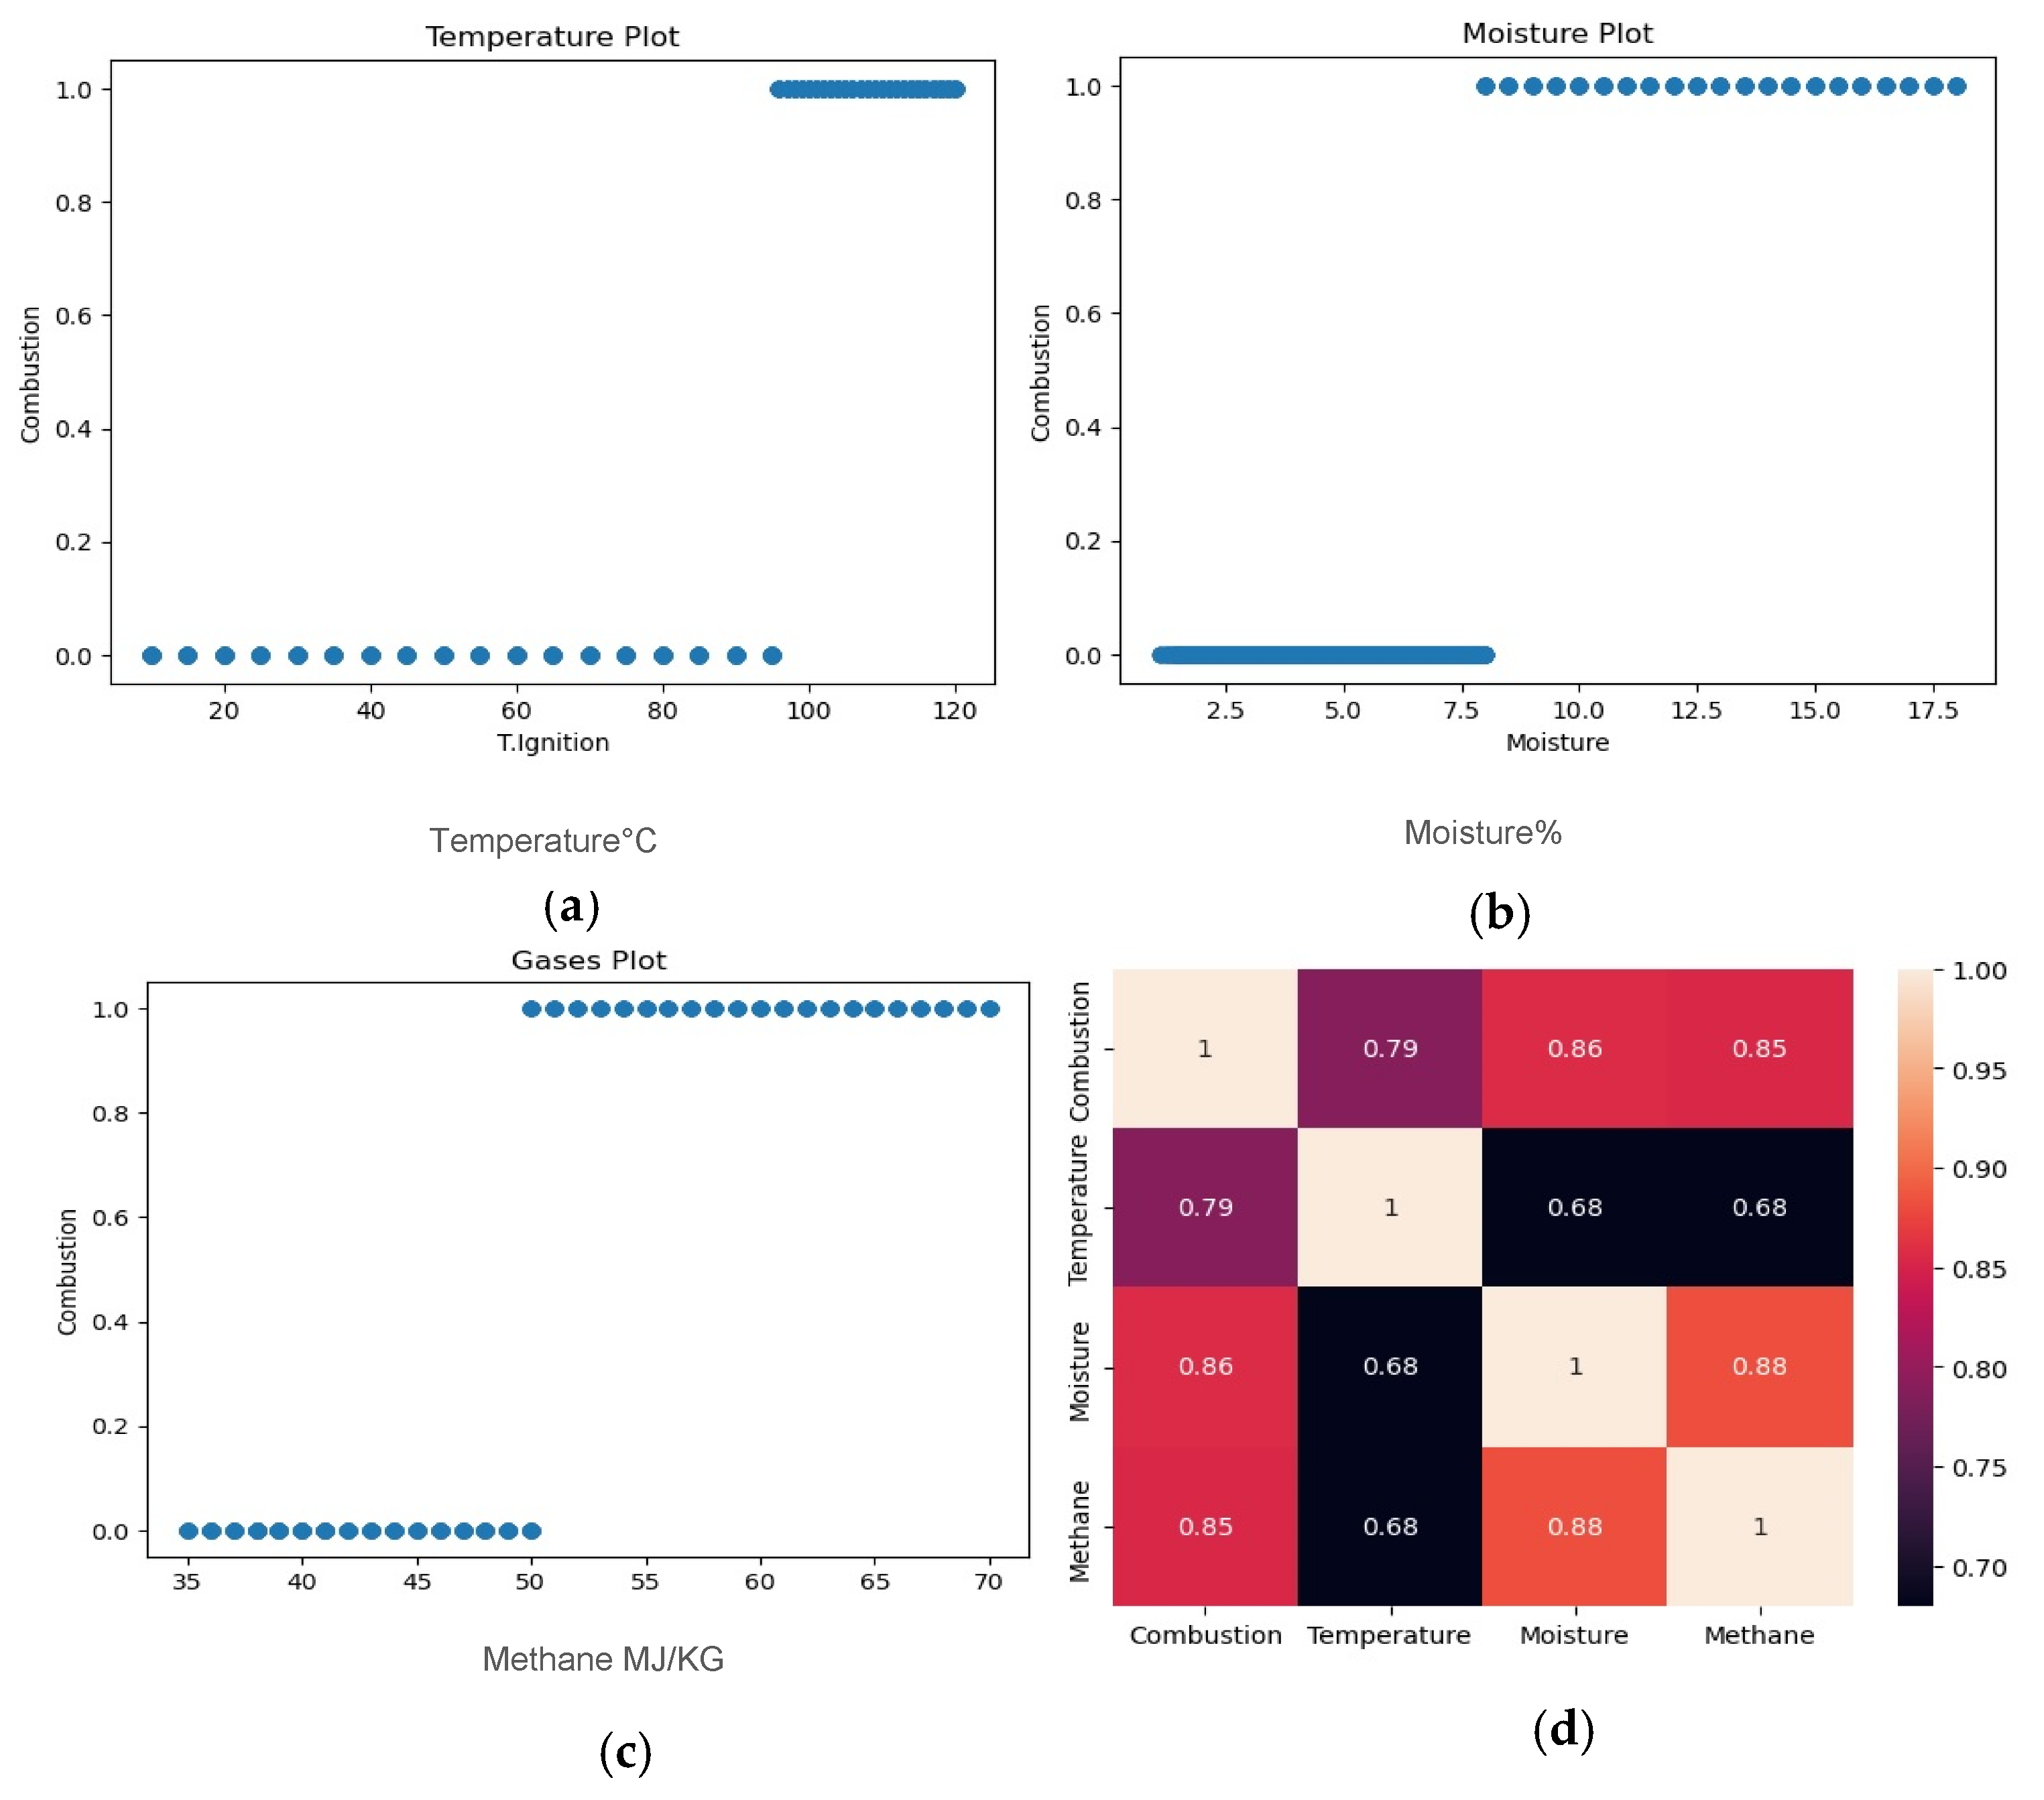
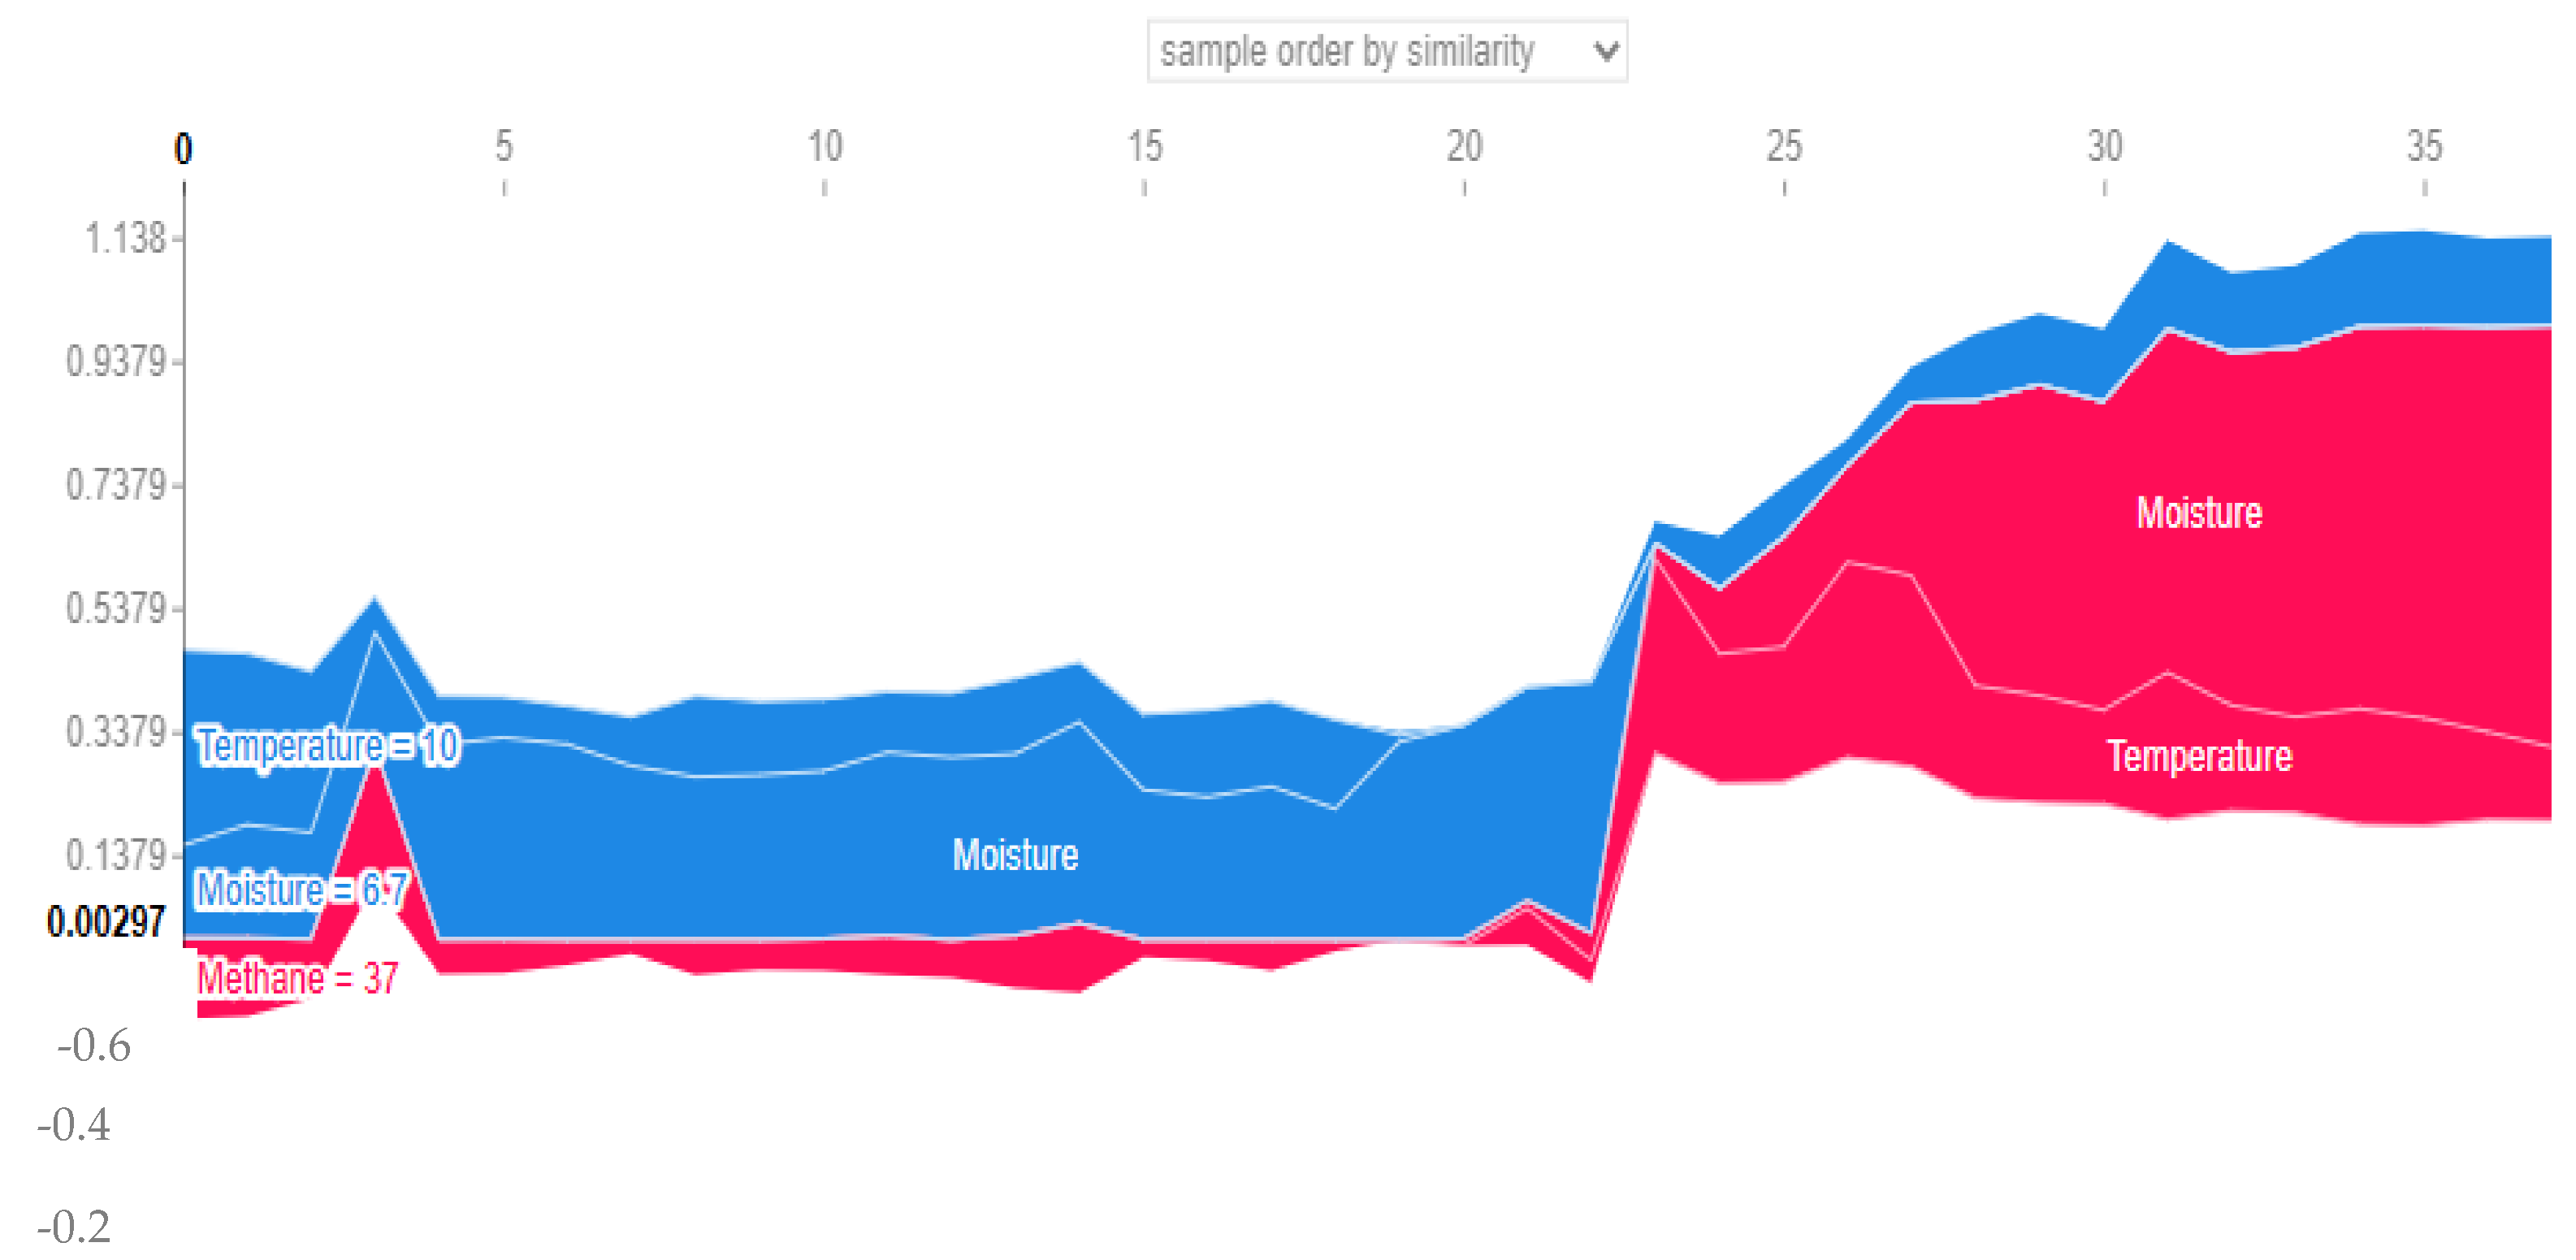
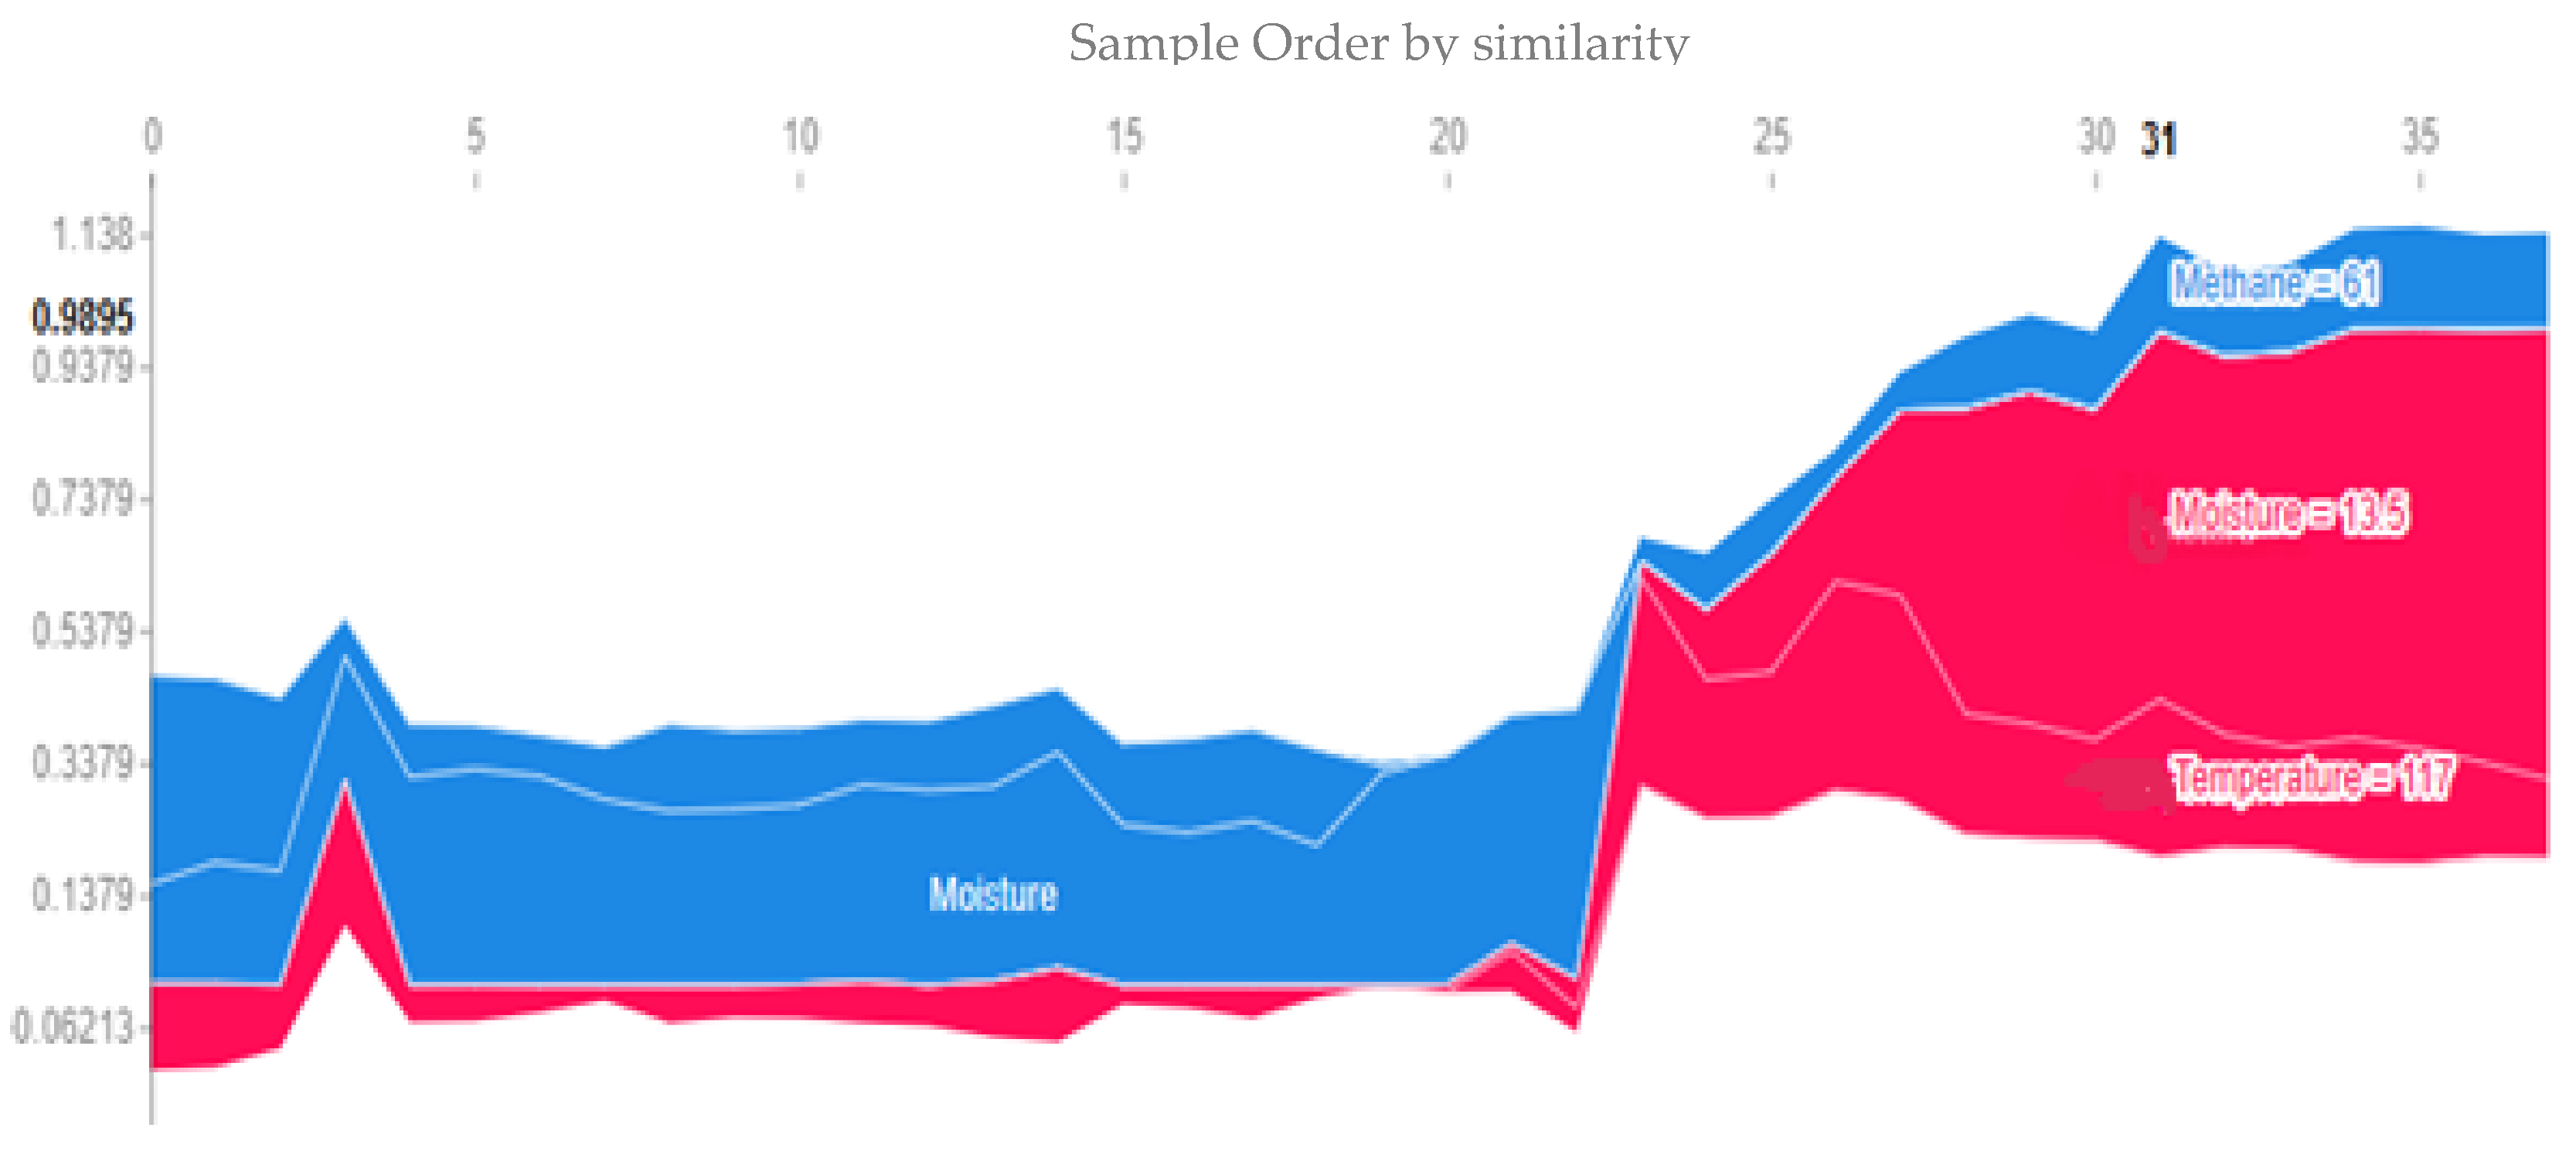
5.2. Spontanous Combustion Factors’ Visualization
- No single study provides a mechanism to detect SC and maintain cotton quality;
- Most researchers only focused on studying heat-causing factors and smoldering;
- They also used traditional agricultural tools and instruments to measure attributes related to the self-heating and combustion of crops like wheat and hay;
- They did not use efficient IoT circuits for the measurement of SC factors and ML/DL algorithms to analyze data. We have considered all these limitations in the current research to detect SC.
6. Conclusions and Future Work
- The proposed system could be improved in the future by using deep learning algorithms for SC prediction, e.g., CNN, RNN, and RGBoost, etc.;
- Similarly, images of cotton can be used to analyze the effect of SC on cotton quality in the future;
- The proposed system can be improved by considering other factors and processes that cause SC.
Author Contributions
Funding
Data Availability Statement
Acknowledgments
Conflicts of Interest
References
- Meyer, L.A. The World and US Cotton Outlook for 2019/20. 2019. Available online: https://www.usda.gov/sites/default/files/documents/Leslie_Meyer.pdf (accessed on 12 May 2021).
- Khan, M.A.; Wahid, A.; Ahmad, M.; Tahir, M.T.; Ahmed, M.; Ahmad, S.; Hasanuzzaman, M. World cotton production and consumption: An overview. Cotton Prod. Uses 2020, 1–7. [Google Scholar] [CrossRef]
- Hamann, M.T. Impact of Cotton Harvesting and Storage Methods on Seed and Fiber Quality. Doctoral Dissertation, Texas A & M University, College Station, TX, USA, 2012. [Google Scholar]
- Horrocks, A.R.; Moss, W.A.; Edwards, N.C.; Price, D. The spontaneous igniting behaviour of oil-contaminated cotton. Polym. Degrad. Stab. 1991, 33, 295–305. [Google Scholar] [CrossRef]
- Salimov, O.A.; Khusanova, S.A.; Salimov, M.; Rahimjonov, A.R. Study of Factors Affecting the Quality of Raw Cotton During Storage and Processing. Cent. Asian J. Theor. Appl. Sci. 2022, 3, 40–46. [Google Scholar]
- Chun, D.T.; Anthony, W.S. Effects of adding moisture at the gin lint slide on cotton bale microbial activity and fiber quality. J. Cotton Sci. 2004, 8, 83–90. [Google Scholar]
- Gamble, G.R. The effect of bale ageing on cotton fiber chemistry, processing performance, and yarn quality. J. Cotton Sci. 2007, 11, 98–103. [Google Scholar]
- Gu, L.H. Cotton the Cause of Spontaneous Combustion. Fire 2012, 23, 32–33. [Google Scholar]
- Xia, E.L. Study on the Characteristic Comparative of Cotton Smoldering and Flame Combustion. Fire Saf. Sci. 2013, 22, 70–76. [Google Scholar]
- Zhao, X.; Xiao, H.; Wang, Q.; Ping, P.; Sun, J. Study on spontaneous combustion risk of cotton using a micro-calorimeter technique. Ind. Crops Prod. 2013, 50, 383–390. [Google Scholar] [CrossRef]
- Xie, Q.; Zhang, Z.; Lin, S.; Qu, Y.; Huang, X. Smoldering fire of high-density cotton bale under concurrent wind. Fire Technol. 2020, 56, 2241–2256. [Google Scholar] [CrossRef]
- Xu, Q.; Yang, S.; Tang, Z.; Cai, J.; Zhong, Y.; Zhou, B. Free radical and functional group reaction and index gas CO emission during coal spontaneous combustion. Combust. Sci. Technol. 2018, 190, 834–848. [Google Scholar] [CrossRef]
- Saeed, M.F.; Jamal, A.; Ahmad, I.; Ali, S.; Shah, G.M.; Husnain, S.K.; Wang, J. Storage conditions deteriorate cotton and wheat seeds quality: An assessment of Farmers’ awareness in Pakistan. Agronomy 2020, 10, 1246. [Google Scholar] [CrossRef]
- Hughs, E.; Gamble, G.R.; Tristao, D.; Corcoran, C.A. Long Term Storage Effects on the Fiber and Textile Quality of Polyethylene Wrapped Cotton Bales. In Proceedings of the National Cotton Council Beltwide Cotton Conference, New Orleans, LA, USA, 9–12 January 2007; pp. 1936–1942. [Google Scholar]
- Glade, E.H. Cotton Quality Evaluation: Testing Methods and Use; US Department of Agriculture, Economic Research Service: Washington, DC, USA, 1981; Volume 668. [Google Scholar]
- Salimov, O.; Salimov, A. Improvement of Cotton Reception and Storage Technology. Eur. J. Life Saf. Stab. 2021, 2660–9630, 113–119. [Google Scholar]
- Su, H.; Shi, J.; Ji, H.; Li, J.; Fan, J. Investigating on the Iconic Gas Compositions Produced by Low-Temperature Heating Cotton. Symmetry 2020, 12, 883. [Google Scholar] [CrossRef]
- Wang, Z.; Liu, W.; Ni, Z.; Qi, W. Effect of density on smoldering rate of cotton bale. In IOP Conference Series: Earth and Environmental Science; IOP Publishing: Bristol, UK, 2020; Volume 446, p. 022062. [Google Scholar]
- Luo, Q.; Ren, T.; Liang, D.; Zhang, J.; Shen, H. A study on the thermal decomposition temperature (TDT) and critical ambient temperature (CAT) of cotton. J. Therm. Anal. Calorim. 2017, 128, 1617–1625. [Google Scholar] [CrossRef]
- Ju, W.H. Study on fire risk and disaster reducing factors of cotton logistics warehouse based on event and fault tree analysis. Procedia Eng. 2016, 135, 418–426. [Google Scholar] [CrossRef]
- Buggeln, R.; Rynk, R. Self-heating in yard trimmings: Conditions leading to SC. Compos. Sci. Util. 2002, 10, 162–182. [Google Scholar] [CrossRef]
- Juita Dlugogorski, B.Z.; Kennedy, E.M.; Mackie, J.C. Low temperature oxidation of linseed oil: A review. Fire Sci. Rev. 2012, 1, 1–36. [Google Scholar] [CrossRef]
- Jiang, J.; Yang, D.; Gao, Z. Study on Application of IOT in the Cotton Warehousing Environment. Int. J. Grid Distrib. Comput. 2015, 8, 91–104. [Google Scholar] [CrossRef]
- Aheleroff, S.; Xu, X.; Lu, Y.; Aristizabal, M.; Velásquez, J.P.; Joa, B.; Valencia, Y. IoT-enabled smart appliances under industry 4.0: A case study. Adv. Eng. Inform. 2020, 43, 101043. [Google Scholar] [CrossRef]
- Qiu, X.; Wei, Y.; Li, N.; Guo, A.; Zhang, E.; Li, C.; Zang, Z. Development of an early warning fire detection system based on a laser spectroscopic carbon monoxide sensor using a 32-bit system-on-chip. Infrared Phys. Technol. 2019, 96, 44–51. [Google Scholar] [CrossRef]
- Hasan, M.; Islam, M.M.; Zarif, M.I.I.; Hashem, M.M.A. Attack and anomaly detection in IoT sensors in IoT sites using machine learning approaches. Internet Things 2019, 7, 100059. [Google Scholar] [CrossRef]
- Munir, M.S.; Bajwa, I.S.; Naeem, M.A.; Ramzan, B. Design and implementation of an IoT system for smart energy consumption and smart irrigation in tunnel farming. Energies 2018, 11, 3427. [Google Scholar] [CrossRef]
- Anbarasan, M.; Muthu, B.; Sivaparthipan, C.B.; Sundarasekar, R.; Kadry, S.; Krishnamoorthy, S.; Dasel, A.A. Detection of flood disaster system based on IoT, big data and convolutional deep neural network. Comput. Commun. 2020, 150, 150–157. [Google Scholar] [CrossRef]
- Otoum, Y.; Liu, D.; Nayak, A. DL-IDS: A deep learning–based intrusion detection framework for securing IoT. Trans. Emerg. Telecommun. Technol. 2022, 33, e3803. [Google Scholar] [CrossRef]
- Goceri, E. Deep learning based classification of facial dermatological disorders. Comput. Biol. Med. 2021, 128, 104118. [Google Scholar] [CrossRef] [PubMed]
- Zheng, Y.Y.; Kong, J.L.; Jin, X.B.; Wang, X.Y.; Su, T.L.; Zuo, M. CropDeep: The crop vision dataset for deep-learning-based classification and detection in precision agriculture. Sensors 2019, 19, 1058. [Google Scholar] [CrossRef]
- Ahmadi, P.; Mansor, S.; Farjad, B.; Ghaderpour, E. Unmanned Aerial Vehicle (UAV)-based remote sensing for early-stage detection of Ganoderma. Remote Sens. 2022, 14, 1239. [Google Scholar] [CrossRef]
- Zhong, B.; Xing, X.; Love, P.; Wang, X.; Luo, H. Convolutional neural network: Deep learning-based classification of building quality problems. Adv. Eng. Inform. 2019, 40, 46–57. [Google Scholar] [CrossRef]
- Alfarisy, A.A.; Chen, Q.; Guo, M. Deep learning based classification for paddy pests & diseases recognition. In Proceedings of the 2018 International Conference on Mathematics and Artificial Intelligence, Chengdu, China, 20–22 April 2018; pp. 21–25. [Google Scholar]
- Montavon, G.; Samek, W.; Müller, K.R. Methods for interpreting and understanding deep neural networks. Digit. Signal Process. 2018, 73, 1–15. [Google Scholar] [CrossRef]
- Goodfellow, I.; Bengio, Y.; Courville, A. Deep Learning; MIT Press: Cambridge, MA, USA, 2016. [Google Scholar]
- Bisong, E.; Bisong, E. Matplotlib and Seaborn. In Building Machine Learning and Deep Learning Models on Google Cloud Platform: A Comprehensive Guide for Beginners; Apress: Berkeley, CA, USA, 2019; pp. 151–165. [Google Scholar]
- Lauzon, F.Q. An introduction to deep learning. In Proceedings of the 2012 11th International Conference on Information Science, Signal Processing and Their Applications (ISSPA), Montreal, QC, Canada, 2–5 July 2012; pp. 1438–1439. [Google Scholar]
- Sharma, N.; Sharma, R.; Jindal, N. Machine learning and deep learning applications-a vision. Glob. Trans. Proc. 2021, 2, 24–28. [Google Scholar] [CrossRef]
- Wu, Y.; Fu, S.; Zhao, J.; Bryan, C. Powering visualization with deep learning. IEEE Comput. Graph. Appl. 2021, 41, 16–17. [Google Scholar] [CrossRef]
- Feng, Y.; Chen, W.; Ma, Y.; Zhang, Z.; Gao, P.; Lv, X. Cotton Seedling Detection and Counting Based on UAV Multispectral Images and Deep Learning Methods. Remote Sens. 2023, 15, 2680. [Google Scholar] [CrossRef]
- Nsugbe, E.; Obajemu, O.; Samuel, O.W.; Sanusi, I. Enhancing care strategies for preterm pregnancies by using a prediction machine to aid clinical care decisions. Mach. Learn. Appl. 2021, 6, 100110. [Google Scholar] [CrossRef]
- Deng, X.; Liu, Q.; Deng, Y.; Mahadevan, S. An improved method to construct basic probability assignment based on the confusion matrix for classification problem. Inf. Sci. 2016, 340, 250–261. [Google Scholar] [CrossRef]


| Year | Factors Investigated | Research Goal | Advantages | Limitations |
|---|---|---|---|---|
| [5], 2022 | Humidity, Weediness | Self-heating; common factors’ identification | Preserves the quality of raw Cotton Avoidance of self-heating | Use of traditional instruments |
| [16], 2021 | Moisture, Weediness | Study raw cotton storage | Improvement in raw cotton storage | Survey-based study |
| [17], 2020 | Methane, CO | Formation of generation law for iconic gas composition | Identification of gases produced during self-heating | Experiments based on laboratory methods |
| [18], 2020 | Cotton density | Cotton density’s effect on smoldering rate | Identified major gases produced during self-heating— | Use of traditional laboratory methods |
| [19], 2017 | DTD, CAT | SC risk evaluation | found thermal decomposition temperature (TDT) and critical ambient temperature (CAT). | Use of traditional laboratory methods |
| [20], 2016 | Temperature, humidity, packing pressure, resistance, capacity | Study of fire safety mechanism | It is found that moisture absorption rate and heat release increase due to smoldering fire | Use of traditional laboratory methods |
| [21], 2002 | Material mass, ambient temperature, pile compaction | Improves fire safety mechanism | Found that an inverse relationship between mass of material and ambient temperatures which lead to SC | Study of SC in a yard, not in a warehouse. Experiments with Eucalyptus leaves not on cotton |
| Indicator | Reference Range |
|---|---|
| Ignition Temp. | 120 °C |
| Moisture | 6.5 to 8% |
| Methane | 50–55 MJ/Kg |
| Quality Factor | Indicators | Sources | Internal Factor | |
|---|---|---|---|---|
| Grade | Color | White | Normal | ✗ |
| Light grey | Extreme weather conditions | ✓ | ||
| Dark grey | ||||
| Spotted | Insects, fungus, soil | ✓ | ||
| Yellow | Internal reactions | ✓ | ||
| Trash | Seed | Harvesting | ✗ | |
| Stem leaves | ✗ | |||
| Dirt grass | ✓ | |||
| Dust particles | Internal | ✓ | ||
| Preparation | Wet cotton | Internal high moisture Weather | ✓ | |
| Dots in lint | Excessive drying | ✗ | ||
| Staple Length | Longer | Good quality | ✗ | |
| Shorter | Bad quality | ✓ | ||
| Micronaire | Immature fiber | Low moisture | ✓ | |
| Fineness of fiber | Bad envrt. Condition Plant process | ✓ | ||
| Sr. No | Combustion | Temperature | Moisture | Methane |
|---|---|---|---|---|
| 1 | 0 | 10 | 6.5 | 35 |
| 2 | 0 | 10 | 6.6 | 36 |
| 3 | 0 | 10 | 6.7 | 37 |
| 4 | 0 | 10 | 6.8 | 38 |
| 5 | 0 | 10 | 6.9 | 39 |
| 6 | 0 | 10 | 7 | 40 |
| 7 | 0 | 10 | 7.1 | 41 |
| 8 | 1 | 130 | 40 | 79 |
| 9 | 1 | 110 | 30 | 85 |
| 10 | 0 | 15 | 7.4 | 44 |
| Hyperparameters | Possible Set of Values | Used | Justification |
|---|---|---|---|
| Number of neurons (input units at each layer) | No of neurons at each layer could be the same and could be different | 10 at hidden layer 1 6 at hidden layer 2 | More neurons required in more complex scenario and suitable accuracy rate achieved with the used neurons count. |
| Activation function (decides computation of output from input using predefined formulae) | “relu”, “sigmoid”, “softplus”, “softsign”, “tanh”, “selu”, “exponential”, “LeakyReLU”, “relu”, “elu” | Relu at hidden layers Sigmoid at output layer | ReLU converged quickly as compare to other activation. Sigmoid is suitable for activation at the output layer for binary classification methods where we only have 2 classes. |
| No of layers | 10–100 | 1 input 2 hidden 1 output | According to the nature of the problem, 2 hidden layers generated the required accuracy rate. |
| Learning rate controls the step size for a model to reach the minimum loss function | 0.01, 0.1 | Tried both | 0.01 learning rate works well. |
| Batch size (number of training data sub-samples used as the input) | 5–25 | Tried [5,10,15,20,25] | A batch size of 25 is more suitable and gives a good accuracy rate. |
| Epoch—number of times a whole dataset is passed through the NN | 5–100 | Tried [5,10,50,100] | An epoch size of 50 is more suitable and gives a good accuracy rate. |
| Optimizer (responsible for changing the learning rate and weights of neurons in the neural network to reach the minimum loss function) | “SGD”, “Adam”, “RMSprop”, “Adadelta”, “Adagrad”, “Adamax”, “Nadam”, “Ftrl”, “SGD” | Adam | Better results than every other optimization algorithm, with a faster computation time, and requiring fewer parameters for tuning. |
| Class | Instances | TP | FP | FN |
|---|---|---|---|---|
| Positive | 1500 | 1390 | 70 | 40 |
| Negative | 2000 | 1960 | 30 | 10 |
| Class | Precision | Recall |
|---|---|---|
| Positive | 95% | 97% |
| Negative | 98% | 99% |
| Issue | Strengths |
|---|---|
| Storage Area Monitoring | Proposed research provides a unique approach for storage area monitoring, which aims to preserve cotton’s quality during storage through the detection of SC. |
| Human-Independent | The proposed approach uses an IoT circuit for the monitoring of SC, which does not require any human beings to operate, and can work independently once installed. |
| Availability | The proposed approach provides a solution that is always available for storage area monitoring, while human beings are not always available to monitor storage areas. |
| Issue | Limitation |
|---|---|
| Hardware | The proposed approach uses sensors for monitoring storage areas. The failure of sensors can affect system output. So, regular maintenance of sensors is required. |
| Cost | The proposed approach uses the IoT for input readings. Therefore, some cost is involved in the purchasing and assembling of the IoT circuit. |
| Chemical heating | The proposed approach only focuses on methane gas in the detection of chemical heating, while other gases are also involved in this process. |
| Research | Study Goal | Technique Used | Findings |
|---|---|---|---|
| Proposed | Detection of SC helps owners to preserve cotton’s quality during lengthy storage | IoT for data input; ANN for data analysis |
|
| [5], 2022 | Studying of factors affecting the quality of raw cotton | Petrov PPR-2M device used |
|
| [16], 2021 | Study of self-heat process | Literature survey |
|
| [17], 2020 | Study produced gases in cotton smoldering | Chromatography–mass spectrometer (GC/MS) |
|
| [18], 2020 | Study of the effect of cotton density on smoldering rate | Instrument to measure density |
|
| [19], 2017 | Found the TDT and CAT of cotton | Infrared spectroscopy analysis, chromatographic and mass spectrometric |
|
| [20], 2016 | Study of factors that can reduce fires in cotton warehouses | Event and fault tree analysis |
|
| [21], 2002 | Study of SC reasons | Experiments with Eucalyptus leaves |
|
Disclaimer/Publisher’s Note: The statements, opinions and data contained in all publications are solely those of the individual author(s) and contributor(s) and not of MDPI and/or the editor(s). MDPI and/or the editor(s) disclaim responsibility for any injury to people or property resulting from any ideas, methods, instructions or products referred to in the content. |
© 2023 by the authors. Licensee MDPI, Basel, Switzerland. This article is an open access article distributed under the terms and conditions of the Creative Commons Attribution (CC BY) license (https://creativecommons.org/licenses/by/4.0/).
Share and Cite
Shafi, U.F.; Bajwa, I.S.; Anwar, W.; Sattar, H.; Ramzan, S.; Mahmood, A. Sensing Spontaneous Combustion in Agricultural Storage Using IoT and ML. Inventions 2023, 8, 122. https://doi.org/10.3390/inventions8050122
Shafi UF, Bajwa IS, Anwar W, Sattar H, Ramzan S, Mahmood A. Sensing Spontaneous Combustion in Agricultural Storage Using IoT and ML. Inventions. 2023; 8(5):122. https://doi.org/10.3390/inventions8050122
Chicago/Turabian StyleShafi, Umar Farooq, Imran Sarwar Bajwa, Waheed Anwar, Hina Sattar, Shabana Ramzan, and Aqsa Mahmood. 2023. "Sensing Spontaneous Combustion in Agricultural Storage Using IoT and ML" Inventions 8, no. 5: 122. https://doi.org/10.3390/inventions8050122