Abstract
The use of modern methods for determining the fault location (FL) on overhead power lines (OHPLs), which have high accuracy and speed, contributes to the reliable operation of power systems. Various physical principles are used in FL devices for OHPLs, as well as various algorithms for calculating the distance to the FL. Some algorithms for FL on OHPLs use emergency mode parameters (EMP); other algorithms use measurement results based on wave methods. Many random factors that determine the magnitude of the error in calculating the distance to the FL affect the operation of FL devices by EMP. Methods based on deterministic procedures used in well-known FL devices for OHPLs do not take into account the influence of random factors, which significantly increases the time to search for the fault. The authors have developed a method of FL on OHPLs based on a multi-hypothetical sequential analysis using the Armitage algorithm. The task of recognizing a faulted section of an OHPL is formulated as a statistical problem. To do this, the inspection area of the OHPL is divided into many sections, followed by the implementation of the procedure for FL. The developed method makes it possible to adapt the distortions of currents and voltages on the emergency mode oscillograms to the conditions for estimating their parameters. The results of the calculations proved that the implementation of the developed method has practically no effect on the speed of the FL algorithm for the OHPL by EMP. This ensures the uniqueness of determining the faulted section of the OHPL under the influence of random factors, which leads to a significant reduction in the inspection area of the OHPL. The application of the developed method in FL devices for OHPLs will ensure the required reliability of power supply to consumers and reduce losses from power outages by minimizing the time to search for a fault.
1. Introduction
Overhead power lines (OHPLs) of various voltage classes are the main elements of power systems, both in terms of quantity and length. The output of power from all types of power plants and the transfer of power between regional power systems are carried out, as a rule, via high- and extra-high-voltage OHPLs [1,2]. This is due to the fact that the cost of construction and operation of cable power lines is much more expensive. At the same time, a number of countries have long-term programs to convert overhead power lines into cable ones [3,4]. This is due to the susceptibility of OHPLs to the influence of many natural and technogenic factors [5,6,7]. As a result, OHPLs have low reliability indicators compared to cable transmission lines [8,9].
Short circuits (SCs) on OHPLs that occur for various reasons are accompanied by voltage dips of various depths and durations. It depends on the type of SC, the magnitude of the transient resistance at the place of the SC, the operation algorithms and settings of the relay protection (RP) devices, as well as the intrinsic time of switching off the high-voltage circuit breakers [10,11]. Voltage dips adversely affect the operation of electrical receivers, especially electric motors, which are slowed down during an SC, and after the SC is eliminated, their self-starting begins. Self-starting occurs only if the electric motors have not been turned off by electrical or technological protection [12,13,14]. According to statistics, on OHPLs with a voltage of 110–500 kV, single-phase SCs are the main ones, accounting for up to 70% of the total. At the same time, two-phase and three-phase SCs account for 20% and 10%, respectively.
The negative impact of faults on OHPLs is mainly associated with either damage to electricity consumers, depending on their power supply scheme, or with violations of the stability of electric power systems.
In some countries, OHPLs with a voltage of 110–500 kV have a length of hundreds of kilometers, pass through mountainous, forested, and swampy areas, with a large number of crossings through water barriers (streams, rivers, lakes, and artificial reservoirs), etc. In addition, OHPLs are operated in difficult climatic conditions, for example, high wind pressures that cause vibration and dancing of wires, the formation of ice-frost deposits on wires, ground wires, and supports of overhead lines, as well as critically high or low air temperatures [15,16,17]. Under these conditions, determining the fault location (FL) on OHPLs by inspection requires considerable time and labor.
The reliability of the functioning of power systems as well as the ability to provide a reliable power supply to consumers depend on the availability of reserve OHPLs, as well as the time required to search for and eliminate a fault on OHPLs [18,19,20]. To eliminate the fault on OHPL, it is necessary to implement organizational and technical measures, which consist of the departure of the repair team to the place of fault and the implementation of emergency recovery work. The volume of repair work, the category of its complexity, as well as the need for materials and devices, are determined on the spot and depend on the scale of the fault and the reasons for its occurrence. The time for elimination of a fault on OHPLs largely depends on the accuracy of determining the fault location by FL devices, i.e., where the repair team should go to search for a fault on the overhead line.
For consumers powered by two OHPLs, one of which was taken out for repair and the second turned off in an emergency, the power supply will be completely disrupted. This will lead to damage from the disconnection of OHPLs, as well as losses from the undersupply of products during the restoration of power supply to the technological process [21,22,23]. To minimize damages and losses to consumers, the accuracy of determining the FL on OHPLs should be increased, and the time for performing emergency recovery work should be minimized [24,25].
For more than 70 years, power grid companies have been using FL devices installed at substations on one or two sides of OHPLs [26,27,28,29]. However, their accuracy remained unsatisfactory for many years, so the staff of the electric grid companies did not trust their testimony. In addition, according to the readings of the FL devices, it was necessary to carry out calculations in order to determine the distance from the substation to the place of fault. To accurately determine the fault location, it is necessary to use modern FL devices, which have sufficient speed and high accuracy and also do not require additional calculations. This will ensure the required reliability of power supply to consumers.
The FL methods by EMP have specific features when implemented on OHPLs of various designs and under different circuit conditions. For example, ref. [30] provides detailed studies of the use of measurements of currents and voltages of zero and negative sequences for the two-way FL of parallel (double-circuit) OHPLs. Features of the use of distributed generation sources in modern power supply systems lead to the advisability of using nonparametric methods in relay protection algorithms and FL on OHPLs [31], such as genetic algorithms, particle swarm methods, differential evolution, and others. It should be noted that achieving high accuracy and speed of FL methods on OHPLs is important in the conditions of reconfiguring the electrical network [32] to ensure system stability and reliability.
It is important to note that various random factors influence the magnitude of errors in calculating the distance to the fault in FL devices:
- Relative and angular errors of measuring current and voltage transformers;
- Harmonic components in currents and voltages recorded in an emergency mode [33];
- Current waveform distortions associated with saturation of electromagnetic measuring current transformers;
- Distortion of the sinusoidality of currents and voltages due to the influence of the load and devices based on power electronics elements [34,35];
- The presence of transient resistance at the site of fault on OHPLs;
- Uneven distribution of resistivity along the OHPL [36];
- Change in the resistance of the ground loops of OHPLs at different times of the year [37,38];
- Not taking into account the capacitive component of the OHPL relative to the ground in the FL algorithm;
- Neglect of mutual induction in the corridors of joint passage of OHPLs [39];
- Errors in the initial data on the resistivity of sections of OHPLs;
- Not taking into account the resistance of bypass connections, etc.
Under these conditions, it is required to use FL methods that allow calculating the distance to the fault location under the influence of random factors with high accuracy [40]. In the existing FL devices for OHPLs and various FL methods considered in the scientific literature, it was not previously proposed to apply a multi-hypothetical sequential analysis using the Armitage algorithm to determine the fault location on overhead lines.
The purpose of the study is to develop a new FL method for OHPLs according to the emergency mode parameters (EMP), based on a multi-hypothetical sequential analysis using the Armitage algorithm. The task of recognizing a faulted section of an OHPL is formulated as a statistical problem. The use of the developed FL method for OHPLs practically does not affect its performance but ensures the unambiguous identification of the faulted section of the OHPL under the influence of random factors.
2. Materials and Methods
In FL devices for OHPLs, they can use various physical principles as well as all kinds of algorithms to calculate the distance to the fault [41,42,43,44]. In some FL algorithms, emergency mode parameters are used, and in other algorithms, the results of the measurements are based on wave methods. In wave methods, either active probing of OHPLs is used or passive registration of wave processes at the ends of OHPLs (at substations) is used [45,46,47].
The relative error of wave FL methods, including those based on active probing of OHPLs, is much less than the error of FL devices by EMP [48,49,50]. However, the high cost of wave FL devices for OHPLs limits the possibility of their mass application in power grid companies. As experience shows, wave FL devices are used only on especially critical OHPLs.
FL devices for OHPLs by EMP are simple since the calculation algorithms are based on measurements of the components of currents and voltages of industrial frequency. One-sided [51,52], two-sided, and multi-sided measurements of currents and voltages are used in FL devices for OHPLs by EMP [53,54,55]. When implementing FL algorithms for OHPLs by EMP, it is not required to use analog-to-digital converters with a high sampling rate as well as high-performance processors. One-way FL algorithms for OHPLs do not require communication channels for information exchange since current and voltage measurements are made from one side of the OHPL. However, one-sided FL algorithms for OHPL have a large error compared to two-sided algorithms [56,57,58,59,60,61,62].
It is possible to implement FL algorithms for OHPLs by EMP in the form of specialized software in relay protection devices, emergency event recorders, automated process control systems for substations, devices for phasor measurement units (PMUs), etc. [63,64,65]. This makes it possible to not install separate FL devices for OHPLs, as has been the case for several decades, but implement this function in devices that are already installed at substations, which is more cost-effective.
In the regulatory and technical documents of large electric grid companies, the OHPL inspection zone means the estimated section of the OHPL (in km), determined on the basis of data from the FL devices (RP or others), which were obtained after an emergency shutdown of the OHPL. This information is the basis for planning the departure of the repair team to the OHPL in order to establish the actual location of the fault to the OHPL, identify the causes of fault, and carry out emergency recovery work. The permissible value of the OHPL inspection zone to search for the actual location of fault depends on the length of the OHPL, and it can reach up to ±10% of its length [66]. If the length of the OHPL is 50 km, then the permissible value of the inspection zone is ±5 km, which is a lot, especially when the OHPL passes over rough terrain.
To reduce the inspection area of OHPLs, in [67,68], two FL methods for OHPLs were proposed and studied, which are used in electrical networks and the contact network of railways. In the first case, based on the use of the interval method [67], the problem of reducing the size of the OHPL section, including the fault site, is solved. The second method [68] offers provisions for splitting the OHPL into sections to solve the problem of determining the faulted section of the OHPL. However, the authors do not take into account the influence of random factors that determine the magnitude of the error when calculating the distance to the fault site, and the FL methods for OHPLs by EMP are implemented on the basis of deterministic procedures.
Let us formulate the problem of recognizing a faulted section of an OHPL as a classification problem, which consists of establishing whether the fault belongs to one of the sections of an OHPL within the zone of its inspection. Due to the influence of random factors, the decision-making process during recognition has a stochastic character, since it is based on the processing of emergency oscillograms of currents and voltages recorded over a limited time interval. The duration of the time interval is determined by the time of SC elimination.
To implement a sequential analysis when choosing a faulted area within the inspection zone of an OHPL, it is proposed to carry out k experiments with sample data at each step of the procedure. According to the results of each of the experiments, one of the (M + 1) decisions is made:
- Complete the experiment by accepting the hypothesis H1 (fault in section No. 1).
- Complete the experiment by accepting the H2 hypothesis (fault in section No. 2).
- ………
- Complete the experiment by accepting the HM hypothesis (fault in section No. M).
- Continue the experiment by making additional observations.
Thus, the procedure is implemented sequentially: based on the first observation, one of the (M + 1) decisions is made, and when one of the first M decisions is chosen, the analysis process ends. If the solution numbered (M + 1) is chosen, then the next (second) observation is made. Then, based on the first two sample data, one of the (M + 1) decisions is made again. If the choice corresponds to the last (M + 1)th decision, then the third experiment is performed, and so on. The process continues until one of the first M solutions is chosen.
In the general case, the decision regarding the faulted section of the OHPL is made on the basis of the vector of parameters of currents and voltages x corresponding to the faulted section numbered m (m = 1, …, M). In this case, the vector x = {x1, x2, …} of current and voltage parameters is generally random since it may include distorting components; for example, it is associated with deviations of power quality indicators from standard values [69,70].
Since the hypotheses H1, …, HM mutually exclude each other, exhausting all possible cases for the chosen values of the vector x, then one (and only one) of the hypotheses, H1, …, HM, is consistent with a specific set of values of the vector x.
In order to form a rational decision rule in case of FL on OHPLs, it is necessary to introduce indicators of the effectiveness of a sequential analysis in recognizing a faulted section of an OHPL.
The most common probabilistic indicators of the effectiveness of the sequential analysis procedure should include a matrix of conditional probabilities for M—hypotheses, each of which corresponds to its faulted section within the inspection area of the OHPL:
where i, k = 1, …, M; P(k|i) = Pi(k) = Pik—the conditional probability of making a decision about the number k of the faulted section, provided that the fault belongs to section i.
The probabilistic indicators of recognition of a faulted section of an OHPL are directly related to the concept of resolution used in a number of physical problems [71]. In this case, the resolution of the FL algorithm for OHPLs should be understood as the minimum length of the OHPL section for which the problem of fault recognition with given performance indicators is implemented (Expression (1)). It is assumed that the resolution of the FL for OHPLs is the potentially achievable minimum length section of the OHPL, while the influence of undesirable random factors is minimized.
It is important to note that the actual resolution refers not only to the FL algorithm (device) for OHPLs, but also to a specific OHPL, which has design and operational features. For each fault on the OHPL, the accuracy of calculating the distance to the fault site will be determined by the resolution of the FL algorithm and the values of random factors affecting the OHPL.
Let us consider the option of using a multi-hypothetical sequential analysis with the use of the Armitage algorithm [72,73] when determining the fault location. In the algorithm developed by the authors, at each step of the analysis, M·(M − 1) paired likelihood ratios are calculated:
where k,l = 1, …, M; k l; —multi-dimensional probability density of the vector x observed at the m-th step.
At each observation step m, the calculated likelihood ratios (Expression (2)) are compared with the thresholds and the condition is checked: if , l = 1, …, M, k l, then a decision is made in favor of the hypothesis Hk. Otherwise, a decision is made to continue observations. The sequential analysis procedure is implemented until the condition is met when all (M − 1) likelihood ratios , l = 1, …, M, k l, characteristic of the hypothesis Hk will simultaneously exceed the corresponding thresholds .
The thresholds for each of the tested hypotheses regarding the faulted section of the OHPL are formed on the basis of probabilistic indicators of the quality of the probability, combined into a matrix of conditional probabilities (Expression (1)). It was shown in [72] that the probability of making a correct decision about a faulted section of an OHPL increases and approaches unity as the number of observations m increases.
The values of the probabilities of correct recognition of the faulted section Pkk and the threshold values in the multi-hypothetical sequential analysis using the Armitage algorithm are interconnected:
For M = 2, the threshold values are identical to those for sequential Wald analysis [74]. Thus, the Armitage algorithm can be considered a combination of M·(M − 1) binary consecutive Wald analyses, where the threshold ratios are determined by Expression (4).
The use of a multi-hypothesis sequential analysis using the Armitage algorithm for FL on OHPLs helps reduce the number of observations while maintaining the simplicity of the approach based on a comparison of pairwise likelihood ratios. For this, threshold values should be set, which depend on the number of observations m:
where —threshold determined by Expression (4); r—positive constant [75].
The developed FL method for OHPLs does not impose restrictions on the maximum required number of observations, but new threshold values reduce the likelihood of conducting a large number of them. It is noted in [75] that for r = 1, the new thresholds significantly reduce the average required number of observations, having an insignificant effect on the classifier error probabilities.
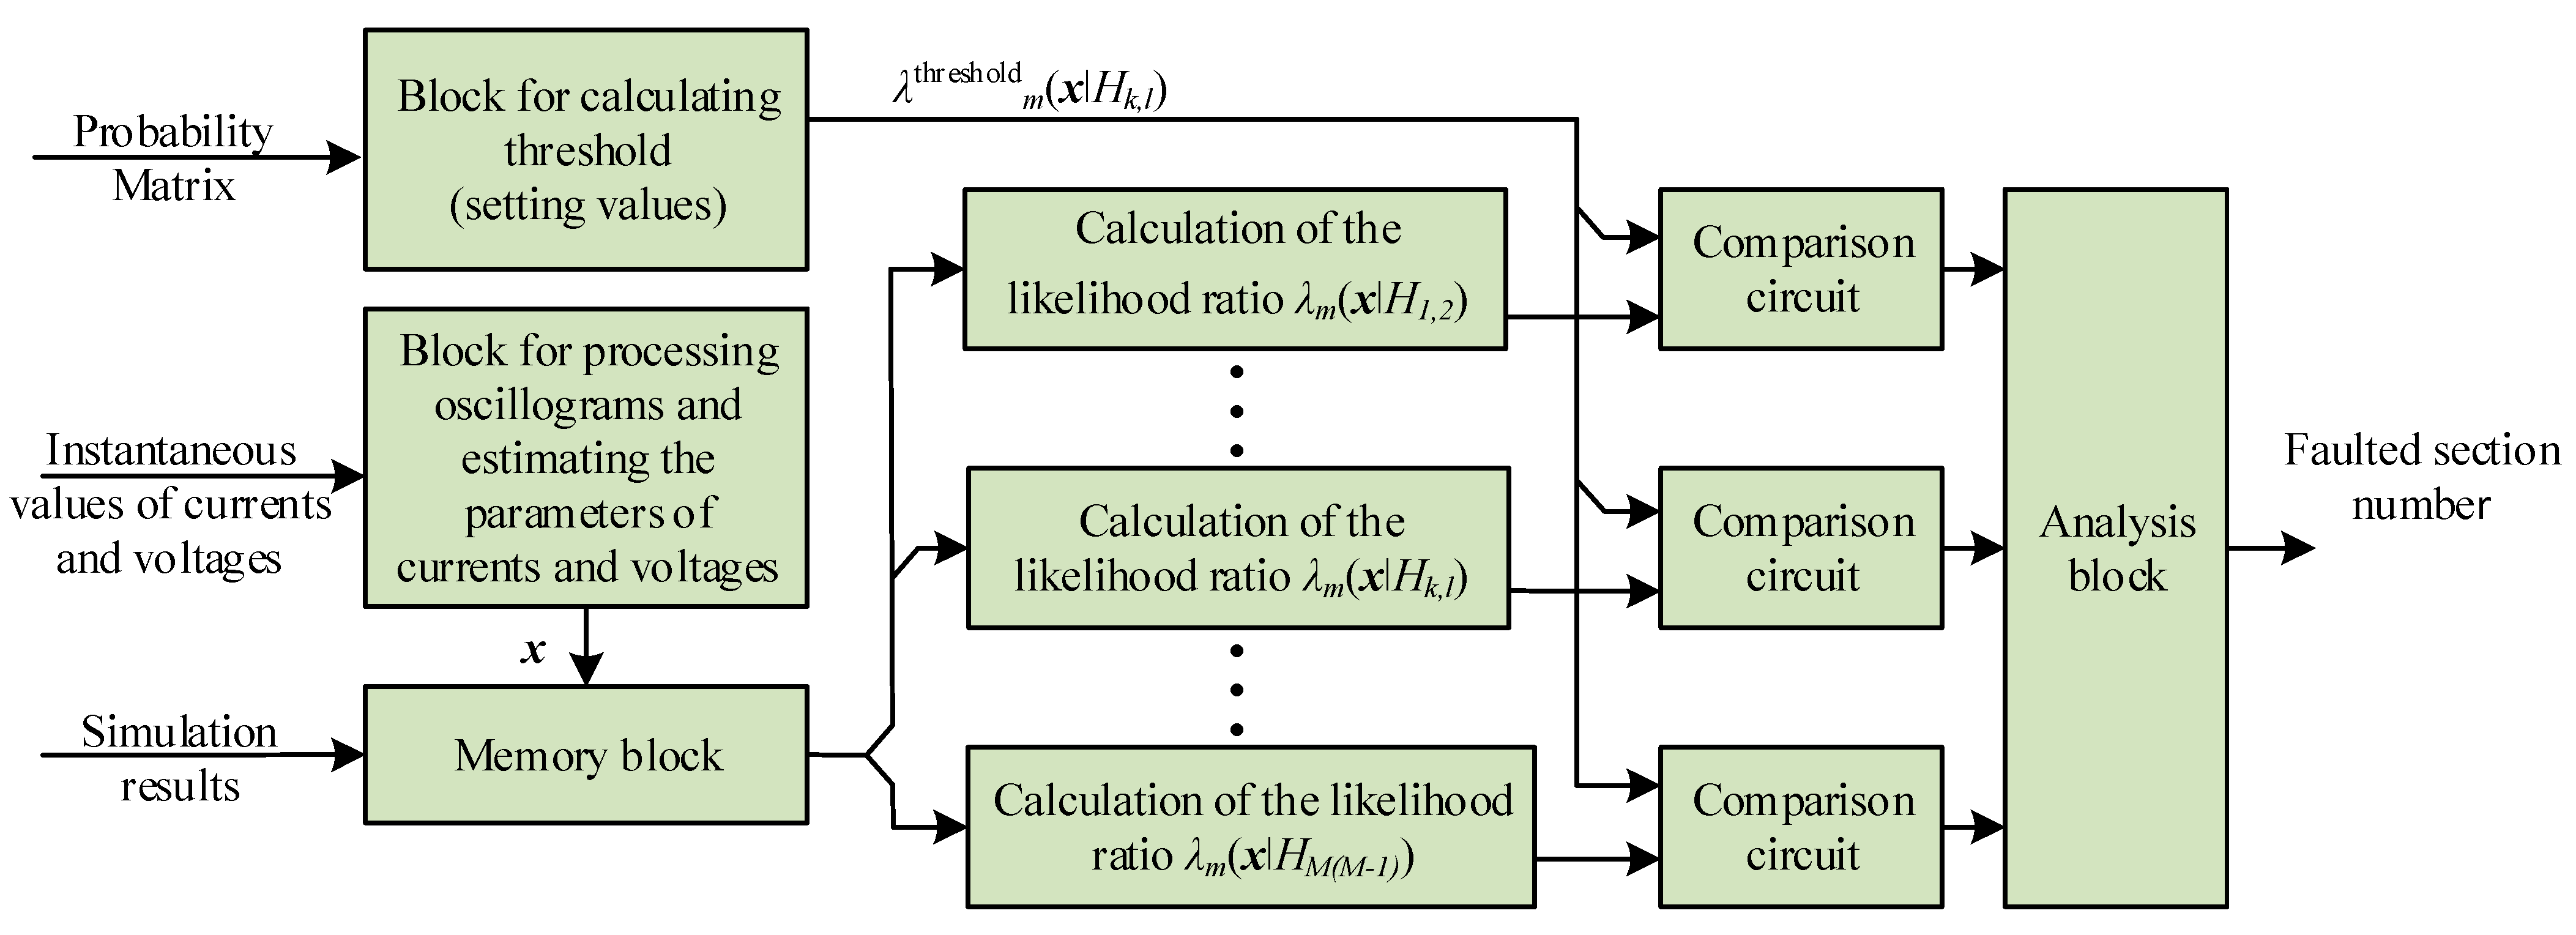
Figure 1 shows a structural diagram of the FL device that implements a multi-hypothetical sequential analysis using the Armitage algorithm. The FL device has a multi-channel structure, including M·(M − 1) channels, where M characterizes the number of sections into which the OHPL inspection zone is divided. For example, for M = 3, the number of channels will be 3 × (3 − 1) = 6, where paired hypothesis testing will be implemented: H1,2, H1,3; H2,1, H2,3; H3,1, and H3,2. There can be any number of sections of OHPLs, and they are determined by the personnel of electric grid companies based on their operating experience.
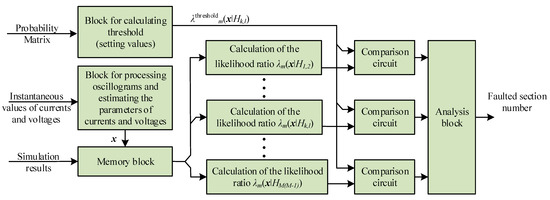
Figure 1.
Structural diagram of the FL device for OHPLs that implements the sequential analysis procedure using the Armitage algorithm.
The instantaneous (complex) values of currents and voltages obtained from the oscillograms of the emergency mode are received at the input of the FL device (Figure 1). Based on this information, the components of the vector x are calculated in the block for processing oscillograms and estimating the parameters of currents and voltages. The composition of the vector x includes quantities characterizing the faulted section of the OHPL (active resistance, reactance, reactive power value, current distribution coefficient value, etc.). In addition, it includes values calculated according to various FL algorithms for OHPLs by EMP, which have various systematic and random errors.
Further, in each of the blocks for calculating the likelihood ratio, based on the vector x, the likelihood ratios are calculated by the Expression (2) . When calculating each from the memory block, for the oscillograms received in the block for processing oscillograms and estimating the parameters of currents and voltages, the values of x are received by the corresponding values and .
Values and are formed for different combinations of hypotheses Hk,l, k l based on simulation results. Simulation modeling is performed in advance, until the moment of implementation of the FL algorithm and its results are recorded in the memory block. Probability distributions and can be obtained on the basis of statistical data, taking into account errors detected by repair teams during inspections of OHPLs after emergency shutdowns. They can also be obtained on the basis of the normalized value of the OHPL inspection zone (averaged values for OHPLs of various lengths and voltages), which is less accurate.
The corresponding threshold values are fed to the first inputs of the comparison circuits from the block for calculating threshold (setting) values to implement the comparison . The calculated values of the likelihood ratio for each of the hypotheses are fed to the second inputs of the comparison circuits, starting from the first and up to M·(M − 1). When the step m of the sequential procedure reaches the value from the output of the comparison circuit, a logical signal is sent to the analysis block [76].
As noted above, the sequential analysis procedure is implemented until the condition is met when all (M − 1) likelihood ratios , l = 1, …, M, k l, characteristic of the hypothesis Hk, do not simultaneously exceed the corresponding thresholds . In this case, the sequential analysis procedure stops and a decision is made that the fault on the OHPL is located in the section numbered k. From the output of the analysis block of the FL device (Figure 1), information is provided to the repair personnel about the faulted section (in the form of its number) within the inspection area of the OHPL.
3. Results and Discussion
Full-scale experiments to determine the location of fault on OHPLs are expensive and require the development of special organizational measures. Therefore, the advantages of the proposed method of FL on OHPLs are illustrated by a calculated example.
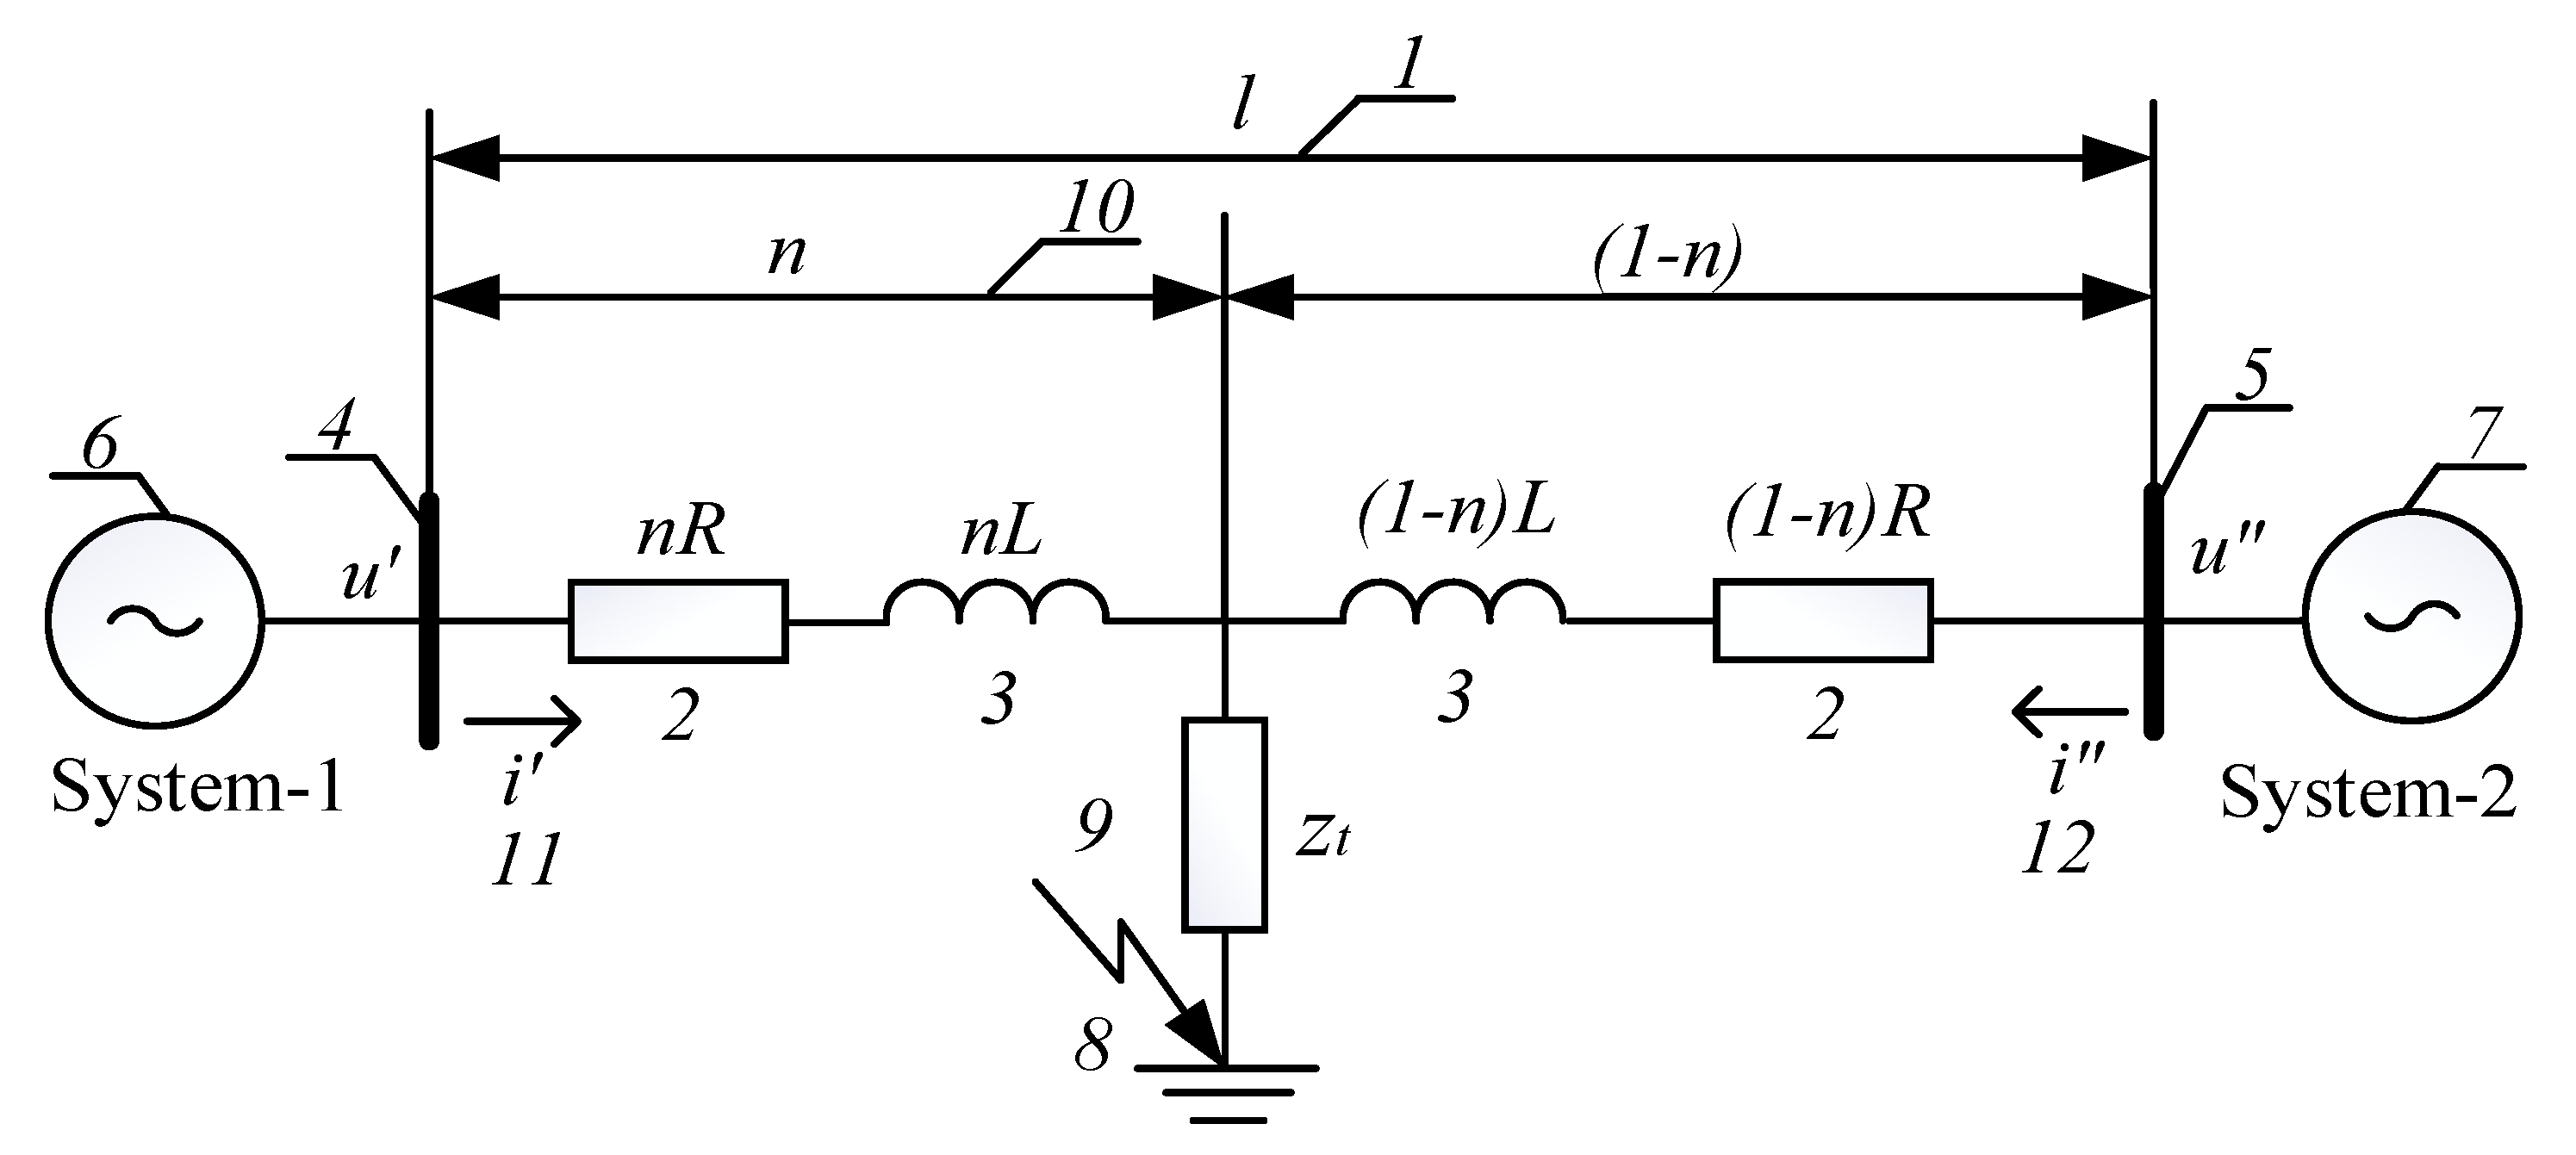
Let us consider the implementation of the FL method for OHPLs based on a multi-hypothetical sequential analysis using the Armitage algorithm using the example of a 110 kV OHPL with a length of l = 50 km and two-sided power supply (Figure 2) [77].
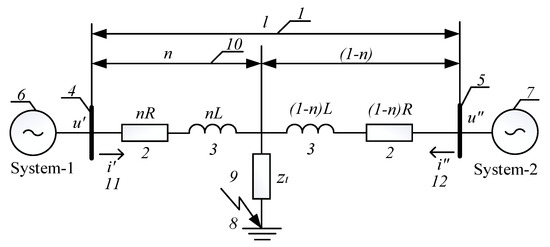
Figure 2.
Single-line equivalent circuit for 110 kV overhead lines.
Figure 2 shows the equivalent circuit of a 110 kV OHPL with a length l (1) in relation to the calculation example, phase active resistance R (2), and inductance L (3) connecting buses (4) and (5) of two power systems (6) and (7). On the OHPL, a short circuit (8) is shown behind the transition resistance Zt (9) at a distance x = n·l (10) from one of the ends of the OHPL. In the event of an SC, current i′ flows through the OHPL from the busbars (4) and current i″ from the busbars (5). At the time of a short circuit, the instantaneous values of phase currents (i′A, i′B, i′C), (i″A, i″B, i″C) and voltages (u′A, u′B, u′C), (u″A, u″B, u″C) are measured from both ends of the overhead line, which are not synchronized in time.
The relative distance to the fault location n is determined in accordance with the following well-known Expression (6):
n = [(u′(m) − u″(m)) + R·I″(m) + L·I″(m)/dtm]/[R·(I′(m) + I″(m))
+ L·(I′(m)/dtm + I″(m)/dtm)].
+ L·(I′(m)/dtm + I″(m)/dtm)].
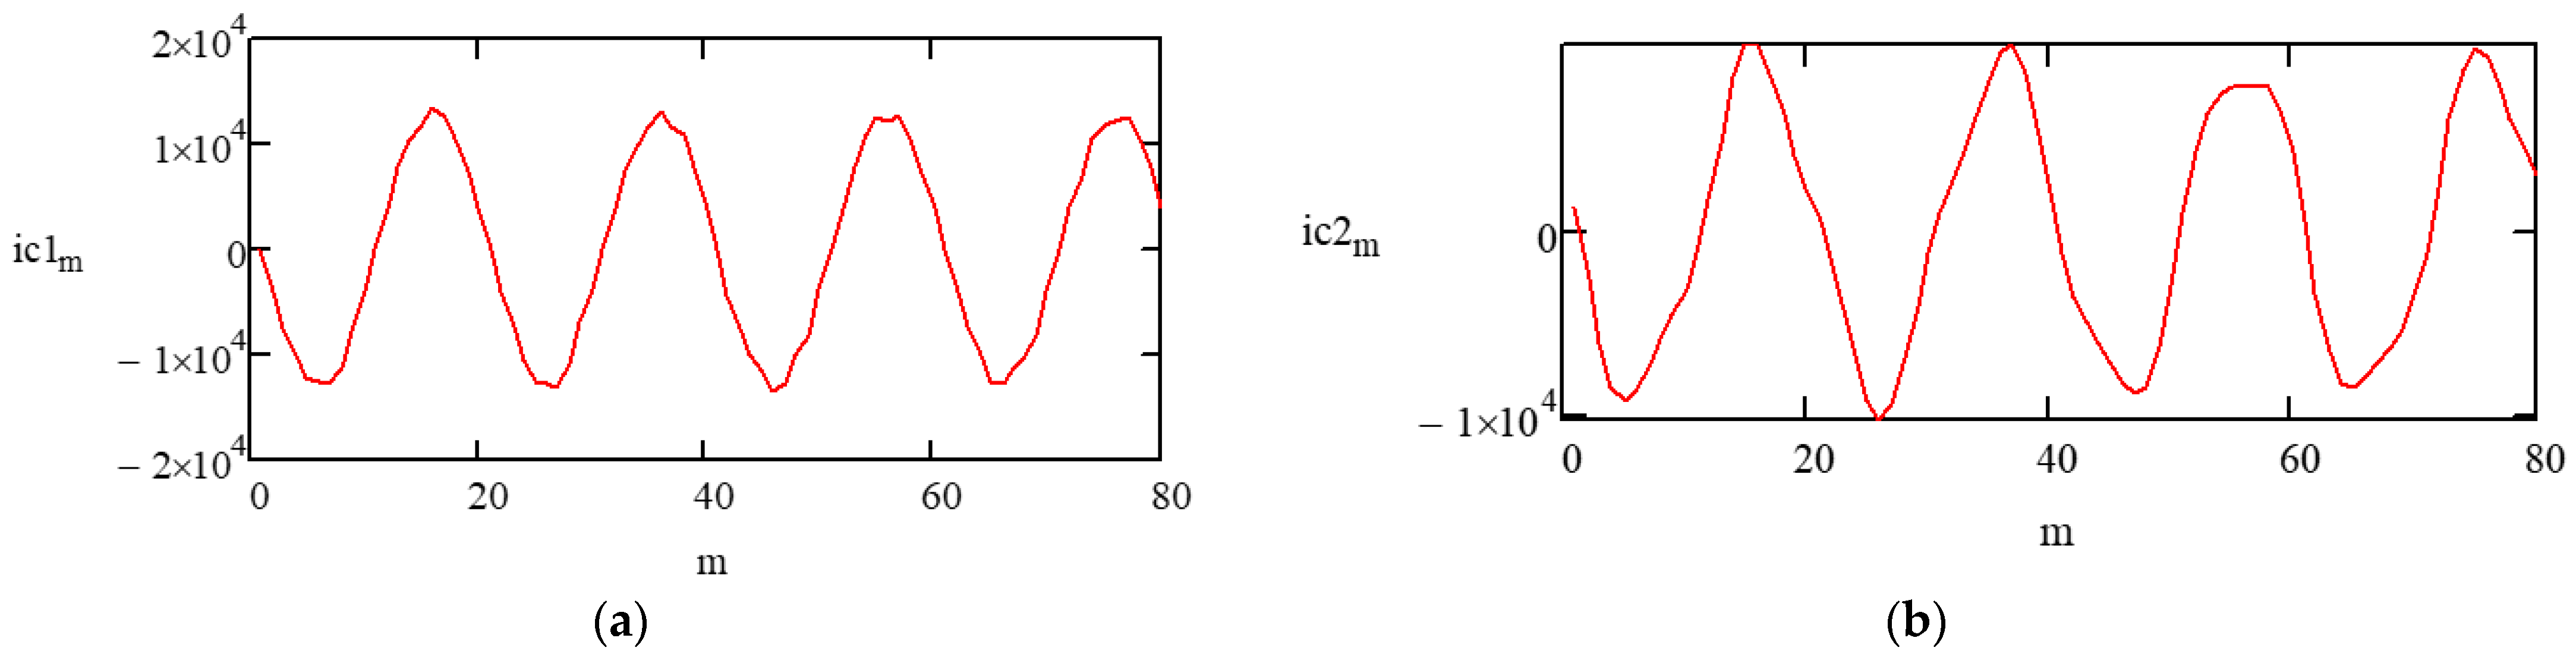
This FL method for OHPLs has small errors in calculating the distance to the fault location under short-circuit conditions with undistorted (sinusoidal) currents and voltages in emergency mode oscillograms [77]. Let us assume that from the power System-1 side (Figure 2), discrete instantaneous values of current i′(m) are distorted by flicker [78,79,80]. The distorted current signal i′(m) is shown in Figure 3a.
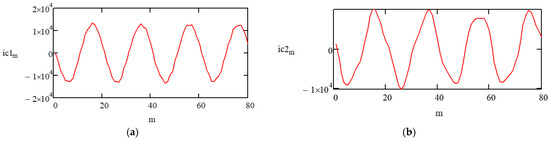
Figure 3.
Oscillograms of overhead line currents distorted by the following: (a) flicker from power System-1; (b) interharmonics with frequency fi = 135 Hz from power System-2.
Let us assume that there is a non-linear load on the side of power System-2 (Figure 2), which outputs interharmonics into the electrical network [81,82]. In the example, the instantaneous values of current i″(m) are distorted by interharmonics with frequency fi = 135 Hz, amplitude Ii = 0.15·I″, and a zero initial phase, as shown in Figure 3b.
The calculation expression for determining the fault location in the presence of flicker and frequency interharmonics fi = 135 Hz will correspond to the equation:
where k—number (constant coefficient) characterizing the “depth of distortion” by flicker; rnd(m)—random number (for example, distributed according to a uniform law in the interval [0; 1], formed at each discrete time value m); U—voltage at the fault location; td—delay time; ts—sampling interval.
ni(m) = {(u′(m) − ui″(m)) + I″[R·sin(2πf(td + m·ts)) + L·cos(2πf(td + m·ts))]
+ 0.15I″[R·sin(2πfi(td + m·ts))+ L·cos(2πfi(td + m·ts))]}/
{(I′(1 − k·rnd(m)) + I″)·[R·sin(2πf(td + m·ts)) + L·cos(2πf(td + m·ts))]
+ 0.15I″[R·sin(2πfi(td + m·ts)) + L·cos(2πfi(td + m·ts))]};
u′(m) = U + I′·(1 − k·rnd(m))·[nR·sin(2πf(td + m·ts)) + nL·cos(2πf(td + m·ts))],
ui″(m) = U + (1 − n)·R[I″·sin(2πf(td + m·ts)) + 0.15I″·sin(2πfi(td + m·ts))]
+ (1 − n)L·[I″·sin(2πf(td + m·ts)) + 0.15I″·sin(2πfi(td + m·ts))],
The technical characteristics of the OHPL and the measured parameters of the emergency mode from the two ends of the OHPL are given in Table 1. The measurement data of the emergency mode parameters were obtained from the emergency event recorder during a real short circuit on the 110 kV OHPL considered in the example.

Table 1.
Technical characteristics of overhead lines and measured parameters of the emergency mode.
Substitution of numerical values from Table 1 into Expression (7) allowed us to obtain the following results:
- At m = 20; ni and (20) = 0.486; ∆x = l·(n − ni) = 50 × (0.5 − 0.486) = 0.7 (km);
- At m = 60; ni and (60) = 0.526; ∆x = l·(n − ni) = 50 × (0.5 − 0.526) = −1.30 (km).
The analysis of the obtained calculation results shows that the FL errors can have both positive and negative signs. In addition, they are distributed unevenly with respect to different points in time [83].
Since the length of the OHPL is l = 50 km, the inspection area by the repair team to search for the actual fault location, in accordance with the requirements of regulatory and technical documents, should not exceed ±10% of the length of the OHPL [66]. Therefore, ∆l = ±50 × 0.1 = ±5 km relative to the fault location.
Taking into account the normal law of FL error distribution for OHPLs by EMP and the three-sigma rule [84], we assume that the standard deviation (root-mean-square deviation) of the normal distribution law of errors of the FL device is σ ≈ (2·∆l)/6 = 10/6 = 1.67 km.
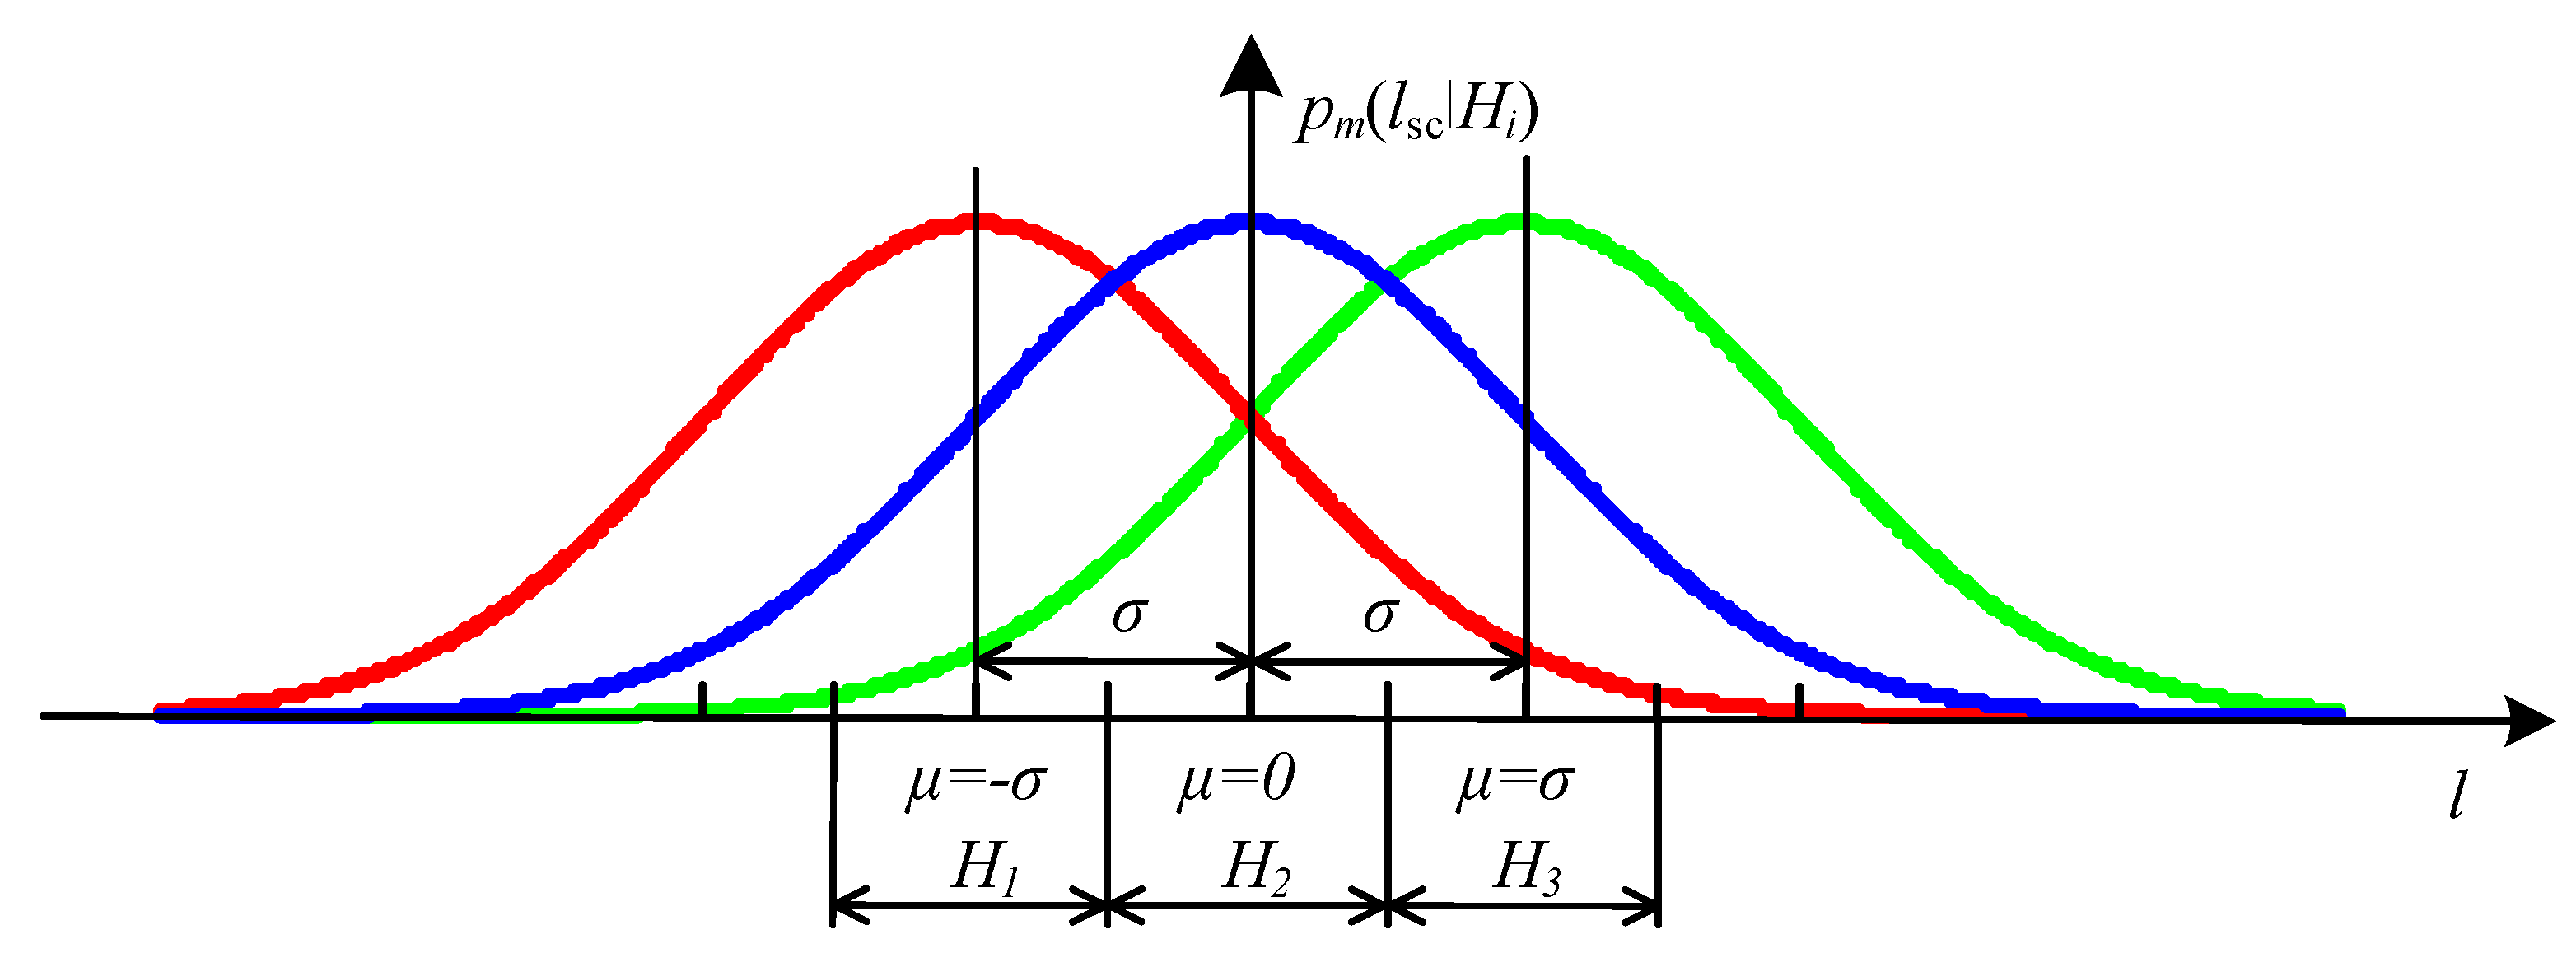
Let us consider the process of implementing a sequential analysis when determining the FL on OHPL with dividing the inspection area of an OHPL into three sections relative to the place of its fault (Figure 4), corresponding to three hypotheses: H1: μ = −σ; H2: μ = 0; and H3: μ = σ. Each of the hypotheses corresponds to making a decision about the compliance of the fault location with the value of mathematical expectations μ.
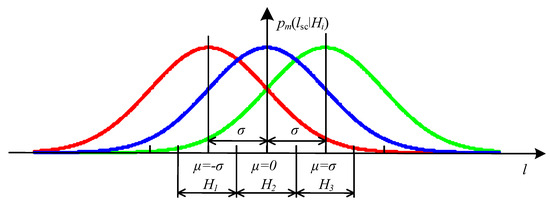
Figure 4.
Probability distribution of hypotheses pm(lsc|Hi).
As a result of calculating the distance to the fault location (Expression (7)), based on the instantaneous values of the current (Figure 3a,b) and voltage oscillograms, ten consecutive sample values lsc were obtained, which are given in Table 2.
Table 2.
Sample values of the distance to the fault location obtained by measuring the instantaneous values of the oscillograms of currents and voltages of the emergency mode.
Due to the scatter of the sample values of lsc, it is impossible to make an unambiguous decision regarding the validity of the hypotheses H1, H2, H3. The mathematical expectation of the sample values lsc (Table 2) is M[lsc] = 25.185 (km).
To implement a sequential analysis, we introduce a matrix of conditional probabilities (Expression (1)) for making a decision regarding the faulted section of the OHPL:
The choice of matrix elements should take into account the operational features of the OHPL, as well as the economic consequences of making an incorrect decision when determining the fault location.
Let us calculate the threshold values necessary for the implementation of a multi-hypothesis sequential analysis using the Armitage algorithm, taking into account the components of the matrix ‖P(k|i)‖ (Expression (1)):
It is advisable to calculate the likelihood ratios for each ratio k l using the standard Gaussian function, the tables of which are given in the following [84]:
At the first step of sequential analysis in relative units lstsc(1) = 0.398, then we achieve the following:
λ1(0.398|H1,2) = p1(0.398H1)/p2(0.398|H2) = 0.0485/0.369 = 0.131;
λ1(0.398|H1,3) = p1(0.398H1)/p2(0.398|H3) = 0.0485/0.18 = 0.269;
λ1(0.398|H2,1) = p2(0.398H2)/p1(0.398|H1) = 0.369/0.0485 = 7.608;
λ1(0.398|H2,3) = p2(0.398H2)/p3(0.398|H3) = 0.369/0.18 = 2.05;
λ1(0.398|H3,1) = p3(0.398H3)/p1(0.398|H1) = 0.18/0.0485 = 3.711;
λ1(0.398|H3,2) = p3(0.398H3)/p2(0.398|H2) = 0.18/0.369 = 0.488.
The calculation results show that at the first step of the sequential analysis, which is only one likelihood ratio λ1(0.398|H2,1) = 7.608, exceeds the specified threshold value. This is due to the introduced condition that all (M − 1) likelihood ratios , l = 1, …, M, k l, characteristic of the hypothesis Hk, must simultaneously exceed the corresponding thresholds . If this condition is not met, then the sequential analysis continues.
Likewise, the likelihood ratios are calculated for the next steps m of sequential analysis using the Armitage algorithm, as shown in Table 3.
Table 3.
Likelihood ratio calculation results required to implement sequential analysis using the Armitage algorithm.
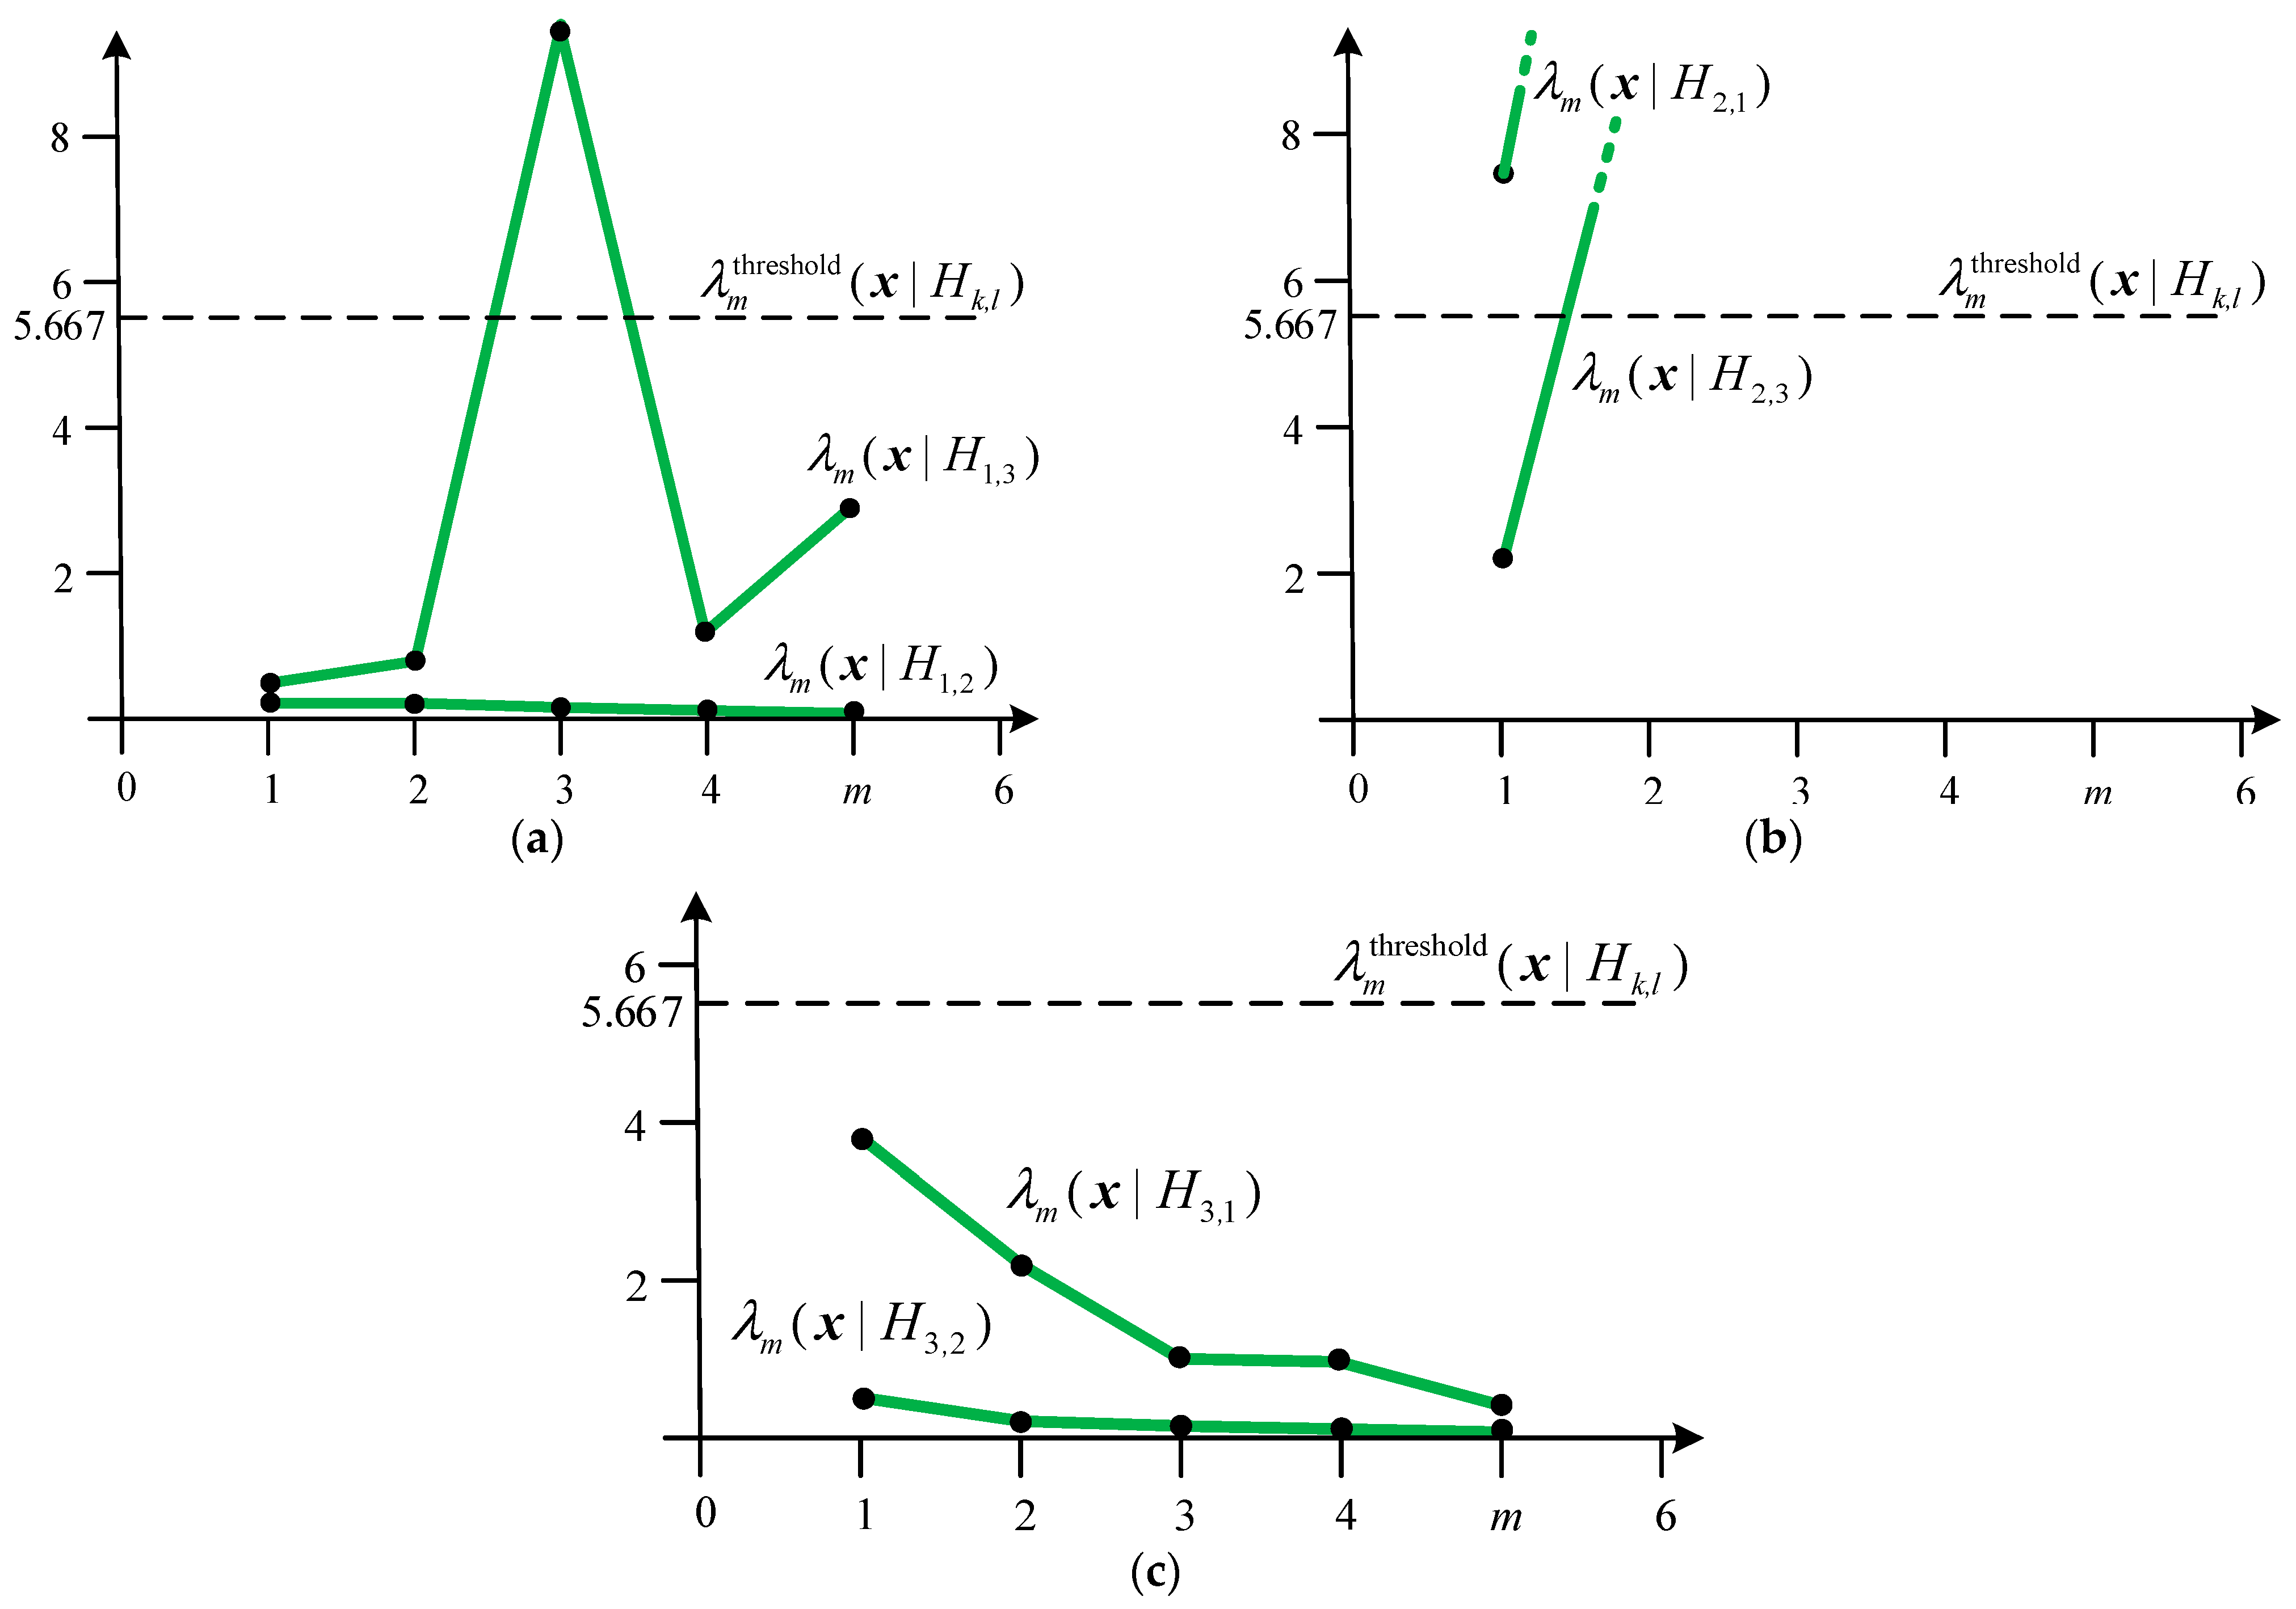
Visually, the process of implementing sequential analysis using the Armitage algorithm is shown in Figure 5.
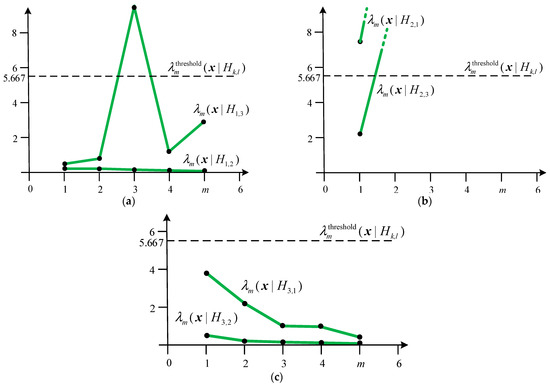
Figure 5.
The process of implementing sequential analysis using the Armitage algorithm for a 110 kV overhead line with a length of l = 50 km: (a) likelihood ratios λm(x|H1,2), λm(x|H1,3); (b) likelihood ratios λm(x|H2,1), λm(x|H2,3); (c) likelihood ratios λm(x|H3,1), λm(x|H3,2).
Analysis of Figure 5 allows us to draw the following conclusions:
- Multi-criteria sequential analysis using the Armitage algorithm as applied to FL for OHPLs by EMP leads to the selection of a faulted section in the interval M[lsc] ± σ/2 = 25.185 ± 0.835 (km);
- The sequential analysis procedure does not require significant time costs, allowing us to make a decision about the faulted section in two steps, practically without affecting the speed of the OHPL fault algorithm;
- There is no need to use special computational methods to increase the speed of FL for OHPLs;
- The speed of making a decision on the fault location on OHPLs when implementing sequential analysis depends on the degree of distortion of currents and voltages in emergency mode oscillograms, including deviations of power quality parameters from standard values [85].
The proposed method is applicable to determining the location of faults on OHPLs accompanied by one-, two-, and three-phase SCs. The reasons for such SCs may be as follows:
- Overlaps as a result of thunderstorms;
- Falling of trees onto wires without breaking the wire or overlapping onto tree branches;
- Overlap with the destruction of insulators, for example, due to unauthorized persons shooting at the garland from a hunting rifle;
- Overlap from the wire to the support body as a result of strong winds, ice, and frost deposits;
- Blocking the wire from passing large-sized machinery and agricultural machinery;
- Breakage of lightning protection cables followed by an SC of the phase wire(s) to the ground;
- A break with a wire falling to the ground;
- Uncoupling of the insulator string;
- Throwing metal objects onto overhead line wires by unauthorized persons;
- Other reasons.
It should be noted that the implementation of a multi-hypothesis sequential analysis slightly increases the time of the decision-making process regarding the faulted area when determining the FL. Based on statistical calculations, the number of stages of the sequential procedure does not exceed 8–10 steps [74]. Moreover, as shown above, the number of processing operations at each step of the sequential procedure is a small number. Thus, for modern FL devices, the practical implementation of the proposed algorithm does not require significant computational costs and time. On the other hand, information about the FL is necessary in network control centers (dispatch centers) to assign the line crew a zone to bypass the faulted OHPL. The time from the moment of fault detection on OHPLs (triggering of relay protection devices) until the departure of the line crew, as a rule, in Russian practice ranges from tens of minutes to an hour and a half. Therefore, the complication of calculations and the additional time spent on them for the proposed FL method do not have any effect on the overall speed of eliminating faults on OHPLs.
4. Conclusions
The influence of various random factors, including deviations of power quality indicators from standard values, leads to the need to use statistical procedures when determining the fault location on an overhead power line based on emergency mode parameters.
A method has been developed for determining the location of the fault based on emergency mode parameters, including dividing the overhead power line bypass zone into many sections, followed by the implementation of a statistical procedure for recognizing the faulted area based on the Armitage multi-hypothesis sequential analysis algorithm.
The use of the Armitage algorithm allows us to adapt the decision-making process regarding the faulted area to the distortion features of emergency oscillograms.
An analysis of the computational operations of the proposed fault location method using the EMP shows an insignificant dependence of its performance on the distortion of emergency oscillograms, but at the same time, unambiguous decision-making is ensured regarding the faulted section of the overhead power line.
Author Contributions
Conceptualization, A.K. and P.I.; methodology, A.K. and S.F.; software, A.L.; validation, P.I. and S.F.; formal analysis, A.K. and A.L.; investigation, P.I. and S.F.; resources, A.K.; data curation, P.I.; writing—original draft preparation, A.K. and P.I.; writing—review and editing, A.L. and S.F.; visualization, A.L.; supervision, A.K.; project administration, P.I.; funding acquisition, S.F. All authors have read and agreed to the published version of the manuscript.
Funding
This work is supported by the Russian Science Foundation under grant 21-79-30013 for the Energy Research Institute of the Russian Academy of Sciences.
Data Availability Statement
Not applicable.
Conflicts of Interest
The authors declare no conflict of interest. The funders had no role in the design of the study; in the collection, analyses, or interpretation of data; in the writing of the manuscript, or in the decision to publish the results.
Abbreviation
| FL | fault location |
| OHPL | overhead power line |
| EMP | emergency mode parameters |
| RP | relay protection |
| SC | short circuit |
| PMU | phasor measurement unit |
References
- Voropai, N. Electric Power System Transformations: A Review of Main Prospects and Challenges. Energies 2020, 13, 5639. [Google Scholar] [CrossRef]
- Suliman, A.S.; Ahmed, B.M.; Elareefi, M.B.; Elrahman, E.A.E.A.; Arbab, E.A.; Abdulwahab, M.M. Monitoring System for Overhead Power Transmission Lines in Smart Grid System Using Internet of Things. Univ. Khartoum Eng. J. 2022, 12, 1. [Google Scholar] [CrossRef]
- Savina, N.V.; Varygina, A.O. Selection of an optimal cable brand for high-voltage overhead power lines based on criterion analysis. Ipolytech J. 2023, 27, 339–353. [Google Scholar] [CrossRef]
- Korotkevich, M.A.; Podgaisky, S.I. On the Expediency of Laying Cable Power Lines with a Voltage of 6–35 kV Outside Settlements Instead of Overhead Power Lines. ENERGETIKA Proc. CIS High. Educ. Inst. Power Eng. Assoc. 2022, 65, 463–476. [Google Scholar] [CrossRef]
- Nazemi M Dehghanian, P.; Darestani, Y.M.; Jinshun, S.J. Parameterized Wildfire Fragility Functions for Overhead Power Line Conductors. Power Syst. IEEE Trans. Power Syst. 2023, 99, 1–11. [Google Scholar] [CrossRef]
- Gonçalves, A.C.R.; Marques, M.C.; Loureiro, S.; Nieto, R.; Liberato, M.L.R. Disruption risk analysis of the overhead power lines in Portugal. Energy 2022, 263, 125583. [Google Scholar] [CrossRef]
- Li, P.; Qiu, R.; Wang, M.; Wang, X.; Jaffry, S.; Xu, M.; Huang, K.; Huang, Y. Online Monitoring of Overhead Power Lines Against Tree Intrusion via a Low-cost Camera and Mobile Edge Computing Approach. J. Phys. Conf. Ser. 2023, 2422, 012018. [Google Scholar] [CrossRef]
- Farkhadzeh, E.M.; Muradaliev, A.Z.; Abdullaeva, S.A.; Nazarov, A.A. Quantitative Assessment of the Operational Reliability of Overhead Power Transmission Lines. Power Technol. Eng. 2022, 55, 790–796. [Google Scholar] [CrossRef]
- Listyukhin, V.A.; Pecherskaya, E.A.; Artamonov, D.; Zinchenko, T.O.; Anisimova, A.A. Improving the reliability of overhead power transmission lines through the introduction of information and measurement systems for monitoring their parameters. Meas. Monit. Manag. Control 2022, 3, 62–68. (In Russian) [Google Scholar] [CrossRef]
- Ilyushin, P.; Volnyi, V.; Suslov, K.; Filippov, S. Review of Methods for Addressing Challenging Issues in the Operation of Protection Devices in Microgrids with Voltages of up to 1 kV that Integrates Distributed Energy Resources. Energies 2022, 15, 9186. [Google Scholar] [CrossRef]
- Listyukhin, V.; Pecherskaya, E.; Gurin, S.; Anisimova, A.; Shepeleva, A. Analysis and classification of cause and effect factors affecting the operating modes of overhead power lines. AIP Conf. Proc. 2022, 2767, 020019. [Google Scholar] [CrossRef]
- Ilyushin, P.; Filippov, S.; Kulikov, A.; Suslov, K.; Karamov, D. Specific Features of Operation of Distributed Generation Facilities Based on Gas Reciprocating Units in Internal Power Systems of Industrial Entities. Machines 2022, 10, 693. [Google Scholar] [CrossRef]
- Gurevich, Y.E.; Kabikov, K.V. Peculiarities of Power Supply, Aimed at Failure-Free Operation of Industrial Consumers; ELEKS-KM: Moscow, Russia, 2005. (In Russian) [Google Scholar]
- Ilyushin, P.V. Emergency and post-emergency control in the formation of micro-grids. E3S Web Conf. 2017, 25, 02002. [Google Scholar] [CrossRef]
- Maly, A.S.; Shalyt, G.M.; Eisenfeld, A.I. Determination of the Places of Damage to Power Transmission Lines According to the Parameters of the Emergency Mode; Energiya: Moscow, Russia, 1972; 215p. (In Russian) [Google Scholar]
- Kezunovic, M.; Knezev, M. Selection of optimal fault location algorithm. In Proceedings of the 2008 IEEE Power and Energy Society General Meeting—Conversion and Delivery of Electrical Energy in the 21st Century, Pittsburgh, PA, USA, 20–24 July 2008. [Google Scholar] [CrossRef]
- Panahi, H.; Zamani, R.; Sanaye-Pasand, M.; Mehrjerdi, H. Advances in Transmission Network Fault Location in Modern Power Systems: Review, Outlook and Future Works. IEEE Access 2021, 9, 158599–158615. [Google Scholar] [CrossRef]
- Schwan, M.; Ettinger, A.; Gunaltay, S. Probabilistic reliability assessment in distribution network master plan development and in distribution automation implementation. In Proceedings of the CIGRE, 2012 Session, Paris, France, 26–30 August 2012. Rep. C4-203. [Google Scholar]
- Shor, Y.B. Statistical Methods of Analysis and Quality Control and Reliability; Soviet Radio: Moscow, Russia, 1962. (In Russian) [Google Scholar]
- Bollen, M.H.J.; Dirix, P.M.E. Simple model for post-fault motor behaviours for reliability/power quality assessment of industrial power systems. IEE Proc.—Gener. Transm. Distrib. 1996, 143, 56–60. [Google Scholar] [CrossRef]
- Powanga, L.; Kwakwa, P.A. Determinants of Electricity Transmission and Distribution Losses in South Africa. J. Renew. Energy 2023, 2023, 2376449. [Google Scholar] [CrossRef]
- Thomas, D.; Fung, J. Measuring downstream supply chain losses due to power disturbances. Energy Econ. 2022, 114, 106314. [Google Scholar] [CrossRef]
- Koks, E.E.; Pant, R.; Thacker, S.; Hall, J. Understanding Business Disruption and Economic Losses Due to Electricity Failures and Flooding. Int. J. Disaster Risk Sci. 2019, 10, 421–438. [Google Scholar] [CrossRef]
- Lacommare, K.; Eto, J. Cost of power interruptions to electricity consumers in the United States (US). Energy 2006, 31, 1845–1855. [Google Scholar] [CrossRef]
- Edomah, N. Effects of voltage sags, swell and other disturbances on electrical equipment and their economic implications. In Proceedings of the CIRED 2009—20th International Conference and Exhibition on Electricity Distribution—Part 1, Prague, Czech Republic, 8–11 June 2009; pp. 1–4. [Google Scholar]
- Shalyt, G.M. Determination of the Place of Damage in Electrical Networks; Energoatomizdat: Moscow, Russia, 1982; 312p. (In Russian) [Google Scholar]
- Krzysztof, G.; Kowalik, R.; Rasolomampionona, D.D.; Anwar, S. Traveling wave fault location in power transmission systems: An overview. J. Electr. Syst. 2011, 7, 287–296. [Google Scholar]
- Lachugin, V.F. Wave methods for determining the location of damage on overhead power lines. Relay Prot. Autom. 2023, 1, 58–61. (In Russian) [Google Scholar]
- Obalin, M.D.; Kulikov, A.L. Application of adaptive procedures in algorithms for determining the location of damage to power lines. Ind. Power Eng. 2013, 12, 35–39. (In Russian) [Google Scholar]
- Abbasi, F.; Abdoos, A.; Hosseini, S.M.; Sanaye-Pasand, M. New ground fault location approach for partially coupled transmission lines. Electr. Power Syst. Res. 2023, 216, 109054. [Google Scholar] [CrossRef]
- Sampaio, F.; Tofoli, F.L.; Melo, L.S.; Barroso, G.C.; Sampaio, R.F.; Leao, R. Adaptive fuzzy directional bat algorithm for the optimal coordination of protection systems based on directional overcurrent relays. Electr. Power Syst. Res. 2022, 211, 108619. [Google Scholar] [CrossRef]
- Aziz, T.; Lin, Z.; Waseem, M.; Liu, S. Review on optimization methodologies in transmission network reconfiguration of power systems for grid resilience. Int. Trans. Electr. Energy Syst. 2021, 31, e12704. [Google Scholar] [CrossRef]
- Ilyushin, P.V.; Pazderin, A.V. Approaches to organization of emergency control at isolated operation of energy areas with distributed generation. In Proceedings of the International Ural Conference on Green Energy (URALCON), Chelyabinsk, Russia, 4–6 October 2018. [Google Scholar] [CrossRef]
- Gurevich, Y.E.; Libova, L.E. Application of Mathematical Models of Electrical Load in Calculation of the Power Systems Stability and Reliability of Power Supply to Industrial Enterprises; ELEKS-KM: Moscow, Russia, 2008. (In Russian) [Google Scholar]
- Ilyushin, P.V.; Filippov, S.P. Under-frequency load shedding strategies for power districts with distributed generation. In Proceedings of the 2019 International Conference on Industrial Engineering, Applications and Manufacturing (ICIEAM), Sochi, Russia, 25–29 March 2019. [Google Scholar] [CrossRef]
- Voitovich, P.A.; Lavrov, Y.A.; Petrova, N.F. Innovative technical solutions for the construction of ultra-compact high-voltage overhead power transmission lines. New Russ. Electr. Power Ind. 2018, 8, 44–57. (In Russian) [Google Scholar]
- Kosyakov, A.A.; Kuleshov, P.V.; Pogudin, A.L. The influence of the grounding device structure of a substation on the voltage of conducted interference of lightning currents. Russ. Electr. Eng. 2019, 90, 752–755. [Google Scholar] [CrossRef]
- Sharipov, U.B.; Égamnazarov, G.A. Calculating currents in lightning protection cables and in optical cables built into them during asymmetric short circuits in overhead transmission lines. Power Technol. Eng. 2017, 50, 673–678. [Google Scholar] [CrossRef]
- Shevchenko, N.Y.; Ugarov, G.G.; Kirillova, S.N.; Lebedeva, Y.V. Review and analysis of the design features of overhead power line wires with increased resistance to icy-wind loads. Quest. Electr. Technol. 2018, 4, 53–63. (In Russian) [Google Scholar]
- Kulikov, A.; Ilyushin, P.; Loskutov, A.; Suslov, K.; Filippov, S. WSPRT Methods for Improving Power System Automation Devices in the Conditions of Distributed Generation Sources Operation. Energies 2022, 15, 8448. [Google Scholar] [CrossRef]
- Saha, M.M.; Izykowski, J.; Rosolowski, E. Fault Location on Power Networks; Springer: London, UK, 2010; 437p. [Google Scholar]
- Visyashchev, A.N. Devices and Methods for Determining the Location of Damage on Power Transmission Lines: A textbook. At 2 h. h. 1; Publishing House of IrSTU: Irkutsk, Russia, 2001; 188p. (In Russian) [Google Scholar]
- Lebedev, V.; Filatova, G.; Timofeev, A. Increase of accuracy of the fault location methods for overhead electrical power lines. Adv. Mater. Sci. Eng. 2018, 2018, 3098107. [Google Scholar] [CrossRef]
- Arzhannikov, E.A.; Lukoyanov, V.Y.; Misrikhanov, M.S. Determining the Location of a Short Circuit on High−Voltage Power Transmission Lines; Shuin, V.A., Ed.; Energoatomizdat: Moscow, Russia, 2003; 272p. (In Russian) [Google Scholar]
- Ilyushin, P.V.; Shepovalova, O.V.; Filippov, S.P.; Nekrasov, A.A. The effect of complex load on the reliable operation of solar photovoltaic and wind power stations integrated into energy systems and into off-grid energy areas. Energy Rep. 2022, 8, 1515–1529. [Google Scholar] [CrossRef]
- Kulikov, A.L. Remote Determination of Power Line Damage Sites by Active Sensing Methods; Energoatomizdat: Moscow, Russia, 2006; 148p. (In Russian) [Google Scholar]
- Minullin, R.G. Detecting the faults of overhead electric-power lines by the location-probing method. Russ. Electr. Eng. 2017, 88, 61–70. [Google Scholar] [CrossRef]
- Kulikov, A.L.; Lukicheva, I.A. Determination of the place of damage to the power transmission line by the instantaneous values of the oscillograms of emergency events. Bull. Ivanovo State Power Eng. Univ. 2016, 5, 16–21. (In Russian) [Google Scholar]
- Ustinov, A.A.; Visyashchev, A.N. Iterative methods for determining the location of damage by the parameters of the emergency mode during one-way measurements on overhead power lines. Bull. IrSTU 2010, 5, 260–266. (In Russian) [Google Scholar]
- Kulikov, A.; Ilyushin, P.; Suslov, K.; Filippov, S. Estimating the Error of Fault Location on Overhead Power Lines by Emergency State Parameters Using an Analytical Technique. Energies 2023, 16, 1552. [Google Scholar] [CrossRef]
- Aboshady, F.M.; Thomas, D.W.P. A Wideband Single End Fault Location Scheme for Active Untransposed Distribution Systems. IEEE Trans. Smart Grid 2020, 11, 2115–2124. [Google Scholar] [CrossRef]
- Takagi, T.; Yamakoshi, Y.; Yamaura, Y.; Kondow, R.; Matsushima, T. Development of a new type fault locator using the one-terminal voltage and current data. IEEE Trans. Power Appl. Syst. 1982, PAS-101, 2892–2898. [Google Scholar] [CrossRef]
- Simeon, O.; Faithpraise, F.O.; Ibanga, J. Iterative Newton-Raphson-Based Impedance Method for Fault Distance Detection on Transmission Line. Int. Multiling. J. Sci. Technol. 2020, 5, 2805–2810. [Google Scholar] [CrossRef]
- Nagendra Reddy, P.L.V.; Mukunda, V.K.S.; Sushyanth, C.; Vanitha, V. Implementation of Novosel Simple Impedance Algorithm for fault location. IJCTA 2016, 9, 7589–7596. [Google Scholar]
- Schweitzer, E.O. A review of impedance-based fault locating experience. In Proceedings of the 14th Annual Iowa–Nebraska System Protection Seminar, Omaha, NE, USA, 12 October 1990; pp. 1–31. [Google Scholar]
- Suslov, K.V.; Solonina, N.N.; Solonina, Z.V.; Akhmetshin, A. Operational determination of the point of a short circuit in power lines. Power Eng. Res. Equip. Technol. 2023, 25, 71–83. [Google Scholar] [CrossRef]
- Bahmanyar, A.; Jamali, S.; Estebsari, A.; Bompard, E. A comparison framework for distribution system outage and fault location methods. Electr. Power Syst. Res. 2017, 145, 19–34. [Google Scholar] [CrossRef]
- Liao, Y. Transmission Line Fault Location Algorithms Without Requiring Line Parameters. Electr. Power Compon. Syst. 2008, 36, 1218–1225. [Google Scholar] [CrossRef]
- Stringfield, T.W.; Marihart, D.J.; Stevens, R.F. Fault location methods for overhead lines. IEEE Trans. Power Appar. Syst. 1957, 76, 518–530. [Google Scholar] [CrossRef]
- Born, E.; Jaeger, J. Device locates point of fault on transmission lines. Electr. World 1967, 168, 133–134. [Google Scholar]
- Senderovich, G.A.; Gryb, O.G.; Karpaliuk, I.T.; Shvets, S.V.; Zaporozhets, A.O.; Samoilenko, I.A. Automation of determining the location of damage of overhead power lines. Stud. Syst. Decis. Control 2021, 359, 35–53. [Google Scholar]
- Senderovich, G.A.; Gryb, O.G.; Karpaliuk, I.T.; Shvets, S.V.; Zaporozhets, A.O.; Samoilenko, I.A. Experimental studies of the method for determining location of damage of overhead power lines in the operation mode. Stud. Syst. Decis. Control 2021, 359, 55–77. [Google Scholar]
- Lyamets, Y.Y.; Antonov, V.I.; Efremov, V.A. Diagnostics of Power Transmission Lines. Electrotechnical Microprocessor Devices and Systems: Interuniversity Collection of Scientific Papers; Publishing House of the Chuvash State University: Cheboksary, Russia, 1992. (In Russian) [Google Scholar]
- Yu, C.S.; Liu, C.W.; Jiang, J.A. A new fault location algorithm for series compensated lines using synchronized phasor measurements. In Proceedings of the 2000 Power Engineering Society Summer Meeting, Seattle, WA, USA, 16–20 July 2000. [Google Scholar] [CrossRef]
- Kezunovic, M.; Meliopoulos, S.; Venkatasubramanian, V.; Vittal, V. Application of Time-Synchronized Measurements in Power System Transmission Networks; Springer: New York, NY, USA, 2014. [Google Scholar]
- STO 56947007–29.240.55.159–2013; Standard Instructions for the Organization of Work to Determine the Places of Damage to Overhead Power Lines with a Voltage of 110 kV and above. Standard of the Organization of PJSC FGC UES: Moscow, Russia, 2013.
- Martynov, M.V. Method of interval determination of the place of damage to the power transmission line. Patent of the Russian Federation No. 2720949, 15 May 2020. (In Russian). [Google Scholar]
- Bykadorov, A.L.; Zarutskaya, T.A.; Muratova-Milekhina, A.S. Application of pattern recognition theory in determining the location of a short circuit in AC traction networks. Bull. RSUPS 2021, 2, 119–128. [Google Scholar] [CrossRef]
- Kulikov, A.L.; Shepovalova, O.V.; Ilyushin, P.V.; Filippov, S.P.; Chirkov, S.V. Control of electric power quality indicators in distribution networks comprising a high share of solar photovoltaic and wind power stations. Energy Rep. 2022, 8, 1501–1514. [Google Scholar] [CrossRef]
- Won, D.J.; Chung, I.Y.; Kim, J.M.; Moon, S.I.; Seo, J.C.; Choe, J.W. A new algorithm to locate power-quality event source with improved realization of distributed monitoring scheme. IEEE Trans. Power Deliv. 2006, 21, 1641–1647. [Google Scholar] [CrossRef]
- Shirman, Y.D. Radio-Electronic Systems: Fundamentals of Construction and Theory, 2nd ed.; Radio Engineering: Moscow, Russia, 2007; 510p. (In Russian) [Google Scholar]
- Armitage, P. Sequential analysis with more than two alternative hypotheses, and its relation to discriminant function analysis. J. R. Stat. Soc. 1950, 12, 137–144. Available online: https://api.semanticscholar.org/CorpusID:126310625 (accessed on 1 September 2023). [CrossRef]
- Ghosh, B.K.; Sen, P.K. Handbook of Sequential Analysis (Statistics: A Series of Textbooks and Monographs), 1st ed.; CRC Press: Boca Raton, FL, USA, 1991; 664p. [Google Scholar]
- Wald, A. Sequential Analysis; John Wiley and Sons: New York, NY, USA, 1947; 232p. [Google Scholar]
- Jouny, I.; Garber, F.D. Mary sequential hypothesis tests for automatic target recognition. IEEE Trans. Aerosp. Electron. Syst. 1992, 28, 473–483. [Google Scholar] [CrossRef]
- Kulikov, A.L.; Ilyushin, P.V.; Suslov, K.V.; Karamov, D.N. Coherence of digital processing of current and voltage signals at decimation for power systems with a large share of renewable power stations. Energy Rep. 2022, 8, 1464–1478. [Google Scholar] [CrossRef]
- Visyashchev, A.N.; Plenkov, E.R.; Tiguntsev, S.G. A method for Determining the Location of a Short Circuit on an Overhead Power Transmission Line with Unsynchronized Measurements from Its Two Ends. Patent of the Russian Federation No. 2508556, 27 February 2014. (In Russian). [Google Scholar]
- Varma, R.K.; Rahman, S.A.; Vanderheide, T.; Dang, M.D.N. Harmonic impact of a 20-MW PV solar farm on a utility distribution network. IEEE Power Energy Technol. Syst. J. 2016, 3, 89–98. [Google Scholar] [CrossRef]
- Torquato, R.; Freitas, W.; Hax, G.R.T.; Donadon, A.R.; Moya, R. High frequency harmonic distortions measured in a Brazilian solar farm. In Proceedings of the 17th International Conference on Harmonics and Quality of Power (ICHQP), Belo Horizonte, Brazil, 16–19 October 2016; pp. 623–627. [Google Scholar]
- IEEE STD 519-2014; Recommended Practices and Requirements for Harmonic Control in Electrical Power Systems/Transmission and Distribution Committee of the IEEE Power and Energy Society. The Institute of Electrical and Electronics Engineers: New York, NY, USA, 2014.
- Adineh, B.; Keypour, R.; Sahoo, S.; Davari, P.; Blaabjerg, F. Robust optimization based harmonic mitigation method in islanded microgrids. Int. J. Electr. Power Energy Syst. 2022, 137, 107631. [Google Scholar] [CrossRef]
- Saha, S.; Saleem, M.I.; Roy, T.K. Impact of high penetration of renewable energy sources on grid frequency behavior. Int. J. Electr. Power Energy Syst. 2022, 145, 108701. [Google Scholar] [CrossRef]
- Ribeiro, P.F.; Duque, C.A.; Silveira, P.M.; Cerqueira, A.S. Power Systems Signal Processing for Smart Grids; John Wiley & Sons Ltd.: Hoboken, NJ, USA, 2014. [Google Scholar]
- Wentzel, E.S. Probability Theory: Textbook for University Students, 10th ed.; Academia: Moscow, Russia, 2005; 571p. (In Russian) [Google Scholar]
- Kulikov, A.; Ilyushin, P.; Suslov, K.; Filippov, S. Organization of Control of the Generalized Power Quality Parameter Using Wald’s Sequential Analysis Procedure. Inventions 2023, 8, 17. [Google Scholar] [CrossRef]
Disclaimer/Publisher’s Note: The statements, opinions and data contained in all publications are solely those of the individual author(s) and contributor(s) and not of MDPI and/or the editor(s). MDPI and/or the editor(s) disclaim responsibility for any injury to people or property resulting from any ideas, methods, instructions or products referred to in the content. |
© 2023 by the authors. Licensee MDPI, Basel, Switzerland. This article is an open access article distributed under the terms and conditions of the Creative Commons Attribution (CC BY) license (https://creativecommons.org/licenses/by/4.0/).