Article

Flexible Synthetic Inertia Optimization in Modern Power Systems

Department of Electrical and Electronic Engineering, Auckland University of Technology (AUT), Auckland 1010, New Zealand
*
Author to whom correspondence should be addressed.
Current address: Department of Electrical Engineering, University of Dar es Salaam, Dar es Salaam P.O. Box 35131, Tanzania.
Inventions 2024, 9(1), 18; https://doi.org/10.3390/inventions9010018
Submission received: 16 December 2023 / Revised: 19 January 2024 / Accepted: 23 January 2024 / Published: 26 January 2024
(This article belongs to the Special Issue Distribution Renewable Energy Integration and Grid Modernization)

Abstract

:
Increasing the replacement of conventional synchronous machines by non-synchronous renewable machines reduces the conventional synchronous generator (SG) inertia in the modern network. Synthetic inertia (SI) control topologies to provide frequency support are becoming a new frequency control tactic in new networks. However, the participation of SI in the market of RES-rich networks to provide instant frequency support when required proposes an increase in the overall marginal operation cost of contemporary networks. Consequently, depreciation of operation costs by optimizing the required SI in the network is inevitable. Therefore, this paper proposes a flexible SI optimization method. The algorithm developed in the proposed method minimizes the operation cost of the network by giving flexible SI at a given SG inertia and different sizes of contingency events. The proposed method uses Box’s evolutionary optimizer with a self-tuning capability of the SI control parameters. The proposed method is validated using the modified New England 39-bus network. The results show that provided SIs support the available SG inertia to reduce the RoCoF values and maintain them within acceptable limits to increase the network’s resilience.

1. Introduction

The electric power system industry is witnessing a structural reformation with the generation of portfolios dominated by renewable energy sources (RESs). Motivated by the global target to reduce carbon emissions, the reformation is shifting towards 100% clean energy and phasing out traditional synchronous generators (SGs) from the conventional network [1,2,3,4,5]. The replaced SGs have significant inertia and damping constants crucial for frequency stability. However, most integrated RESs, such as solar photovoltaic (PV), do not have inertia. On the other hand, inertia from wind turbines (WTs) is decoupled from the rest of the network by the converters connecting them to the grid. Therefore, this reformation technically reduces the conventional inertia in the modern grid. An example of a country embarking on RESs is Great Britain (GB). The total SG in the GB network is anticipated to be at most 30% by 2033/34 due to the penetration of RESs [6].
Nevertheless, this phase out of traditional SGs leads to problems related to reduced rotational inertia in the modern network [7,8]. It should be mentioned that the reduced rotational inertia and damping, which are the essential properties of the replaced traditional SGs, are involved in stability control in traditional networks [9]. System inertia is a crucial property that responds immediately after power contingencies to slow down the rate of change of frequency (RoCoF) in the network. Hence, networks with reduced SG inertia experience significant operational and stability challenges [10].
To address the underlying operational and stability challenges, hence achieving secure network operations, different control strategies of non-synchronous renewable energy sources have been introduced to the modern network [9,11]. The control strategies primarily provide so-called synthetic inertia (SI) to improve the stability of the network in cases of low SG inertia. On one hand, SI involves control topologies to emulate the behavior of synchronous generators in supporting frequency control in conventional low-inertia networks [7]. On the other hand, SI is commonly explained as the controlled input of electrical torque from a unit to give additional power comparable to the RoCoF. This control is implemented to reduce the impact caused by low inertia in the network after a contingency event [12]. In short, SI is an extra power component injected to or absorbed from the network to support frequency stability when the network is subjected to contingencies [13].
Generally, inertia is crucial in overcoming immediate frequency deviation due to power imbalances. It is believed that SI can play a massive role in the stability resilience of the modern power grid [14]. SI can be temporarily obtained from the control of RESs, such as battery storage systems (BESSs), variable speed wind turbines (VSWTs) and supercapacitors [14]. SI can play an essential role during frequency deviation to safeguard frequency stability before primary frequency control comes into play [15].
Several control topologies in the literature are proposed to provide SI for frequency control in the modern network. For instance, in [16], a control topology for SI is included in managing frequency dynamics in networks. Likewise, in [17], a complex control topology of WTs gives SI at different times during contingency events. All SI topologies require a primary energy source behind a converter that connects the energy source to the network [18]. This energy source is from the RES that replaces the kinetic energy from the retired conventional SGs. As SI depends on the capacity of the primary energy sources such as BESSs, supercapacitors and flywheels, it is becoming an important participant in the inertia market framework in modern networks, as proposed in [17,19,20]. As SI is a short-term quantity that functions in line with the available conventional synchronous generator inertia, it needs to be operated depending on the contingency severity and the pre-known values of the available traditional SG inertia in the network [21]. In this research, the contingency severity is assessed by the amount of active power variation. For example, the more active the power variation is, the more severe the contingency will be. Hence, for a severe contingency event and the same value of SG in the network, a high value of SI is needed to maintain frequency response within safe limits. The amount of SI to be procured depends mainly on how much conventional system inertia is available online. The lower the traditional inertia of the system, the higher the SI to be procured [21,22].
Apart from SI becoming a critical quantity for providing frequency stability and raising its value in the modern network, it also plays a major role for ancillary service [18]. For these reasons, SI is an inevitable aspect of current network operation. However, considering the operation cost of the modern network, which is appreciated because of the procurement of SI, there is a need for methods to give optimal values of SI for frequency control at different conditions. The provision of SI to control frequency during contingency events in low inertia networks needs to be at values that can achieve as low operating costs as possible [23,24].
However, there is a challenge in providing an optimum value of SI, especially during contingency events in modern networks. The current research works such as [16,25,26] suggest various approaches to solve the low inertia issue in modern networks. Yet, most methods focus only on the provision of SI but not on optimized values. For instance, in a study [15], the approach focuses on optimized power point tracking (OPPT) for VSWTs to provide virtual inertia (VI) for frequency control. Nevertheless, it does not offer optimal SI at the minimal operating cost of the network. The research in [27] assesses the potential tuning of WT parameters to provide SI for the timely and effective rescue of frequency in various network circumstances. The research neither considers the dynamics of the WTs in the network nor focuses on providing optimal SI for effective cost saving in the network’s operation.
Furthermore, the study in [24] describes the need to dynamically optimize the values of SI for frequency control in low inertia networks. The research in [28] develops an optimization method based on conventional economic dispatch. In the method, distributed energy resources (DERs) participate in inertial and primary frequency response by sharing power injections relative to their power ratings. Furthermore, the methods proposed in Refs. [7,29,30] employ the H 2 performance metric to address the optimal inertia placement problem concerning network coherency. Specifically, research works in Refs. [7,29] focus on enhancing frequency response for networks with high penetration of RESs by finding the optimal inertia placements that reduce the performance metric H 2 . Not only do these methods face a limitation of not giving the optimal values of SI but also their models are inadequate to illustrate the dynamics of the real low-inertia network. As a result, the applicability of the system performance metric H 2 raises a concern.
Considering the limitations from other research works, a novel model to dynamically optimize values of SI according to the size of contingency and a minimum value of SG inertia in a network is proposed. The proposed optimization algorithm provides a new degree of SI freedom at minimum SG inertia values in networks. Depending on the value of minimum SG inertia in the network and the contingency severity, the algorithm proposed can flexibly adjust the amount of optimal value of SI required by the system to keep the frequency stable. This approach assumes enough energy storage from the controlled RES to provide this optimal value until the network frequency reaches a safe value.
The novelties of the proposed method are summarized as follows:
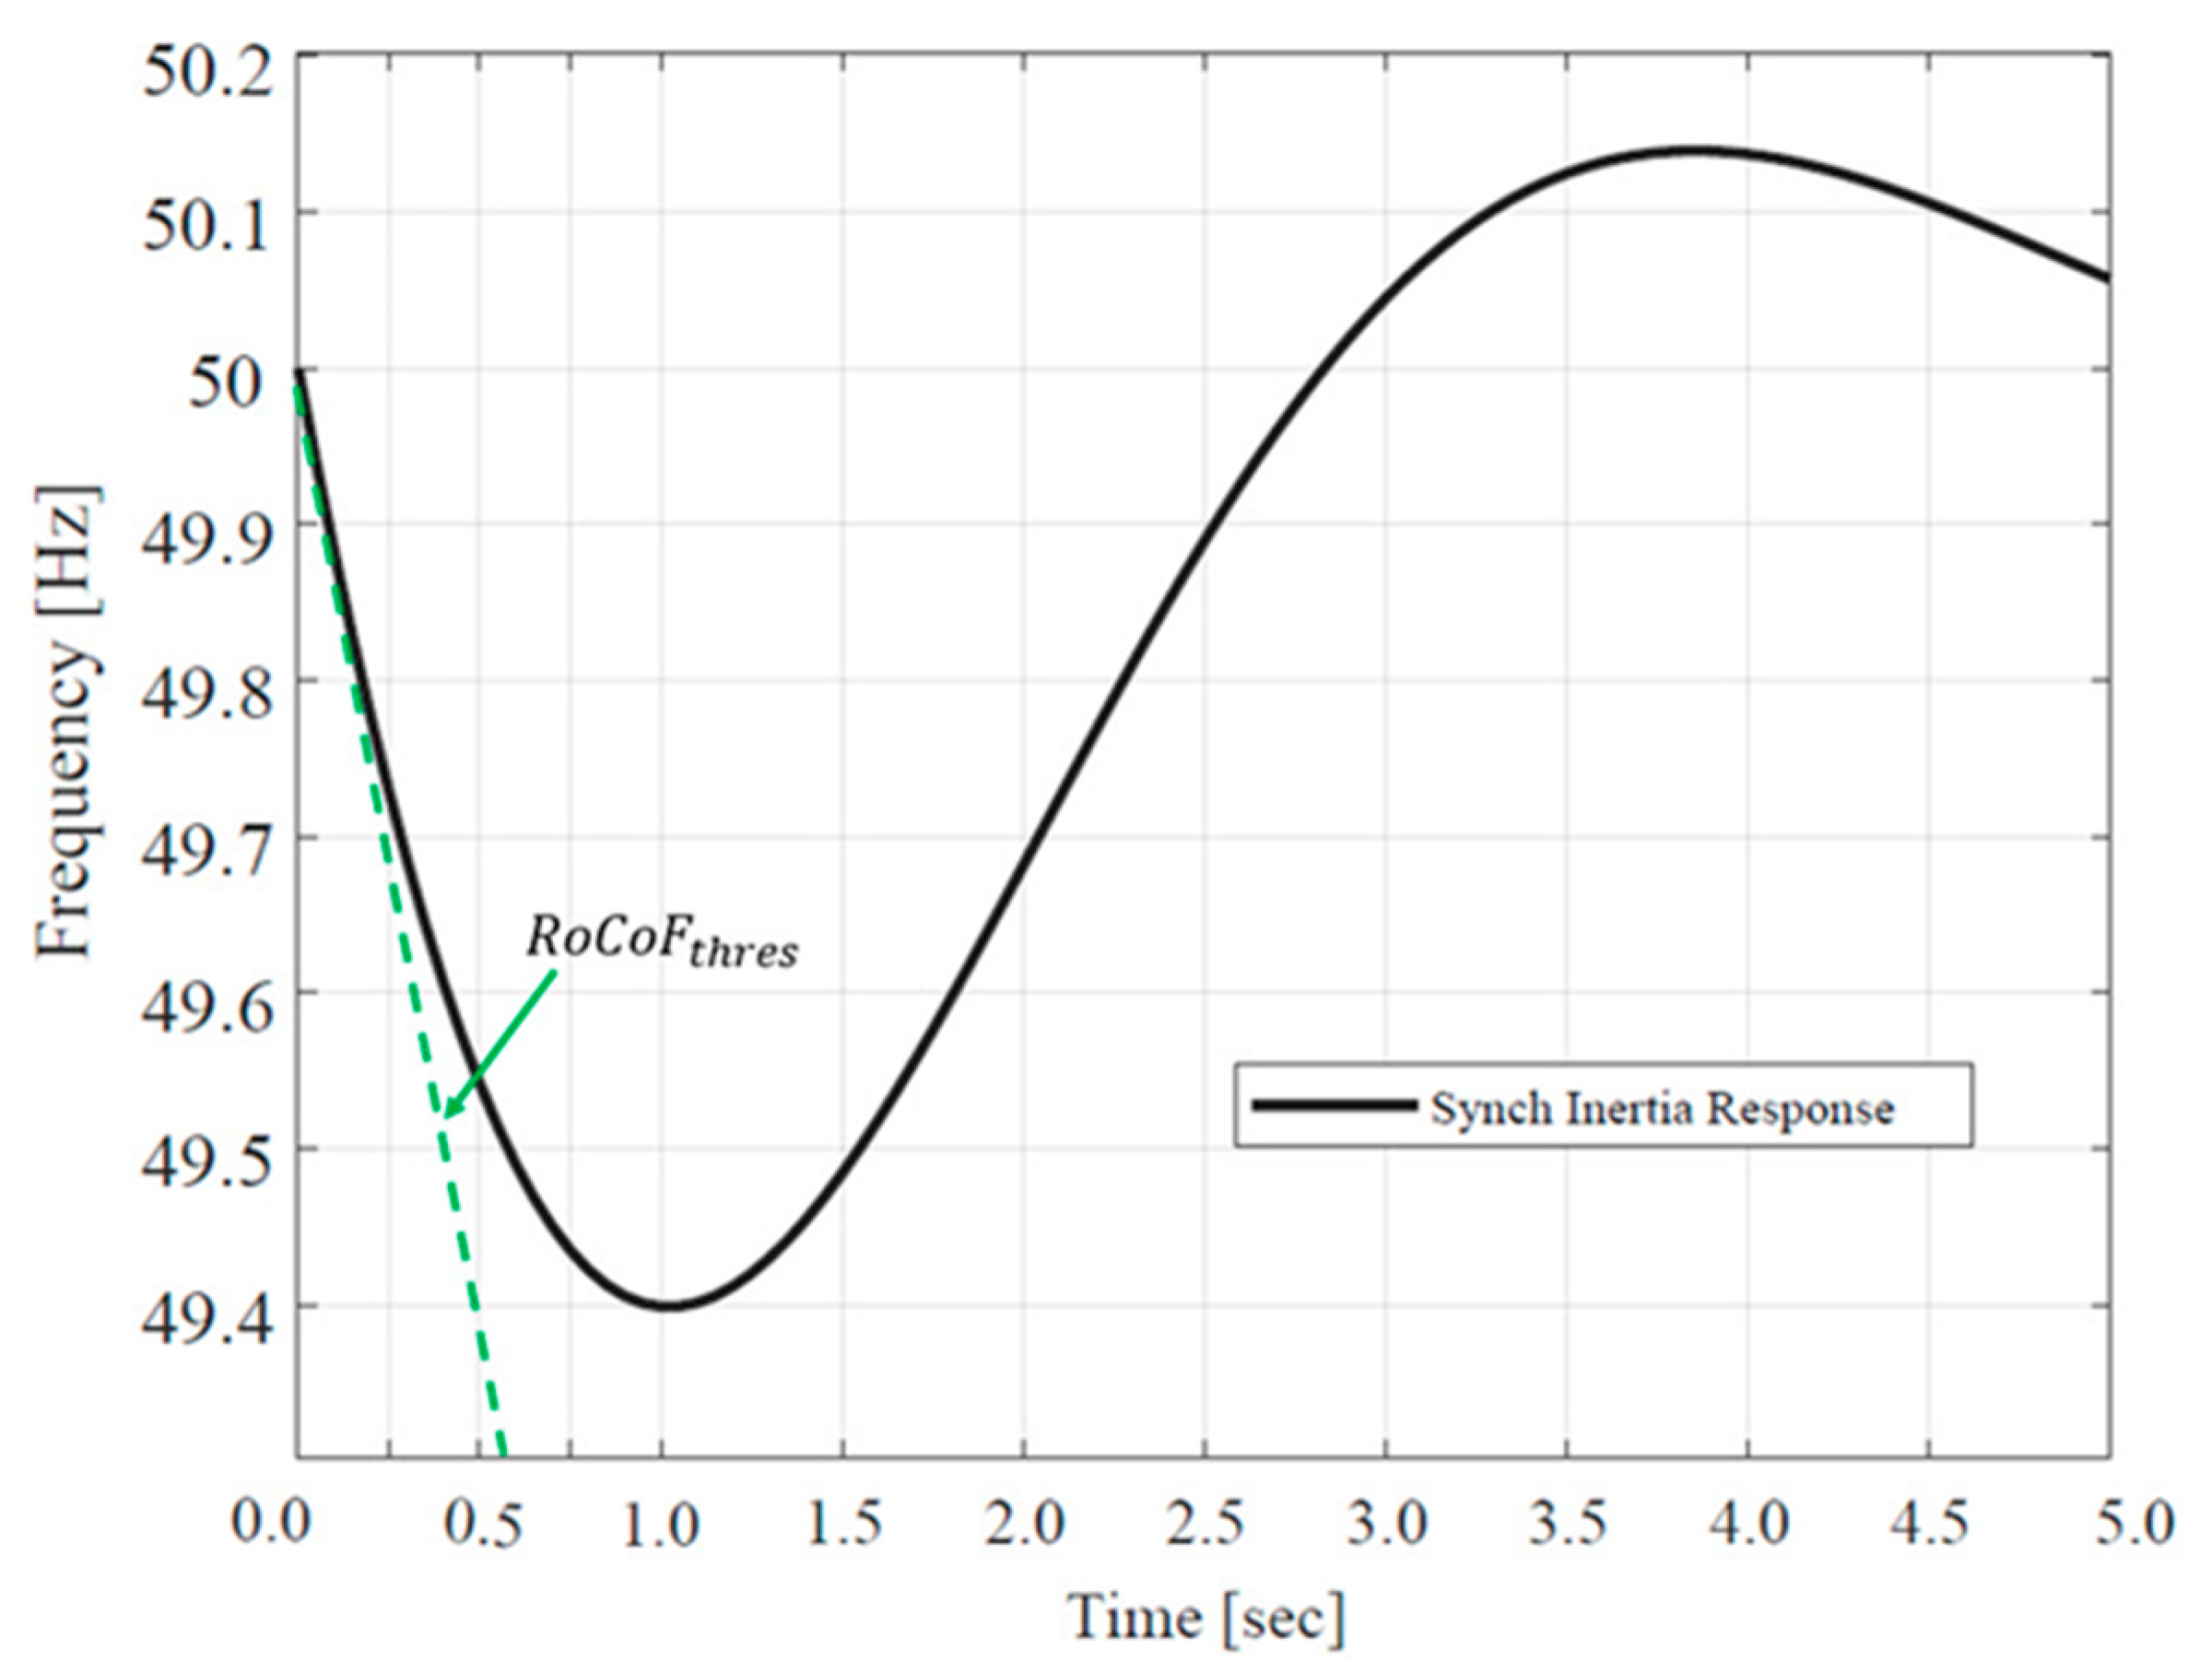
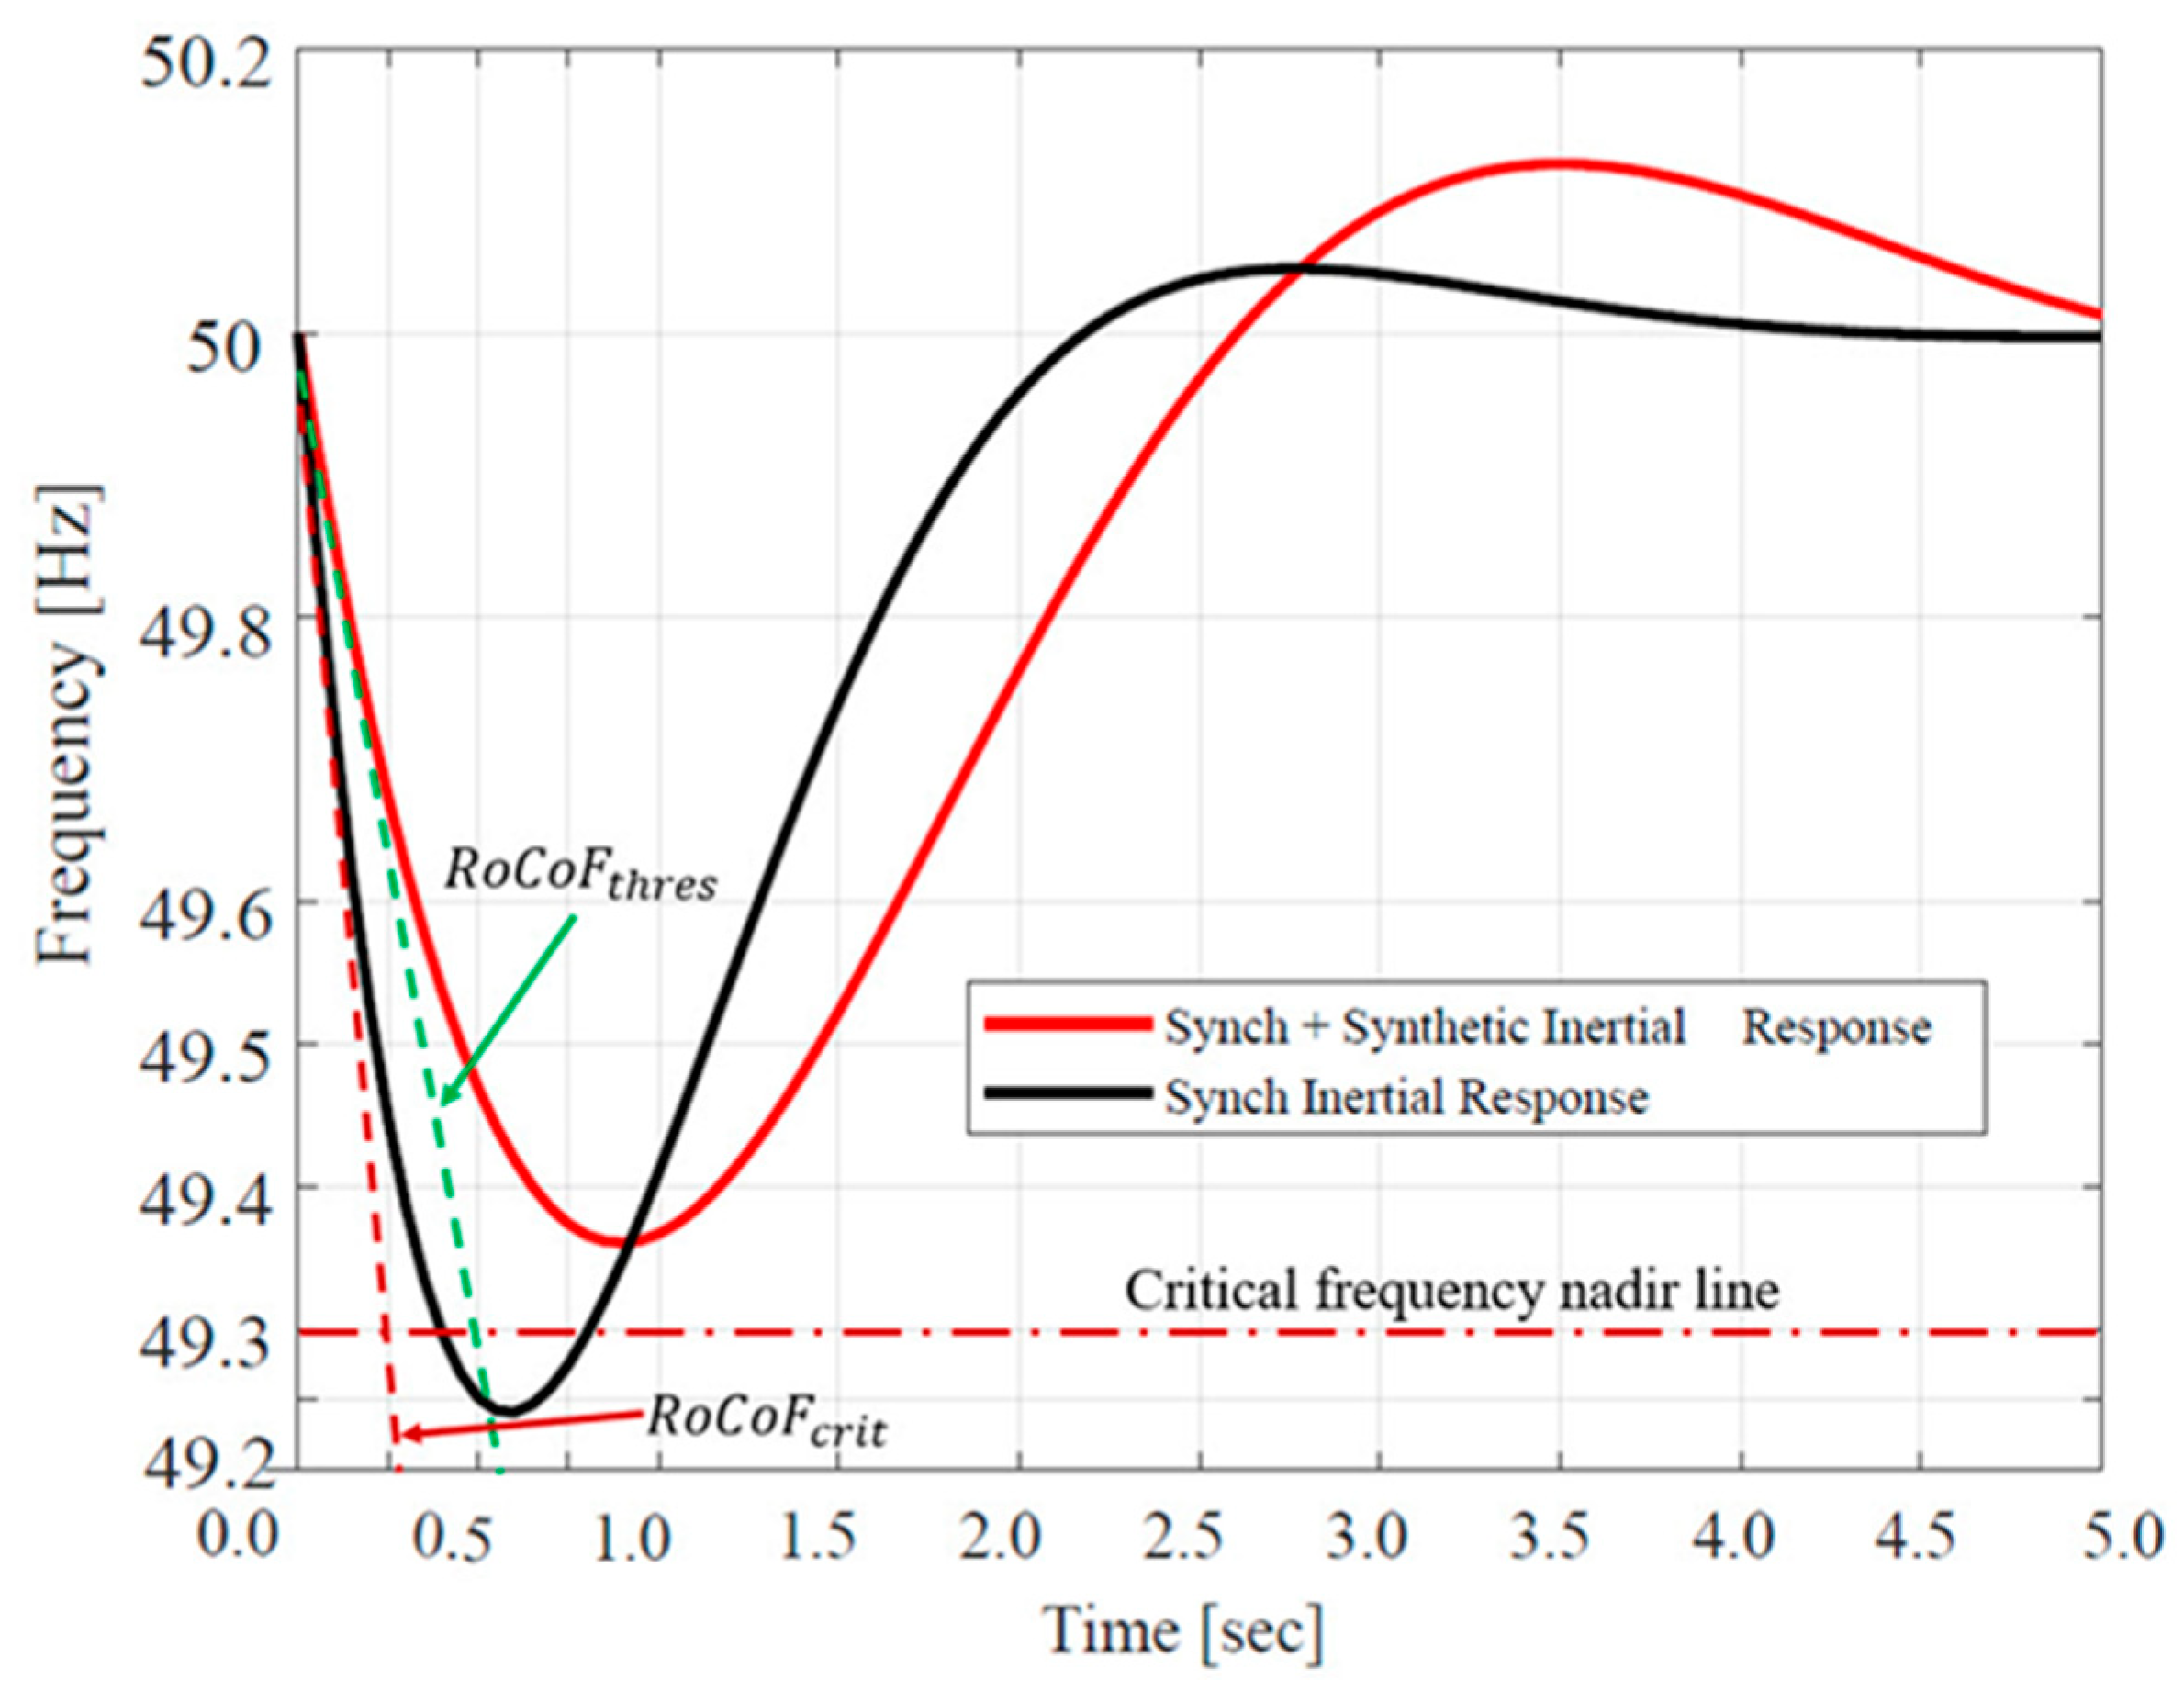
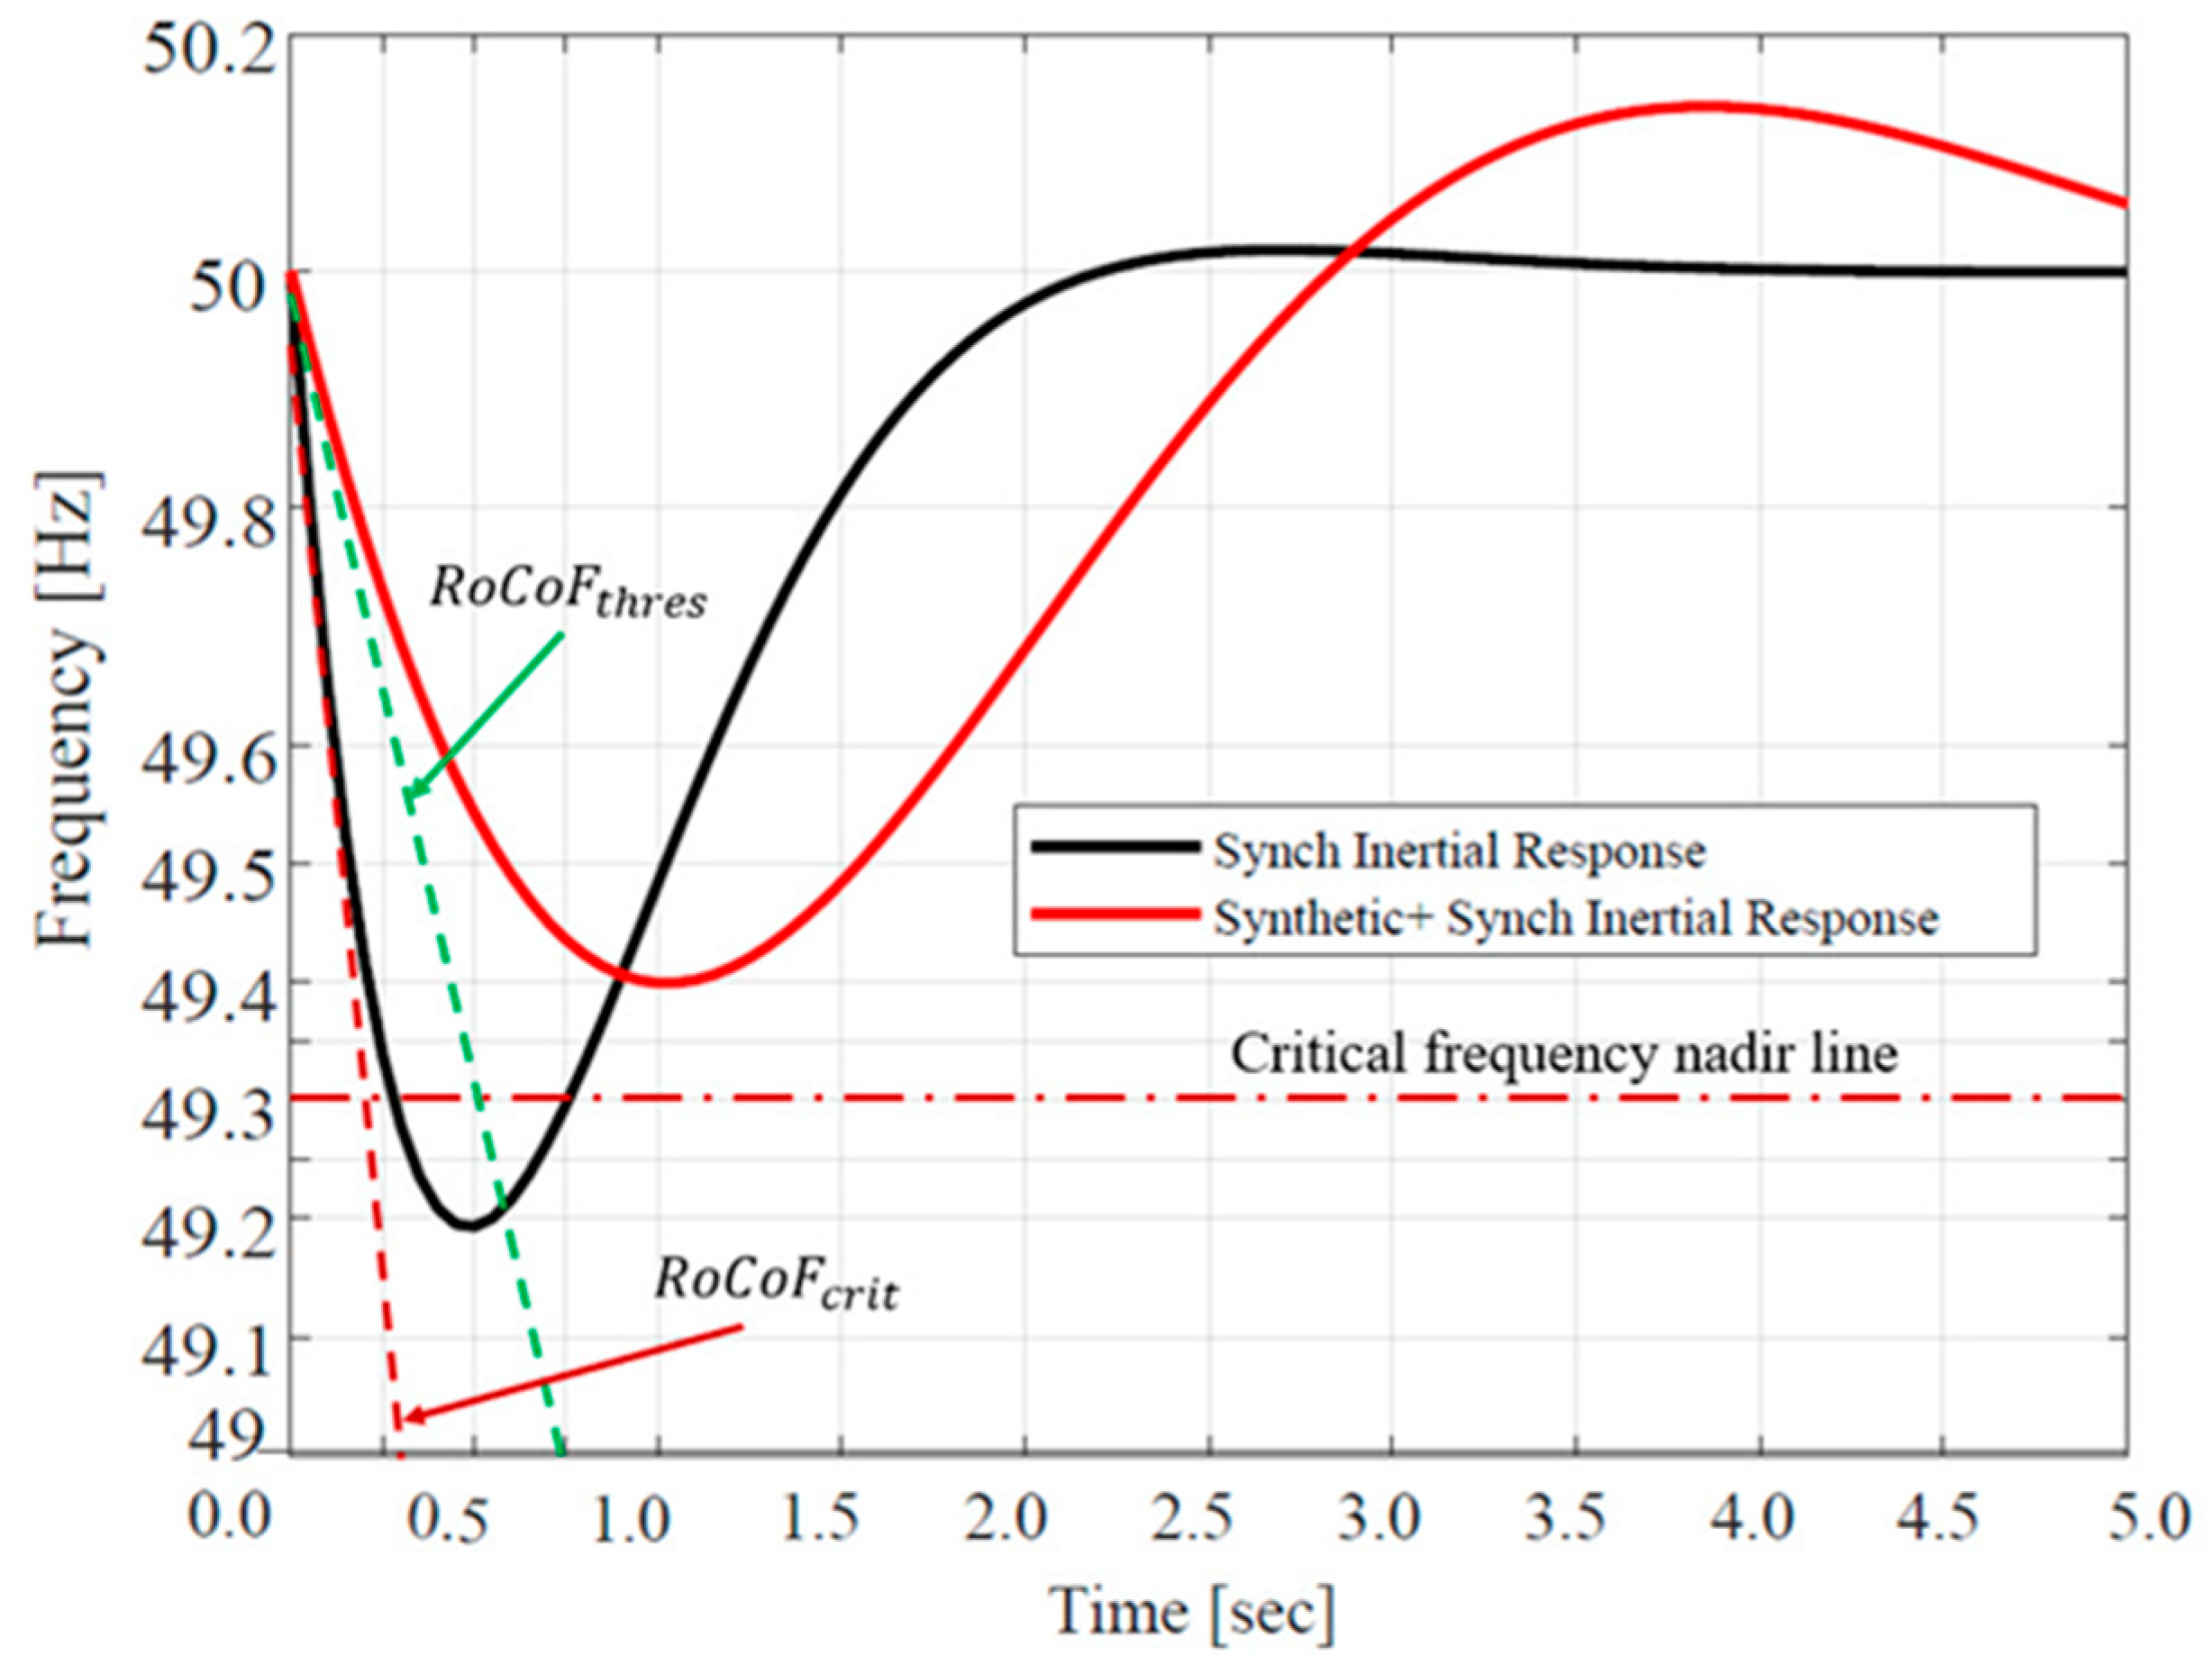
  • RoCoFs and frequency nadir are improved due to optimal SI activation following a contingency event in the network.
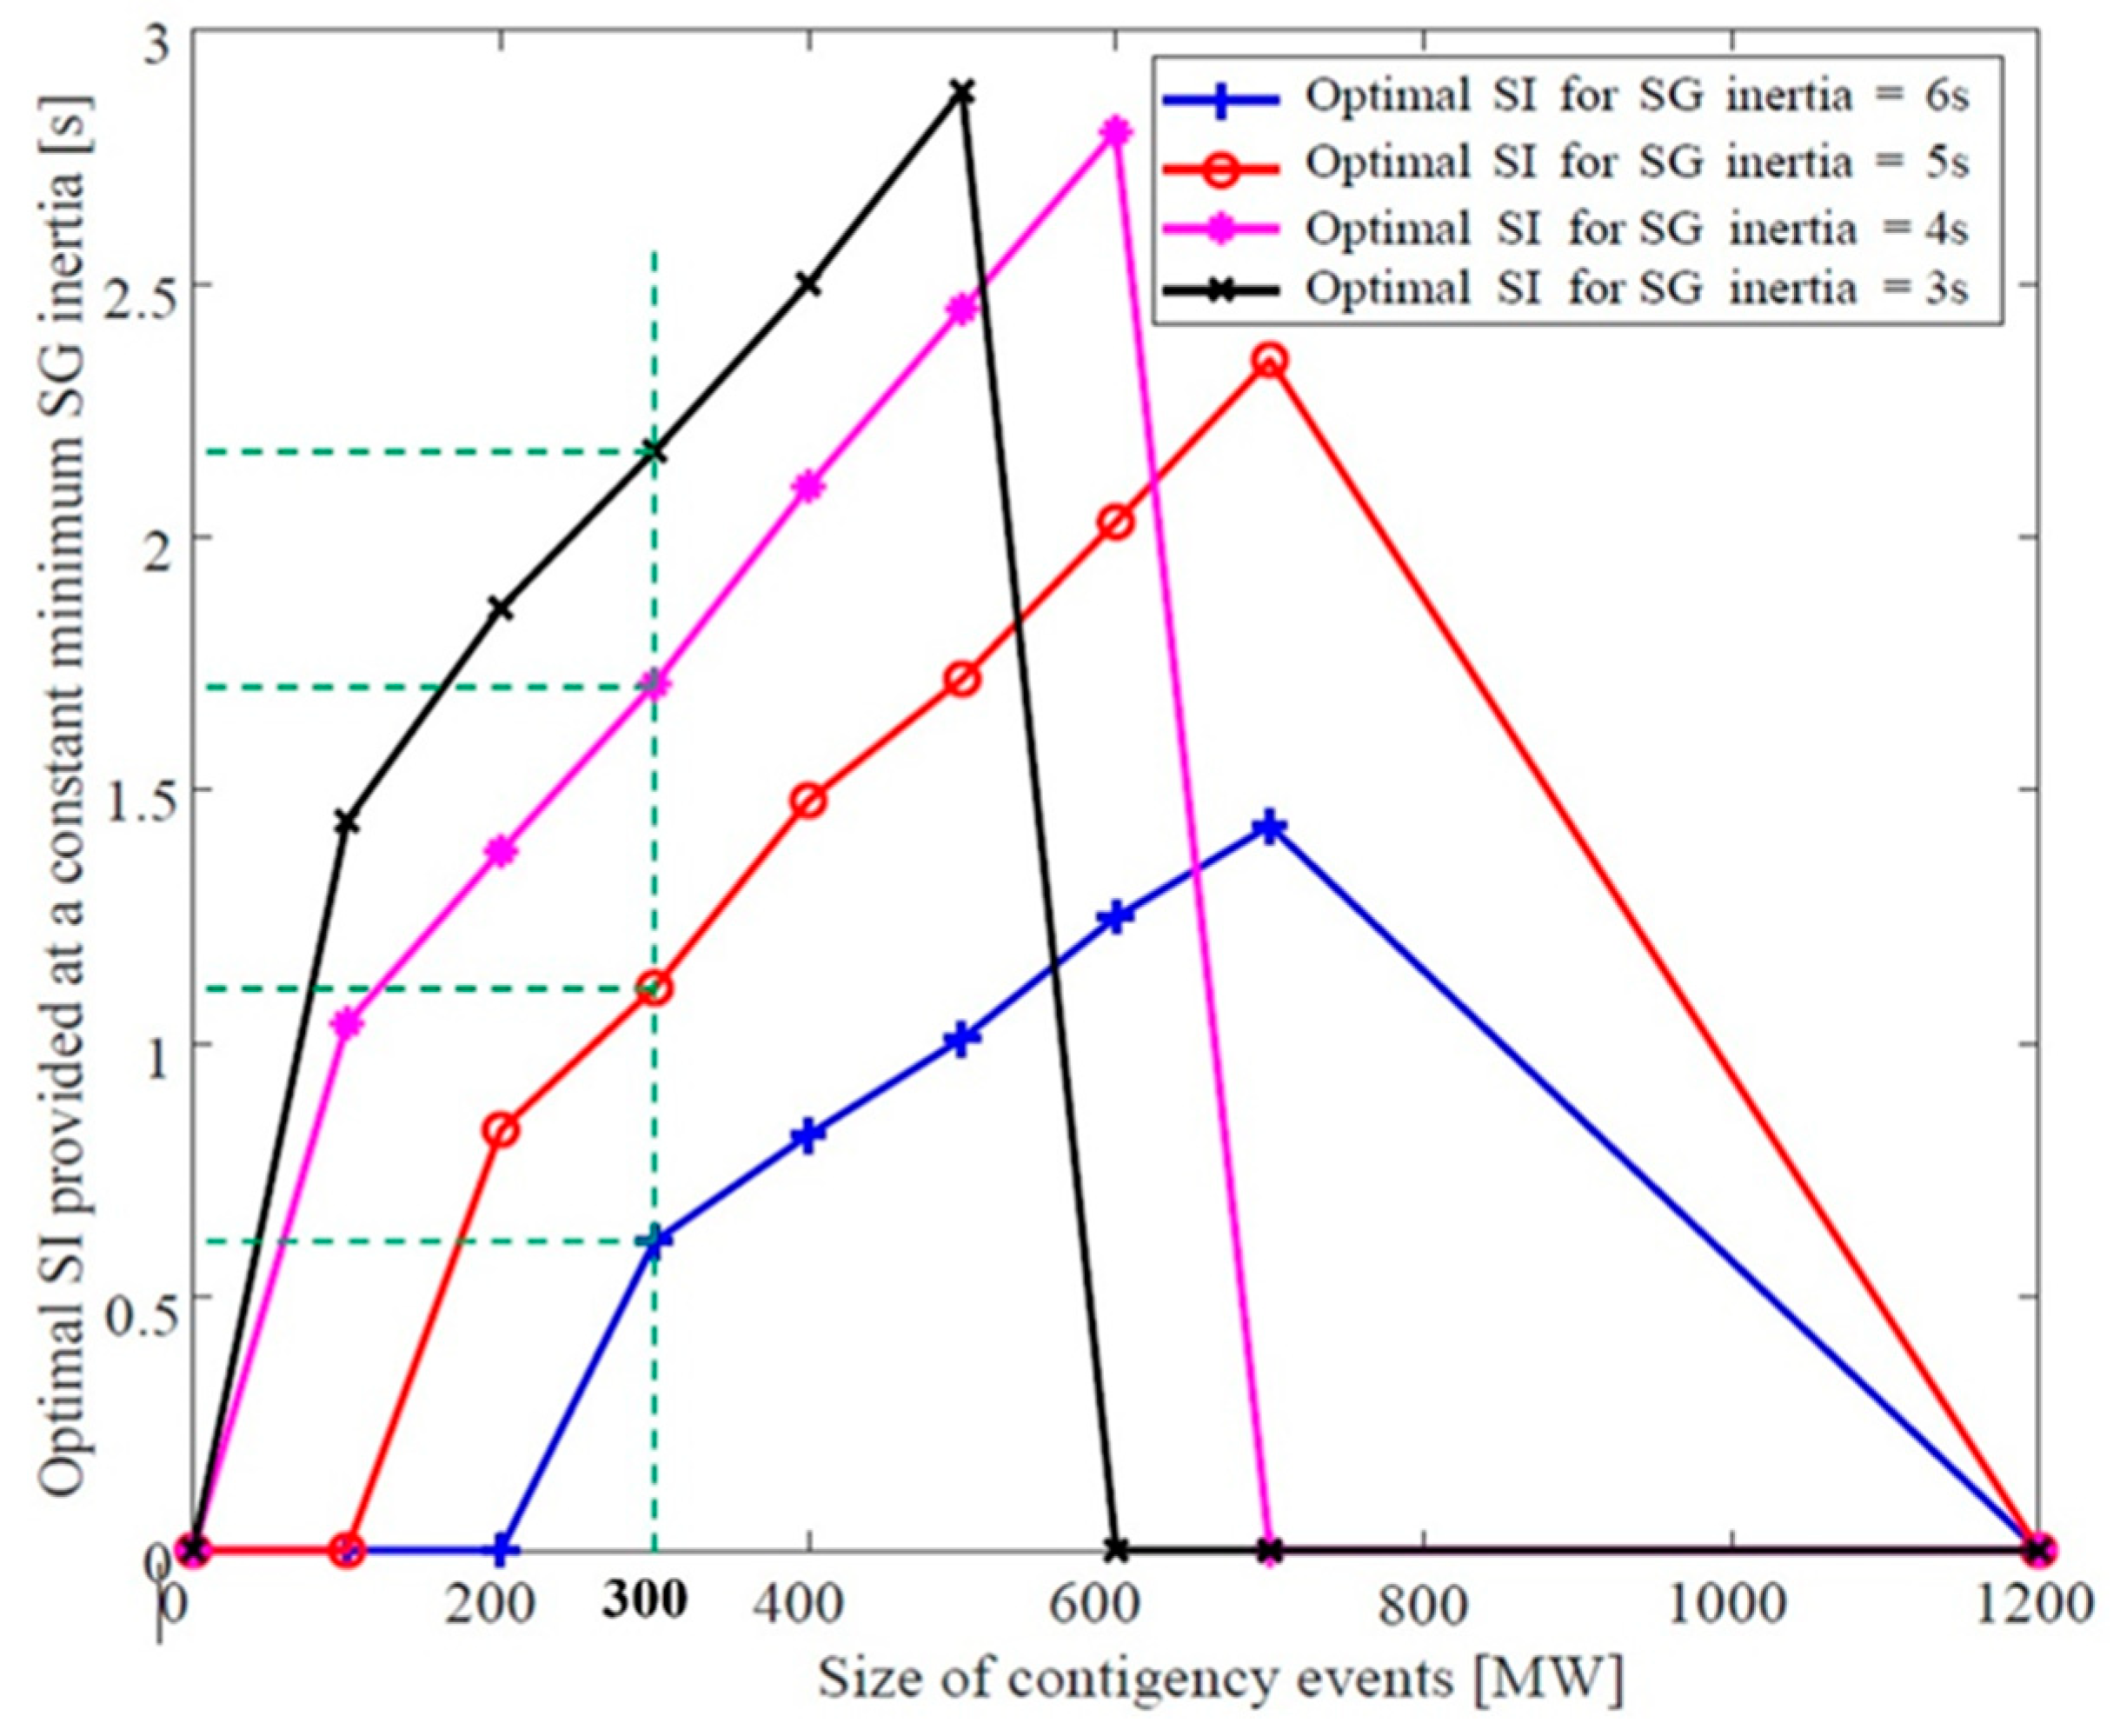
  • The best values of SI are provided at the given minimum value of SG inertia at the optimal cost.
  • SI flexibility is assured depending on the values of minimum SG inertia and the contingency severity.
The rest of this paper is organized as follows: In Section 2, the formulation of the problem for SI provision in the modern network and the proposed SI optimization method is described. The network description and simulation results to confirm the effectiveness of the proposed approach are presented in Section 3. Additionally, discussions of the results are given alongside each result. Ultimately, the conclusion is given in Section 4.

2. Materials and Methods

2.1. Problem Formulation for Optimal Synthetic Inertia Provision in Power Systems

Synthetic inertia can be implemented in different ways in modern power systems, as explained in [9,31,32]. To achieve the objective of this research, this paper uses the control of solar PV and BESSs in the provision of SI. Even though a BESS is a non-rotational generation unit, it can quickly regulate its power outputs to make it suitable for SI provision in the power system [33]. The conceptual diagram showing how a non-dispatchable generating unit can be configured to provide SI in a network with SG inertia is presented in Figure 1. The SG and the transformer are shown in red, RES and converter in green while the loads in black. Thus, considering a BESS to represent the rest of non-dispatchable units, a schematic diagram on how the topological arrangement provides SI in a modern power system is presented in Figure 2. The battery, inverter and the grid are represented in red while the measurement and control signal are in blue arrows.
Various research works such as [12,34,35] explain that after detecting a contingency event in the network, the available synchronous generator inertia responds instantly. Then, the controlled SI takes over after a specific time, subject to the control topology, as shown in Figure 3. Depending on the topology that provides SI in the network, the problem in this research is formulated in three stages:
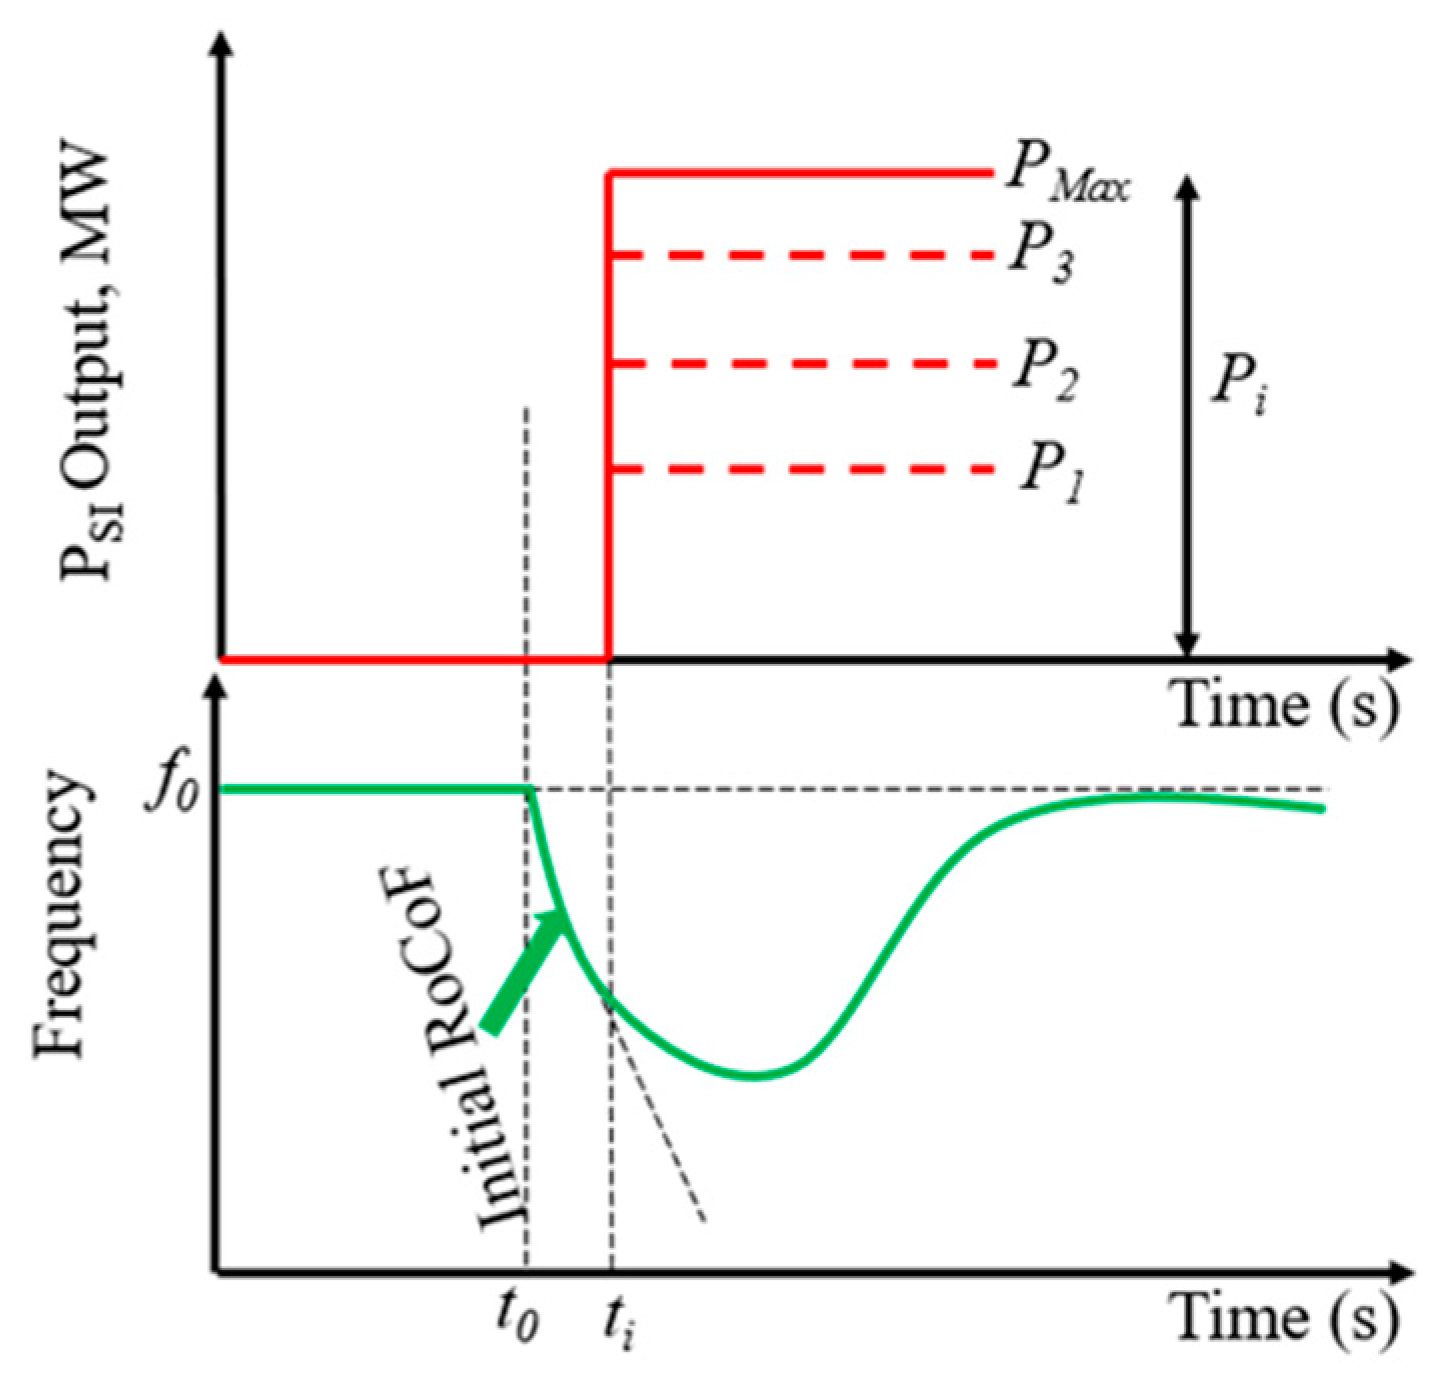
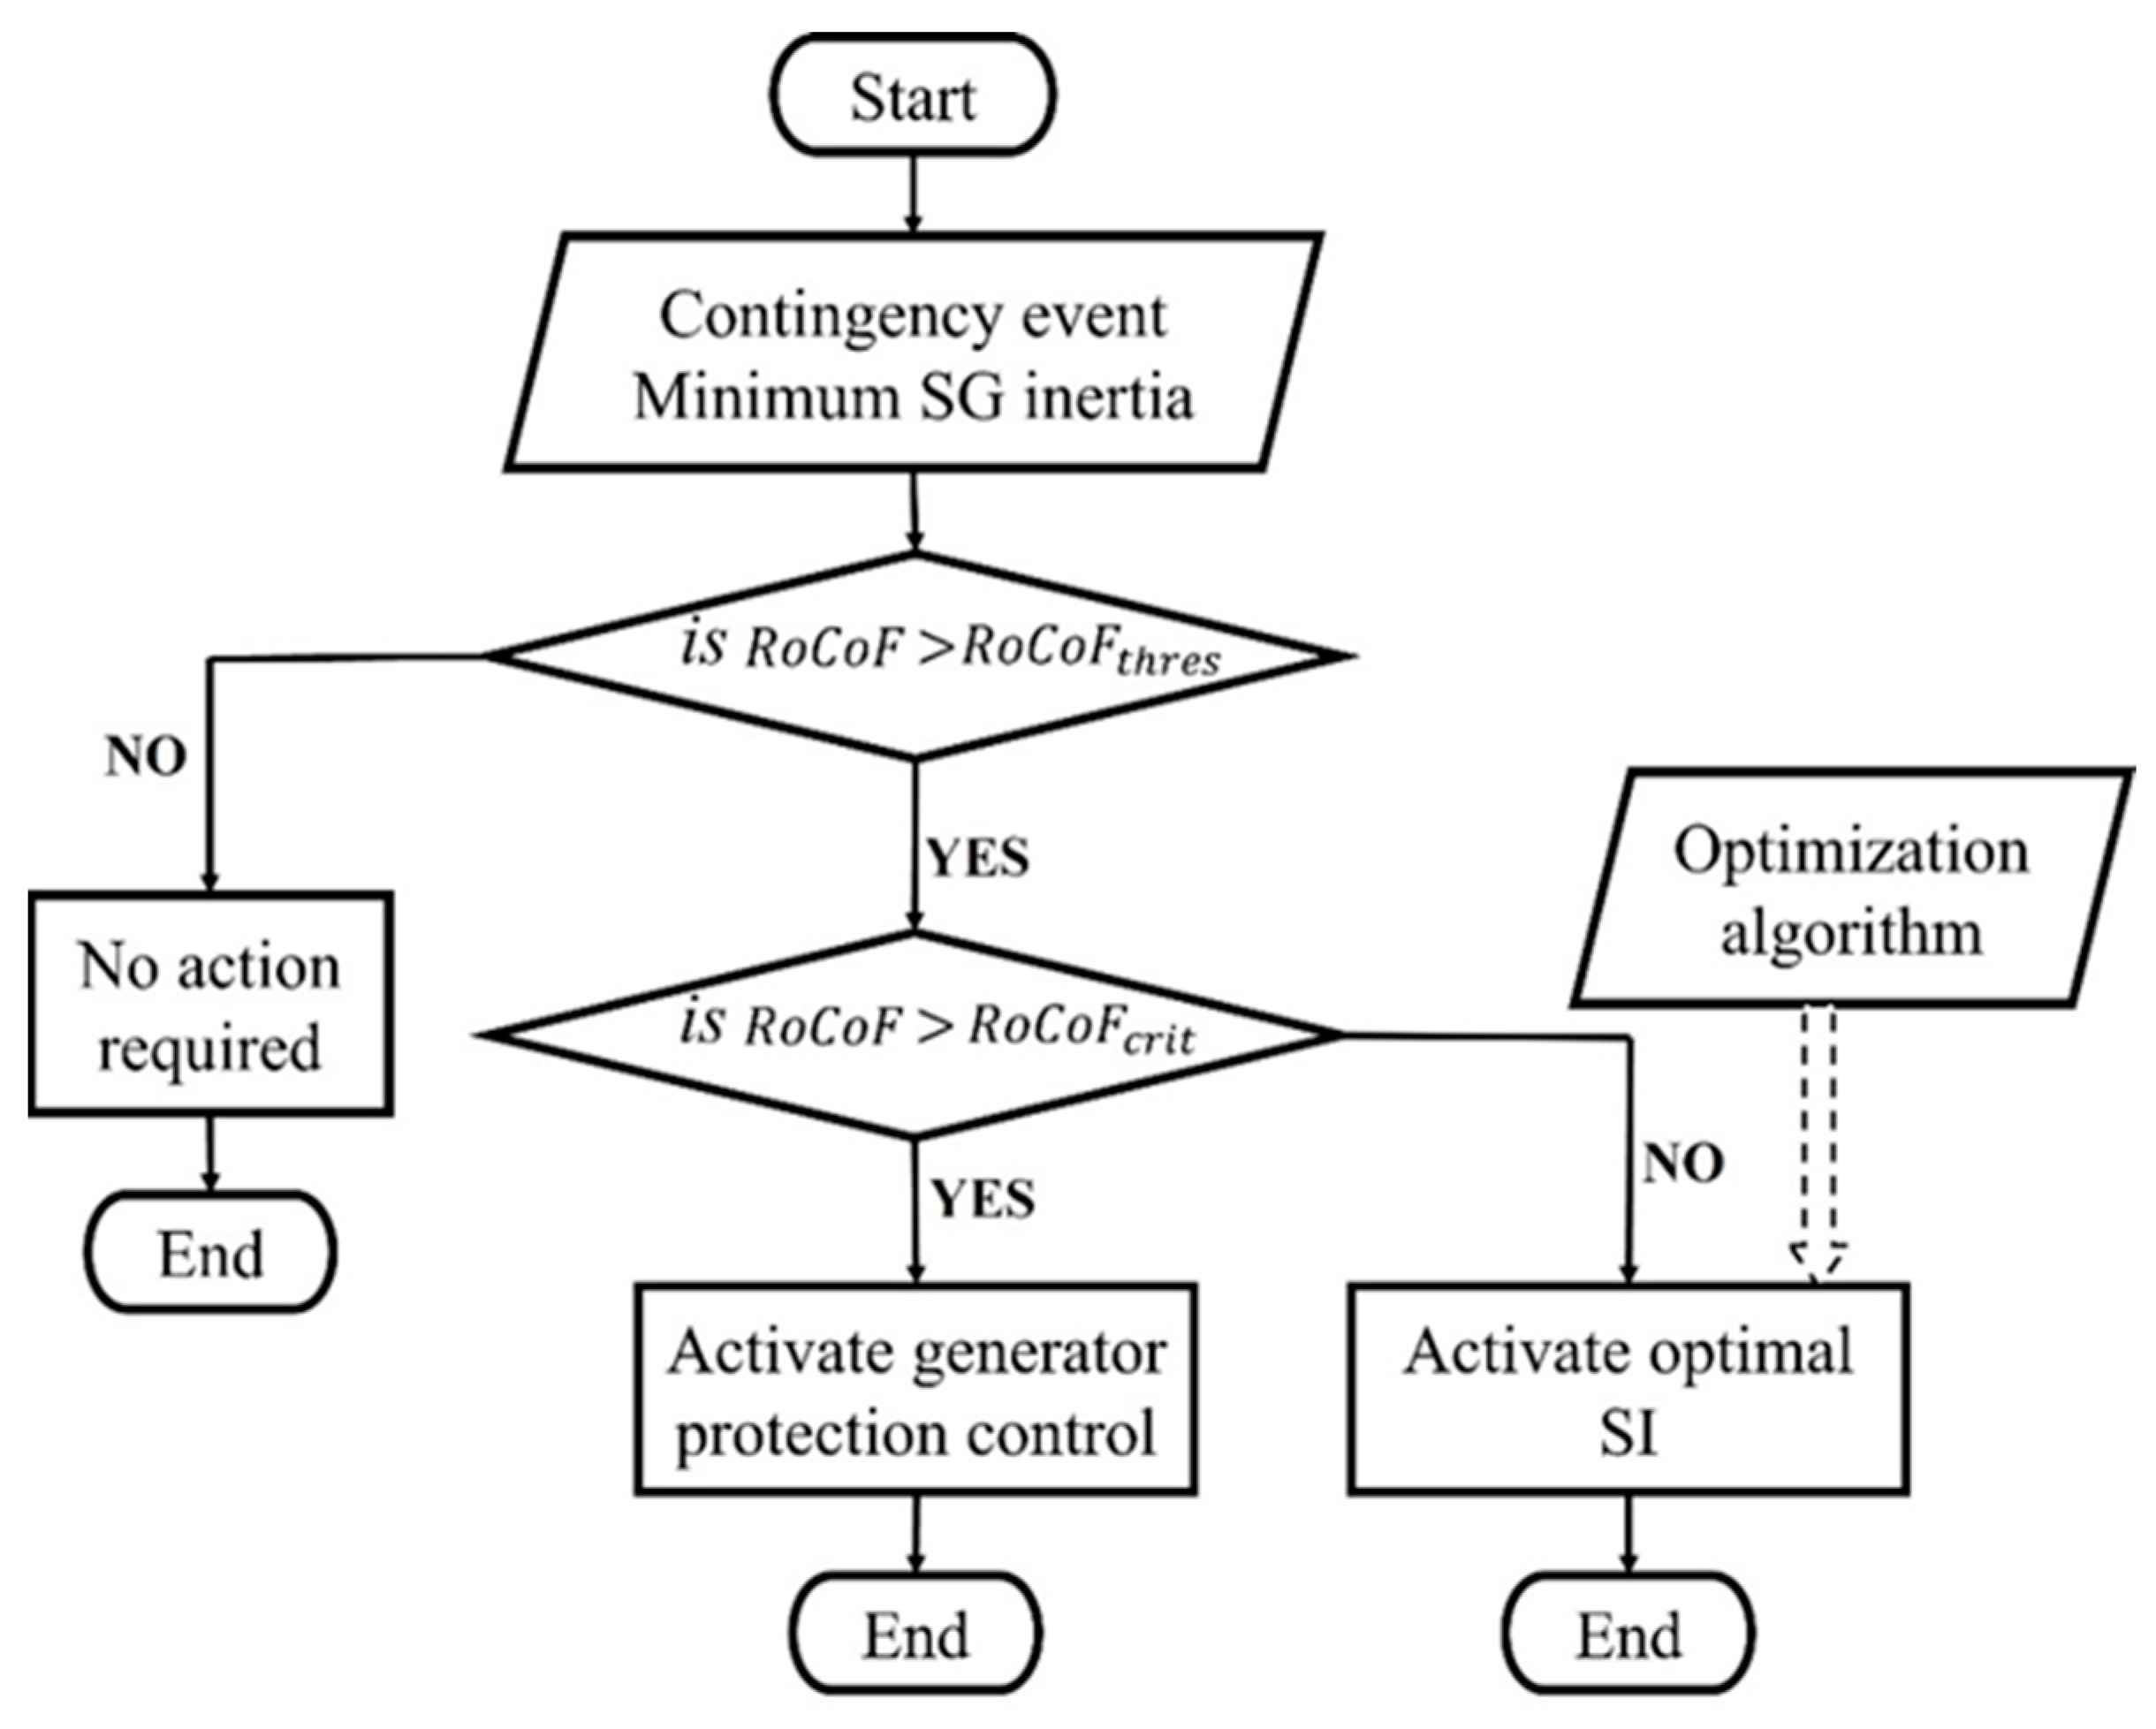
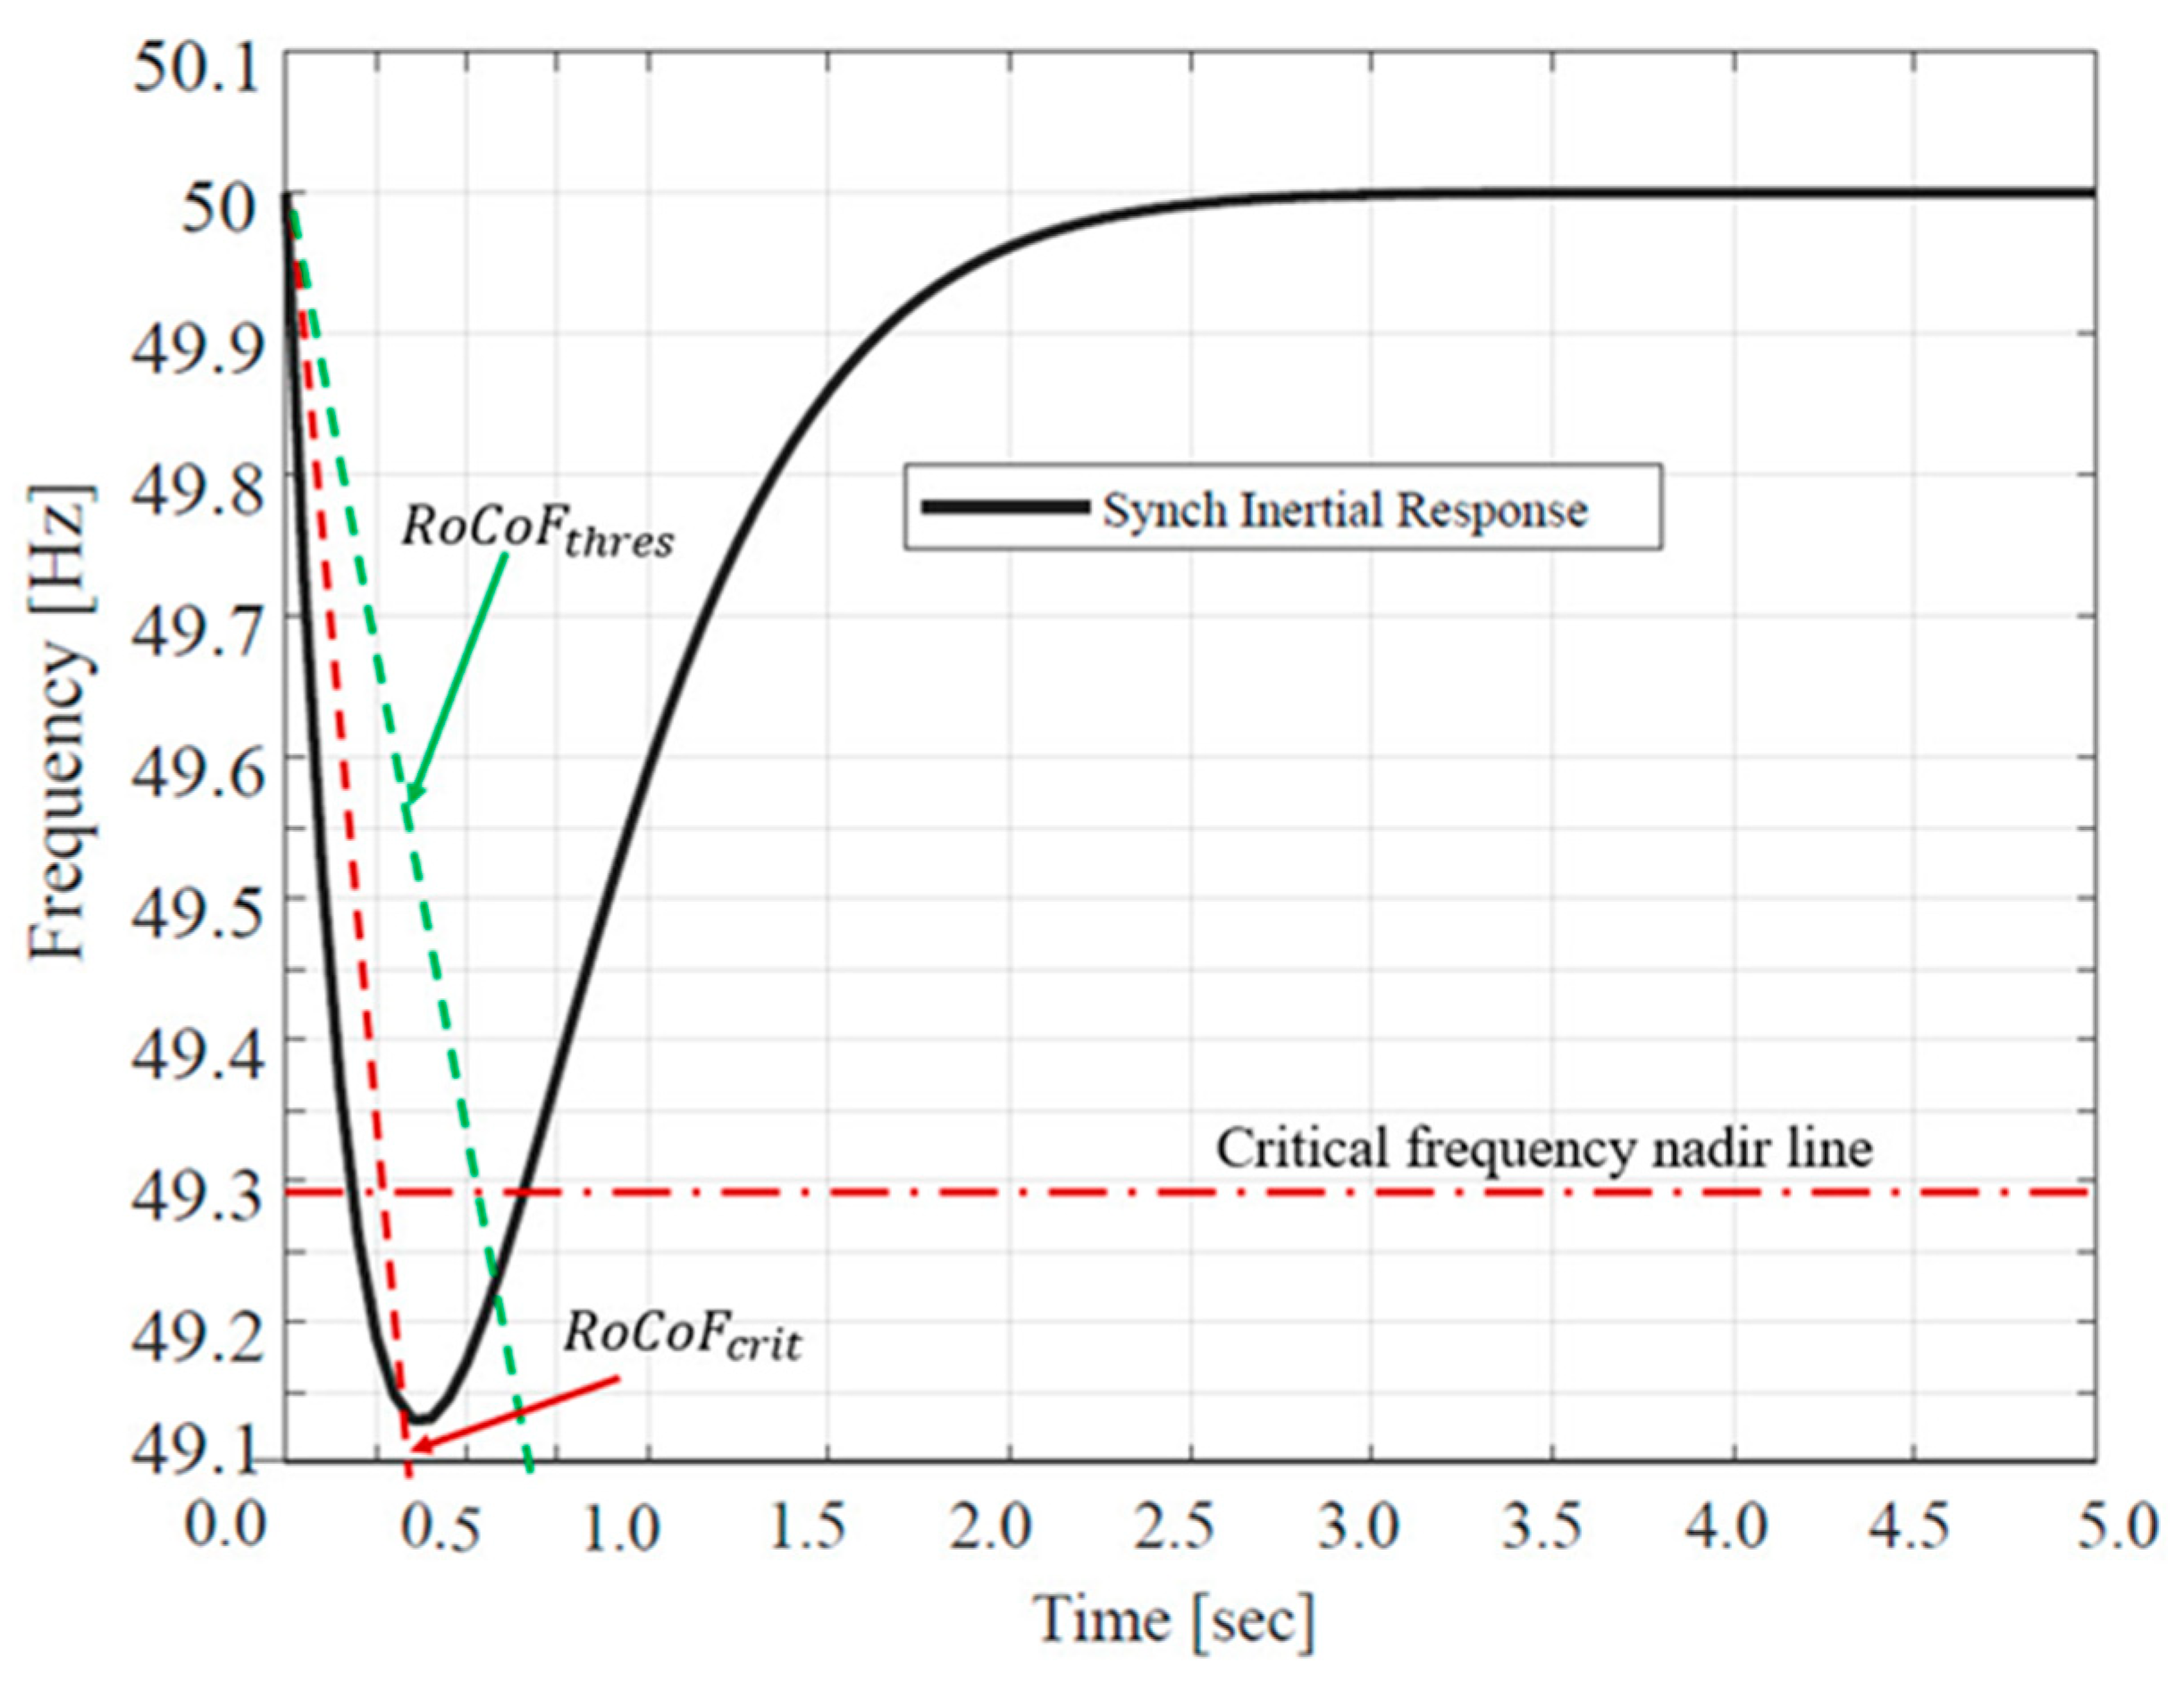
  • After a contingency event is detected in the network, the initial RoCoF is obtained.
  • The algorithm reads the resulting RoCoF and compares it with the set threshold and critical values of RoCoF.
  • Based on the recorded value of the initial RoCoF and the minimum value of SG inertia, the amount of SI needed to maintain the RoCoF in case the initial RoCoF is beyond the threshold value is evaluated.
Therefore, this research work determines how much SI is needed to be activated for different sizes of contingency events in the network. Depending on a contingency event, a suitable amount of SI in terms of the output power P i is activated, as described by the dashed lines in Figure 3. In this figure, the contingency event occurs at the time t 0 and injection of SI is performed at the time t i to deliver extra power P i based on the size of the event and the initial RoCoF detected. For a small contingency event, P 1 can be activated while P M a x is for the maximum contingency event. P M a x depends on the capacity of the energy source of SI. P 2 and P 3 stand for any other values of SI to be activated depending on the level of contingency event and initial RoCoF detected. The delay between t 0 and t i is due to the time taken for the communication from activation of the fault, performing the control algorithm and provision of the SI activation signal. After the activation of SI, the initial RoCoF and frequency deviation are reduced to save the network from frequency instabilities. The activation process comes in only if the available minimum value of SG inertia cannot keep the frequency within safe values. Therefore, in this research, it is critical to pre-quantify the minimum value of SG inertia in the network to plan for sufficient resources that can provide adequate SI to retain the frequency within acceptable limits.
An optimization problem is formulated to answer how much SI is needed to support frequency in synchronous low-inertia networks and, hence, attain the performance targets. The problem is developed based on the least level of SG inertia present in the network, the initial value of RoCoF, set threshold and critical values of RoCoF and, finally, the operating cost of the network. Based on the minimum SG inertia, the developed algorithm should decide the minimum possible value of SI to be provided to support frequency stability at different levels of contingency events. This problem is formulated using the network model given in Figure 4. In this figure, the present SG inertia is presented by the block named minimum synchronous. Synthetic inertia is provided by the derivative control of the network frequency deviation from the nominal value, while the damping is provided by the droop control. The combination of SI and damping give the so-called synthetic inertial power P S I , which is given by the converter-based units in the network. The fault generator represents the contingency events in the network. Based on the figure, various design variables are considered in the formulation of the problem. The design parameters considered in the problem formulation include the minimum level of SG inertia, damping constant and the contingency event.
The solution of the formulated optimization problem can be obtained by considering various constraints. In approaching this problem, the RoCoF of the network is the main deciding parameter. Suppose the RoCoF is below the set threshold value. In that case, the resulting frequency following a contingency event is within the range, and the minimum SG inertia can maintain the frequency without any need for additional SI. However, when the RoCoF is beyond the threshold, and below the critical value set, the minimum SG inertia is insufficient to maintain the frequency within allowable ranges. Therefore, an additional optimal value of SI must supplement the SG inertia to manage the frequency response in safe limits. On the other hand, when the RoCoF is beyond the critical value, this condition is beyond the combined inertia response. Therefore, the generator protection schemes must be activated for further protection.
To achieve the goal of optimal SI provision in the network, the parameters required to be tuned to supplement SG inertia in maintaining frequency are the proportional and derivative gains K p V I and K d V I of the SI controller. Tuning of these parameters mainly depends on the SG inertia, contingency event level and the initial RoCoF in the network. The objective function of the optimization problem is formulated based on contingency events considering limitations of the SG inertia in the network. The goal is to tune the SI control gains parameters to obtain the optimal value of SI required to maintain the frequency within allowable ranges.

2.2. The Proposed Flexible Inertia Optimization Method

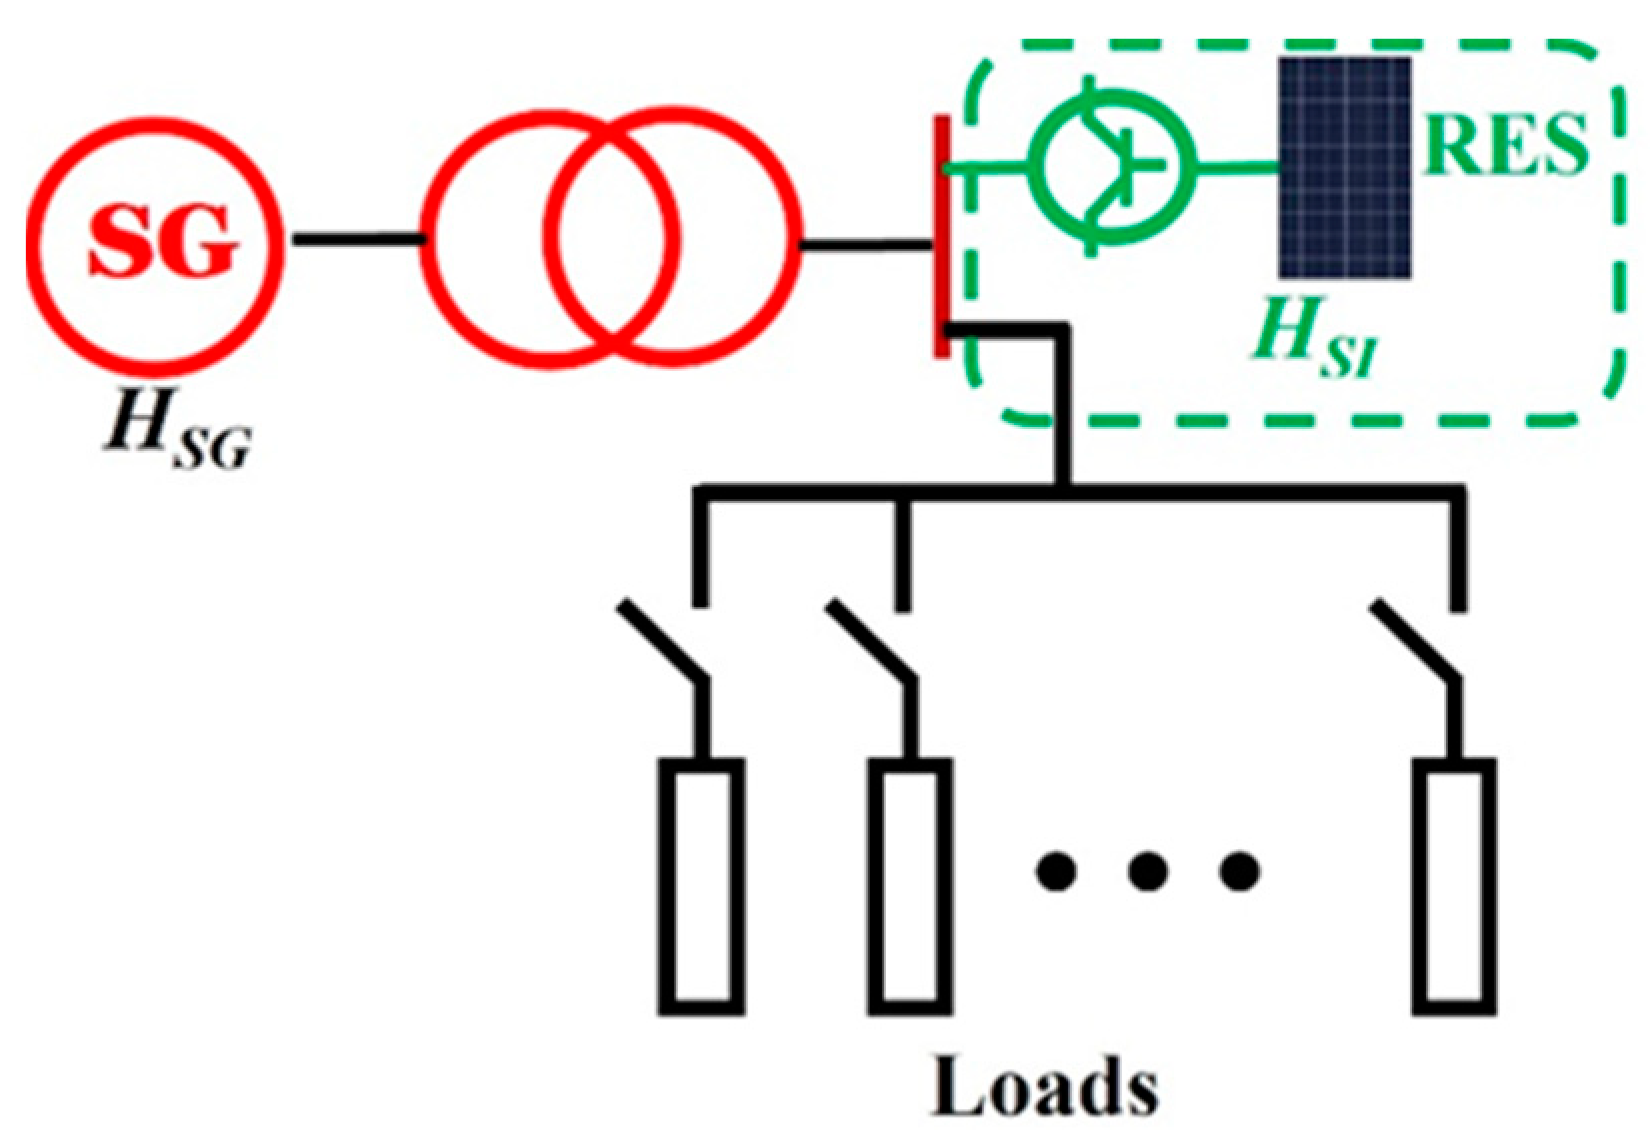
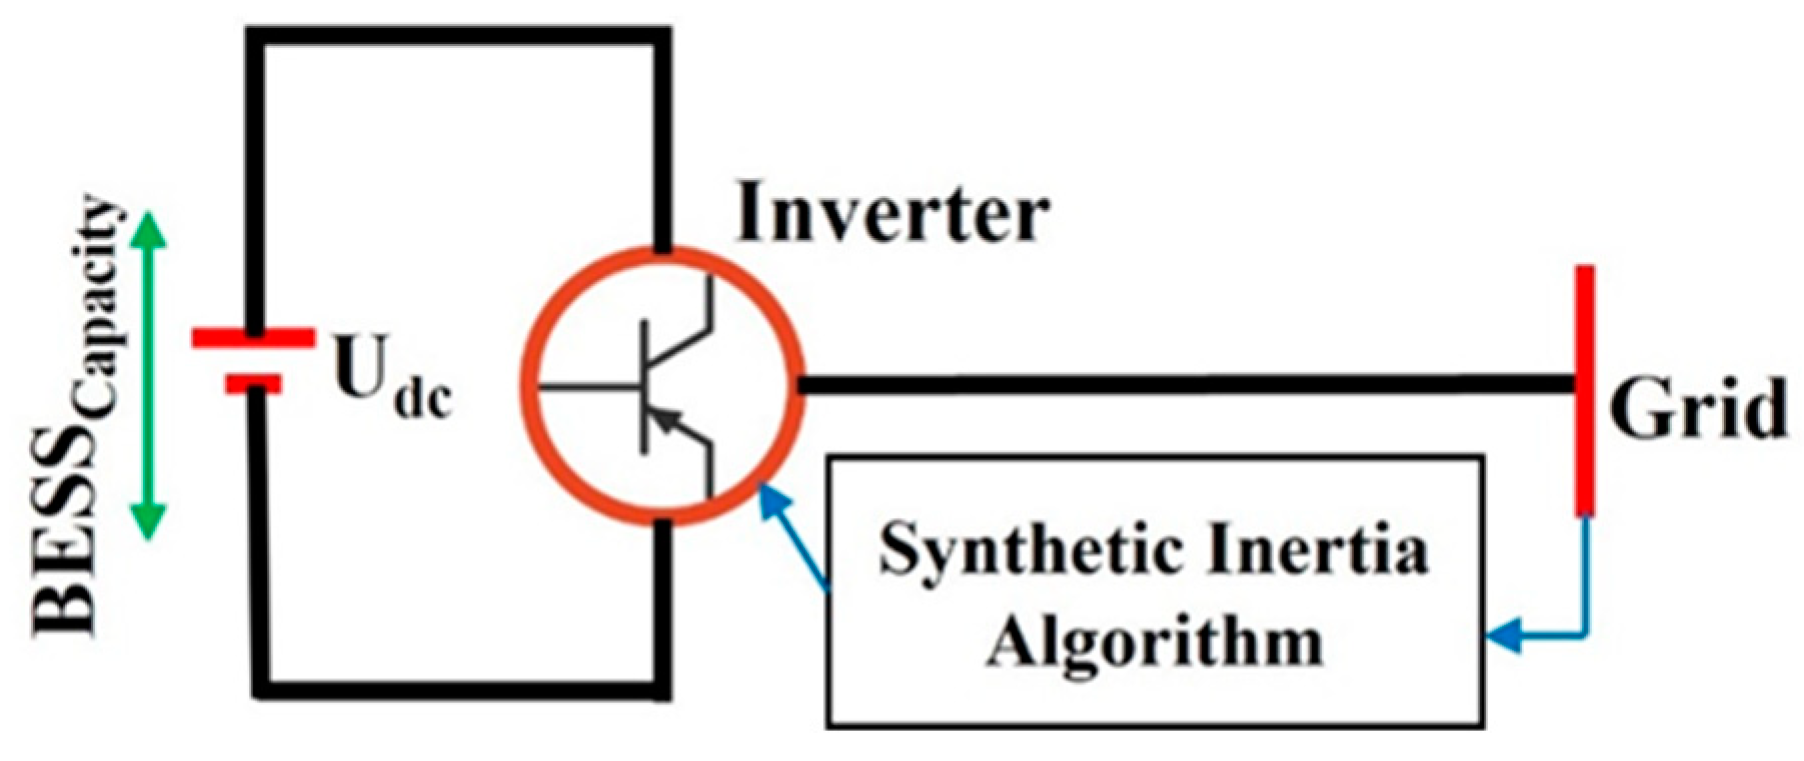
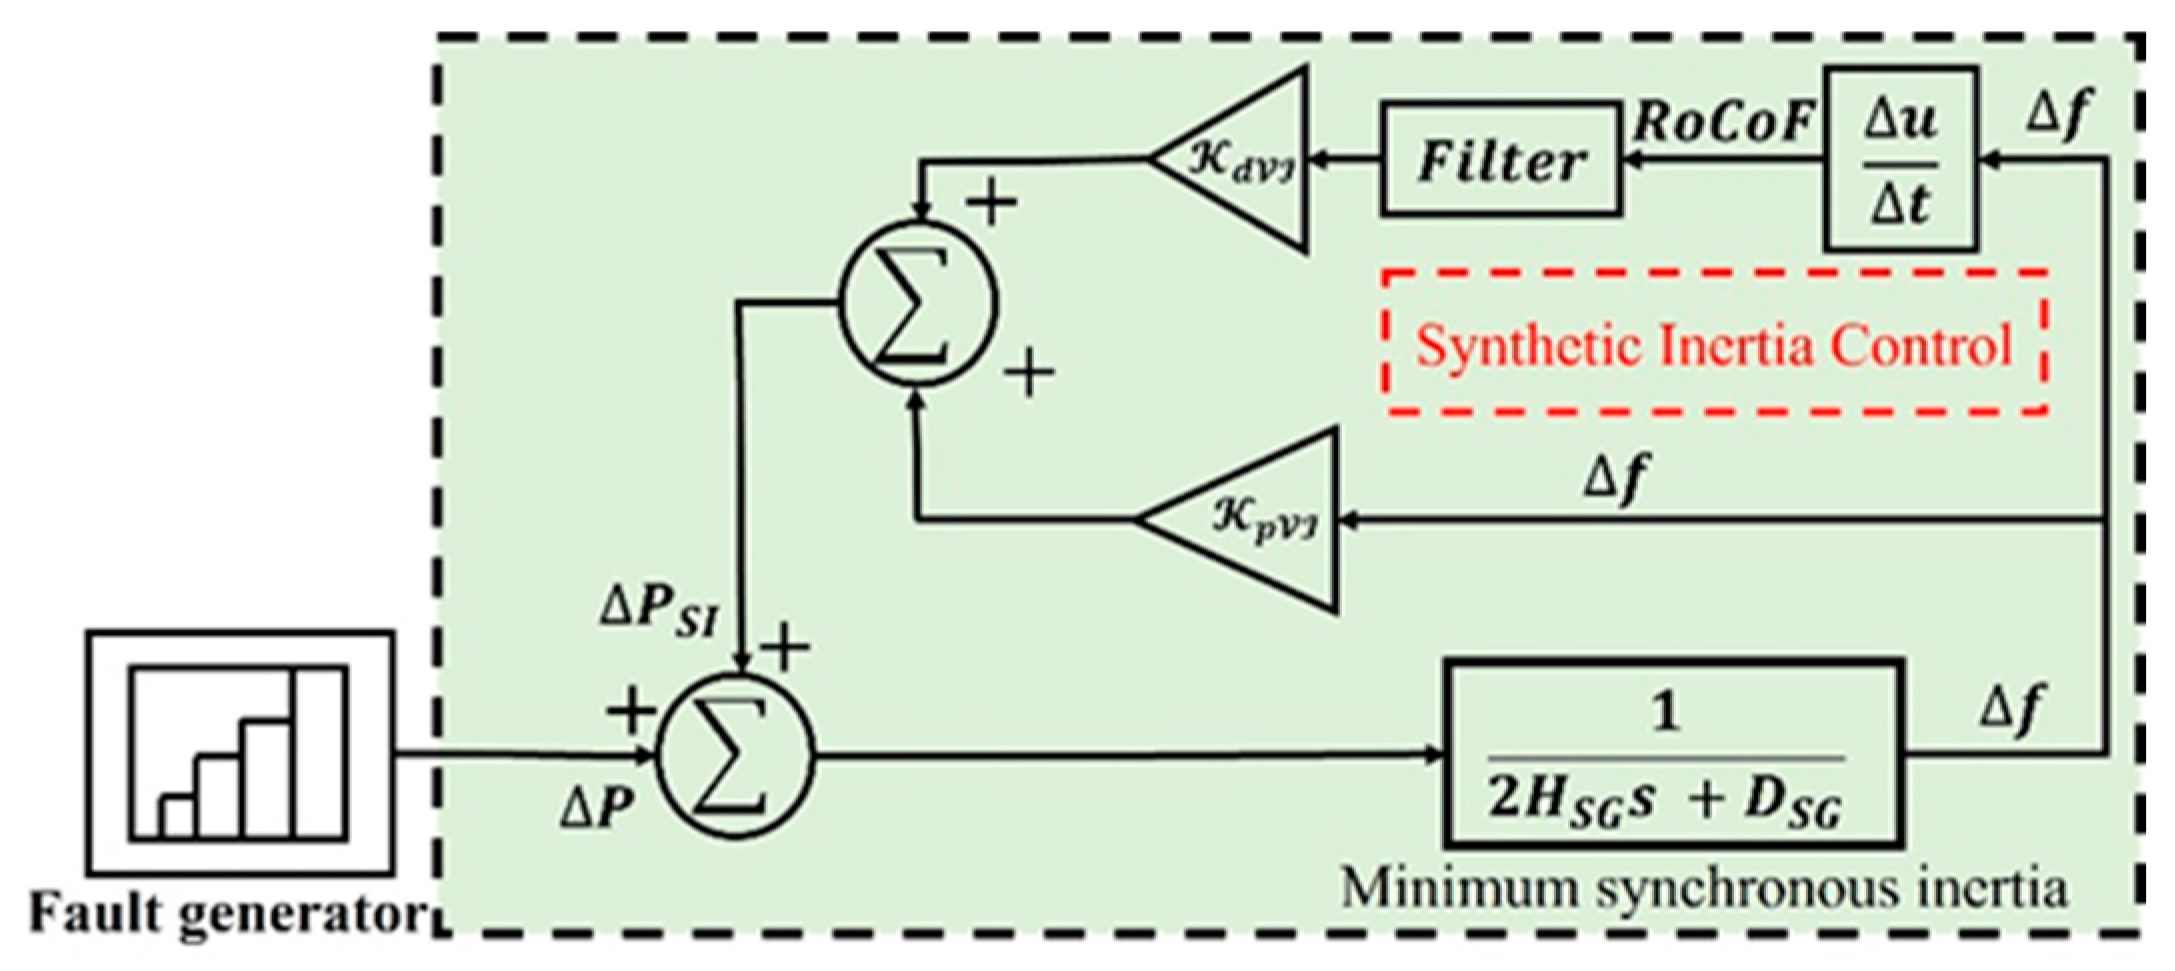
2.2.1. Model Description and Inertial Response

As the load profile dictates how much the generation should be in the network, for light loads, fewer synchronous generators are required online to power the load. The conventional SGs can further be removed from the grid when weather conditions and pricing allow more RESs to be operational. However, the operational risk is high. When any contingency event happens during this light load with reduced conventional SG inertia, RoCoFs and frequency deviations are enormous. In such circumstances, threshold values may be exceeded and lead to cascading tripping of online synchronous generators, resulting in blackouts [21].
As load profiles forecasts are well established in the literature, they can be used to schedule the minimum level of SGs online, as presented in [21]. This research work develops a graphical relation to match contingency size and the minimum required SG in a network, as shown in Figure 5. For instance, for a contingency severity of 700 MW, a minimum inertia of 7 s is required in the network as shown by the dash line. The level of SG inertia online and the contingency severity determine the size of the RoCoF. For constant SG inertia, the contingency event is directly proportional to the RoCoF. This information concludes that system inertia and the contingency severity mainly dictate the initial frequency response in the network. Likewise, the RoCoF (Hz/s), which is the time derivative of the system frequency response, primarily depends on both the contingency severity P (MW) and the system inertia H s y s (s), as seen in (1) [12,36], where f 0 (Hz) represents the nominal network frequency.
R o C o F = P f 0 2 H s y s
Now, to formulate the dynamic model for flexible SI provision in the low-SG-inertia network, the contingency severity and the minimum value of SG inertia are crucial inputs. When a contingency event P happens in a network, there will be a reaction from the rotating masses of the SGs in the network by changing their rotor speed ω (rad/s). The approximated swing Equation (2) gives the relation of speed deviation to the power imbalance.
2 H s y s ω 0 d ω d t = P
For a constant value of system inertia, the contingency severity determines the RoCoF. If maximum power imbalance P m a x is assumed, the maximum RoCoF is given by (3) [12].
R o C o F m a x = f 0 2 H s y s P m a x
And if a threshold power imbalance is considered, the RoCoF will be equal to a threshold value. The relationship is presented in (4).
R o C o F t h r e s = f 0 2 H s y s P t h r e s
To limit the RoCoF to a threshold value means extra power must be supplied to or absorbed from an external entity. Equation (5), which is the difference between the maximum RoCoF and threshold RoCoF, is presented to obtain the minimum required additional power to maintain the RoCoF below the threshold value, as explained in [12,36].
R o C o F = R o C o F m a x R o C o F t h r e s = f 0 2 H s y s P r e q
As successful frequency control requires specific RoCoF threshold values for different networks, in this research, a generalized RoCoF value of 1 Hz/s is the threshold value set in place to evaluate the provision of optimal values of SI in the network after a contingency.
Any network can use the developed concept for frequency control. In this approach, the network model is approximated using the system identification approach, as explained in [37,38]. From the estimated model, the system frequency dynamics are captured. The network dynamics are defined by the traditional swing Equation (6), where P m and P e represent mechanical power and active power deviations, respectively, while D s y s is the total damping constant of the network. The values of available SG inertia can be obtained and used in the optimization algorithm from the identified dynamics.
ω = 1 2 H s y s s + D s y s P m P e
If the network comprises both SG inertia and SI, Equation (6) can be split into two, as shown in [28]. The swing equations for the network with conventional SG inertia and SI are (7) and (8), respectively.
ω = 1 2 H S G s + D S G P m P e
ω = 1 2 H S I s + D S I P m P e
where H S G and D S G are the effective inertia constant and damping constant for the SGs in the network, while H S I and D S I are the effective inertia constant and damping constant for the SI resources in the network. The total system inertia constant H s y s and damping constant D s y s are defined by (9) and (10), respectively.
H s y s = H S G + H S I
D s y s = D S G + D S I
From the model identification, the network dynamics are identified using the s-domain transfer function from the contingency event P to frequency deviation, as given in (11).
ω s P = k s + ζ s 2 + 2 ξ ω n s + ω n 2
The Laplace transform of (11) gives (12) for underdamped systems.
ω t = ω s s 1 e ξ ω n t 1 ξ 2 sin ( ω d t + φ ω n ζ sin ω d t )          
where ω d = ω n 1 ζ 2 , φ = tan 1 ζ 1 1 ζ 2 , ω s s = P D e q , k = 2 H s y s , ζ = τ 1 , ω n = D e q 2 τ H s y s and ξ = 1 2 2 H s y s + τ D e q 2 τ H s y s D e q , and τ is the system turbine time constant.
Solving for the total required network inertia H s y s at a given contingency event P , as described in [28], and knowing the minimum value of SG inertia in the network, the required SI can be calculated using the optimization approach described in the following subsection.

2.2.2. Synthetic Inertia Optimization

This subsection introduces the optimization approach to work out the required optimal amount of SI to be provided at different levels of contingency events. In presenting the optimization approach, the cost function is an essential condition to be considered, given the additional operational cost of RESs to provide an inertial response during contingencies in the network. This paper’s optimization problem is based on the cost function of the overall economic dispatch of SGs and the cost of RES resources to provide SI. In this approach, the traditional linear Box’s evolutionary optimization (BEO) algorithm is used [39]. Box’s evolutionary optimizer presents a self-tuning capability of the parameters in the environment where it is used [39]. As the optimization problem depends on the cost of minimum SG inertia in the network, the BEO algorithm is a perfect choice in this approach. During the contingency event cycle, the parameters of the SI controller are tuned by Box’s evolutionary optimizer to provide the minimum required SI from the RES. In this way, the SI from the RES is optimized to minimize the overall cost of the network operation.
The overall cost function of the network considering only inertia can be formulated by (13) [21]. In this formulation, the cost function involves only the sum of all the components required for inertial response in the network. Therefore, the cost function is approximated by considering only the cost of SG inertia and the cost of SI in the network at a particular time t .
C t i = 1 N S G C i ( H S G t ) + i = 1 N C i ( H S I t )
where C t is the approximate of the overall cost function as a function of the cost of all SG inertia in C i ( H S G ) and SI resources C i ( H S I ) in the network. If the cost function C t is assumed to be strictly convex, then the Karush–Kuhn–Tucker (KKT) terms [29] suggest that the derivative of the cost function (14) has a distinctive set of optimizers, F .
C t f C i H S G t t + f C i H S I t t P = F
The optimizers F hold as long as all variables considered in the optimization problem do not cross their limits [40].
To ensure RESs respond optimally during contingencies, their injected power would have to solve the optimization problem (14) [28]. The optimization solution will provide the minimum amount of total SG inertia and the additional SI that help the RoCoF and frequency deviation maintained within their limits for the acceptable level of contingency event. The constraints required to formulate the optimization problem are presented in (15).
R o C o F t h r e s R o C o F R o C o F c r i t f c r i t f f c r i t E r e q E c r i t t t c r i t
For the optimization algorithm to obtain a distinctive set of optimizers for the cost function (14), first, the RoCoF should be between threshold and critical values R o C o F t h r e s R o C o F R o C o F c r i t . Second, the frequency should be within the critical values f c r i t f f c r i t . Third, the energy level from the frequency-support resources should be higher than the critical value E r e q E c r i t . Fourth, the response time of the frequency-support resources should be less than a critical set value t t c r i t . Using these constraints, the optimization algorithm should carefully tune the SI parameters to limit the RoCoF and frequency nadir within acceptable limits. In this way, the frequency profile can be maintained and avoid compromising its security and making it vulnerable to instability.
Therefore, minimizing the SI in terms of additional power at a given SG’s inertia value in the network is the optimization objective of this problem. To minimize the cost function provided in (13) as a function of levels of contingency events, P follows, as given in (16).
m i n P , t C t = f i 1 N S G C i ( H S G ( t ) ) t + f i = 1 N C i ( H S I ( t ) ) t P
As H S G is considered to be a constant quantity throughout the contingency event time t , then the optimization problem is a function of SI H S I in the network. Since the SI controller is the function of K p V I , K d V I [14], then the optimization function solely depends on the tuning of these parameters. Tuning these parameters and minimizing SI at constant minimum SG inertia should dictate the marginal cost of the network operation under contingency events.
To minimize the cost function, the primary input in the developed algorithm is the forecasted minimum synchronous generation units in the network, as determined by the forecasted net load. Based on the forecasted SGs in the network, the minimum total SG inertia can be defined by (17).
H T o t a l × S T o t a l = i = 1 N S G H i × S i
where H T o t a l and S T o t a l are the total inertia constant and the capacity of the entire system, respectively; H i and S i are the inertia constant and the capacity of the i t h SG, respectively; and N S G is the number of SGs in the network.
The following are the steps of the BEO algorithm:
  • Step 1: Choose initial points x ( 0 ) for K P V I and K I V I of SI, H S I based on the available SG inertia H S G in the network. Also choose the size reduction parameter i for each variable and a termination parameter . Set x ¯ =   x ( 0 ) ,
  • Step 2: If < , terminate the optimization process, else create 2 N by adding and subtracting i /2 from each variable at the point x ¯ ,
  • Step 3: Compute function values at all ( 2 N +1) points. Find the point having the minimum function value. Designate the minimum point to be x ¯ ,
  • Step 4: If x ¯ =   x ( 0 ) , reduce size parameters i = i /2 and go to Step 2, else set x ( 0 ) =   x ¯ and go to Step 2.
The overall algorithm of the proposed method is summarized in this paragraph. When a contingency event happens in the network, the algorithm is started by checking the contingency severity in relation to the minimum SG inertia in the network. For the first case, if the initial RoCoF is less than the threshold value, the minimum SG inertia in the network can suppress the event to maintain frequency stability. For the second case, if the response results in a RoCoF higher than the threshold value but less than the critical value, the minimum SG inertia is not enough and, hence, is incapable of suppressing the event alone to support frequency stability. Therefore, the optimal value of SI must be activated to support the available SG inertia to suppress the contingency event and thus save the network from frequency instabilities. Meeting these constraints is adequate for keeping modern networks reliable and in safe operation. For the third case, if the frequency response results in a RoCoF higher than a set critical value, the inertial response cannot maintain the frequency. In this scenario, therefore, generation protection controls are activated to protect damages in the network. The concept of the proposed algorithm is summarized in the flow diagram in Figure 6. The process is performed once for every contingency event happening in the network. When there is no contingency event, the algorithm is not started. More importantly, the implementation of this algorithm on power systems needs the presence of phasor measurement units (PMUs). With PMUs in the network, power system operators (PSOs) can monitor the status of the synchronous generators’ inertia in the network using inertia estimation techniques. Then, when contingencies happen in the network, the proposed algorithm can be run using the power system control room computers to optimize synthetic inertia to be provided by converter-based resources present in the network.

3. Results and Discussion

This research uses a modified New England 39-bus network with ten SGs for numerical simulation to validate the proposed method. The network is modelled in DIgSILENT PowerFactory 15 (manufactured by DIgSILENT GmbH, Gomaringen, Baden-Württemberg, Germany). Figure 7 presents the network’s schematic. The frequency of the network is measured at the center of inertia (COI) bus enclosed in the red dashed box. The obtained data are exported to MATLAB, (R2018b, manufactured by MathWorks, Inc., Natick, MA, USA), where the optimization algorithm is implemented. To emulate the low-inertia conditions, some of the traditional SGs in the network are sequentially replaced by solar PV power plants, represented in green boxes, to adjust the minimum value of SG inertia in the network. Alongside the solar PV plants, the BESS provides the SI in the network under contingency events. The controller at the converter controls the BESS to give optimal SI subject to the size of the event, as shown in Figure 4. The threshold, critical RoCoFs and maximum frequency deviation are set to 1 Hz/s, 2 Hz/s and 0.7 Hz, respectively.
Using the optimization algorithm presented in Section 3, several contingency events P are applied, as illustrated in Figure 4. Then, depending on the size of the event, the activation of the SI control algorithm is performed when the initial RoCoF crosses the threshold value. When SI is activated, tuning of SI controller parameters is performed to give optimal values of SI. The contingency events in this simulation are generated by tripping different loads in the network model. The resulting RoCoF is recorded and compared with RoCoF threshold and critical values for each contingency event. One generation unit G1 at bus 39 is tripped to obtain the largest contingency event. Table 1 shows the data used in the proposed approach. The table gives the inertia values and time constants of different SGs used in the network. All the frequency readings are taken from the center of inertia bus number 14.
Various simulations are performed to verify the applicability of the proposed approach. For a constant total SG inertia in the network, different sizes of contingency events are applied, and the BEO tunes the appropriate values of parameters K P V I , K I V I and the corresponding SI is given in the network. Then, the value of total SG inertia is changed by replacing some of the SGs with solar PV plants. The simulation is performed for four different values of SG inertia in the network, which are 6 s, 5 s, 4 s and 3 s. Table 2 and Table 3 present the results for different sizes of contingency events for two separate cases of SG inertia to represent the rest of the cases in the network. The corresponding tuned parameters K P V I , K I V I and the optimal SI for each case is provided. Furthermore, the percentage contribution of SI in the inertial response for each contingency event is provided.
It is noted from Table 2 that with minimum SG inertia of 6 s, contingency events with values 100 MW and 200 MW do not lead to activation of SI. The resulting RoCoF is lower than the threshold value. This scenario of low RoCoF means the available SG inertia is enough to respond to the event without resulting instability. The developed algorithm for this condition does not activate the SI controller. On the other hand, the contingency events with 300 MW to 700 MW result in an RoCoF beyond the threshold value. Therefore, the SI controller is activated, and the BEO tunes its parameters to provide SI to supplement the available SG inertia in the network. For this scenario, if the SI controller is not activated, the SG inertia cannot ensure frequency stability after the events. In the other scenario, the contingency event with a value of 1200 MW results in a very high RoCoF beyond the critical value set. In this scenario, the algorithm does not activate the SI controller; instead, it sends information to the generator protection relays for further protection actions.
Table 3 presents the optimization results for a network with a low total SG inertia of 3 s related to a maximum penetration of RESs in the network. For this case of highly reduced SG inertia, contingency events from 100 MW to 500 MW need activation of the SI controller. Contingency events from 600 MW to 1200 MW result in an RoCoF beyond the set critical value. Therefore, the SI controller is not activated; instead, protection relays are activated. For each event, the percentage contribution of SI in the inertia response is given. It is noted that the SI contribution percentage increases with the increase in the contingency events’ size.
It can be seen that as the minimum value of SG inertia is reduced in the network, large amounts of optimal SI need to be applied in the network during contingency events. The large amounts of optimal SI increase the operation cost of the network. Therefore, it is recommended to have the SG inertia in the network as much as possible to avoid the increased operating cost of modern networks.
The numerical simulations in Figure 8, Figure 9, Figure 10 and Figure 11 showcase the four cases of frequency responses with different amounts of SG inertia at various contingency events. The frequency responses presented are obtained from the center of inertia bus 14, as shown in the study case network in Figure 7. However, the SI controls are performed at the local buses where the BESSs are located. Figure 8 presents the first case where a low power contingency event is activated by increasing the load at bus 20 by 30%. The resulting frequency response has an RoCoF lower than the threshold RoCoF value. Therefore, the minimum available SG inertia in the network can maintain the frequency response within safe limits. For this case, consequently, the SI control is not activated.
The second case involves a higher contingency event than the first case at the same minimum SG inertia as in case one. In this case, two loads from bus 20 and 28 are simultaneously increased by 30% each. Therefore, the resulting initial RoCoF is higher than the threshold RoCoF set value, as observed in Figure 9. The algorithm activates the SI control as the initial RoCoF is higher than the threshold RoCoF value. The optimization algorithm provides the required value of SI for the contingency severity. The added SI increases the value of total inertia in the network and therefore modifies the frequency response from the black line with a higher RoCoF to the red line with a reduced RoCoF. In this phenomenon, the added SI saves the frequency response from instabilities.
On the other hand, to observe the effect of the increased size of contingency event on the amount of SI to be added, case three is given, as presented in Figure 10. The loads at buses 20, 28 and 39 simultaneously increased by 50%, 30% and 25%, respectively. The minimum SG inertia in the network is the same as cases one and two. The resulting contingency event is higher than that in case two. Consequently, the resulting initial RoCoF is much higher than that in case two and, therefore, crosses the threshold value as well. Likewise, the algorithm checks if the initial RoCoF value does not cross the critical value.
The resulting RoCoF does not cross the critical value set for this case. For that reason, the algorithm again activates the SI control. In this case, the optimization algorithm provides the optimal SI value with a higher value than that in case two. According to (3), a bigger size of contingency events results in a higher RoCoF and frequency deviation. According to Figure 5, more significant events require a higher inertia value to suppress them.
Therefore, for the same minimum SG inertia in case three as in cases one and two, a higher value of SI in case three than in cases one and two must be applied to suppress the higher contingency event. As expected, the higher added value of SI in case three modifies the frequency response from the black line with higher RoCoF to the red line with a reduced RoCoF, as noted in Figure 10. In this phenomenon again, the added SI saves the frequency response from instabilities.
The last case involves the disconnection of generator G1 at bus 39. In this case, the registered initial RoCoF is higher than both the threshold and the critical RoCoF values set. The network’s generator disconnection is a colossal contingency event given the same minimum amount of SG inertia as in the previous cases. This event results in the network experiencing huge frequency oscillations, as presented in Figure 11. For this condition, the algorithm is designed not to activate the SI control but to send information to generator protection relays to further protect the network for safety purposes, instead.
As seen from cases one to three, the amount of SI added to the network to increase the amount of total inertia in the network to save the frequency response from instabilities depends on the value of SG inertia and the size of contingency event in the network. As contingency events increase at the same SG inertia in the network, the amount of SI required increases proportionally. Therefore, Figure 12 presents the approximate values of SI required at different SG inertia values and different contingency events. The higher the value of SG inertia in the network, the lower the value of SI that needs to be added during events. For instance, the blue line represents the network with an SG inertia value of 6s, and the SI is not activated for a contingency event lower than 200 MW.
On the other hand, the black line representing the network with an SG inertia value of 3 s needs activation of SI for any contingency event. Furthermore, a significant difference can be noted when comparing the values of SI added in the network for the blue and black lines. For example, when the contingency event is 300 MW, the required optimal SIs are approximately 0.7 s and 2.5 s for SG inertia values of 6 s and 3 s, respectively, as noted in Figure 12. Moreover, the network with high SG inertia can withstand higher contingency events before the algorithm cannot provide SI due to a higher initial RoCoF beyond critical values, as explained in the preceding sections. This phenomenon can be observed from Figure 12, as the blue and red lines with 6 s and 5 s SG inertia, respectively, can withstand events with added SI until the event size is 700 MW. Beyond this size, the resulting initial RoCoFs are beyond the critical value set. Therefore, there is no further activation of SI in the network. Other lines with SG inertia values of 4 s and 3 s can withstand events of maximum sizes 600 MW and 500 MW, respectively. The resulting initial RoCoFs are beyond the critical value set for circumstances beyond those values. Therefore, no further activation of SI is processed in the network, as noted in Figure 12.

4. Conclusions

This paper proposes an algorithm that ensures RESs participate in inertial response by giving optimal SI values depending on the SG inertia values and the size of contingency events in the network. Self-tuning the parameter of the SI controller using the BEO approach improves frequency responses while optimizing the required SI following contingency events in a network. The optimization problem is based on the operational cost of the network. The operation cost is minimized by minimizing the cost function of inertia values in the network. The optimization study is performed using the modified New England 39-bus network. The optimization algorithm proposed has the capability of self-tuning the proportional and derivative gains K p V I and K d V I parameters of the SI controller. The results show that frequency-support resources can provide different values of SI at various contingency events to minimize the operation cost of the network. The provided SI supports the available SG inertia in the network to reduce the RoCoF values and maintain them within acceptable limits. Controlling the RoCoFs within acceptable values saves the network from frequency instabilities and increases stability resilience under various contingency events in the network. Therefore, the general merits of the proposed approach are to provide flexible values of SI under different contingency events, improve RoCoFs and reduce frequency nadir and finally, to provide the best values of SI at various events to minimize the network’s operation cost. However, one critical disadvantage of this proposed method is cascaded failures that can lead to a total failure of the entire network when available synchronous generator inertia in the network can be over-estimated. This means the proposed algorithm will provide a lower value of SI than what is actually required. The effective inertia in the network will be low for severe contingencies, hence leading to the frequency response crossing safe operating limits.

Author Contributions

Conceptualization, methodology and formal analysis, P.M. and R.Z.; writing—original draft preparation, P.M.; writing—review and editing, P.M., U.P. and R.Z.; supervision, R.Z. and T.T.L. All authors have read and agreed to the published version of the manuscript.

Funding

This research received no external funding.

Data Availability Statement

Data are contained within the article.

Acknowledgments

The authors would like to acknowledge Auckland University of Technology for the conductive research environment that enabled the undertaking of this research.

Conflicts of Interest

The authors declare no conflicts of interest.

Nomenclature

BESSBattery energy storage system
DERDistributed energy resources
GBGreat Britain
MFATMinistry of foreign affairs and trade
MWMegawatt
OPPTOptimized power point tracking
PSOPower system operators
PVPhotovoltaic
RESRenewable energy sources
RoCoFRate of change of frequency
SGSynchronous generator
SISynthetic inertia
VIVirtual inertia
VSWTVariable speed wind turbines
WTWind turbines

References

  1. Kroposki, B.; Johnson, B.; Zhang, Y.; Gevorgian, V.; Denholm, P.; Hodge, B.-M.; Hannegan, B. Achieving a 100% Renewable Grid: Operating Electric Power Systems with Extremely High Levels of Variable Renewable Energy. IEEE Power Energy Mag. 2017, 15, 61–73. [Google Scholar] [CrossRef]
  2. Brown, T.; Bischof-Niemz, T.; Blok, K.; Breyer, C.; Lund, H.; Mathiesen, B.V. Response to ‘Burden of proof: A comprehensive review of the feasibility of 100% renewable-electricity systems’. Renew. Sustain. Energy Rev. 2018, 92, 834–847. [Google Scholar] [CrossRef]
  3. Connolly, D.; Mathiesen, B.V. A technical and economic analysis of one potential pathway to a 100% renewable energy system. Int. J. Sustain. Energy Plan. Manag. 2014, 1, 7–28. [Google Scholar]
  4. Mathiesen, B.V.; Lund, H.; Karlsson, K. 100% Renewable energy systems, climate mitigation and economic growth. Appl. Energy 2011, 88, 488–501. [Google Scholar] [CrossRef]
  5. Thiesen, H.; Jauch, C.; Gloe, A. Design of a system substituting today’s inherent inertia in the European continental synchronous area. Energies 2016, 9, 582. [Google Scholar] [CrossRef]
  6. Rakhshani, E.; Gusain, D.; Sewdien, V.; Torres, J.L.R.; Van Der Meijden, M.A. A key performance indicator to assess the frequency stability of wind generation dominated power system. IEEE Access 2019, 7, 130957–130969. [Google Scholar] [CrossRef]
  7. Poolla, B.K.; Groß, D.; Dörfler, F. Placement and implementation of grid-forming and grid-following virtual inertia and fast frequency response. IEEE Trans. Power Syst. 2019, 34, 3035–3046. [Google Scholar] [CrossRef]
  8. Makolo, P.; Zamora, R.; Lie, T.-T. Heuristic Inertia Estimation Technique for Power Networks with High Penetration of RES. In Proceedings of the 2020 2nd International Conference on Smart Power & Internet Energy Systems (SPIES), Bangkok, Thailand, 15–18 September 2020; pp. 356–361. [Google Scholar]
  9. Makolo, P.; Zamora, R.; Lie, T.-T. The role of inertia for grid flexibility under high penetration of variable renewables-A review of challenges and solutions. Renew. Sustain. Energy Rev. 2021, 147, 111223. [Google Scholar] [CrossRef]
  10. Mancarella, P.; Billimoria, F. The Fragile Grid: The Physics and Economics of Security Services in Low-Carbon Power Systems. IEEE Power Energy Mag. 2021, 19, 79–88. [Google Scholar] [CrossRef]
  11. Ujjwol, T.; Dipesh, S.; Manisha, M.; Bishnu, P.B.; Timothy, M.H.; Reinaldo, T. Virtual Inertia: Current Trends and Future Directions. Appl. Sci. 2017, 7, 654. [Google Scholar] [CrossRef]
  12. Kosmecki, M.; Rink, R.; Wakszyńska, A.; Ciavarella, R.; Di Somma, M.; Papadimitriou, C.N.; Efthymiou, V.; Graditi, G. A Methodology for Provision of Frequency Stability in Operation Planning of Low Inertia Power Systems. Energies 2021, 14, 737. [Google Scholar] [CrossRef]
  13. Chamorro, H.R.; Sanchez, A.C.; Øverjordet, A.; Jimenez, F.; Gonzalez-Longatt, F.; Sood, V.K. Distributed synthetic inertia control in power systems. In Proceedings of the 2017 International Conference on Energy and Environment (CIEM), Bucharest, Romania, 19–20 October 2017; pp. 74–78. [Google Scholar]
  14. Altin, M.; Kuhlmann, J.C.; Das, K.; Hansen, A.D. Optimization of synthetic inertial response from wind power plants. Energies 2018, 11, 1051. [Google Scholar] [CrossRef]
  15. Ochoa, D.; Martinez, S. Fast-Frequency Response provided by DFIG-Wind Turbines and its impact on the grid. IEEE Trans. Power Syst. 2017, 32, 4002–4011. [Google Scholar] [CrossRef]
  16. Paturet, M.; Markovic, U.; Delikaraoglou, S.; Vrettos, E.; Aristidou, P.; Hug, G. Stochastic unit commitment in low-inertia grids. IEEE Trans. Power Syst. 2020, 35, 3448–3458. [Google Scholar] [CrossRef]
  17. Badesa, L.; Teng, F.; Strbac, G. Pricing inertia and frequency response with diverse dynamics in a mixed-integer second-order cone programming formulation. Appl. Energy 2020, 260, 114334. [Google Scholar] [CrossRef]
  18. Venkatraman, A.; Markovic, U.; Shchetinin, D.; Vrettos, E.; Aristidou, P.; Hug, G. Improving Dynamic Performance of Low-Inertia Systems through Eigensensitivity Optimization. IEEE Trans. Power Syst. 2021, 36, 4075–4088. [Google Scholar] [CrossRef]
  19. Paturet, M.; Markovic, U.; Delikaraoglou, S.; Vrettos, E.; Aristidou, P.; Hug, G. Economic valuation and pricing of inertia in inverter-dominated power systems. arXiv 2020, arXiv:2005.11029. [Google Scholar]
  20. Poolla, B.K.; Bolognani, S.; Li, N.; Dörfler, F. A market mechanism for virtual inertia. IEEE Trans. Smart Grid 2020, 11, 3570–3579. [Google Scholar] [CrossRef]
  21. Gu, H.; Yan, R.; Saha, T.K. Minimum synchronous inertia requirement of renewable power systems. IEEE Trans. Power Syst. 2017, 33, 1533–1543. [Google Scholar] [CrossRef]
  22. Liang, Z.; Mieth, R.; Dvorkin, Y. Inertia Pricing in Stochastic Electricity Markets. arXiv 2021, arXiv:2107.04101. [Google Scholar] [CrossRef]
  23. Chu, Z.; Markovic, U.; Hug, G.; Teng, F. Towards optimal system scheduling with synthetic inertia provision from wind turbines. IEEE Trans. Power Syst. 2020, 35, 4056–4066. [Google Scholar] [CrossRef]
  24. Teng, F.; Strbac, G. Assessment of the role and value of frequency response support from wind plants. IEEE Trans. Sustain. Energy 2016, 7, 586–595. [Google Scholar] [CrossRef]
  25. Kerdphol, T.; Rahman, F.S.; Watanabe, M.; Mitani, Y.; Turschner, D.; Beck, H.-P. Enhanced virtual inertia control based on derivative technique to emulate simultaneous inertia and damping properties for microgrid frequency regulation. IEEE Access 2019, 7, 14422–14433. [Google Scholar] [CrossRef]
  26. Fang, J.; Zhang, R.; Li, H.; Tang, Y. Frequency derivative-based inertia enhancement by grid-connected power converters with a frequency-locked-loop. IEEE Trans. Smart Grid 2018, 10, 4918–4927. [Google Scholar] [CrossRef]
  27. Ruttledge, L.; Flynn, D. Emulated inertial response from wind turbines: Gain scheduling and resource coordination. IEEE Trans. Power Syst. 2015, 31, 3747–3755. [Google Scholar] [CrossRef]
  28. Guggilam, S.S.; Zhao, C.; Dall’Anese, E.; Chen, Y.C.; Dhople, S.V. Optimizing DER participation in inertial and primary-frequency response. IEEE Trans. Power Syst. 2018, 33, 5194–5205. [Google Scholar] [CrossRef]
  29. Poolla, B.K.; Bolognani, S.; Dörfler, F. Optimal placement of virtual inertia in power grids. IEEE Trans. Autom. Control 2017, 62, 6209. (In English) [Google Scholar] [CrossRef]
  30. Ademola-Idowu, A.; Zhang, B. Optimal Design of Virtual Inertia and Damping Coefficients for Virtual Synchronous Machines. arXiv 2018, arXiv:1806.08488. [Google Scholar]
  31. Fernández-Guillamón, A.; Gómez-Lázaro, E.; Muljadi, E.; Molina-Garcia, Á. A review of virtual inertia techniques for renewable energy-based generators. Renew. Energy-Technol. Appl. 2020. [Google Scholar]
  32. Dreidy, M.; Mokhlis, H.; Mekhilef, S. Inertia response and frequency control techniques for renewable energy sources: A review. Renew. Sustain. Energy Rev. 2017, 69, 144–155. [Google Scholar] [CrossRef]
  33. Yang, L.; Hu, Z. Implementation of Dynamic Virtual Inertia Control of Supercapacitors for Multi-Area PV-Based Microgrid Clusters. Sustainability 2020, 12, 3299. [Google Scholar] [CrossRef]
  34. Pagnier, L.; Jacquod, P. Optimal placement of inertia and primary control: A matrix perturbation theory approach. IEEE Access 2019, 7, 145889–145900. [Google Scholar] [CrossRef]
  35. Thiesen, H.; Jauch, C. Determining the load inertia contribution from different power consumer groups. Energies 2020, 13, 1588. [Google Scholar] [CrossRef]
  36. Eriksson, R.; Modig, N.; Elkington, K. Synthetic inertia versus fast frequency response: A definition. IET Renew. Power Gener. 2017, 12, 507–514. [Google Scholar] [CrossRef]
  37. Makolo, P.; Zamora, R.; Lie, T. Online inertia estimation for power systems with high penetration of RES using recursive parameters estimation. IET Renew. Power Gener. 2021, 15, 2571–2585. [Google Scholar] [CrossRef]
  38. Makolo, P.; Oladeji, I.; Zamora, R.; Lie, T.-T. Data-driven inertia estimation based on frequency gradient for power systems with high penetration of renewable energy sources. Electr. Power Syst. Res. 2021, 195, 107171. [Google Scholar] [CrossRef]
  39. Deb, K. Optimization for Engineering Design: Algorithms and Examples; PHI Learning Pvt. Ltd.: Delhi, India, 2012. [Google Scholar]
  40. Liberzon, D. Calculus of Variations and Optimal Control Theory; Princeton University Press: Princeton, NJ, USA, 2011. [Google Scholar]
Figure 1. Schematic diagram showing SI provision from RES in a network with SG inertia.
Inventions 09 00018 g001
Figure 2. The schematic diagram for a topological arrangement and control of BESS to provide SI in network.
Inventions 09 00018 g002
Figure 3. Synthetic inertia provision to support frequency stability in synchronous low-inertia networks.
Inventions 09 00018 g003
Figure 4. A model to provide optimal values of SI in a synchronous low-inertia network.
Inventions 09 00018 g004
Figure 5. A diagram to show minimum required inertia for different contingency severities at different RoCoFs.
Inventions 09 00018 g005
Figure 6. Flow diagram of the proposed decision algorithm to activate the required SI in the network.
Inventions 09 00018 g006
Figure 7. A modified New England 39-bus with ten SGs and four solar PV plants to replace some SGs.
Inventions 09 00018 g007
Figure 8. Frequency response with a low contingency event that results in RoCoF lower than the threshold value.
Inventions 09 00018 g008
Figure 9. Frequency response at a contingency event that results in RoCoF beyond the threshold value.
Inventions 09 00018 g009
Figure 10. Frequency response at a more significant contingency event that results in RoCoF beyond the threshold value.
Inventions 09 00018 g010
Figure 11. Frequency response at an extremely significant contingency event that results in RoCoF beyond the threshold and critical values.
Inventions 09 00018 g011
Figure 12. Approximate values of SI required at different SG inertia values and different contingency events.
Inventions 09 00018 g012
Table 1. Parameters of the network used for the numerical simulation of the network.
ParameterValue (s)ParameterValue (s)
H S G 1 4.0 τ S G 1 3.5
H S G 2 3.6 τ S G 2 4.5
H S G 3 3.8 τ S G 3 5.0
H S G 4 3.2 τ S G 4 4.0
H S G 5 3.6 τ S G 5 4.6
H S G 6 3.7 τ S G 6 4.5
H S G 7 3.3 τ S G 7 5.0
H S G 8 3.2 τ S G 8 4.0
H S G 9 3.1 τ S G 9 4.5
H S G 10 3.5 τ S G 10 5.5
Table 2. Tuned parameters for different sizes of contingency events at SG inertia = 6 s.
Contingency   Events   P (MW) K p V I K d V I SI (s)% of SI in Inertial Response
00000
1000000
2000000
300126.20.615
400116.00.828
5009.86.11.0111
6009.55.81.2513
7008.14.71.4315
12000000
The minimum value of synchronous generator inertia = 6 s.
Table 3. Tuned parameters for different sizes of contingency events at SG inertia = 3 s.
Contingency   Events   P (MW) K p V I K d V I SI (s)% of SI in Inertial Response
00000
1004.52.21.4415
2004.21.81.8620
3003.61.52.1723
4003.51.22.5027
5003.10.82.8831
6000000
7000000
12000000
The minimum value of synchronous generator inertia = 3 s.
Disclaimer/Publisher’s Note: The statements, opinions and data contained in all publications are solely those of the individual author(s) and contributor(s) and not of MDPI and/or the editor(s). MDPI and/or the editor(s) disclaim responsibility for any injury to people or property resulting from any ideas, methods, instructions or products referred to in the content.

