Article

Flow Rate Sensor inside Infusion Tube

1
Institute of Cardio—Cerebrovascular Medicine, Central Hospital of Dalian University of Technology, Dalian 116003, China
2
School of Optoelectronic Engineering and Instrumentation Science, Dalian University of Technology, Dalian 116024, China
3
School of Chemical Engineering, Dalian University of Technology, Dalian 116024, China
4
Faculty of Medicine, School of Biomedical Engineering, Dalian University of Technology, Dalian 116024, China
*
Authors to whom correspondence should be addressed.
Inventions 2024, 9(4), 89; https://doi.org/10.3390/inventions9040089
Submission received: 13 July 2024 / Revised: 11 August 2024 / Accepted: 12 August 2024 / Published: 13 August 2024

Abstract

:
Infusion systems are widely used in clinical medicine. Intravenous infusion therapy must be monitored to ensure patient safety. We proposed a compact flow rate sensor device based on the time-of-flight method. This device included one ceramic heater and two infrared sensors. Practical sensor prototypes were fabricated and characterized. The response time was 30 s. The sensor range was estimated to be 33 dB from μL/min to tens of mL/min, covering almost the entire usage range This flow rate sensor can be applied to common infusion tubes. Through the use of a mobile phone app, detailed information can be presented in real time.

1. Introduction

Infusion systems are widely used in clinical medicine. They are used in intravenous fluid therapy, being used to administer drug solutions and nutrients to patients. Considering the physical and pharmacological properties of different medicines, as well as the different ages and medical statuses of patients, acceptable fluid speeds or flow rates have been defined [1,2,3,4]. Therefore, doctors need to establish a reasonable flow rate when giving intravenous drugs to patients. At present, the infusion process in most hospitals relies on inspections by nurses and patients. This results in a shortage of medical resources, and medical staff are prone to medical errors under high-intensity work. The data reported by Donaldson et al. [5] estimate that between 44,000 and 98,000 people die each year from medical errors. Therefore, the use of an intelligent infusion system for flow rate monitoring can reduce the manpower workloads of hospitals, improve the efficiency of clinical care, and reduce low-level errors in medical processes [6].
The fluid measurements were realized using microcantilevers [7,8,9]. It is necessary that the probe comes in contact with the medicine, requiring additional disinfection and sterilization as there is a risk of contamination with the chemical solution. To avoid contact with the drug, non-contact measurements were performed and reported along with the weight measurements [10,11] and capacitive measurements [12,13,14]. However, these two methods can only estimate the remaining amount in the bottle and cannot show the flow rate. There are different infusion systems: gravity infusion methods that use a vessel and a drip filling chamber. Droplet counting methods [15,16,17,18] can obtain the flow rate by calculating the number of droplets dripping per unit time via infrared photodetection; however, the measurement accuracy is limited by the alignment. The ultrasonic method [19] measures the flow rate via the calculation of the time difference in reflection with high accuracy. However, it has a high cost. Thermal methods [20,21,22] use the principle of heat transfer to measure the transfer of heated liquid in the pipeline with good measurement accuracy and has a low cost. Berthet et al. [23] designed a thermal micro-flow rate sensor designed to measure liquid flow velocity based on the time-of-flight (TOF) method. Typically, there are two main types of testing devices used to measure intravenous infusion flow rates: contact and non-contact. Lei et al. [24] developed a self-powered spiral droplet triboelectric sensor for real-time monitoring. The weighing infusion monitoring system is a kind of non-contact measurement that is relatively easy to implement; however, its accuracy is low [25]. The measuring accuracy of the capacitive measuring device is low when measuring low liquid levels [26,27]. Photoelectric monitoring requires high stability of the infusion room and is not suitable for drugs that need to be stored away from light [28,29,30,31]. Using the time domain reflectometry measurement combined with non-invasive sensing elements requires the installation of strip electrodes outside the infusion container, which is costly [32]. The thermal method uses the principle of heat transfer to measure the transmission of heated liquid in the pipeline to achieve flow rate detection, which can achieve high measurement accuracy.
In this work, we designed a clinical infusion-warming and flow rate-monitoring device. Its total weight was measured to be less than 200 g. For this application, we have designed a clinical infusion-warming and flow rate-monitoring device specifically suited for intravenous fluids with low viscosity coefficients. One heater was placed on the infusion tube, and two infrared temperature sensors was arranged at different distances from the heater. The TOF approach was used to calculate the time delay between the two sensors when the heated liquid was used to measure the flow rate. The thermal diffusion mode of the liquid and the infusion tube differ; thus, three-dimensional finite element analysis calculations were performed using Ansys. Normal saline (0.9% sodium chloride), lactated ringer’s Solution, dextrose solutions, antibiotics, blood products (red blood cells and plasma), analgesics, sedatives, and electrolyte solutions can typically be warmed to a certain temperature range during infusion, which can help alleviate adverse infusion reactions caused by the temperature difference between the chemical solutions and a patient’s body temperature.
We can also use a servo to squeeze the infusion tube to adjust the infusion speed. In addition to flow rate monitoring, we can also continuously heat the liquid through the heating sheet, and form feedback control with the infrared temperature sensor to achieve constant temperature heating, which can alleviate the adverse infusion reaction caused by the temperature difference between the chemical solution and the body temperature. The measurement data and operating status of the device are transmitted in real time to the host computer or a mobile phone for real-time display. The high cost of sensors produced by companies such as Sensirion and Keyence hinders their widespread use in medical institutions for infusion monitoring. Our proposed sensor is low-cost, highly accurate, and suitable for widespread use in medical institutions, effectively meeting the demand for infusion flow rate measurements.

2. The Device Design of Flow Rate Sensor

2.1. The Experimental Scheme

Figure 1 shows the experimental scheme. The syringe pump (LSP02-3B, Ditron Technology Co., Ltd., Baoding, China) was used to inject the liquid into the infusion tube. The inner diameter and the outer diameter of the infusion tube were 2.8 mm and 5.1 mm, respectively. The sensor device included one ceramic heater and two infrared sensors. This sensor device was fabricated using a three-dimensional (3D) printer. The size of this sensor device is 100 mm (length) × 22 mm (wide) × 36 mm (height). The total weight was measured as being 188 g. The distance between the two infrared sensors was 30.5 mm. The typical heating period was 20 s. The inner diameter of the infusion tube is 2.1 mm. The PTC (positive temperature coefficient) ceramic heating plates are installed outside the pipeline for heating without direct contact with the liquid inside the pipeline.

2.2. The Flow Speed Calculation Modeling

To attain the linearity and reduce the dependence on fluid properties, the flow rate sensor must be operated in a regime in which longitudinal diffusion effects are negligible. Then, we performed the measurements using sequential sensors. Since the two infrared temperature sensors are fixed in their respective positions and L is a constant, it is only necessary to find out the time interval (Δt) between the two sensors for the heated liquid to pass through the two sensors. The calculation used for the flow speed using the TOF method was simplified as follows:
V = L Δ t
where V is the flow speed, L is the distance between the two sensors, and ∆t is the time interval.

2.2.1. Time-Domain Cross-Correlation Algorithms

In this case, the two infrared temperature sensors detected the thermal radiation signal of the same heated liquid. Therefore, the cross-correlation algorithm can be used to calculate the correlation of two signals at different moments and find the moment when there is the greatest degree of correlation so as to obtain the time interval after passing through the two sensors. The cross-correlation algorithm is a signal processing technique used to measure the similarity between two signals. It performs a convolution operation on one signal with another in the time domain and then observes the peak position of the convolution result to determine the time offset between the two signals. Suppose the temperature variation signal detected by the first sensor is f ( t ) , and the temperature variation signal detected by the second sensor is g ( t ) . For the two signals f ( t ) and g ( t ) , their cross-correlation function is R f g ( τ ) , where τ represents the time shift of g ( t ) relative to f ( t ) on the right. When the similarity between f ( t ) and g ( t ) is maximum, the peak of the cross-correlation function R f g ( τ ) is the largest, and the time τ corresponding to this peak is the time difference between the two peaks. For the case of heated liquid passing through two infrared temperature sensors, Equation (1) can be used to calculate the fluid velocity. During a measurement cycle, its cross-correlation function can be represented as follows:
R f g ( τ ) = t 0 t 0 + T f * ( t ) g ( t + τ ) d t
The time τ corresponding to the maximum value of the cross-correlation function is the delay time ∆t. Substituting ∆t into Equation (1) yields the true average flow velocity V in the tube.

2.2.2. Frequency-Domain Correlation Algorithms

Bot time-domain correlation and the frequency-domain correlation are signal processing techniques used to measure the similarity between two signals. The equation for the cross-correlation calculation after time domain discretization is as follows:
R f g ( m ) = lim N 0 1 N k = 0 N 1 f ( k ) g ( k + m )
where f(k) and g(k) are sequences of length N. According to the definition, if two sequences are directly multiplied and summed, then they need to be realized by two layers of four loops, and the computational complexity is O(N2), which is computationally expensive but has high accuracy. This algorithm is suitable for short signal lengths.
Compared to time-domain correlation, frequency-domain correlation can be computed using the spectral information of the signal; therefore, the cross-correlation function can be computed more quickly. The frequency-domain cross-correlation algorithm consists of two steps: the first step is to perform a Fourier transform of the spectrum of the two signals as
f ( k ) F 1 ( n ) ,
and
g ( k ) F 2 ( n ) .
The second step is to multiply their spectra and then perform an inverse Fourier transform to obtain the cross-correlation function. This step can be realized by
S ( n ) = F 1 ( n ) F 2 * ( n )
and
R f g ( m ) = F 1 S ( n ) .
The frequency domain cross-correlation algorithm can use fast Fourier transform (FFT) to achieve fast computation, with a computational complexity of O(NlogN), with efficient computation and fast response time; however, it requires spectrum analysis and processing, so it may require more computational resources. Compared with the time-domain correlation, the frequency domain cross-correlation algorithm has advantages when processing long-term series data, especially when multi-channel data need to be processed. On the other hand, the time-domain cross-correlation algorithm has more advantages in computational complexity and accuracy and is suitable for shorter signal processing tasks. Because the flow rate of intravenous fluids is very slow, the rate measurement cycle becomes correspondingly long. In this case, the frequency domain cross-correlation algorithm can improve the measurement accuracy and calculation speed of intravenous infusion flow rate, which has higher practicability. Therefore, in the following experimental verification process, the frequency domain cross-correlation algorithm was chosen for the flow speed calculations.

2.2.3. The Relation of the Flow Speed and the Flow Rate

A simplified model of the flow rate sensor device is shown in Figure 2. The liquid went through the infusion tube, and the distance between two thermal sensors was L. The inner and outer radii of the infusion tube are set as Ri and Ro, respectively. The cylindrical coordinate system was chosen due to the geometrical characteristics of the infusion tube. The first sensor position point A was located at z = 0, and the heat of the liquid heated by the heating sheet is transferred in the tube wall and the liquid in the tube to generate a dynamic waveform with a temperature of T(z, t) in the tube, which satisfies the heat dispersion equation:
T ( z , t ) t + U T ( z , t ) z = α 2 T ( z , t ) z 2
In this case, U/V = 0.6233. The conversion relationship between the flow speed and the flow rate is presented as
U = V S ,
where Q is the flow rate and S is the cross-sectional area inside the infusion tube.

2.2.4. The Design of the Signal Process

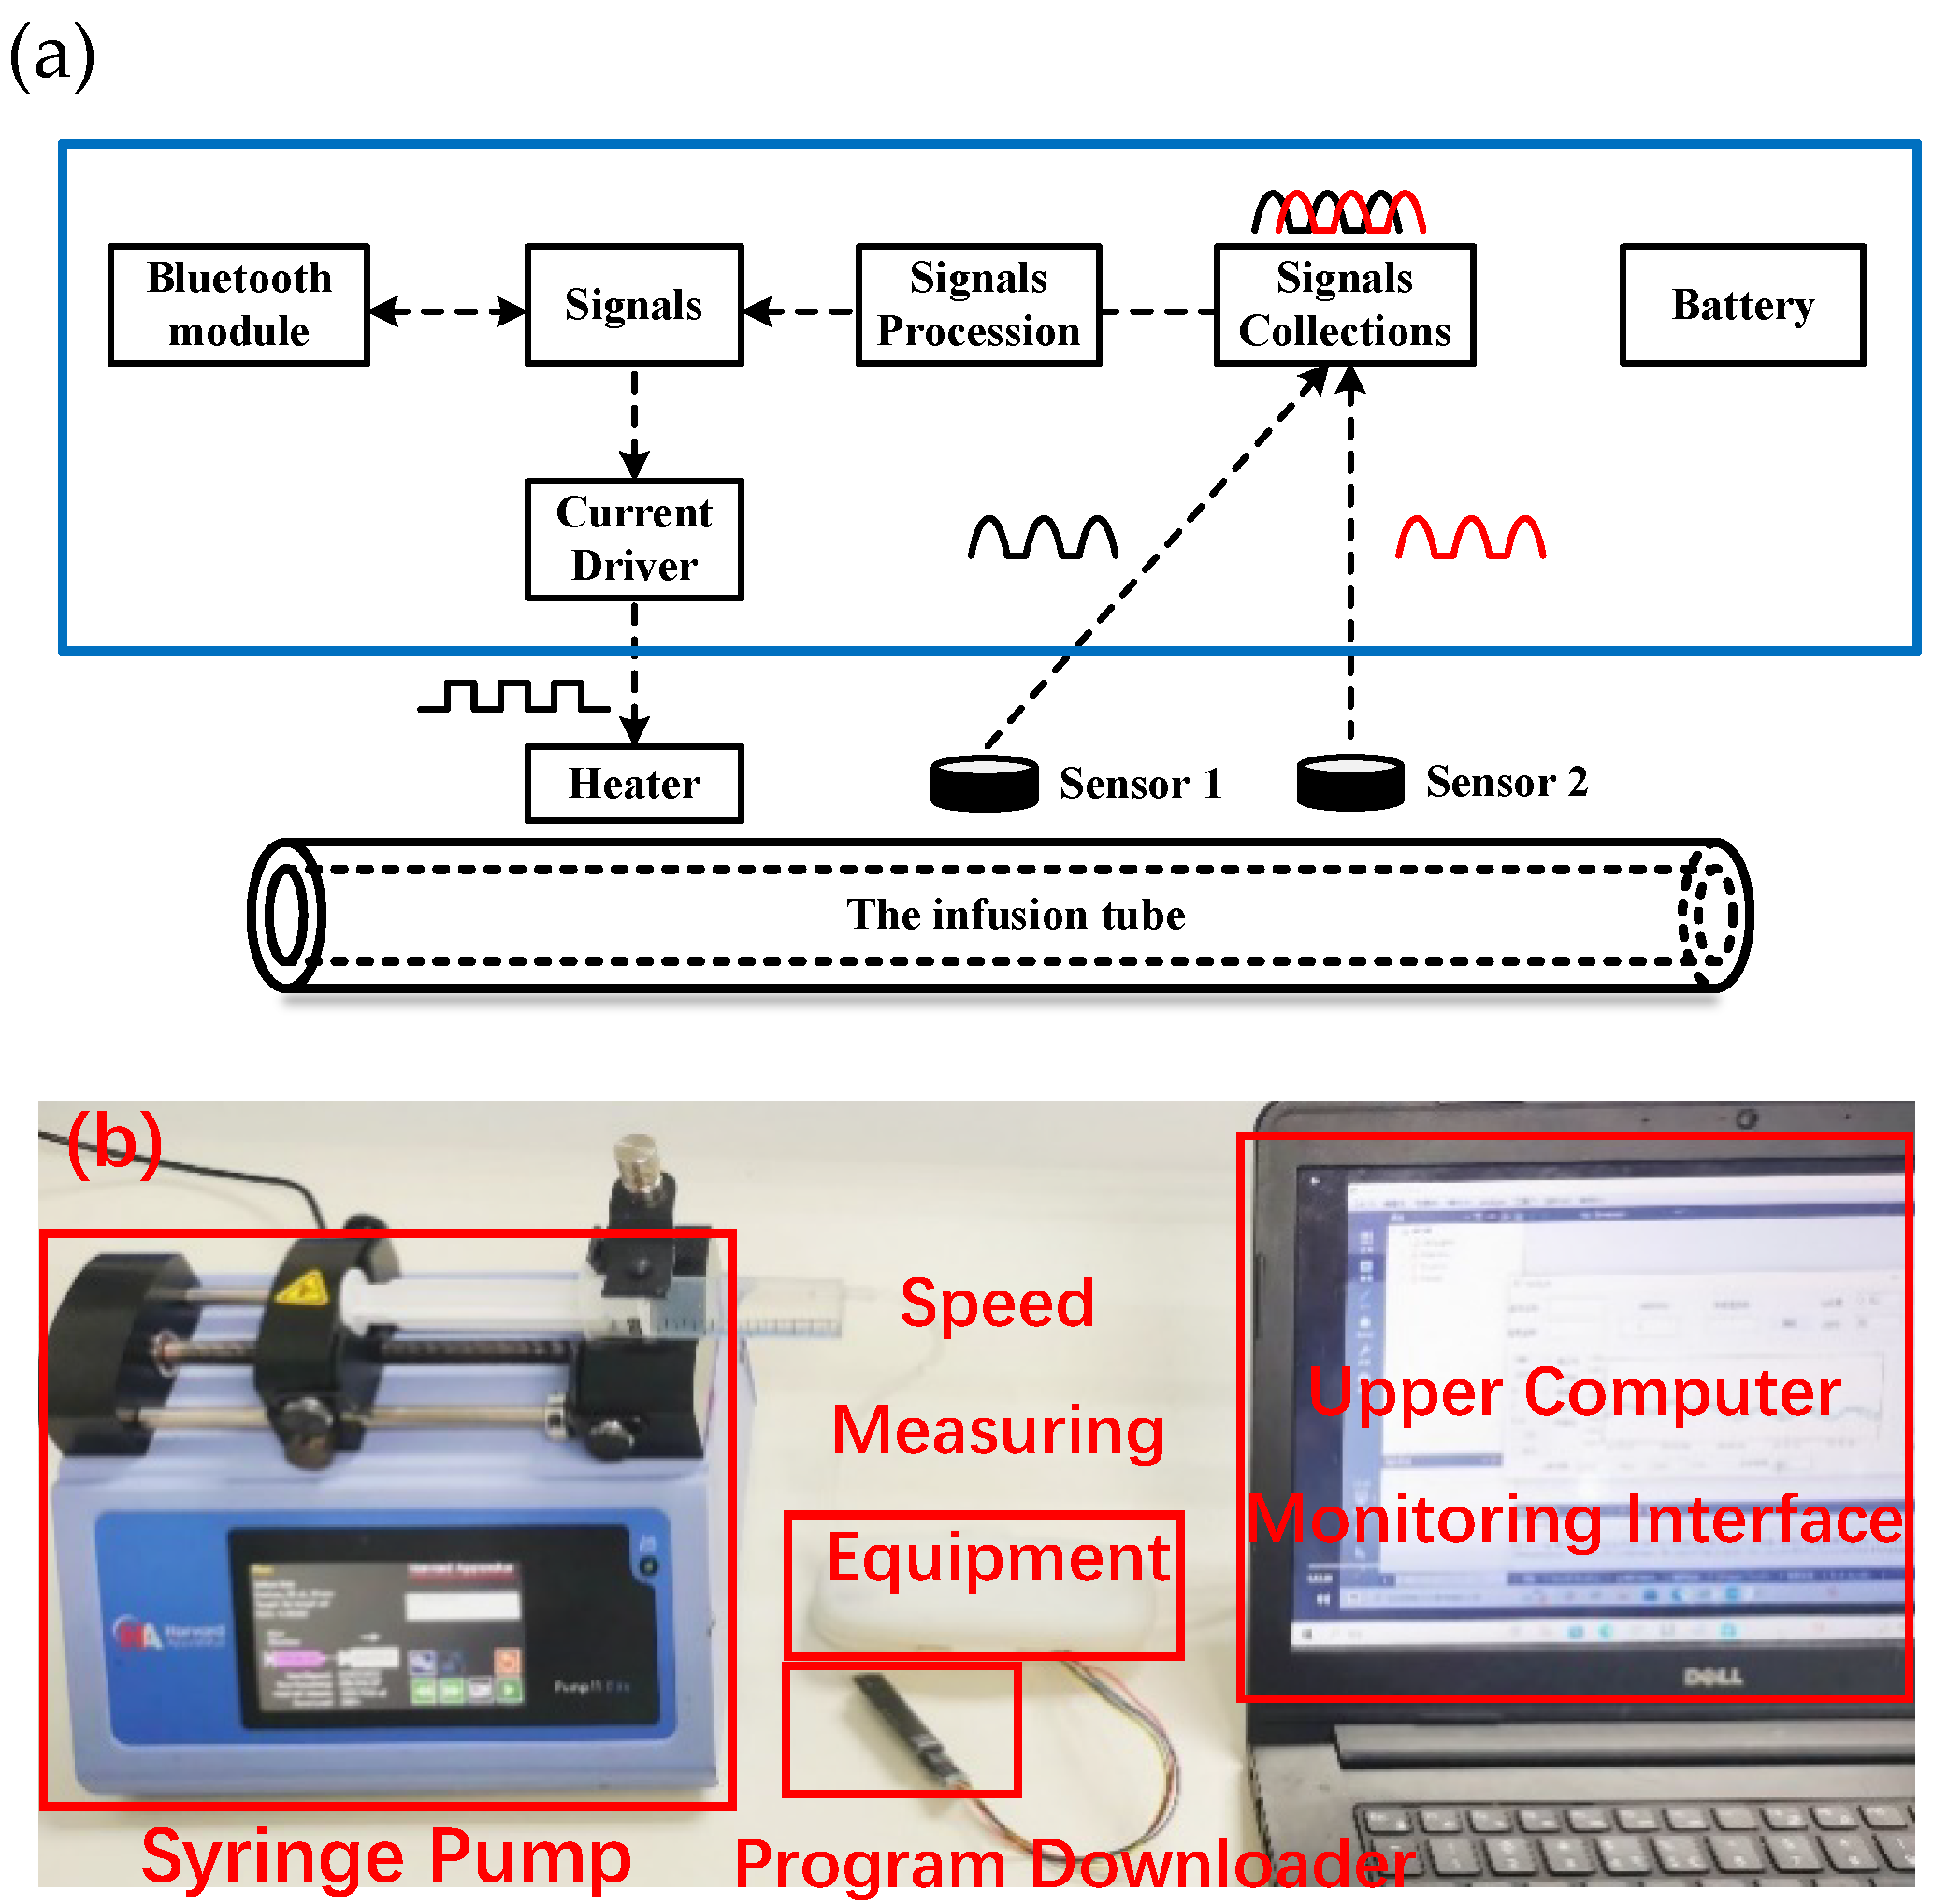
Figure 3a shows the block diagram of the flow speed measurement system, including the Bluetooth module, drive circuit, heating module, sensor, battery, and so on. The control unit controls the heating module through a drive circuit, the heating module periodically heats the pipe, and the temperature of the fluid in the pipe changes accordingly. The fluid carrying the heat information flows through two infrared temperature sensors in; thus, the two sensors detect the change in heat and generate the corresponding electrical signal. This signal is amplified by the amplification circuit and is collected by the control unit and processed and calculated so as to obtain the flow rate. The information is transmitted to the host computer for display through the Bluetooth module. An experiment was also set up, as shown in Figure 3b.

3. The Performance of the Flow Rate Sensor Devices

3.1. The Signals Process of the Flow Speed

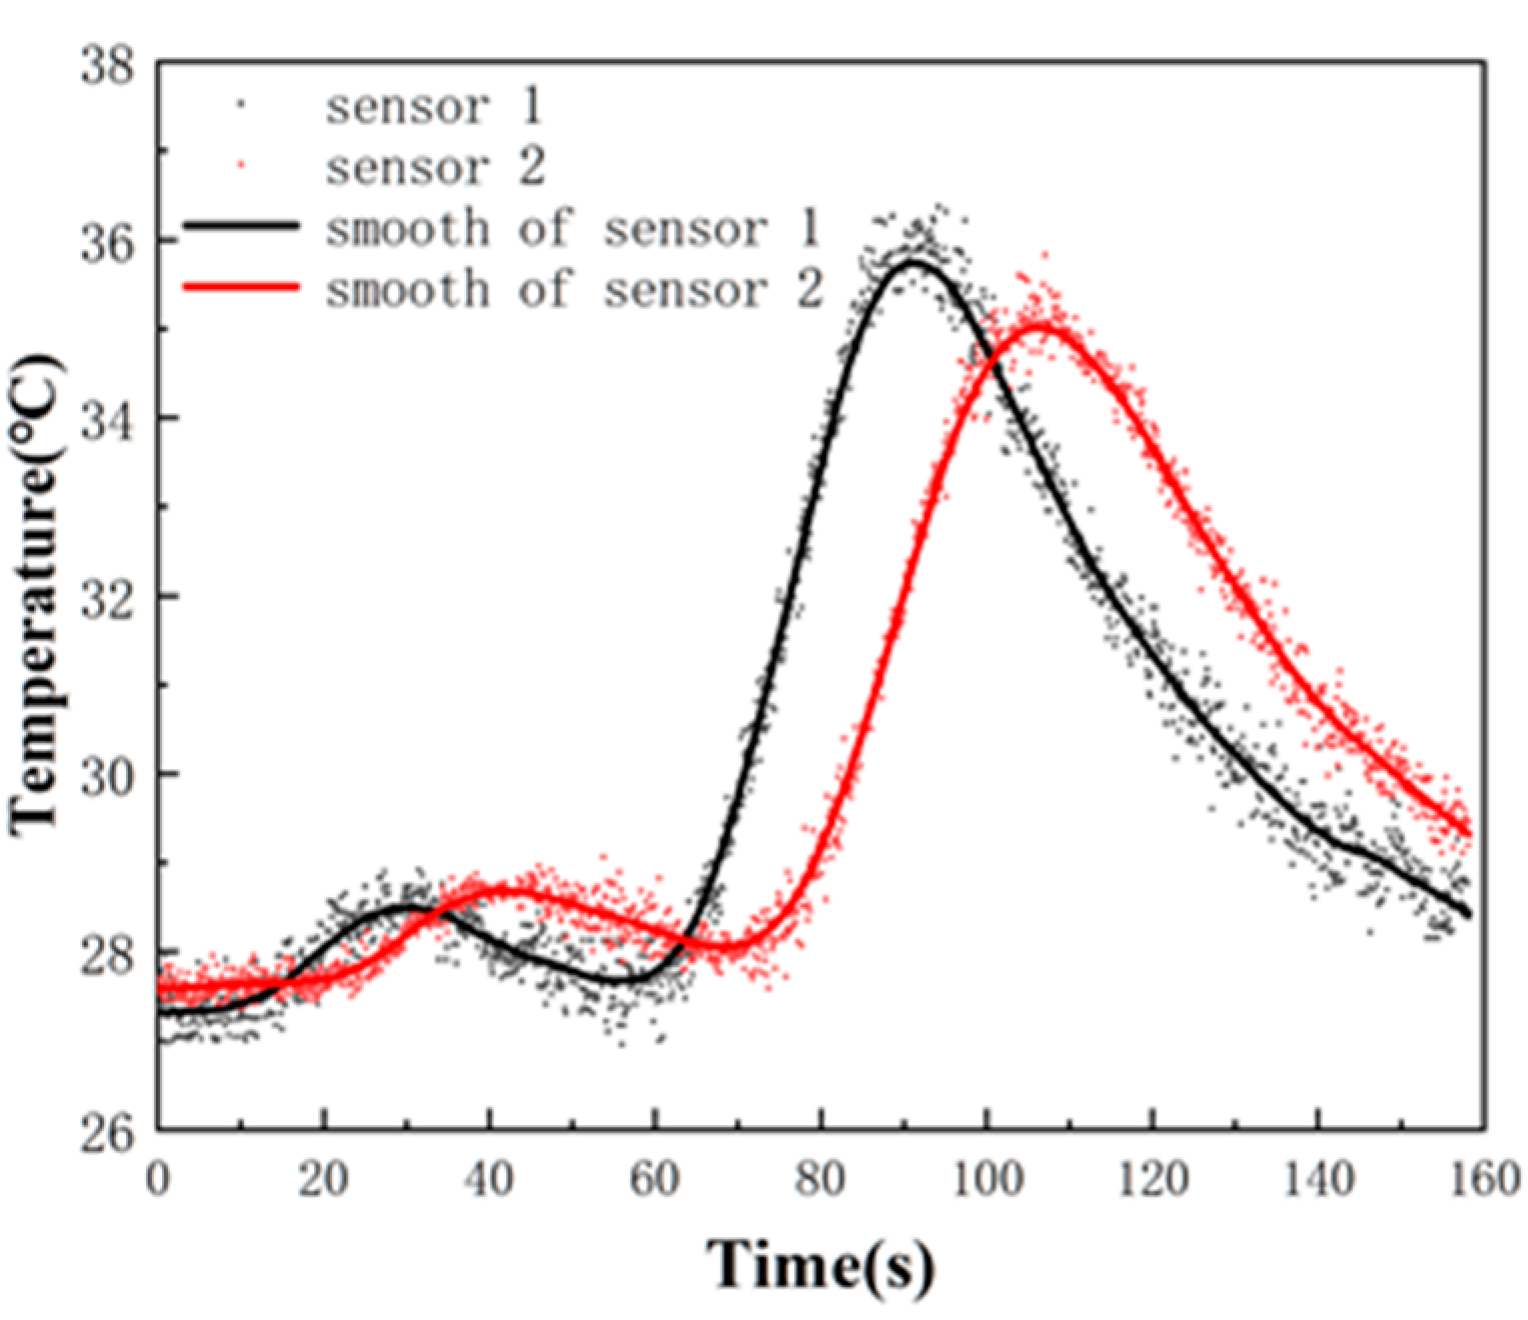
The setting of infusion rate takes into account multiple factors, including the patient’s age, weight, condition, cardiopulmonary function, and the nature of the medication. Due to variations in these factors, the infusion rate is not fixed but is adjusted by the doctor based on the specific circumstances of the patient. For healthy adults, the normal infusion rate is typically around 40–60 drops per minute, which corresponds to 240–360 mL/h. In Figure 4, we show the typical signals from the thermal sensors when the ceramic heater was on for 15 s heating. The distance of two thermal sensors was set to be 30.5 mm, and the sampling frequency was 10 Hz. The data points of thermal sensor 1 were marked in black, and the black line was processed by the moving average filter using MATLAB. The signals from thermal sensor 2 were also handled with the same process, and the data points and the curve are shown as red. The time interval between these two thermal sensors was obtained as being 13.5 s. The flow speed was calculated as being 3.70 mm/s.

3.2. The Operation of This Flow Rate Sensor Device

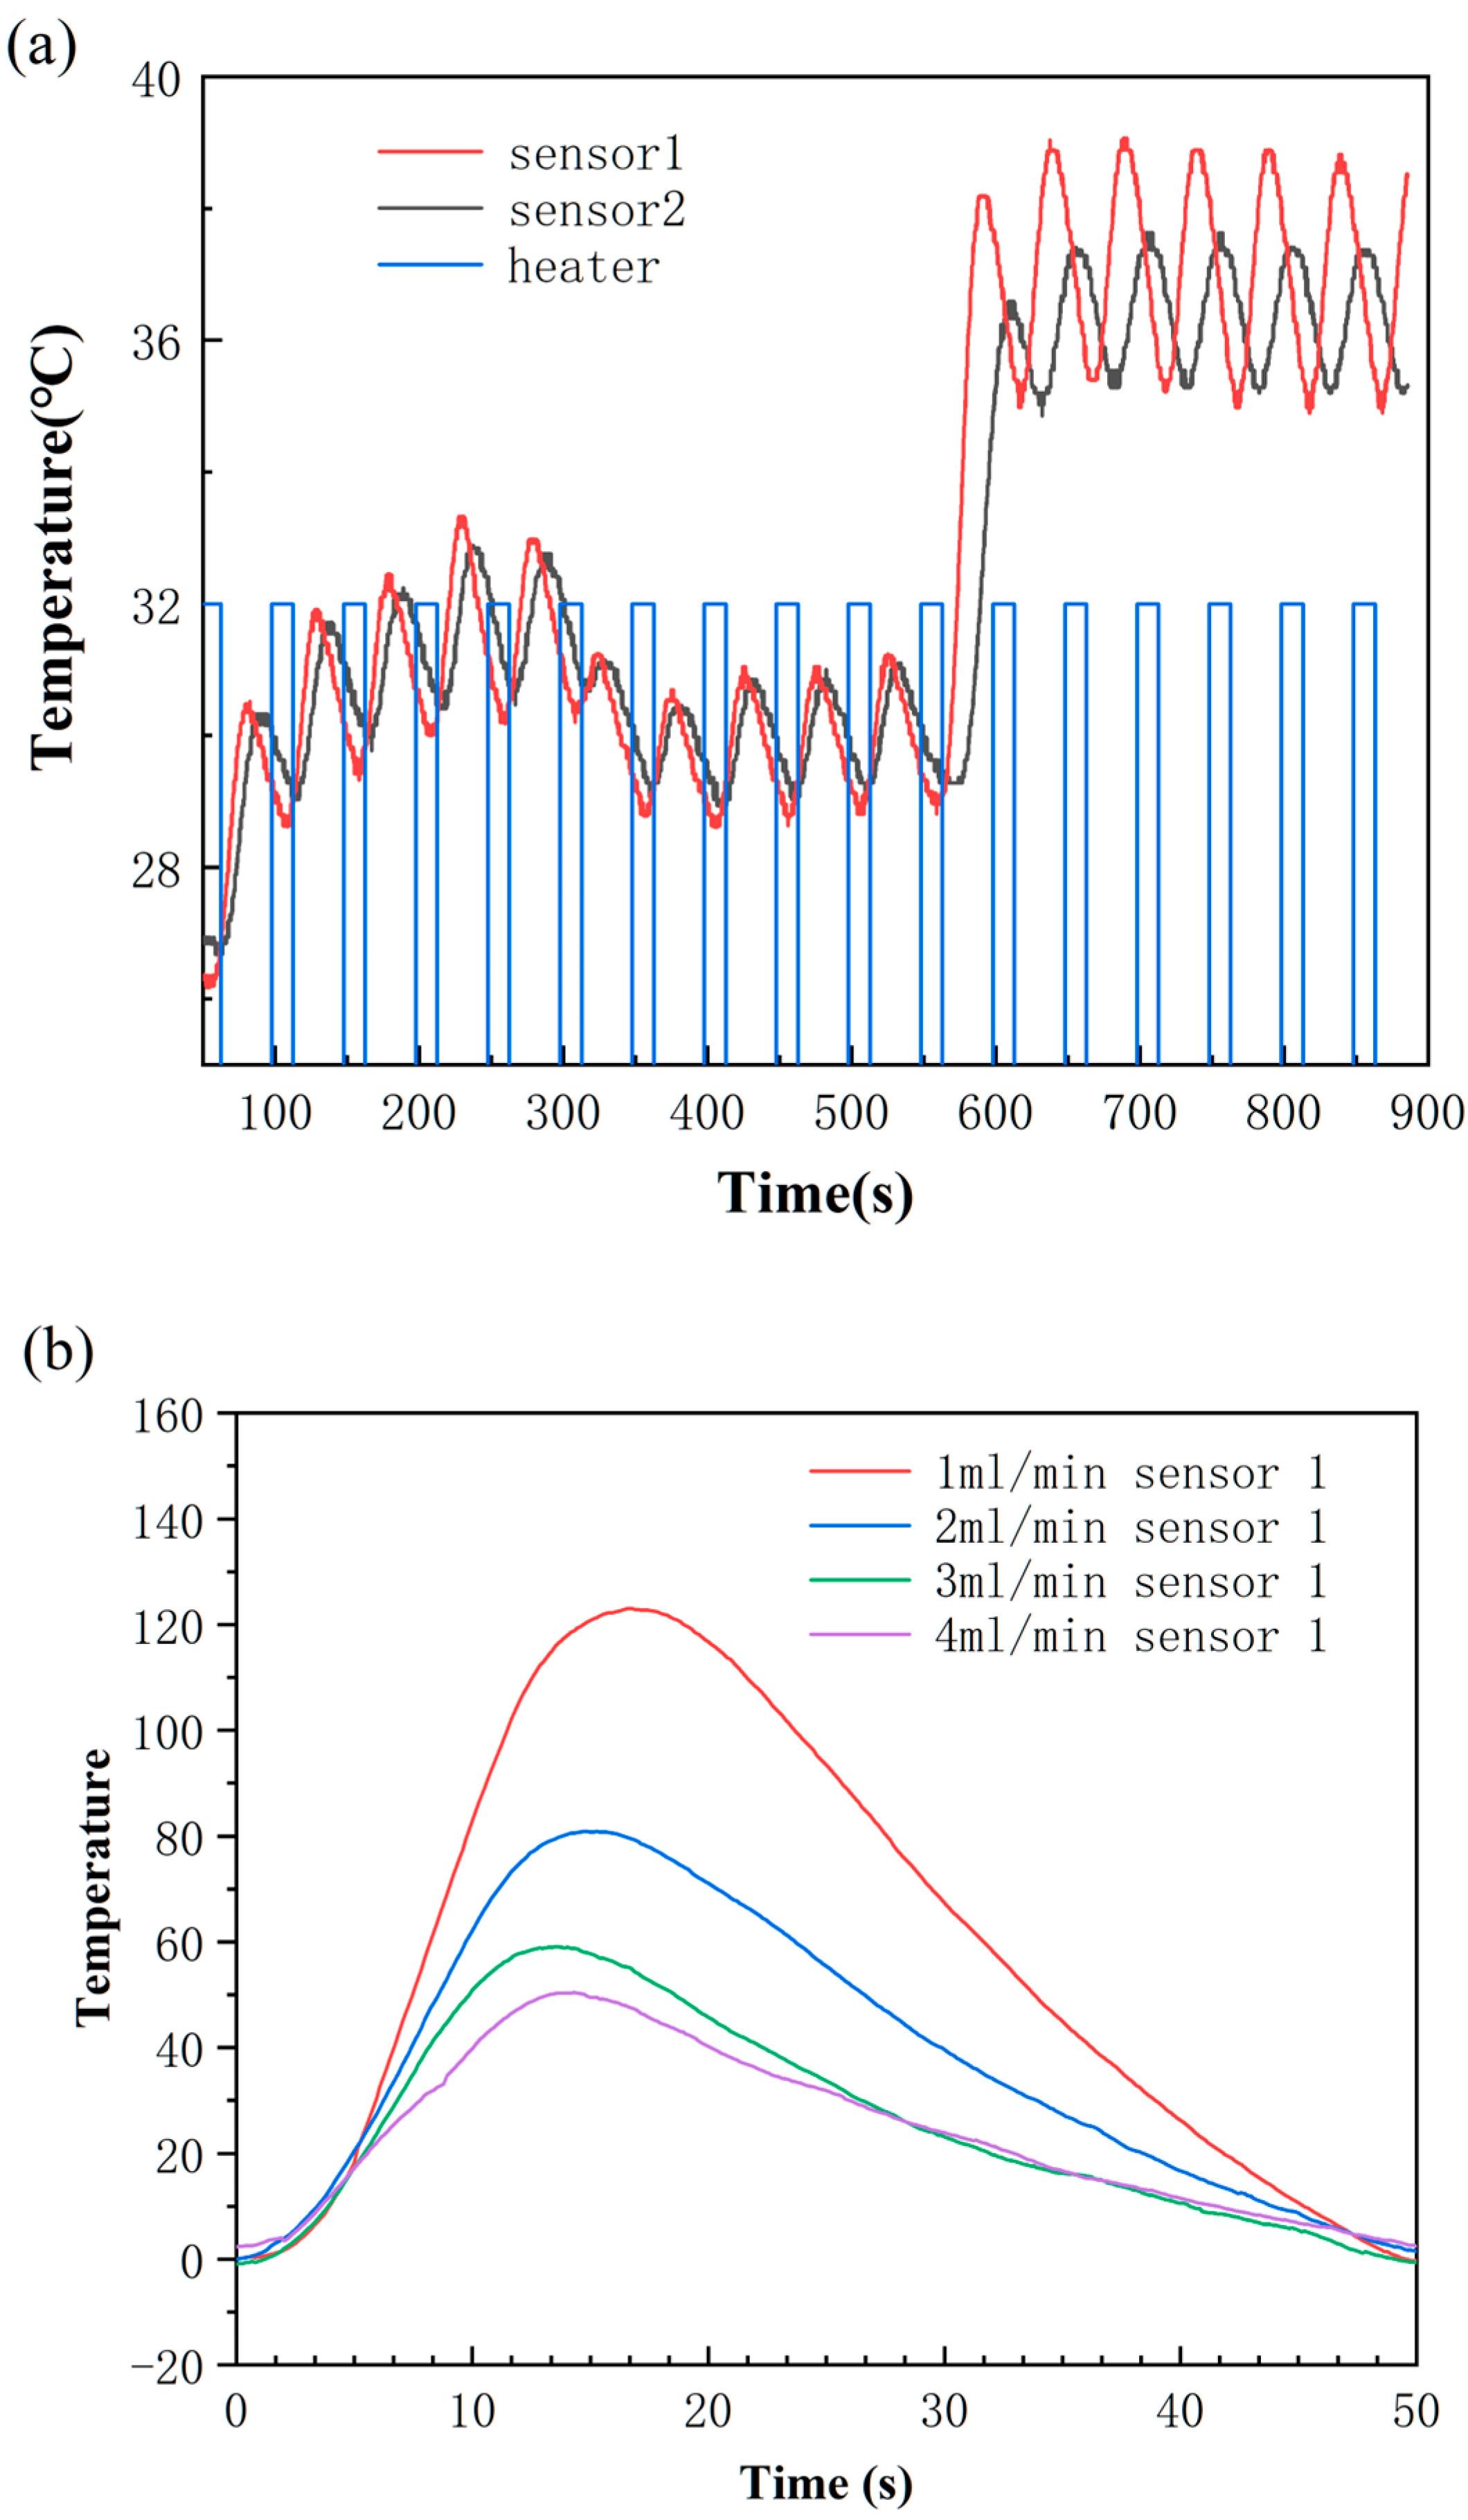
We can control the flow rate by tuning the syringe pump. In Figure 5a, we show the data curve of the continuous operations. The operation period is 50 s, and the heating duration is 15 s. The flow rate can be dynamically altered. With the operation process, the flow speed can be correctly calculated. Figure 5b depicts the temperature amplitude variation detected by the sensor under different flow rates. As shown in the figure, as the flow rate increases, the temperature variation amplitude decreases. Importantly, within the typical range of intravenous infusion flow rates, significant temperature changes can be reliably measured, thereby satisfying the requirements for intravenous infusion flow rate measurements.

3.3. The Dynamic Range of This Flow Rate Sensor Device

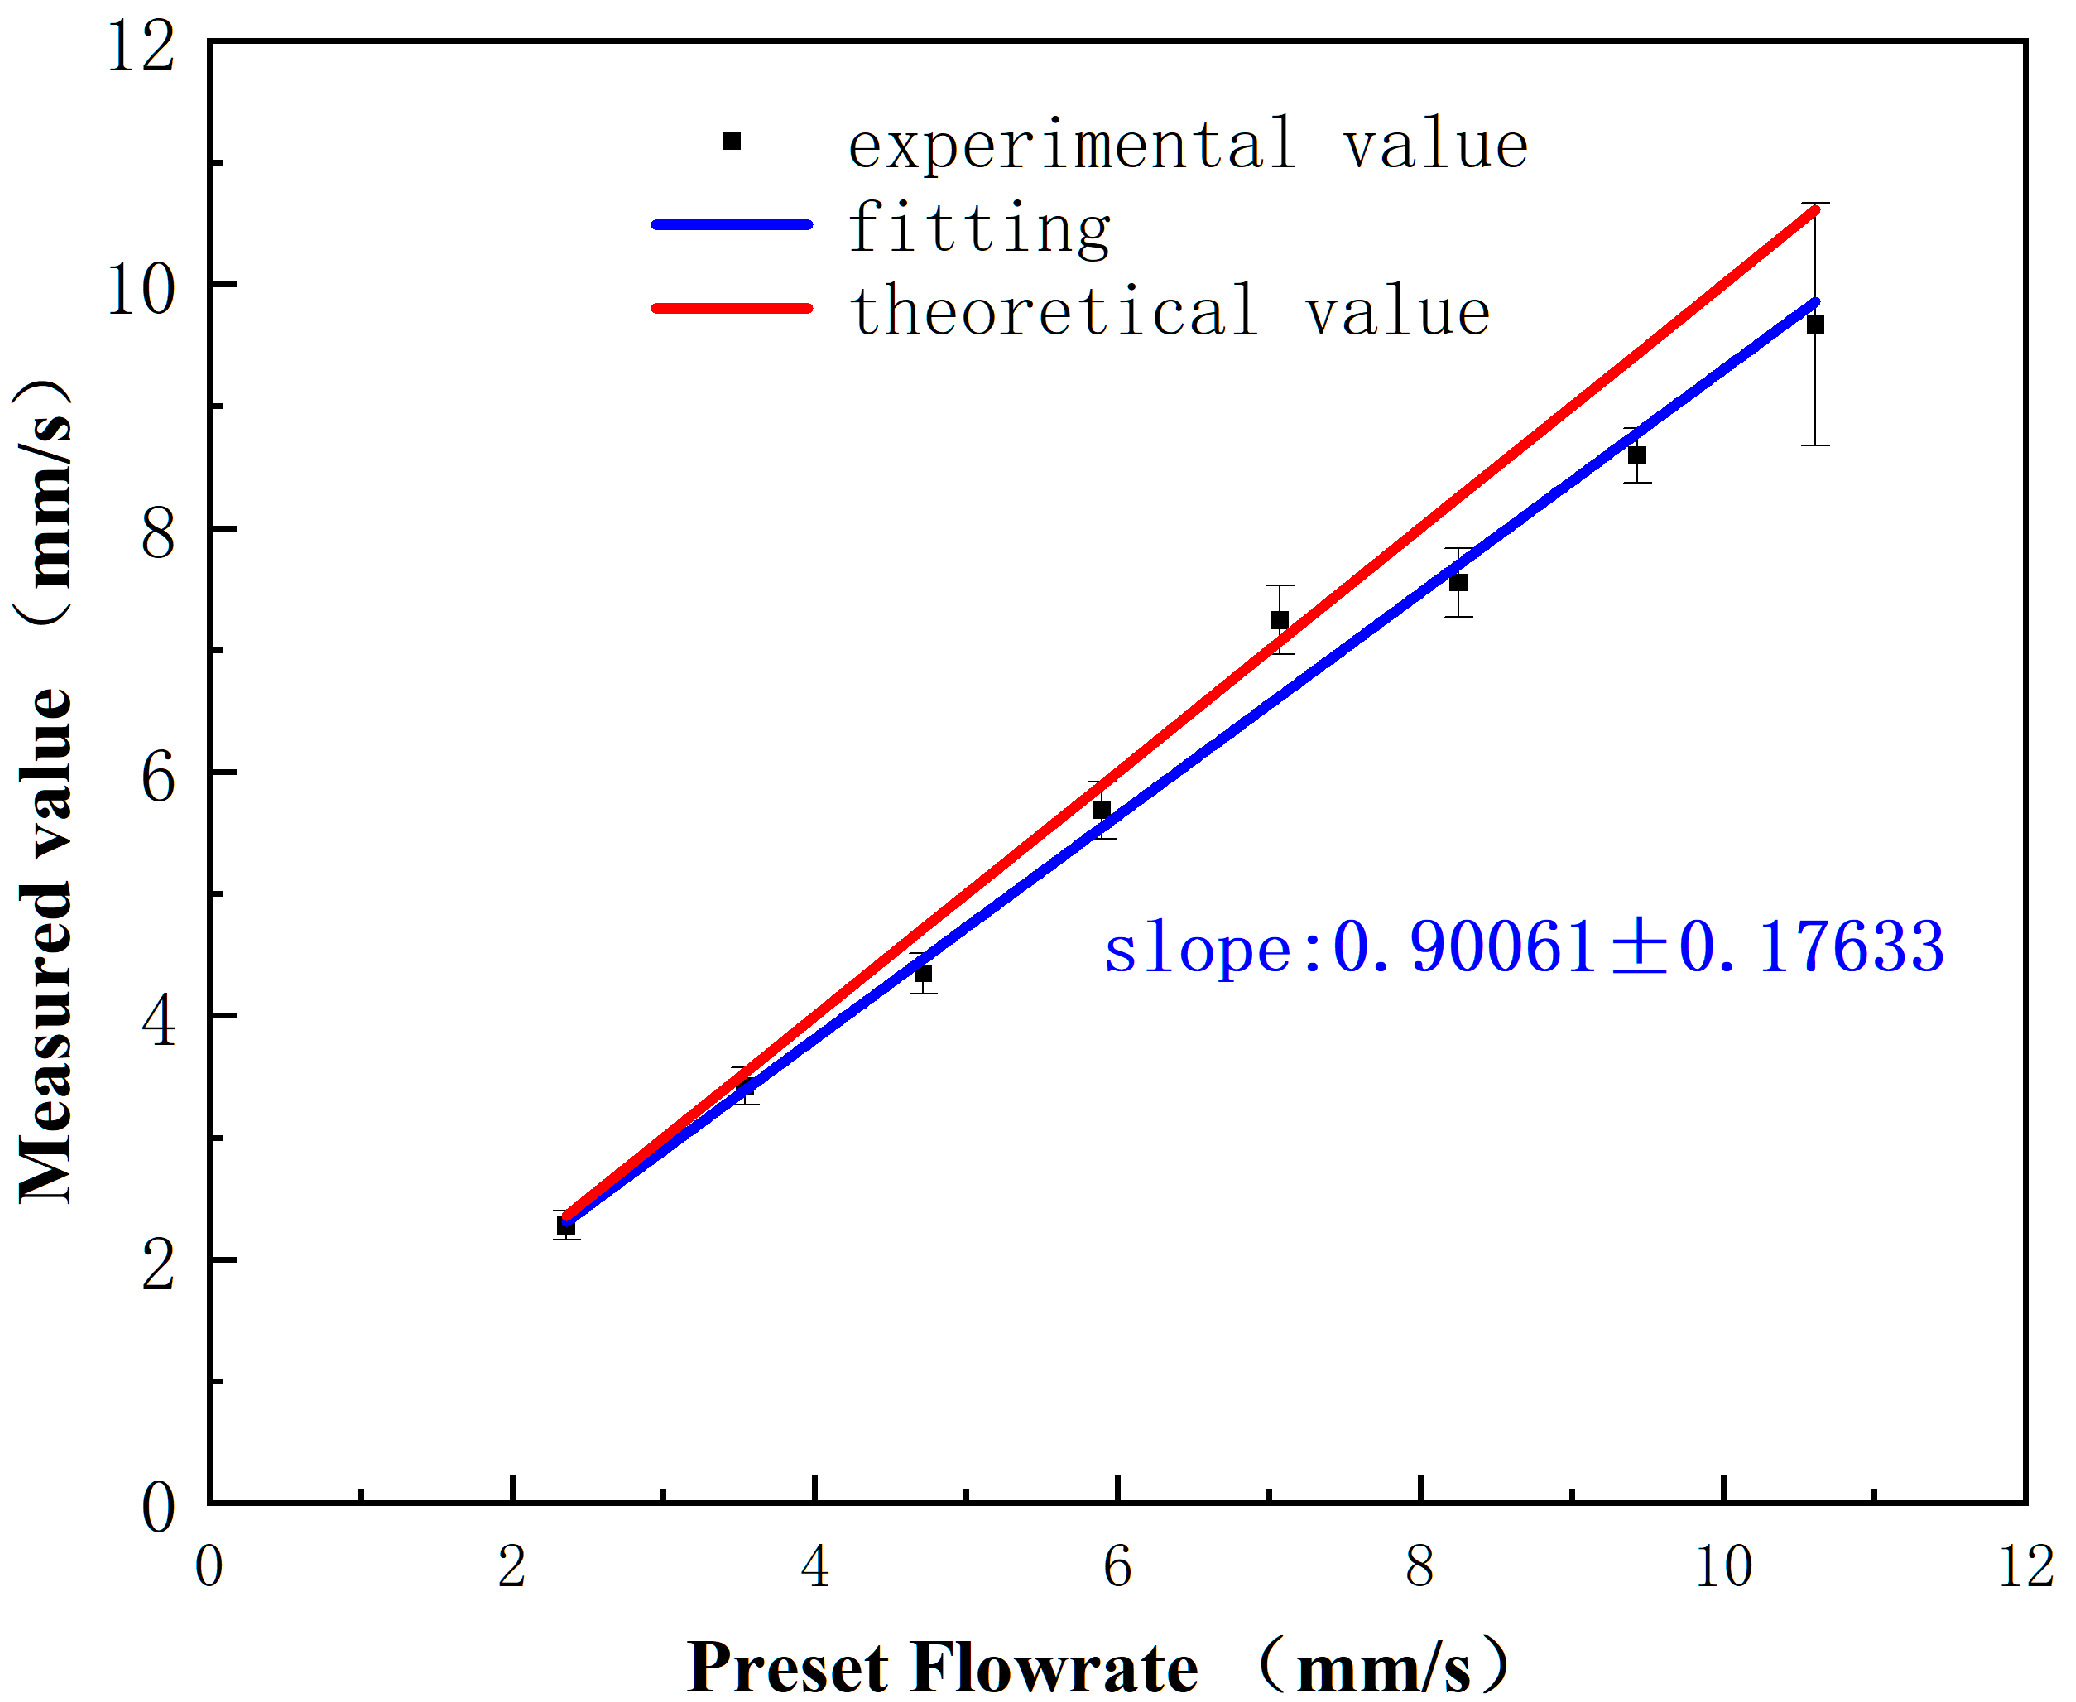
To determine the range of the flow rate measurements yielded by the system, all tests were conducted by changing the fluid flow rate. The flow rate of the infusion pump was controlled within the range of 1 mL/min to 4.5 mL/min, providing corresponding flow rates to allow for the designed measurement device to operate continuously at a certain flow rate for a period of time, measuring the flow rates over multiple cycles. The averages and standard deviations (SDs) of the flow rates within different periods were calculated for each flow rate. The relationship between the measurement results and the set flow rates is shown in Figure 6. The experimental results indicate that the measurement performance of the system is better at lower flow rates, but as the flow rate increases, the measurement error of the system also increases. The uncertainty budget is listed in Table 1. The uncertainty budgets of the devices were calculated with 30+ times test data.

4. Conclusions

Time-of-flight is an important parameter that affects the detection accuracy of the system; therefore, it places high requirements on the measurement of the delay between two signals. The cross-correlation algorithm can accurately obtain the time delay between two signals by analyzing the similarity between two signals. The algorithm not only achieves high measurement accuracy but also has strong anti-interference ability, which greatly reduces the influence of noise on the speed of measurements. In general, medical staff in hospitals rely on their own experience to observe the flow of infusion fluids by counting the number of infusion droplets within a certain period of time. During intravenous infusion treatments, if the drug has been fully injected and the medical staff does not find it in time, the blood in the human body will flow back into the infusion tube, and serious medical accidents will occur if left unresolved for a long period of time. Therefore, for more reliable monitoring to be achieved, the electronic monitoring of infusion therapy is necessary.
With this heat flow sensor, the quality and level of intravenous infusion therapy can be improved, the workload of medical staff can be reduced, and the incidence of medical malpractice can be reduced. Furthermore, this sensor is less expensive to make and can be widely used. We designed a compact and low-cost flow rate sensor device for infusion tubes.

5. Patents

The idea and design of this device is already protected by Chinese (ZL 202210776851.X) and Taiwanese patents. Now, these related applications have been consecutively sent to the patent offices of other countries and areas.

Author Contributions

Conceptualization, H.-C.C. and K.-R.Q.; methodology, Y.X.; validation, Z.W. and Y.X.; resources, R.L.; data curation, X.Z.; writing, X.Z.; writing—review and editing, H.-C.C.; project administration, H.-C.C.; funding acquisition, K.-R.Q. All authors have read and agreed to the published version of the manuscript.

Funding

This research was funded by the Fundamental Research Funds for the Central Universities, China (GrantNo.DUT23YG205).

Data Availability Statement

The raw data supporting the conclusions of this article will be made available by the authors upon request.

Conflicts of Interest

The authors declare no conflicts of interest.

References

  1. Wakasa, Y.; Takada, K.; Yanagita, T. Reinforcing effect as a function of infusion speed in intravenous self-administration of nicotine in rhesus monkeys. Jpn. J. Psychopharmacol. 1995, 15, 53–59. [Google Scholar]
  2. Abreu, M.E.; Bigelow, G.E.; Fleisher, L.; Walsh, S.L. Effect of intravenous injection speed on responses to cocaine and hydromorphone in humans. Psychopharmacology 2001, 154, 76–84. [Google Scholar] [CrossRef]
  3. Kendall, M.J.; Woods, K.L.; Wilkins, M.R.; Worthington, D.J. Responsiveness to beta-adrenergic receptor stimulation: The effects of age are cardioselective. Br. J. Clin. Pharmacol. 1982, 14, 821–826. [Google Scholar] [CrossRef]
  4. Kim, U.R.; Peterfreund, R.A.; Lovich, M.A. Drug Infusion Systems: Technologies, Performance, and Pitfalls. Anesth. Analg. 2017, 124, 1493–1505. [Google Scholar] [CrossRef] [PubMed]
  5. Kohn, L.T.; Corrigan, J.M.; Donaldson, M.S. To Err Is Human: Building a Safer Health System; To Err is Human; Building a Safer Health System: Washington, DC, USA, 2000. [Google Scholar]
  6. Keohane, C.A.; Hayes, J.; Saniuk, C.; Rothschild, J.M.; Bates, D.W. Intravenous Medication Safety and Smart Infusion Systems. J. Infus. Nurs. 2005, 28, 321–328. [Google Scholar] [CrossRef]
  7. Zhang, Q.; Ruan, W.; Wang, H.; Zhou, Y.; Wang, Z.; Liu, L. A self-bended piezoresistive microcantilever flow sensor for low flow rate measurement. Sens. Actuators A Phys. 2010, 158, 273–279. [Google Scholar] [CrossRef]
  8. Nezhad, A.S.; Ghanbari, M.; Agudelo, C.G.; Packirisamy, M.; Bhat, R.B.; Geitmann, A. PDMS Microcantilever-Based Flow Sensor Integration for Lab-on-a-Chip. IEEE Sens. J. 2013, 13, 601–609. [Google Scholar] [CrossRef]
  9. Sadegh Cheri, M.; Latifi, H.; Sadeghi, J.; Salehi Moghaddam, M.; Shahraki, H.; Hajghassem, H. Real-time measurement of flow rate in microfluidic devices using a cantilever-based optofluidic sensor. Analyst 2014, 139, 431–438. [Google Scholar] [CrossRef] [PubMed]
  10. Ruiz, E.; Wenman, M.S. Method for Monitoring Infusion of Intravenous Fluid into a Patient. U.S. Patent No. 4,650,464, 17 March 1987. [Google Scholar]
  11. Chen, F.-G.; Wang, J.-Y.; Chen, S.; Tu, S.-C.; Chen, K.-Y. A Hang-and-Play Intravenous Infusion Monitoring System. In Proceedings of the 2015 3rd International Conference on Applied Computing and Information Technology/2nd International Conference on Computational Science and Intelligence, Okayama, Japan, 12–16 July 2015; pp. 278–281. [Google Scholar]
  12. Chiang, C.-T.; Huang, Y.-C. A Semicylindrical Capacitive Sensor With Interface Circuit Used for Flow Rate Measurement. IEEE Sens. J. 2006, 6, 1564–1570. [Google Scholar] [CrossRef]
  13. Cohen, L.; Rose, R.A. Capacitance-Type Fluid Level Sensor for i.v. and Catheter Bags. U.S. Patent No. 5,135,485, 4 August 1992. [Google Scholar]
  14. Wei, Q.; Lee, J.H.; Seong, K.W.; Kim, M.N.; Cho, J.H. The design of a wireless flexible capacitive sensor detection system to detect liquid level in plastic bag intravenous drip sets. Biomed. Eng. Lett. 2011, 1, 247–253. [Google Scholar] [CrossRef]
  15. Jianwen, C.; Han, Z. Design of intravenous infusion monitoring and alarm system based on wireless communication technology. In Proceedings of the IEEE International Conference Mechatronics & Automation, Beijing, China, 7–10 August 2011. [Google Scholar]
  16. Babu, C.G.; Kumar, J.R.D.; Balaji, V.R.; Priyadharsini, K.; Karthi, S.P. Performance Analysis of Smart Intravenous Infusion Systems using Machine Learning. In Proceedings of the 2021 Smart Technologies, Communication and Robotics (STCR), Sathyamangalam, India, 9–10 October 2021; pp. 1–7. [Google Scholar]
  17. Zhang, Y.; Zhang, S.; Ji, Y.; Wu, G. Intravenous infusion monitoring system based on WSN. In Proceedings of the International Conference on Wireless Sensor Network, Beijing, China, 15–17 November 2010. [Google Scholar]
  18. Deckert, C.; Wilson, L.L. Flow control system. U.S. Patent No. 4,681,563, 21 July 1987. [Google Scholar]
  19. Peng, D.; Cheng, Z.; Chen, H.; Li, Z.; Wei, Z. Development of infusion remote-control system based on wireless data-transfer and ultrasonic acquisition. Chin. Med. Equip. J. 2005, 8, 7–8. [Google Scholar]
  20. Mistry, K.K.; Mahapatra, A. Design and simulation of a thermo transfer type MEMS based micro flow sensor for arterial blood flow measurement. Microsyst. Technol. 2012, 18, 683–692. [Google Scholar] [CrossRef]
  21. Schnell, G. Measurement of flow in infusion systems. Med. Biol. Eng. Comput. 1997, 35, 737–741. [Google Scholar] [CrossRef] [PubMed]
  22. Lee, D.; Kim, J.; Park, Y.; Lee, K.-H.; Kim, C.; Kwon, O.; Kim, S.; Lee, S.-R. Sensitive and reliable thermal micro-flow sensor for a drug infusion system. Sens. Actuators A Phys. 2020, 309, 112033. [Google Scholar] [CrossRef]
  23. Berthet, H.; Jundt, J.; Durivault, J.; Mercier, B.; Angelescu, D. Time-of-flight thermal flowrate sensor for lab-on-chip applications. Lab Chip 2011, 11, 215–223. [Google Scholar] [CrossRef] [PubMed]
  24. Qian, L.; Wang, Y.; Qian, W.; Wang, Y.; Qian, J. A self-powered spiral droplet triboelectric sensor for real-time monitoring of patient infusion in nursing wards. Nanotechnology 2024, 35, 155501. [Google Scholar] [CrossRef] [PubMed]
  25. Ajibola, O.O.E.; Sunday, O.O.; Eyehorua, D.O. Development of automated intravenous blood infusion monitoring system using load cell sensor. J. Appl. Sci. Environ. Manag. 2018, 22, 1557–1561. [Google Scholar] [CrossRef]
  26. Tang, Z.; Tao, Z.; Cao, Y.; Zhang, Q.; Liu, W.; Cao, C. Capacitively coupled contactless conductivity detection-based sensor for liquid level measurement and application to clinical infusion monitoring. Sens. Actuators A Phys. 2024, 367, 115073. [Google Scholar] [CrossRef]
  27. Salmaz, U.; Ahsan, M.A.H.; Islam, T. High-Precision Capacitive Sensors for Intravenous Fluid Monitoring in Hospitals. IEEE Trans. Instrum. Meas. 2021, 70, 1–9. [Google Scholar] [CrossRef]
  28. Lee, J.-K.; Yoon, K.-C.; Kim, K.G. Design of a Remote Monitoring System Based on Optical Sensors to Prevent Medical Accidents during Fluid Treatment. Appl. Sci. 2021, 11, 10124. [Google Scholar] [CrossRef]
  29. Venkatesh, K.; Alagundagi, S.S.; Garg, V.; Pasala, K.; Karia, D.; Arora, M. DripOMeter: An open-source opto-electronic system for intravenous (IV) infusion monitoring. HardwareX 2022, 12, e00345. [Google Scholar] [CrossRef] [PubMed]
  30. Alagundagi, S.S.; Pasala, K.; Arora, M. Opto-electronic system for intravenous infusion monitoring. In Proceedings of the 2018 10th International Conference on Communication Systems & Networks (COMSNETS), Bengaluru, India, 3–7 January 2018; pp. 688–692. [Google Scholar] [CrossRef]
  31. Wang, L. Design and study of a novel spatial pseudodepolarizer. Opt. Tech. 2014, 209–213. (In Chinese) [Google Scholar] [CrossRef]
  32. Cataldo, A.; Cannazza, G.; Giaquinto, N.; Trotta, A.; Andria, G. Development of a remote system for real-time control of intravenous drip infusions. In Proceedings of the 011 IEEE International Symposium on Medical Measurements and Applications (MeMeA), Bari, Italy, 30–31 May 2011; pp. 234–237. [Google Scholar] [CrossRef]
Figure 1. The system of the flow rate sensor inside the infusion tube. PTC, positive temperature coefficient ceramic heater.
Inventions 09 00089 g001
Figure 2. The simplified model of the.
Inventions 09 00089 g002
Figure 3. (a)The block diagram of the flow speed measurement system; (b) the picture of the experimental set up.
Inventions 09 00089 g003
Figure 4. The typical signals from the thermal sensors when the ceramic heater was on for 15 s heating. The data points of the sensor 1 are indicated in black, and sensor 2 is indicated in red. The distance of two thermal sensors was 30.5 mm and the sampling frequency was 10 Hz.
Inventions 09 00089 g004
Figure 5. (a) The continuous operations of the flow rate sensor device. The operation period was 50 s, and the heating duration was 15 s; (b) the relationship of temperature amplitude varying with flow rate.
Inventions 09 00089 g005
Figure 6. The conversion relationship of the flow speed and the flow rate.
Inventions 09 00089 g006
Table 1. The uncertainty values of these devices.
The Uncertainty SourceUncertainty
Repeatability0.013
Reproducibility0.007
Stability0.003
Instrumentation bias0.021
Tables were obtained with 30+ times test data.
Disclaimer/Publisher’s Note: The statements, opinions and data contained in all publications are solely those of the individual author(s) and contributor(s) and not of MDPI and/or the editor(s). MDPI and/or the editor(s) disclaim responsibility for any injury to people or property resulting from any ideas, methods, instructions or products referred to in the content.