
Lactobacillus plantarum Supplementation on Sport Performance, Biomarkers of Intestinal Damage, and Oxidative Stress in Recreational Athletes
 , , , and
Abstract
1. Introduction
2. Methods
2.1. Participants
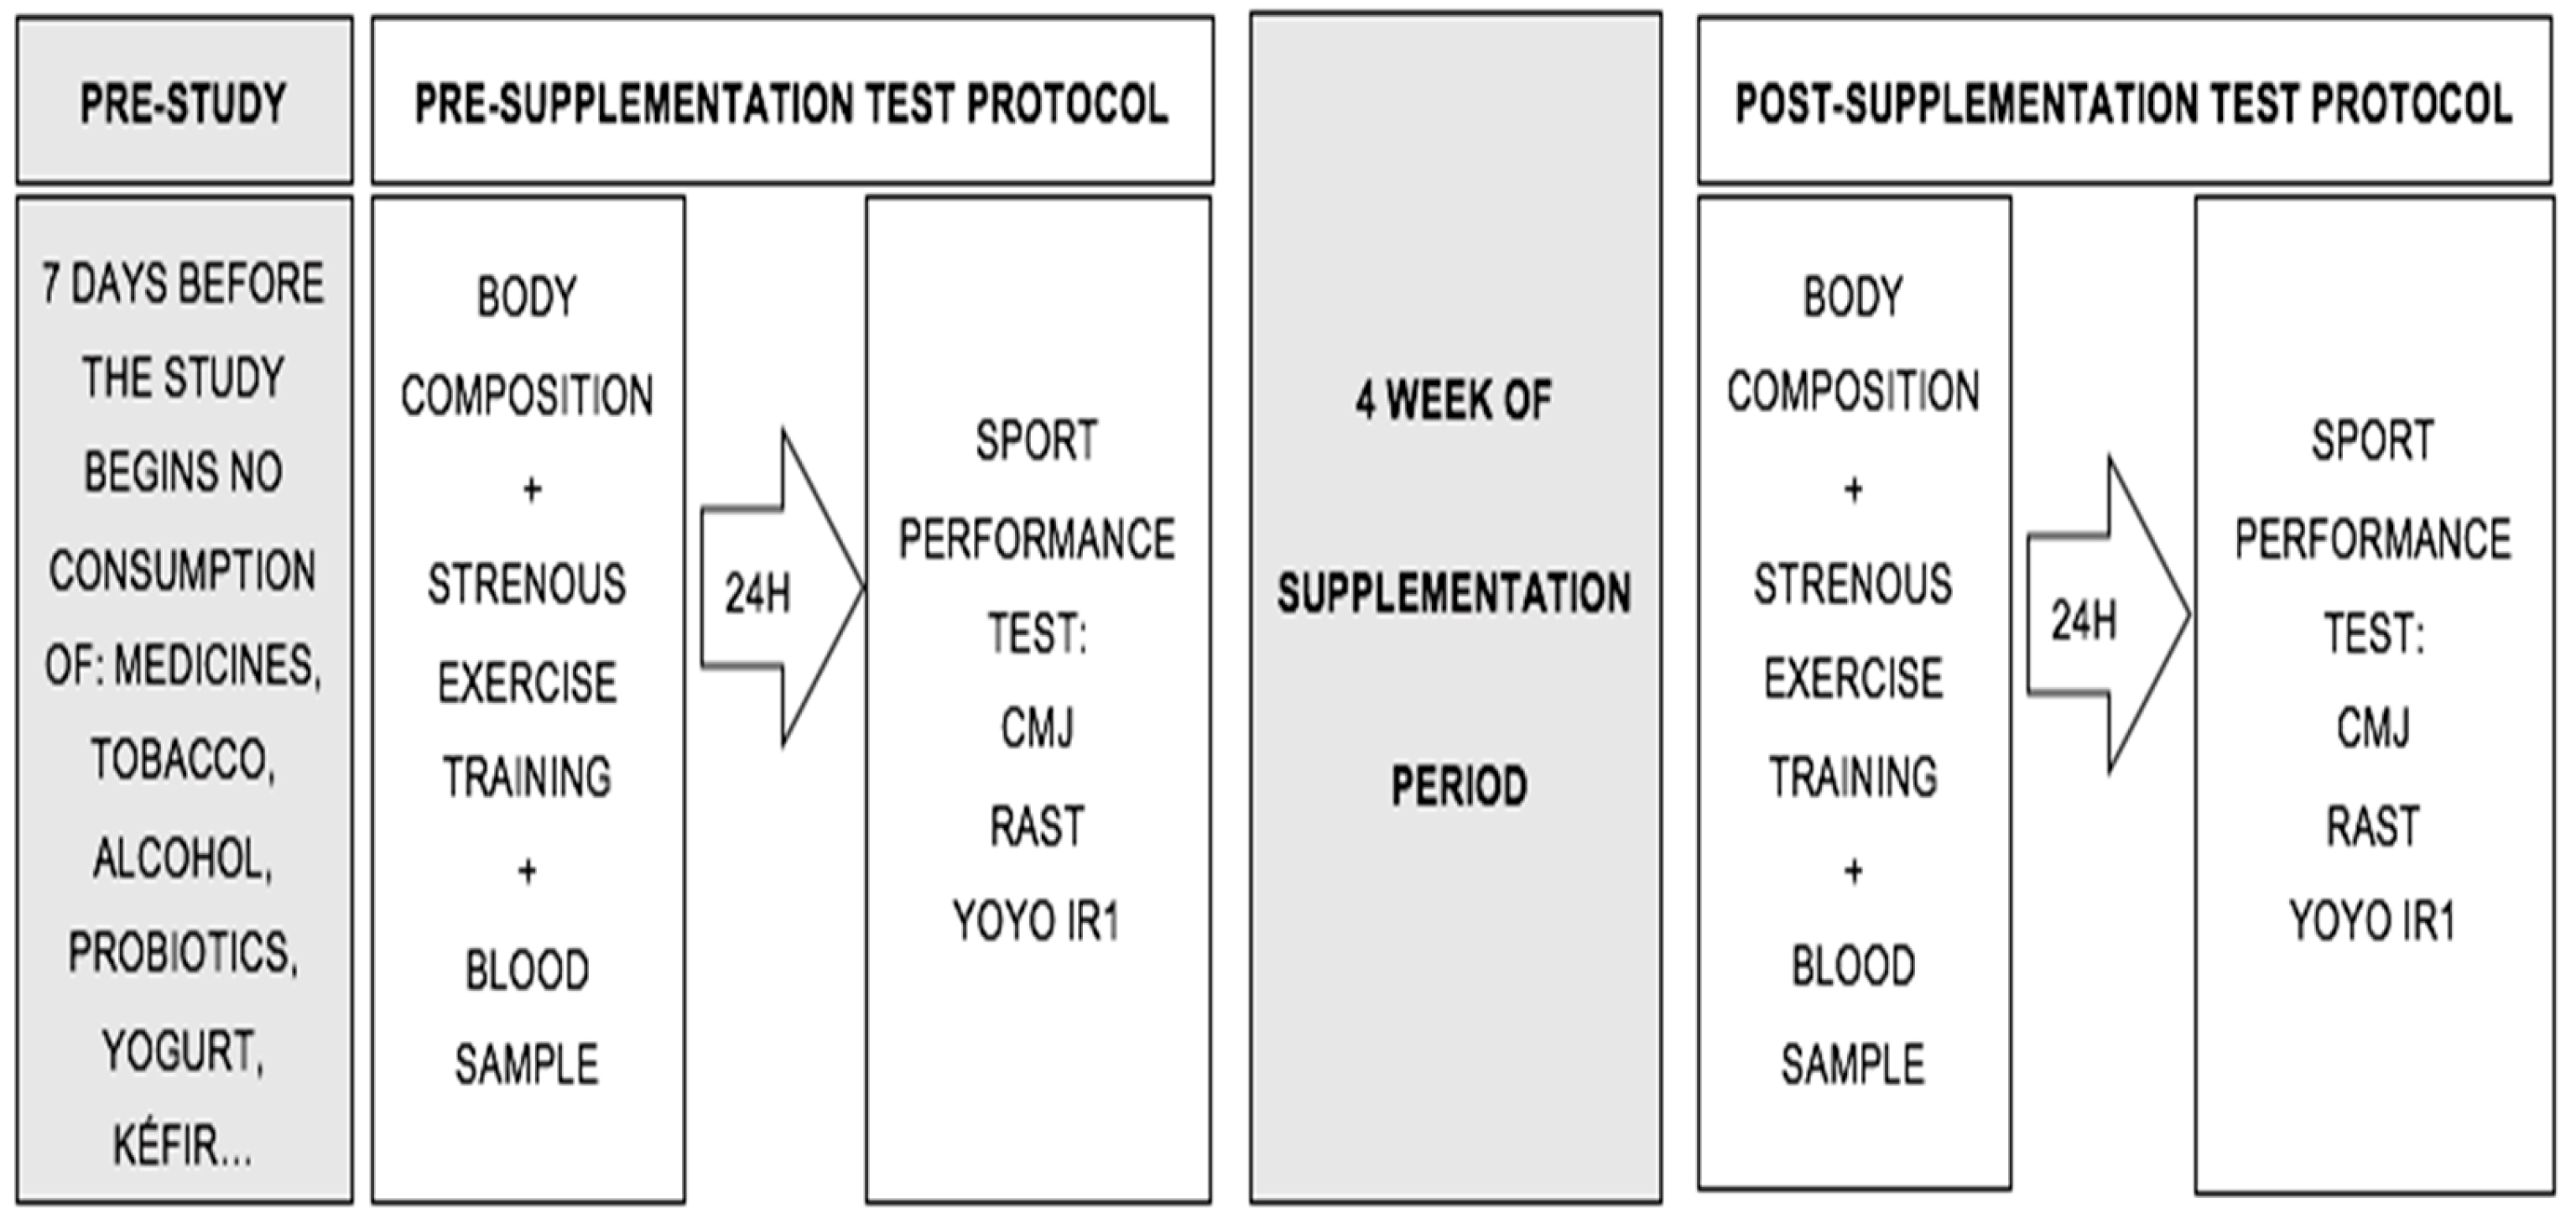
2.2. Study Design
2.3. Experimental Procedures
- Power: CMjs were assessed using an optojump (Microgate®, Bolzano, Italy). Three vertical jumps were performed with hands on the hips at all times, with a 20 s rest period between jumps.
- Anaerobic power: The RAST was conducted and scores were recorded with Witty photocells (Microgate®, Bolzano, Italy). A total of six 35-m sprints, with a 10 s rest period between each sprint, were carried out. This test measures anaerobic short-distance performance and the time (seconds) a person takes to run each sprint.
- Aerobic capacity: The YOYO IR1, involving 40 m of distance running (20 m outward and 20 m return) at increasing speeds (starting speed of 10 km/hour, stipulated by an audio beep), was performed. Between each sprint, there were 10 s of active rest (walking in a given area for 5 m). The test ended when the participants did not reach the distance estimated by the beep or when they decided to stop due to fatigue.
2.4. Blood Samples
2.5. Statistical Analysis
3. Results
4. Discussion
5. Conclusions
Author Contributions
Funding
Institutional Review Board Statement
Informed Consent Statement
Data Availability Statement
Acknowledgments
Conflicts of Interest
References
- Rawson, E.S.; Miles, M.P.; Larson-Meyer, D.E. Dietary supplements for health, adaptation, and recovery in athletes. Int. J. Sport Nutr. Exerc. Metab. 2018, 28, 188–199. [Google Scholar] [CrossRef] [PubMed]
- Pires, W.; Veneroso, C.E.; Wanner, S.P.; Pacheco, D.A.S.; Vaz, G.C.; Amorim, F.T.; Tonoli, C.; Soares, D.D.; Coimbra, C.C. Association between exercise-induced hyperthermia and intestinal permeability: A systematic review. Sport Med. 2017, 47, 1389–1403. [Google Scholar] [CrossRef] [PubMed]
- Jäger, R.; Mohr, A.E.; Carpenter, K.C.; Kerksick, C.M.; Purpura, M.; Moussa, A.; Townsend, J.R.; Lamprecht, M.; West, N.P.; Black, K.; et al. International society of sports nutrition position stand: Probiotics. J. Int. Soc. Sports Nutr. 2019, 16, 62. [Google Scholar] [CrossRef] [PubMed]
- Deaton, C.M.; Marlin, D.J. Exercise-associated oxidative stress. Clin. Tech. Equine Pract. 2003, 2, 278–291. [Google Scholar] [CrossRef]
- Ilhan, N.; Kamanli, A.; Ozmerdivenli, R.; Ilhana, N. Variable effects of exercise intensity on reduced glutathione, thiobarbituric acid reactive substance levels, and glucose concentration. Arch. Med. Res. 2004, 35, 294–300. [Google Scholar] [CrossRef]
- Przewłócka, K.; Folwarski, M.; Kaźmierczak-Siedlecka, K.; Skonieczna-żydecka, K.; Kaczor, J.J. Gut-muscle axisexists and may affect skeletal muscle adaptation to training. Nutrients 2020, 12, 1451. [Google Scholar] [CrossRef]
- Borges, L.D.S.; Dermargos, A.; Junior, E.P.D.S.; Weimann, E.; Lambertucci, R.H.; Hatanaka, E. Melatonin decreases muscular oxidative stress and inflammation induced by strenuous exercise and stimulates growth factor synthesis. J. Pineal Res. 2015, 58, 166–172. [Google Scholar] [CrossRef]
- Claudino, J.G.; Gabbett, T.J.; Bourgeois, F.; Souza, H.D.S.; Miranda, R.C.; Mezêncio, B.; Soncin, R.; Alberto, C.; Filho, C.A.C.; Bottaro, M.; et al. CrossFit overview: Systematic review and meta analysis. Sport. Med. Open 2018, 4, 11. [Google Scholar] [CrossRef]
- van Wijck, K.; Lenaerts, K.; Grootjans, J.; Wijnands, K.A.P.; Poeze, M.; van Loon, L.J.C.; Dejong, C.H.C.; Buurman, W.A. Physiology and pathophysiology of splanchnic hypoperfusion and intestinal injury during exercise: Strategies for evaluation and prevention. Am. J. Physiol. Gastrointest. Liver Physiol. 2012, 303, G155–G168. [Google Scholar] [CrossRef]
- Casey, E.; Mistry, D.J.; MacKnight, J.M. Training room management of medical conditions: Sports gastroenterology. Clin. Sports Med. 2005, 24, 525–540. [Google Scholar] [CrossRef]
- Costa, R.J.S.; Snipe, R.M.J.; Kitic, C.M.; Gibson, P.R. Systematic review: Exercise-induced gastrointestinal syndrome-implications for health and intestinal disease. Aliment. Pharmacol. Ther. 2017, 46, 246–265. [Google Scholar] [CrossRef] [PubMed]
- Hill, C.; Guarner, F.; Reid, G.; Gibson, G.R.; Merenstein, D.J.; Pot, B.; Morelli, L.; Canani, R.B.; Flint, H.J.; Salminen, S.; et al. Expert consensus document: The international scientific association for probiotics and prebiotics consensus statement on the scope and appropriate use of the term probiotic. Nat. Rev. Gastroenterol. Hepatol. 2014, 11, 506–514. [Google Scholar] [CrossRef] [PubMed]
- Di Dio, M.; Calella, P.; Pelullo, C.P.; Liguori, F.; Di Onofrio, V.; Gallè, F.; Liguori, G. Effects of probiotic supplementation on sports performance and performance related features in athletes: A systematic review. Int. J. Environ. Res. Public Health 2023, 20, 2226. [Google Scholar] [CrossRef] [PubMed]
- Pane, M.; Amoruso, A.; Deidda, F.; Graziano, T.; Allesina, S.; Mogna, L. Gut microbiota, probiotics, and sport from clinical evidence to agonistic performance. J. Clin. Gastroenterol. 2018, 52, S46–S49. [Google Scholar] [CrossRef]
- Nichols, A.W. Probiotics and athletic performance: A systematic review. Curr. Sports Med. Rep. 2007, 6, 269–273. [Google Scholar] [CrossRef]
- Aykut, M.N.; Erdoğan, E.N.; Çelik, M.N.; Gürbüz, M. An updated view of the effect of probiotic supplement on sports performance: A detailed review. Curr. Nutr. Rep. 2024, 13, 251–263. [Google Scholar] [CrossRef]
- Coqueiro, A.Y.; de Oliveira Garcia, A.B.; Rogero, M.M.; Tirapegui, J. Probiotic supplementation in sports and physical exercise: Does it present any ergogenic effect? Nutr. Health 2017, 23, 239–249. [Google Scholar] [CrossRef]
- Möller, G.B.; da Cunha Goulart, M.J.V.; Nicoletto, B.B.; Alves, F.D.; Schneider, C.D. Supplementation of probiotics and its effects on physically active individuals and athletes: Systematic review. Int. J. Sport Nutr. Exerc. Metab. 2019, 29, 481–492. [Google Scholar] [CrossRef]
- de Paiva, A.K.F.; De Oliveira, E.P.; Mancini, L.; Paoli, A.; Mota, J.F. Effects of probiotic supplementation on performance of resistance and aerobic exercises: A systematic review. Nutr. Rev. 2013, 81, 153–167. [Google Scholar] [CrossRef]
- Santibañez-Gutierrez, A.; Fernández-Landa, J.; Calleja-González, J.; Delextrat, A.; Mielgo-Ayuso, J. Effects of probiotic supplementation on exercise with predominance of aerobic metabolism in trained population: A systematic review, meta-analysis and meta-regression. Nutrients 2022, 14, 622. [Google Scholar] [CrossRef]
- Santibañez-Gutierrez, A.; Fernández-Landa, J.; Todorovic, N.; Calleja-González, J.; Stojanovic, M.; Mielgo-Ayuso, J. Effects of probiotics on strength and power performance in a trained population: A systematic review and meta-analysis. Kinesiology 2023, 55, 62–67. [Google Scholar] [CrossRef]
- Marttinen, M.; Ala-Jaakkola, R.; Laitila, A.; Lehtinen, M.J. Gut microbiota, probiotics and physical performance in athletes and physically active individuals. Nutrients 2020, 12, 2936. [Google Scholar] [CrossRef] [PubMed]
- Faul, F.; Erdfelder, E.; Lang, A.-G.; Buchner, A. G*Power 3: A flexible statistical power analysis program for the social, behavioral, and biomedical sciences. Behav. Res. Methods 2007, 39, 175–191. [Google Scholar] [CrossRef] [PubMed]
- Huang, W.; Hsu, Y.; Li, H.; Kan, N.; Chen, Y.; Lin, J.-S.; HSU, T.-K.; Tsai, T.-Y.; Chiu, Y.-S.; Huang, C.-C. Effect of Lactobacillus Plantarum TWK10 on improving endurance performance in humans. Chin. J. Physiol. 2018, 61, 163–170. [Google Scholar] [CrossRef]
- Kulich, K.R.; Madisch, A.; Pacini, F.; Piqué, J.M.; Regula, J.; Van Rensburg, C.J.; Ujszászy, L.; Carlsson, J.; Halling, K.; Wiklund, I.K. Reliability and validity of the Gastrointestinal Symptom Rating Scale (GSRS) and Quality of Life in Reflux and Dyspepsia (QOLRAD) questionnaire in dyspepsia: A six-country study. Health Qual. Life Outcomes 2008, 6, 12. [Google Scholar] [CrossRef]
- Gross, K.N.; Harty, P.S.; Krieger, J.M.; Mumford, P.W.; Sunderland, K.L.; Hagele, A.M.; Kerksick, C.M. Milk or kefir, in comparison to water, do not enhance running time-trial performance in endurance master athletes. Nutrients 2024, 16, 717. [Google Scholar] [CrossRef]
- Stewart, A.; Marfell-Jones, M.; Olds, T.; de Ridder, H. International Standards for Anthropometric Assessment, 3rd ed.; ISAK: Lower Hutt, New Zeland, 2011. [Google Scholar]
- Lee, R.C.; Wang, Z.; Heo, M.; Ross, R.; Janssen, I.; Heymisfield, S.B. Total-body skeletal muscle mass: Development and cross-validation of anthropometric prediction models. Am. J. Clin. Nutr. 2000, 72, 796–803. [Google Scholar] [CrossRef]
- Carter, J.E.L. Body composition of Montreal Olympic athletes. In The Physical Structure of Olympic Athletes—Part I—The Montreal Olympic Games Anthropometrical Project; Karger: Basel, Switzerland, 1982; pp. 107–116. ISBN 978-3-8055-3502-1. [Google Scholar]
- Stevanovic, V.B.; Jelic, M.B.; Milanovic, S.D.; Filipovic, S.R.; Mijic, M.J.; Stojanovic, M.D.M. Sport-specific warm-up attenuates static stretching- induced negative effects on vertical jump but not neuromuscular excitability in basketball players. J. Sport. Sci. Med. 2019, 18, 282–289. [Google Scholar]
- Borg, G.A. Psychophysical bases of perceived exertion. Med. Sci. Sports Exerc. 1982, 14, 377–381. [Google Scholar] [CrossRef]
- Laurent, C.M.; Green, J.M.; Bishop, P.A.; Sjökvist, J.; Schumacker, R.E.; Richardson, M.T.; Curtner-Smith, M. A practical approach to monitoring recovery: Development of a perceived recovery status scale. J. Strength Cond. Res. 2011, 25, 620–628. [Google Scholar] [CrossRef]
- Mesquita, C.S.; Oliveira, R.; Bento, F.; Geraldo, D.; Rodrigues, J.V.; Marcos, J.C. Simplified 2,4-dinitrophenylhydrazine spectrophotometric assay for quantification of carbonyls in oxidized proteins. Anal. Biochem. 2014, 458, 60–71. [Google Scholar] [CrossRef] [PubMed]
- Harma, M.; Harma, M.; Erel, O. Measurement of the total antioxidant response in preeclampsia with a novel automated method. Eur. J. Obstet. Gynecol. Reprod. Biol. 2005, 118, 47–51. [Google Scholar] [CrossRef] [PubMed]
- Ferguson, C.J. An effect size primer: A guide for clinicians and researchers. Prof. Psychol. Res. Pract. 2009, 40, 532–538. [Google Scholar] [CrossRef]
- Cohen, J. Statistical Power Analysis for the Behavioral Sciences, 2nd ed.; Lawrence Earlbaum Associates: Hillsdale, NJ, USA, 1988; ISBN 1483276481. [Google Scholar]
- Markowiak-Kopeć, P.; Śliżewska, K. The effect of probiotics on the production of short-chain fatty acids by human intestinal microbiome. Nutrients 2020, 12, 1107. [Google Scholar] [CrossRef]
- Den Besten, G.; Van Eunen, K.; Groen, A.K.; Venema, K.; Reijngoud, D.J.; Bakker, B.M. The role of short-chain fatty acids in the interplay between diet, gut microbiota, and host energy metabolism. J. Lipid Res. 2013, 54, 2325–2340. [Google Scholar] [CrossRef]
- Huang, W.-C.; Pan, C.-H.; Wei, C.-C.; Huang, H.-Y. Lactobacillus plantarum ps128 improves physiological adaptation and performance in triathletes through gut microbiota modulation. Nutrients 2020, 12, 2315. [Google Scholar] [CrossRef]
- Huang, W.-C.; Wei, C.-C.; Huang, C.-C.; Chen, W.-L.; Huang, H.-Y. The beneficial effects of Lactobacillus plantarum PS128 on high-intensity, exercise-induced oxidative stress, inflammation, and performance in triathletes. Nutrients 2019, 11, E353. [Google Scholar] [CrossRef]
- Fu, S.-K.; Tseng, W.-C.; Tseng, K.-W.; Lai, C.-C.; Tsai, Y.-C.; Tai, H.-L.; Hsu, C.-C. Effect of daily oral Lactobacillus plantarum PS128 on exercise capacity recovery after a half-marathon. Nutrients 2021, 13, 4023. [Google Scholar] [CrossRef]
- Portincasa, P.; Bonfrate, L.; Vacca, M.; De Angelis, M.; Farella, I.; Lanza, E.; Khalil, M.; Wang, D.Q.-H.; Sperandio, M.; Di Ciaula, A. Gut microbiota and short chain fatty acids: Implications in glucose homeostasis. Int. J. Mol. Sci. 2022, 23, 1105. [Google Scholar] [CrossRef]
- Leung, C.; Rivera, L.; Furness, J.B.; Angus, P.W. The role of the gut microbiota in NAFLD. Nat. Rev. Gastroenterol. Hepatol. 2016, 13, 412–425. [Google Scholar] [CrossRef]
- Brüssow, H.; Parkinson, S.J. You are what you eat. Nat. Biotechnol. 2014, 32, 243–245. [Google Scholar] [CrossRef] [PubMed]
- Subramanian, S.; Goodspeed, L.; Wang, S.; Kim, J.; Zeng, L.; Ioannou, G.N.; Haigh, W.G.; Yeh, M.M.; Kowdley, K.V.; O’Brien, K.D.; et al. Dietary cholesterol exacerbates hepatic steatosis and inflammation in obese. J. Lipid Res. 2011, 52, 1626–1635. [Google Scholar] [CrossRef]
- Bloemen, J.G.; Damink, S.W.M.O.; Venema, K.; Buurman, W.A.; Jalan, R.; Dejong, C.H.C. Short chain fatty acids exchange: Is the cirrhotic, dysfunctional liver still able to clear them? Clin. Nutr. 2010, 29, 365–369. [Google Scholar] [CrossRef] [PubMed]
- Morrison, D.J.; Preston, T. Formation of short chain fatty acids by the gut microbiota and their impact on human metabolism. Gut Microbes 2016, 7, 189–200. [Google Scholar] [CrossRef] [PubMed]
- Jeukendrup, A.E.; Vet-Joop, K.; Sturk, A.; Stegen, J.H.; Senden, J.; Saris, W.H.; Wagenmakers, A.J. Relationship between gastro-intestinal complaints and endotoxaemia, cytokine release and the acute-phase reaction during and after a long-distance triathlon in highly trained men. Clin. Sci. 2000, 98, 47–55. [Google Scholar] [CrossRef]
- Winrow, V.R.; Winyard, P.G.; Morris, C.J.; Blake, D.R. Free radicals in inflammation: Second messengers and mediators of tissue destruction. Br. Med. Bull. 1993, 49, 506–522. [Google Scholar] [CrossRef]
- Yuan, X.; Wang, L.; Bhat, O.M.; Lohner, H.; Li, P.-L. Differential effects of short chain fatty acids on endothelial Nlrp3 inflammasome activation and neointima formation: Antioxidant action of butyrate. Redox Biol. 2018, 16, 21–31. [Google Scholar] [CrossRef]
- Sánchez Macarro, M.; Ávila-Gandía, V.; Pérez-Piñero, S.; Cánovas, F.; García-Muñoz, A.M.; Abellán-Ruiz, M.S.; Victoria-Montesinos, D.; Luque-Rubia, A.J.; Climent, E.; Genovés, S.; et al. Antioxidant effect of a probiotic product on a model of oxidative stress Induced by high-intensity and duration physical exercise. Antioxidants 2021, 10, 323. [Google Scholar] [CrossRef]
- Bermudez-Brito, M.; Plaza-Díaz, J.; Muñoz-Quezada, S.; Gómez-Llorente, C.; Gil, A. Probiotic mechanisms of action. Ann. Nutr. Metab. 2012, 61, 160–174. [Google Scholar] [CrossRef]
- Martarelli, D.; Verdenelli, M.C.; Scuri, S.; Cocchioni, M.; Silvi, S.; Cecchini, C.; Pompei, P. Effect of a probiotic intake on oxidant and antioxidant parameters in plasma of athletes during intense exercise training. Curr. Microbiol. 2011, 62, 1689–1696. [Google Scholar] [CrossRef]
- Zamani, B.; Sheikhi, A.; Namazi, N.; Larijani, B.; Azadbakht, L. The effects of supplementation with probiotic on biomarkers of oxidative stress in adult subjects: A systematic review and meta-analysis of randomized trials. Probiotics Antimicrob. Proteins 2020, 12, 102–111. [Google Scholar] [CrossRef]

| Variable | Placebo Group (n = 10) Mean ± SD | Probiotic Group (n = 12) Mean ± SD |
|---|---|---|
| Age (years) | 32 ± 5 | 33 ± 5 |
| Height (m) | 1.7 ± 0.1 | 1.7 ± 0.1 |
| Body mass (kg) | 71.8 ± 10.3 | 72.4 ± 10.8 |
| BMI (kg/m2) | 24.1 ± 2.1 | 24.1 ± 2.0 |
| 95% CI for Effect Size | ||||||
|---|---|---|---|---|---|---|
| Variables | Pre (Mean ± SD) | Post (Mean ± SD) | p | Effect Size | Lower | Upper |
| Body mass (kg) | ||||||
| Placebo (n = 10) | 71.9 ± 10.3 | 72.2 ± 9.9 | 0.906 | 0.236 | 0.735 | 0.429 |
| Probiotic (n = 12) | 72.4 ± 10.8 | 72.9 ± 10.8 | 1.000 | −0.410 | 0.792 | 0.202 |
| BMI (kg/m2) | ||||||
| Placebo (n = 10) | 24.1 ± 2.1 | 24.1 ± 2.3 | 0.904 | 0.039 | 0.582 | 0.658 |
| Probiotic (n = 12) | 24.1 ± 2.0 | 24.3 ± 1.9 | 0.526 | 0.410 | 0.792 | 0.202 |
| BF% | ||||||
| Placebo (n = 10) | 12.2 ± 3.4 | 12.2 ± 3.6 | 0.873 | 0.052 | 0.671 | 0.570 |
| Probiotic (n = 12) | 14.5 ± 3.8 | 14.4 ± 3.7 | 0.445 | 0.229 | 0.350 | 0.798 |
| Muscle mass% | ||||||
| Placebo (n = 10) | 41.7 ± 3.1 | 42.0 ± 2.9 | 0.530 | 0.206 | 0.828 | 0.426 |
| Probiotic (n = 12) | 39.3 ± 5.2 | 39.4 ± 4.7 | 0.879 | 0.045 | 0.610 | 0.522 |
| 95% CI for Effect Size | ||||||
|---|---|---|---|---|---|---|
| Variables | Pre (Mean ± SD) | Post (Mean ± SD) | p | Effect Size | Lower | Upper |
| CMJ (cm) | ||||||
| Placebo (n = 10) | 32.5 ± 7.4 | 32.4 ± 7.4 | 0.864 | 0.056 | 0.566 | 0.674 |
| Probiotic (n = 12) | 33.3 ± 8.5 | 33.9 ± 8.9 | 0.085 | 0.546 | 1.144 | 0.074 |
| RAST (s) | ||||||
| Placebo (n = 10) | 6.1 ± 0.6 | 6.1 ± 0.6 | 0.693 | 0.129 | 0.497 | 0.748 |
| Probiotic (n = 12) | 6.2 ± 0.7 | 6.2 ± 0.6 | 0.970 | 0.011 | 0.555 | 0.577 |
| YOYO IR1 (m) | ||||||
| Placebo (n = 10) | 1080.0 ± 432.9 | 1200.0 ± 545.2 | 0.083 | 0.636 | 0.896 | 0.053 |
| Probiotic (n = 12) | 883.3 ± 436.7 | 1066.7 ± 502.9 | 0.003 * | 1.083 | 1.789 | 0.347 |
| RPE | ||||||
| Placebo (n = 10) | 6.7 ± 2.1 | 7.6 ± 0.8 | 0.171 | 0.470 | 1.115 | 0.197 |
| Probiotic (n = 12) | 6.7 ± 2.1 | 7.4 ± 0.5 | 0.564 | 0.172 | 0.738 | 0.402 |
| Recovery scale | ||||||
| Placebo (n = 10) | 7.7 ± 1.5 | 6.6 ± 2.6 | 0.116 | 0.551 | 0.131 | 1.206 |
| Probiotic (n = 12) | 7.1 ± 1.9 | 6.6 ± 1.8 | 0.551 | 0.538 | 0.846 | 0.039 |
| GI survey | ||||||
| Placebo (n = 10) | 24.3 ± 7.7 | 27.4 ± 9.9 | 0.304 | 0.345 | 0.303 | 0.975 |
| Probiotic (n = 12) | 26.7 ± 11.4 | 23.7 ± 10.1 | 0.286 | 0.324 | 0.898 | 0.264 |
| 95% CI for Effect Size | ||||||
|---|---|---|---|---|---|---|
| Variables | Pre (Mean ± SD) | Post (Mean ± SD) | p | Effect Size | Lower | Upper |
| IFABP | ||||||
| Placebo (n = 10) | 565.1 ± 305.7 | 497.1 ± 393.3 | 0.587 | 0.178 | 0.452 | 0.798 |
| Probiotic (n = 12) | 680.0 ± 321.1 | 535.9 ± 369.8 | 0.268 | 0.337 | 0.253 | 0.912 |
| PC | ||||||
| Placebo (n = 10) | 0.9 ± 0.3 | 0.9 ± 0.3 | 0.455 | 0.247 | 0.870 | 0.390 |
| Probiotic (n = 12) | 0.9 ± 0.2 | 1.00 ± 0.16 | 0.465 | 0.219 | 0.787 | 0.359 |
| TAC | ||||||
| Placebo (n = 10) | 1108.2 ± 518.8 | 809.0 ± 374.7 | 0.048 * | 0.723 | 0.006 | 1.409 |
| Probiotic (n = 12) | 975.0 ± 332.0 | 696.1 ± 423.7 | 0.098 | 0.523 | 0.093 | 1.118 |
| Total proteins | ||||||
| Placebo (n = 10) | 7.2 ± 0.9 | 7.5 ± 0.7 | 0.460 | 0.244 | 0.867 | 0.392 |
| Probiotic (n = 12) | 7.5 ± 1.0 | 7.1 ± 0.9 | 0.419 | 0.243 | 0.337 | 0.812 |
| GSSG | ||||||
| Placebo (n = 10) | 374.3 ± 130.3 | 287.4 ± 131.9 | 0.125 | 0.536 | 0.143 | 1.189 |
| Probiotic (n = 12) | 319.1 ± 106.9 | 333.9 ± 139.9 | 0.754 | 0.538 | 0.658 | 0.477 |
| GSH | ||||||
| Placebo (n = 10) | 1337 ± 351.1 | 1254 ± 340.3 | 0.586 | 0.179 | 0.451 | 0.799 |
| Probiotic (n = 12) | 1206 ± 374.9 | 1105 ± 261.6 | 0.460 | 0.221 | 0.357 | 0.789 |
| Catalase | ||||||
| Placebo (n = 10) | 0.03 ± 0.023 | 0.04 ± 0.33 | 0.131 | 0.526 | 1.178 | 0.151 |
| Probiotic (n = 12) | 0.04 ± 0.04 | 0.06 ± 0.11 | 0.791 | 0.103 | 0.491 | 0.631 |
Disclaimer/Publisher’s Note: The statements, opinions and data contained in all publications are solely those of the individual author(s) and contributor(s) and not of MDPI and/or the editor(s). MDPI and/or the editor(s) disclaim responsibility for any injury to people or property resulting from any ideas, methods, instructions or products referred to in the content. |
© 2025 by the authors. Licensee MDPI, Basel, Switzerland. This article is an open access article distributed under the terms and conditions of the Creative Commons Attribution (CC BY) license (https://creativecommons.org/licenses/by/4.0/).
Share and Cite
Santibañez-Gutierrez, A.; Fernández-Landa, J.; Busto, N.; Todorovic, N.; Calleja-González, J.; Mielgo-Ayuso, J. Lactobacillus plantarum Supplementation on Sport Performance, Biomarkers of Intestinal Damage, and Oxidative Stress in Recreational Athletes. J. Funct. Morphol. Kinesiol. 2025, 10, 131. https://doi.org/10.3390/jfmk10020131
Santibañez-Gutierrez A, Fernández-Landa J, Busto N, Todorovic N, Calleja-González J, Mielgo-Ayuso J. Lactobacillus plantarum Supplementation on Sport Performance, Biomarkers of Intestinal Damage, and Oxidative Stress in Recreational Athletes. Journal of Functional Morphology and Kinesiology. 2025; 10(2):131. https://doi.org/10.3390/jfmk10020131
Chicago/Turabian StyleSantibañez-Gutierrez, Asier, Julen Fernández-Landa, Natalia Busto, Nikola Todorovic, Julio Calleja-González, and Juan Mielgo-Ayuso. 2025. "Lactobacillus plantarum Supplementation on Sport Performance, Biomarkers of Intestinal Damage, and Oxidative Stress in Recreational Athletes" Journal of Functional Morphology and Kinesiology 10, no. 2: 131. https://doi.org/10.3390/jfmk10020131
APA StyleSantibañez-Gutierrez, A., Fernández-Landa, J., Busto, N., Todorovic, N., Calleja-González, J., & Mielgo-Ayuso, J. (2025). Lactobacillus plantarum Supplementation on Sport Performance, Biomarkers of Intestinal Damage, and Oxidative Stress in Recreational Athletes. Journal of Functional Morphology and Kinesiology, 10(2), 131. https://doi.org/10.3390/jfmk10020131