
Muscle Ultrasound Echo Intensity and Fiber Type Composition in Young Females

 ,
,  , and
, and
Abstract
1. Introduction
2. Materials and Methods
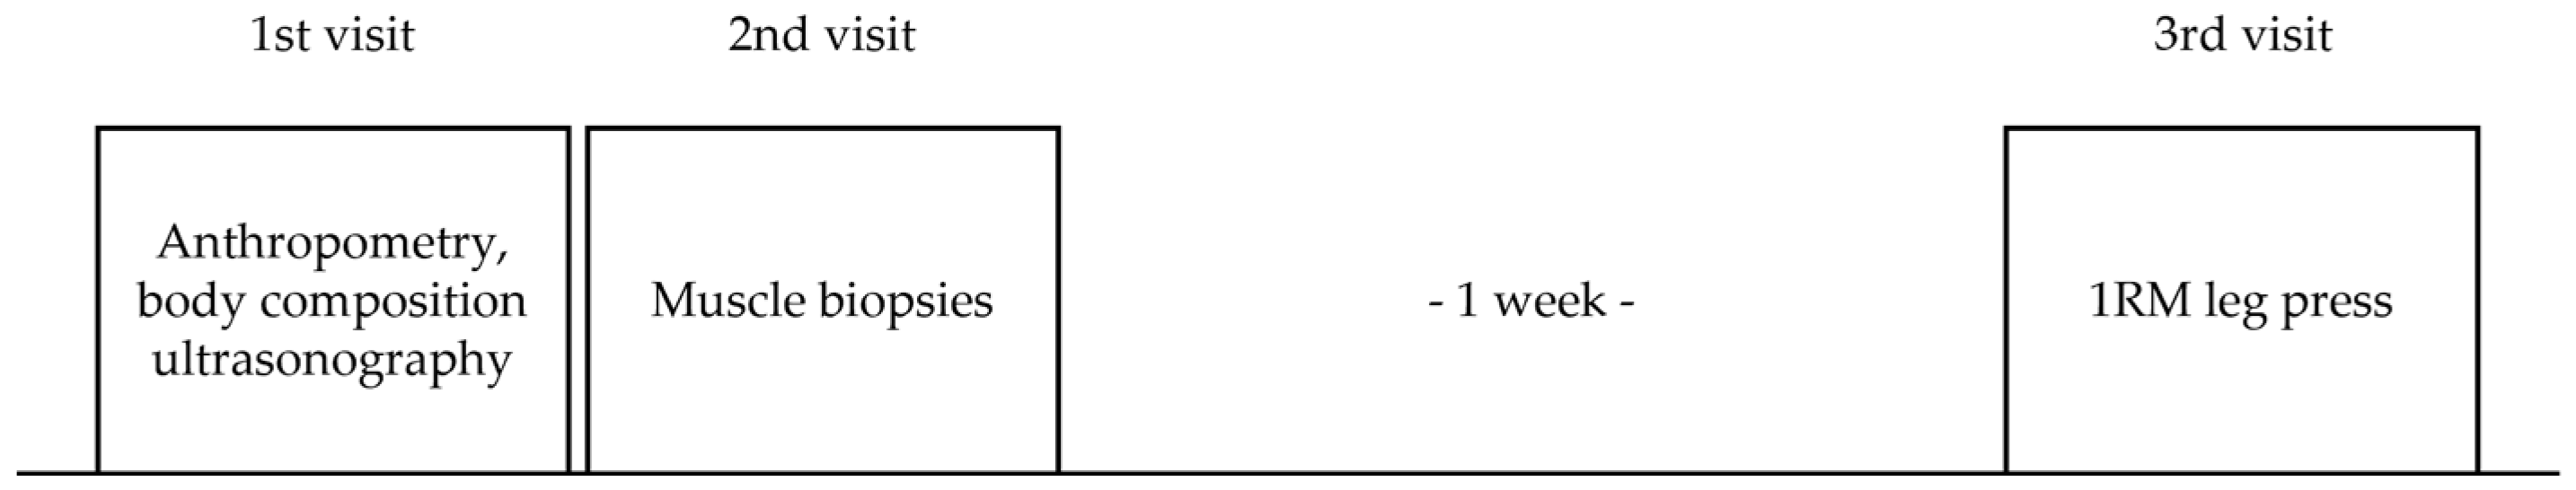
2.1. Experimental Approach
2.2. Participants
2.3. Body Composition
2.4. Ultrasonography
2.5. Muscle Fiber Type Composition
2.6. 1-RM Strength
2.7. Statistical Analysis
3. Results
4. Discussion
Limitations
5. Conclusions
Practical Applications
Author Contributions
Funding
Institutional Review Board Statement
Informed Consent Statement
Data Availability Statement
Acknowledgments
Conflicts of Interest
References
- Blue, M.N.M.; Smith-Ryan, A.E.; Trexler, E.T.; Hirsch, K.R. The effects of high intensity interval training on muscle size and quality in overweight and obese adults. J. Sci. Med. Sport 2018, 21, 207–212. [Google Scholar] [CrossRef] [PubMed]
- Yoshiko, A.; Kaji, T.; Sugiyama, H.; Koike, T.; Oshida, Y.; Akima, H. Twenty-four months’ resistance and endurance training improves muscle size and physical functions but not muscle quality in older adults requiring long-term care. J. Nutr. Health Aging 2019, 23, 564–570. [Google Scholar] [CrossRef] [PubMed]
- Scanlon, T.C.; Fragala, M.S.; Stout, J.R.; Emerson, N.S.; Beyer, K.S.; Oliveira, L.P.; Hoffman, J.R. Muscle architecture and strength: Adaptations to short-term resistance training in older adults: Muscle adaptations. Muscle Nerve 2014, 49, 584–592. [Google Scholar] [CrossRef] [PubMed]
- Pillen, S.; Tak, R.O.; Zwarts, M.J.; Lammens, M.M.Y.; Verrijp, K.N.; Arts, I.M.P.; van der Laak, J.A.; Hoogerbrugge, P.M.; van Engelen, B.G.M.; Verrips, A. Skeletal muscle ultrasound: Correlation between fibrous tissue and echo intensity. Ultrasound Med. Biol. 2009, 35, 443–446. [Google Scholar] [CrossRef] [PubMed]
- Nosaka, K.; Sakamoto, K. Effect of elbow joint angle on the magnitude of muscle damage to the elbow flexors. Med. Sci. Sports Exerc. 2001, 33, 22–29. [Google Scholar] [CrossRef] [PubMed]
- Chen, T.C.; Chen, H.-L.; Lin, M.-J.; Yu, H.-I.; Nosaka, K. Contralateral repeated bout effect of eccentric exercise of the elbow flexors. Med. Sci. Sports Exerc. 2016, 48, 2030–2039. [Google Scholar] [CrossRef] [PubMed]
- Medeiros, D.M.; Mantovani, R.F.; Lima, C.S. Effects of low intensity pulsed ultrasound on muscle thickness and echo intensity of the elbow flexors following exercise-induced muscle damage. Sport Sci. Health 2017, 13, 365–371. [Google Scholar] [CrossRef]
- Wong, V.; Spitz, R.W.; Bell, Z.W.; Viana, R.B.; Chatakondi, R.N.; Abe, T.; Loenneke, J.P. Exercise induced changes in echo intensity within the muscle: A brief review. J. Ultrasound 2020, 23, 457–472. [Google Scholar] [CrossRef] [PubMed]
- Nieman, D.C.; Shanely, R.A.; Zwetsloot, K.A.; Meaney, M.P.; Farris, G.E. Ultrasonic assessment of exercise-induced change in skeletal muscle glycogen content. BMC Sports Sci. Med. Rehabil. 2015, 7, 9. [Google Scholar] [CrossRef]
- Routledge, H.E.; Bradley, W.J.; Shepherd, S.O.; Cocks, M.; Erskine, R.M.; Close, G.L.; Morton, J.P. Ultrasound does not detect acute changes in glycogen in vastus lateralis of man. Med. Sci. Sports Exerc. 2019, 51, 2286–2293. [Google Scholar] [CrossRef]
- Ikezoe, T.; Kobayashi, T.; Nakamura, M.; Ichihashi, N. Effects of Low-Load, Higher-Repetition vs. High-Load, Lower-Repetition Resistance Training Not Performed to Failure on Muscle Strength, Mass, and Echo Intensity in Healthy Young Men: A Time-Course Study. J. Strength Cond. Res. 2020, 34, 3439–3445. [Google Scholar] [CrossRef] [PubMed]
- Radaelli, R.; Botton, C.E.; Wilhelm, E.N.; Bottaro, M.; Brown, L.E.; Lacerda, F.; Gaya, A.; Moraes, K.; Peruzzolo, A.; Pinto, R.S. Time course of low- and high-volume strength training on neuromuscular adaptations and muscle quality in older women. Age 2014, 36, 881–892. [Google Scholar] [CrossRef] [PubMed]
- Neto Müller, J.; Lanferdini, F.J.; Passos Karam, J.Y.; de Brito Fontana, H. Examination of the confounding effect of subcutaneous fat on muscle echo intensity utilizing exogenous fat. Appl. Physiol. Nutr. Metab. 2021, 46, 473–478. [Google Scholar] [CrossRef] [PubMed]
- Stock, M.S.; Thompson, B.J. Echo intensity as an indicator of skeletal muscle quality: Applications, methodology, and future directions. Eur. J. Appl. Physiol. 2021, 121, 369–380. [Google Scholar] [CrossRef] [PubMed]
- Schiaffino, S.; Reggiani, C. Fiber types in mammalian skeletal muscles. Physiol. Rev. 2011, 91, 1447–1531. [Google Scholar] [CrossRef] [PubMed]
- Payne, C.M.; Stern, L.Z.; Curless, R.G.; Hannapel, L.K. Ultrastructural fiber typing in normal and diseased human muscle. J. Neurol. Sci. 1975, 25, 99–108. [Google Scholar] [CrossRef] [PubMed]
- Johnson, M.A.; Polgar, J.; Weightman, D.; Appleton, D. Data on the distribution of fibre types in thirty-six human muscles: An autopsy study. J. Neurol. Sci. 1973, 18, 111–129. [Google Scholar] [CrossRef]
- Staron, R.S.; Hagerman, F.C.; Hikida, R.S.; Murray, T.F.; Hostler, D.P.; Crill, M.T.; Ragg, K.E.; Toma, K. Fiber type composition of the vastus lateralis muscle of young men and women. J. Histochem. Cytochem. 2000, 48, 623–629. [Google Scholar] [CrossRef] [PubMed]
- Tsitkanou, S.; Spengos, K.; Stasinaki, A.N.; Zaras, N.; Bogdanis, G.; Papadimas, G.; Terzis, G. Effects of high-intensity interval cycling performed after resistance training on muscle strength and hypertrophy. Scand. J. Med. Sci. Sports 2017, 27, 1317–1327. [Google Scholar] [CrossRef]
- Terzis, G.; Spengos, K.; Karampatsos, G.; Manta, P.; Georgiadis, G. Acute effect of drop jumping on throwing performance. J. Strength Cond. Res. 2009, 23, 2592–2597. [Google Scholar] [CrossRef]
- Hopkins, W.G. Measures of reliability in sports medicine and science. Sports Med. 2000, 30, 1–15. [Google Scholar] [CrossRef] [PubMed]
- Methenitis, S.; Spengos, K.; Zaras, N.; Stasinaki, A.N.; Papadimas, G.; Karampatsos, G.; Arnaoutis, G.; Terzis, G. Fiber Type Composition and Rate of Force Development in Endurance- and Resistance-Trained Individuals. J. Strength Cond. Res. 2019, 33, 2388–2397. [Google Scholar] [CrossRef] [PubMed]
- Andersen, P.; Kroese, A.J. Capillary supply in soleus and gastrocnemius muscles of man. Pflug. Arch. 1978, 375, 245–249. [Google Scholar] [CrossRef] [PubMed]
- Hellsten, Y.; Gliemann, L. Peripheral limitations for performance: Muscle capillarization. Scand. J. Med. Sci. Sports 2024, 34, e14442. [Google Scholar] [CrossRef] [PubMed]
- Terzis, G.; Spengos, K.; Manta, P.; Sarris, N.; Georgiadis, G. Fiber type composition and capillary density in relation to submaximal number of repetitions in resistance exercise. J. Strength Cond. Res. 2008, 22, 845–850. [Google Scholar] [CrossRef] [PubMed]
- Jenkins, N.D.M.; Miramonti, A.A.; Hill, E.C.; Smith, C.M.; Cochrane-Snyman, K.C.; Housh, T.J.; Cramer, J.T. Greater Neural Adaptations following High- vs. Low-Load Resistance Training. Front. Physiol. 2017, 8, 331. [Google Scholar] [CrossRef]
- Larsson, L.; Degens, H.; Li, M.; Salviati, L.; Lee, Y.I.; Thompson, W.; Kirkland, J.L.; Sandri, M. Sarcopenia: Aging-Related Loss of Muscle Mass and Function. Physiol. Rev. 2019, 99, 427–511. [Google Scholar] [CrossRef]


| All (n = 13) | Type I > 50% (n = 6) | Type II > 50% (n = 7) | Effect Size Type I–II (Cohen’s d) | |
|---|---|---|---|---|
| Body composition (DXA) | ||||
| LBM (kg) | 41.0 ± 5.2 | 40.4 ± 6.8 | 41.6 ± 2.7 | −0.234 |
| Fat mass (kg) | 16.4 ± 3.3 | 15.1 ± 2.2 | 18.0 ± 4.0 | −0.886 |
| BMD (g/cm2) | 1.21 ± 0.10 | 1.21 ± 0.11 | 1.20 ± 0.08 | 0.107 |
| Fat lower limbs (%) | 33.0 ± 3.3 | 31.4 ± 3.5 | 34.9 ± 1.8 | −1.215 |
| Vastus lateralis morphology | ||||
| Type I fibers (%) | 49.4 ± 11.9 | 40.6 ± 6.1 | 59.5 ± 8.3 * | −2.623 |
| Type II fibers (%) | 50.5 ± 11.9 | 59.3 ± 6.1 | 40.4 ± 8.3 * | 2.623 |
| Type I CSA (μm2) | 2780 ± 347 | 2646 ± 411 | 2936 ± 179 | −0.885 |
| Type IΙ CSA (μm2) | 2735 ± 487 | 2556 ± 384 | 2943 ± 545 | −0.883 |
| Type I CSA (%) | 49.8 ± 12.1 | 41.4 ± 4.4 | 59.7 ± 10.7 * | −2.311 |
| Type IΙ CSA (%) | 50.1 ± 12.1 | 58.5 ± 4.4 | 40.2 ± 10.7 * | 2.311 |
| Ultrasonography VL | ||||
| VL CSA (cm2) | 14.8 ± 3.2 | 13.6 ± 3.5 | 16.3 ± 2.2 | −0.890 |
| Sub/neous fat thickness (cm) | 0.61 ± 0.22 | 0.46 ± 0.15 | 0.79 ± 0.15 * | −2.131 |
| EI (a.u.) | 28.1 ± 7.1 | 29.2 ± 7.9 | 26.6 ± 6.2 | 0.335 |
| Corrected EI (a.u.) | 33.4 ± 15.2 | 23.6 ± 10.3 | 44.8 ± 11.6 * | −1.927 |
| Muscle strength | ||||
| 1-RM leg press (kg) | 109.8 ± 28.3 | 103.2 ± 37 | 117.5 ± 10.3 | −0.500 |
| EI (a.u.) | Corrected EI (a.u.) | |
|---|---|---|
| Body composition | ||
| LBM (kg) | −0.220 | 0.071 |
| Fat mass (kg) | 0.069 | 0.415 |
| BMD (g/cm2) | −0.474 | −0.118 |
| Fat lower limbs (%) | 0.374 | 0.602 * |
| Vastus lateralis morphology | ||
| Type I fibers (%) | 0.076 | 0.801 ** |
| Type II fibers (%) | −0.076 | −0.801 ** |
| Type I CSA (μm2) | −0.271 | 0.156 |
| Type IΙ CSA (μm2) | −0.435 | −0.100 |
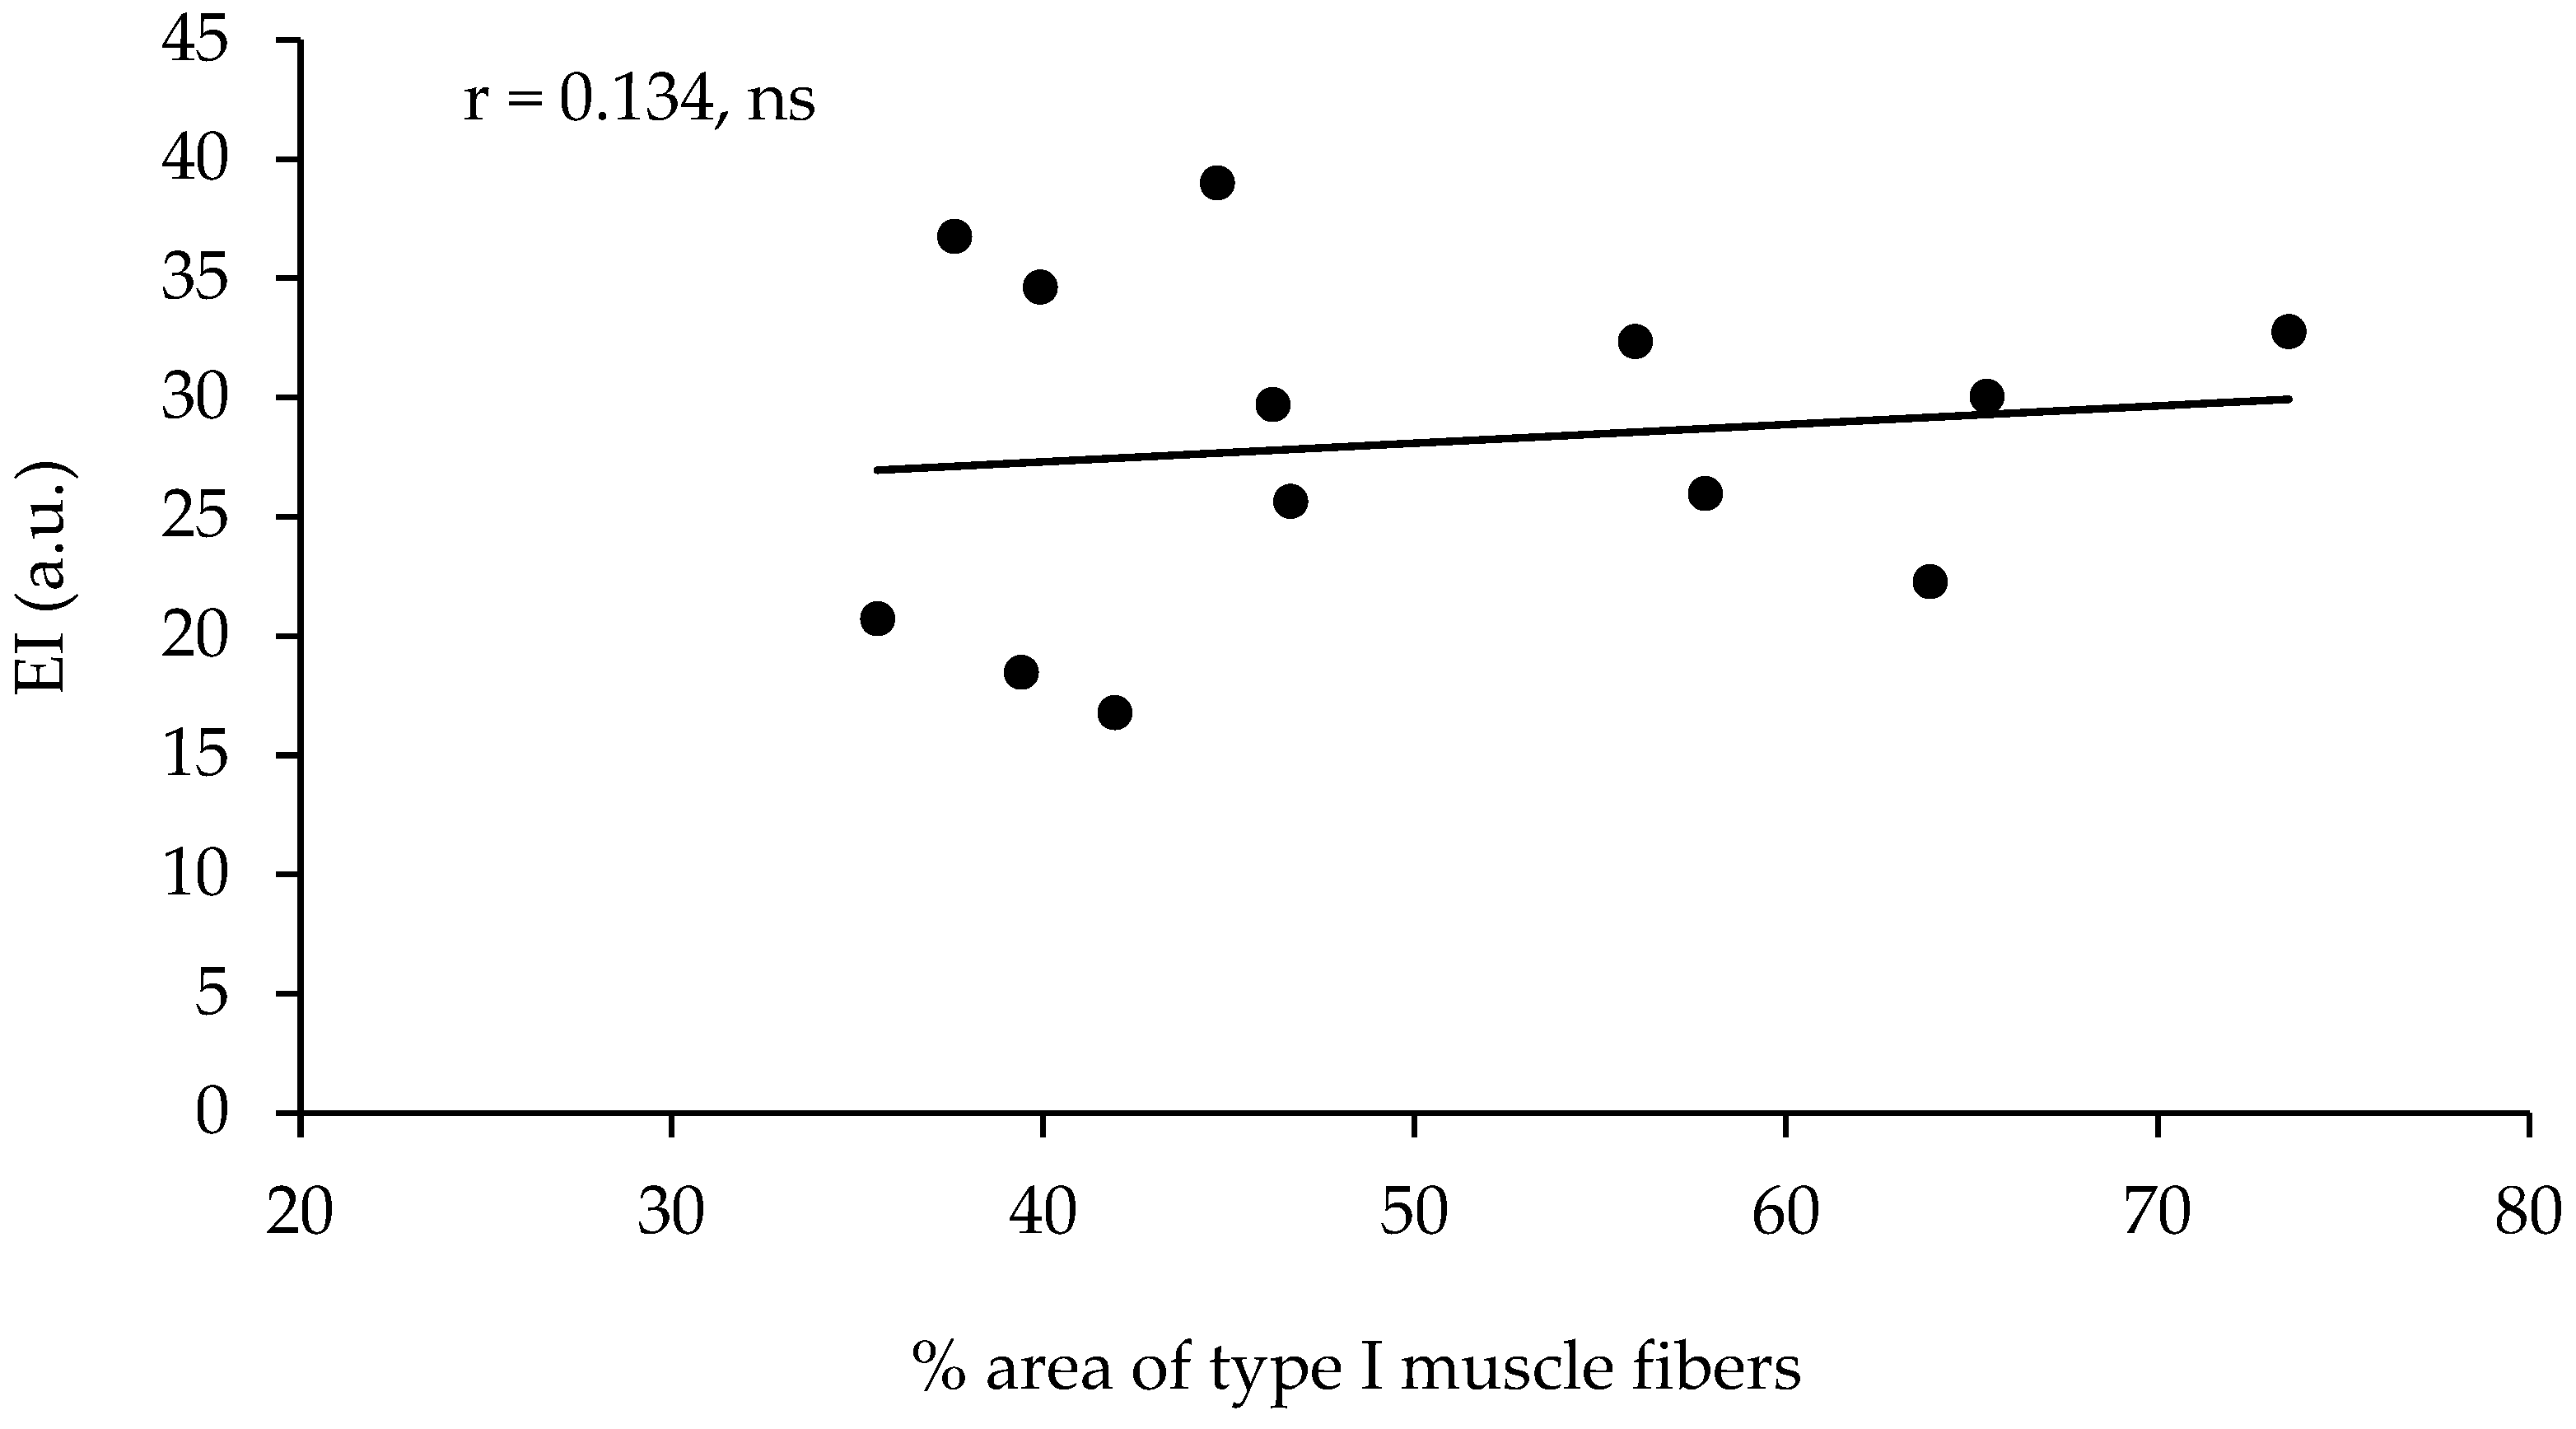
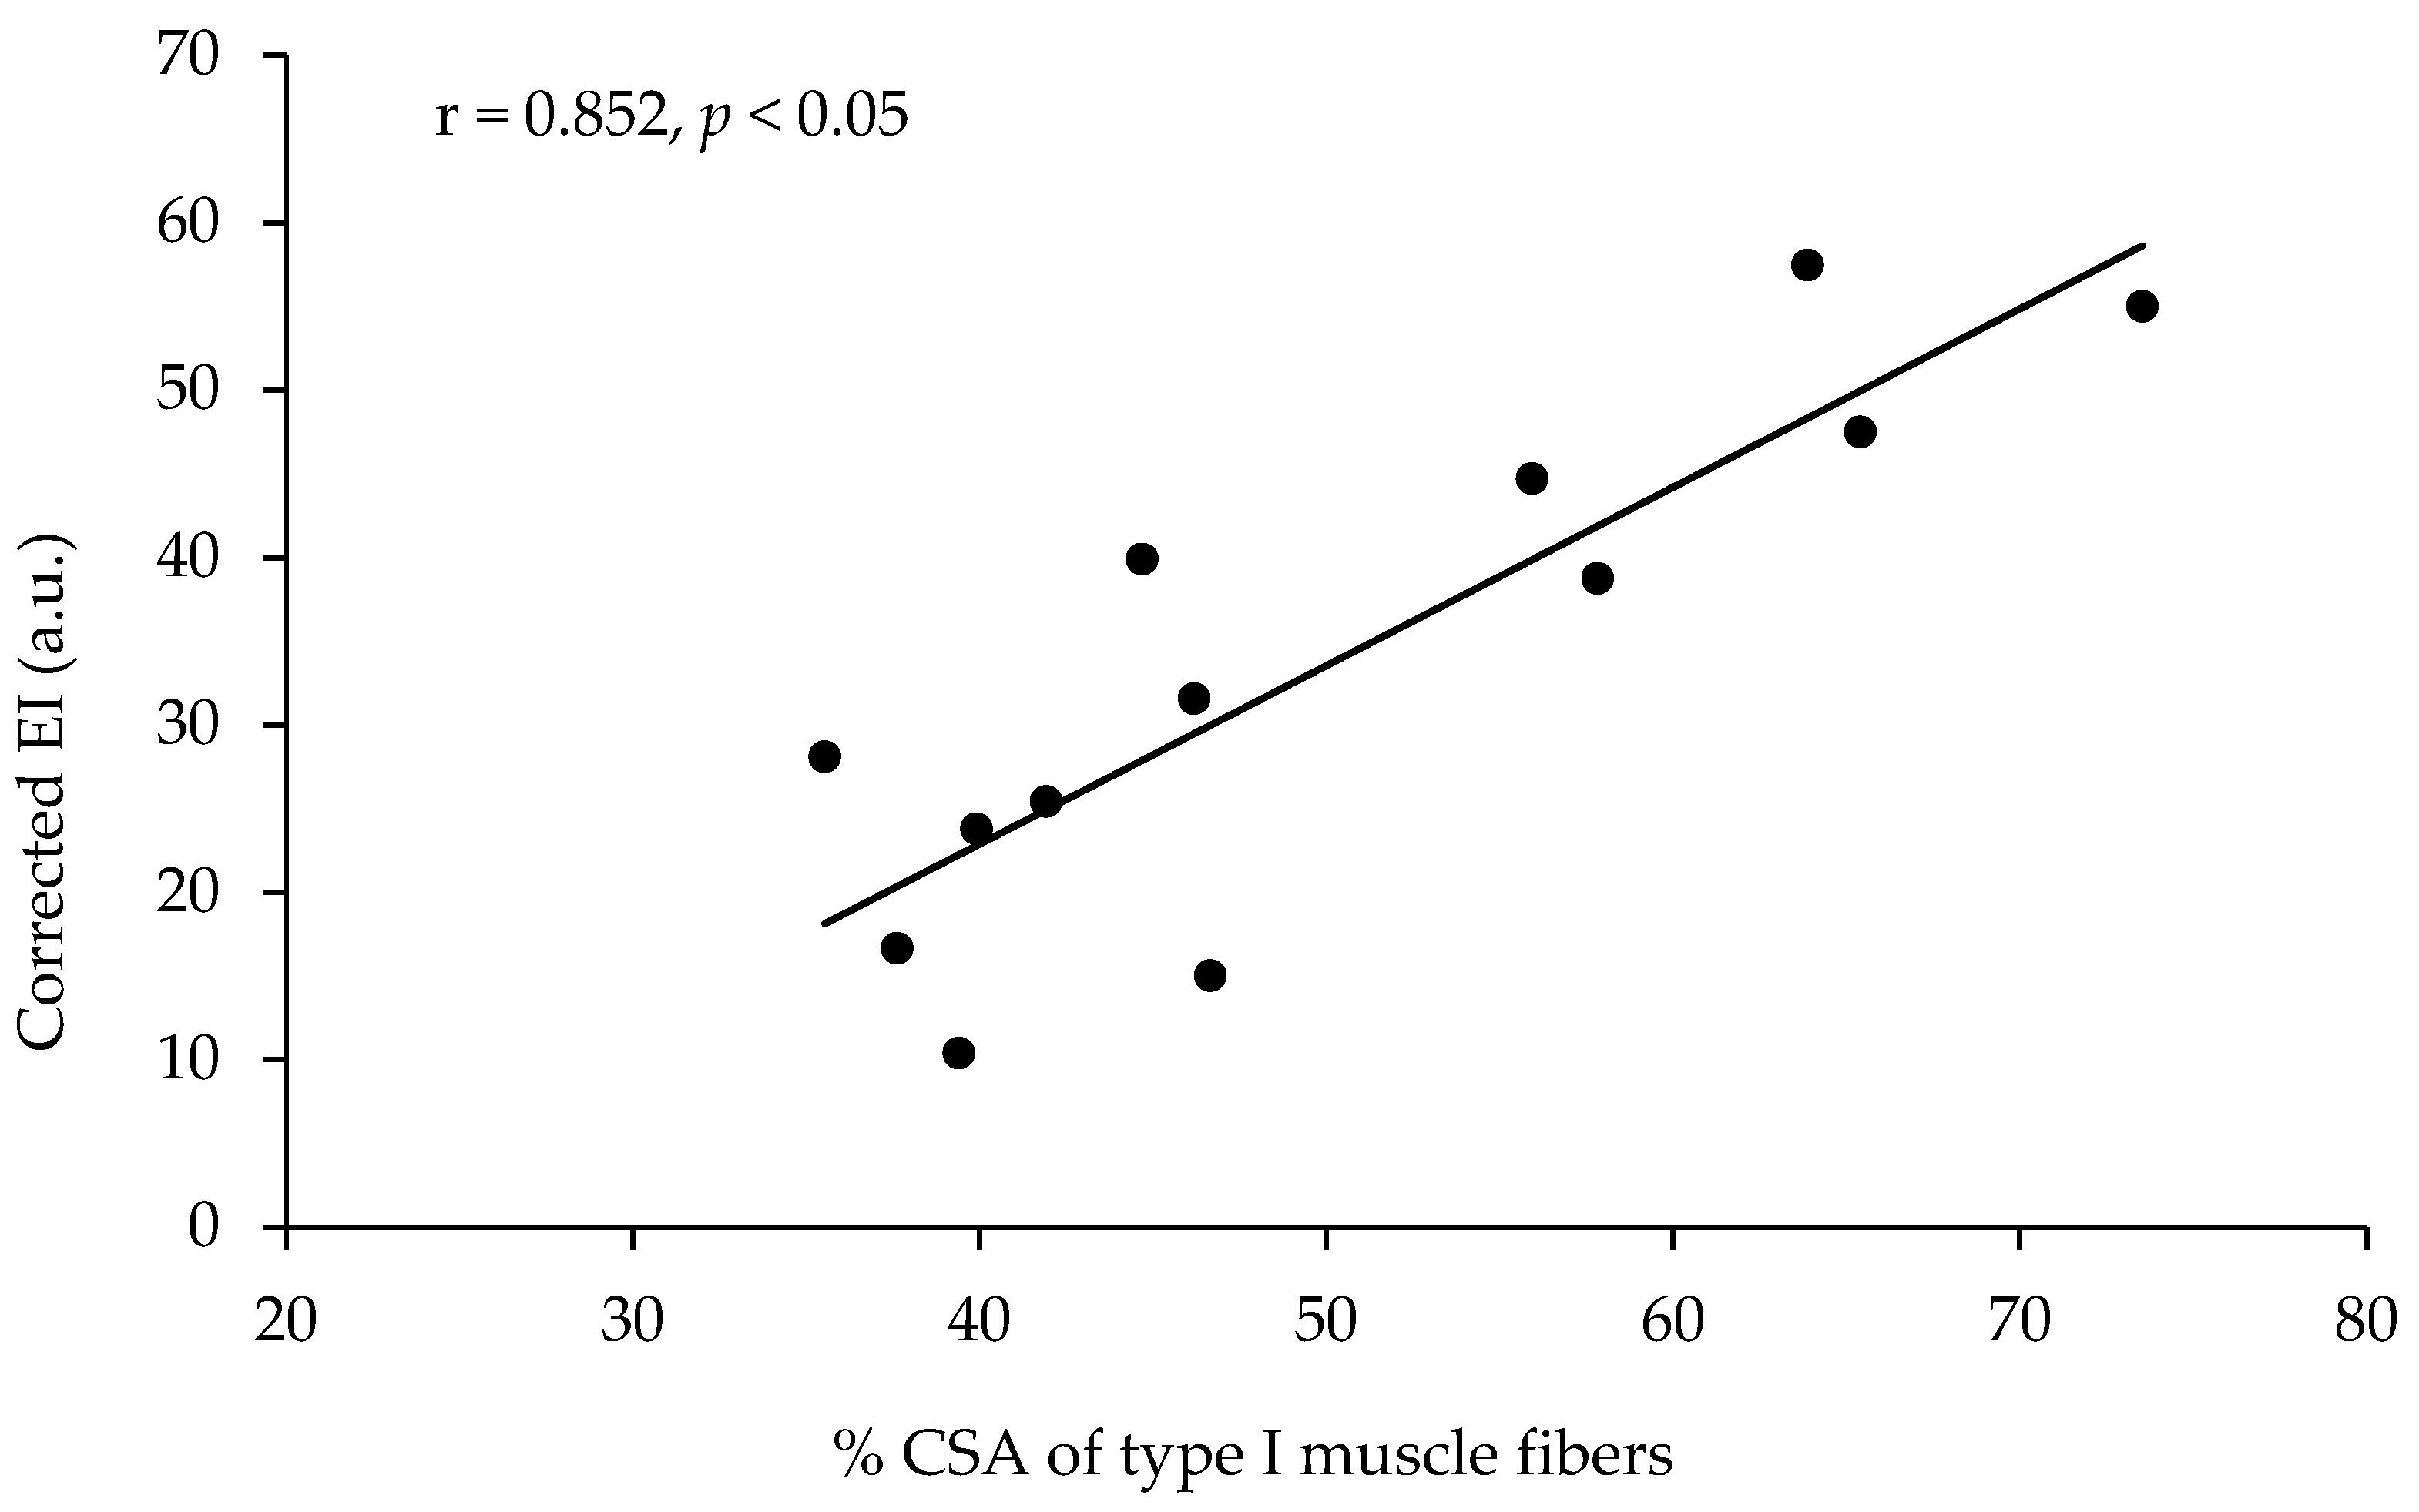
| Type I CSA (%) | 0.134 | 0.852 ** |
| Type IΙ CSA (%) | −0.134 | −0.852 ** |
| Ultrasonography VL | ||
| VL CSA (cm2) | −0.396 | 0.368 |
| Subcutaneous fat thickness (cm) | 0.080 | 0.984 ** |
| Muscle strength | ||
| 1-RM leg press (kg) | −0.238 | 0.183 |
Disclaimer/Publisher’s Note: The statements, opinions and data contained in all publications are solely those of the individual author(s) and contributor(s) and not of MDPI and/or the editor(s). MDPI and/or the editor(s) disclaim responsibility for any injury to people or property resulting from any ideas, methods, instructions or products referred to in the content. |
© 2024 by the authors. Licensee MDPI, Basel, Switzerland. This article is an open access article distributed under the terms and conditions of the Creative Commons Attribution (CC BY) license (https://creativecommons.org/licenses/by/4.0/).
Share and Cite
Terzis, G.; Vekaki, E.; Papadopoulos, C.; Papadimas, G.; Stasinaki, A.-N. Muscle Ultrasound Echo Intensity and Fiber Type Composition in Young Females. J. Funct. Morphol. Kinesiol. 2024, 9, 64. https://doi.org/10.3390/jfmk9020064
Terzis G, Vekaki E, Papadopoulos C, Papadimas G, Stasinaki A-N. Muscle Ultrasound Echo Intensity and Fiber Type Composition in Young Females. Journal of Functional Morphology and Kinesiology. 2024; 9(2):64. https://doi.org/10.3390/jfmk9020064
Chicago/Turabian StyleTerzis, Gerasimos, Eftychia Vekaki, Constantinos Papadopoulos, Giorgos Papadimas, and Angeliki-Nikoletta Stasinaki. 2024. "Muscle Ultrasound Echo Intensity and Fiber Type Composition in Young Females" Journal of Functional Morphology and Kinesiology 9, no. 2: 64. https://doi.org/10.3390/jfmk9020064
APA StyleTerzis, G., Vekaki, E., Papadopoulos, C., Papadimas, G., & Stasinaki, A.-N. (2024). Muscle Ultrasound Echo Intensity and Fiber Type Composition in Young Females. Journal of Functional Morphology and Kinesiology, 9(2), 64. https://doi.org/10.3390/jfmk9020064