
Relationship between Femur Mineral Content and Local Muscle Strength and Mass


 , , ,
, , ,  , and
, and 
Abstract
:1. Introduction
2. Method
2.1. Body Composition and Bone Mineral Measurement
2.2. Strength Measurements
2.3. Statistical Analysis
3. Results
4. Discussion
5. Conclusions
Author Contributions
Funding
Institutional Review Board Statement
Informed Consent Statement
Data Availability Statement
Acknowledgments
Conflicts of Interest
References
- Chen, Z.; Lohman, T.G.; Stini, W.A.; Ritenbaugh, C.; Aickin, M. Fat or Lean Tissue Mass: Which One is the Major Determinant of Bone Mineral Mass in Healthy Postmenopausal Women? J. Bone Miner. Res. 1997, 12, 144–151. [Google Scholar] [CrossRef] [PubMed]
- Reid, I.R. Relationships Among Body Mass, its Components, and Bone. Bone 2002, 31, 547–555. [Google Scholar] [CrossRef] [PubMed]
- Gnudi, S.; Sitta, E.; Fiumi, N. Relationship Between Body Composition and Bone Mineral Density in Women with and without Osteoporosis: Relative Contribution of Lean and Fat Mass. J. Bone Miner. Metab. 2007, 25, 326–332. [Google Scholar] [CrossRef] [PubMed]
- Beck, T.J.; Oreskovic, T.L.; Stone, K.L.; Ruff, C.B.; Ensrud, K.; Nevitt, M.C.; Genant, H.K.; Cummings, S.R. Structural Adaptation to Changing Skeletal Load in the Progression Toward Hip Fragility: The Study of Osteoporotic Fractures. J. Bone Miner. Res. 2001, 16, 1108–1119. [Google Scholar] [CrossRef] [PubMed]
- Thomas, T.; Burguera, B.; Melton, L.J., 3rd; Atkinson, E.J.; O’Fallon, W.M.; Riggs, B.L.; Khosla, S. Role of Serum Leptin, Insulin, and Estrogen Levels as Potential Mediators of the Relationship Between Fat Mass and Bone Mineral Density in Men Versus Women. Bone 2001, 29, 114–120. [Google Scholar] [CrossRef] [PubMed]
- Migliaccio, S.; Greco, E.A.; Wannenes, F.; Donini, L.M.; Lenzi, A. Adipose, Bone and Muscle Tissues as new Endocrine Organs: Role of Reciprocal Regulation for Osteoporosis and Obesity Development. Horm. Mol. Biol. Clin. Investig. 2014, 17, 39–51. [Google Scholar] [CrossRef] [PubMed]
- Makovey, J.; Naganathan, V.; Sambrook, P. Gender Differences in Relationships Between Body Composition Components, Their Distribution and Bone Mineral Density: A Cross-sectional Opposite Sex Twin Study. Osteoporos. Int. 2005, 16, 1495–1505. [Google Scholar] [CrossRef] [PubMed]
- Lee, N.; Radford-Smith, G.L.; Forwood, M.; Wong, J.; Taaffe, D.R. Body Composition and Muscle Strength as Predictors of Bone Mineral Density in Crohn’s Disease. J. Bone Miner. Metab. 2009, 27, 456–463. [Google Scholar] [CrossRef] [PubMed]
- Taaffe, D.R.; Cauley, J.A.; Danielson, M.; Nevitt, M.C.; Lang, T.F.; Bauer, D.C.; Harris, T.B. Race and Sex Effects on the Association Between Muscle Strength, Soft Tissue, and Bone Mineral Density in Healthy Elders: The Health, Aging, and Body Composition Study. J. Bone Miner. Res. 2001, 16, 1343–1352. [Google Scholar] [CrossRef]
- Frost, H.M. Muscle, Bone, and the Utah Paradigm: A 1999 Overview. Med. Sci. Sports Exerc. 2000, 32, 911–917. [Google Scholar] [CrossRef]
- Guadalupe-Grau, A.; Fuentes, T.; Guerra, B.; Calbet, J.A. Exercise and Bone Mass in Adults. Sports Med. 2009, 39, 439–468. [Google Scholar] [CrossRef]
- Espada, M.C.; Santos, F.J.; Conceição, A.; Louro, H.; Ferreira, C.F.; Reis, J.F.; Pessôa-Filho, D.M.; Pereira, A. The Effects of 12 Weeks In-Water Training in Stroke Kinematics, Dry-Land Power, and Swimming Sprints Performance in Master Swimmers. J. Mens. Health 2022, 18, 186. [Google Scholar] [CrossRef]
- Cárdenas-Fernández, V.; Chinchilla-Minguet, J.L.; Castillo-Rodríguez, A. Somatotype and body composition in young soccer players according to the playing position and sport success. J. Strength Cond. Res. 2019, 33, 1904–1911. [Google Scholar] [CrossRef]
- Gil, S.M.; Gil, J.; Ruiz, F.; Irazusta, A.; Irazusta, J. Anthropometrical characteristics and somatotype of young soccer players and their comparison with the general population. Biol. Sport 2010, 27, 17–24. [Google Scholar] [CrossRef]
- Hulme, A.; Finch, C.F. From Monocausality to Systems Thinking: A Complementary and Alternative Conceptual Approach for Better Understanding the Development and Prevention of Sports Injury. Inj. Epidemiol. 2015, 2, 31. [Google Scholar] [CrossRef]
- Bittencourt, N.; Meeuwisse, W.H.; Mendonça, L.; Nettel-Aguirre, A.; Ocarino, J.; Fonseca, S. Complex Systems Approach for Sports Injuries: Moving from Risk Factor Identification to Injury Pattern Recognition—Narrative Review and New Concept. Br. J. Sports Med. 2016, 50, 1309–1314. [Google Scholar] [CrossRef]
- Read, P.J.; Oliver, J.L.; Croix, M.B.A.D.S.; Myer, G.D.; Lloyd, R.S. An Audit of Injuries in Six English Professional Soccer Academies. J. Sports Sci. 2018, 36, 1542–1548. [Google Scholar] [CrossRef] [PubMed]
- Santos, F.J.; Valido, A.J.; Malcata, I.S.; Ferreira, C.C.; Pessôa Filho, D.M.; Verardi, C.E.L.; Espada, M.C. The Relationship Between Preseason Common Screening Tests to Identify Inter-Limb Asymmetries in High-Level Senior and Professional Soccer Players. Symmetry 2021, 13, 1805. [Google Scholar] [CrossRef]
- Nilsson, M.; Ohlsson, C.; Mellström, D.; Lorentzon, M. Previous sport activity during childhood and adolescence is associated with increased cortical bone size in young adult men. J. Bone Miner. Res. 2009, 24, 125–133. [Google Scholar] [CrossRef] [PubMed]
- Kohrt, W.M.; Ehsani, A.A.; Birge, S.J. Effects of exercise involving predominantly either joint-reaction or ground-reaction forces on bone mineral density in older women. J. Bone Miner. Res. 1997, 12, 1253–1261. [Google Scholar] [CrossRef]
- Burr, D.B. Muscle Strength, Bone Mass, and Age-related Bone Loss. J. Bone Miner. Res. 1997, 12, 1547–1551. [Google Scholar] [CrossRef]
- Lang, T.F. The Bone-muscle Relationship in Men and Women. J. Osteoporos. 2011, 2011, 702735. [Google Scholar] [CrossRef]
- Slemenda, C.; Longcope, C.; Peacock, M.; Hui, S.; Johnston, C.C. Sex Steroids, Bone Mass, and Bone Loss. A Prospective Study of Pre-, Peri-, and Postmenopausal Women. J. Clin. Investig. 1996, 97, 14–21. [Google Scholar] [CrossRef]
- Harriss, D.; MacSween, A.; Atkinson, G. Ethical Standards in Sport and Exercise Science Research: 2020 Update. Int. J. Sports Med. 2019, 40, 813–817. [Google Scholar] [CrossRef]
- Looker, A.C.; Wahner, H.W.; Dunn, W.L.; Calvo, M.S.; Harris, T.B.; Heyse, S.P.; Johhnston, C.C., Jr.; Lindsay, R. Updated data on proximal femur bone mineral levels of US adults. Osteoporos. Int. 1998, 8, 468–490. [Google Scholar] [CrossRef]
- Nana, A.; Slater, G.J.; Hopkins, W.G.; Burke, L.M. Techniques for Undertaking Dual-energy X-ray Absorptiometry Whole-body Scans to Estimate Body Composition in Tall and/or Broad Subjects. Int. J. Sport Nutr. Exerc. Metab. 2012, 22, 313–322. [Google Scholar] [CrossRef]
- Massini, D.A.; Macedo, A.G.; Almeida, T.A.; Espada, M.C.; Santos, F.J.; Castro, E.A.; Fereira, D.C.P.; Neiva, C.M.; Pessôa Filho, D.M. Single-and Multi-Joint Maximum Weight Lifting Relationship to Free-Fat Mass in Different Exercises for Upper-and Lower-Limbs in Well-Trained Male Young Adults. Int. J. Environ. Res. Public Health 2022, 19, 4020. [Google Scholar] [CrossRef]
- Baechle, T.R.; Earle, R.W. Essentials of Strength Training and Conditioning, 3rd ed.; National Strength and Conditioning Association, Ed.; Human Kinetics: Champaign, IL, USA, 2008. [Google Scholar]
- Ferguson, C.J. An Effect Size Primer: A Guide for Clinicians and Researchers. Prof. Psychol. Res. Pract. 2009, 40, 532–538. [Google Scholar] [CrossRef]
- Hopkins, W.G.; Marshall, S.W.; Batterham, A.M.; Hanin, J. Progressive statistics for studies in sports medicine and exercise science. Med. Sci. Sports Exerc. 2009, 41, 3–12. [Google Scholar] [CrossRef]
- Matsuo, T.; Douchi, T.; Nakae, M.; Uto, H.; Oki, T.; Nagata, Y. Relationship of Upper Body Fat Distribution to Higher Regional Lean Mass and Bone Mineral Density. J. Bone Miner. Metab. 2003, 21, 179–183. [Google Scholar] [CrossRef] [PubMed]
- Oliveira, T.P.; Espada, M.C.; Massini, D.A.; Robalo, R.A.M.; Almeida, T.A.F.; Hernández-Beltrán, V.; Gamonales, J.M.; Castro, E.A.; Pessôa Filho, D.M. Effects of Exercise and Sports Intervention and the Involvement Level on the Mineral Health of Different Bone Sites in the Leg, Hip, and Spine: A Systematic Review and Meta-Analysis. Int. J. Environ. Res. Public Health 2023, 20, 6537. [Google Scholar] [CrossRef] [PubMed]
- Young, D.; Hopper, J.L.; Macinnis, R.J.; Nowson, C.A.; Hoang, N.H.; Wark, J.D. Changes in Body Composition as Determinants of Longitudinal Changes in Bone Mineral Measures in 8 to 26-year-old Female Twins. Osteoporos. Int. 2001, 12, 506–515. [Google Scholar] [CrossRef]
- Schoenau, E. From Mechanostat Theory to Development of the “Functional Muscle Bone-Unit”. J. Musculoskelet. Neuronal Interact. 2005, 5, 232–238. [Google Scholar]
- Locatelli, V.; Bianchi, V.E. Effect of GH/IGF-1 on Bone Metabolism and Osteoporsosis. Int. J. Endocrinol. 2014, 2014, 235060. [Google Scholar] [CrossRef]
- Sievanen, H.; Heinonen, A.; Kannus, P. Adaptation of Bone to Altered Loading Environment: A Biomechanical Approach Using X-ray Absorptiometric Data From the Patella of a Young Woman. Bone 1996, 19, 55–59. [Google Scholar] [CrossRef]
- Massini, D.A.; Nedog, F.H.; de Oliveira, T.P.; Almeida, T.A.F.; Santana, C.A.A.; Neiva, C.M.; Macedo, A.G.; Castro, E.A.; Espada, M.C.; Santos, F.J.; et al. The Effect of Resistance Training on Bone Mineral Density in Older Adults: A Systematic Review and Meta-Analysis. Healthcare 2022, 10, 1129. [Google Scholar] [CrossRef]
- Matsui, Y.; Takemura, M.; Harada, A.; Ando, F.; Shimokata, H. Divergent Significance of Bone Mineral Density Changes in Aging Depending on Sites and Sex Revealed through Separate Analyses of Bone Mineral Content and Area. J. Osteoporos. 2012, 2012, 642486. [Google Scholar] [CrossRef]
- Guimarães, B.R.; Pimenta, L.D.; Massini, D.A.; Dos Santos, D.; Siqueira, L.O.D.C.; Simionato, A.R.; Dos Santos, L.G.A.; Neiva, C.M.; Pessôa Filho, D.M. Muscle Strength and Regional Lean Body Mass Influence on Mineral Bone Health in Young Male Adults. PLoS ONE 2018, 13, e0191769. [Google Scholar] [CrossRef]
- Ryan, A.S.; Ivey, F.M.; Hurlbut, D.E.; Martel, G.F.; Lemmer, J.T.; Sorkin, J.D.; Metter, E.J.; Fleg, J.L.; Hurley, B.F. Regional Bone Mineral Density after Resistive Training in Young and Older Men and Women. Scand. J. Med. Sci. Sports. 2004, 14, 16–23. [Google Scholar] [CrossRef] [PubMed]
- Huuskonen, J.; Väisänen, S.B.; Kröger, H.; Jurvelin, J.S.; Alhava, E.; Rauramaa, R. Regular Physical Exercise and Bone Mineral Density: A Four-Year Controlled Randomized Trial in Middle-aged Men. The DNASCO Study. Osteoporos. Int. 2001, 12, 349–355. [Google Scholar] [CrossRef] [PubMed]


| Total Mass (kg) | Lean Mass (LM, kg) | Fat Mass (FM, kg) | |
|---|---|---|---|
| Trunk | 32.7 ± 7.2 (23.0–59.9) | 26.0 ± 4.2 (19.2–39.6) | 6.0 ± 3.8 (2.0–19.3) |
| * Upper limb | 8.6 ± 1.7 (6.3–14.4) | 6.8 ± 1.2 (5.3–11.6) | 1.4 ± 0.83 (0.45–4.7) |
| * Lower limb | 25.2 ± 4.2 (19.0–39.4) | 19.2 ± 2.5 (15.3–26.3) | 5.1 ± 2.5 (1.8–11.8) |
| Exercises | Average ± SD | Minimum–Maximum | TPF BMC (g) |
|---|---|---|---|
| Bench Press (kg) | 60.0 ± 16.0 | 40.0–112.5 | 0.34 * |
| Front Pulley (kg) | 62.2 ± 16.4 | 40.0–130.0 | ns ‡ |
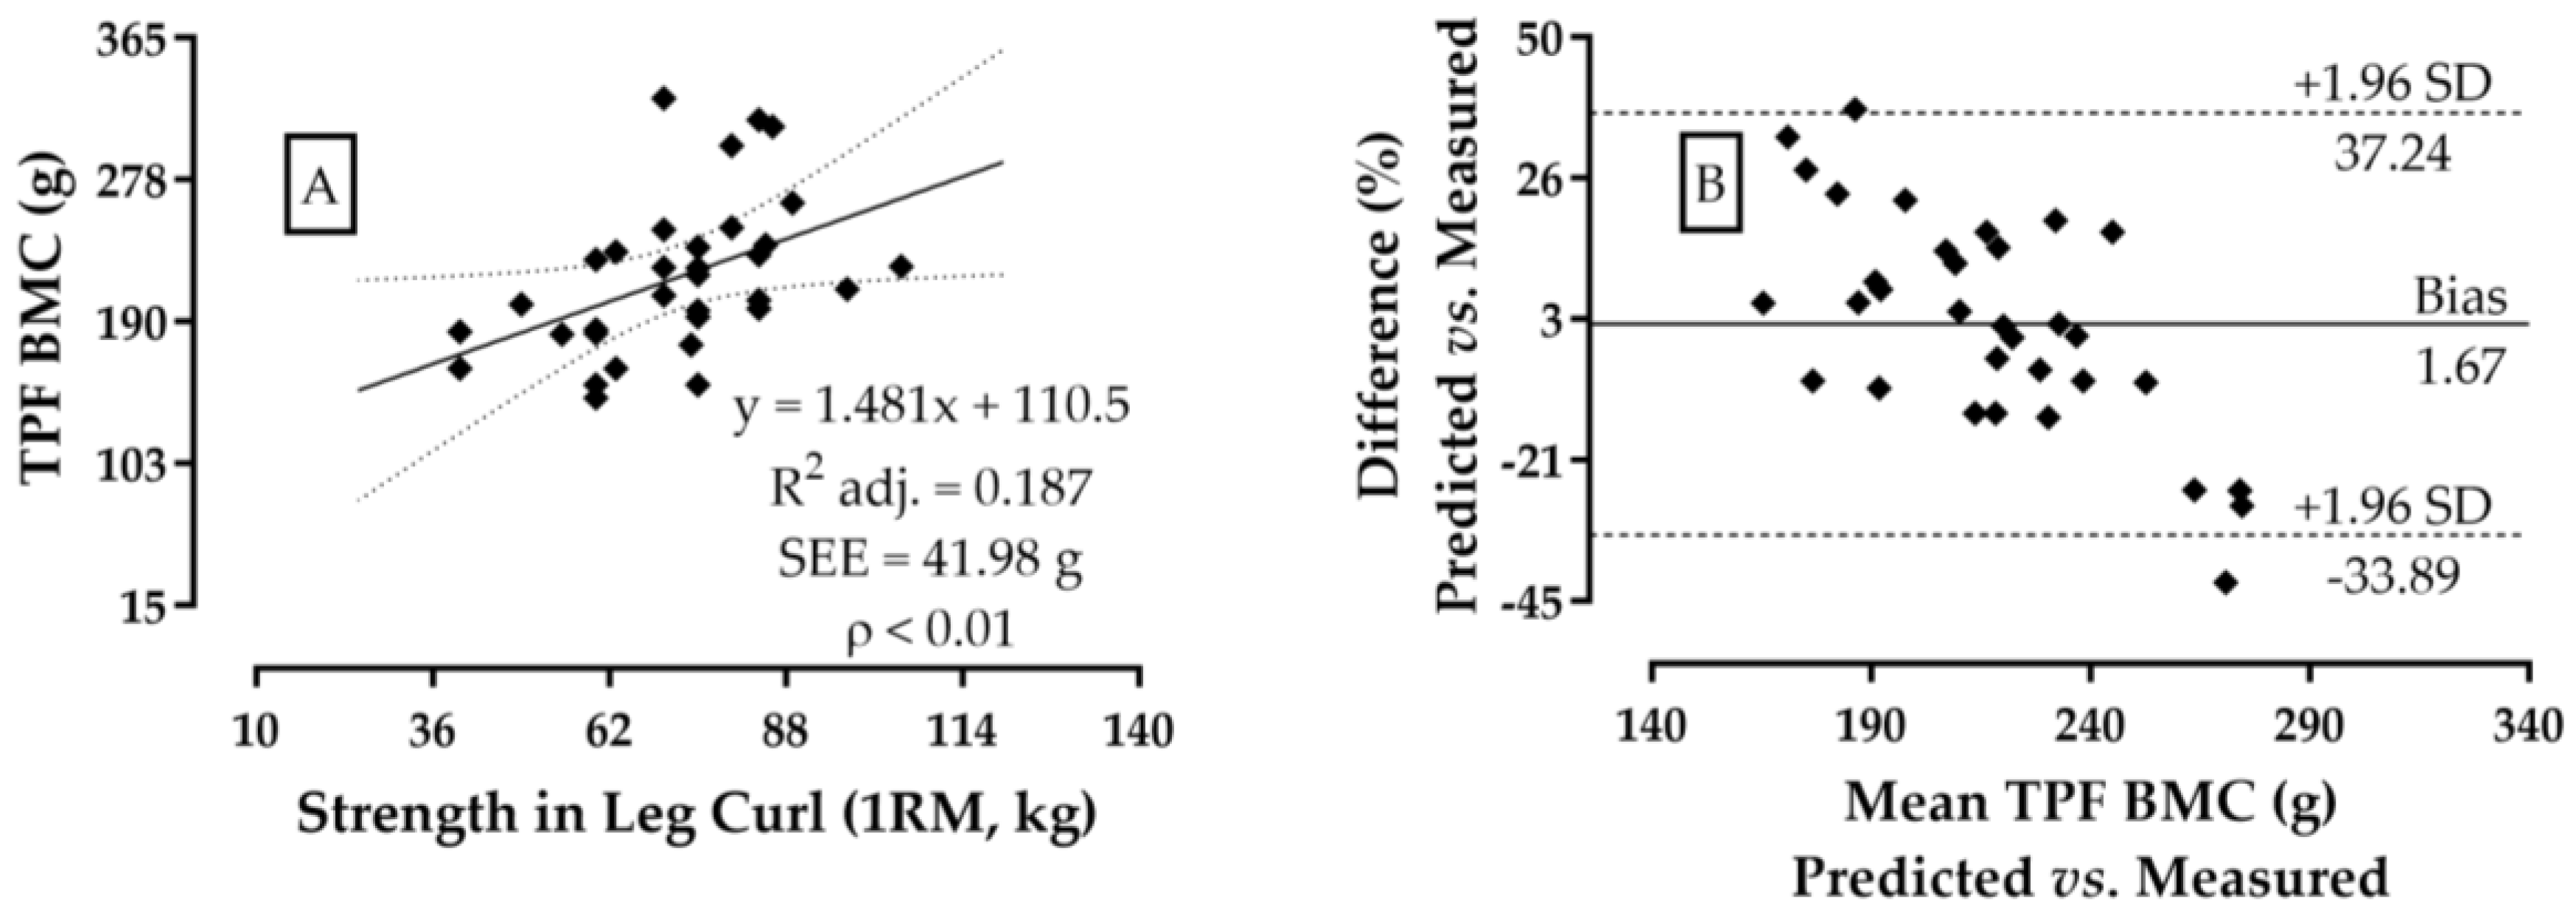
| Leg Curl (kg) | 72.0 ± 14.5 | 40.0–105.0 | 0.46 ** |
| Leg Extension (kg) | 91.8 ± 30.3 | 40.0–188.0 | ns ‡ |
| 45° Leg Press (kg) | 259.1 ± 57.5 | 120.0–366.0 | 0.39 * |
| Push Press (kg) | 40.1 ± 13.0 | 18.0–82.0 | 0.38 * |
| Seated Row (kg) | 71.8 ± 21.7 | 35.0–150.0 | 0.39 * |
| Triceps Pulley (kg) | 54.4 ± 13.9 | 35.0–100.0 | 0.36 * |
| Arm Curl (kg) | 35.1 ± 8.8 | 16.0–65.8 | ns ‡ |
Disclaimer/Publisher’s Note: The statements, opinions and data contained in all publications are solely those of the individual author(s) and contributor(s) and not of MDPI and/or the editor(s). MDPI and/or the editor(s) disclaim responsibility for any injury to people or property resulting from any ideas, methods, instructions or products referred to in the content. |
© 2024 by the authors. Licensee MDPI, Basel, Switzerland. This article is an open access article distributed under the terms and conditions of the Creative Commons Attribution (CC BY) license (https://creativecommons.org/licenses/by/4.0/).
Share and Cite
Ramos, B.V.R.; Massini, D.A.; Almeida, T.A.F.; Castro, E.A.; Espada, M.C.; Ferreira, C.C.; Robalo, R.A.M.; Macedo, A.G.; Pessôa Filho, D.M. Relationship between Femur Mineral Content and Local Muscle Strength and Mass. J. Funct. Morphol. Kinesiol. 2024, 9, 69. https://doi.org/10.3390/jfmk9020069
Ramos BVR, Massini DA, Almeida TAF, Castro EA, Espada MC, Ferreira CC, Robalo RAM, Macedo AG, Pessôa Filho DM. Relationship between Femur Mineral Content and Local Muscle Strength and Mass. Journal of Functional Morphology and Kinesiology. 2024; 9(2):69. https://doi.org/10.3390/jfmk9020069
Chicago/Turabian StyleRamos, Bruno V. R., Danilo A. Massini, Tiago A. F. Almeida, Eliane A. Castro, Mário C. Espada, Cátia C. Ferreira, Ricardo A. M. Robalo, Anderson G. Macedo, and Dalton M. Pessôa Filho. 2024. "Relationship between Femur Mineral Content and Local Muscle Strength and Mass" Journal of Functional Morphology and Kinesiology 9, no. 2: 69. https://doi.org/10.3390/jfmk9020069
APA StyleRamos, B. V. R., Massini, D. A., Almeida, T. A. F., Castro, E. A., Espada, M. C., Ferreira, C. C., Robalo, R. A. M., Macedo, A. G., & Pessôa Filho, D. M. (2024). Relationship between Femur Mineral Content and Local Muscle Strength and Mass. Journal of Functional Morphology and Kinesiology, 9(2), 69. https://doi.org/10.3390/jfmk9020069