Abstract
The road transport system is expanding considerably in developing countries. Villages are connecting to major cities for business, education, health, and many other reasons because of road development and smooth transportation. There has been a rise in the number of road accidents observed, caused by abruptly appearing dividers on roads and a lack of required signage systems. This paper discusses scenarios of accidents due to such abruptly appearing dividers and offers a strategy to design appropriate signage to avoid road accidents in the future. It has been observed that permanent or movable arbitrary fixtures, such as a barricade or a small partition block wall, are installed to separate lanes, in addition to white-colored stripes that are typically employed for lane separation on roads. These fixtures, although they are intended as lane-dividing solutions on roads, cause serious, and at times, fatal accidents, due their sudden, uninitiated appearance on the road. To address this problem, alternative signage designs were designed and tested on Indian roads, based on human cognitive responses and visual attention analysis on signage using an eye-tracking method. In addition, the semantic quality and legibility of alternate signage designs were evaluated using a questionnaire to judge their overall efficacy. Hence, the best signage design solution is proposed for implementation near or before occurrences of road dividers to avoid accidents.
1. Introduction
Road accidents are on the rise in India for a variety of reasons. Numerous accidents are primarily the result of a disregard for traffic regulations. However, at the same time, several accidents have been reported to have solely resulted from the absence of essential traffic signs and their positions. Traffic management must manage a variety of scenarios on the highways for directing vehicles since the number of roads is significantly increasing. The country’s whole road network has undergone significant expansion, while essential signage systems have not been put in place in accordance with the requirements for vehicles. A professional team must be appointed in order to conduct necessary research and prepare a list of sensitive locations (accident prone zones) and the relevant signage required along the roads. This team must then present their report to the relevant office in order to have specific signage installed at each location.
Some roads are marked using barrier walls, some with cement blocks, and others with painted white stripes on the surface for guiding vehicles—from a solely administrative viewpoint and one of preventing traffic jams and accidents. In the same way as the respective sign is erected at a designated distance before the occurrence of a speed breaker, a warning sign alerting a vehicle driver in advance of an approaching lane divider is essential to help prevent accidents. The visual style of the road signs currently used in India was researched with respect to factors such as shape, color, form, and their recognition by the driver. Following a thorough analysis, a new sign might be designed and proposed to warn drivers about upcoming road divider objects up ahead. The suggested sign was tested using a sample-based eye-tracking testing method.
Several incidents of vehicle accidents caused by the abrupt appearance of divider objects have gained public attention not only in print and television media, but also on social media. The present authors personally visited such accident sites to document the incidents through photographs taken on a mobile device with a camera. The key reason observed for these disasters was the absence of signs alerting drivers of barriers up ahead. Sometimes, because of their excessive speed, automobiles hit such abruptly appearing dividers with extremely high impact. Such abruptly appearing dividers are not apparent in the dark because of the strong high-beam headlights of vehicles in the opposite lane. Sometimes, a lack of street illumination also contributes to compromising the visibility of such divider objects. In the rainy season, the lights of cars from the opposite lane of the road are appearing on the road and into the eyes of drivers, and this added visual disturbance compounds the existing lack of visibility of dividers, making them undetectable to drivers and causing vehicles to collide with such objects.
Owing to the current lack of proper signage, the general public holds the administration responsible for such mishaps. Lane division is carried out for traffic management and navigation, as well as the separation of heavy and light vehicles. To maintain lane discipline or for administrative purposes, in areas of concern, some barricades or objects are emplaced, but this solution is not functional and results in many accidents near the signals. As published in a report by the Ministry of Transportation (Govt. of India) in 2022, 15,368 road accidents took place, in which 7307 people were killed and 14,829 were injured [1]. One of the studies conducted by the Civil Engineering Department of the Visvesvaraya National Institute of Technology (VNIT), India, revealed that inaccurately constructed dividers placed at erroneous positions are disrupting the steady flow of traffic and are a major cause (70%) for road accidents in Nagpur, India [2]. Although there are many studies conducted on signage in commercial places, comparatively fewer studies have been conducted in the area of traffic signage in India. It is also noticed that eye-tracking systems have not been utilized for studies of traffic signage in the past. Hence, an attempt was made to design and validate Indian road signage with special reference to signs indicating dividers ahead, as these are one of the major causes of Indian road accidents.
2. Literature Review
2.1. Road Accidents and Signage System
It has been observed that, unfortunately, despite incredible health advancements, RTIs are now among the top 10 fatalities worldwide. According to the World Health Organization (WHO), RTIs are to blame for 20% of the worldwide daily deaths attributable to injury. RTIs will rise to the third-most significant global cause of daily deaths by 2020 from their current ranking of ninth [3]. It was found that the costs of road accidents represent 3% of the GDP. The number of fatal accidents increased steadily between 2000 and 2018, rising from 1.15 million to 1.35 million. Around the world, traffic accidents are a serious problem. One of the main causes of road accidents is irresponsible driving, which is innately influenced by infrastructure and traffic conditions, among other things [4]. A study conducted by scholars, specifically for Pune city, stated that for better traffic management, installing suitable signs in accordance with IRC 67-2012 would be a good solution. The presence of lane management is a key element in controlling traffic in any city, and Pune’s lack of an adequate lane management system is a key factor contributing to traffic congestion [5].
It was observed that when dealing with countries like India, the signage system for public spaces must address both the issues of multilingualism and illiteracy. A widely accepted solution is to incorporate graphic symbols in the signs. The visual symbols are created to be straightforward and useful for visual communication. A designer must use his or her judgment when choosing the language (text), an appropriate graphic symbol, the background and foreground color scheme, proportioning, size, and placement of the signage to make it serve its purpose for all—literate, illiterate, persons with physical disabilities, and populations of the local region and other regions who may have temporarily migrated [6]. From a study, it can be said that signs are more likely to be understood by drivers from various cultural backgrounds if they adhere to global ergonomic design standards. To improve comprehension, particularly for drivers who have never seen a particular sign before, sign design should be influenced by accepted ergonomics concepts [7]. It is observed that road user safety, driving effectiveness, and overall traffic flow are all impacted by drivers’ capacity to pay attention to both traffic direction and regulation signs while operating a vehicle. When developing traffic regulation and road direction signs, several variables must be considered (such as color, writing size, light reflection, and contrast), but the most important one is whether drivers will understand and use the information. The capacity of humans to process information quickly is limited. The short-term memory capacity of the driver will rapidly become overloaded by the amount of information on traffic signs, leading to omissions [8].
Traffic sign identification is a difficult example where the algorithms must deal with real-time limitations, high accuracy requirements, and naturally complex and dynamic situations. Therefore, a variety of methodologies for the detection and recognition of traffic signs have been proposed due to their great industrial relevance [9].
Road signs are made to be visible and understandable to human drivers using color, shape, iconography, and text according to well-defined design principles. A subset of traffic signs that are extremely similar to one another is created when signs with the same general meaning, like the numerous speed limits, share a shared general appearance [10]. Work is carried out regarding human behavior to make sure that information design and orientation are mostly seen subliminally, providing consumers a sense of assurance that they are moving in the right path [11]. Instead of relying on algorithms, designers must have a thorough understanding of how to use color to create efficient wayfinding solutions [12]. The pictogram should always have a clear area around it to separate it from surrounding items [13,14]. Given that it deals with shape, size, colors, and lettering styles, the word “design” should refer to the entire sign. Some shapes may be eliminated depending on how much copy needs to be on a sign [15]. If an icon has many small features or is elaborate, it is considered complex; if it has few elements or few details, it is considered simple. Evidently, meaning refers to how significant individuals consider icons to be. The degree of similarity between what is portrayed on an icon and what it is meant to represent is known as semantic distance. It is found that because traffic signs are not standardized globally, their ability to be guessed at by potential users is crucial [16].
It is advised that for visual alert signals, light displays are required at intersections to mark the locations of signboards showing speed limits and other traffic regulations, such as pedestrian safety. Different speed modifications are needed for different types of roads and locations. Therefore, using signboards placed at regular road intervals, riders should be made aware of the steps by making sure they are plainly visible [17]. The criteria and guidelines for a systematic and effective signage say that it must draw attention or be obvious, be readable from a distance that is acceptable, frequently be readable when just briefly observed, and be readable in poor lighting. When alternative perspectives could have poor legibility distance, side views of some symbols, like cars, are appropriate. Depending on the message and sign layout, several perspectives are required, but when a choice is available, side views are the best [18]. It is observed that to ensure proper visibility, road signs should be positioned such that they are visible to all road users. The road sign should be positioned correctly in relation to the area, object, or circumstance to which it pertains in order to help express the intended meaning. The road sign’s placement and legibility should be such that it gives drivers enough time to react [19].
The installation of traffic signs and road markings is crucial for preventing traffic conflicts, accidents, and serious injuries by providing drivers and other road users with key information such as warnings, instructions, and directions. Therefore, for successful communication with drivers and pedestrians utilizing the road, traffic signs and markings should be clear, precise, and simple to interpret [20]. Application areas for traffic sign recognition include autonomous driving, urban scene awareness, driver aid and safety, and even sign monitoring for maintenance. Given that signs are distinctive, stiff, and created to be easily seen by vehicles, with limited variation in appearance, it is a reasonably confined task [21].
A study showed that many factors, including the types of information on traffic signs, their information volume and comprehensibility, the behavioral characteristics of drivers, the geometric features of roadways, and weather and visibility conditions, have a significant impact on the effectiveness and performance of traffic guide signs at intersections [22]. In a study involving safety signs, it was discovered that people could more accurately predict the meaning of signs when they were well known, concrete, clear, and significant, as well as when the signs were connected to the underlying ideas [23].
2.2. Traffic Signs and Accident Possibilities
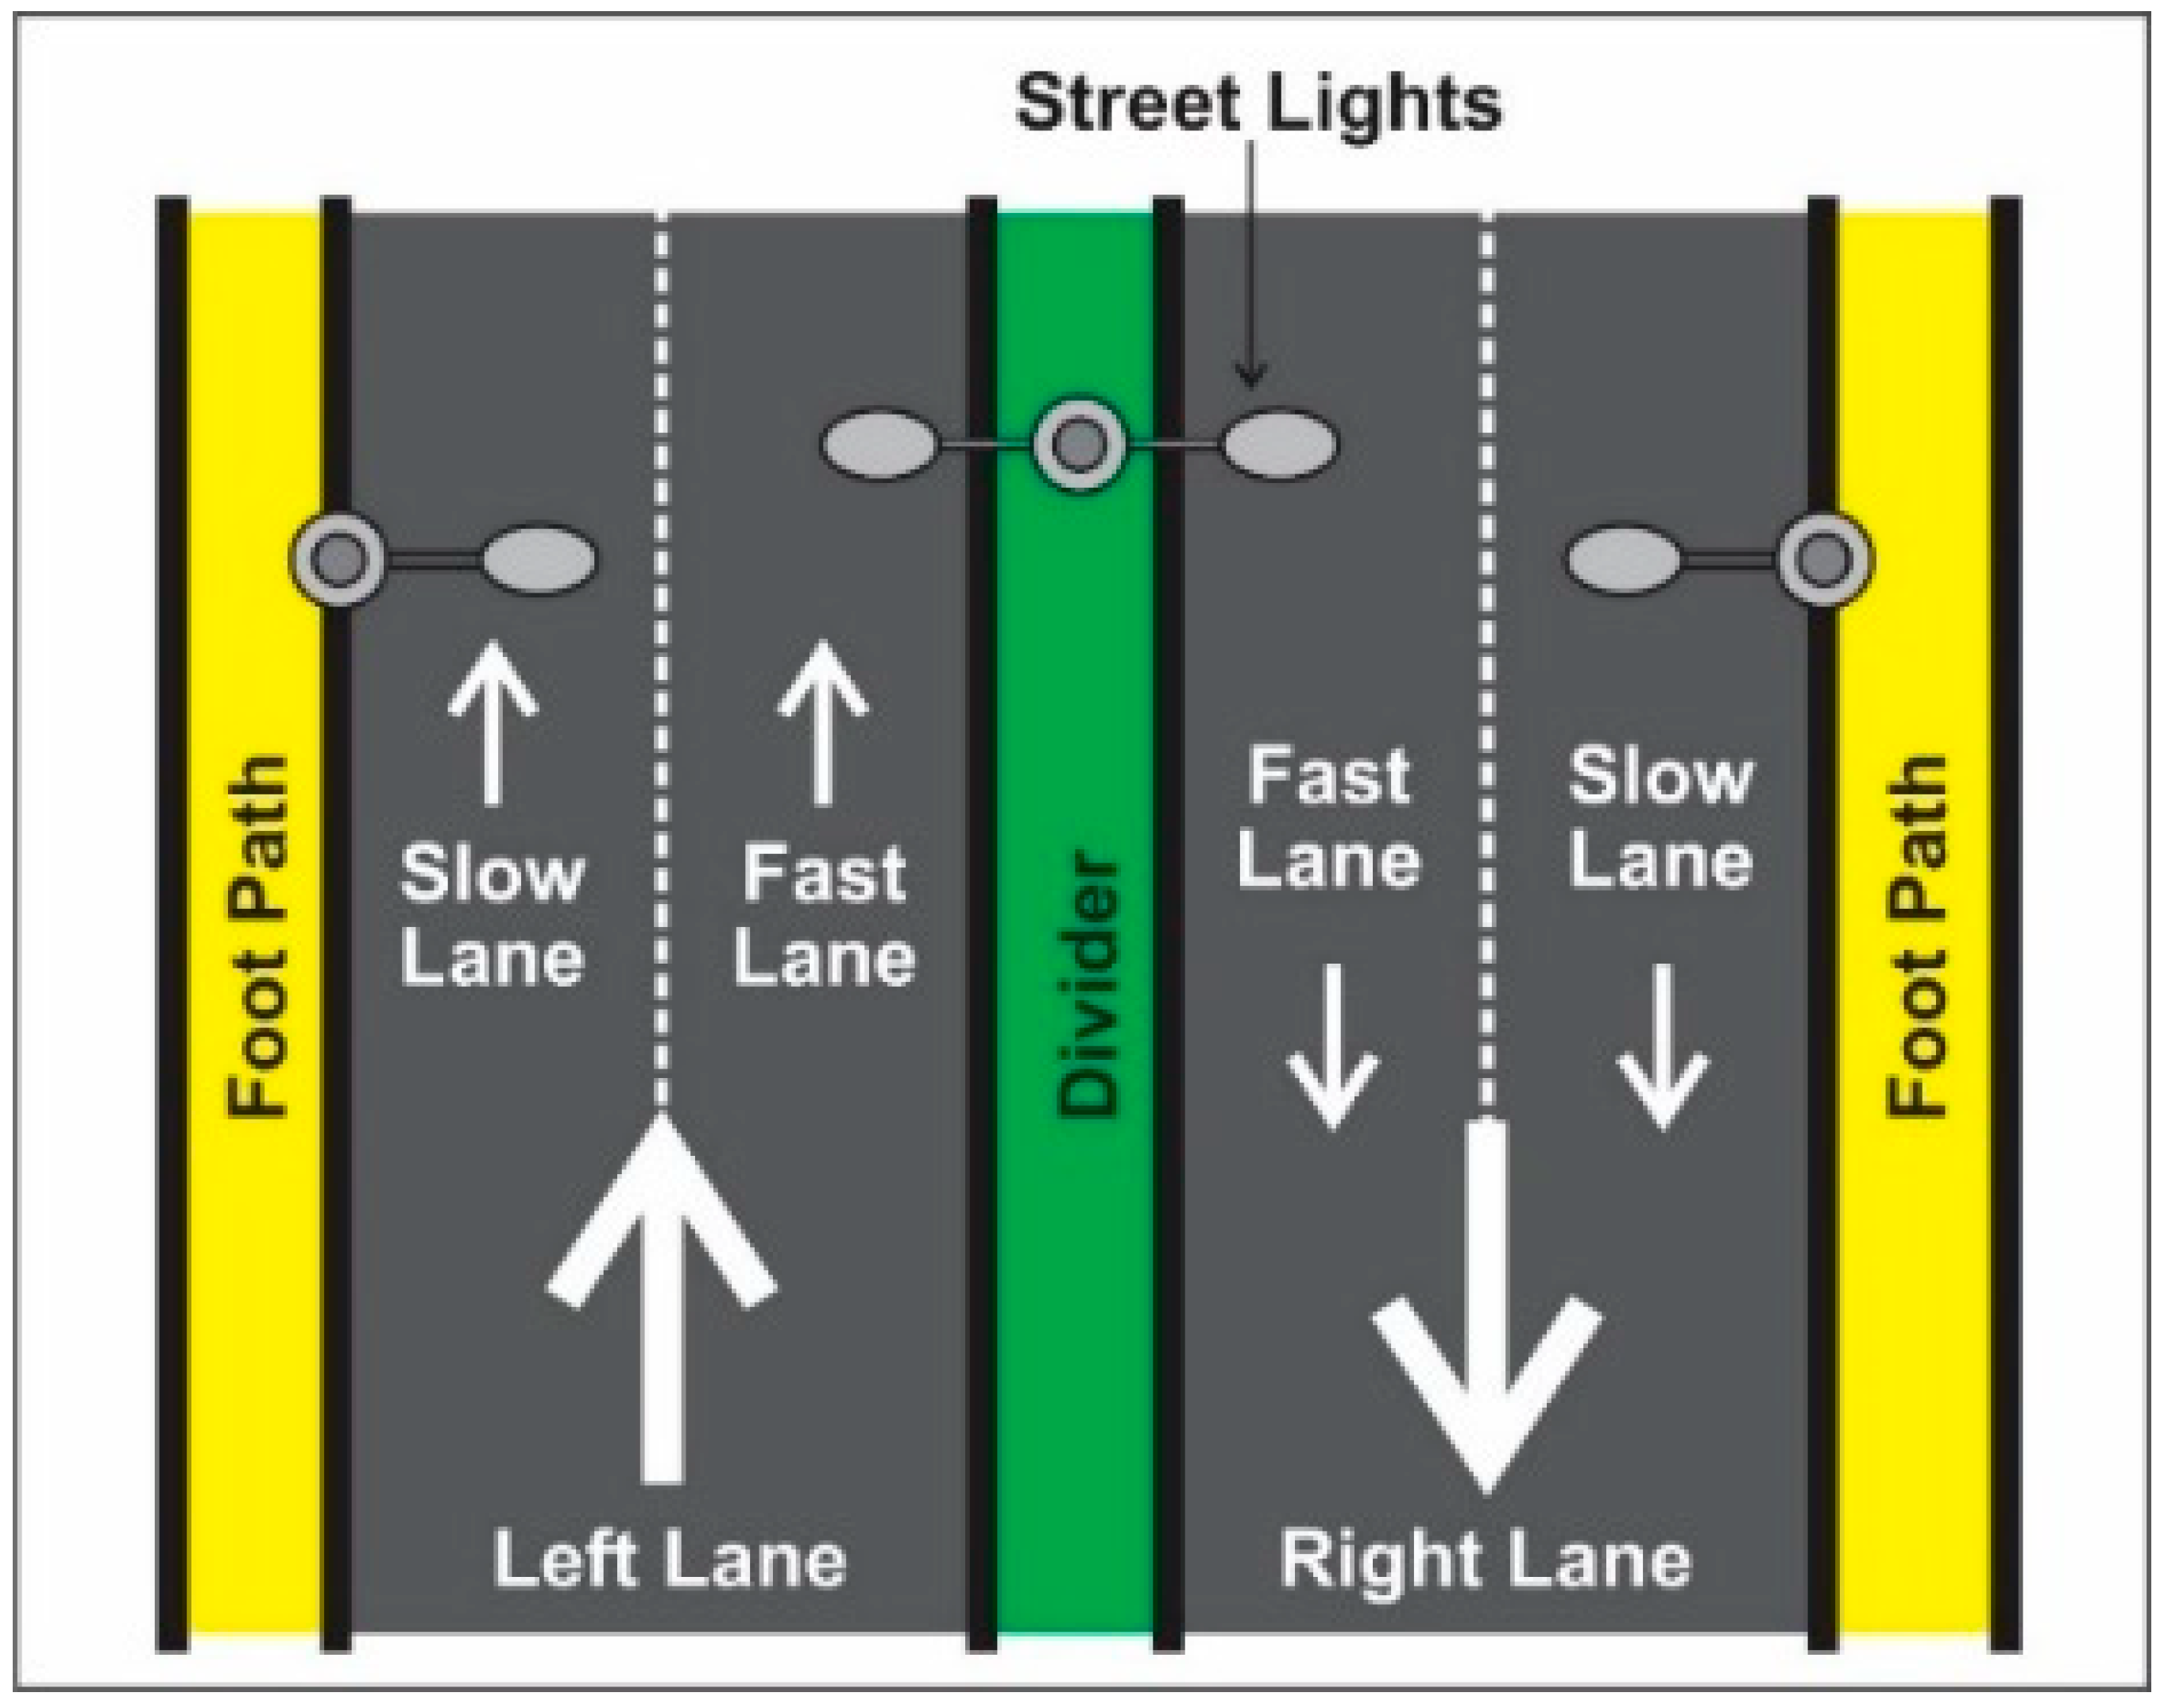
The roads are divided into various lanes to maintain some discipline on roadways for the smooth functioning of vehicles. To understand the proposed signage system, various road maps and accident possibilities are described and discussed here. The road is divided into two lanes—the left lane and right lane (please see Figure 1). The left or right lane is then separated into multiple lanes to channelize the lanes for various requirements and maintain a systematic approach to traffic.
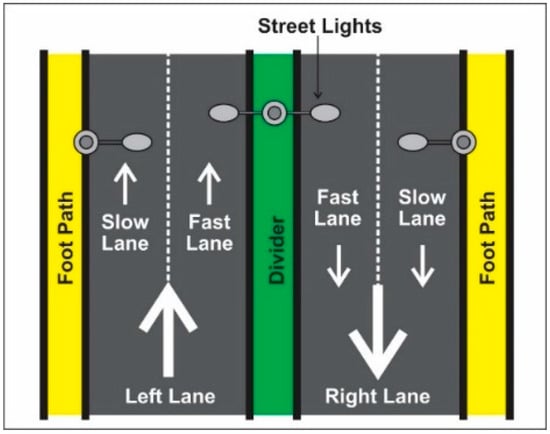
Figure 1.
Road lanes, footpaths, street lights, and divider as infrastructure to understand the road and possibilities on Indian roadways.
Possibility 1: The road is divided into two parts—left lane and right lane. On main roads, these roadways are further divided into fast or slow lanes by painting white strips directly onto the road. On some roads, there is a provision for dual carriage way dividers that divide the road into two parts. They have available signage for the same. However, it has been observed that this division on some roads is achieved with a white painted strip. In places where the road is narrow, or there is a bridge, the navigable roadway is divided by separators into separate lanes to avoid vehicular congestion. These fixed objects placed immediately after the white painted strip on the road become a major cause for vehicular accidents due to low visibility of these structures, especially after the painted white strips.
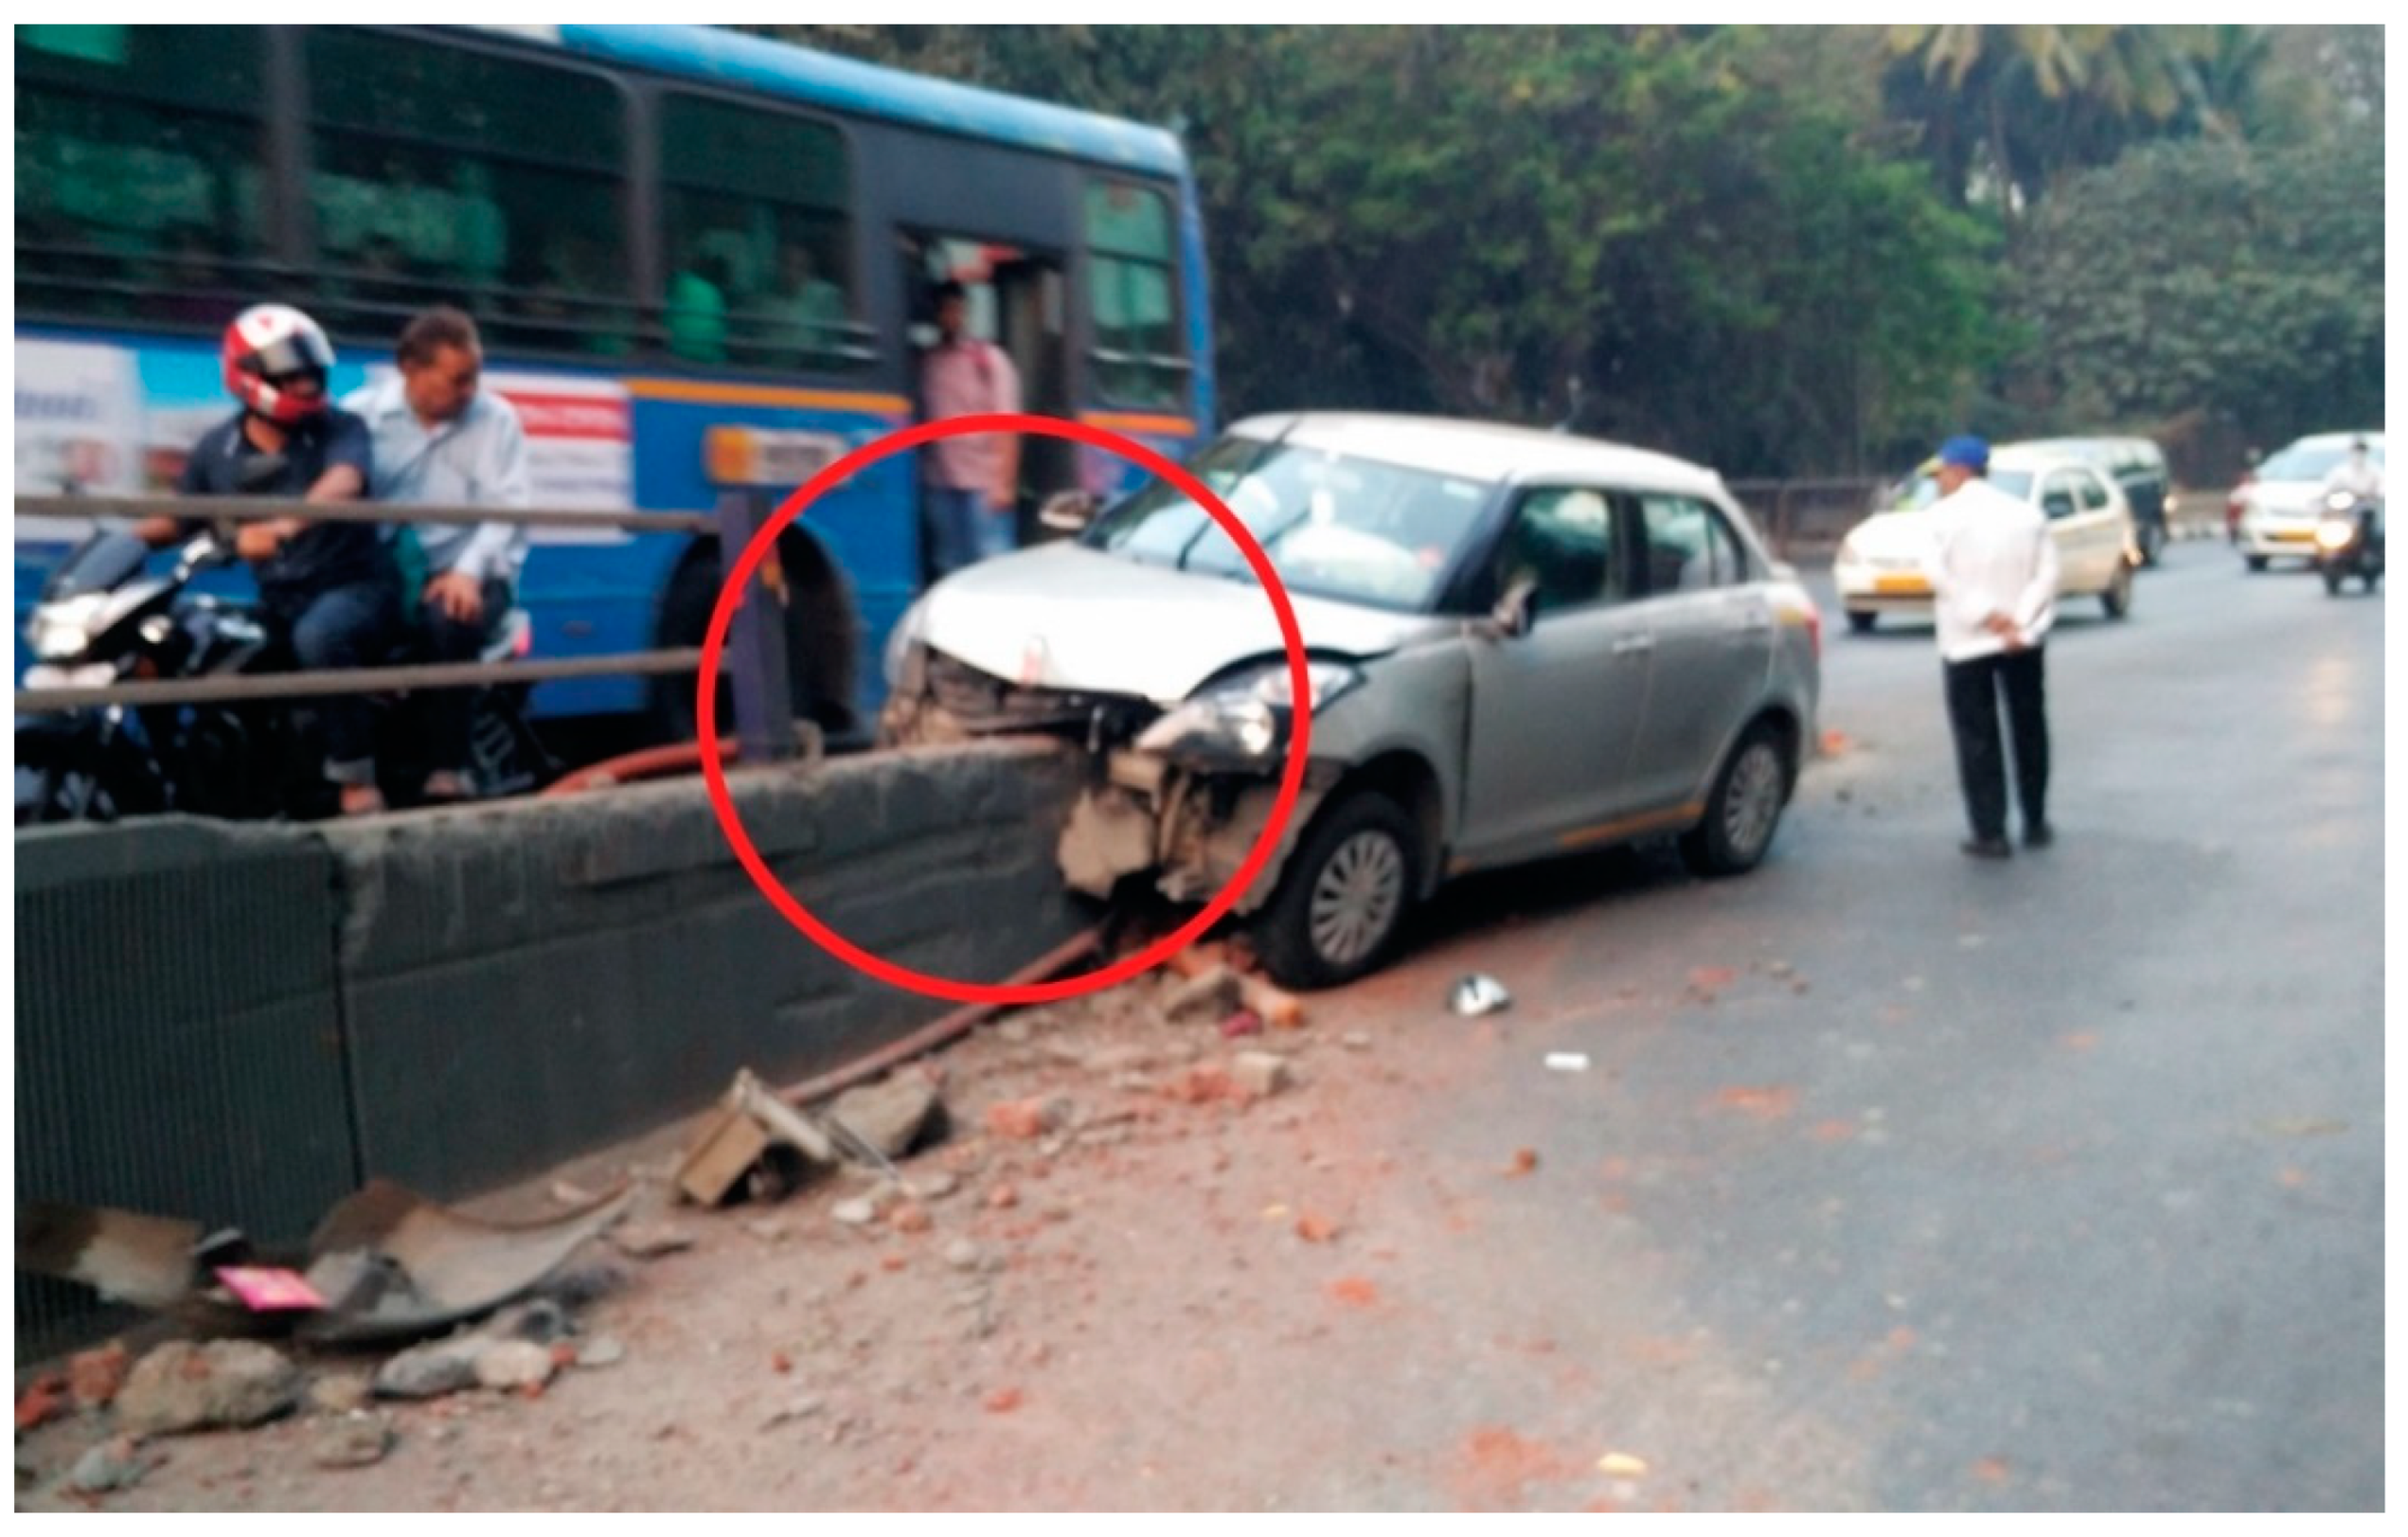
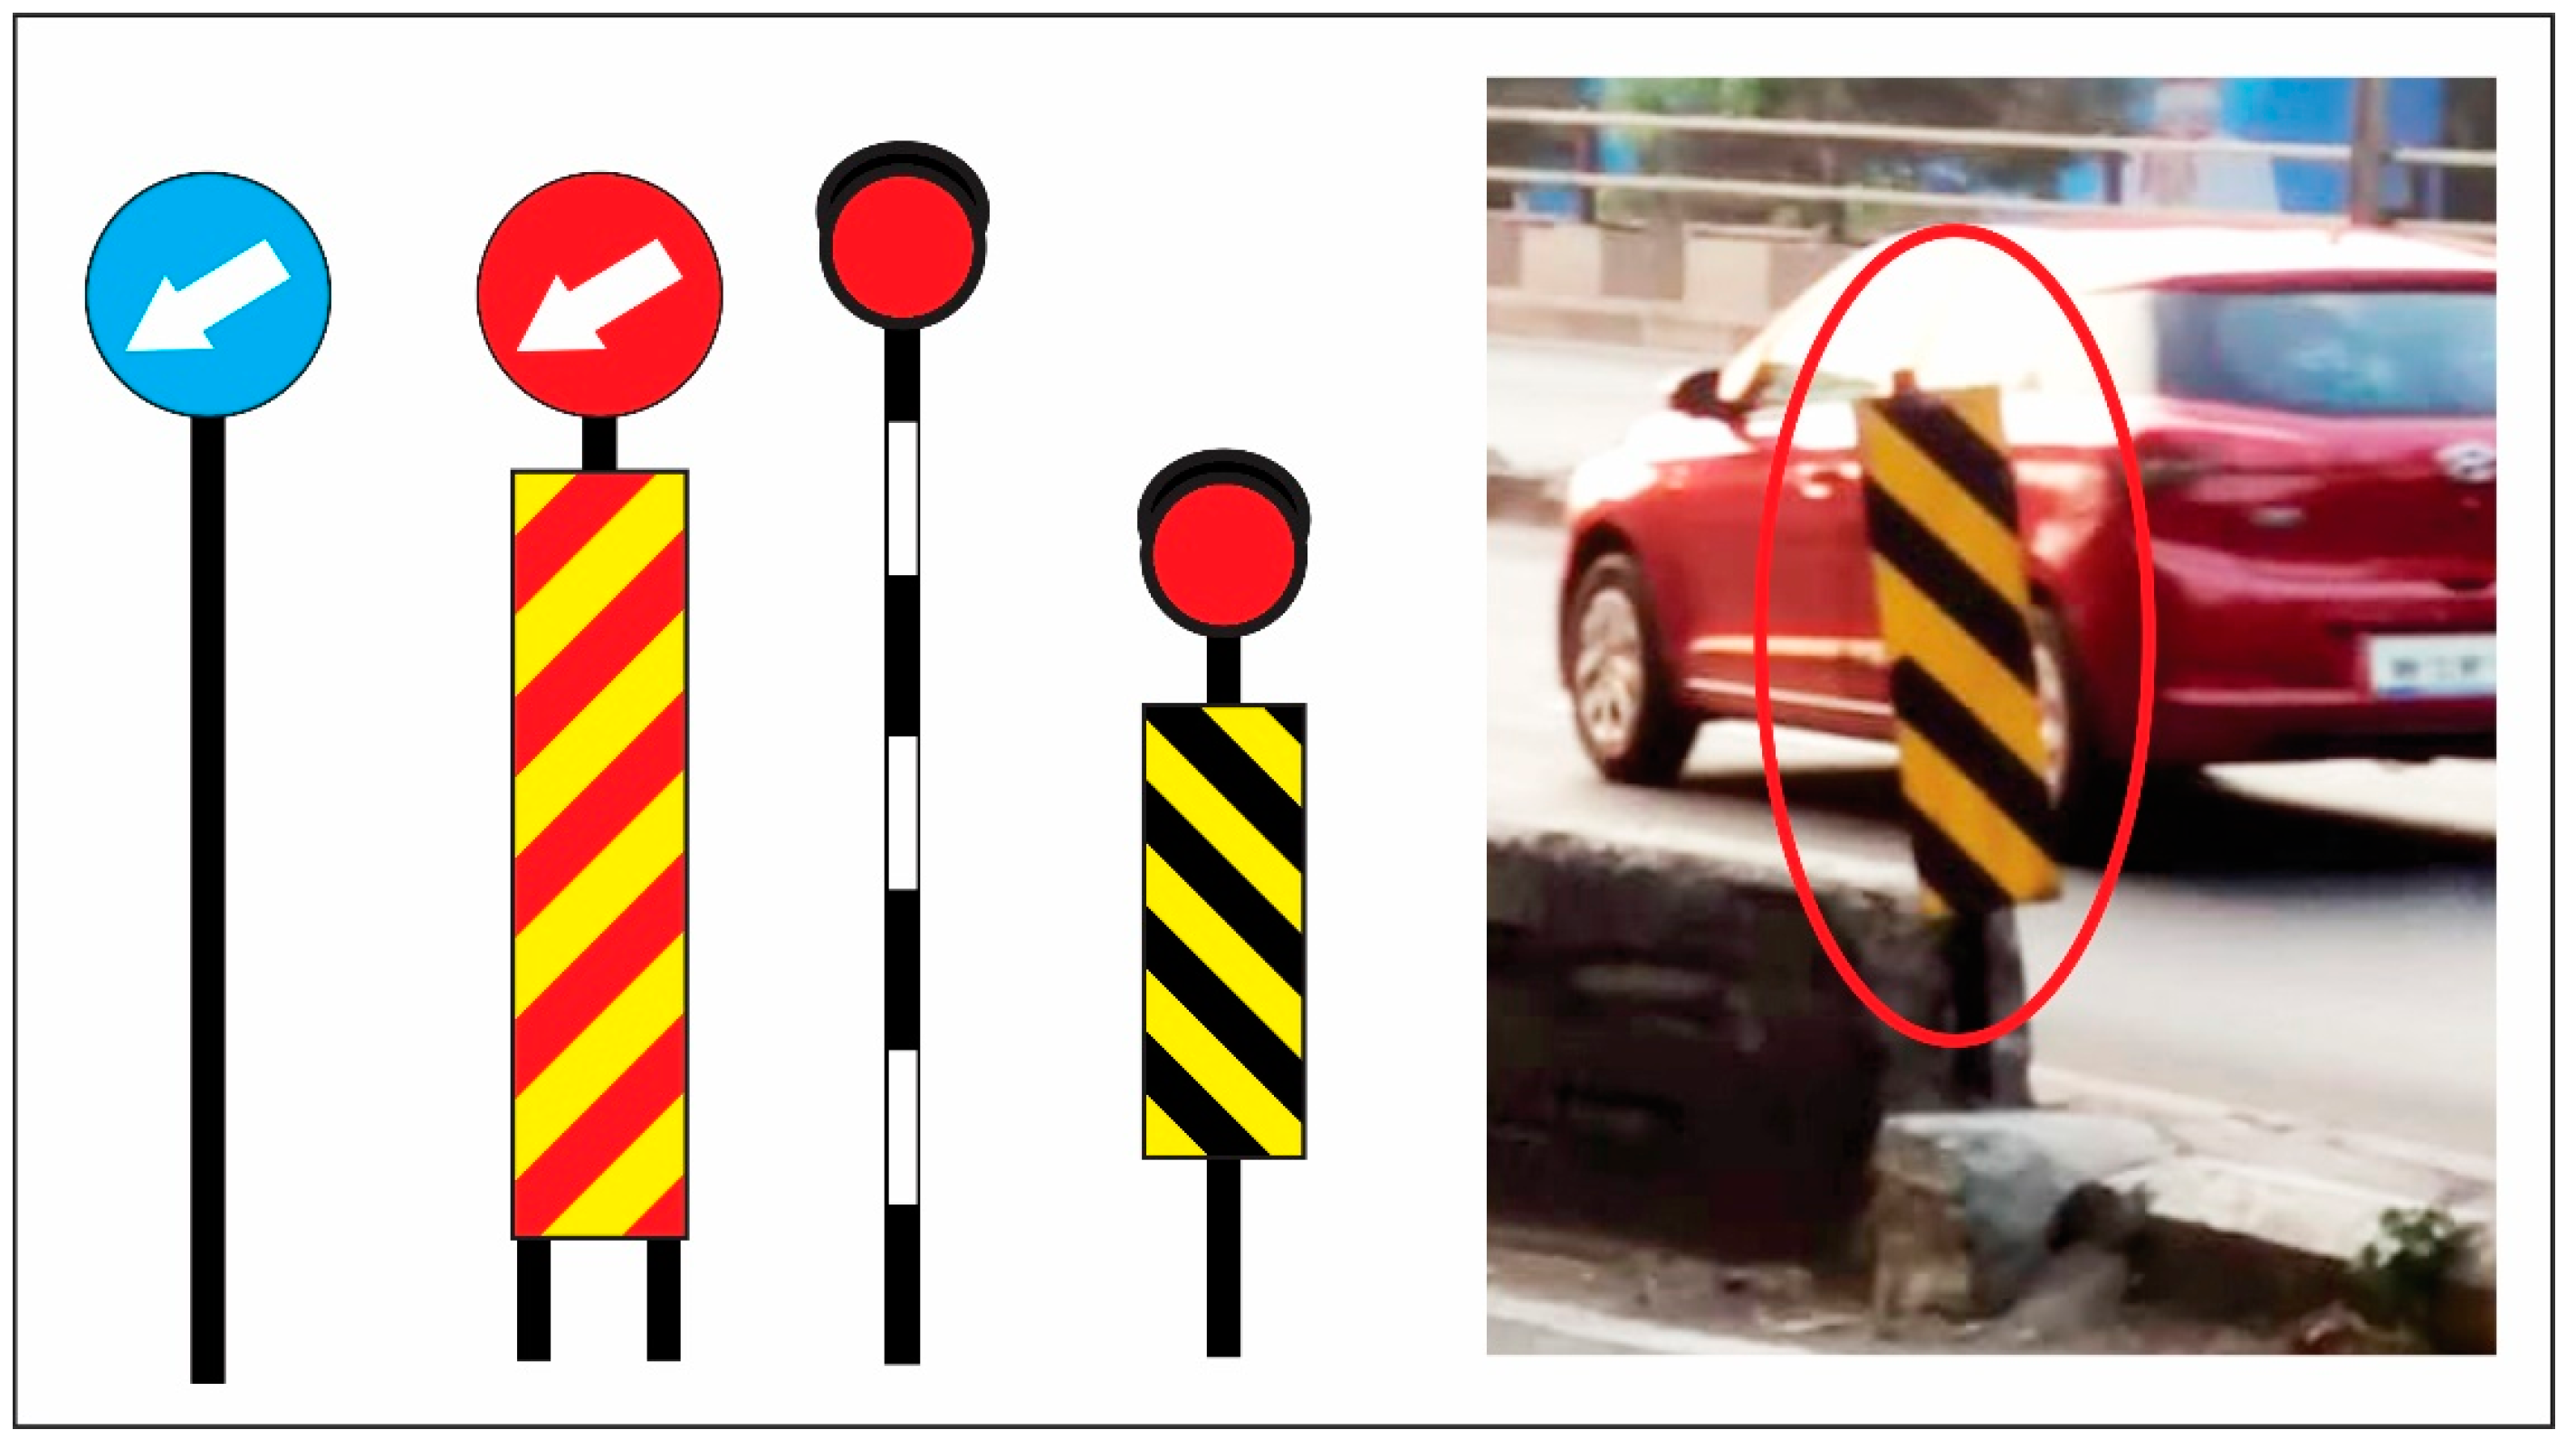
Possibility 2: On some roads, an over- or under bridge is installed to avoid haphazard pedestrian crossing, save time, and structure traffic on cross roads and signals. The fixed object or barricade that separates the bridge from the main lane becomes an obstruction to the steady flow of traffic, due to lack of visibility (refer to Figure 2).

Figure 2.
Actual image from the location, how an accident takes place on a divider.
Possibility 3: For smooth functioning of local transport systems such as buses and ambulances, there is a separate lane on some roads. In the state of Maharashtra, in India, such lanes are called BRT lanes (Public Transport Buses Lane). To create a demarcation of these special lanes from the free flow lanes, barricades or walls are constructed. The main purpose of these lanes is to ensure smooth functioning of BRT buses, regulate traffic, and ensure fast and smooth public services.
Possibility 4: Separate lanes are constructed on some roads to connect villages or to avoid local traffic on fast-flowing main roads. These lanes are called service roads.
For the aforementioned conditions, dividers have been installed to further channelize the flow of traffic and help navigate the roadways in a systematic manner. Unfortunately, these separators have become a major cause for roadside accidents. This can mainly be attributed to the ignorance of installing “Divider Ahead” signage to alert incoming traffic of such installations. To alert the users, a separate visual signage system is thus required.
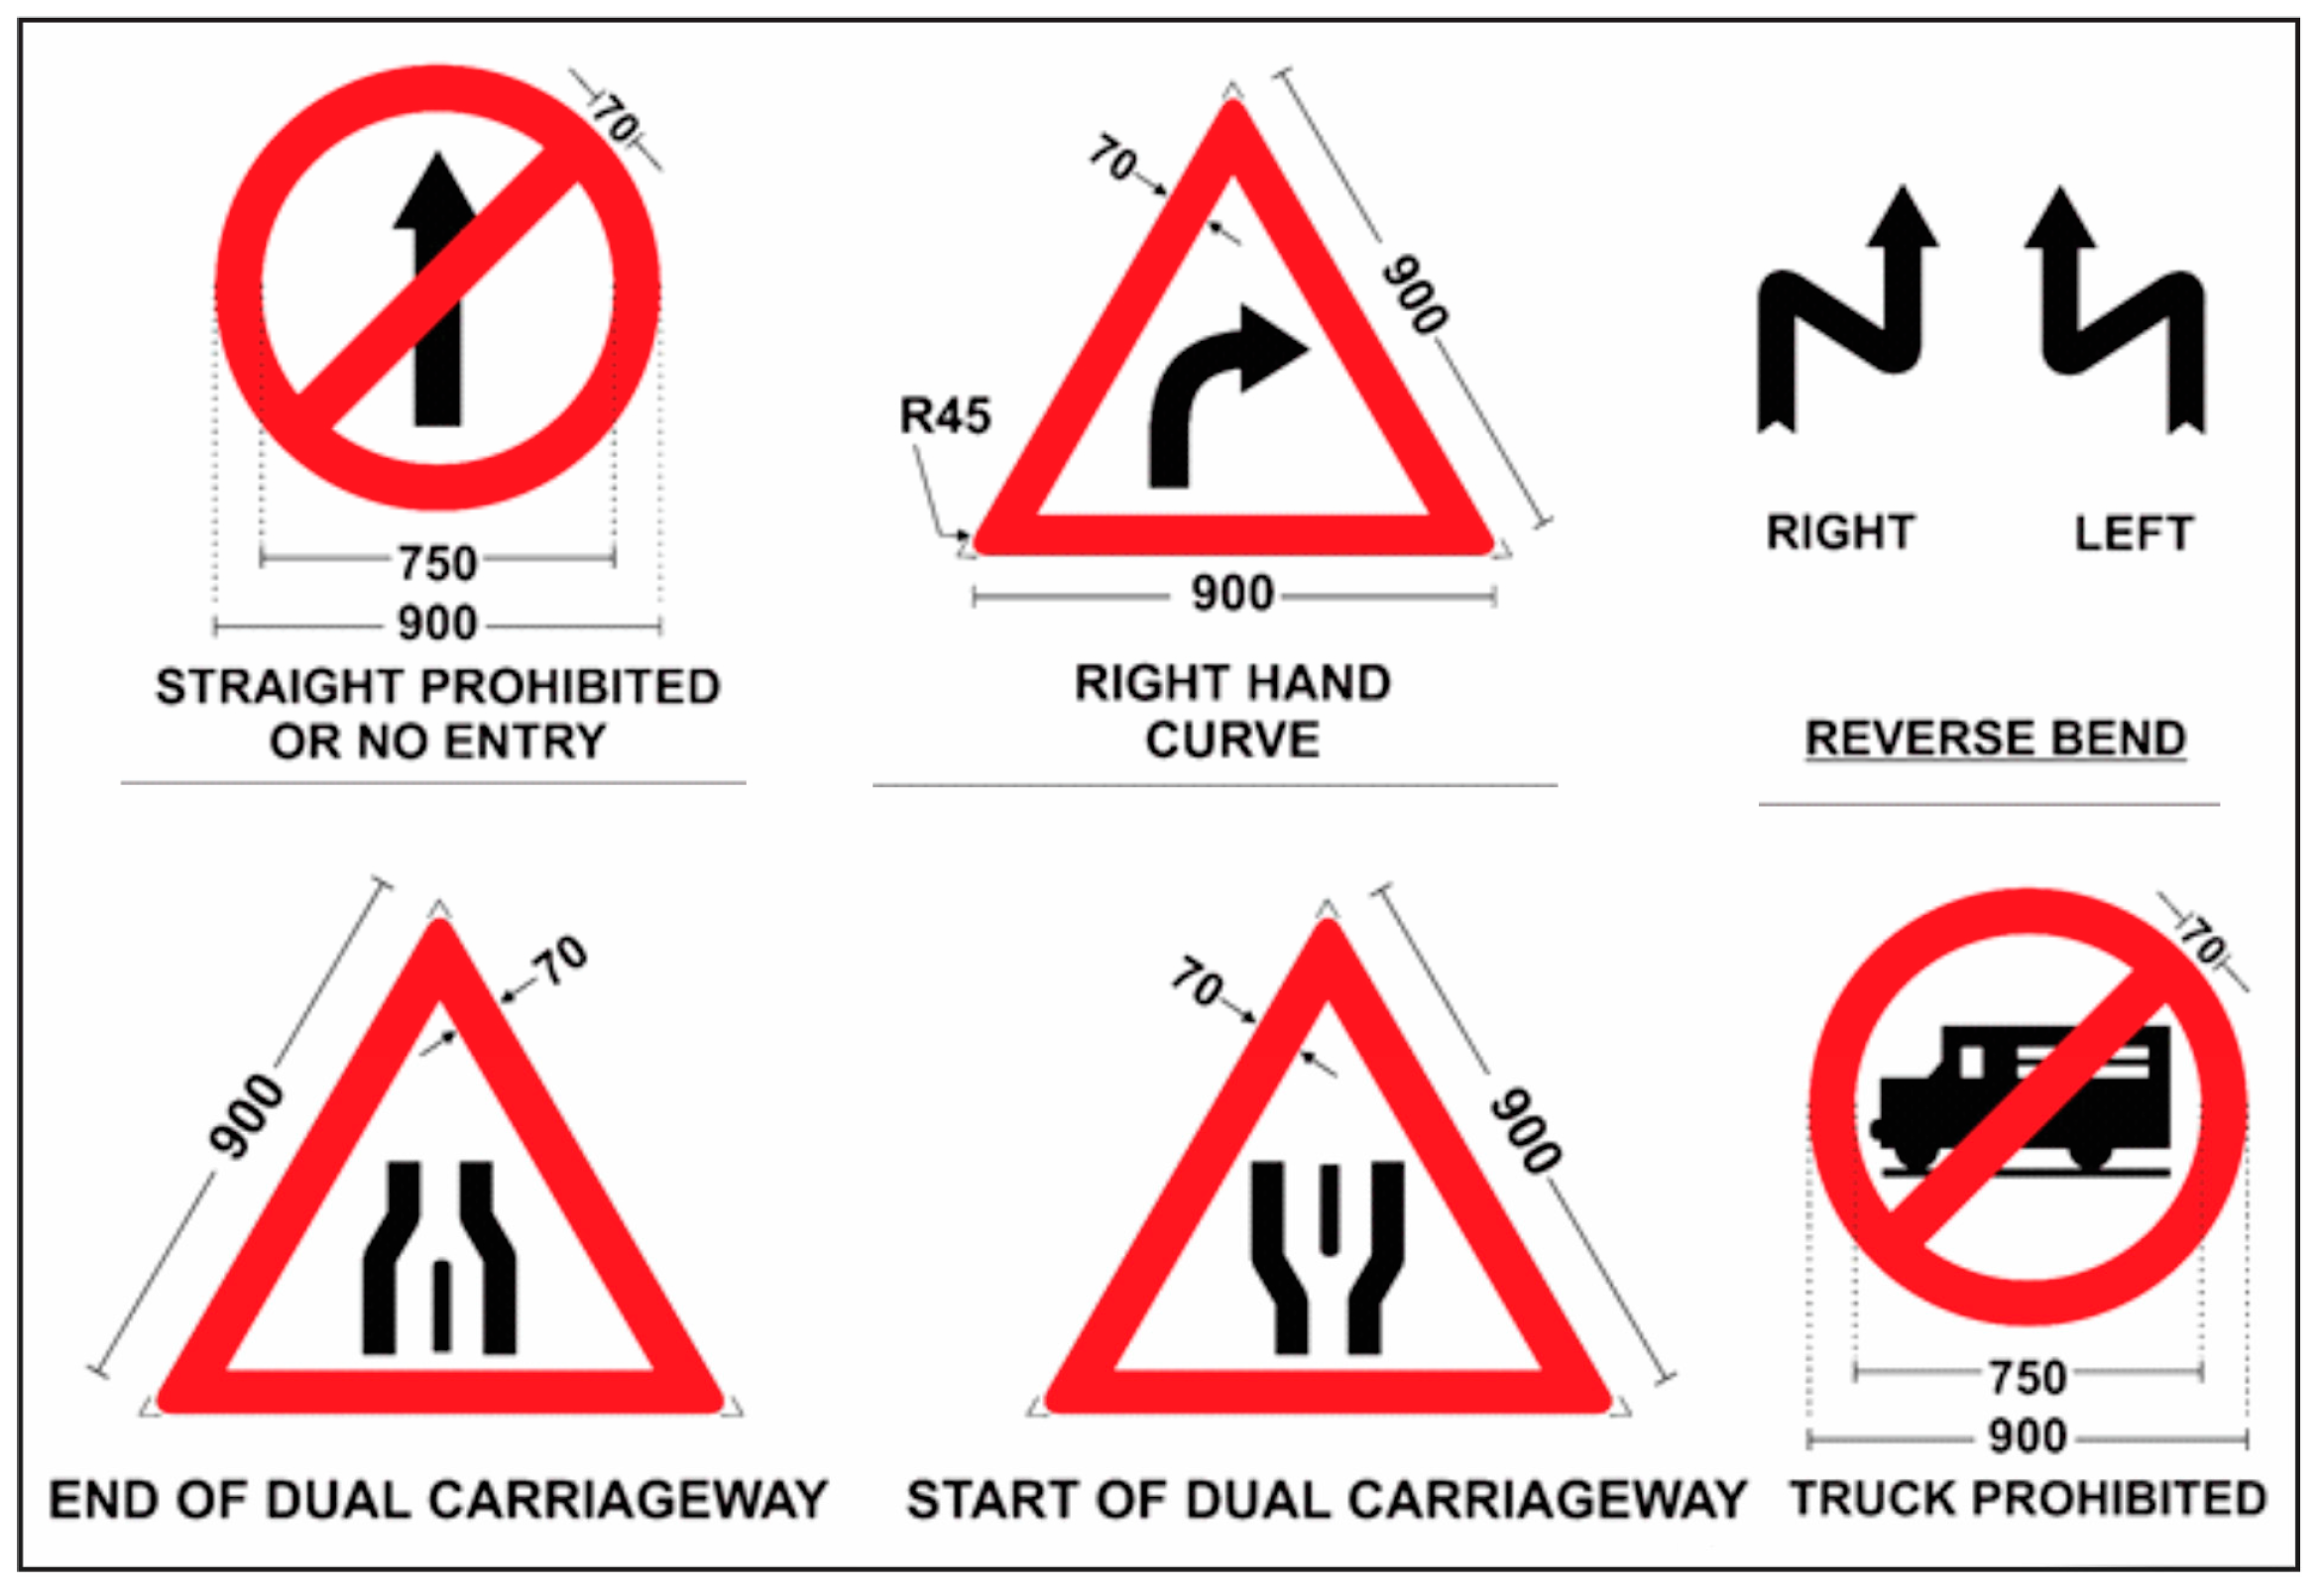
The proposed signage system is developed by referring to the current signage system visual language. The Traffic Signage System document published by the Ministry of Road Transport and Highways, Government of India, is studied to further understand the specifications and technical aspects of roadway signage systems in India. Some samples from the same are documented (refer to Figure 3).

Figure 3.
Sign samples with shape, color, and technical specification.
The system feels that the installation of temporary signs on the very front of the divider completes their responsibility of alerting vehicles to the obstructions, as mentioned above in possibilities 1, 2, and 3. One lane continues on the ground level and the other lane continues as a flyover bridge. This particular observation was made at an actual location and inspired deep study and analysis of the cause of divider-related accidents; please refer to Figure 2.
There are many instructions and guidelines available from the Ministry of Road Transport and Highways, Government of India, regarding the road and its related construction and maintenance guidelines. The study was conducted so as to maintain the same visual language for the new proposed signs to alert vehicles to sudden dividers or obstructions on the road.
Installation of Signs on Roadways
The Ministry of Road Transport and Highways [2], Government of India, make available the guidelines for signage installation and also publish annual reports. These are available on their website. Please find below one of the samples, prescribed for signage sizes for local agencies or concerned departments while installing/preparing the signs on the road. The same book lists all necessary specifications to the visual guide of the signs. Some visual signs are listed below to highlight the particular shapes of the board, colors, sizes, and technical specifications as mentioned by the Ministry; please refer to Figure 3.
These signs are selected directly from the document to study the arrow size specifications, color palette, technical aspects of grid and layout of the sign, etc. Viewing distance specifications ensure that optimum distance is maintained for the user to view the sign, perceive the information, and subsequently follow the instruction specified. The graphic aspect in all signs is optimized and simplified for the user to quickly grasp the information. The red colored borders bring attention to the sign. The white background with the red and black elements maintains sufficient contrast to ensure ease of viewing from a distance. The sign installation departments from respective states follow all these guidelines to support similarity and consistency in all signs throughout the country. With careful research carried out on the existing signage system, the new signs proposed are designed while keeping in mind the preservation of consistency in the prevailing visual language.
2.3. Divider between the Roads for Separating Lanes
The road is mainly divided into two parts (refer to Figure 1). In some cases, there are one-way roads that are further divided into sub-lanes. Roadways are also divided for left- or right-side villages through connectivity lanes. Such lanes are mainly required on National Highways where local villages are located on either side of the main roads. The road is also divided near the signals for left turn. The various conditions and scenarios captured here are discussed in the detailed study.
2.3.1. Lane Separated for Local Bus Rapid Transit Route (BRT), by Pune Municipal Corporation
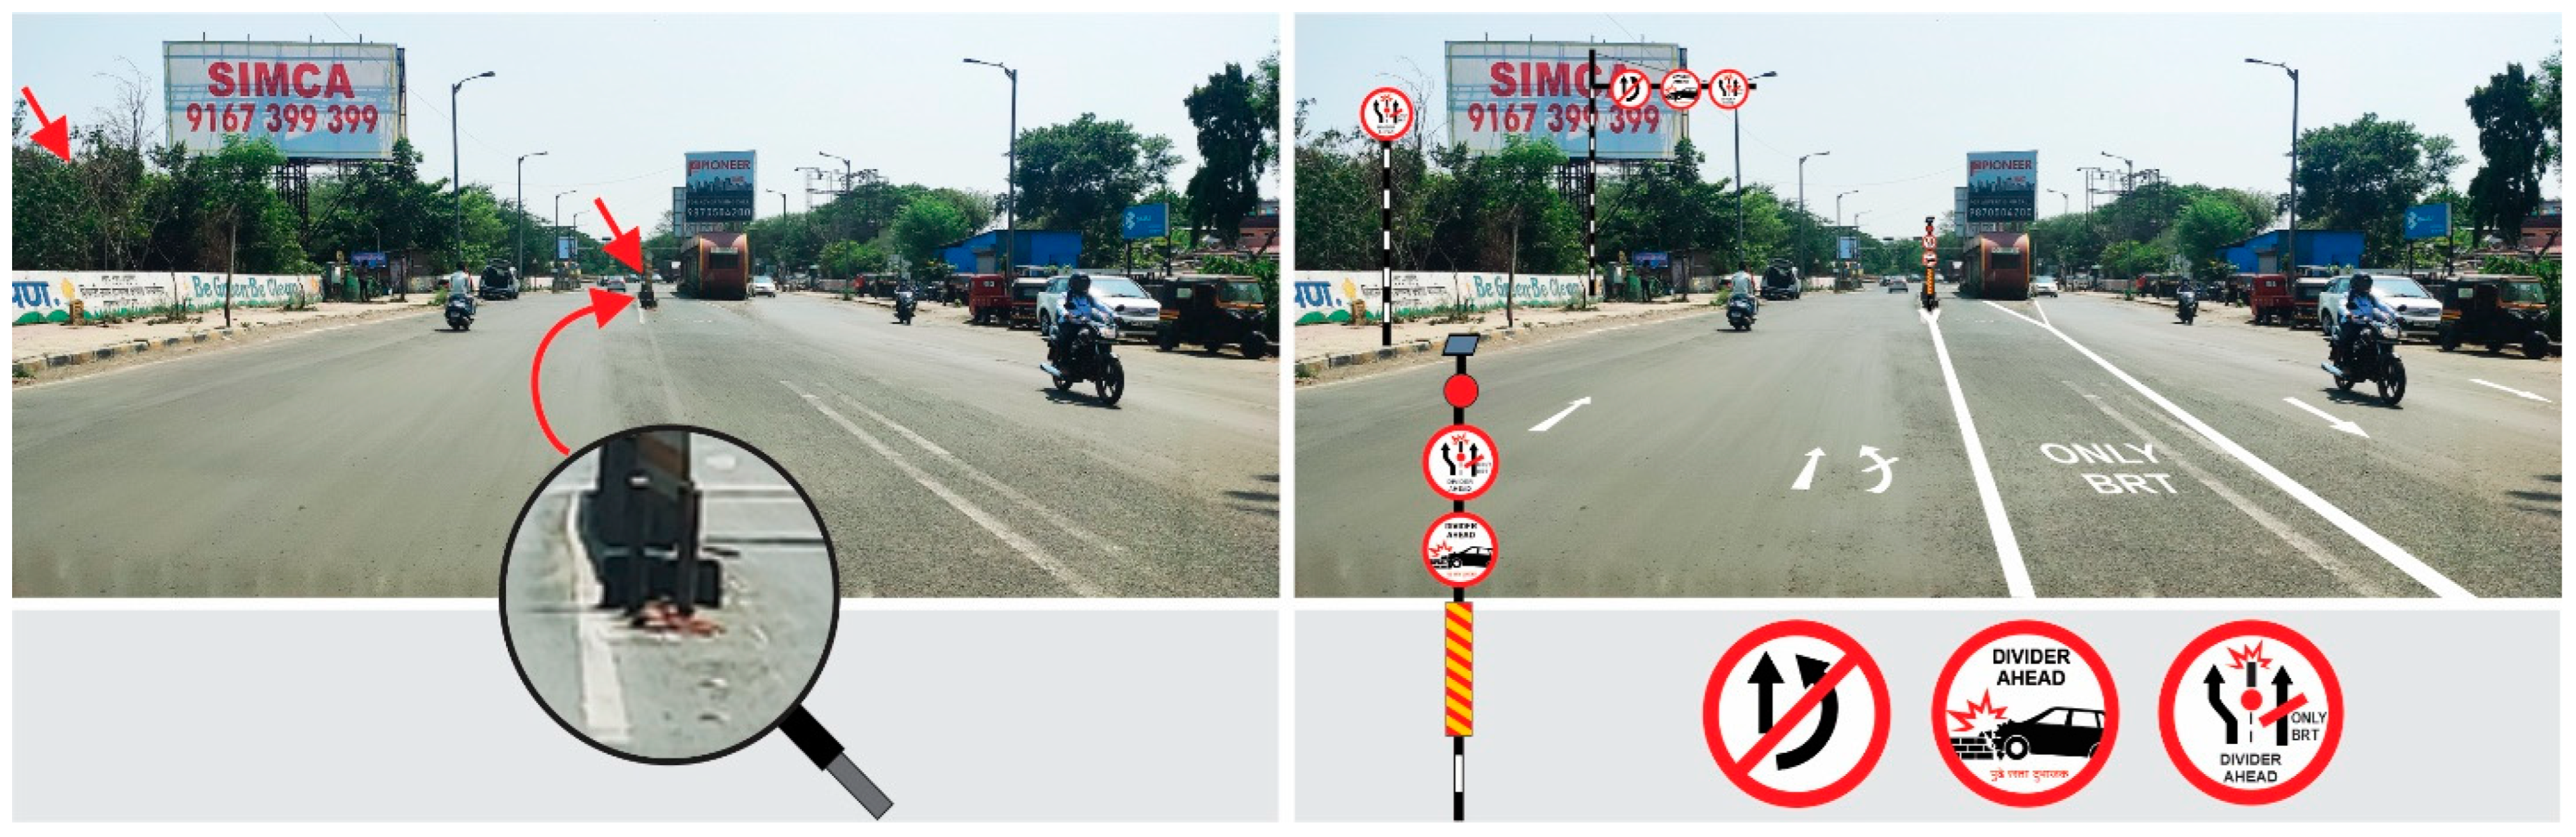
According to Possibility 1 mentioned above, in some parts of developed cities, there is a separate lane for public transport buses for fast and smooth operation of traffic. Due to insufficient width of the divided space provided for a “Bus Lane”, in some cases, buses move within the common channel instead of the separate lane. These are made with metal or constructed barricade dividers or fixed objects. Such dividers are sudden interferences in the flow of traffic due to their placement in the middle of the road. No visibility of the same often creates collisions and multiple vehicle pile-ups.
To alert the oncoming traffic of such obtrusions, some flat board or panel with strips is installed. These plates usually accumulate dust, which affects visibility. In Figure 4, the current scenario, the plate is installed to separate the lane, and the graphical representation of the proposed signs is represented digitally for “Divider Ahead Alert”. To alert vehicles about the BRT route, the current solutions are also displayed in Figure 5.

Figure 4.
The multiple solutions seen on roads to show dividers. The current signage is displayed in the right part of the image within the red circle.
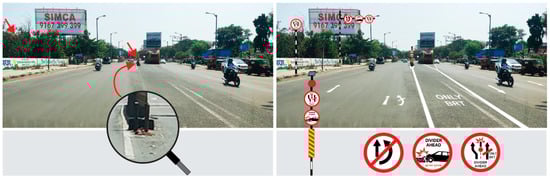
Figure 5.
The BRT Lane separates the local bus lane from the main lane.
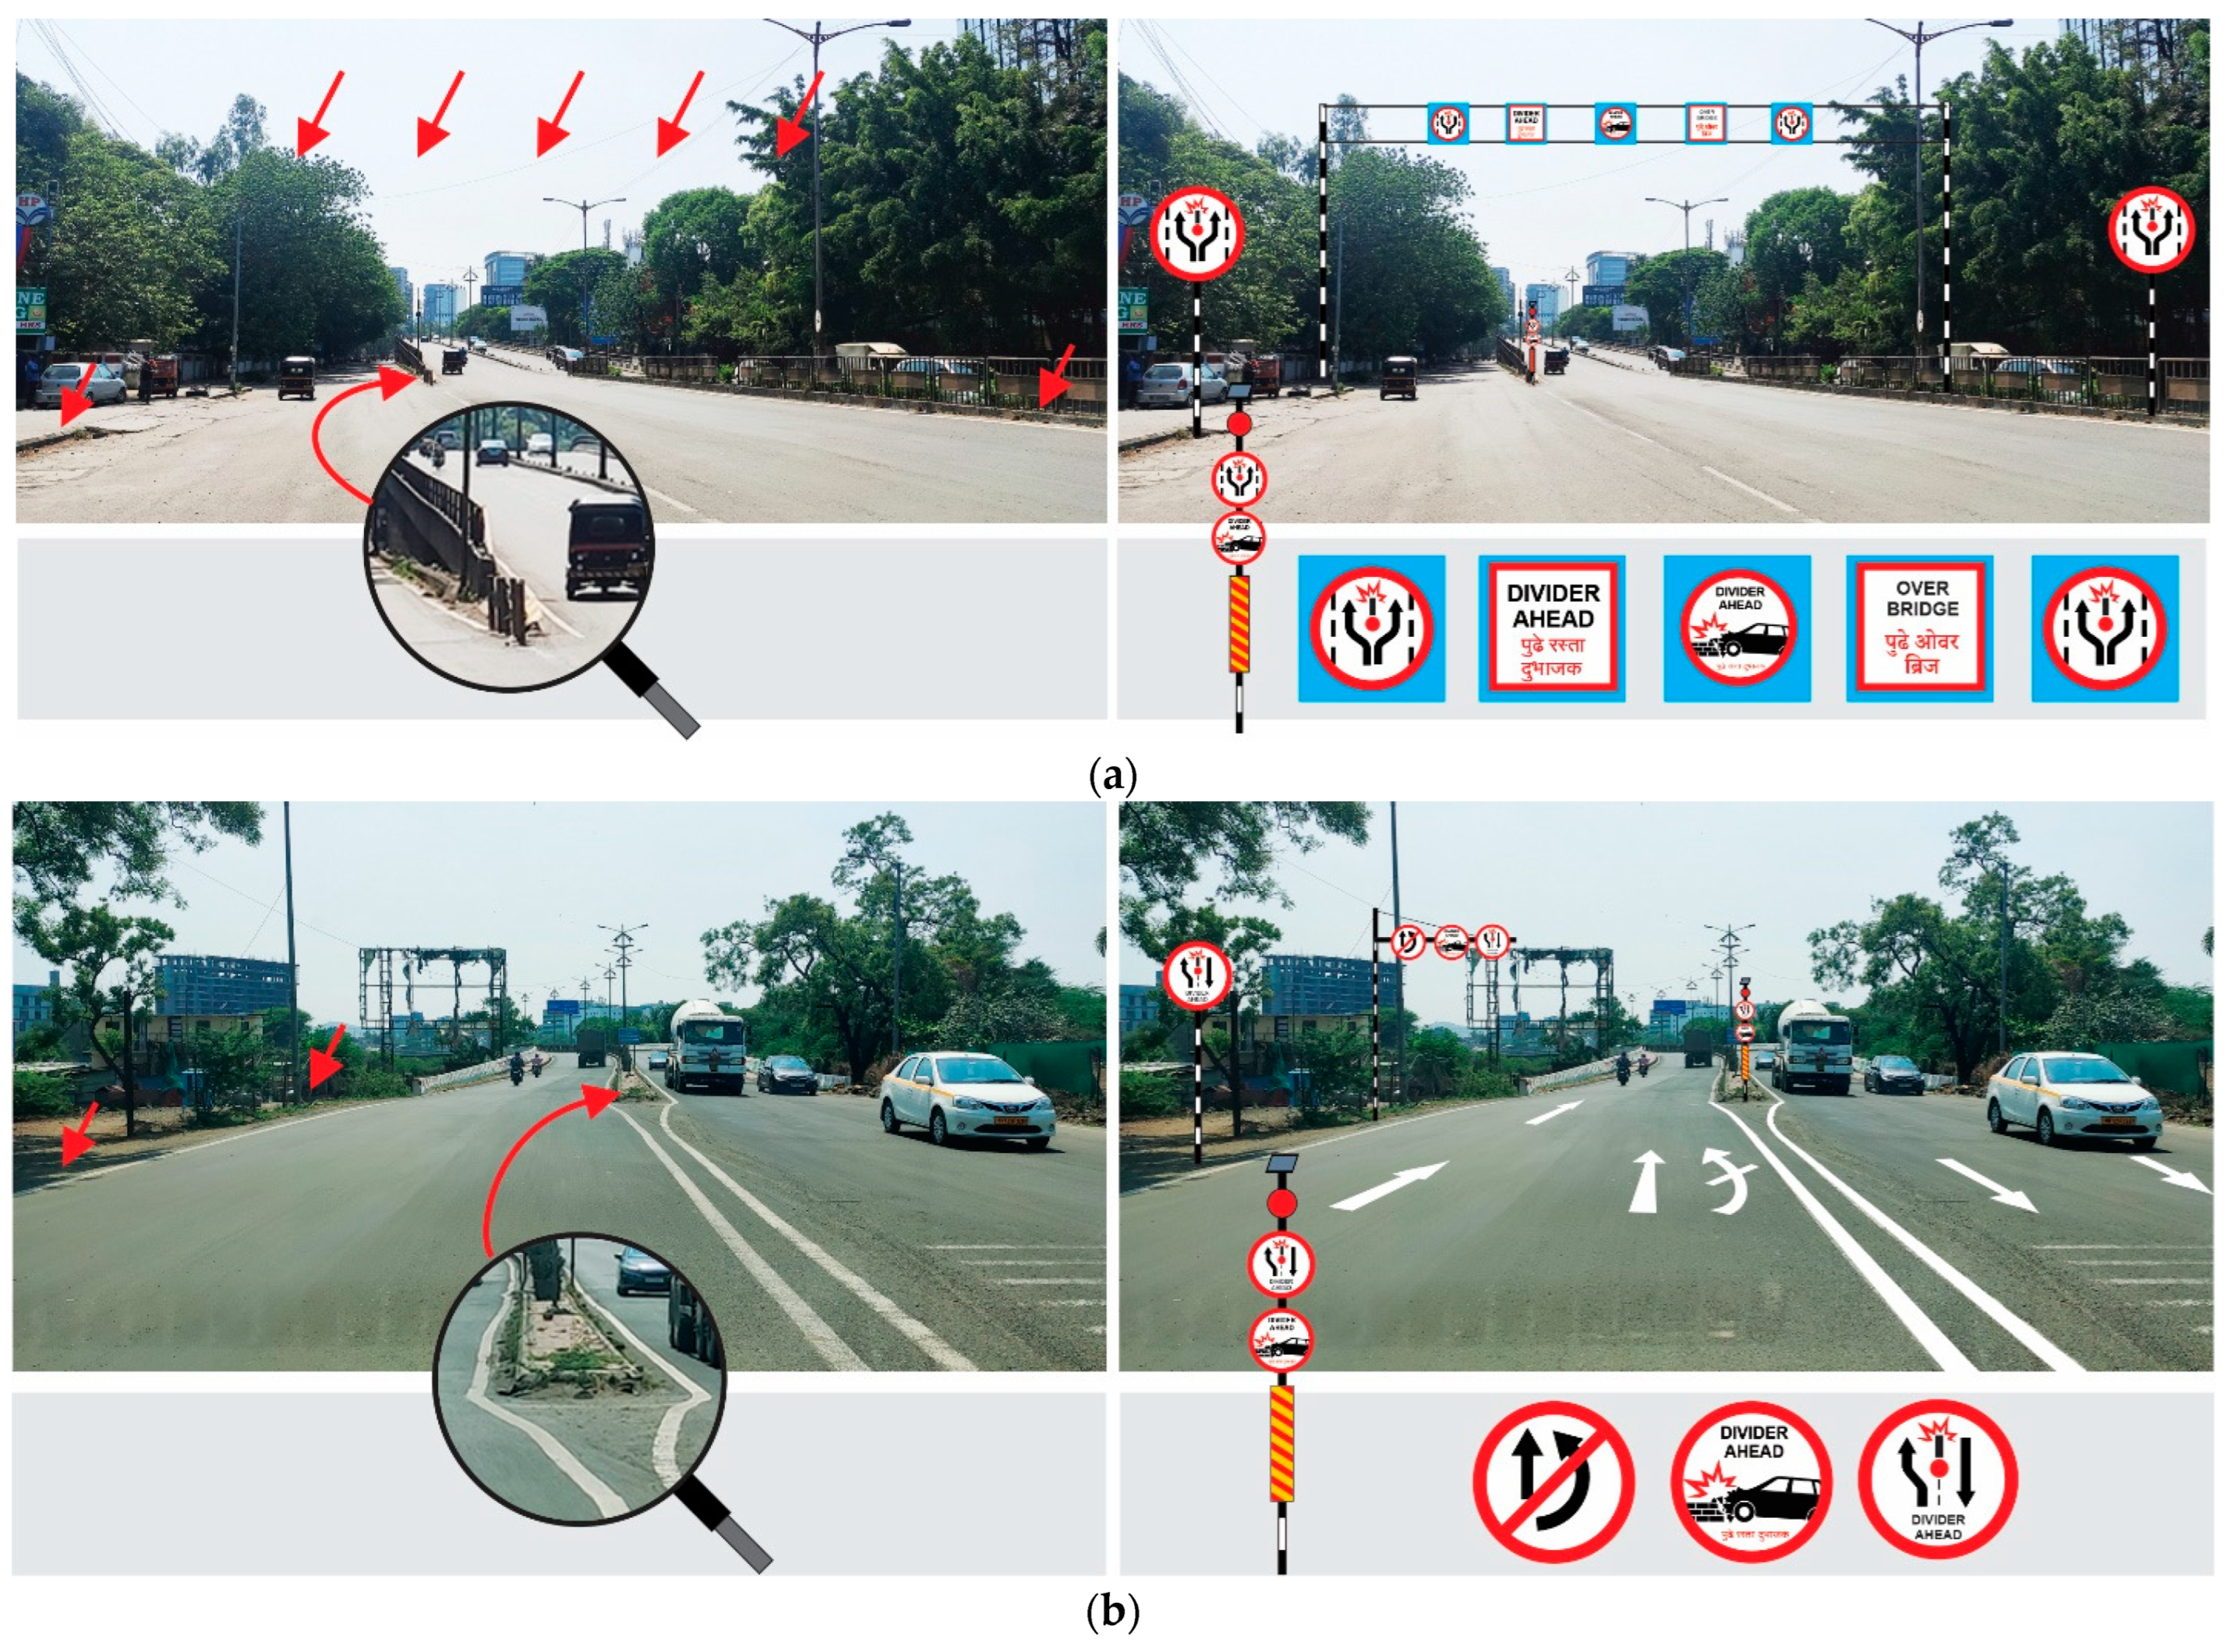
2.3.2. Lane Divided Due to over- or under Bridge on the Road
According to the possibility mentioned in the heading, on some roads there are over- or under bridge. Some vehicles choose to avail the bridge, to bypass the pedestrian crossings and save time. To separate the lane for the bridge and the left lane connecting to the underpass or local adjacent village, dividers are constructed and installed. The bridge wall itself plays the role of “Lane Separator Wall” on such roads. The concerned departments fail to display permanent alert signs in some areas where there is some kind of divider lane ahead. Such ignorance results in many accidents due to the abruptness of these dividers on the road. To alert the user of such dividers, this paper proposes some “Divider Ahead Alert” signage samples with the current scenario and graphical representation in Figure 6.
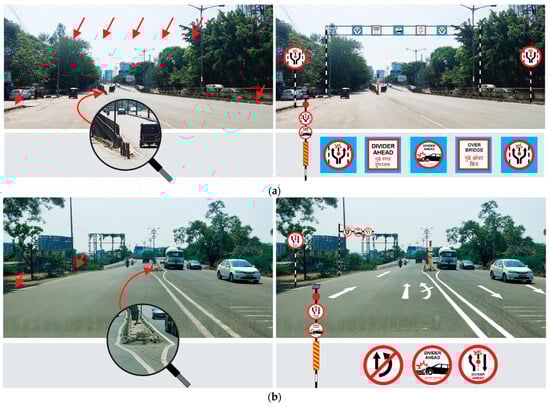
Figure 6.
(a) Example of Possibility 1: Lack of signage alerting incoming traffic of road diversion due to onset of overbridge wall. A strong visual signage system is required to alert users at least 1 km before the separator wall and control the speed of the vehicle. To strengthen the alertness of drivers, one more sign needs to be installed near the divider spot as well. (b) Lack of signage alerting incoming traffic of the sudden divider to avoid traffic jams. A strong proposed visual signage system is required to alert users.
2.3.3. Separator to Divide Lanes
Sometimes lines are drawn on both sides of the road separator or dividers, generally to prevent confusion about the direction, causing a traffic jam.
Although there are studies on safety and exit signs using eye-tracking [24] and evaluation of signage using eye-tracking techniques [25], hardly any studies address the negative consequences of improper application of divider caution signs.
3. Methodology
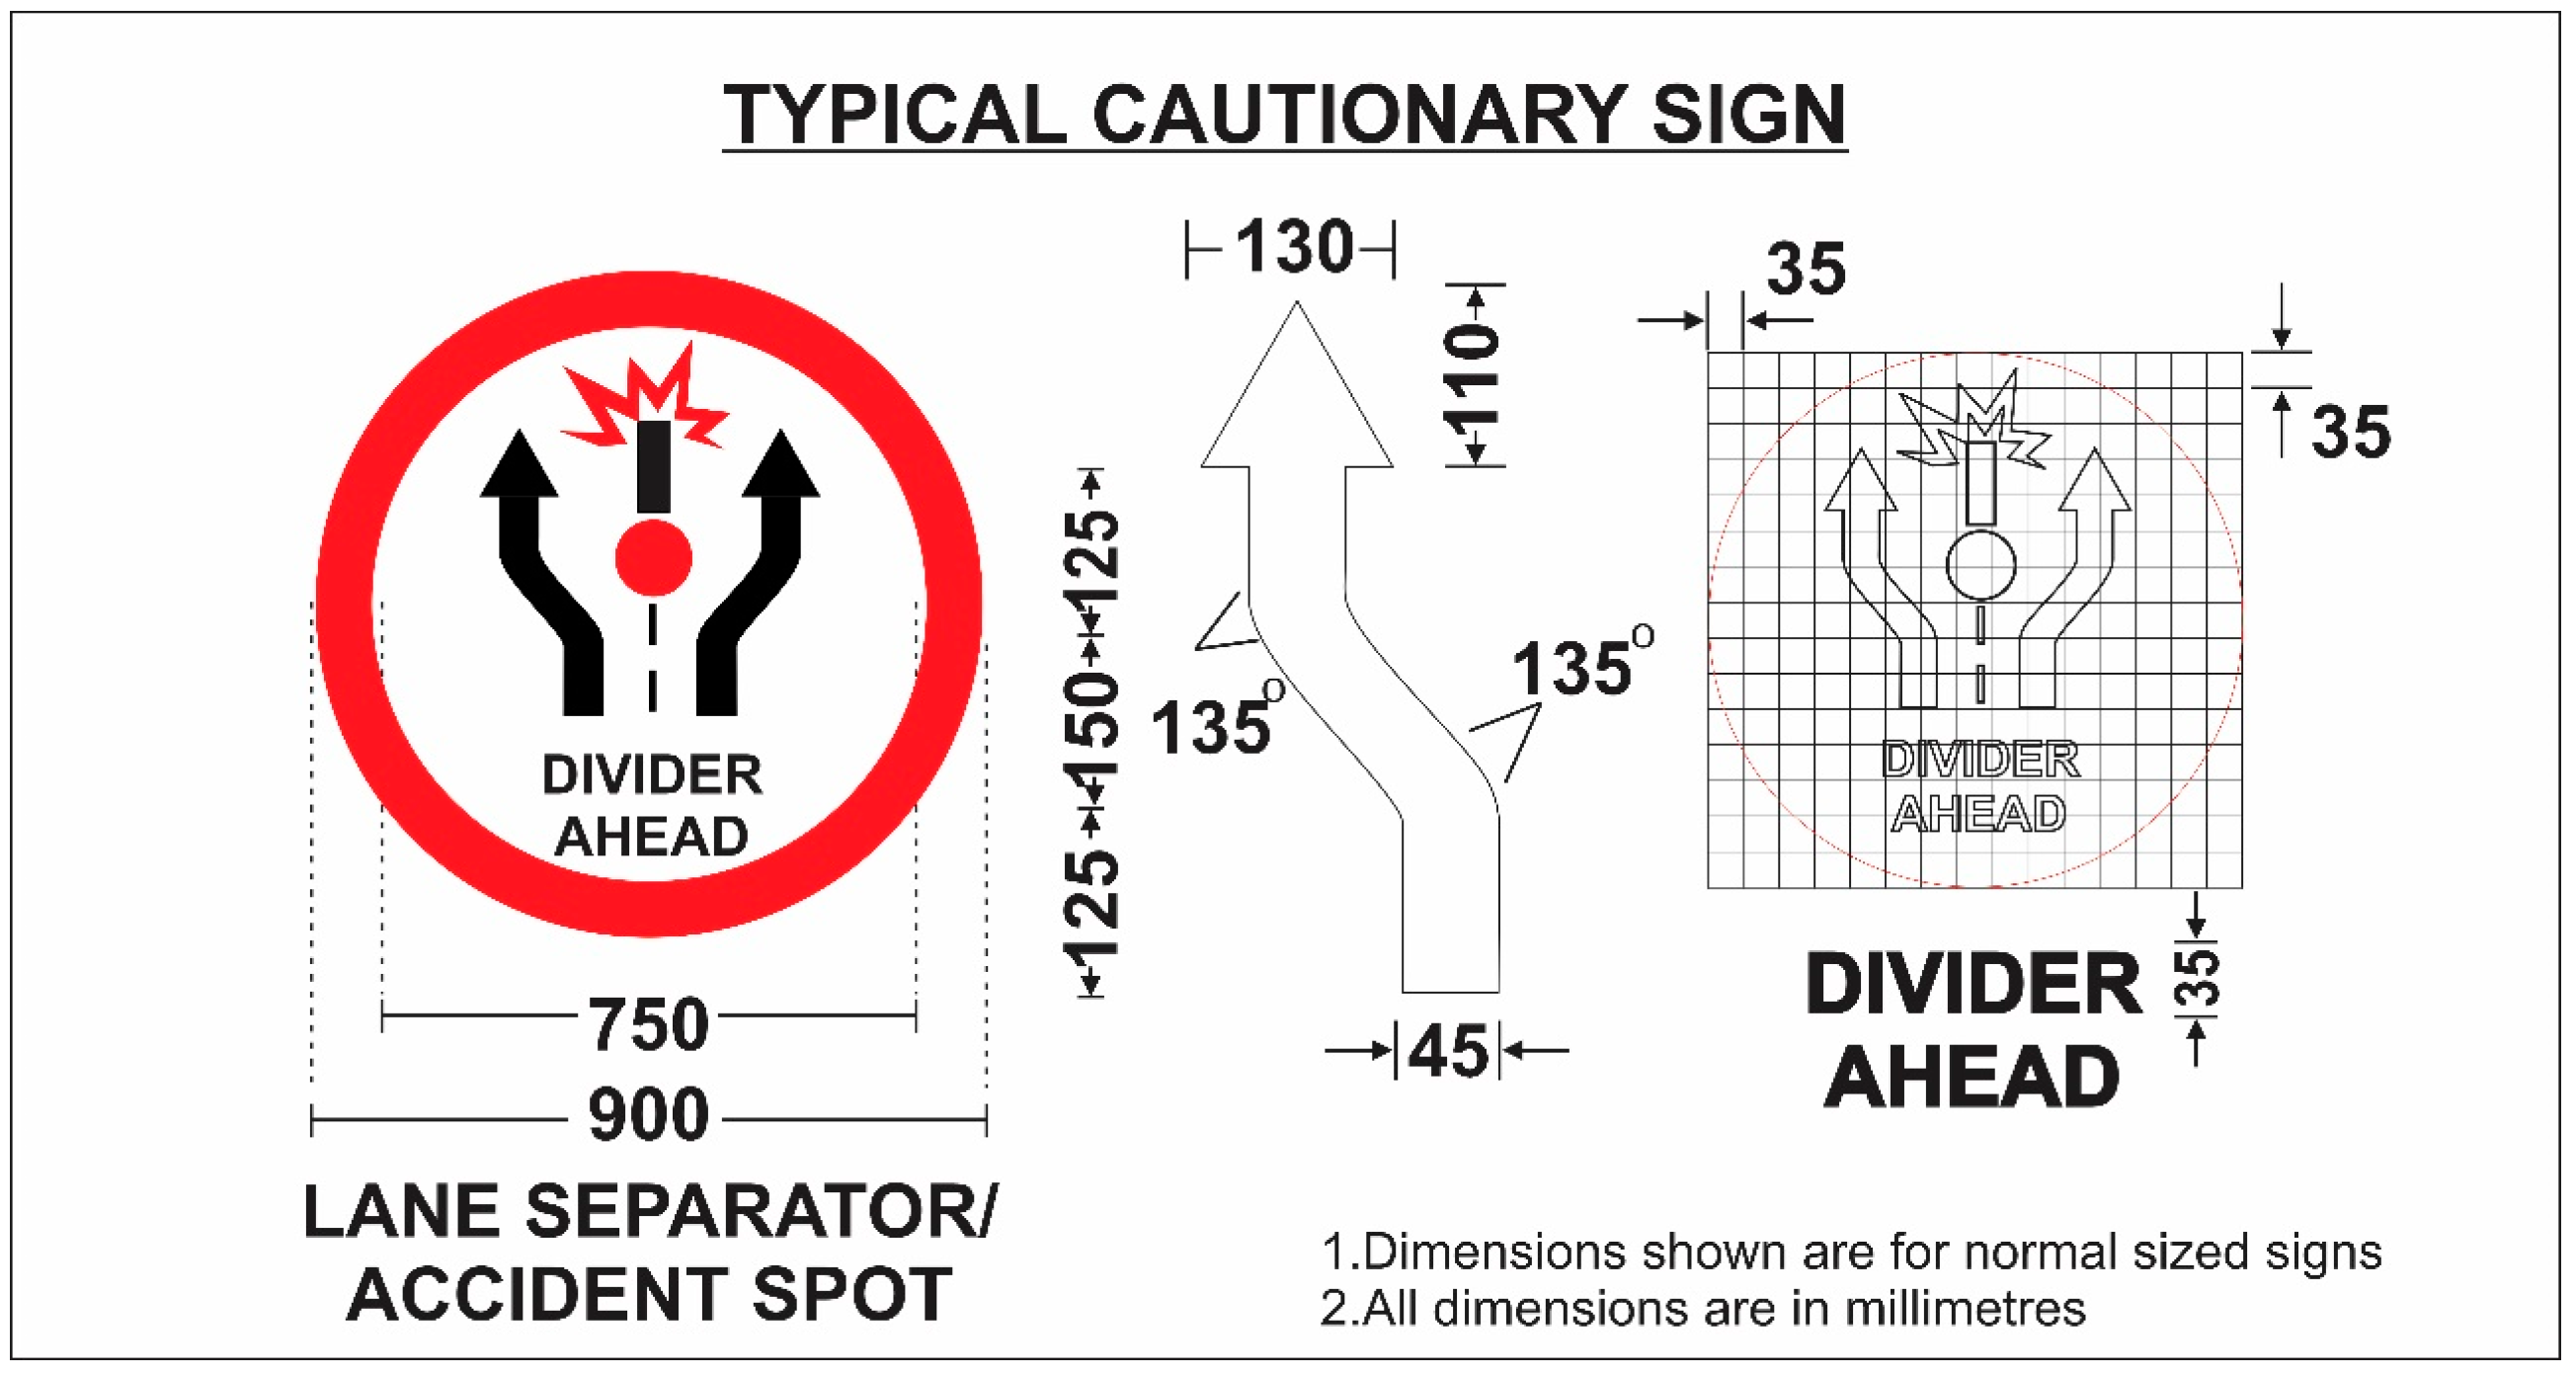
3.1. Divider Alert Signage Design for Possible Solution
According to the guidelines for road signage, some visuals were developed as a solution to solve the problem. While designing these visuals, considerations were made for simplicity of form, ease of understanding or visual perception in minimum time, the variation of language of users, etc. To alert the vehicles well in advance, the proposed signage is recommended to be displayed around 200 m before the divider.
The Divider Ahead Alert Sign is a special sign for vehicles to avoid accidents. The handbook published by the Indian Government and concerned departments does not list design guidelines for such signs. The technical aspects of the proposed sign shape and color are referenced from the same book. This sample helps the user to control the speed and be alert while approaching the divider or any object installed ahead. The signage design proposal was also tested with end-users using a questionnaire and eye-tracking method.
3.1.1. Existing Signage Solutions
In the current scenario, to avoid accidents and alert vehicles, the local Traffic Administration Departments have installed vertical rectangular-shaped, yellow and black striped sheets next to the dividers or the object to alert vehicles. The current solution is a temporary arrangement and is only established on required locations. This solution is varied and installed in various sizes. Before proposing the new system, the previous solution was studied and is displayed here, please see Figure 7.
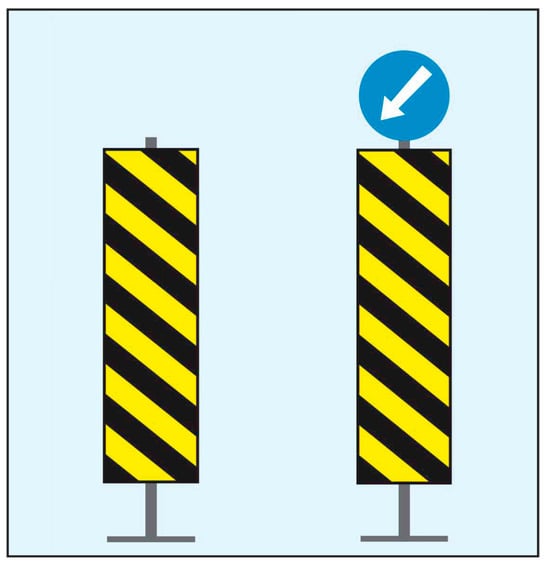
Figure 7.
Current signage system placed before the divider to alert the users.
3.1.2. Proposed Signage
- Sample 1: Divider Ahead
There is another scenario where the road is divided into two parts or lanes are created for left-side diversion due to an over bridge. All vehicles move on the same path and they maintain some speed. When they overtake or wish to change lane, the assumption is that the road might be in steady continuation. Sudden obstructions in the form of barricades cause vehicular collisions. The vehicle must be alerted of the sudden divider in advance with some form of signage (please see Figure 8). The proposed signage in Figure 8 aims to provide a conclusive solution for indicating the divider ahead and alerting an approaching vehicle with the necessary graphic elements and giving adequate time to take action, thereby reducing roadside accidents.
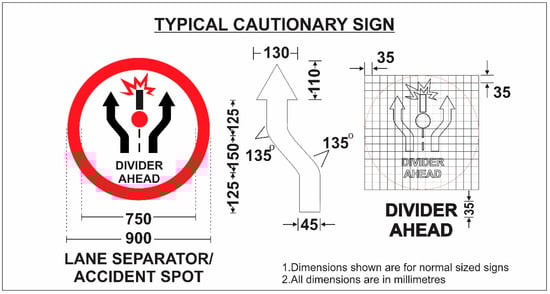
Figure 8.
Proposed signage (Sample 1) to provide the users with the “Divider Ahead Alert”.
- Sample 2: For Divider Ahead Alert Sign
There is another scenario where the road is functional from both sides and at some part of dividing the road, a divider is created. Such cases are usually observed after stretches of a steady continued road followed by an over bridge. This causes the road to be diverted into two segments by dividers. In such situations, the user needs to be alerted at least 200 m before the divider by the installation of a “Divider Ahead Alert” sign with the recommended specifications (please see Figure 9).

Figure 9.
Proposed signage (Sample 2) for directing vehicles.
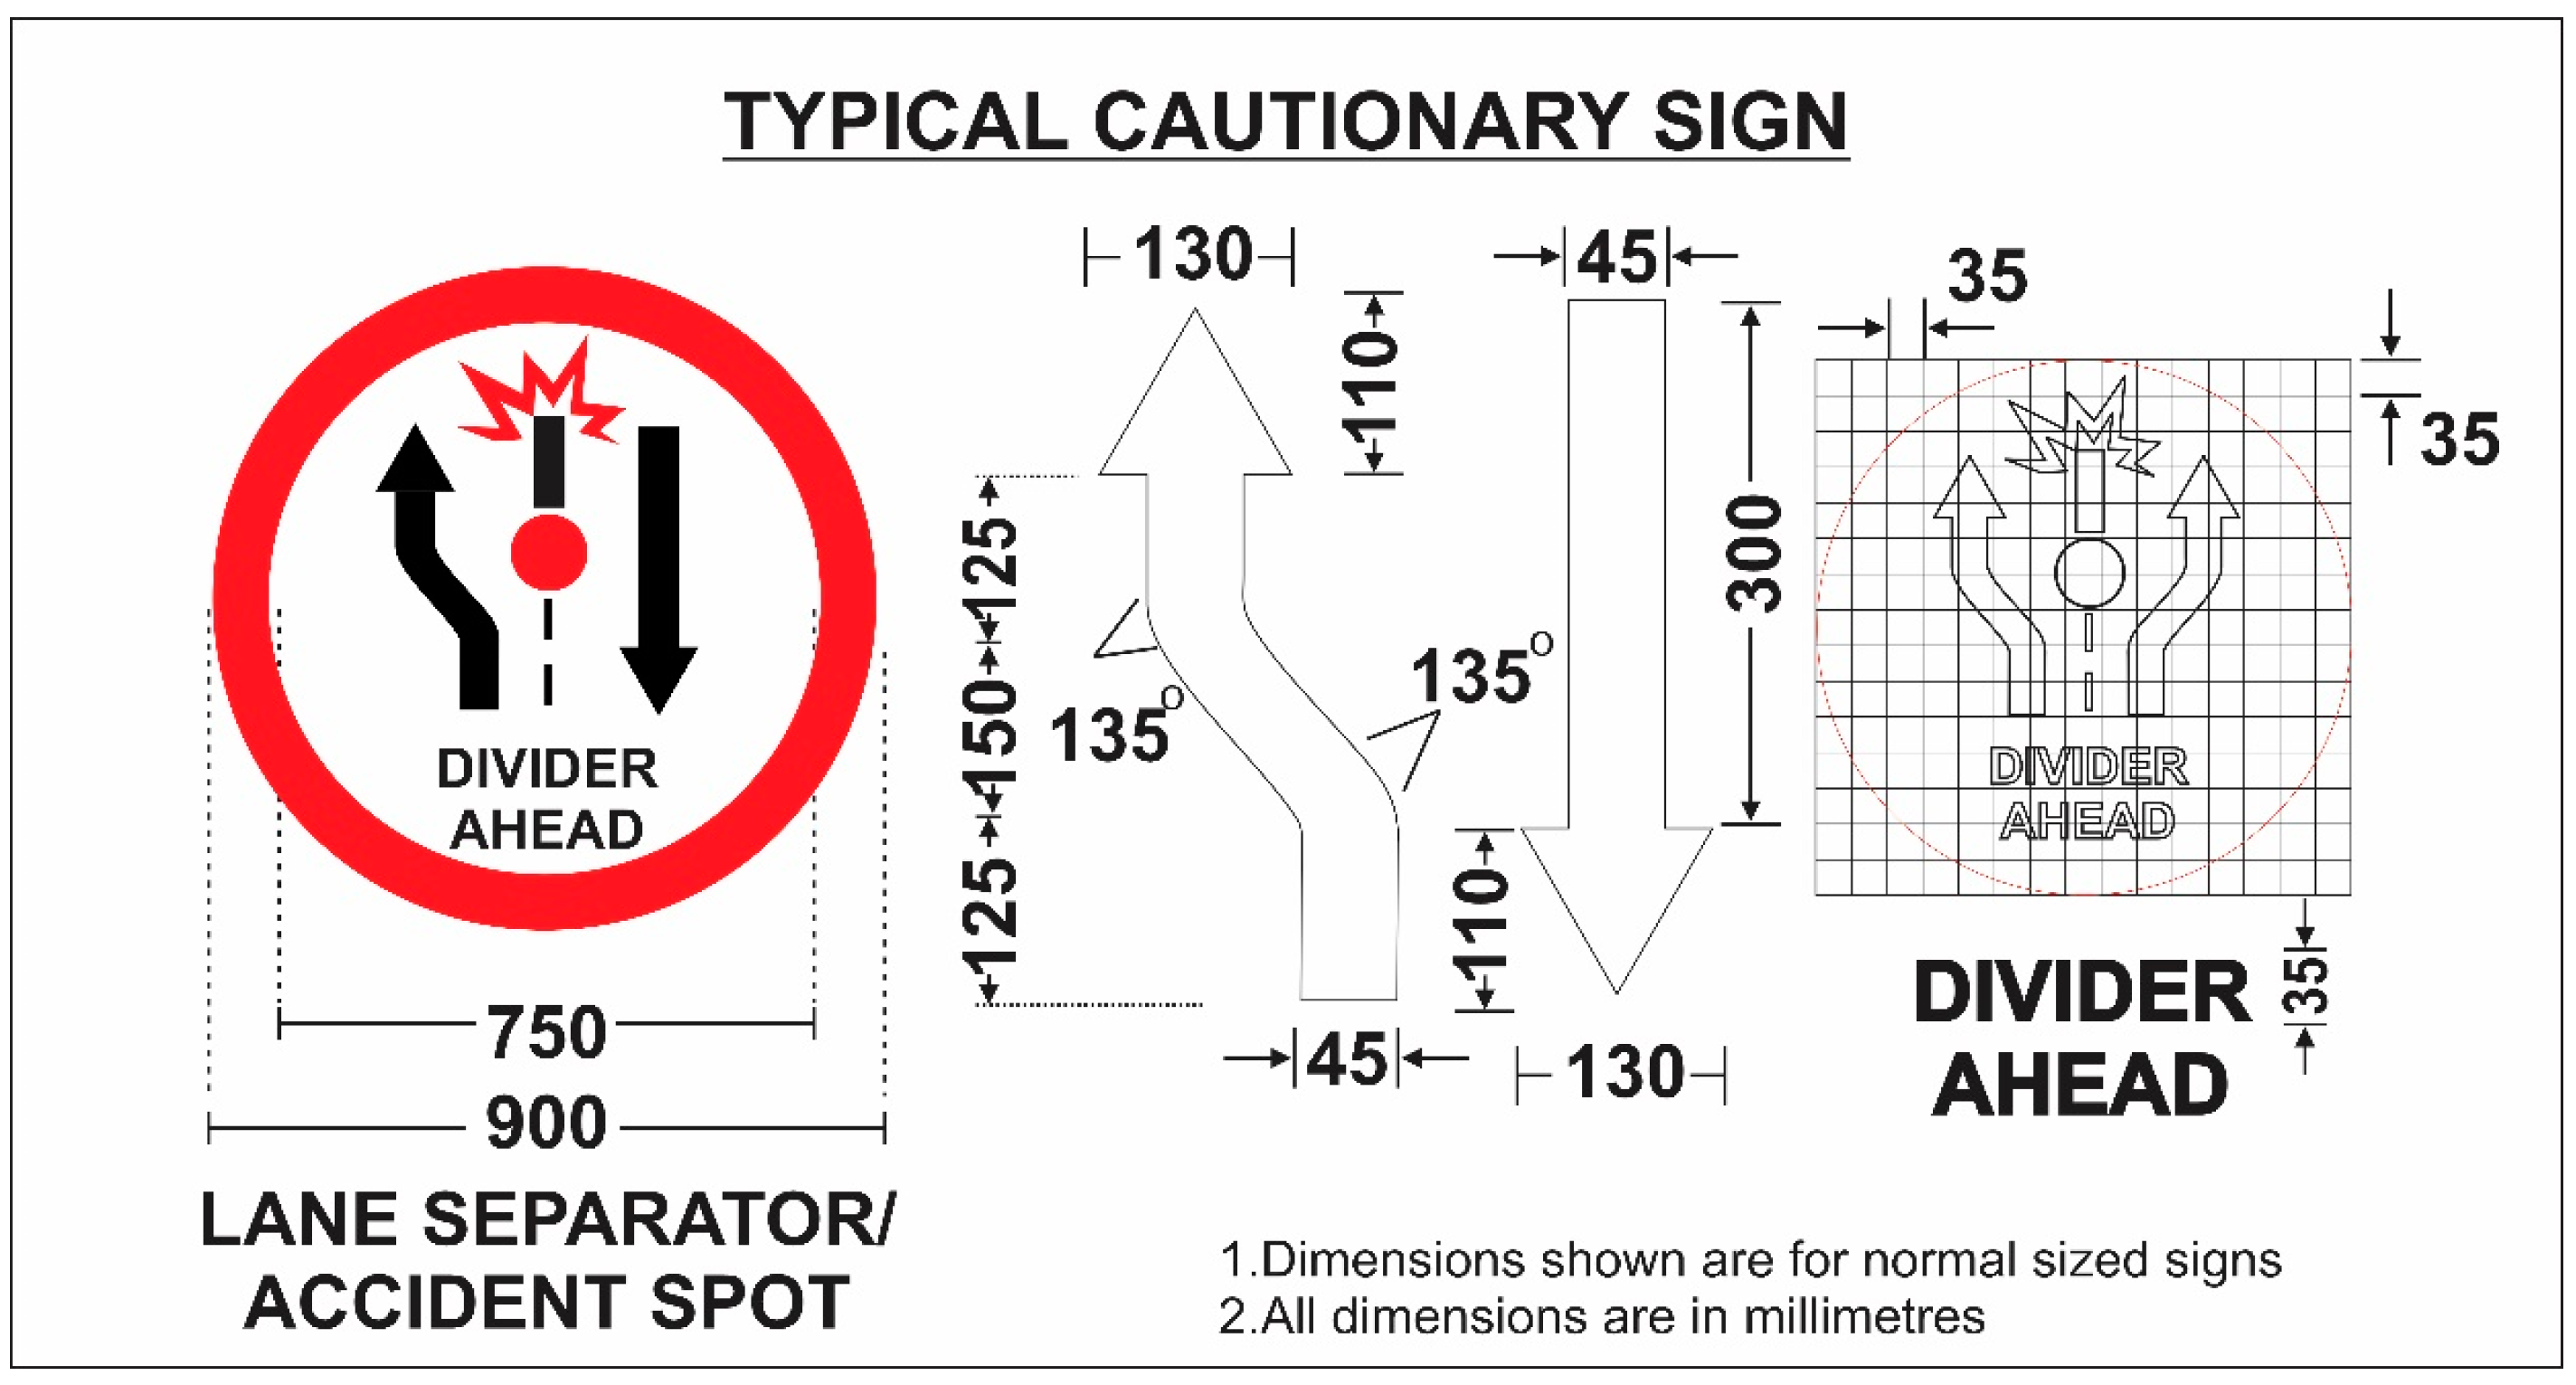
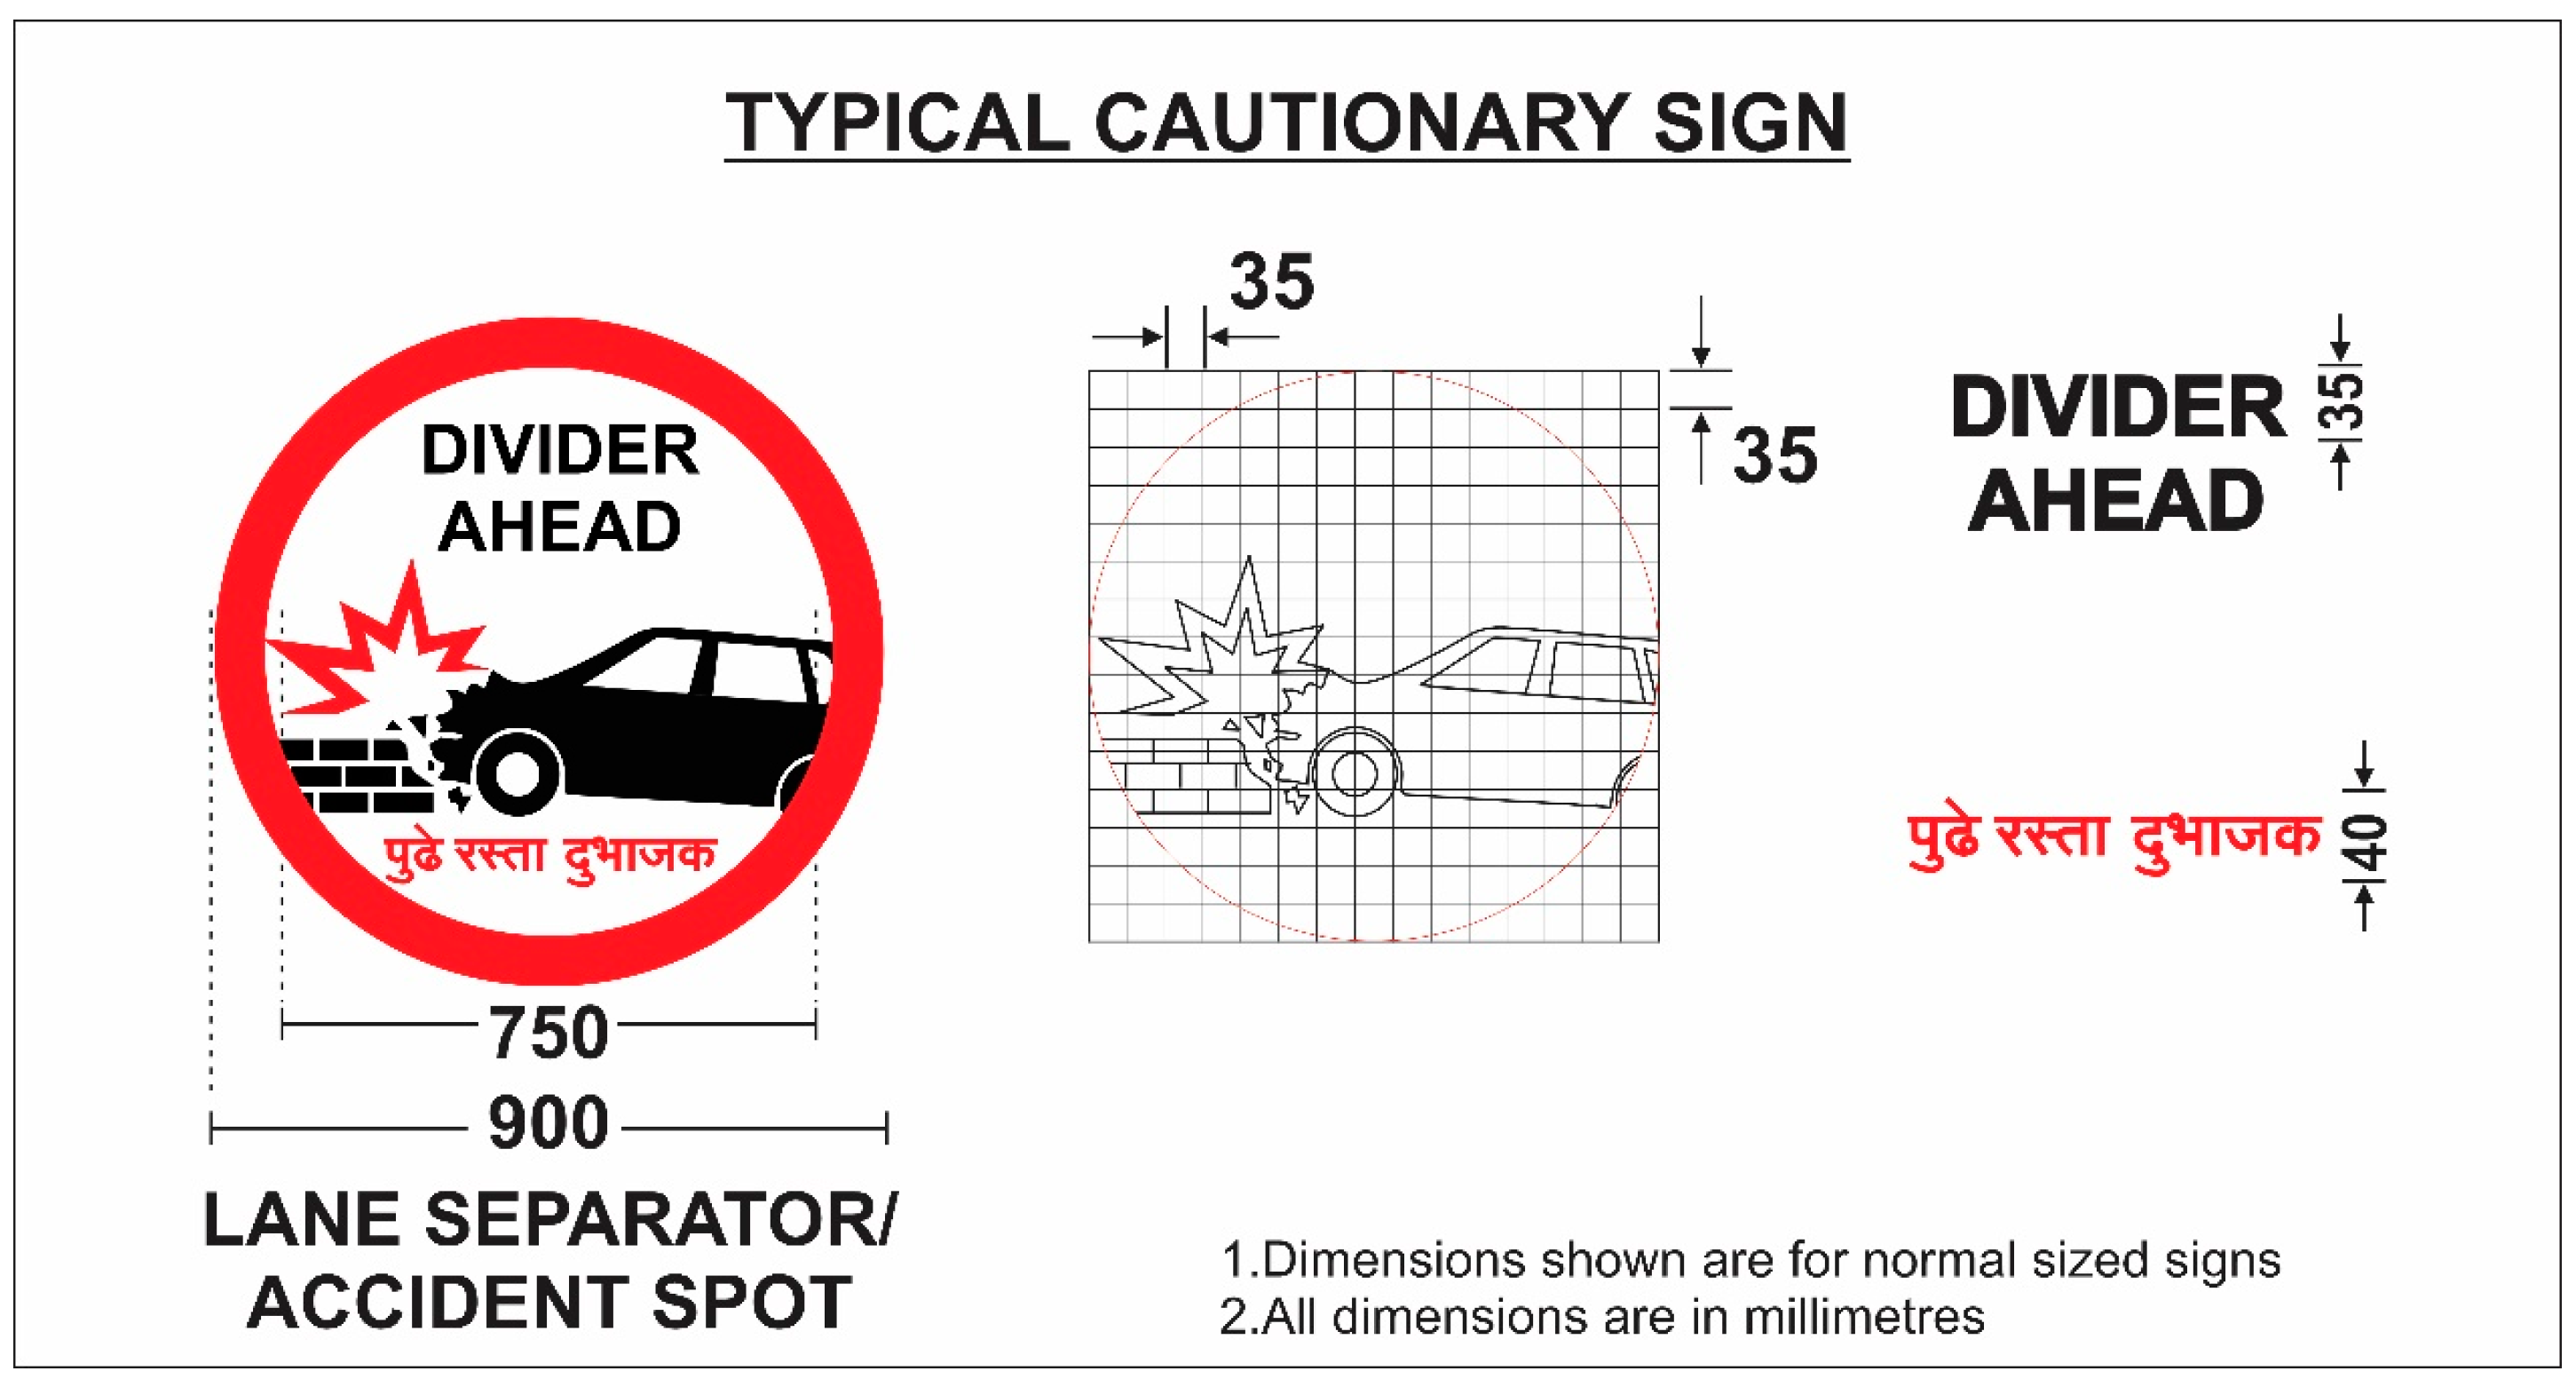
- Sample 3: For Divider Ahead Alert Sign
The third solution for the “Divider Ahead Alert” sign is rendered with actual vehicle and wall representative graphics in it. In this sign, the car is crashing into the divider. In the Indian scenario, the divider is continuously placed during road development projects to help vehicles channel their routes. The red-colored blasting stroke indicates a crash, thereby alerting the user to such a possibility. The graphic showcasing the crash of the car into the divider alerts the user about the divider ahead and helps them control the speed when they are on such roads. It further ensures that the vehicle takes care when approaching the divider and safely passes through the channelized route. The text “DIVIDER AHEAD” is part of the sign on the top and is further emphasized with local language at the bottom to help a variety of users. To maintain the continuity of size and color specification in individual signs, the visual language is continued overall (please see Figure 10).
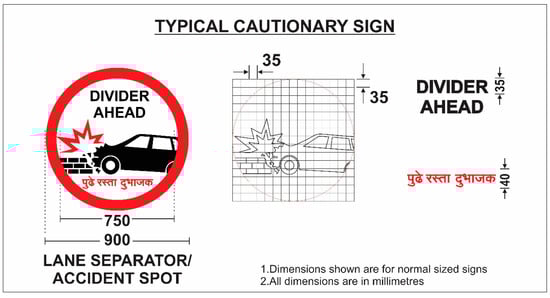
Figure 10.
Proposed signage (Sample 3) for alerting the vehicles about upcoming dividers.
The above proposed signage samples were tested with the eye-tracking test method with selected users. The actual study of the locations where roadside accidents take place required such indications for vehicles. The appropriate sign definitely helps the vehicle with deciding the path and speed by following all road safety instructions through the use of a functional signage system.
3.2. Participants and Demographic Details
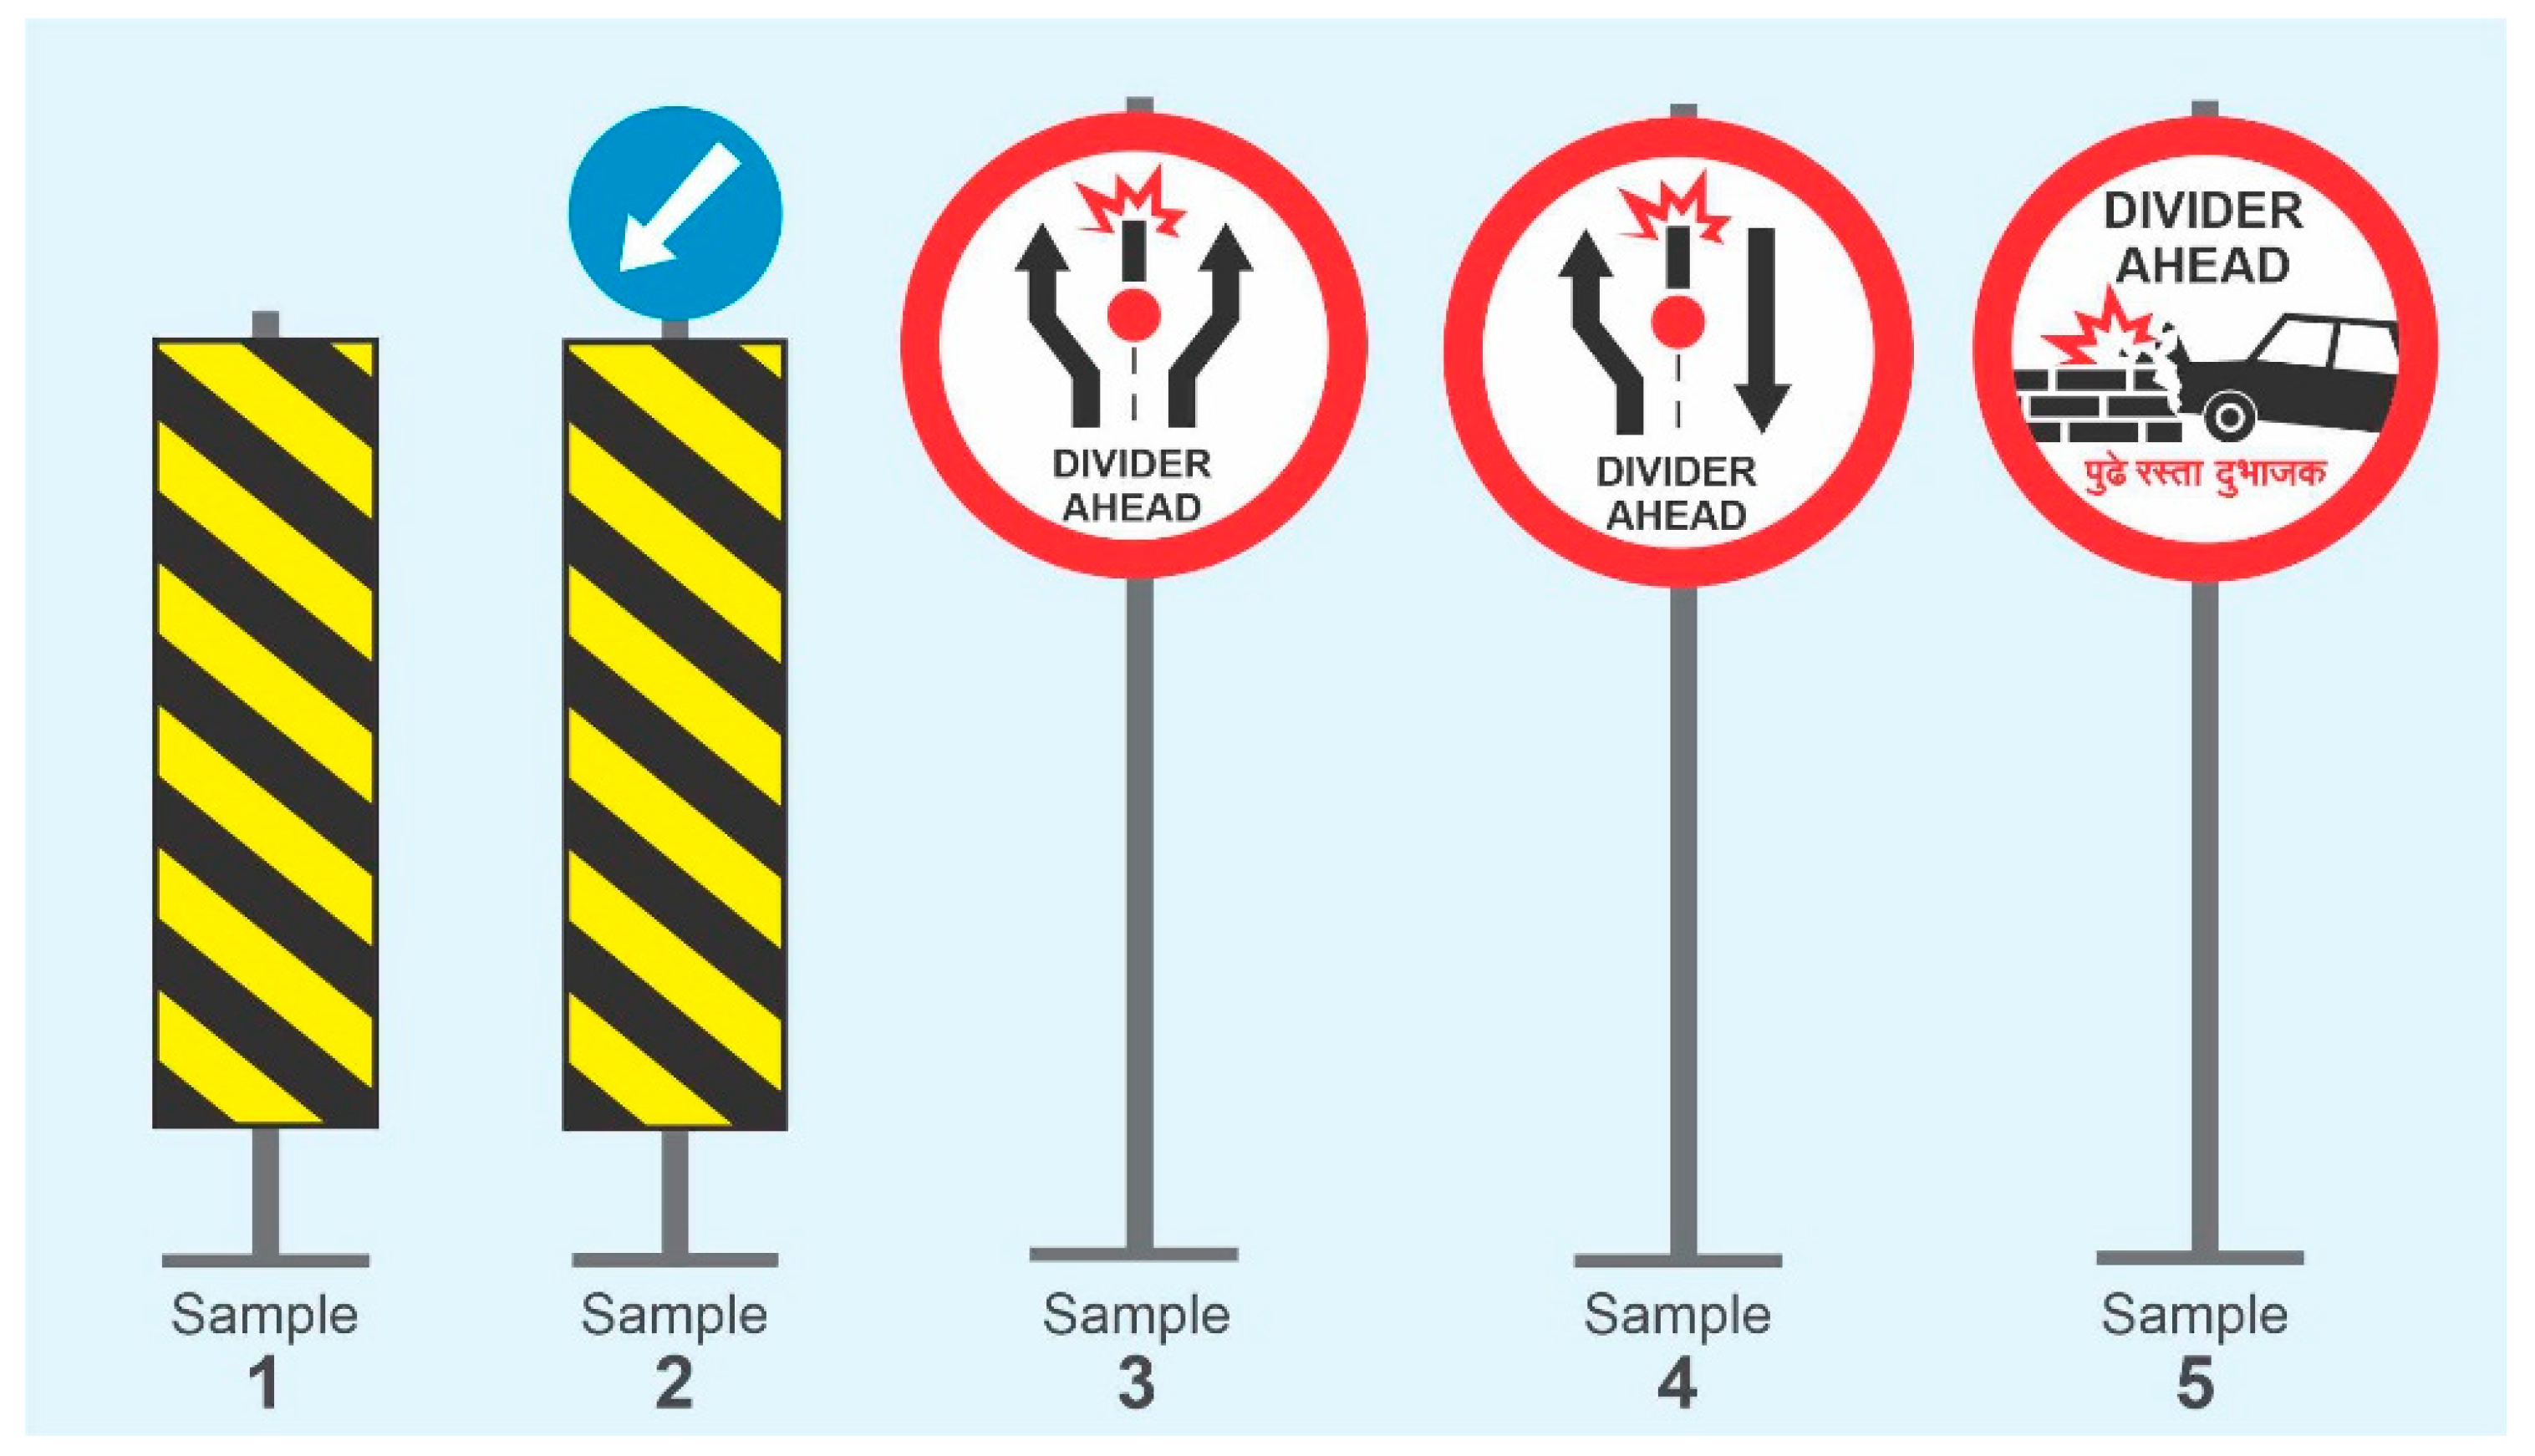
For the study of the proposed signage system and the existing signs, a mixture of discussion and digital survey was utilized. The proposed signage samples were sent to multiple participants. Please see Figure 11. The data gathered were then compiled together to be analyzed. Some information was also collected to study the respondents’ information. The reader can find the questionnaire along with the respondents’ responses below in percentages in the form of pie charts.
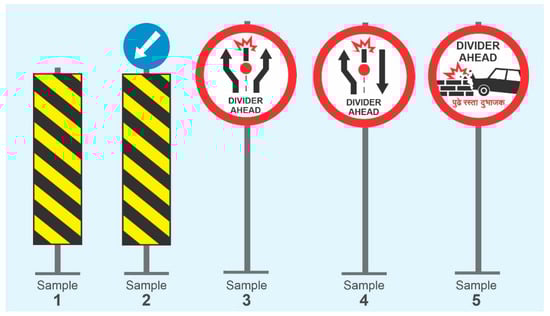
Figure 11.
Signage visual samples prepared for the test.
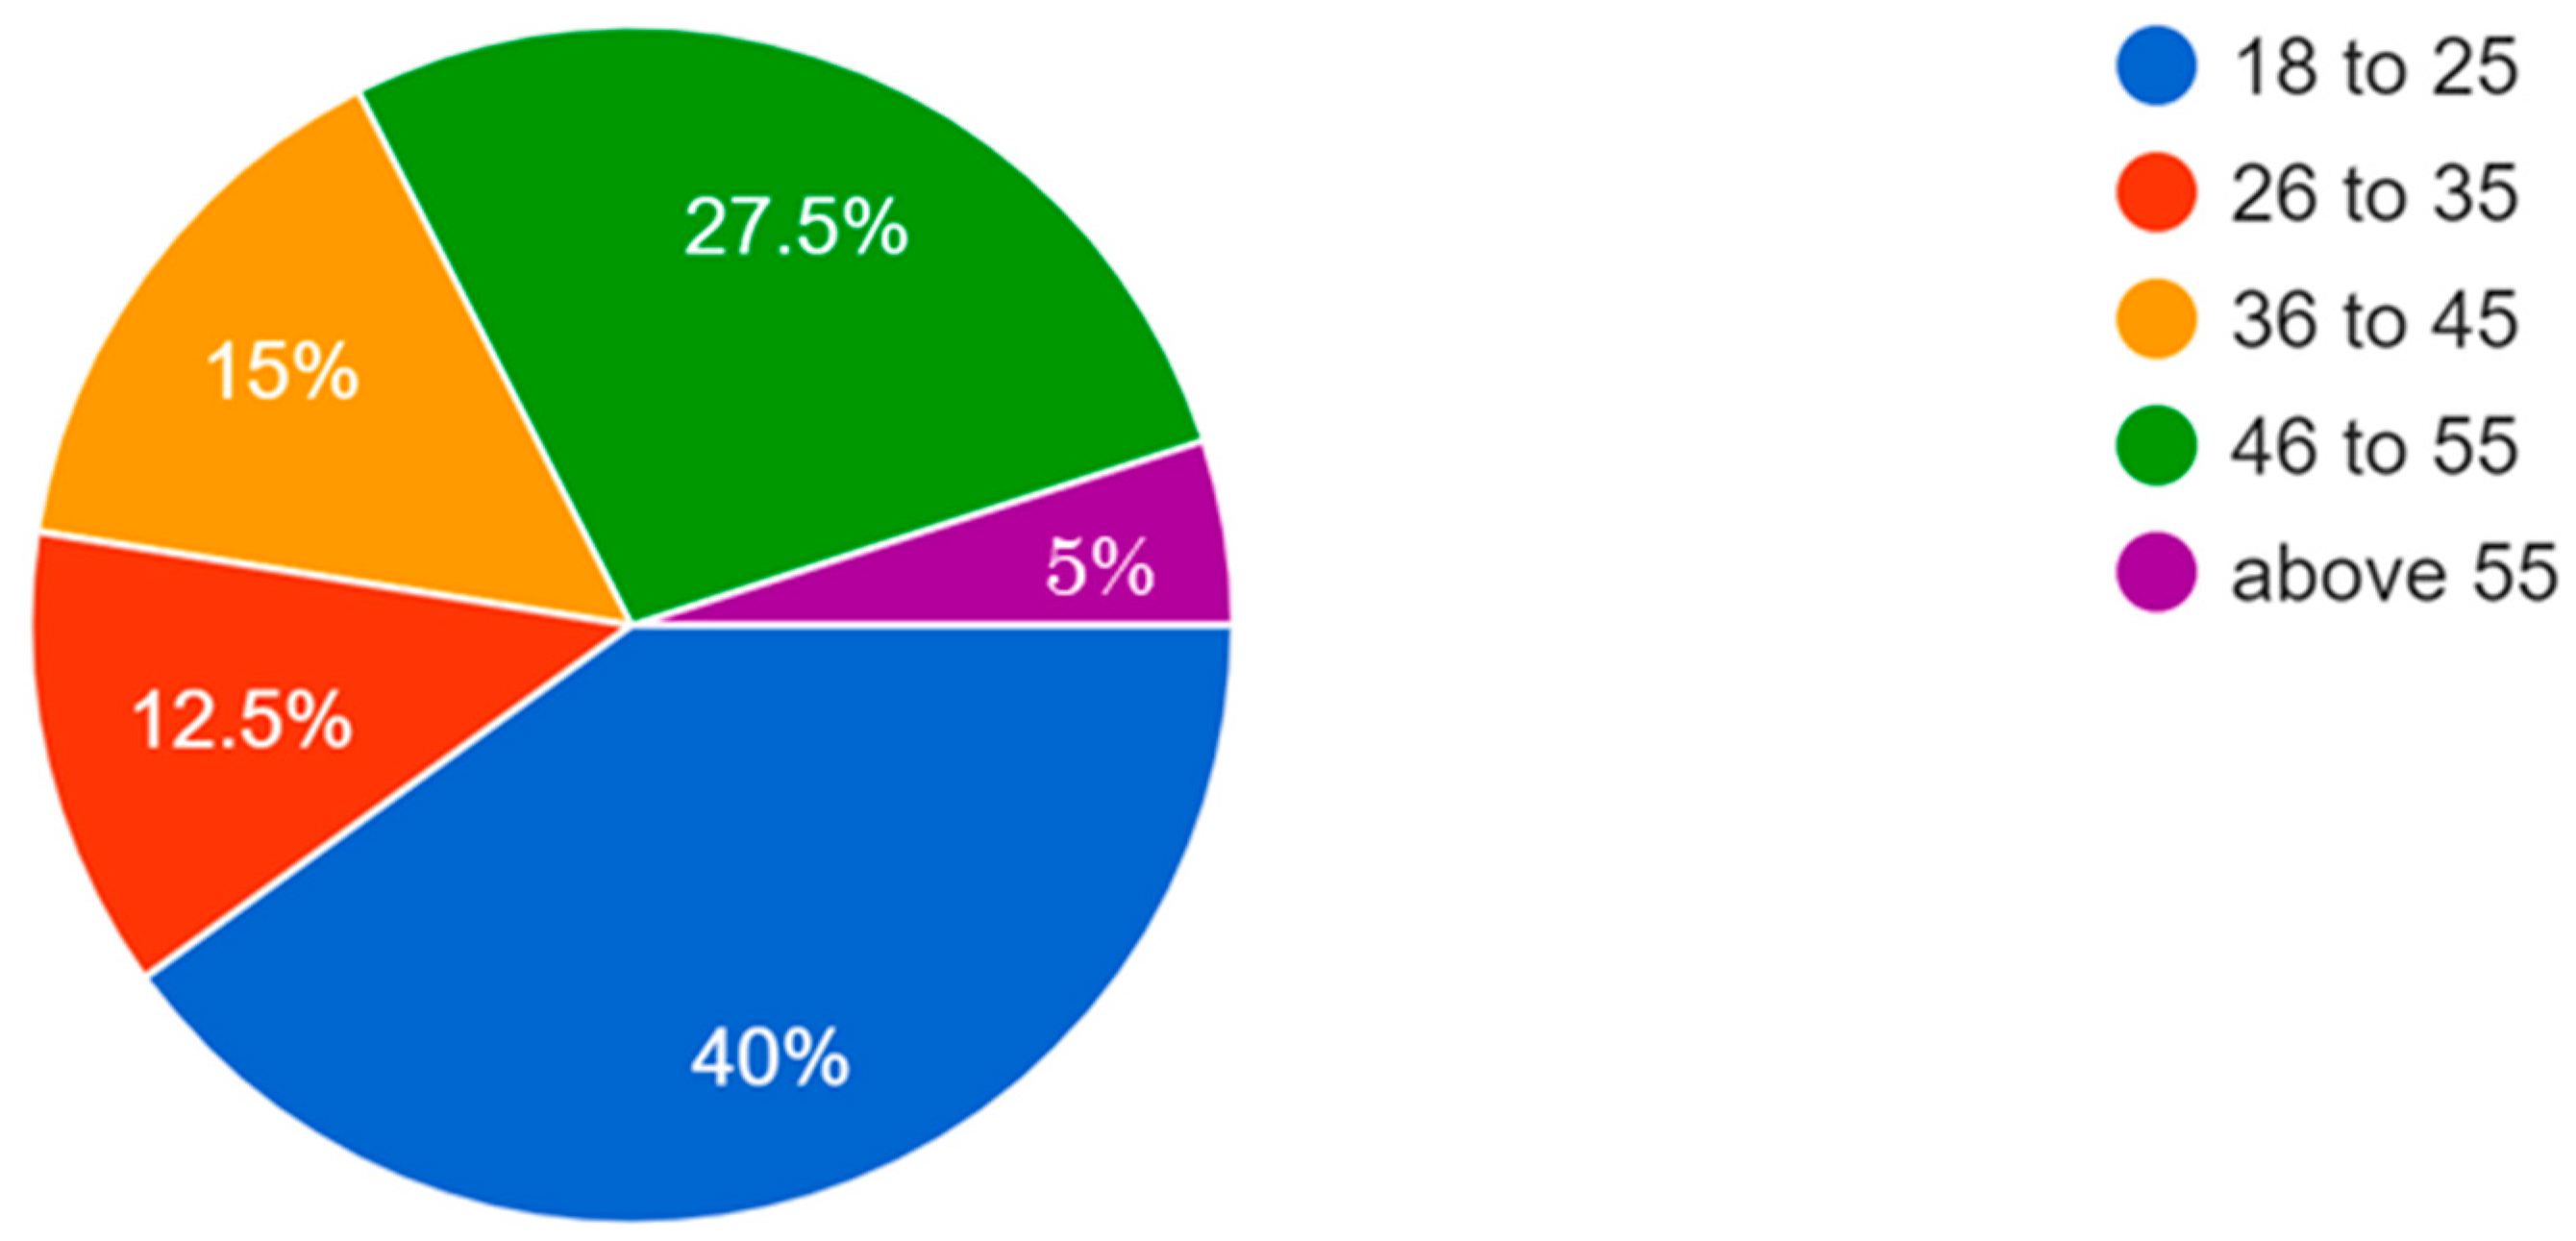
The respondents’ details for the questionnaire study, especially the age group, was recorded as information. Driving licenses are issued after 18 years of age. Accordingly, the age groups studied are as follows: from 18 to 25, 26 to 35, 36 to 45, 46 to 55 and above 55 years of age. The response of each age group was recorded. Please see Figure 12 for the age group information details.
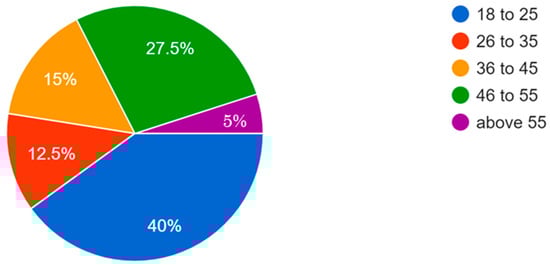
Figure 12.
Age groups of respondents.
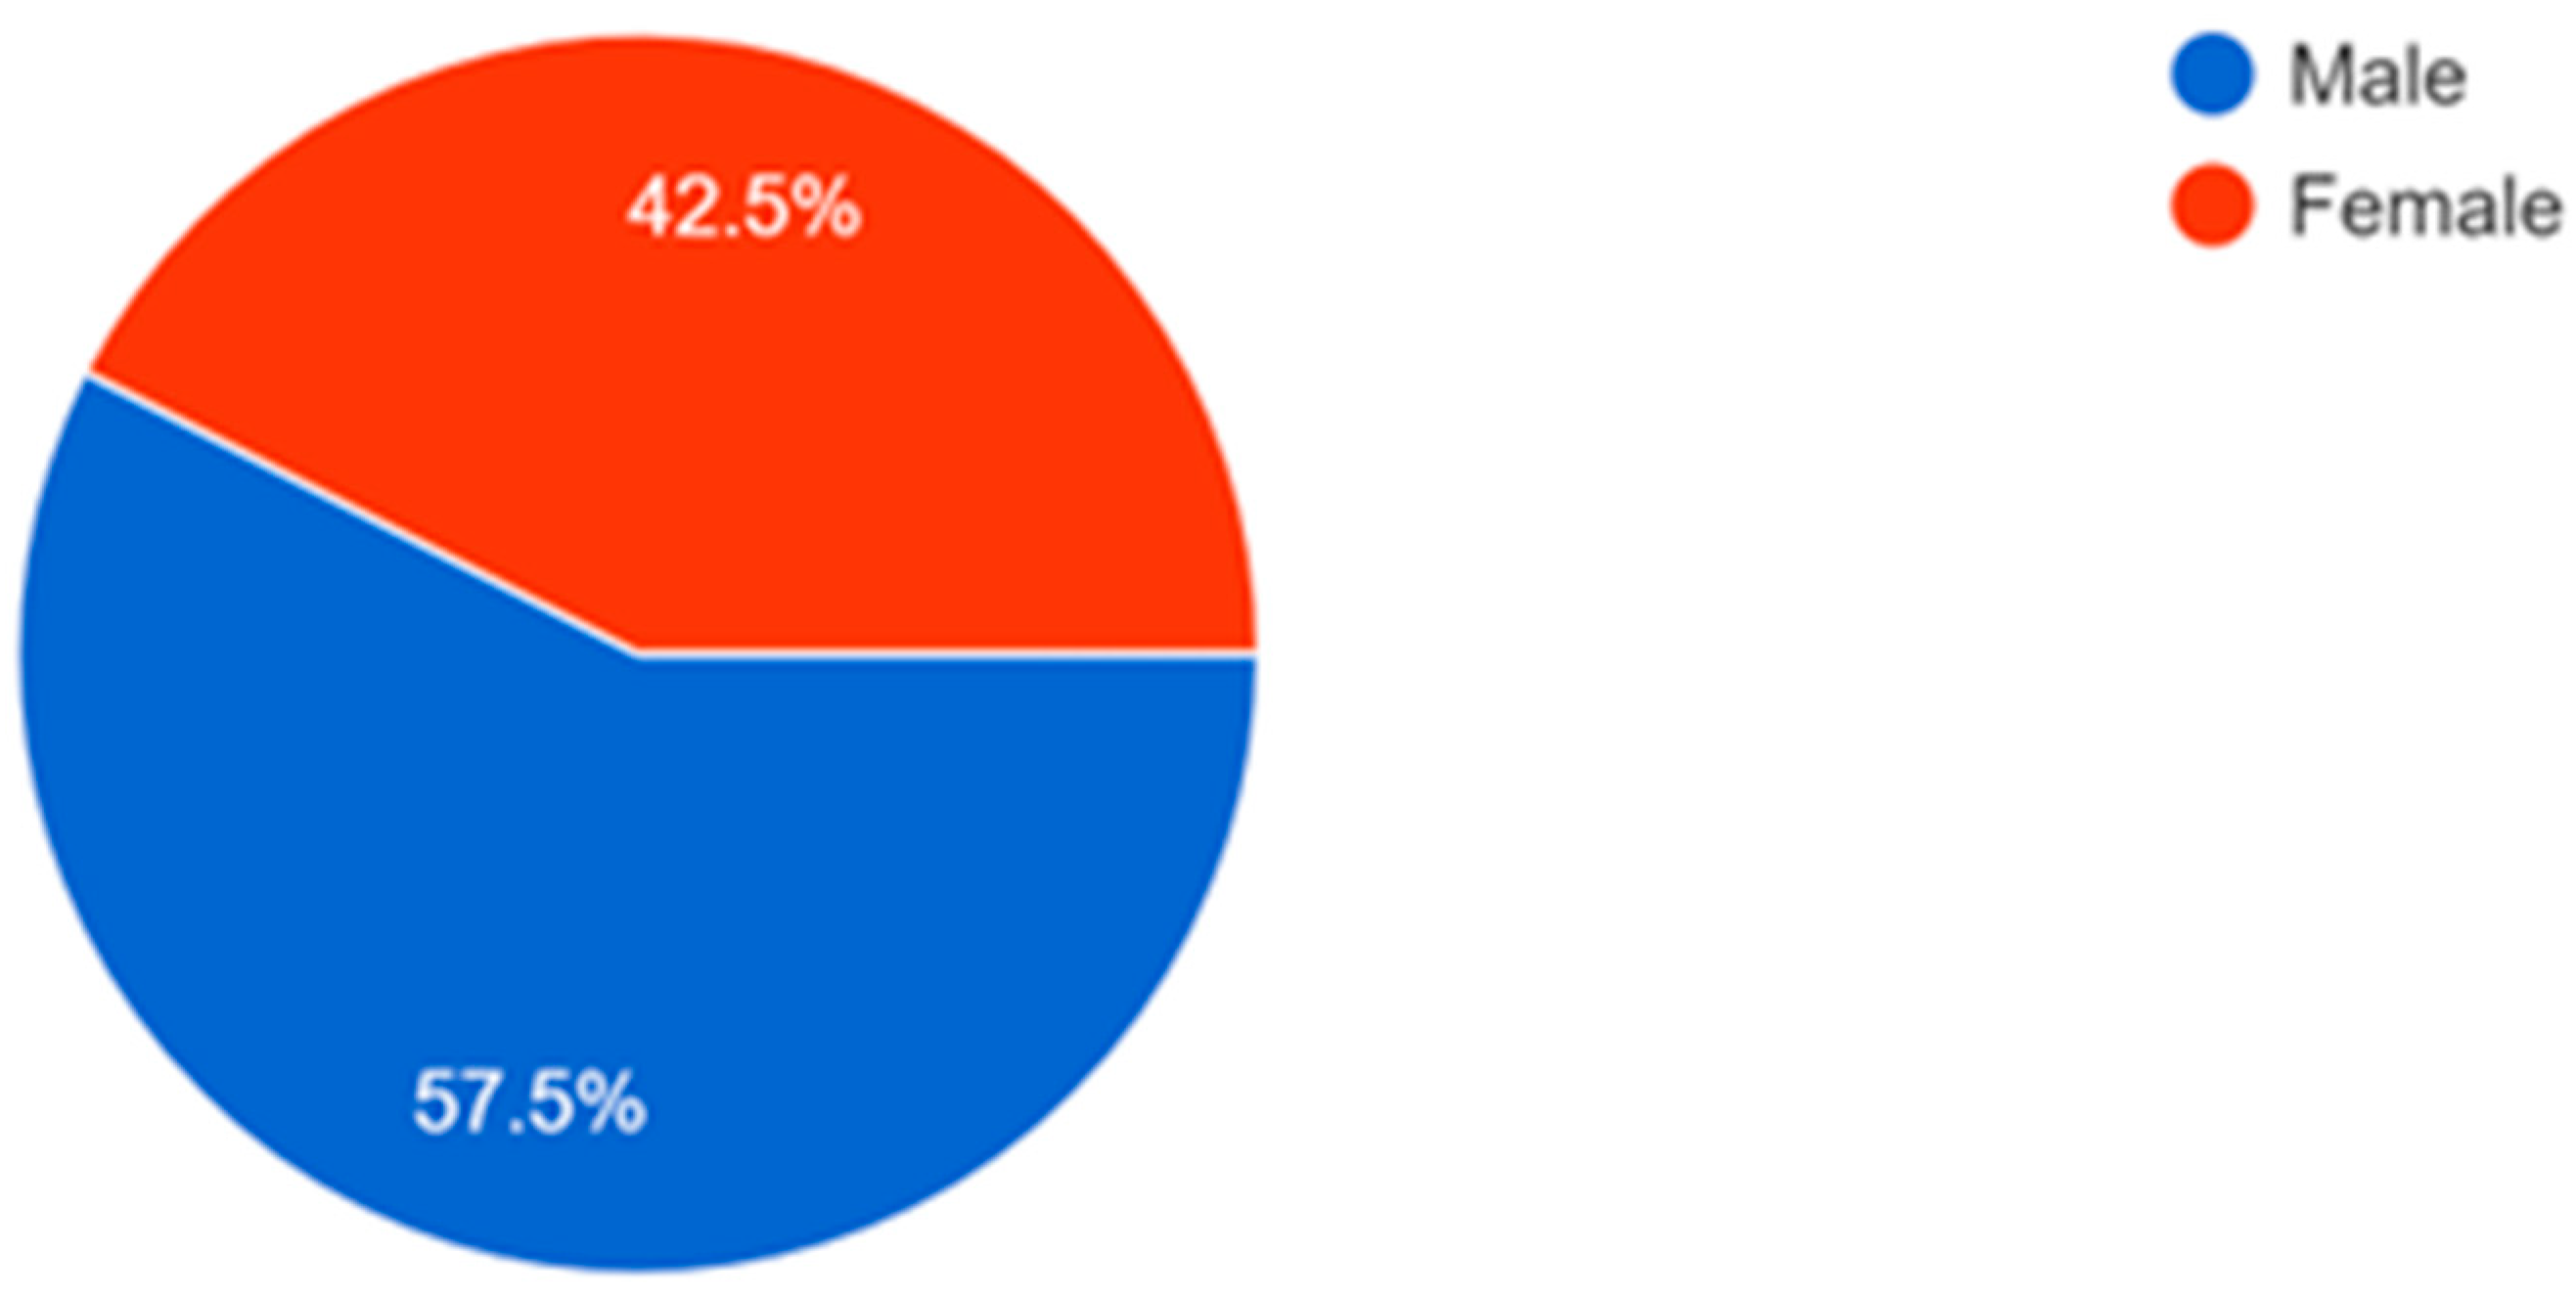
There was a predominance of male drivers in the study. It was noted that there was a noteworthy contribution from independent female drivers. For the study purpose, the respondents’ details were recorded on a gender basis too (refer to Figure 13).
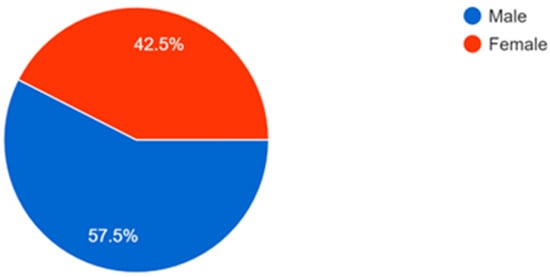
Figure 13.
Information about the respondents’ gender.
A total of 15 participants were included in the eye-tracking study (67% were male and 34% were female). The average age was around 42.56 years and they had driving experience of 5–12 years.
3.3. Measures and Questionnaire Study
In this study, the 40 participants were asked to respond to a psychometric questionnaire (see Table 1). The questionnaire had three measures: (1) legibility of signage, (2) understanding, and (3) effectiveness of the communication of signage. The researchers presented both the existing and proposed signs to respondents and collected responses for a total of five signs (two existing and three novel signs), as presented in Figure 12.

Table 1.
Measures for checking quality of signage.
3.4. Eye Tracking Study
The eye-tracking study was conducted using the trial version of the Real-Eye, a cloud-based eye-tracking system. All the stimuli were prepared using the same cloud-based software and presented for 5 s during the eye-tracking trial with an inter stimulus interval of 1 s. All signage clues were randomly presented automatically on a computer screen in a studio setup using Real-Eye. The computer resolution and configuration were kept constant for all participants during the experiment (screen size: 22 inches, aspect ratio: 16:9, 64 bits Windows 10 system). To determine and compare eye-tracking-related parameters such as fixation counts, fixation duration, etc., a total of five predetermined areas of interest were selected on each type of symbol (two existing and three proposed) to check the attentional properties of the novel signs. To observe the pattern of visual attention, a heat map analysis was also performed.
4. Results and Discussion
4.1. Results of Questionnaire Study
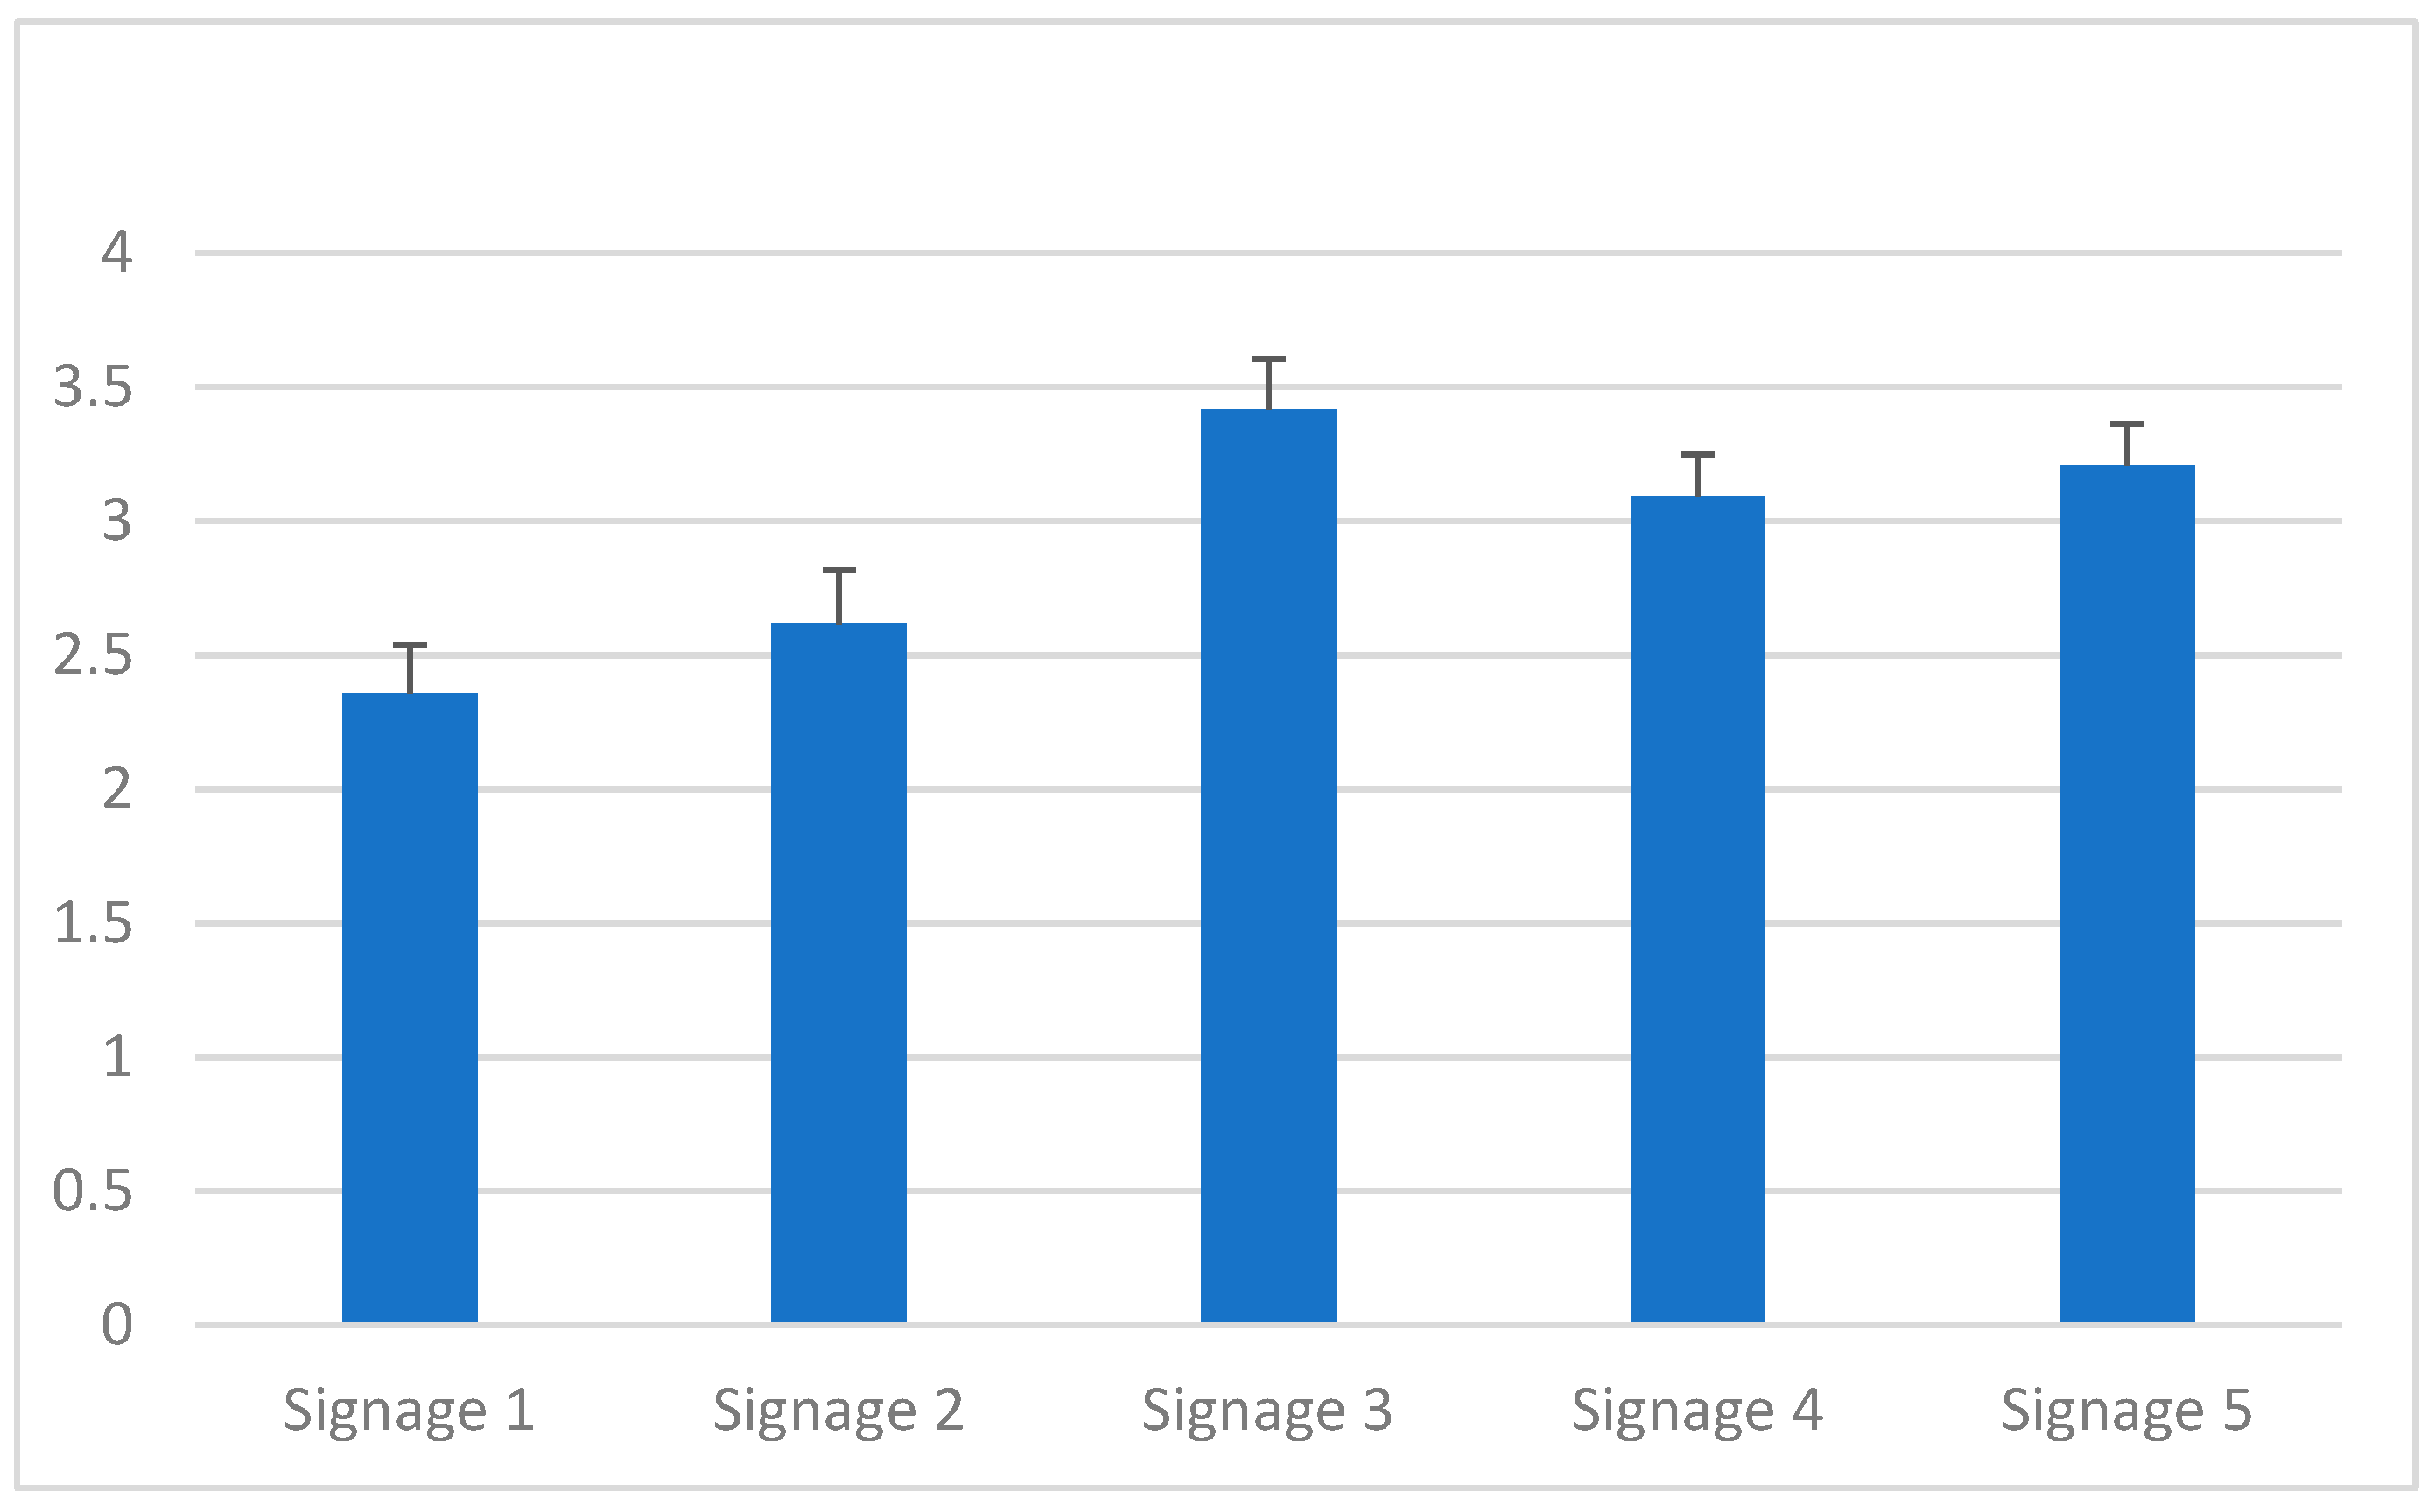
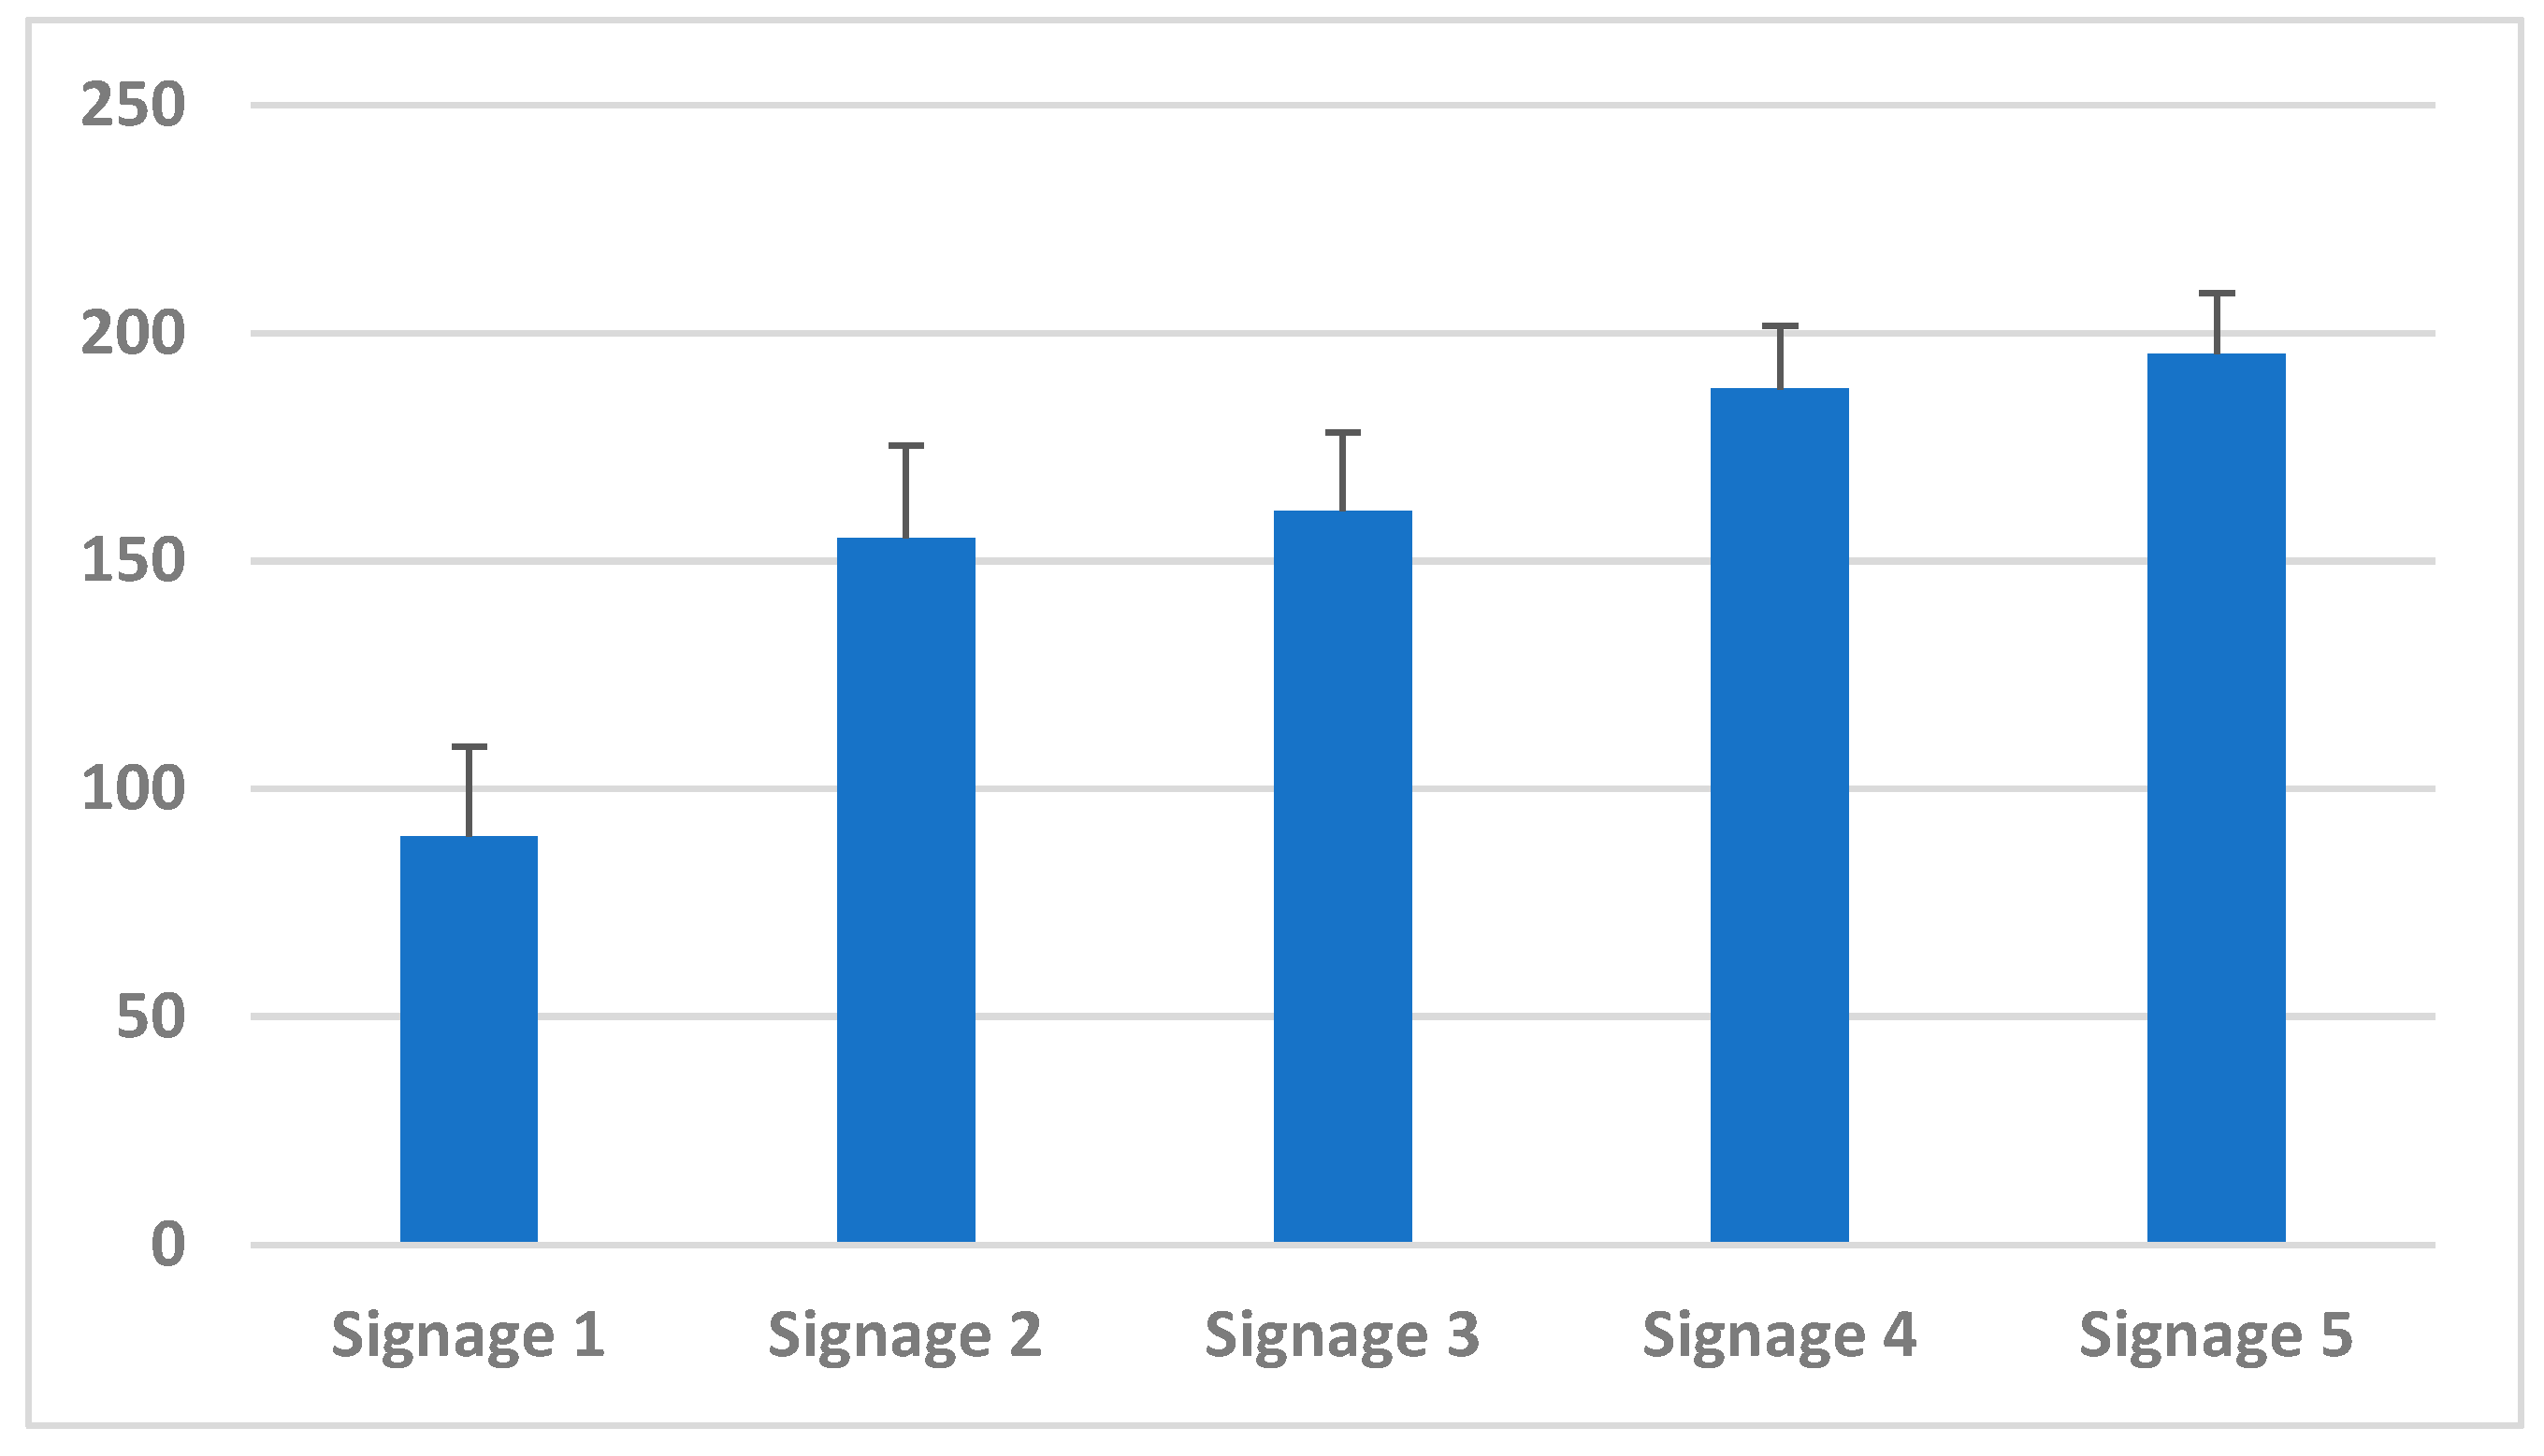
The respondents gave inputs for all five signage samples (see Figure 11). For effective communication, the variation was recorded from respondents (please see Figure 14).
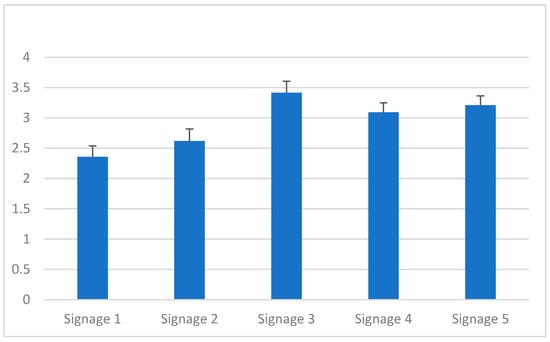
Figure 14.
Variations in effective communication.
The mean values of the effective communication of Sign 3 and Sign 5 were significantly higher than Sign 1 and 2 (p < 0.05). The mean value of the effective communication of Sign 4 was significantly higher than Sign 1, whereas it was significantly lower than Sign 3 (p < 0.05). There was no significant difference in mean value of effective communication when the mean values of signs 5, 3 and 4 (p > 0.05) were compared.
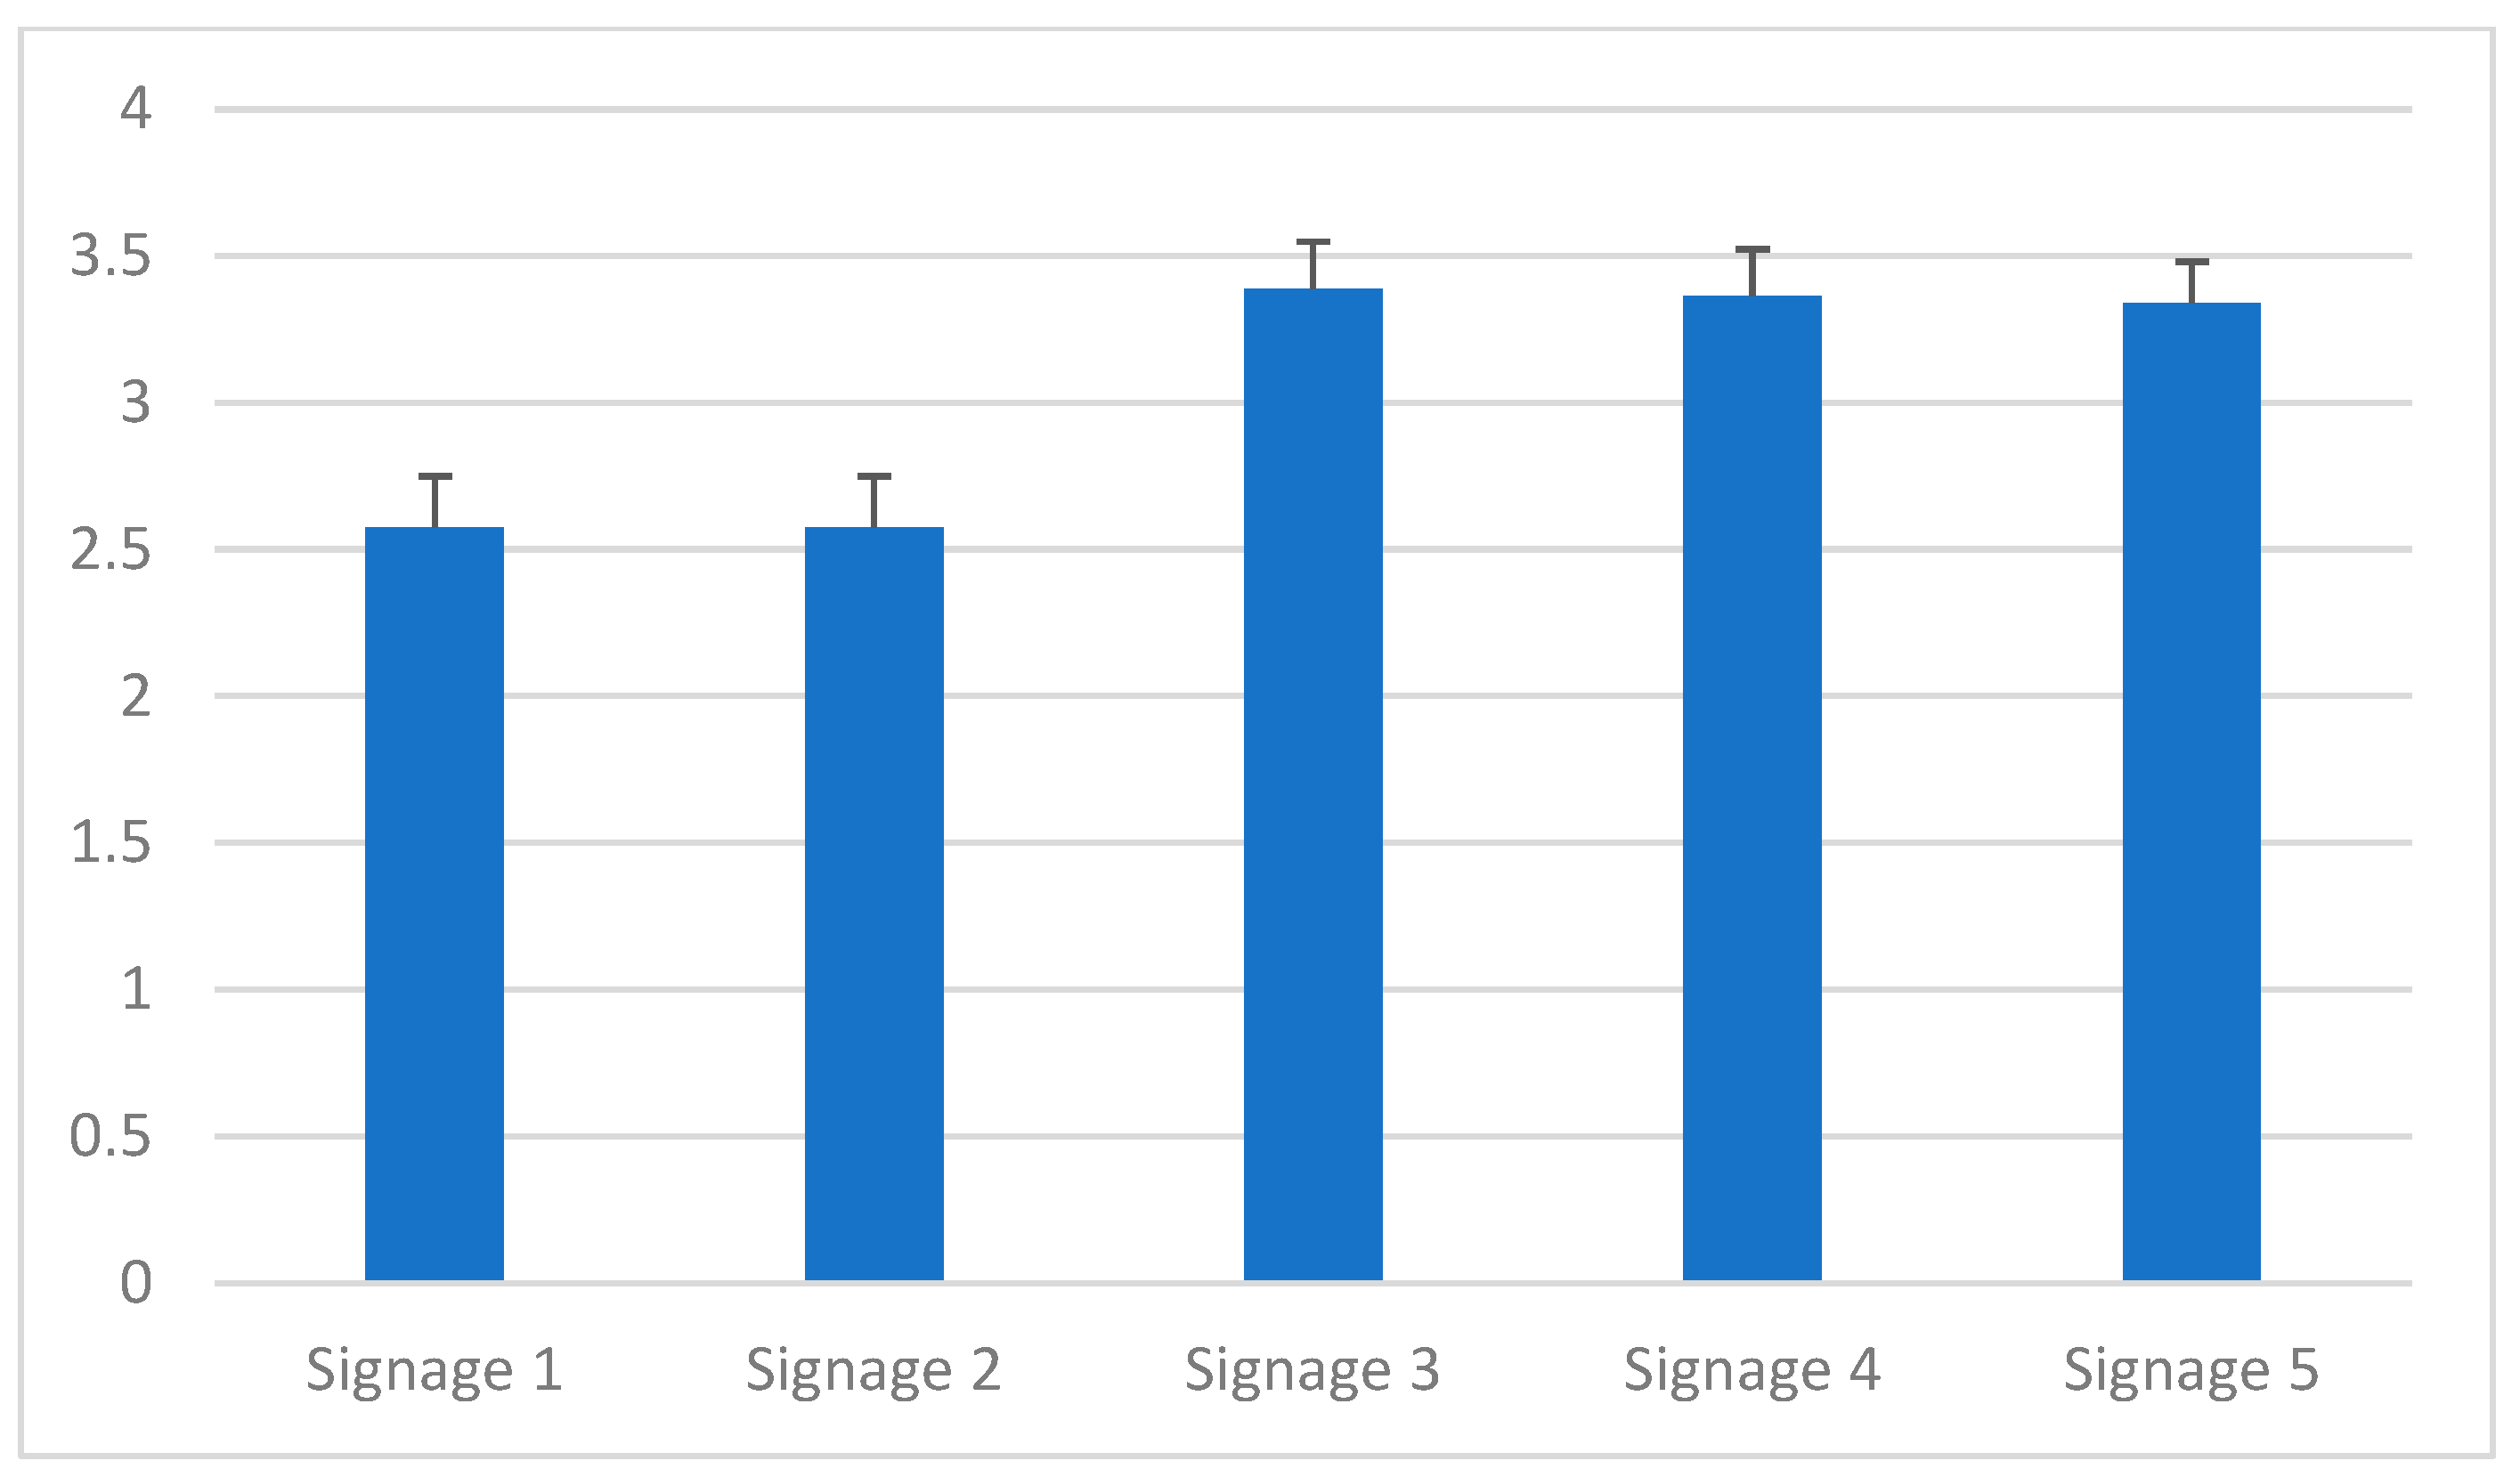
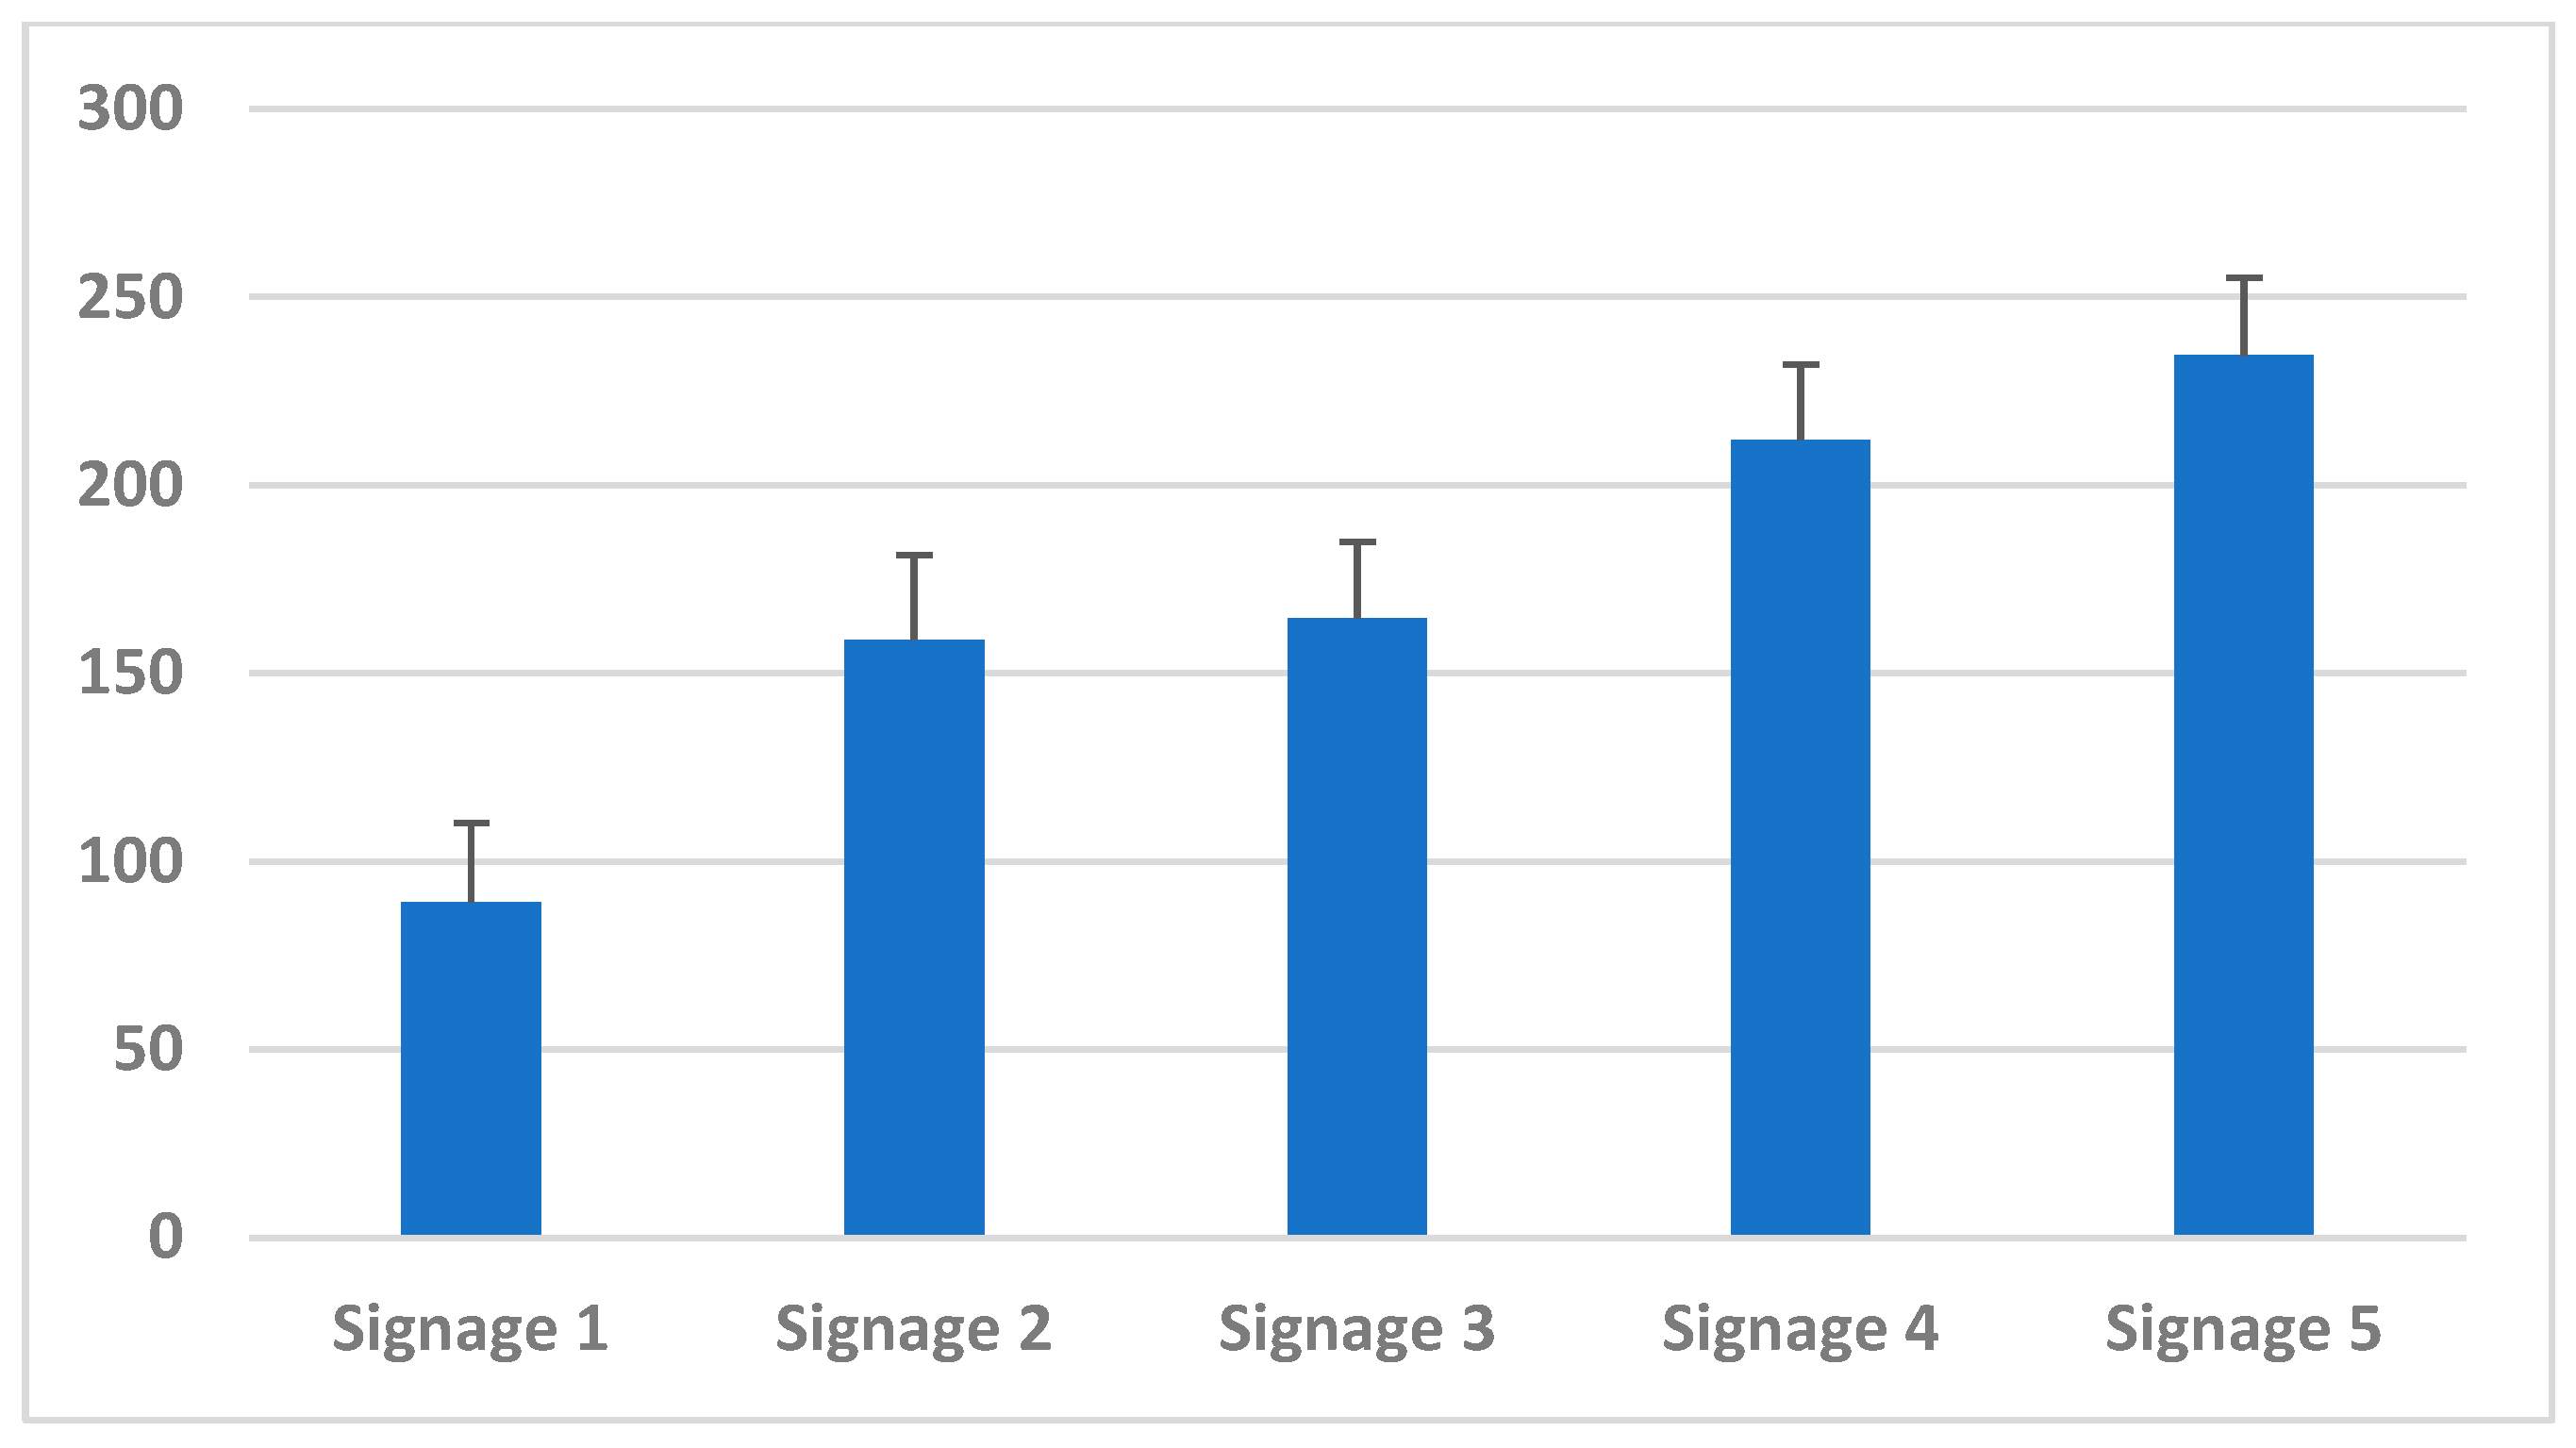
The mean values of the legibility of signs 3, 4, and 5 were significantly higher than signs 1 and 2 (p < 0.05). There was a significant difference in mean legibility score when mean values were compared for signs 5, 3, and 4 (p > 0.05) (please see Figure 15).

Figure 15.
Mean variations in legibility.
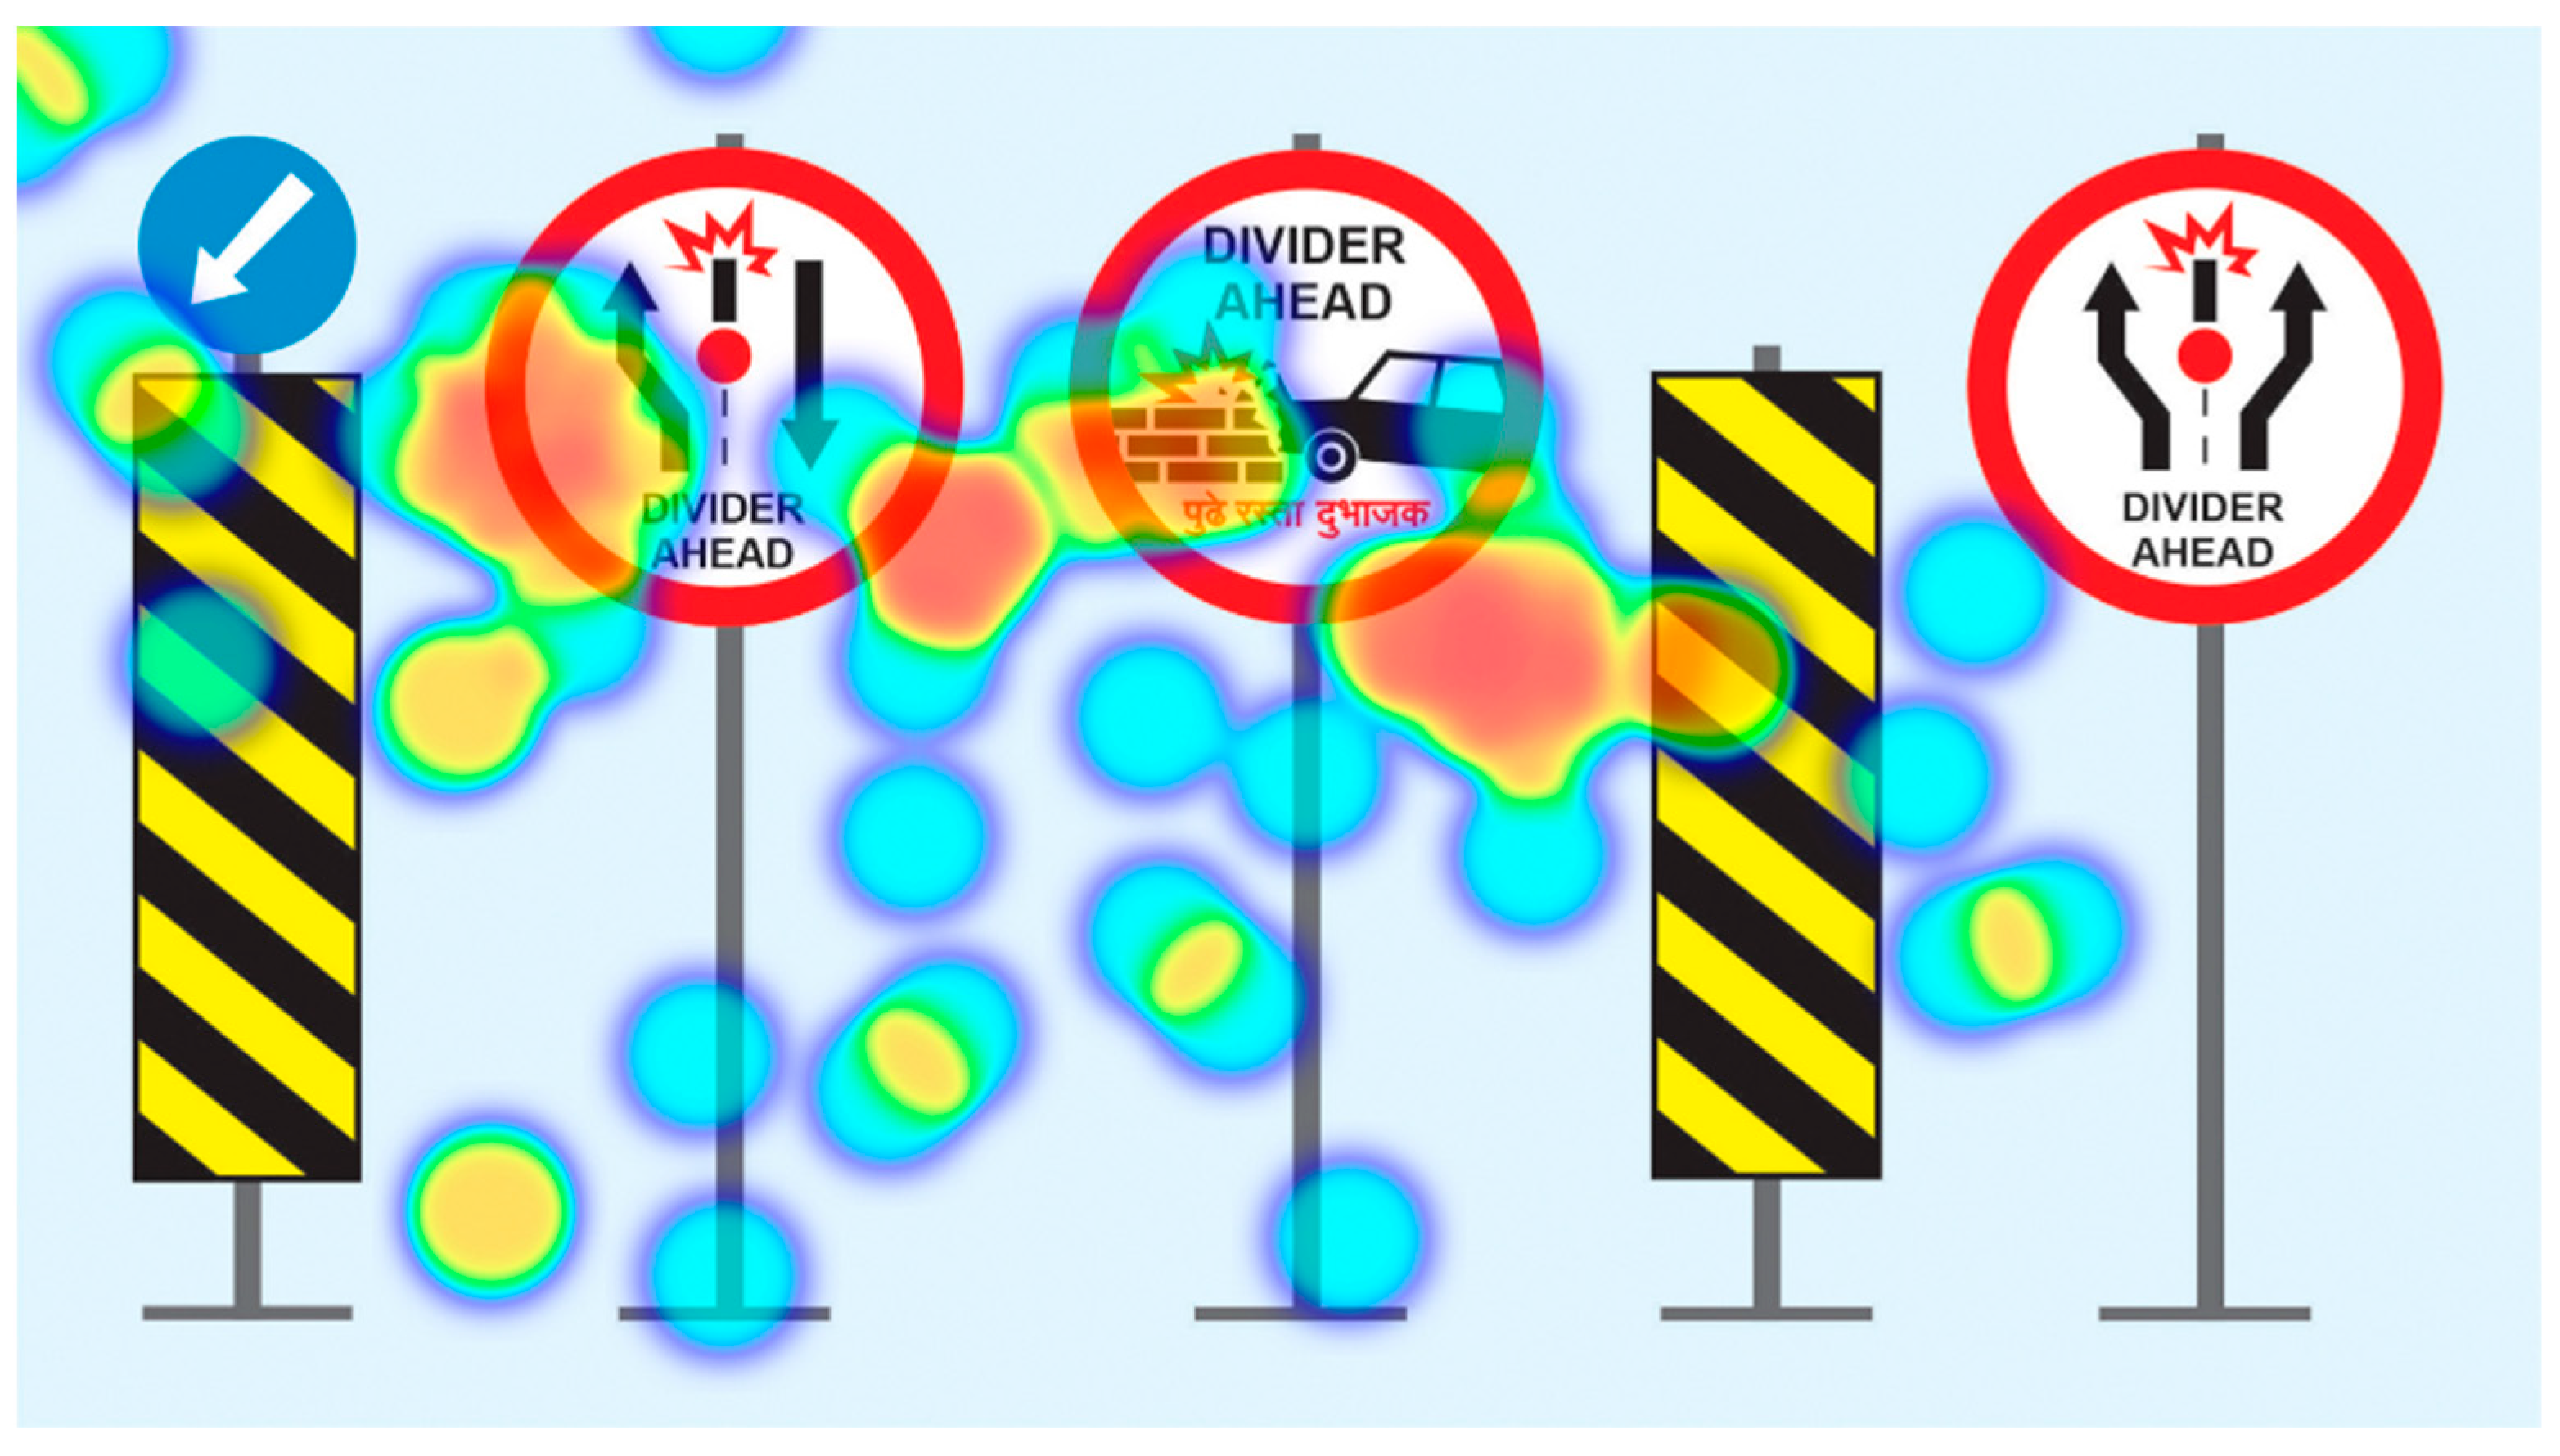
4.2. Results of Eye-Tracking Study
In the eye-tracking study, the attention of participants was distributed over various sign, as presented in the heatmap (Figure 16). When five signs were presented together for the eye-tracking study, we found that participants paid most of their attention to Sign 5. Heat maps were predominantly centered around Sign 5, as represented in Figure 16. Hence, it is clear from the heatmap analysis that Sign 5 was the most attractive and people were more attentive towards it. Therefore, if Sign 5 was implemented, there is a higher chance of reduction of accidents due to sudden dividers with or without existing signs by creating alertness to road safety.

Figure 16.
Heatmap analysis for traffic signs used in the eye-tracking study.
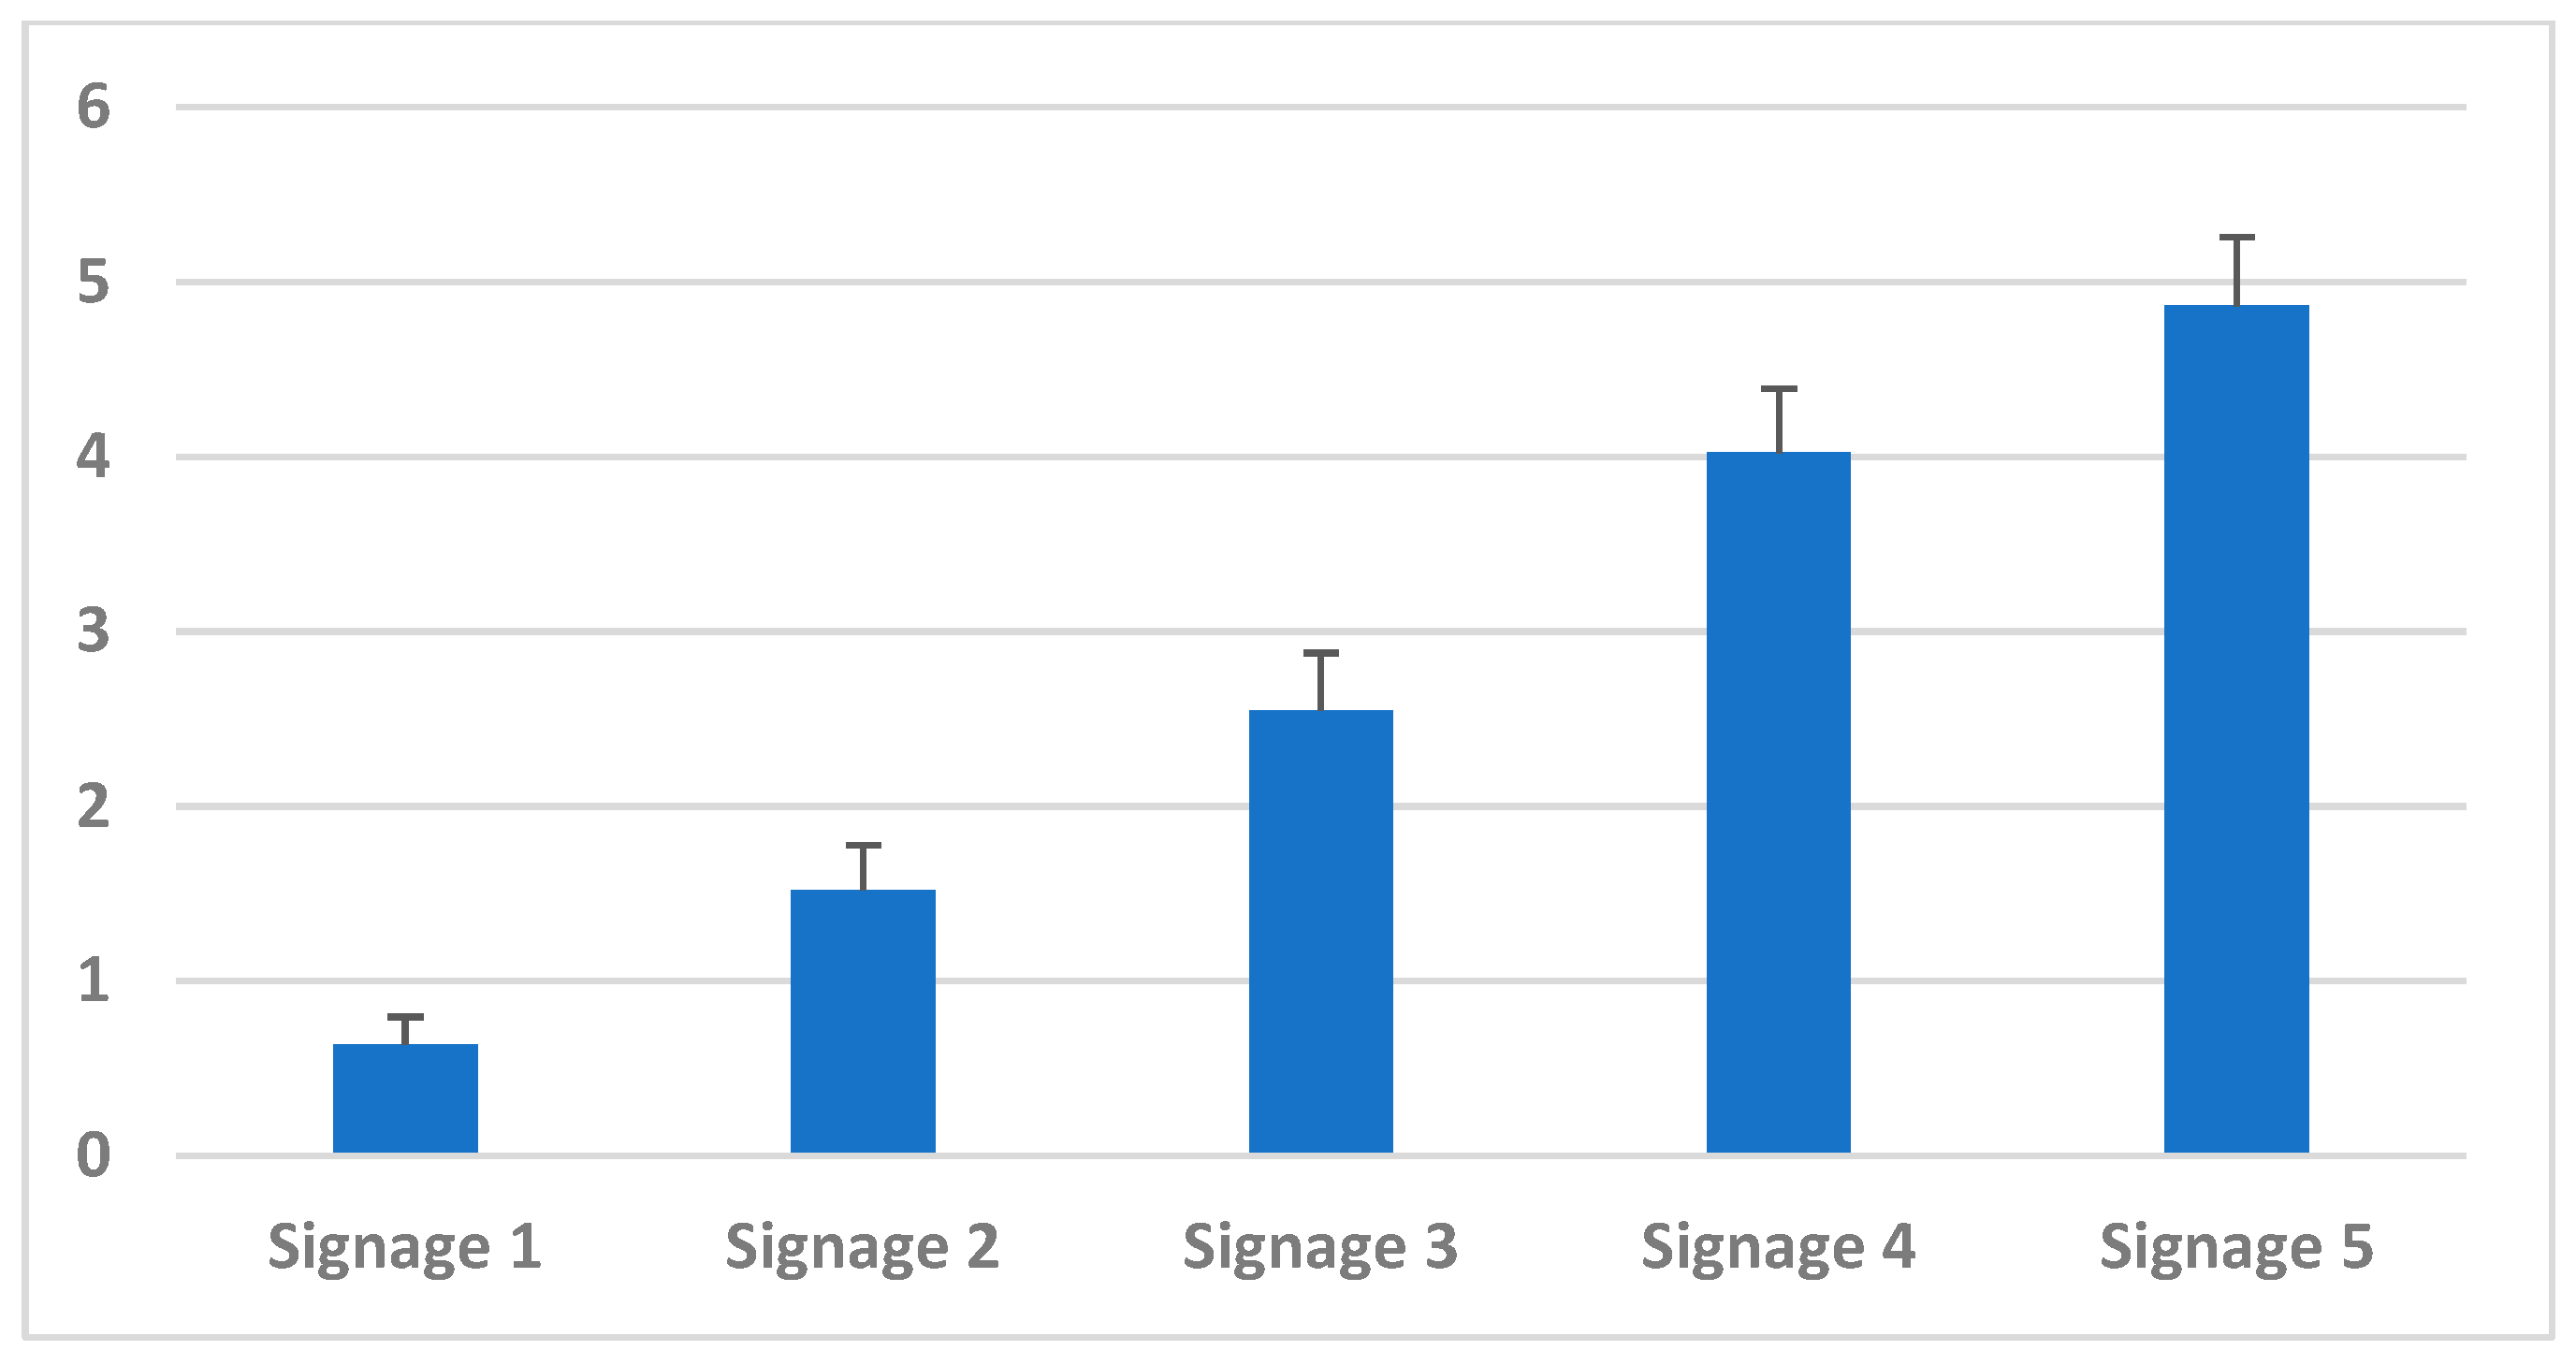
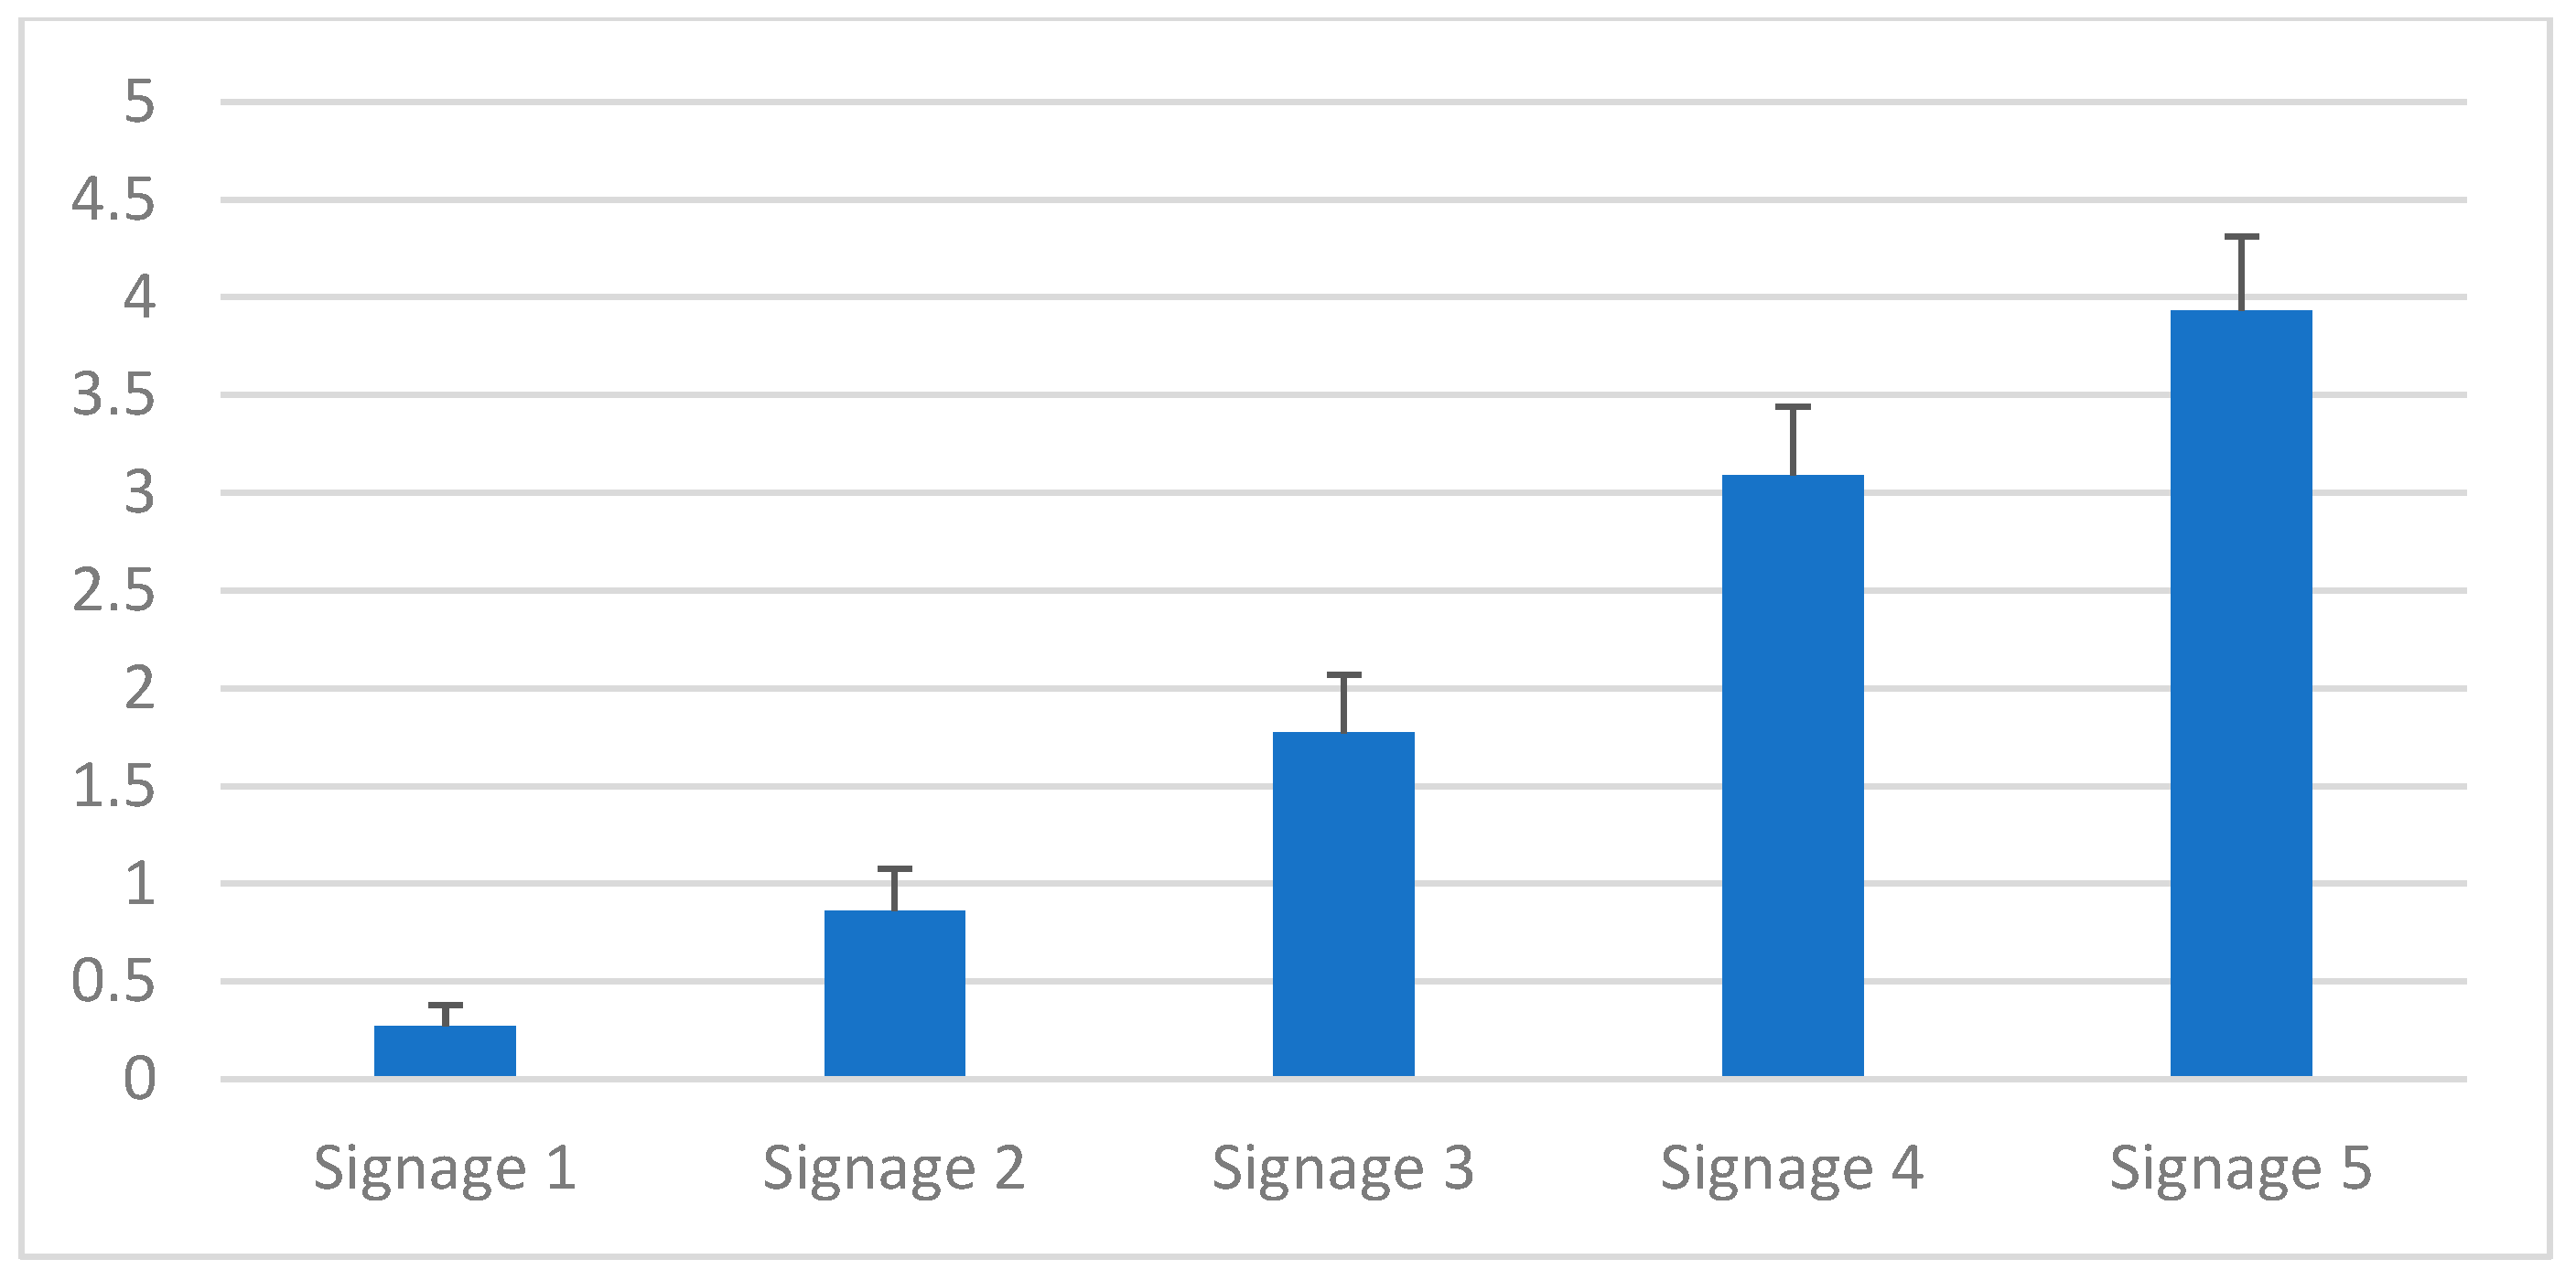
There was a significant difference in mean values of average fixation counts due to variations in design of traffic signs (F (4) = 3.711, p = 0.006, Ƞ2 = 0.066, OP = 0.88) (please refer to the mean variation of fixation counts for various signs in Figure 17). Also, there was a significant difference in mean values of total fixation counts (see Figure 18) due to variations in number of exposures or arrangements of signage in stimuli (F (2) = 3.039, p = 0.05, Ƞ2 = 0.028, OP = 0.58). The mean value of total fixation counts of Sign 5 was significantly higher than signs 1 and 2 (p < 0.05). However, there was no record of significant differences in other eye-tracking variables (fixation duration, first fixation duration, visit counts, and revisits per count) due to variations in design of traffic signs and variations in number of exposures or arrangements of signage in stimuli (p > 0.05).
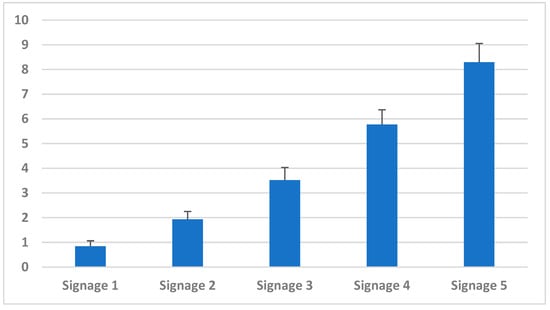
Figure 17.
Mean variations in average fixations counts per AOI.
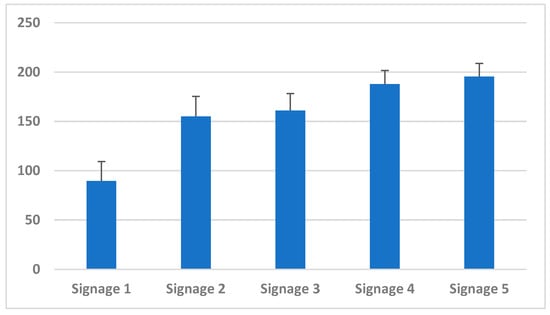
Figure 18.
Mean variations in total fixations counts per AOI.
The first fixation duration per AOI was highest in the case of Sign 5 and lowest in the case of Sign 1 (see Figure 19). Similarly, visit counts per AOI were also highest in the case of Sign 5 and lowest in the case of Sign 1 (see Figure 20). The mean revisit counts per AOI was found to be highest in the case of Sign 5 and lowest in the case of Sign 1 (see Figure 21). All of these results indicate that Sign 5 is more attractive and might be more meaningful in the pursuit of preventing accidents due to dividers.

Figure 19.
Mean variations in first fixation duration (Y axis: in ms) per AOI.
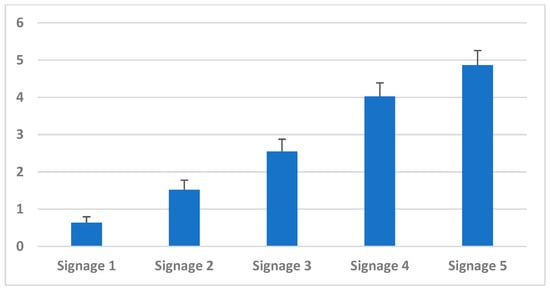
Figure 20.
Mean variations in visit counts per AOI.

Figure 21.
Mean variations in revisits count per AOI.
4.3. Results of Conjoint Analysis
The signage samples communicated to the selected users from various age group and genders to test the five specific criteria are listed in Table 2. As researchers received varied responses for the selection of signs (Sign 3 was the most prominent in the case of the questionnaire study but Sign 5 stood out in the eye-tracking study), a conjoint analysis was conducted to understand the overall score for both signs and select the most prominent one of the two. From the conjoint analysis results, it was observed that, overall, Sign 5 stands out, as the sum and average normalized scores for Sign 5 were greater than those of Sign 3.
Table 2.
Results of conjoint analysis.
5. Discussion
The legibility of traffic signs depends on the text and traffic symbols used in the signs [26]. In addition, the comprehension of signs depends on the understanding of meaning and effective communication of traffic symbols [27,28]. In this study, the novel signs for “Dividers Ahead Alert” were tested based on legibility and effective communication. It was found that many of these proposed signs (Sign 3 and Sign 5) were legible and effectively communicated the desired meanings better than the existing signs (Sign 1 and Sign 2). Such visual plates are required to bring real-time application to avoid accidents due to road dividers installed on steady continued roads. The required signage system display is the duty of the concerned traffic department. Members with expertise in the topic must be appointed in this department. They must collect the necessary reports through deep study and analysis of road- and signage-related issues.
In the eye-tracking study, it was observed that the highest number of fixations and fixation duration were for Sign 5, indicating that it has comparatively more attention-grabbing characteristics. When signs containing more information (loaded with more content) and unfamiliar elements were exposed to the participants, they systematically produced the longest overall and average fixation and gazing durations. On the contrary, other research says that if the object is more attractive [29], interesting [30], less confusing [31], and quickly searchable [32], it might have more fixation counts and longer fixation duration. In this study, it was observed that the signs having more legibility and effective communication scores also had higher numbers of fixation counts and fixation duration. Hence, Sign 3 and Sign 5 were of higher prominence than the existing signs (Sign 1 and Sign 2). When these signs were compared on the basis of conjoint analysis, it was observed that Sign 5 is the best sign to represent a divider ahead to prevent the possibility of road accidents due to sudden dividers.
The current signs or the temporary solutions to alert users about a divider ahead are insufficient. Many times, the concerned local departments have tried to find temporary solutions, and such solutions may continue into regularization. The current study was specifically focused to find a functional solution. The functionality of the proposed plate needs to be tested at actual locations. It was also noted that the temporary solution installation in the changing digital scenario in the industry now requires the use of additional technology in the signage display domain. After display of the plates, the complete lack of signs is another issue for the system. Solutions for this specific problem can be found by using AI (artificial intelligence) or digital detection or tracking solutions to maintain the plates at places. The current proposed signage is a solution to alert the vehicles about a divider ahead.
6. Conclusions
The sign samples were tested with users and the analysis of the eye-tracking test was documented. From conjoint analysis results, it was observed that, overall, Sign 5 is the best, as the sum and average normalized scores for Sign 5 were greater than those of Sign 3 (see Table 2). Hence, in this study, a better road sign was designed, validated, and proposed for implementation to prevent accidents due to sudden divides in Indian roads. The eye-tracking method was applied for the validation of the proposed signage, and the contingency method was first applied to check the suitability of the road signage. However, the newly developed eye-tracking method, which is integrated with a mixed-reality device, could also be applied in the near future to test the signs in a mixed-reality traffic environment.
The proposed signage proposal is a requirement on the road but is overlooked by the concerned transportation department of the government body. The sensitivity toward the said issue needs to be resolved by taking necessary action. As mentioned above, the current paper focused on highlighting the issue of accidents due to sudden dividers on the road. After the study and analysis of the proposed solution, we offer some conclusion points after the above discussion. The sudden divider is placed on the road to channelize vehicles. Such systems help in diverting traffic, but also become the reason for resulting accidents (see Figure 2). To avoid such accidents, there needs to be signs installed at least 200 m before the divider starts to alerts the vehicles (see Figure 5, Figure 6 and Figure 7).
The survey and analysis need to be conducted on actual users after the display of the proposed signage on the road and documented in the report after implementing them on roads. The particular place where the continuous accidents are happening needs to be used as a case study or sample study, and regular checks must happen at that location by installing such signage with actual users. The improvement must be checked after a defined duration after the implementation of the proposed signage. The proposed signage needs to be tested on actual roads in various places and scenarios. Afterwards, a survey needs to be implemented throughout the country to help vehicles navigate the roadways safely and avoid accidents on the road through alertness to road conditions. We must emplace “Divider Ahead Alert” signage where applicable.
7. Practical Implication
The current scenario is very critical on many roads due to ignorance of signage system placements on respective locations, resulting in regular accidents. The proposed signs will help the user safely control the vehicle and take necessary action on the road to direct the vehicles. The local accident spots, due to some object installed on the road for any reason, need to be identified. There is a requirement to appoint a separate team for such study and implement these systems at particular locations. Users need to be educated on the importance of signage, specifically through schooling techniques. In addition, animated LED-based signs could also be implemented in the future, as research says that animated symbols attract people towards looking at these symbols.
Author Contributions
Conceptualization, M.D. and A.C.; methodology, M.D. and A.C.; software, A.C.; validation, M.D. and A.C.; formal analysis, A.C.; investigation, M.D.; resources, M.D.; data curation, M.D. and A.C.; writing—original draft preparation, M.D.; writing—review and editing, M.D.; visualization, M.D.; supervision, A.C.; project administration, M.D.; funding acquisition, Self-funded. All authors have read and agreed to the published version of the manuscript.
Funding
No external funding was received for this research.
Data Availability Statement
The entire raw data is with authors. Authors shall provide and disclose the raw data when and if required.
Acknowledgments
We acknowledge the Ministry of Road Transport and Highways and the Government of India, for making the information available for study on their respective websites.
Conflicts of Interest
There are no conflicts of interest.
References
- Shrivastav, S. Over 1/3rd Mishaps Occur at Wrongly Designed Medians. Available online: https://timesofindia.indiatimes.com/city/nagpur/over-1/3rd-mishaps-occur-at-wrongly-designed-medians/articleshow/63020444.cms (accessed on 22 February 2018).
- Road Accidents in India. 2022. pp. 4–21. Available online: https://morth.nic.in/sites/default/files/RA_2022_30_Oct.pdf (accessed on 1 January 2022).
- Pal, R.; Ghosh, A.; Kumar, R.; Galwankar, S.; Paul, S.K.; Pal, S.; Sinha, D.; Jaiswal, A.; Moscote-Salazar, L.R.; Agrawal, A. Public health crisis of road traffic accidents in India: Risk factor assessment and recommendations on prevention on the behalf of the Academy of Family Physicians of India. J. Fam. Med. Prim. Care 2019, 8, 775–783. [Google Scholar] [CrossRef] [PubMed]
- Athiappan, K.; Karthik, C.; Rajalaskshmi, M.; Subrata, C.; Dastjerdi, H.R.; Liu, Y.; Fernández-Campusano, C.; Gheisari, M. Identifying Influencing Factors of Road Accidents in Emerging Road Accident Blackspots. Adv. Civ. Eng. 2022, 2022, 9474323. [Google Scholar] [CrossRef]
- Mahajan, R.; Mahajan, D. To Study the Factors Causing Traffic Problems in India with Specific Reference to Pune City: A Conceptual Framework. Civ. Eng. Arch. 2022, 10, 1071–1080. [Google Scholar] [CrossRef]
- Gupta, I. Public Signage System to Combat Problems of Illiteracy and Multilingualism. J. Int. Soc. Res. 2008, 1, 268–278. [Google Scholar]
- Ben-Bassat, T.; Shinar, D. Ergonomic guidelines for traffic sign design increase sign comprehension. Hum. Factors 2006, 48, 182–195. [Google Scholar] [CrossRef] [PubMed]
- Liu, Y.C. A simulated study on the effects of information volume on traffic signs, viewing strategies and sign familiarity upon driver’s visual search performance. Int. J. Ind. Ergon. 2005, 35, 1147–1158. [Google Scholar] [CrossRef]
- Houben, S.; Stallkamp, J.; Salmen, J.; Schlipsing, M.; Igel, C. Detection of traffic signs in real-world images: The German Traffic Sign Detection Benchmark. In Proceedings of the 2013 International Joint Conference on Neural Networks (IJCNN), Dallas, TX, USA, 4–9 August 2013; pp. 1–8. [Google Scholar]
- Stallkamp, J.; Schlipsing, M.; Salmen, J.; Igel, C. Man vs. computer: Benchmarking machine learning algorithms for traffic sign recognition. Neural Netw. 2012, 32, 323–332. [Google Scholar] [CrossRef] [PubMed]
- Wang, S. New Signage Design: Connecting People & Spaces; Promopress: Barcelona, Spain, 2015; p. 004. [Google Scholar]
- David, G. The Wayfinding Handbook: Information Design for Public Places; Princeton Architectural Press: New York, NY, USA, 2009; p. 86. [Google Scholar]
- Philipp, M.; Daniela, P. Construction and Design Manual Wayfinding and Signage; DOM Publishers: Berlin, Germany, 2010; pp. 37–38. [Google Scholar]
- Michelle, G. Signage Design; Braun Publishing AG: Berlin, Germany, 2012; p. 8. [Google Scholar]
- Andreas, U. Signage Systems and Information Graphics: A Professional Sourcebook; Thames and Hudson Inc.: New York, NY, USA, 2007. [Google Scholar]
- Ng, A.W.; Chan, A.H. The guessability of traffic signs: Effects of prospective-user factors and sign design features. Accid. Anal. Prev. 2007, 39, 1245–1257. [Google Scholar] [CrossRef] [PubMed]
- Mishra, S.P. Road Safety Audit Confirming the Highway Safety Standards; Case Studies Kalahandi, Odisha. Soc. Nat. Sci. J. 2022, 13, 43809–43822. [Google Scholar]
- Dewar, R.; Pronin, M. Designing Road sign symbols. Transp. Res. Part F Traffic Psychol. Behav. 2023, 94, 466–491. [Google Scholar] [CrossRef]
- Congress, I.R. Code of Practice for Road Signs. 2012. Available online: https://law.resource.org/pub/in/bis/irc/irc.gov.in.067.2012.pdf (accessed on 4 October 2023).
- Akple, M.S.; Sogbe, E.; Atombo, C. Evaluation of road traffic signs, markings and traffic rules compliance among drivers’ in Ghana. Case Stud. Transp. Policy 2020, 8, 1295–1306. [Google Scholar] [CrossRef]
- Sermanet, P.; LeCun, Y. Traffic sign recognition with multi-scale convolutional networks. In Proceedings of the 2011 International Joint Conference on Neural Networks, San Jose, CA, USA, 31 July–5 August 2011; pp. 2809–2813. [Google Scholar]
- Yao, X.; Zhao, X.; Liu, H.; Huang, L.; Ma, J.; Yin, J. An approach for evaluating the effectiveness of traffic guide signs at intersections. Accid. Anal. Prev. 2019, 129, 7–20. [Google Scholar] [CrossRef] [PubMed]
- Shinar, D.; Vogelzang, M. Comprehension of traffic signs with symbolic versus text displays. Transp. Res. Part F Traffic Psychol. Behav. 2013, 18, 72–82. [Google Scholar] [CrossRef]
- Till, R.C.; Babcock, J.S. Proof of Concept: Use of Eye-Tracking to Record How People Use Exit Signage. In Pedestrian and Evacuation Dynamics; Springer: Boston, MA, USA, 2011; pp. 209–219. [Google Scholar]
- Babić, D.; Dijanić, H.; Jakob, L.; Babić, D.; Garcia-Garzon, E. Driver eye movements in relation to unfamiliar traffic signs: An eye tracking study. Appl. Ergon. 2020, 89, 103191. [Google Scholar] [CrossRef] [PubMed]
- Zwahlen, H.T.; Schnell, T. Legibility of traffic sign text and symbols. Transp. Res. Rec. 1999, 1692, 142–151. [Google Scholar] [CrossRef]
- Paniati, J.F. Legibility and Comprehension of Traffic Sign Symbols. In Proceedings of the Human Factors Society Annual Meeting; SAGE Publications: Sage, CA, USA; Los Angeles, CA, USA, 1988; Volume 32, pp. 568–572. [Google Scholar]
- Balk, S.A.; Kissner, E.; Katz, B. Comprehension and Legibility of Selected Symbol Signs Phase IV; No. FHWA-HRT-22-088; United States. Federal Highway Administration. Office of Safety Research and Development: Washington, DC, USA, 2022. [Google Scholar]
- Chowdhury, A.; Karmakar, S.; Reddy, S.M.; Sanjog, J.; Ghosh, S.; Chakrabarti, D. Visual attention analysis on mutated brand name using eye-tracking: A case study. World Acad. Sci. Eng. Technol. Int. J. Soc. Behav. Educ. Econ. Bus. Ind. Eng. 2012, 6, 1132–1135. [Google Scholar]
- Chowdhury, A.; Karmakar, S.; Reddy, S.M.; Ghosh, S.; Chakrabarti, D. Product personality rating style for satisfaction of tactile need of online buyers—A human factors issue in the context of e-retailers’ web-design. In Proceedings of the 2013 International Conference on Human Computer Interactions (ICHCI), Chennai, India, 23–24 August 2013; pp. 1–8. [Google Scholar]
- Chowdhury, A.; Rohankar, S. Effects of Animation Types on Visual Search. In Communication Design and Branding: A Multidisciplinary Approach; Springer: Cham, Switzerland; Berlin, Germany, 2023; pp. 253–266. [Google Scholar]
- Cai, L.; Yang, R.; Tao, Z. A new method of evaluating signage system using mixed reality and eye tracking. In Proceedings of the 4th ACM SIGSPATIAL International Workshop on Safety and Resilience, Seattle, WA, USA, 6 November 2018; pp. 1–6. [Google Scholar]


Disclaimer/Publisher’s Note: The statements, opinions and data contained in all publications are solely those of the individual author(s) and contributor(s) and not of MDPI and/or the editor(s). MDPI and/or the editor(s) disclaim responsibility for any injury to people or property resulting from any ideas, methods, instructions or products referred to in the content. |
© 2024 by the authors. Licensee MDPI, Basel, Switzerland. This article is an open access article distributed under the terms and conditions of the Creative Commons Attribution (CC BY) license (https://creativecommons.org/licenses/by/4.0/).