Article

Investigating the Combined Impact of Water–Diesel Emulsion and Al2O3 Nanoparticles on the Performance and the Emissions from a Diesel Engine via the Design of Experiment

1
Automotive Engineering Department, Faculty of Engineering, Minia University, Minia 61519, Egypt
2
Mechatronics Engineering Department, Faculty of Engineering, October University for Modern Sciences and Arts (MSA), Giza 12451, Egypt
3
Faculty of Engineering, October University for Modern Sciences and Arts (MSA), Giza 12451, Egypt
4
Center of Excellence, October University for Modern Sciences and Arts (MSA), Giza 12451, Egypt
*
Author to whom correspondence should be addressed.
Submission received: 20 October 2023 / Revised: 7 December 2023 / Accepted: 20 December 2023 / Published: 22 December 2023
(This article belongs to the Special Issue Design Sensitivity Analysis and Engineering Optimization)

Abstract

:
This study aims to assess the impact of the water ratio and nanoparticle concentration of neat diesel fuel on the performance characteristics of and exhaust gas emissions from diesel engines. The experimental tests were conducted in two stages. In the first stage, the effects of adding water to neat diesel fuel in ratios of 2.5% and 5% on engine performance and emissions characteristics were examined and compared to those of neat diesel at a constant engine speed of 3000 rpm under three different engine loads. A response surface methodology (RSM) based on a central composite design (CCD) was utilized to simulate the design of the experiment. According to the test results, adding water to neat diesel fuel increased the brake-specific fuel consumption and reduced the brake thermal efficiency compared to neat diesel fuel. In the examination of exhaust emissions, hydrocarbons (HC), carbon monoxide (CO), and nitrogen oxides (NOx) in the tested fuel containing 2.5% of water were decreased in comparison to pure diesel fuel by 16.62%, 21.56%, and 60.18%, respectively, on average, through engine loading. In the second stage, due to the trade-off between emissions and performance, the emulsion fuel containing 2.5% of water is chosen as the best emulsion from the previous stage and mixed with aluminum oxide nanoparticles at two dose levels (50 and 100 ppm). With the same engine conditions, the emulsion fuel mixed with 50 ppm of aluminum oxide nanoparticles exhibited the best performance and the lowest emissions compared to the other evaluated fuels. The outcomes of the investigations showed that a low concentration of 50 ppm with a small amount of 11 nm of aluminum oxide nanoparticles combined with a water diesel emulsion is a successful method for improving diesel engine performance while lowering emissions. Additionally, it was found that the mathematical model could accurately predict engine performance parameters and pollution characteristics.

1. Introduction

The use of diesel engines has exceeded that of gasoline engines in the vehicles industry and power generation due to their greater reliability and capacity. In contrast, diesel engines significantly contribute to environmental pollution, especially through substances that are harmful to human health, like hydrocarbons (HC), carbon monoxide (CO), particulate matter (PM), and nitrogen oxides (NOx). The use of exhaust gas recirculation (EGR), various fuel injection techniques, and alternative fuels like biodiesel derived from vegetable oil and animal fat are just a few of the numerous studies scientists continue to perform to decrease these harmful emissions [1]. Among these, due to its excellent ability to reduce hazardous emissions, especially NOx and PM, water diesel emulsion fuel has emerged as a favored alternative fuel for diesel engines. Additionally, it can be used without engine changes [2]. The excessively high temperature in the diesel engine promotes the generation of NOx gas through the reaction of oxygen and nitrogen from the air. The presence of water in emulsion fuel helps to lower NOx emissions by lowering the engine’s temperature [3].
Since diesel and water are immiscible, a small amount of surfactant is added to the mixture of water and neat diesel fuel through high-speed stirring, ultrasonic mixing, or other external forces to create a water–oil mixture known as a water–diesel emulsion [4,5]. The surfactant assists in creating stable water-in-fuel emulsions by reducing the interfacial tension between the two substances [5]. Different types of surfactants, such as Span 20, Span 60, Span 80, Tween 20, Tween 80, and Triton X100, with different ratios, have been used in several studies [6,7,8,9,10,11].
Seifi et al. [5] examined the engine performance and exhaust emission parameters using water percentages (2%, 5%, 8%, and 10% by volume) mixed with pure diesel fuel to create a water–diesel emulsion. They observed a notable decrease in engine power and torque when using emulsions, primarily attributable to the reduction in heating value. They also observed that emulsions led to a reduction in engine NOx emissions, attributed to the lowering of combustion temperatures compared to neat diesel fuel. Ithnin et al. [6] studied the impact of water–diesel emulsion on the performance of and emissions from a direct-injection diesel engine. Four samples of water–diesel emulsions were examined, each containing varying water proportions (5%, 10%, 15%, and 20%) while maintaining a constant surfactant content of 2% (Span 80). These samples were labeled E5, E10, E15, and E20, respectively. Based on their results, E20 exhibited similar in-cylinder pressure and heat release rates to pure diesel fuel, concurrently reducing NOx and PM emissions significantly. In their study, Azimi et al. [7] studied water–diesel emulsions as a possible solution to reduce engine pollution. The emulsion fuel varied in water content, ranging from 0% to 10% by volume. Their findings indicated that emulsified diesel fuel containing 2% water content enhanced engine power and torque while reducing exhaust emissions. Watanabe et al. [12] conducted experiments on a single-cylinder diesel generator using two types of water–diesel emulsions with different water contents (10% and 20% by volume) and 1% surfactant (Span 80). The test results revealed that emulsified fuels reduced NOx and PM emissions by up to 51% and 14%, respectively. Alahmer et al. [13] focused on assessing the engine’s performance and its environmental impact when running on both pure diesel and emulsified fuel containing various water content levels (ranging from 5% to 30% by volume). During the experiments, the engine operated within a speed range of 1000 to 3000 rpm. The results showed that emulsified fuel, while maintaining or improving thermal efficiency and reducing NOx emissions, also increased brake-specific fuel consumption. Furthermore, a higher water content in the emulsion contributed to reduced nitrogen oxide emissions. However, it was noted that diesel emulsion fuel produced higher CO2 emissions compared to pure diesel.
Researchers have recently become interested in adding nano additives to water–diesel emulsions, which substantially impact the diesel engine’s operational characteristics [14]. In internal combustion engines, metal nanoparticles are frequently utilized in fuel as nano additives [15]. Nanoparticles of metal oxides, such as aluminum oxide (Al2O3), zinc oxide (ZnO), cerium oxide (CeO2), and others, are the focus of the majority of the research on metal nanoparticles utilized in emulsified fuel at the present time [16]. These nanoparticles’ benefits, such as their high oxygen content, high thermal conductivity, potent catalytic function, quick combustion rate, and increased production of free radicals, make them ideal for improving thermal efficiency, lowering fuel consumption, and reducing harmful emissions [17].
Vali and Wani [14] performed research on the influence of a diesel–water emulsion containing 88% diesel, 10% water, and 2% surfactants mixed with ZnO nanoparticles, varying between 50 ppm and 100 ppm, on engine performance and emissions compared to neat diesel fuel and water–diesel emulsion fuel at different compression ratios. As a result, a more significant improvement in BTE and BSFC was seen for emulsified fuels contained ZnO nanoparticles compared to other test blends by increasing the engine’s compression ratio. CO and HC emissions were reduced dramatically, but CO2 emissions were increased for emulsified fuels containing ZnO nanoparticles. Basha et al. [18] examined a diesel engine’s performance and emission characteristics when fueled with an emulsified mixture composed of 83% diesel, 15% water, and 2% surfactants by volume. Alumina nanoparticles were systematically introduced into the water–diesel emulsion fuel at 25, 50, and 100 ppm mass concentrations. Their findings revealed a notable enhancement in engine performance and reduced harmful emissions due to incorporating alumina nanoparticles into the water–diesel emulsion fuel. In a study by Khatri and Goyal [19], the combined impact of silicon dioxide (SiO2) nanoparticles and water–diesel fuel on the performance and emissions of diesel engines was investigated. The base fuel, denoted as D94W5S1, consisted of 94% diesel, 5% water, and 1% Span 80. SiO2 nanoparticles were introduced at concentrations of 25, 50, 75, and 100 ppm. Based on the experimental results, the test fuel containing 50 ppm of SiO2, labeled as D94W5S1-Si50, emerged as the optimal configuration. This particular configuration led to notable reductions in NOX, smoke opacity, hydrocarbon, and carbon monoxide emissions of 52.52%, 29.32%, 69.69%, and 64.28%, respectively, when compared to pure diesel under full load conditions. Anil et al. [20] aimed to address a reduction in pollutants emanating from the exhaust of diesel engines while concurrently enhancing performance. This was achieved by incorporating cobalt oxide (Co3O4) nanoparticles into water-emulsified diesel. Emulsion blends were prepared with varying water concentrations (5% and 10%) and nanoparticle dosages (50 ppm and 100 ppm). The experimental results revealed that adding 100 ppm of cobalt oxide nanoparticles to the emulsified fuel led to significant reductions of 23% in NOx, 33.3% in HC, 25% in CO, and 44.6% in smoke emissions compared to pure diesel. Furthermore, BTE enhancements and BSFC reductions were observed across all emulsion blends.
Response surface methodology (RSM) application is quickly becoming a crucial and popular tool for tackling various industrial issues [21]. This approach is also considered to be effective and less costly for analyzing the individual and combined elements of experiment variables that affect output responses [21]. Compared to other optimization methods, RSM shortens the time needed to finish the procedure by reducing the number of tests and establishing a suitable test matrix [22].
The authors of this work have previously evaluated the influence of the addition of aluminum oxide nanoparticles to diesel fuel on emissions and the performance of an engine generator set using response surface methodology [23]. This study aims to investigate diesel engines’ performance characteristics and emissions by mixing water, Al2O3 nanoparticles, and diesel fuel at two stages of experimental work. Based on previous studies, using a water–diesel emulsion effectively reduced NOx emission [1,3,6,24,25,26,27,28,29,30,31]. In contrast, many studies showed a decrease in brake thermal efficiency (BTE) and an increase in brake-specific fuel consumption (BSFC) with an increasing water ratio in the emulsion fuel due to a lower heating value [32,33,34,35,36,37,38]. To combat this issue, Al2O3 nanoparticles are chosen as the combustion enhancer and mixed with the water–diesel emulsion fuel. The novelty of the current study is the fact that no previous study has optimized the input variables of a diesel engine for improved performance and emission responses from water–diesel emulsions with the addition of Al2O3 nanoparticles according to response surface methodology approach.

2. Methods and Materials

2.1. The Experimental Strategy

The experimental investigations have been divided into two stages. In the first stage, the impact of adding water with ratios of 2.5 and 5% to neat diesel fuel on engine performance and emissions parameters was investigated and compared with those in neat diesel. Based on improved engine performance and the possible reduction in emissions, the best emulsion fuel will be chosen. In the second stage, the best emulsion fuel, which was experimentally selected in the first stage, is combined with aluminum oxide nanoparticles at two dosage levels (50 and 100 ppm), and their impacts on the same engine will be examined and compared to those of water diesel emulsion and neat diesel.

2.2. Water Diesel Emulsion Fuel Preparation

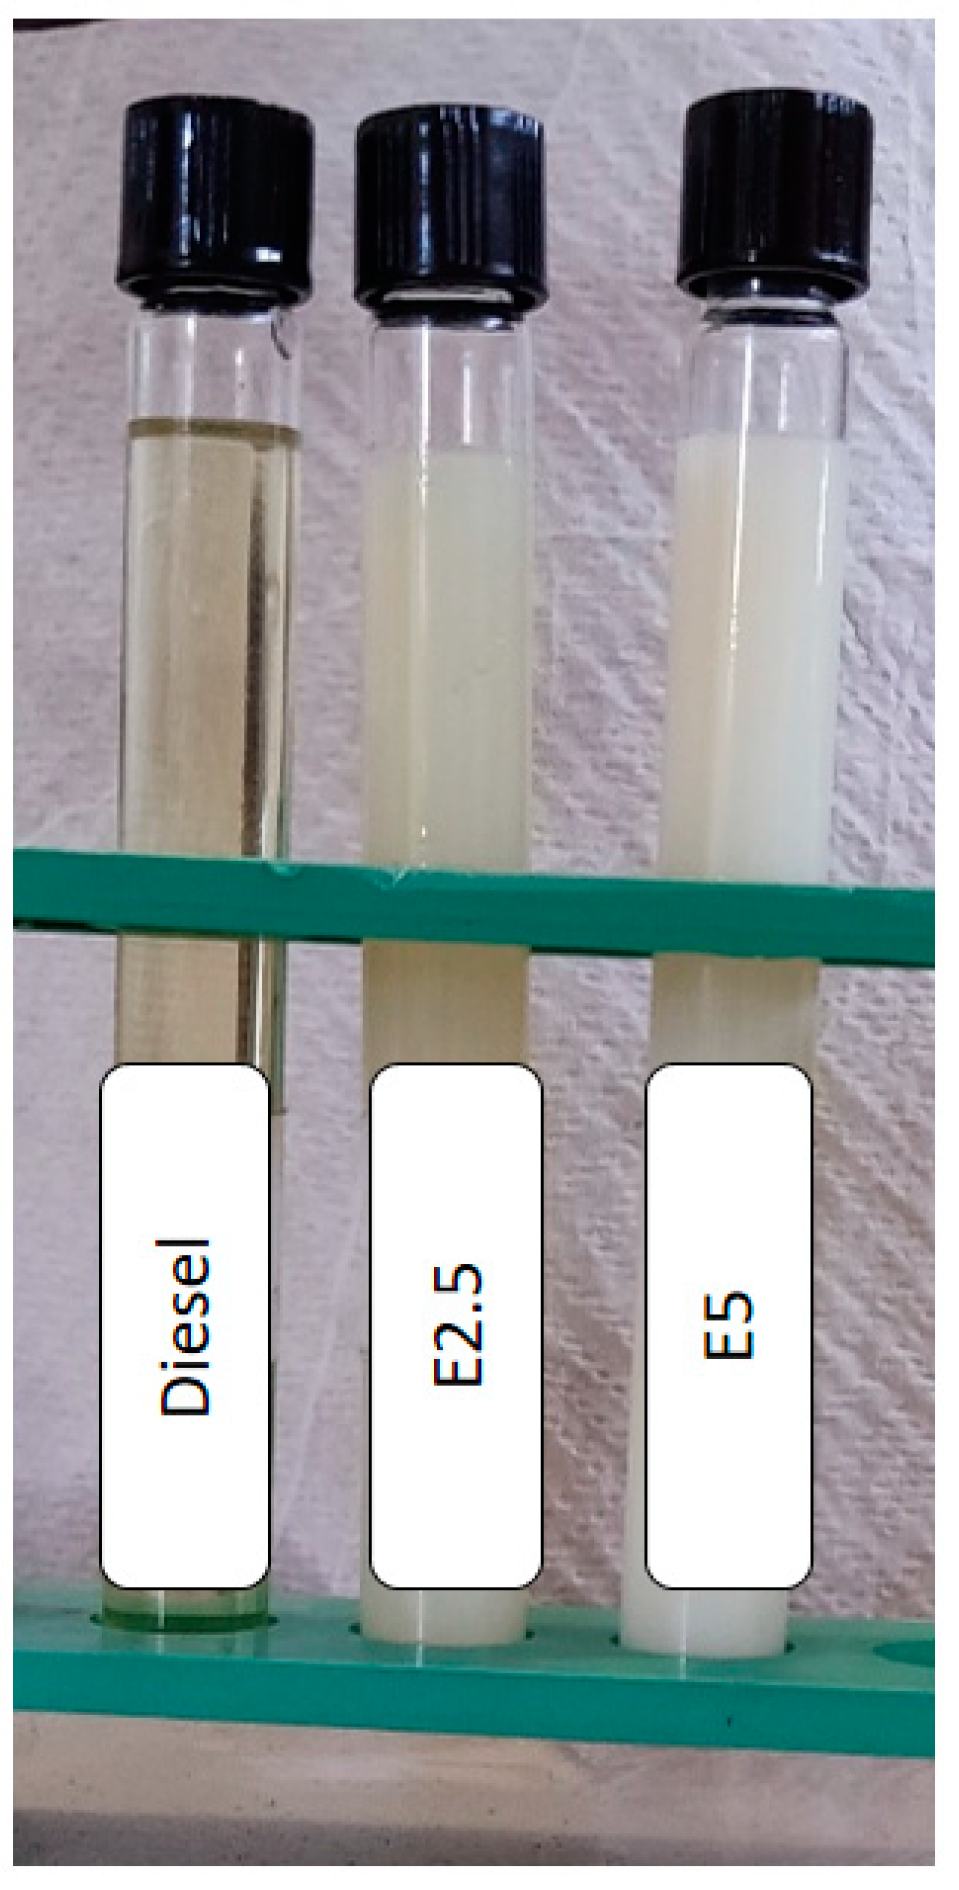
Two samples with low water ratios were selected based on the literature and preliminary experiments. This choice was made since increasing the emulsion’s water ratio tends to reduce brake thermal efficiency and increase brake-specific fuel consumption. By volume, the first sample, designated as E2.5, is composed of 94.5% diesel, 3.3% surfactant, and 2.5% water. The second sample, E5, has a volume percentage of 92% diesel, 3% surfactant, and 5% water. The water–diesel emulsions were prepared using stirring and ultrasonication phases. In the stirring step, 3% of Span 20 (Sorbitan monolaurate) by volume is added to diesel as a surfactant using a magnetic stirrer for ten minutes at a speed of 2400 rpm. Then, the distilled water is added gradually drop-by-drop into the mixture of surfactant and diesel fuel for another 20 min. In the ultrasonication phase, the emulsion was placed in a sonicator for one hour. Strong stirring effects are produced by this ultrasonication method, which mixes the continuous (diesel) and dispersed (water) phases [39]. Figure 1 depicts the process of making water–diesel emulsion. The real appearances of the prepared neat diesel fuel and water–diesel emulsion fuels are presented in Figure 2.

2.3. Nanoparticles Characteristics and Aluminum Oxide Nanoparticles Blended Water Diesel Emulsion Fuel Preparation

The physical properties of Al2O3 nanoparticles, bought from the Nanotech Egypt Company, are displayed in Table 1. Figure 3 depicts Al2O3 nanoparticles using transmission electron microscopy (TEM). The nanoparticles were added to the mixture of diesel fuel and surfactant at the start of the stirring phase to prepare nanoparticles-blended water–diesel emulsion fuel. Then, the same preparation procedure was utilized, as discussed in Section 2.2.

2.4. Fuel Properties

Using the ASTM criteria for Egyptian diesel fuel provided in Table 2, it is assumed, for testing purposes, that pure diesel has a density of 829 kg/m3 and a heating value of 42,000 kJ/kg [23,40]. Additionally, it is assumed that water has a density of 1000 kg/m3 and that Span 20 has a density of 1032 kg/m3 [41]. The heating values for the water and surfactant are assumed to be zero [42]. As shown in Table 3, the heating values and densities of water–diesel emulsion fuel samples have been determined using the weighted average approach [29,42,43,44]. Furthermore, in our work, it is assumed that the heating value and density of aluminum oxide nanoparticles blended with water–diesel emulsion fuel will not change due to the marginal effect; similar assumptions were made in earlier studies [23,45,46].

2.5. Experimental Apparatus and Procedure

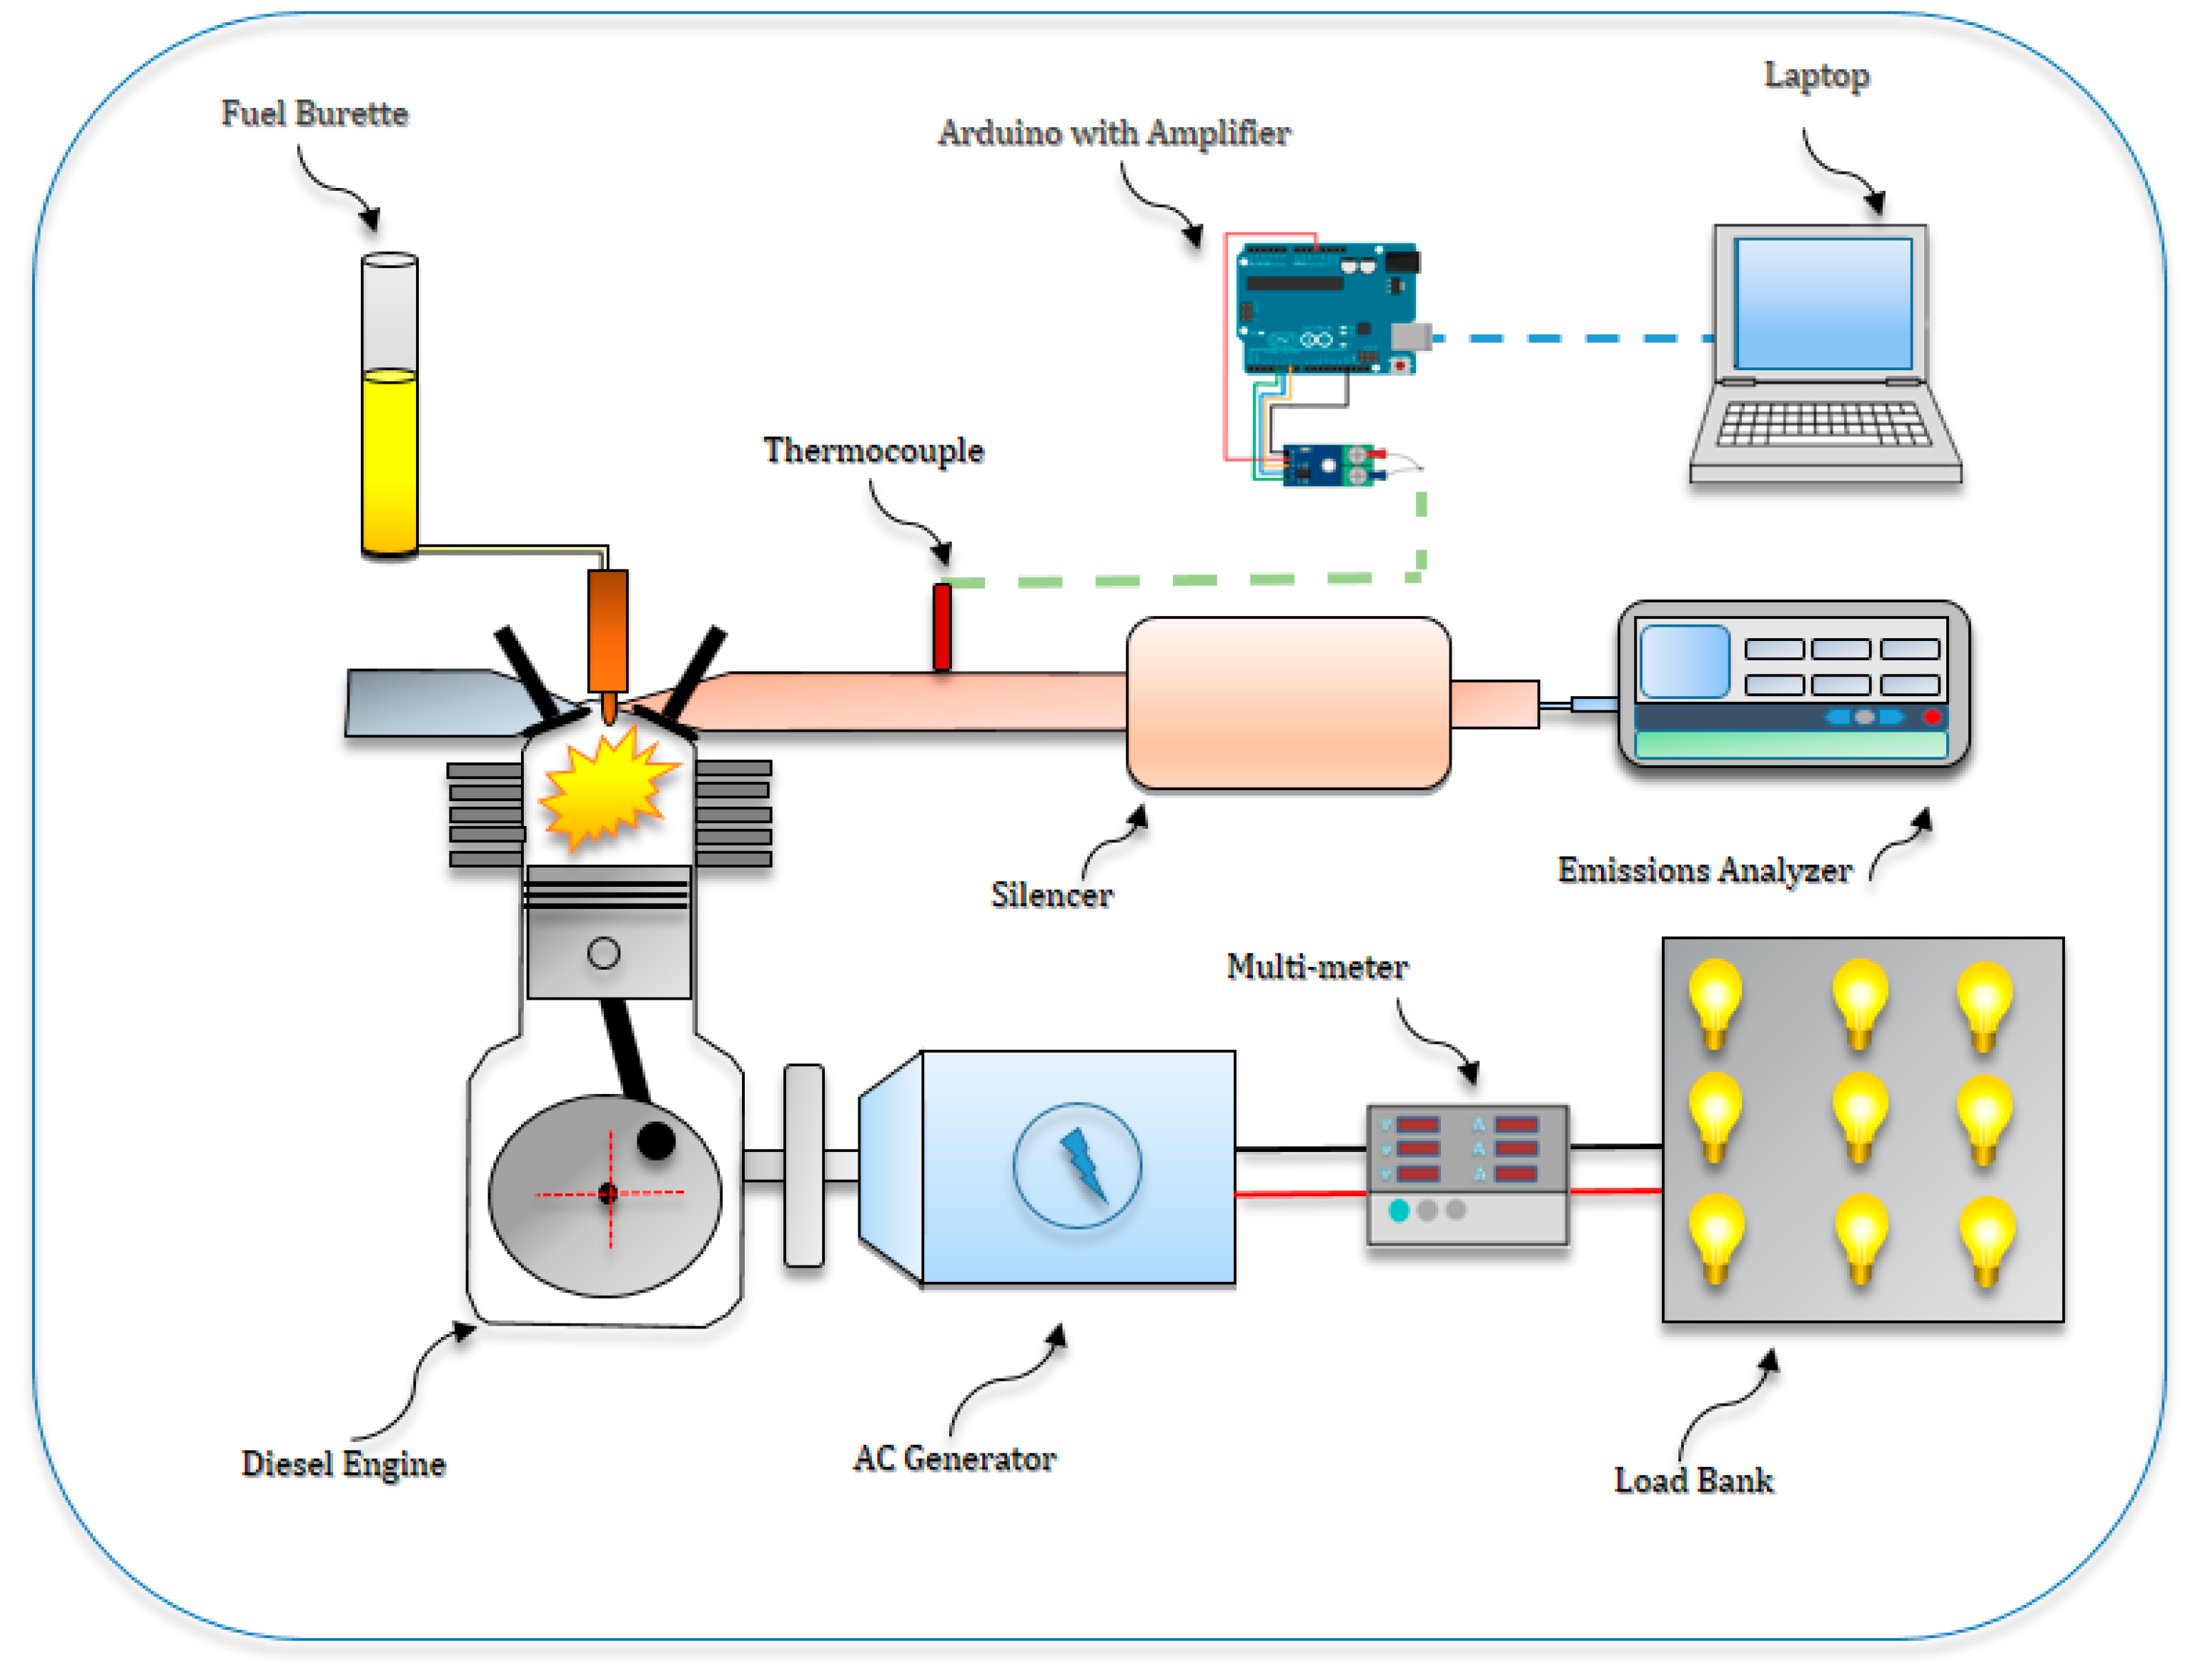
The apparatus consists of a fuel supply, an electric load bank, an engine generator set, and measuring apparatus. A schematic representation of the test rig is depicted in Figure 4. The technical details of the engine and generator are provided in Table 4. To determine the fuel consumption, a fuel burette and timer were utilized. For this, it was noted how long it took to consume twenty milliliters of fuel and then the mass was divided by the duration. The electric load was measured with the aid of a Tense-EM-06 digital multi-meter. The BSFC and BTE values were determined for the electrical power of the generator load. The exhaust emissions were measured by the Brain Bee-AGS668 emissions analyzer. The technical details of the exhaust gas analyzers are listed in Table 5. EGT was monitored using a thermocouple (K-type) installed in the exhaust pipe and an Arduino UNO R3 microcontroller linked to a MAX6675 analog-to-digital signal converter.
In the experiment, for warming up and establishing steady conditions, the engine could continue to operate for ten minutes. With a partial engine load and a rated speed of 3000 rpm, the experiment was run using an electric load bank with three different load levels: 0.9, 1.8, and 2.7 kW. In many practical applications, diesel engines run under partial load circumstances for much of their runtime. This is especially true when the engine does not continuously operate at full power, such as industrial machinery or city driving. Consequently, partial loads offer valuable insights into conditions that are applicable in real-world scenarios. Once the engine’s operating state had stabilized, data on its performance and exhaust emissions were collected. The average data were immediately entered into the design expert program after being measured in triplicate throughout each run on the same day. It was necessary to empty and clean the fuel burette with the fuel line before switching to different fuel samples.

2.6. Measurement Uncertainty

Uncertainty analysis is a methodical and balanced series of steps used to determine the errors in the collected experimental data [47]. In line with the uncertainty analysis methodology, as outlined by Casseres et al. [48], the type A evaluation method was applied. This method involves conducting a statistical analysis of a series of measurements. Subsequently, to determine the most accurate estimate x i from a collection of measurements q 1 , q 2 , q 3 , , q n the following expression was employed:
x i = q ¯ = 1 n · i = 1 n q i
The variability within the set of measurements q 1 , q 2 , q 3 , , q n ) is established by computing the standard deviation (S).
S = 1 n 1 i = 1 n q i q ¯ 2
The standard uncertainty is derived by computing the average experimental standard deviation u x i .
u x i = 1 n 1 n 1 i = 1 n q i q ¯ 2
where ‘n’ signifies the number of measurements performed repeatedly. The overall uncertainty U(overall) regarding the engine’s performance and emission parameters is computed utilizing the subsequent equation [47]:
U ( overall ) = ±   Uncertainty   of   % N O x 2 + H C 2 + C O 2 2 + C O 2 + E G T 2 + B S F C 2 + B T E 2
The uncertainty of each variable and the overall uncertainty of the experiment at two stages are presented in Table 6.

2.7. RSM Modeling

In the 1950s, Box and associates created the response surface methodology [49]. RSM is a computer-based application used for modeling and optimizing internal combustion engines and has gained recognition across several fields. This technique calculates and maximizes the effects and magnitudes of various input elements on the engine’s response [50]. In RSM modeling, a quadratic polynomial equation, as in Equation (5), is typically used to explain the relationship between the input and output parameters:
y = β 0 + i = 1 k β i x i + i = 1 k j i k β i j x i x j + i = 1 k β i i x i 2 + ε
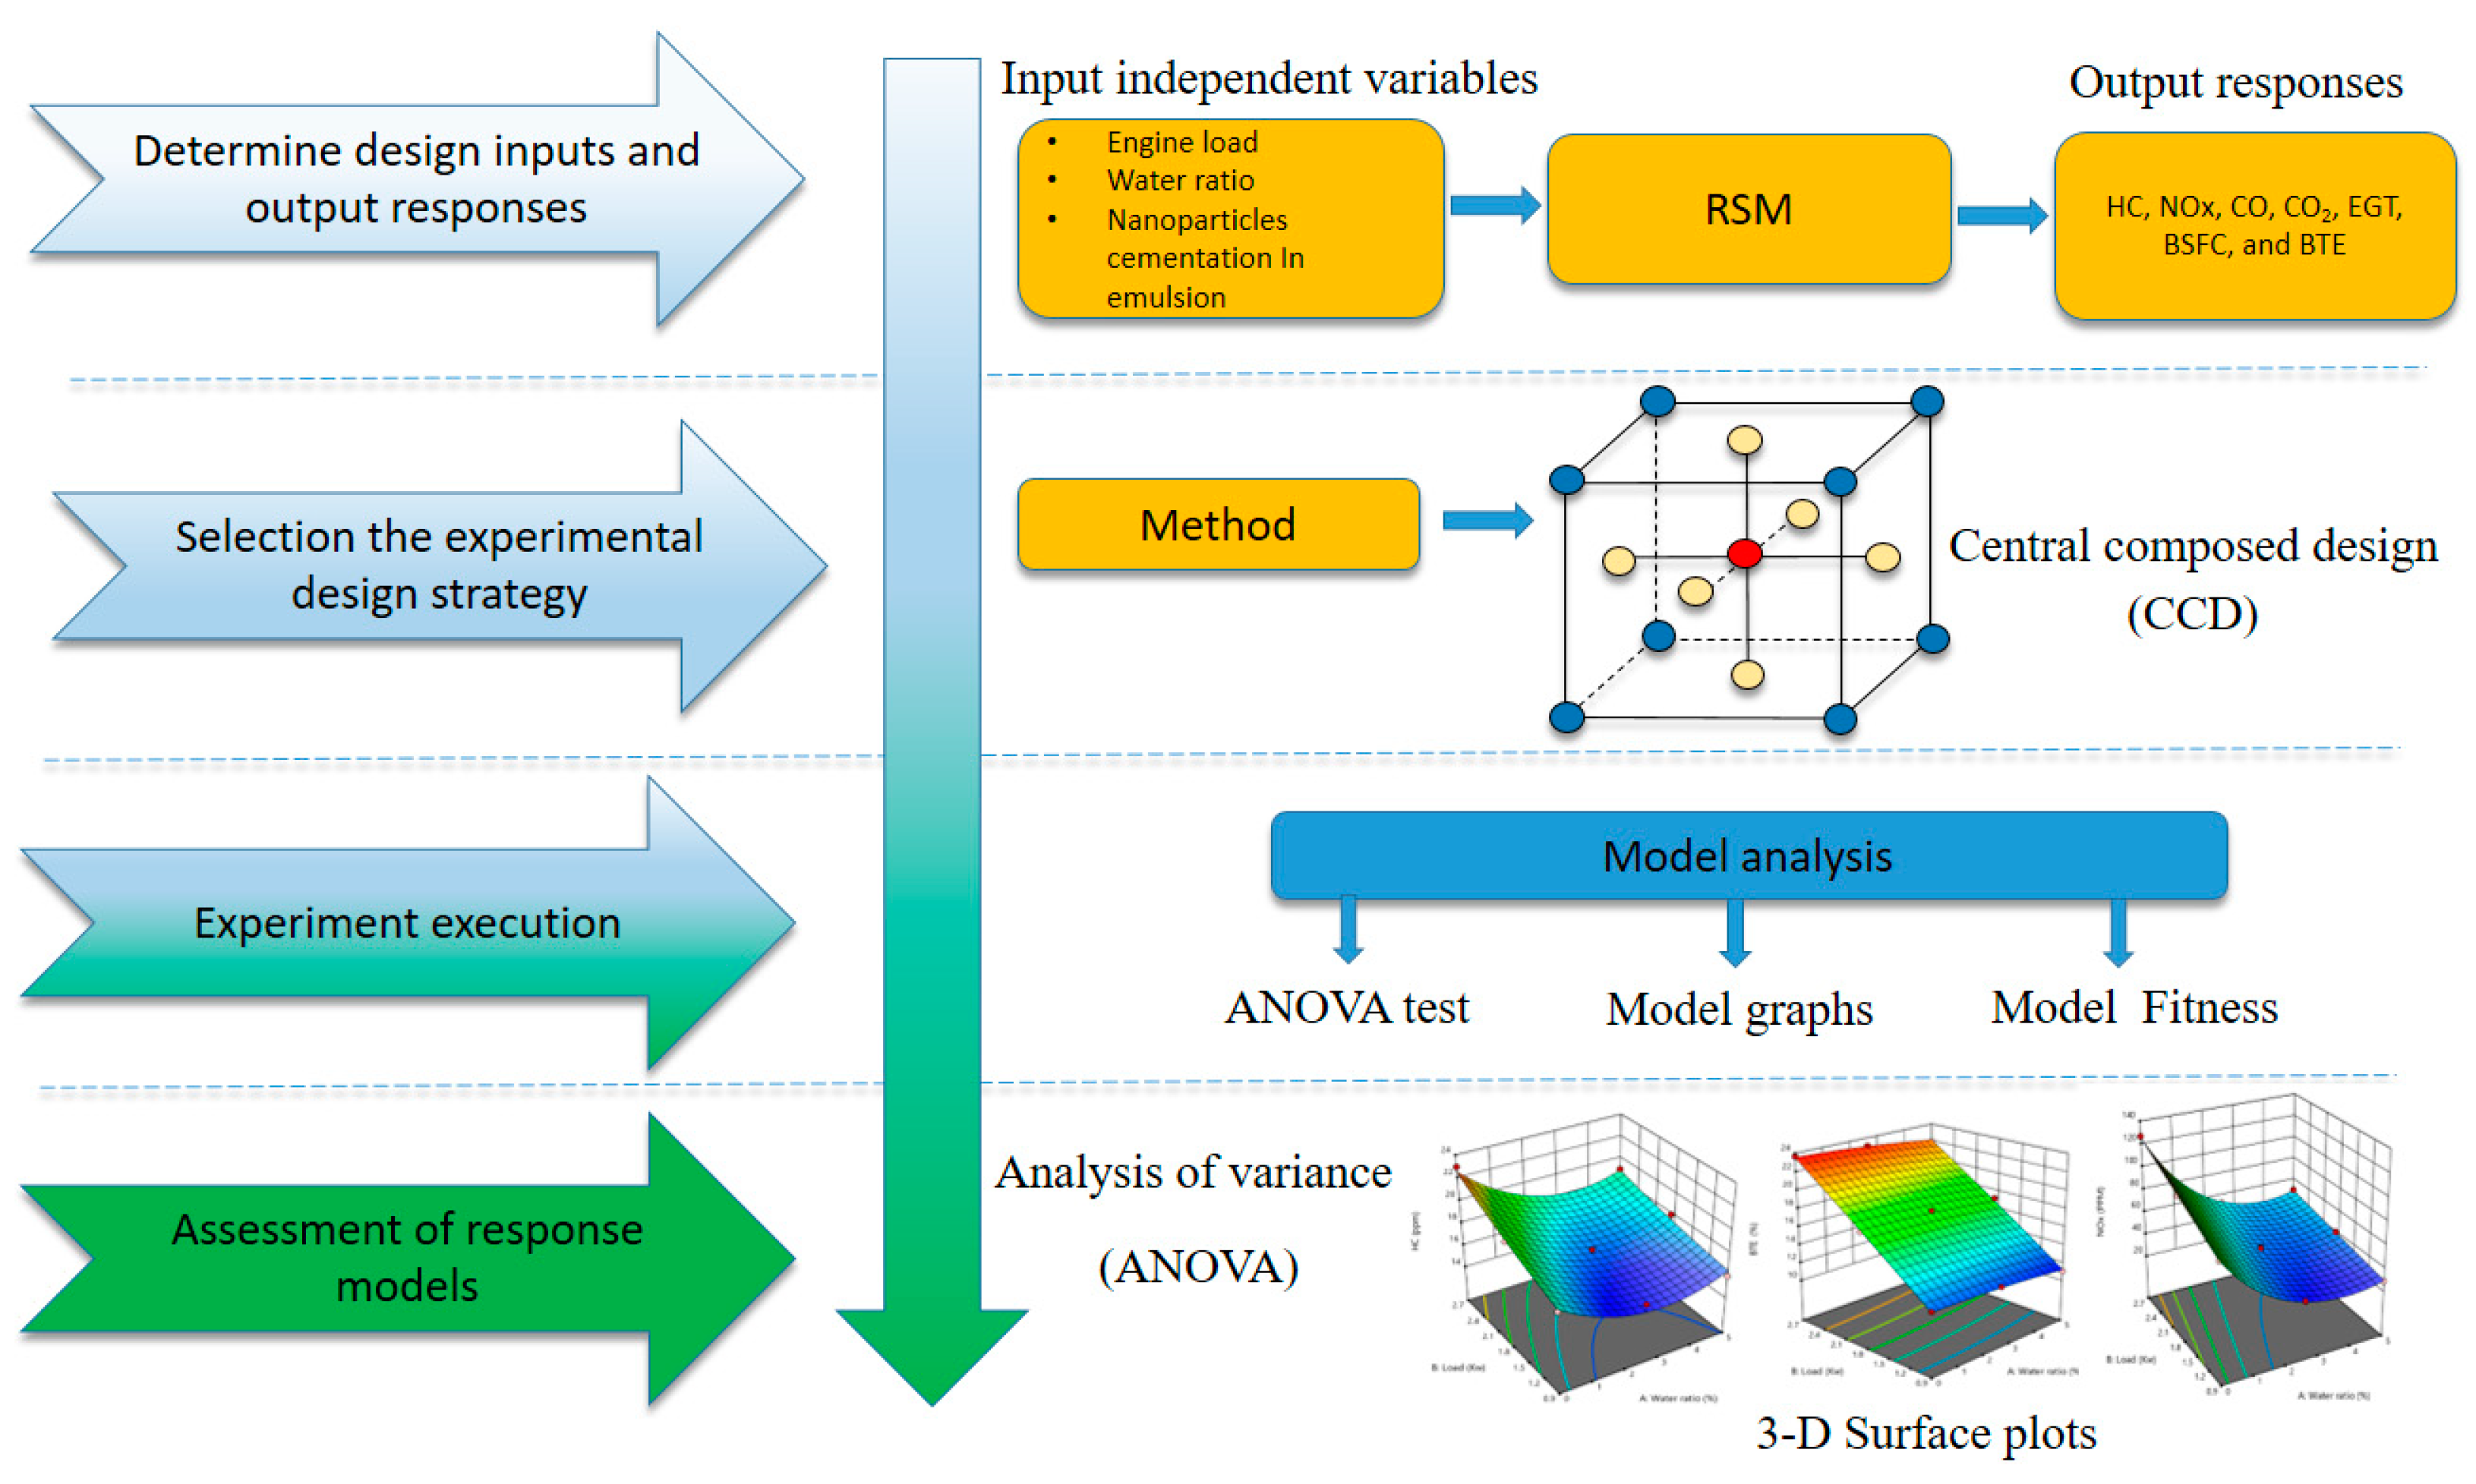
where Y is the predicted output response for emission characteristics and engine performance (i.e., HC, NOx, CO, CO2, EGT, BSFC, and BTE), k is the number of factors (k = 2 in this work), x i and x j are independent factors, and ε is error; β 0 constant, β i , β i i , and β i j are linear, quadric, and interaction coefficients, respectively [51]. The experimental plan for RSM was created using the Design Expert Software version 13. The software was also utilized to analyze data gathered from experiments. A central composite design (CCD) was employed to examine the relationship between the responses and several experimental factors. The most popular type of response surface is a CCD. As it may be applied to build on earlier factorial experiments by adding axial and center points, CCD is beneficial in chronological experimental work [21]. In addition, the response surface method uses fewer experimental groups, which can save research expenses [52]. The flow chart in Figure 5 illustrates our thorough research process.

3. Results and Discussions

3.1. Models Assessment

CCD is composed of thirteen runs with five replicated center points in order to evaluate the pure error. In the first stage of the experiment, water ratio and engine load were employed as two independent variables. There were three levels used for each independent variable, −1, 0, and +1, in order to construct models for the prediction of HC, NOx, CO, CO2, EGT, BSFC, and BTE. In Table 7, the input variables and their values are shown.
In the second stage of the experiment, E2.5 is selected as the best emulsion from the previous stage, due to the trade-off between emissions and performance; it was combined with aluminum oxide nanoparticles at two dosage levels (50 and 100 ppm) and named E2.5 + 50Al2O3 and E2.5 + 100Al2O3. Table 8 shows the independent variables and their ranges in the second stage.
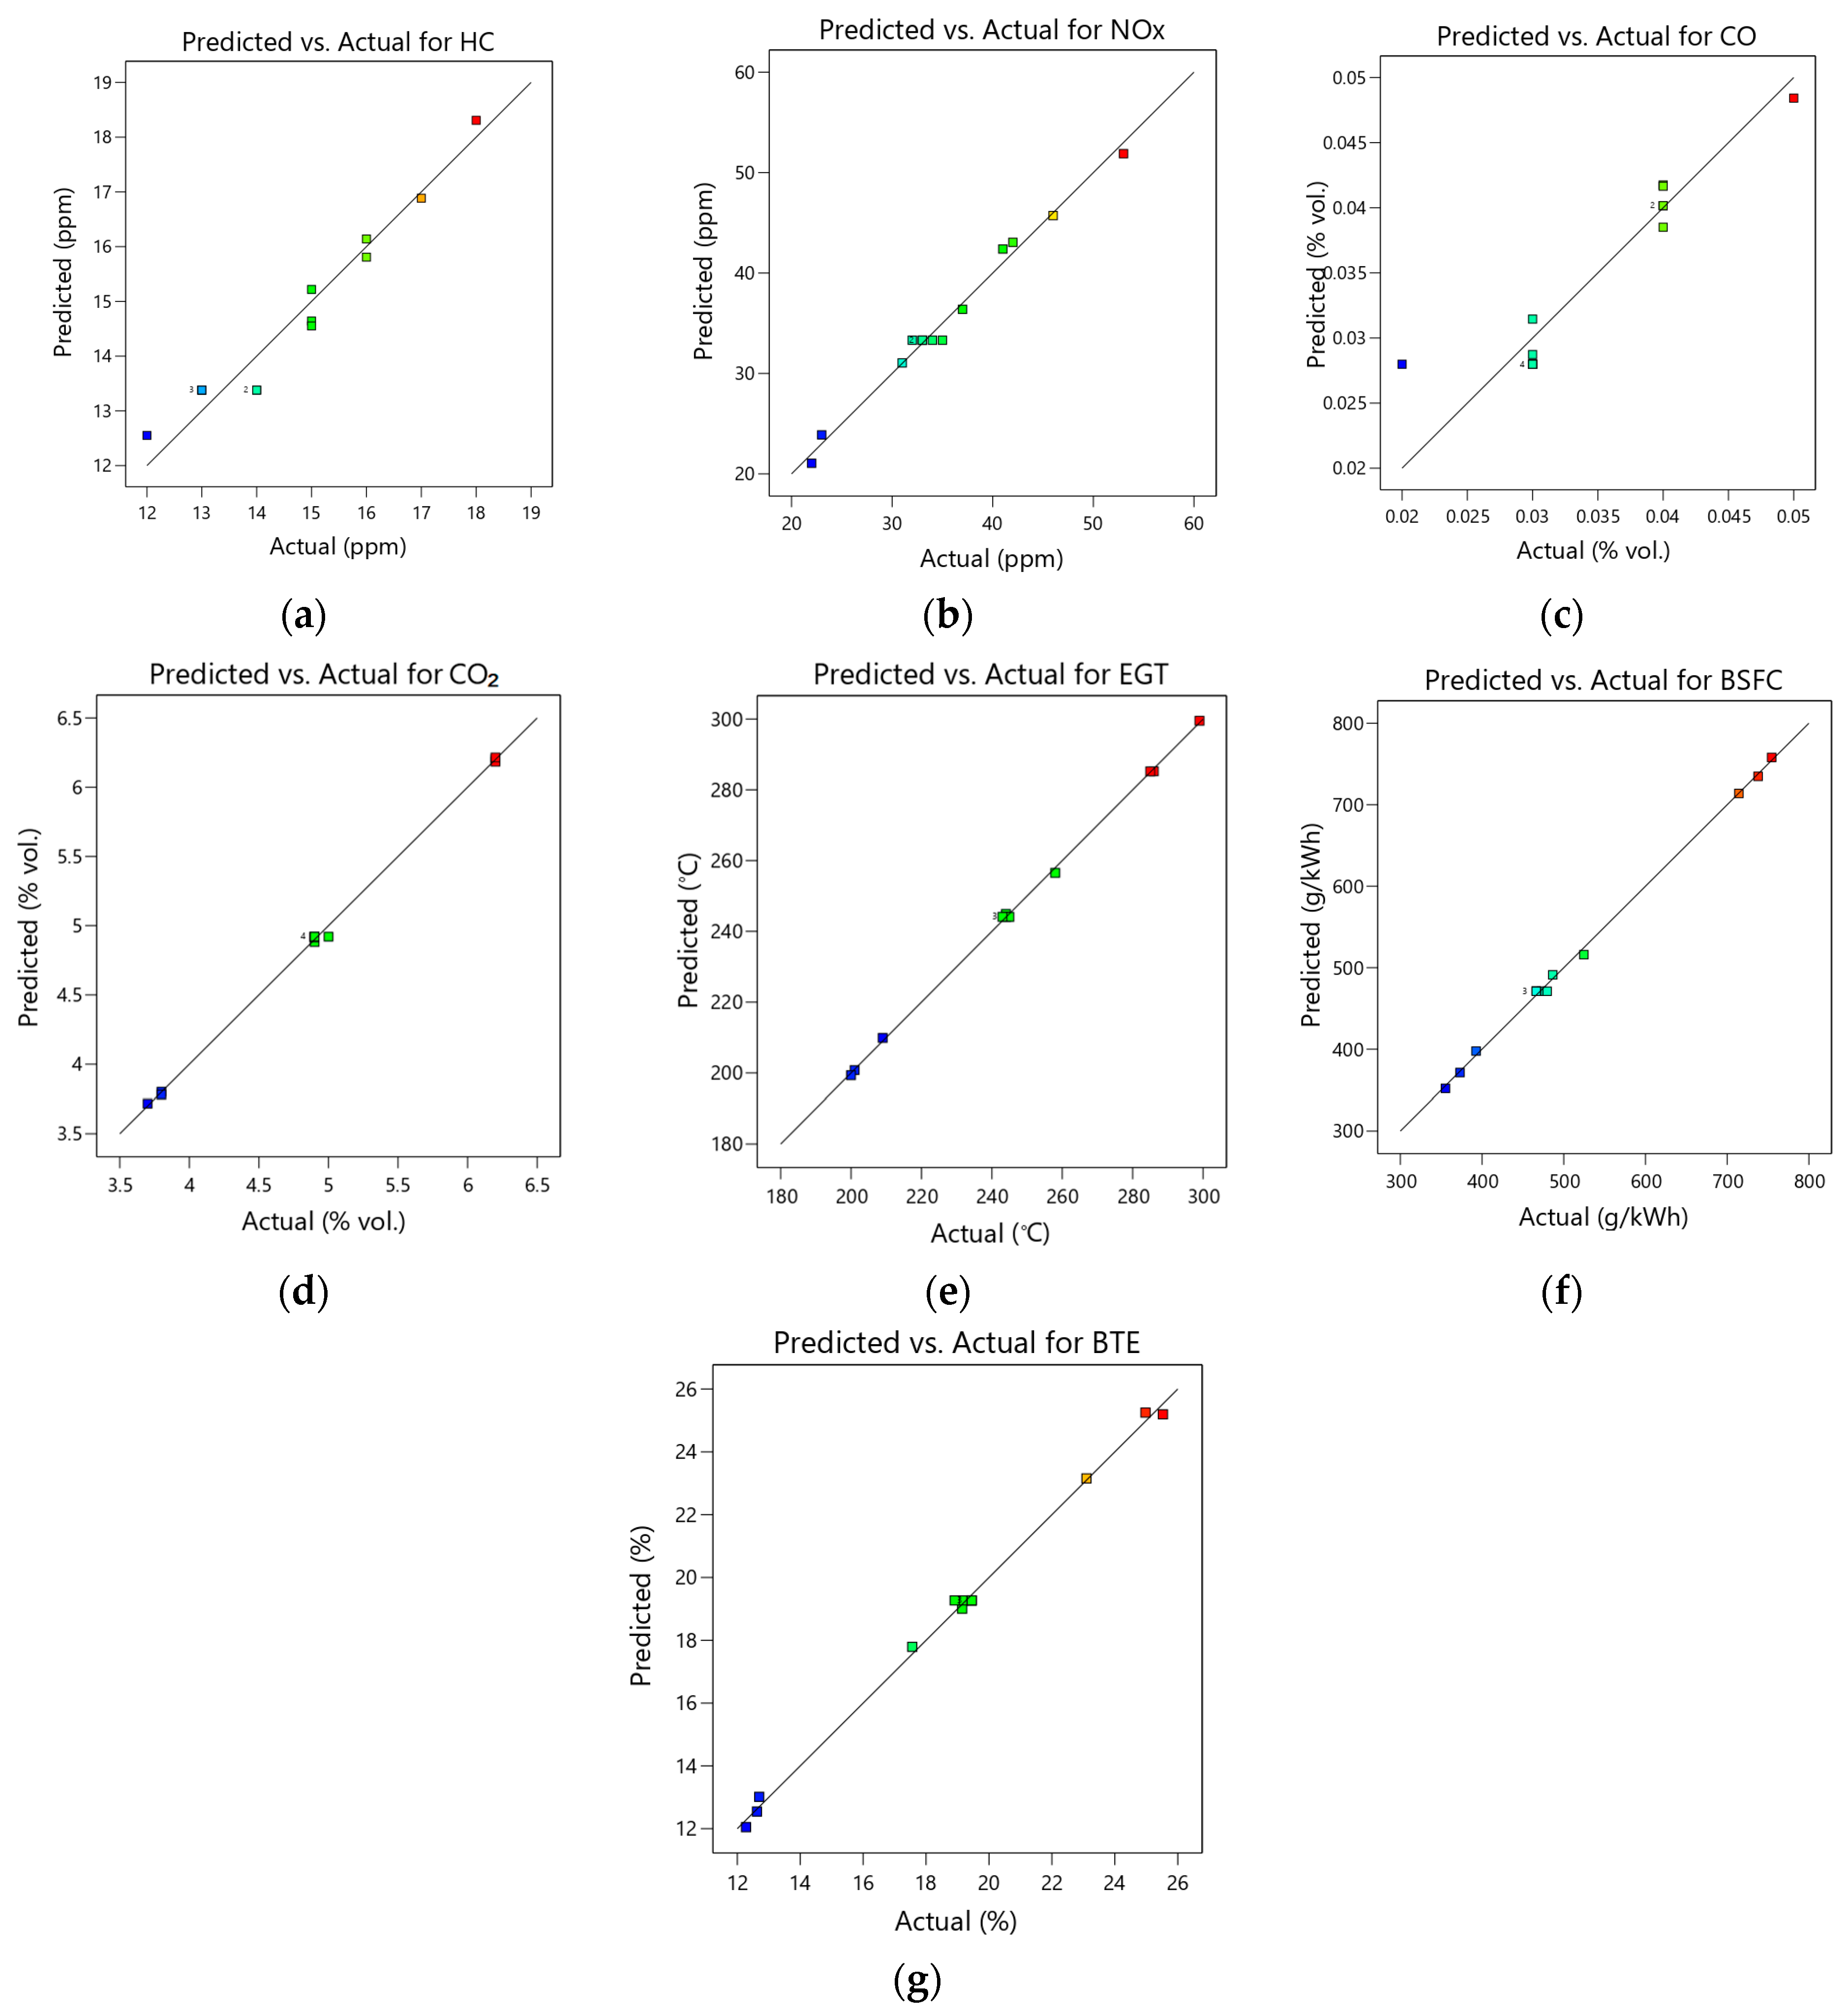
The experimental design data for stages I and II are tabulated in Table 9 and Table 10. In the two stages of experimental work, to determine the variables and their interactions that significantly affect the outcomes, analysis of variance (ANOVA) is employed. The various response parameters, such as HC, NOx, CO, CO2, EGT, BSFC, and BTE, are tabulated in Table 11 and Table 12 using analysis of variance. The tables show that all models can be considered significant because their p-values are less than 0.05 [52]. How well the experimental data matches the models is demonstrated by the coefficient of determination (R2) value [53]. The R2 values for HC, NOx, CO, CO2, EGT, BSFC, and BTE were 0.9360, 0.9992, 0.8134, 0.9987, 0.9997, 0.9969, and 0.9976, respectively, in the first stage, and were 0.9443, 0.9867, 0.8315, 0.9989, 0.9994, 0.9986, and 0.9971 in second stage, which, when compared to the experimental results, function as highly exact model consequences. Except for the CO model (R2 is more than 80%), all responses have R2 values more than 90%. An R2 value near unity (1.0) indicates that our constructed model is highly standard [54]. Predicted R2 and adjusted R2 values are useful metrics for modeling accuracy [55]. Since their values are within 0.20 of one another for all models, the adjusted R2 and predicted R2 for the models have an acceptable degree of agreement [56]. For all models, in terms of pure error, the F value (the lack of fit) shows that it is not significant. The model fit is sufficient if there is no significant lack of fit [57]. All models should be utilized to explore the design space because the obtained signal-to-noise ratios (Adequate Precision) for the models are more than four [58]. Figure 6 and Figure 7 display the relationship between the predicted and actual values. They show how closely the values of the actual and expected data coincide. This implies that the model is significant. Regression analysis, which entails fitting the response into the polynomial model, was used to examine all the responses. Table 13 and Table 14 provide the final empirical model equations for HC, NOx, CO, CO2, EGT, BSFC, and BTE in terms of coded factors in stages I and II.
It should be noted that, as per [59], the measurement error in the used exhaust gas analyzer (Brain Bee-AGS668 ) is ±5% as a relative error for CO, CO2, and HC. Herin, Table 9 and Table 10 show that the difference in the responses’ values of this study, due to interactions between the parameters, reveals a small difference compared to the ±5% device error. While the measuring device has a higher error margin, the consistent replication of results across multiple trials underscores the reliability of our findings. In this study, statistical analysis confirms that the obtained results are highly significant, with a p-value much lower than the conventional value of 0.05. In addition, the evaluation of diesel engines primarily centers on NOx emissions, in the sense that CO and HC are not the primary focus as they are generated in low quantities in diesel engines compared to gasoline engines. In our study, the differences between NOx responses were quite large, which is not surprising owing to the addition of water to the neat diesel. Similar study have reported the same limitation posed by the measurement error using the same gas analyzer model [60].
It was also observed that the effect of additives on the obtained CO and CO2 values was small, this was most likely due to the low resolution of the exhaust gas analyzer we used. This suggests that a more accurate exhaust gas analyzer should be used [61].

3.2. Analysis of Emissions Characteristics

3.2.1. HC Emissions

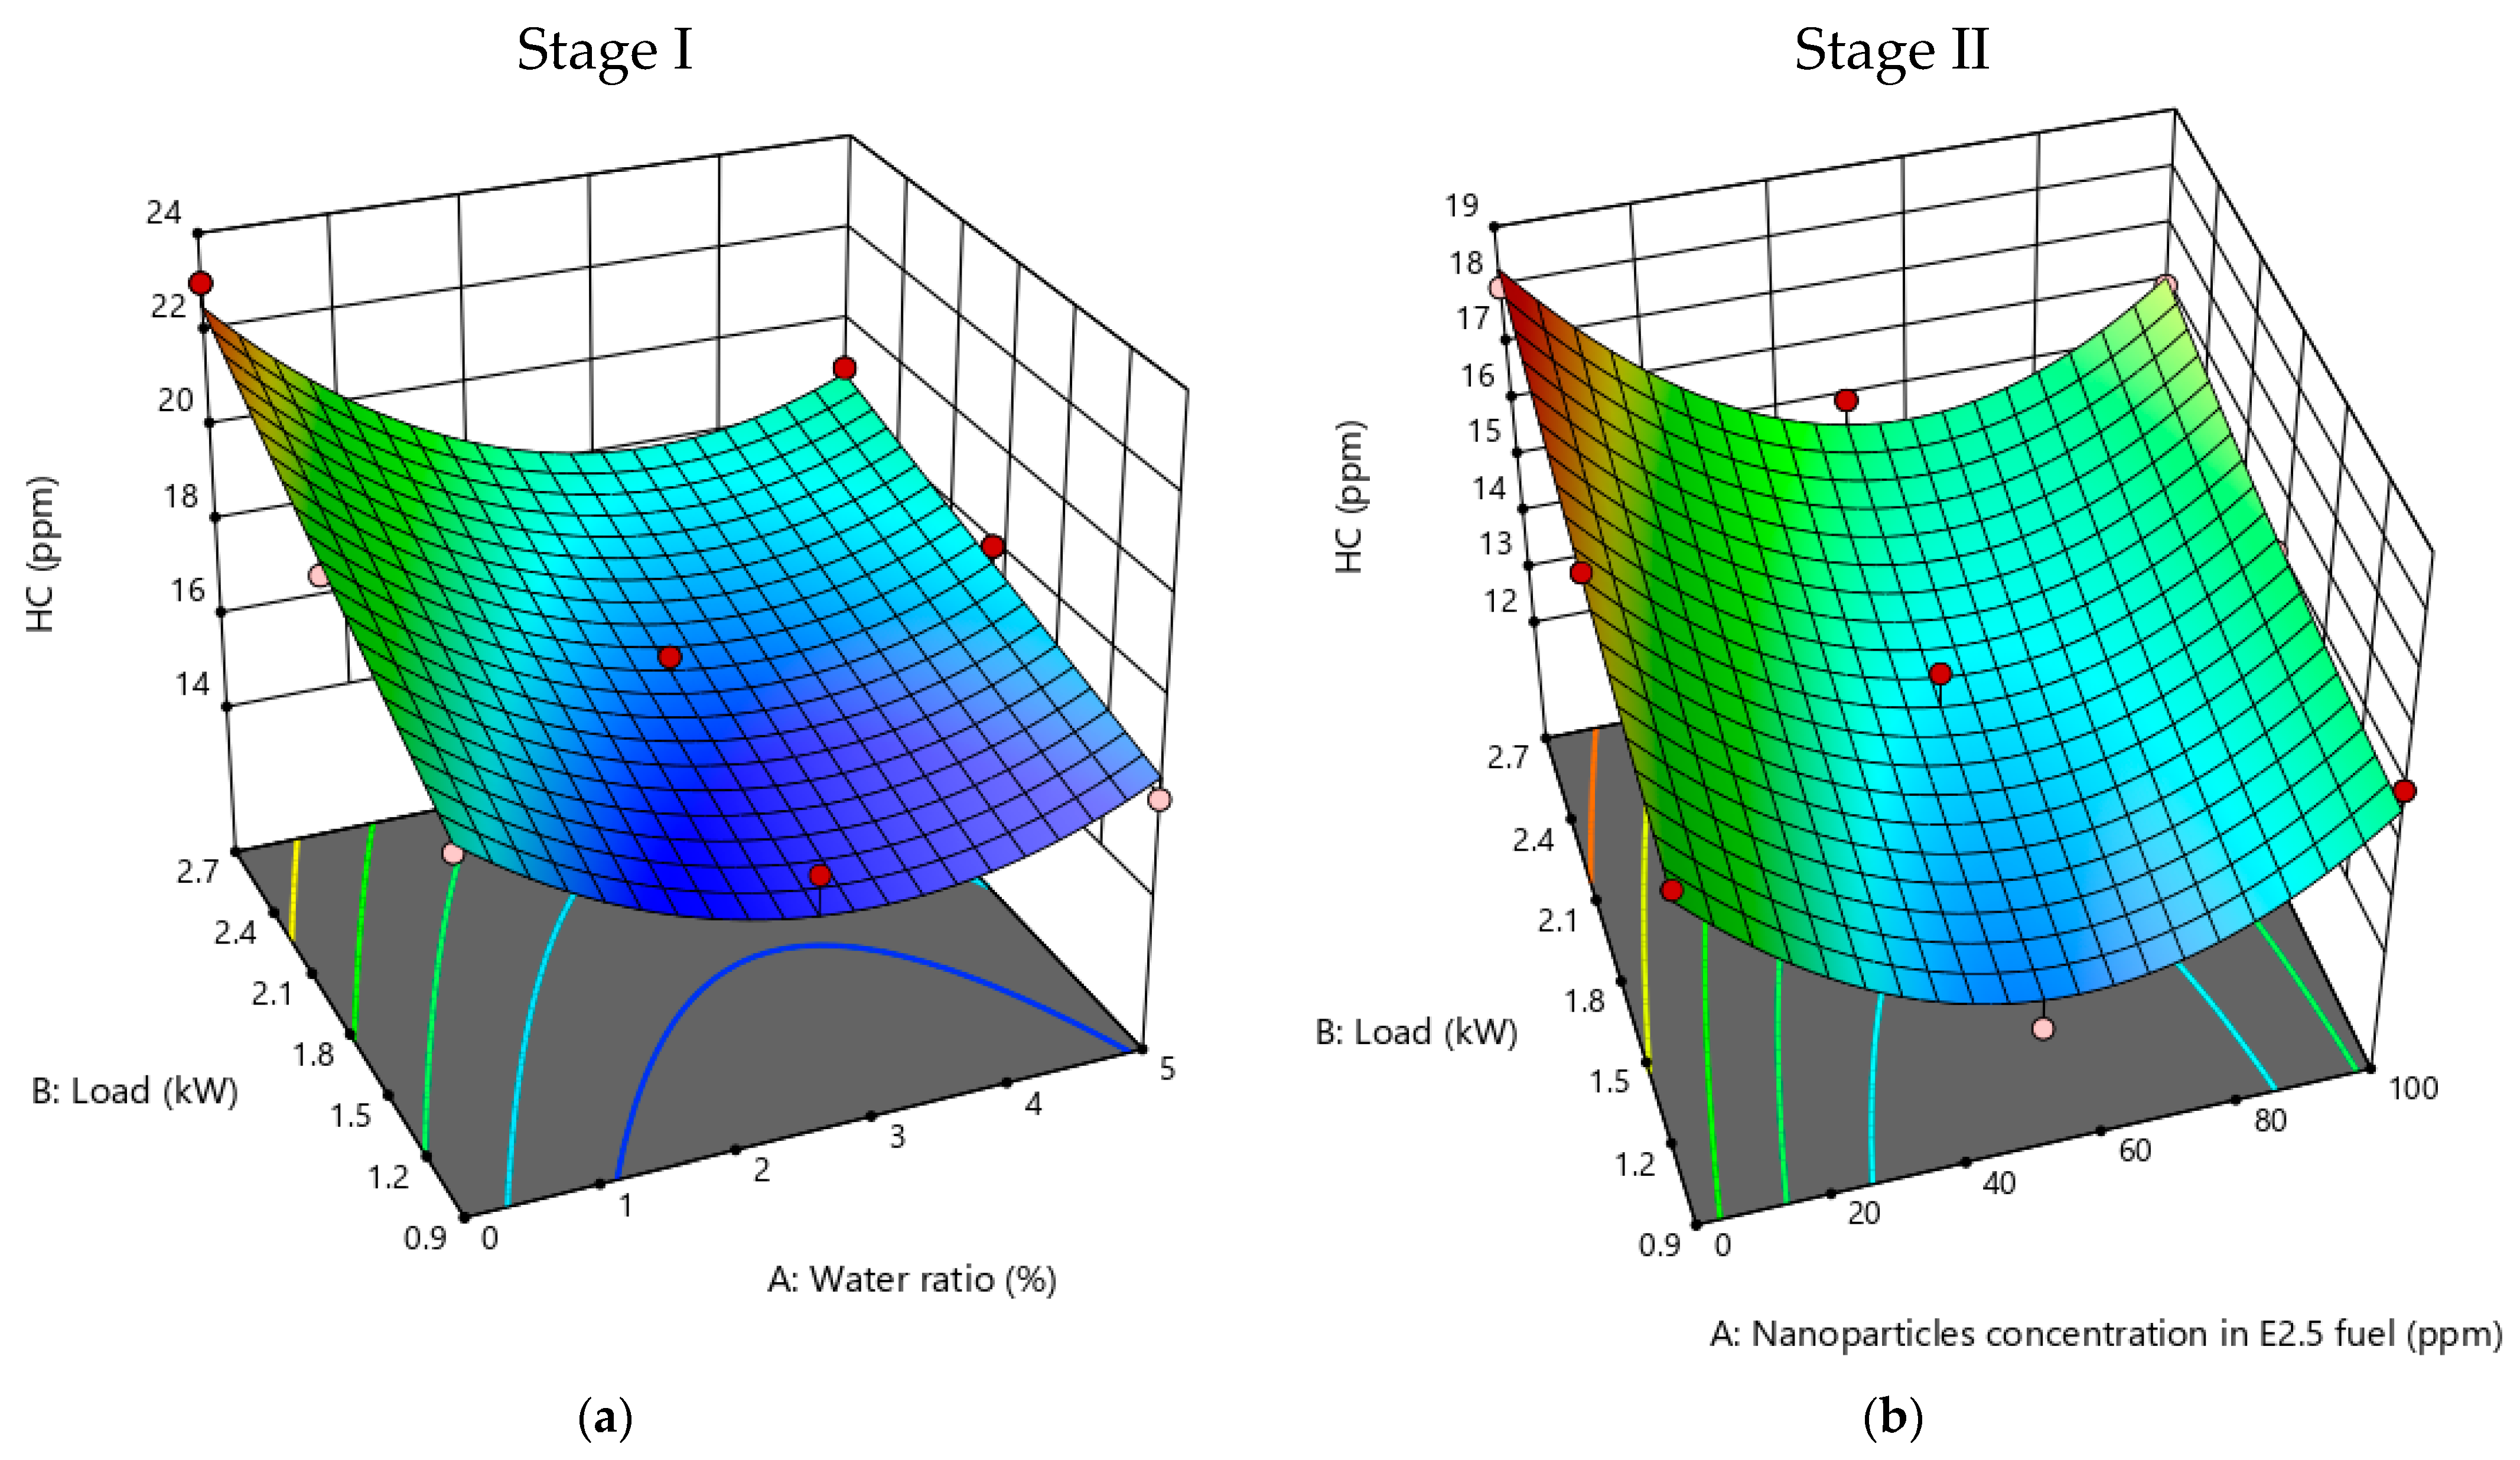
Incomplete combustion of the hydrocarbon fuel results in HC emissions. In general, the amount of hydrocarbons (HC) in exhaust gases is given as the total hydrocarbons concentration in parts per million carbon atoms [62]. Figure 8a,b present (3D) contour plot graphs (both stage I and II results) for the HC emissions response with respect to change in independent variables. Both Figures show that the HC curves gradually increase with the increase in engine load. This pattern might result from greater loads having a richer fuel–air mixture [63,64]. In stage I, Figure 8a shows the interactions between the water ratio in the emulsion and the engine load for HC emissions. Due to a lack of oxygen content and incomplete combustion, pure diesel fuel generated large amounts of HC emissions [65]. With the addition of water, there is a decrease in HC emissions. This is probably because adding water to the emulsion fuel improves air–fuel mixing, which is a benefit of micro-explosion occurrences [39]. The value of HC is 18 and 19 ppm when utilizing E2.5 and E5, respectively, at a maximum test load, as opposed to 23 for pure diesel. At stage II, regarding the influence of nanoparticles concentration in E2.5 fuel, it can be seen from Figure 8b that there is a significant reduction in HC emission compared to other tested fuels. This might be the result of Al2O3 nanoparticles’ shorter ignition delay and improved ignition properties, which enhance the burning action by acting as an essential catalyst and oxygen buffer [8,66,67,68]. Additionally, the nanoparticles’ activation energy boosts the combustion of the in-cylinder carbon particles at the cylinder wall, which lowers HC emissions [69]. HC for E2.5 + 50Al2O3 is 15 ppm at the maximum test load, whereas it is 16 ppm for E2.5 + 100Al2O3.

3.2.2. NOx Emissions

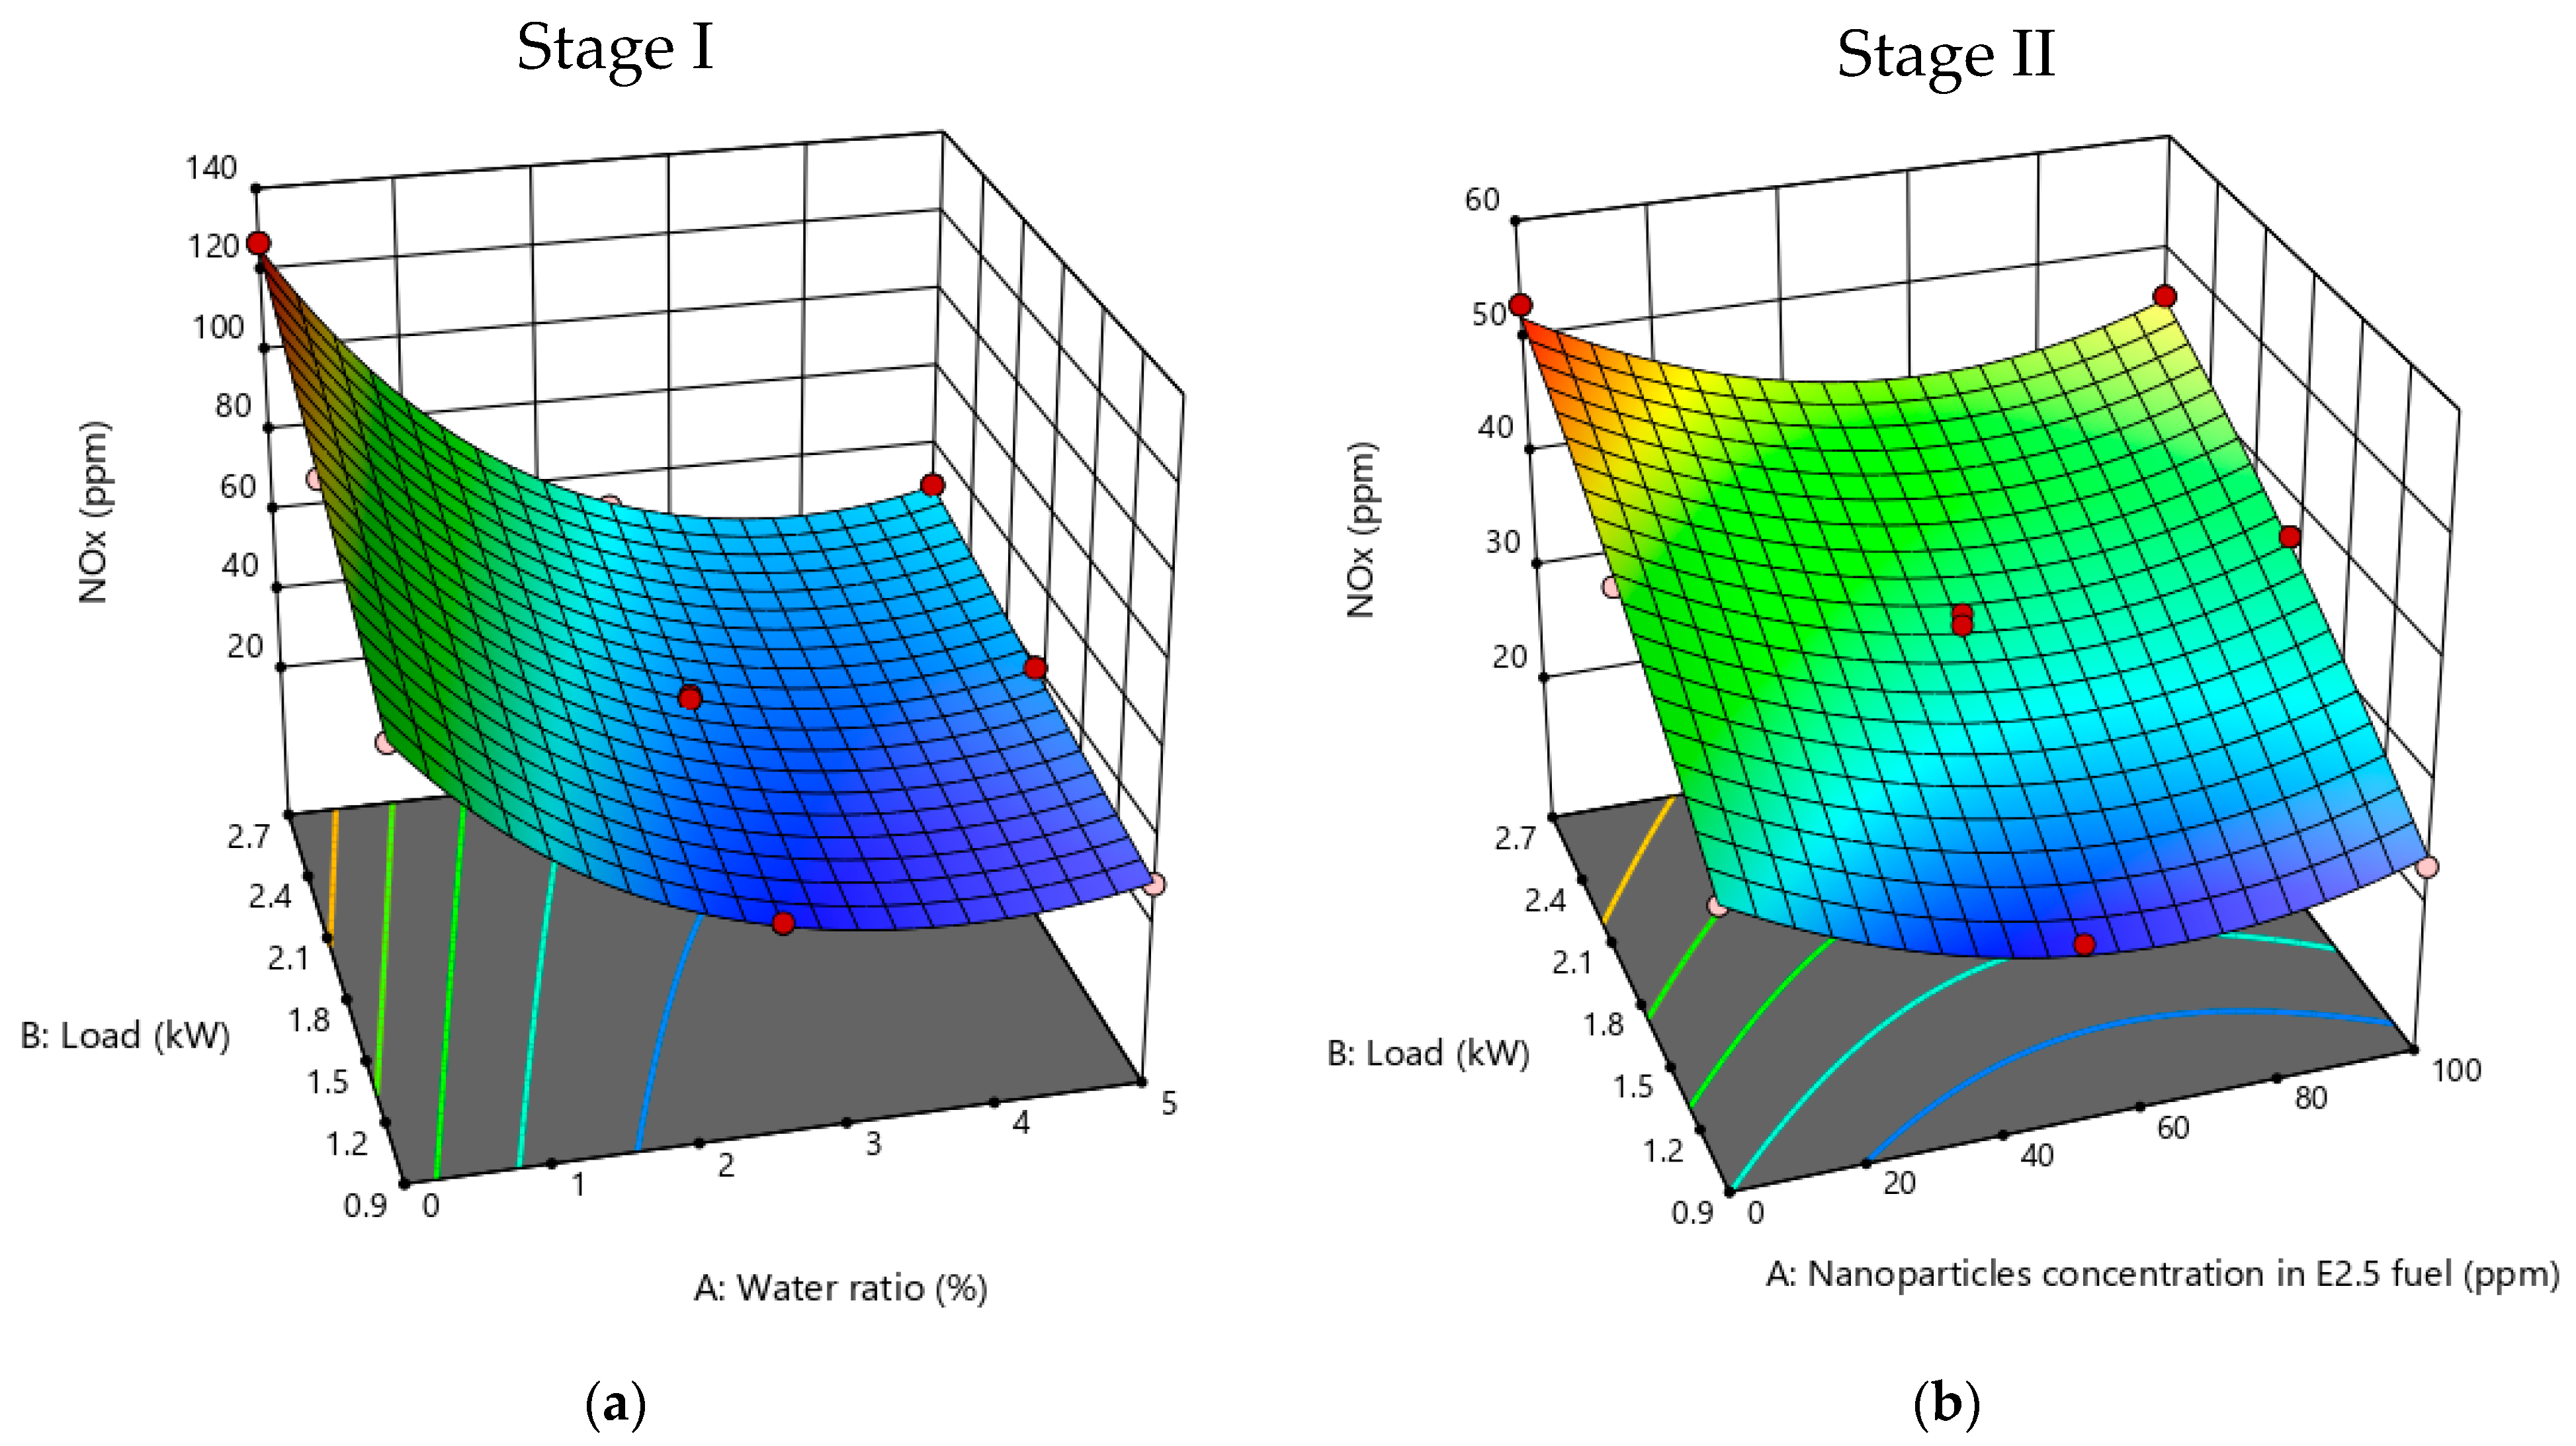
NOx is the result of the reaction between NO and NO2. NO2 has a substantially higher toxicity than NO. Unlike NO2, which is dark in color and smells strongly, NO is an uncolored, odorless gas [70]. By oxidating nitrogen in accordance with the Zeldovich’s mechanism, NOx is formed. The primary factors influencing NOx generation are oxygen availability, combustion temperature, and combustion time [14]. As can be observed in Figure 9a,b, increasing engine load at two stages led to a rise in NOx emissions levels because the combustion temperature inside the combustion chamber increased [71]. Figure 9a displays a three-dimensional surface plot of NOx emissions vs. engine load, emulsified fuels, and neat diesel. It is evident that decreasing the NOx emissions by increasing the water content of the emulsion fuel has a considerable impact. This can be associated with the combustion process absorbing latent heat of water evaporation, which causes the peak flame temperature in the combustion enclosure to decrease [28,72,73]. Additionally, it is also true that, as the percentage of water in fuel increases, less diesel is used per unit volume of fuel, which lowers emissions and limits NOx generation. Furthermore, higher water content increases the likelihood that extra oxygen will be utilized during the water ionization process via the creation of hydroxyl (OH) radicals, which reduces the formation of NOx [29]. The maximum NOx emission values for neat diesel, E2.5, and E5 are 127 ppm, 53 ppm, and 50 ppm, respectively, at the maximum test load. As illustrated in Figure 9b, adding Al2O3 nanoparticles to water–diesel emulsion fuel (E2.5) further reduces NOx emissions. The possible reason for NOx reduction may be the ability of the nanoparticles to reduce the ignition delay and heat transport by offering a high surface area-to-volume ratio, which causes rapid heat transfer from the flame to the water and lowers the temperature inside the cylinder [8,74]; at maximum test load, the results showed NOx emissions of 41 ppm for E2.5 + 50Al2O3 and 46 ppm for E2.5 + 100Al2O3.

3.2.3. CO Emissions

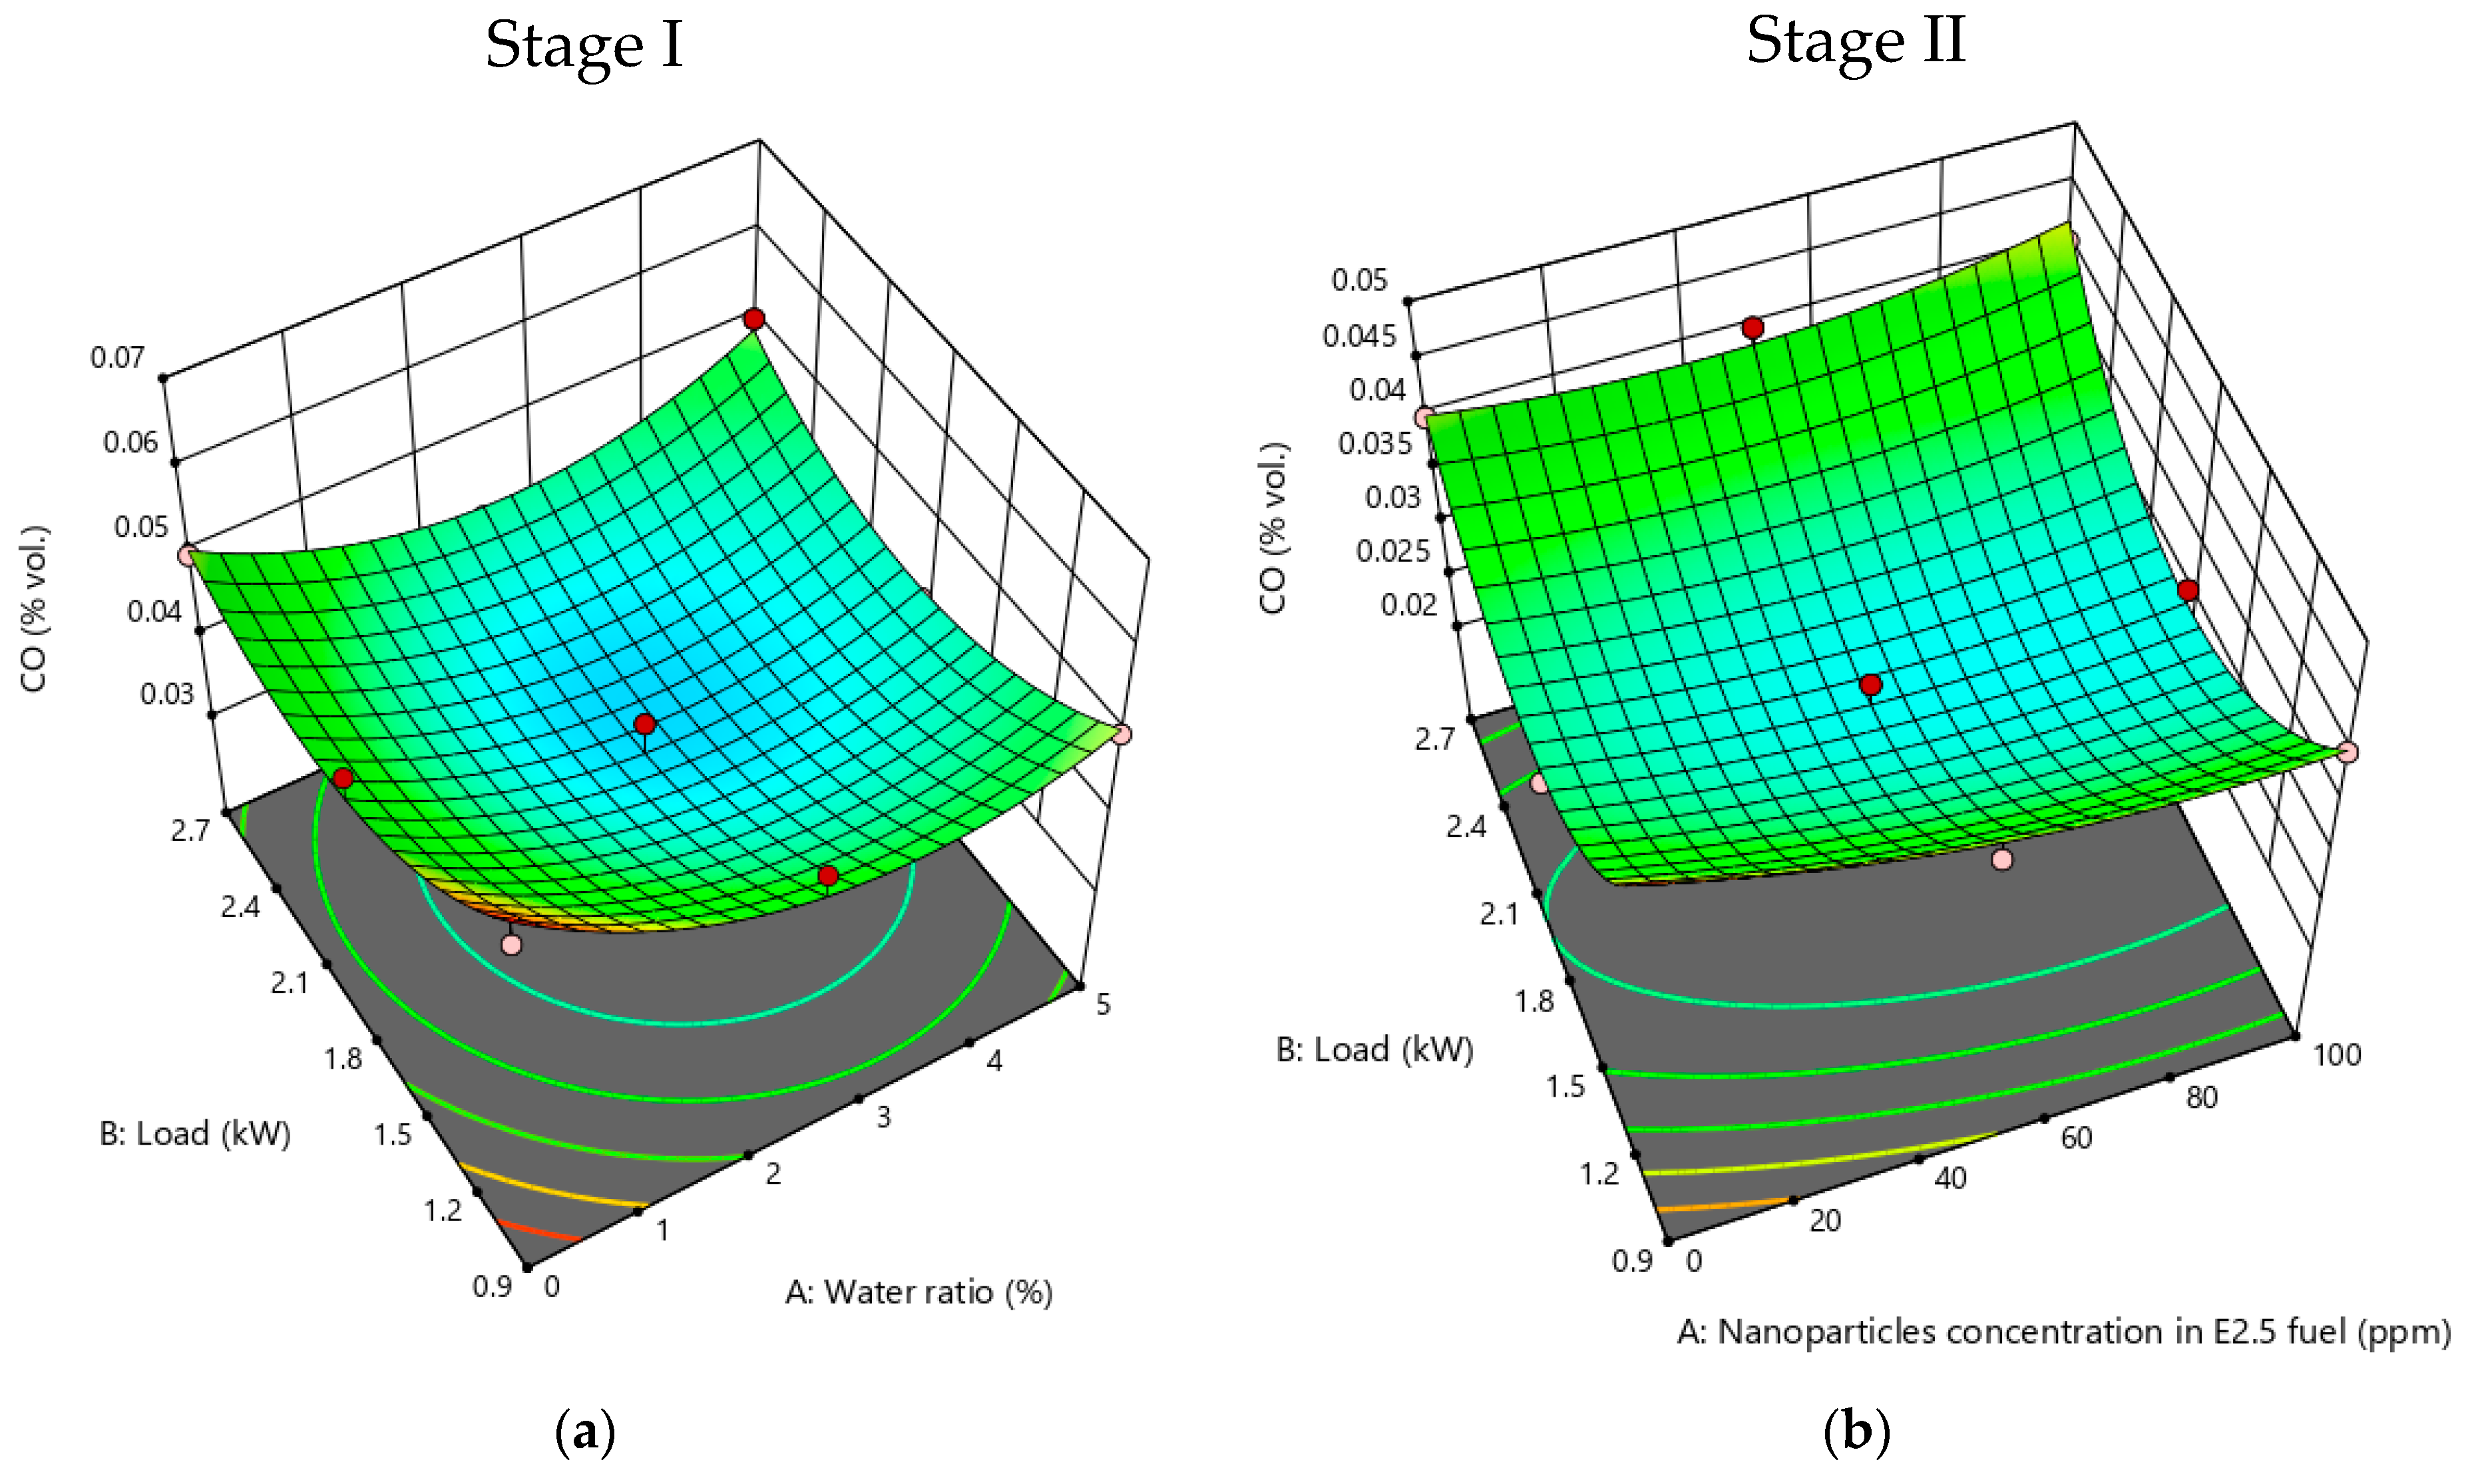
When hydrocarbon fuels burn incompletely inside the combustion chamber, a toxic compound known as carbon monoxide is created [75]. As the air–fuel ratio declines below the stoichiometric value, the CO emissions rise. At the stoichiometric air–fuel ratio, when a homogenous mixture is burned, the amount of CO in the exhaust output is negligible [63]. As shown in Figure 10a,b, the CO emissions for all tested fuels decreased from 0.9 kW to 1.8 kW of engine load and again increased to a final load of 2.7 kW. According to Venkanna and Reddy’s [63] explanation for a similar trend, when compared to the 0.9 kW load, CO emissions decreased at the 1.8 kW load because the temperature increased while the absolute air–fuel ratio decreased, remaining higher than the stoichiometric value. Despite the cylinder temperature and absolute air–fuel ratio being somewhat higher than the stoichiometric ratio, CO emissions increased at a load of 2.7 kW. This is because incomplete combustion occurs in certain pockets in the chamber where the absolute air–fuel ratio is less than the stoichiometric value. The relationships between engine load and water ratio for CO emissions are shown in Figure 10a. It was found that adding water to neat diesel reduced CO emissions slightly, especially for the E2.5 fuel sample. The reason for this could be the micro explosion, resulting in more complete combustion [76]. In addition, the presence of oxygen molecules in the fuel composition of an emulsion might trigger the transformation of CO into CO2, resulting in a decrease in CO [64]. Additionally, it was found that the addition of nanoparticles to E2.5 fuel was similar. Furthermore, the E2.5 + 50Al2O3 fuel produced less CO emissions at all load conditions. When combustion occurs, secondary atomization is produced by the catalytic effect caused by nanoparticles. Carbon monoxide emissions are further decreased by this subsequent atomization [77].

3.2.4. CO2 Emissions

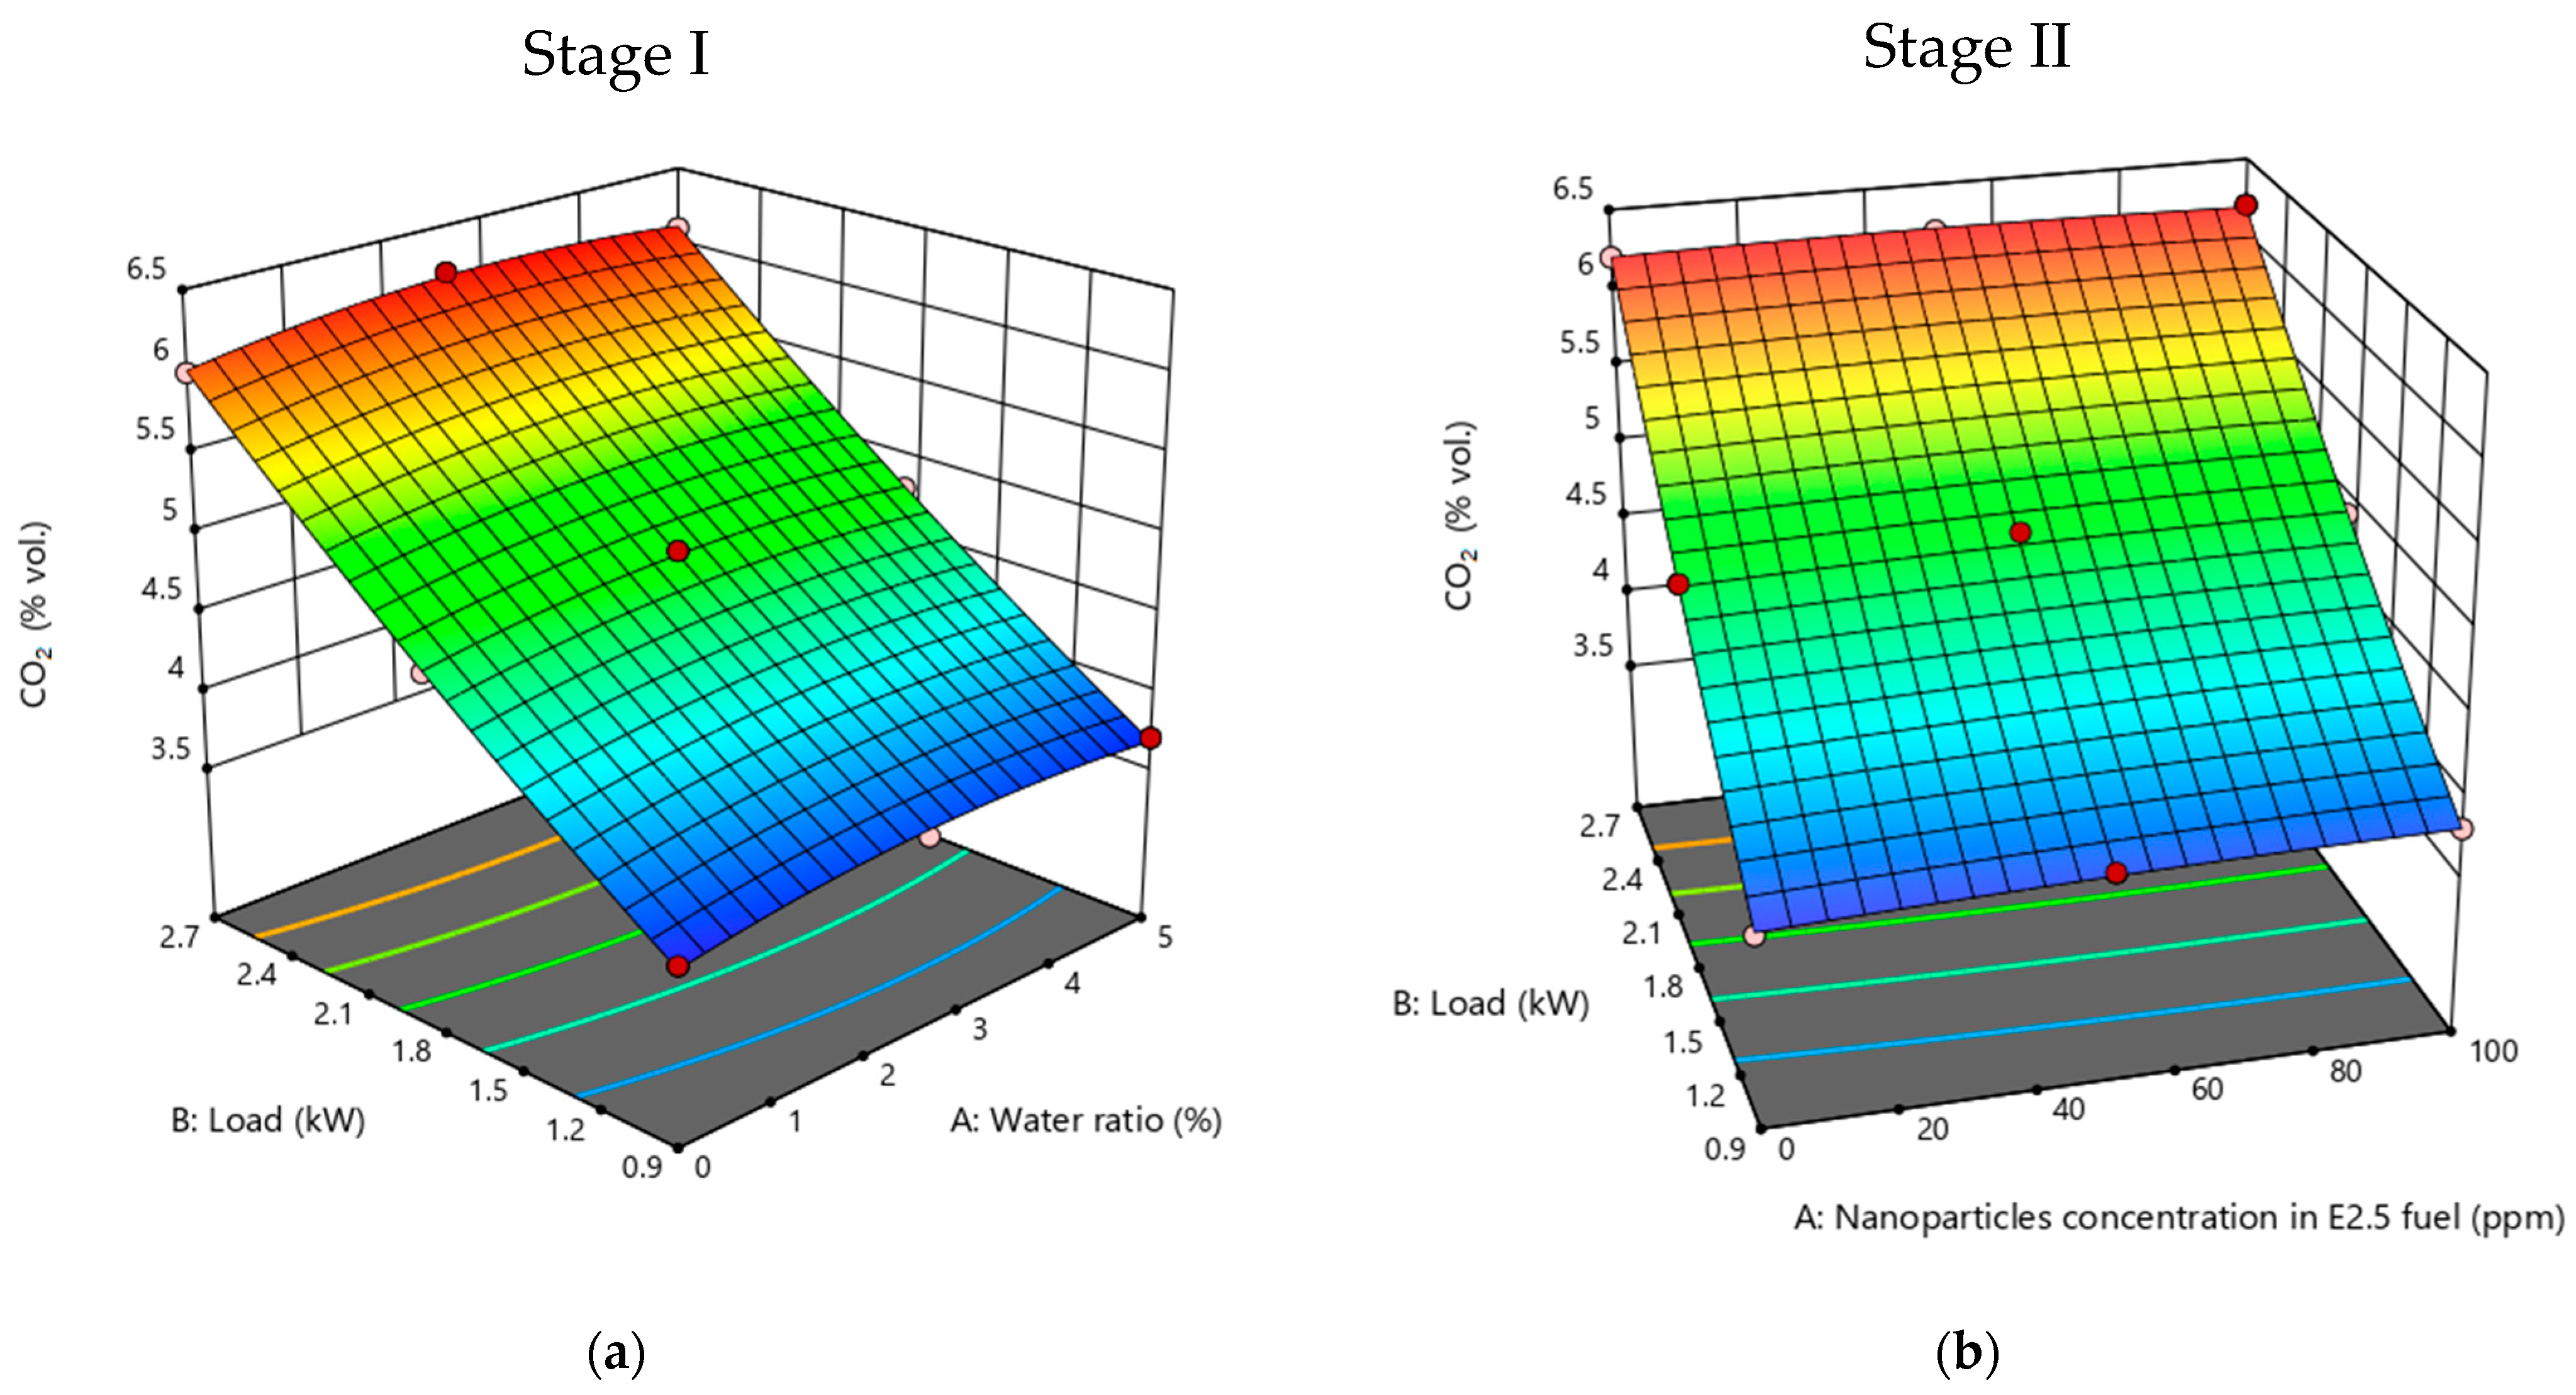
One sign that the combustion inside the combustion chamber is complete is the higher production of CO2. In general, incomplete combustion lowers CO2 and raises HC and CO [28,78]. Since CO2 is a greenhouse gas, there is a strong need to reduce emissions, even though it is normally exempt from emission regulations and is not considered harmful [79]. The impact of engine load on CO2 for all tested fuel samples is presented in Figure 11a,b. For all fuel samples, the CO2 increased linearly with the load due to high combustion temperatures and rates of oxidization [80]. In addition, no significant difference was found in the case of using a water–diesel emulsion or the addition of nanoparticles to E2.5 fuel as compared to pure diesel fuel. Furthermore, the marginal increase in CO2 is a result of emulsified fuels’ higher oxygen atom content, which leads to an improved combustion process [78,81].

3.3. Analysis of Engine Performance Parameters

3.3.1. EGT

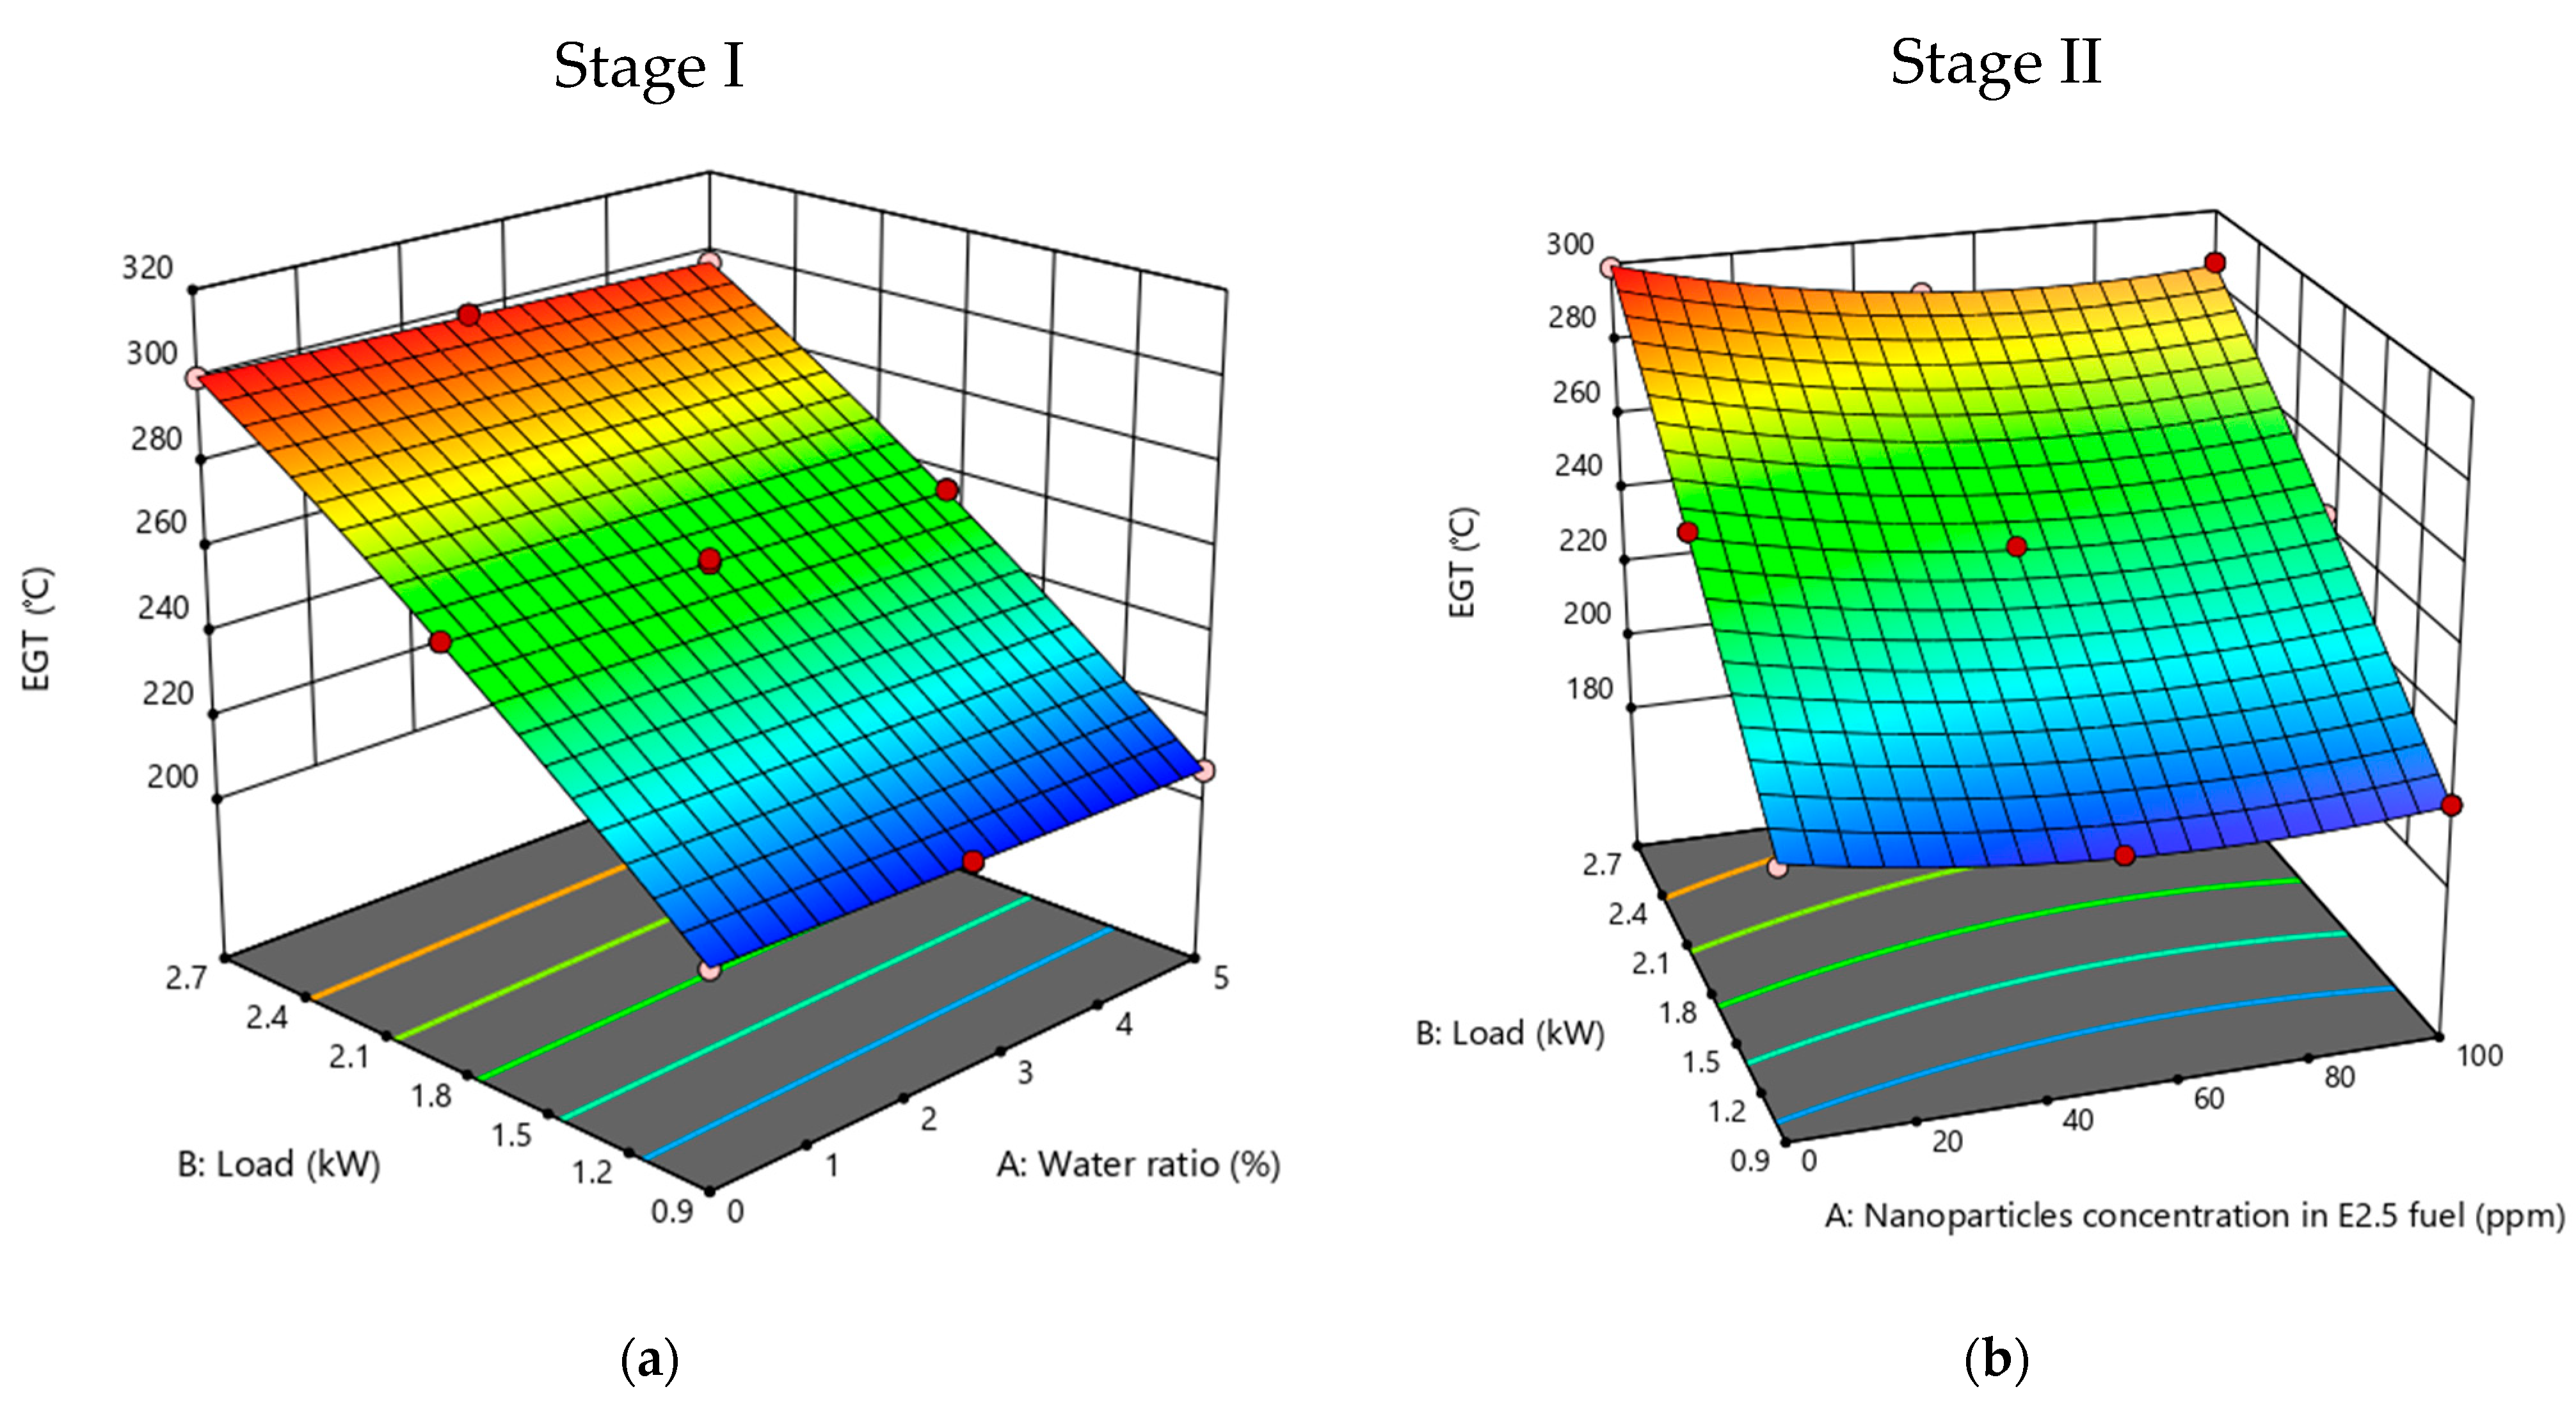
Exhaust gas temperature (EGT) is an important parameter for engine performance and indicates the combustion quality inside the combustion chamber [82,83]. In internal combustion engines, an extremely high EGT is undesirable. Considering that it might harm the engine permanently, the EGT is therefore monitored in investigation studies on alternative fuels [51]. As shown in Figure 12a,b, an increase in the EGT with increasing load was noticed for all tested fuels since the engine needed more fuel to produce the additional power required to handle the increased loading [84]. The EGT decreased as the water percentage increased in the emulsified fuel, as presented in Figure 12a. The water’s ability to absorb heat can lighten the drop in exhaust gas temperature. Water evaporation and the average cylinder temperature after injection and before ignition fall as the water content in the emulsion fuel increases, meaning that the latent heat in the water will cool the charge [32,76]. For stage II, Figure 12b shows the inclusion of Al2O3 in a water–diesel emulsion. It is clear from the Figure that the EGT decreased further due to the catalytic impact and accelerated combustion [66,85]. The lowest EGT measured at the maximum test load for E2.5 + 50Al2O3 was 285 °C, while the neat diesel, E2.5, E5, and E2.5 + 100Al2O3 exhibited EGT values of 300, 299, 297, and 286 °C, respectively.

3.3.2. BSFC

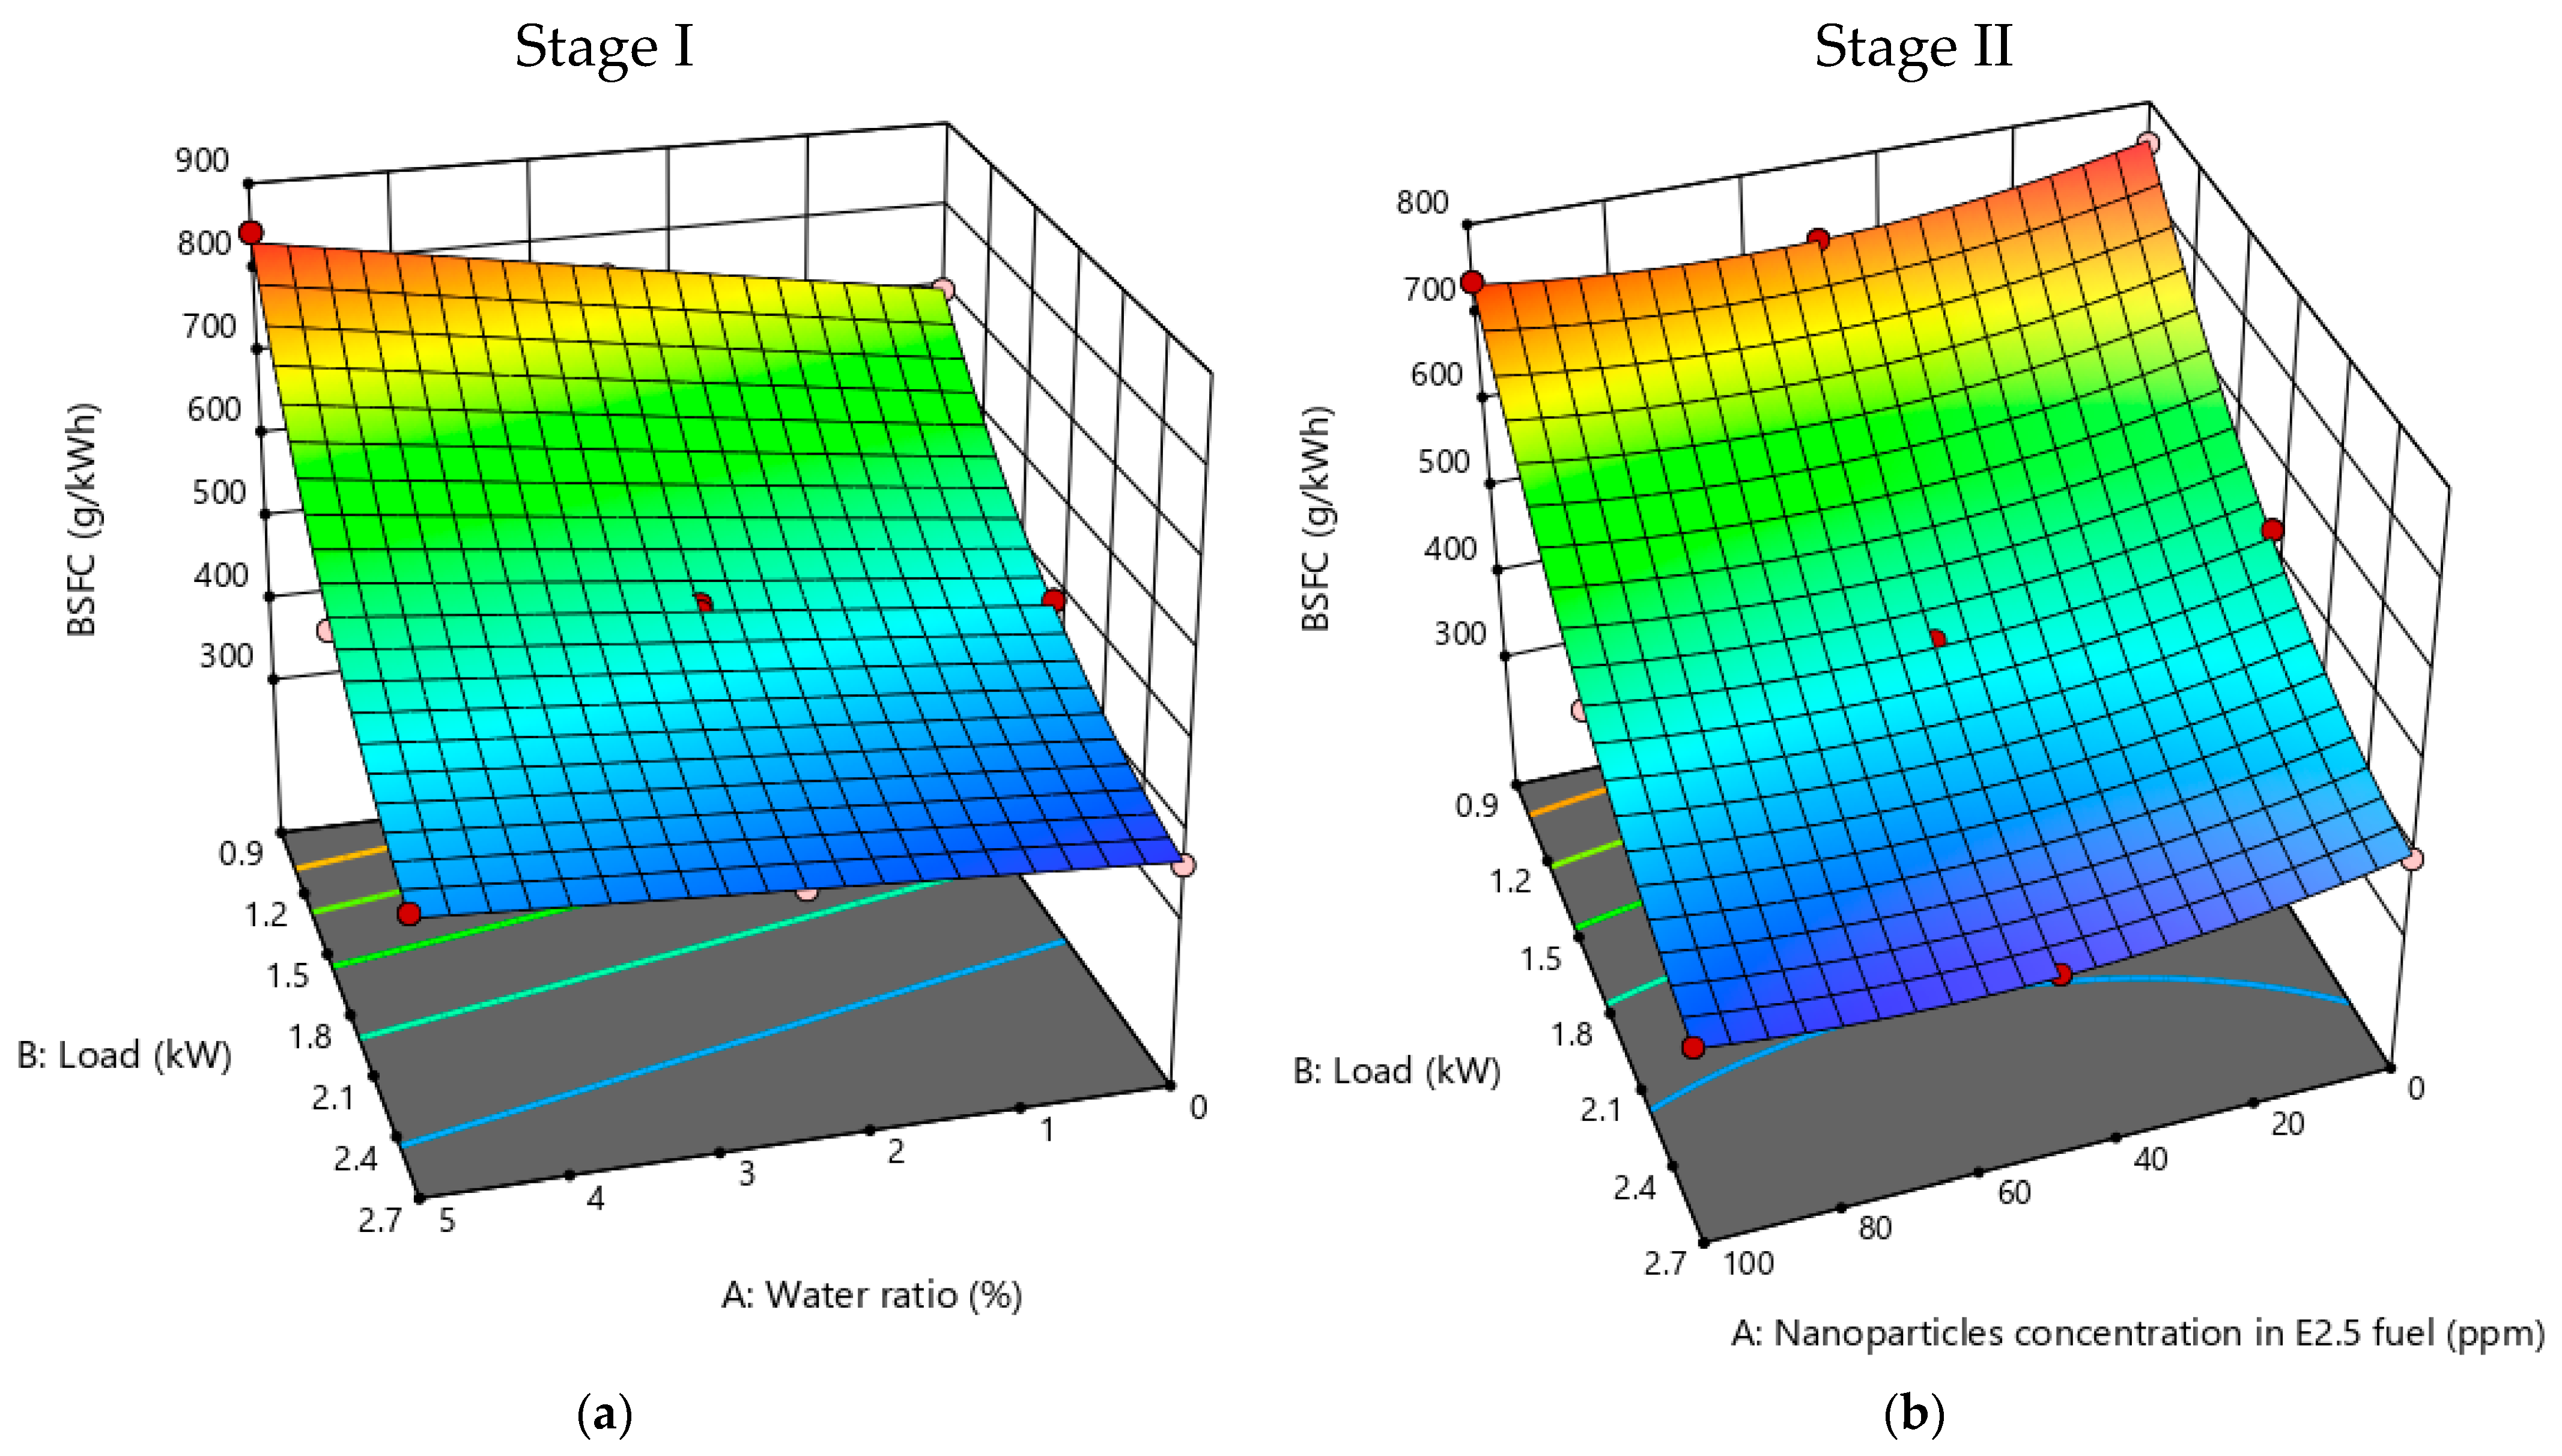
The definition of the BSFC is the total fuel flow rate per unit of generated power (g/kWh) [86]. The primary factors contributing to the BSFC are the air/fuel ratio, volatile nature, density, calorific value, and cetane number of the fuel [87]. Figure 13a,b presents the variation in BSFC against engine load, water ratio, and nanoparticles’ concentration in E2.5 fuel. For all tested fuel samples, it was found that the BSFC decreased as the load increased. This behavior is explained by a greater total energy discharge at higher loads with a constant frictional power loss; so, net power output increases and BSFC decreases. Another explanation would be that higher cylinder pressure and temperature (at high loads) improve combustion efficiency [35]. With an increasing water ratio in fuel emulsion, there is also an increase in BSFC, as presented in Figure 13a. As emulsified fuels have a lower heating value, a higher mass of fuel flow is necessary to produce an identical fuel energy input [38,66]. The existence of oxide nanoparticles in E2.5 fuel improved the BSFC, as shown in Figure 13b. This could be due to shortened ignition delay characteristics, enhanced surface-area-to-volume ratio, and increased heat transfer rate [8,39,66,74]. In addition, when a nanoparticle acts as a source of oxygen, it causes complete combustion, which releases more energy and uses less fuel [8]. For E2.5 + 50Al2O3, the minimum BSFC observed at the maximum test load was 355.3 g/kWh, whereas it was 362.4, 392.7, 424.5, and 373.1 g/kWh for the neat diesel, E2.5, E5, and E2.5 + 100Al2O3, respectively.

3.3.3. BTE

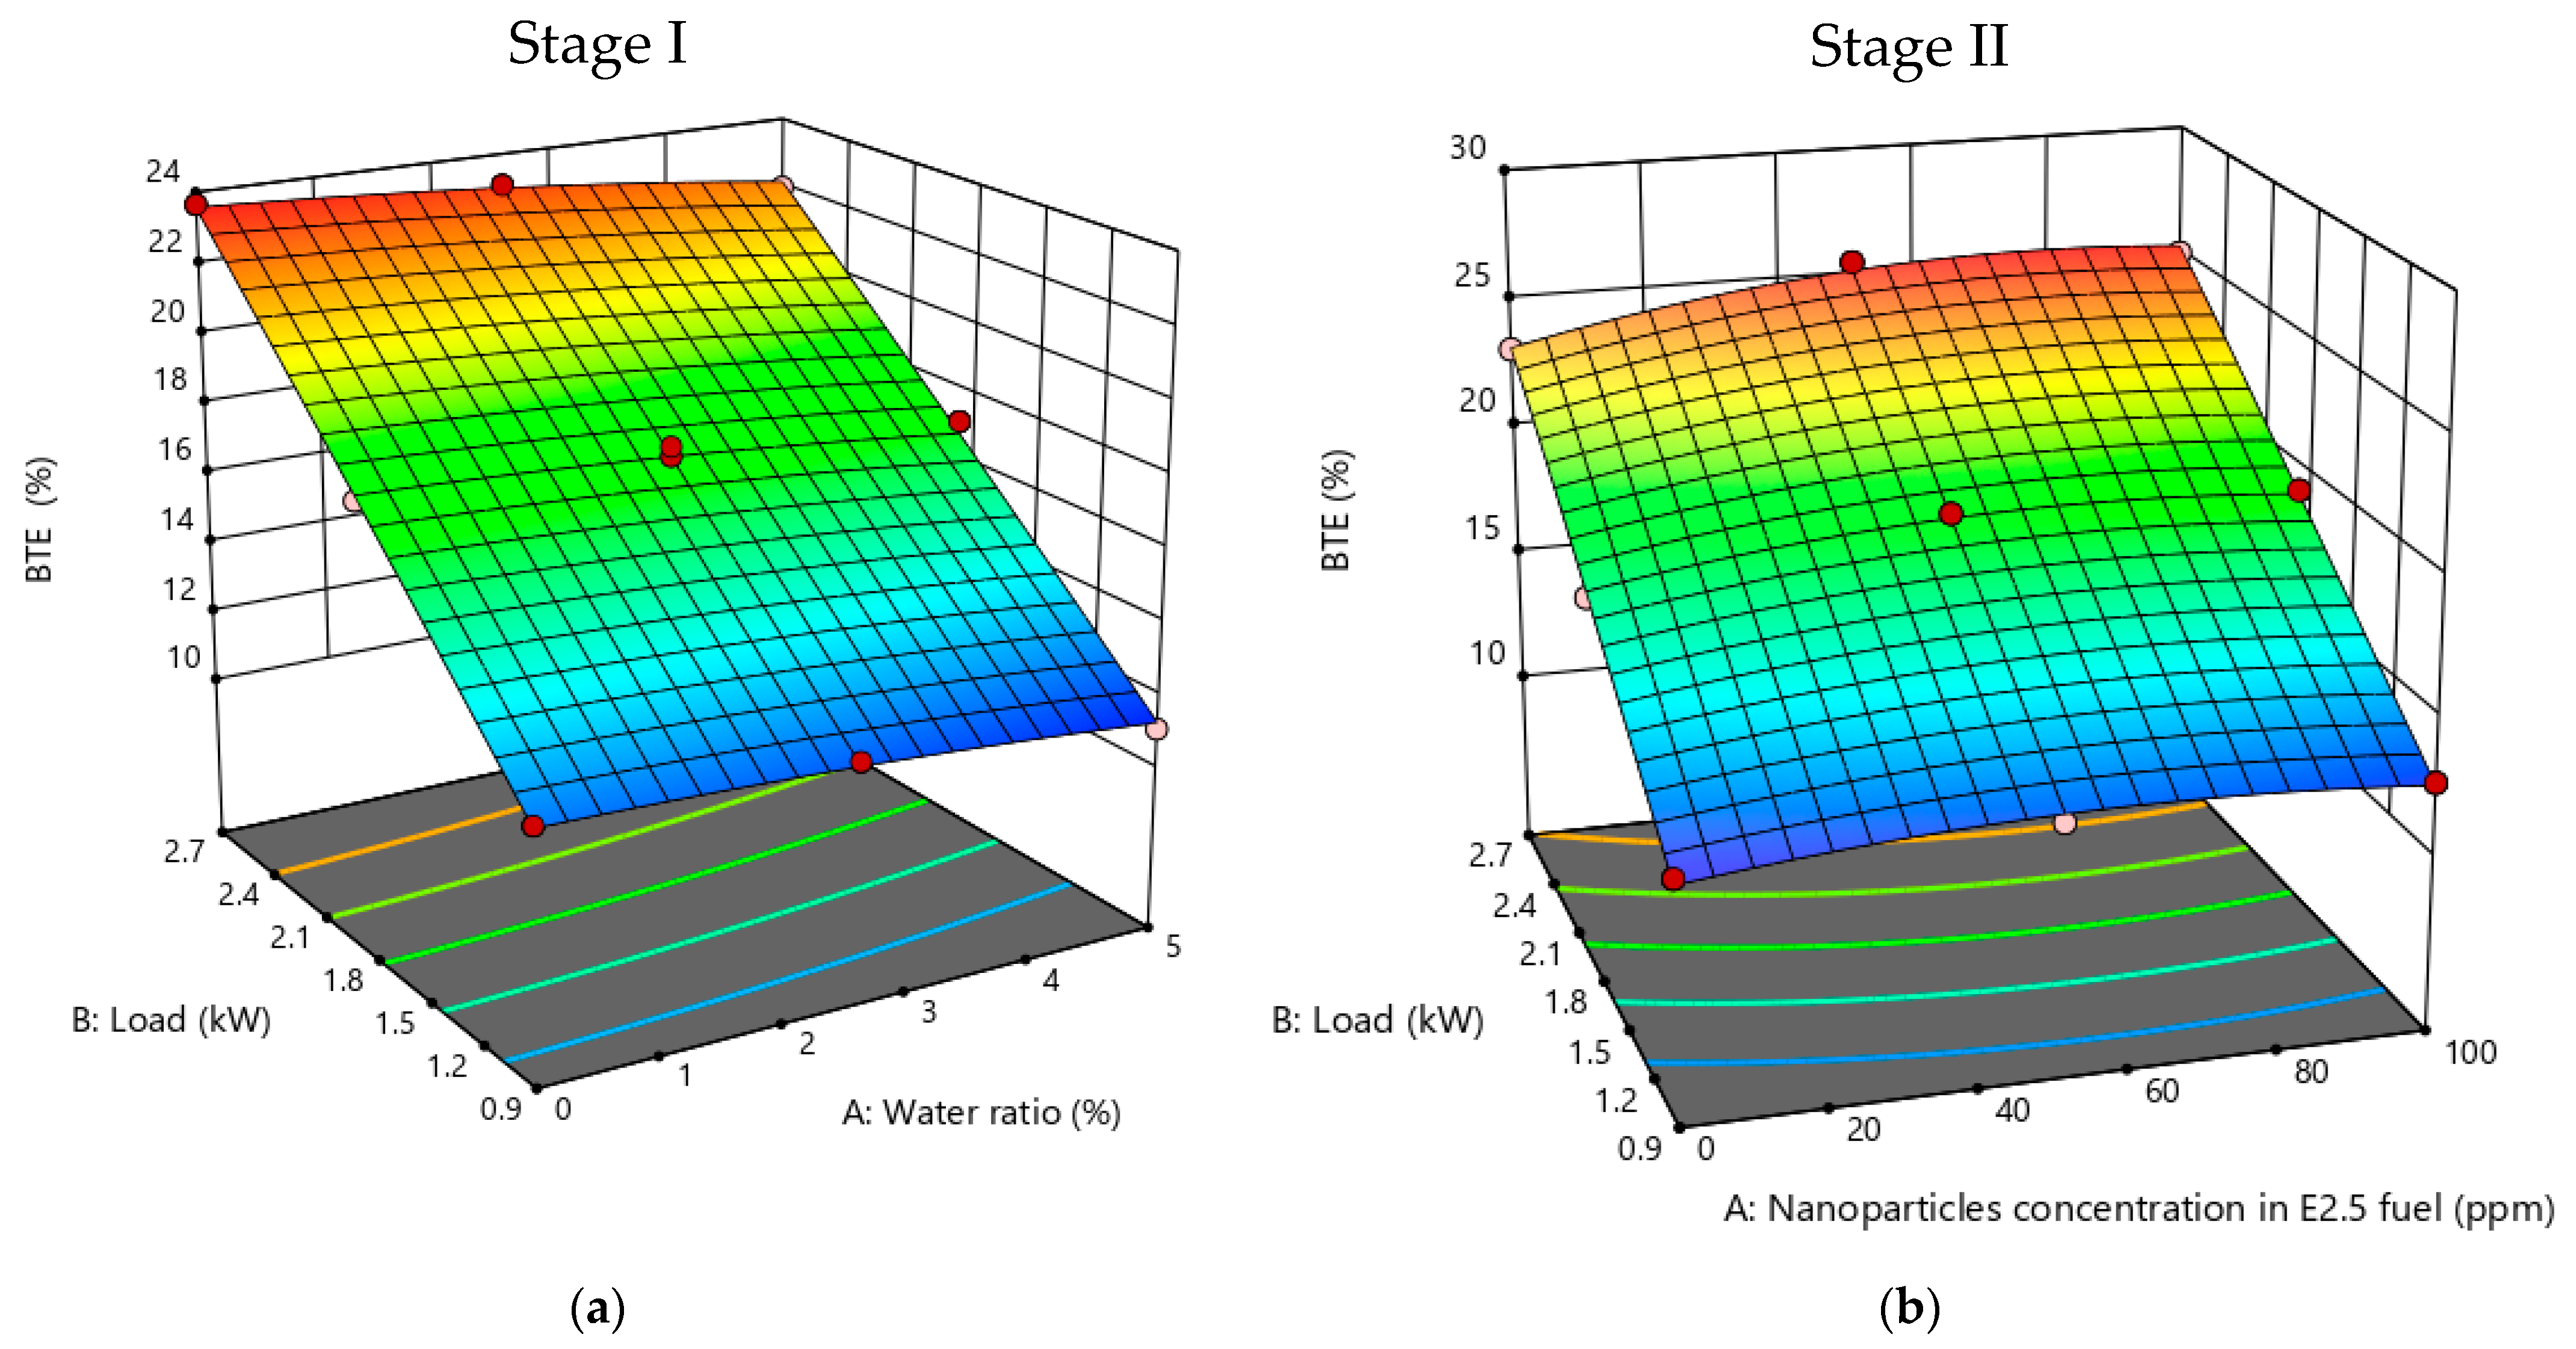
The engine’s ability to convert the fuel’s chemical energy into productive work is evaluated by brake thermal efficiency. This value is computed by dividing the engine’s braking power by the energy input to the system [8,88]. For all tested fuel samples, BTE increases linearly as the load increases, as seen in Figure 14a,b. There is a decrease in BTE with increasing water ratio in emulsion fuel, as seen in Figure 14a. Since the water has no calorific value, the mixture has a lower heating value, which is the main cause of the BTE value decreasing as the concentration of water in the diesel increases [33]. The influence of nanoparticles in E2.5 fuel is well presented in Figure 14b as compensating for the lower heating value. The E2.5 + 50Al2O3 achieved the highest BTE under all load conditions. This is most likely due to the greater surface-area-to-volume ratio and improved combustion properties of nanoparticles, which boost the fuel’s burning efficiency by enabling extra fuel to react with air [66]. The BTE observed for E2.5 + 50Al2O3 at maximum test load was 25.53%, while the BTEs for the neat diesel, E2.5, E5, and E2.5 + 50Al2O3 were 23.65, 23.10, 21.95, and 24.31, respectively.

4. Conclusions

The main objective of this study was to improve engine performance and reduce exhaust emissions by utilizing water–diesel emulsions and aluminum oxide nanoparticles in a two-stage experimental framework facilitated by response surface methodology (RSM). In the first stage, experiments were conducted to assess the impact of water–diesel emulsions on diesel engine performance and emissions at various loads relative to the base fuel. Water was introduced at varying ratios of 2.5% and 5% in the base fuel. The significant results from this stage are as follows:
  • Model analysis indicated the stability of each response model, with all p-values being less than 0.05. Additionally, HC, NOx, CO, CO2, EGT, BSFC, and BTE exhibited coefficient determination (R2) values of 0.9360, 0.9992, 0.8134, 0.9987, 0.9997, 0.9969, and 0.9976, respectively. The predicted R2 and adjusted R2 values differed by less than 0.2, signifying the robustness of both the model and the data.
  • Performance analysis revealed that, due to the lower heating value of the emulsion, brake specific fuel consumption increased with an escalating water ratio, while brake thermal efficiency decreased.
  • In terms of exhaust emissions analysis, the E2.5 fuel demonstrated average reductions of 60.18% for NOx, 16.62% for HC, and 21.56% for CO throughout engine loading compared to pure diesel fuel.
Overall, while water–diesel emulsion fuel proved efficient in pollutant reduction, it did not enhance engine performance. In the second stage, owing to a trade-off between emissions and performance, E2.5 was identified as the optimal emulsion from the previous stage and blended with aluminum oxide nanoparticles at two concentrations (50 and 100 ppm). Conclusions drawn from this stage include:
  • Model analysis showed a p-value below 0.05 for every response model, with the corresponding R2 values for HC, NOx, CO, CO2, EGT, BSFC and BTE being 0.9443, 0.9867, 0.8315, 0.9989, 0.9994, 0.9986, and 0.9971, respectively. Additionally, the minimal difference between predicted R2 and adjusted R2 values (below 0.2) indicates the reliability of the models.
  • Exhaust emissions analysis revealed that, on average, throughout engine loading, E2.5 + 50Al2O3 fuel accomplished a substantial reduction in NOx (69.70%), HC (33.37%), and CO (32.44%) compared to pure diesel fuel.
  • Performance analysis indicated a 7.94% increase in brake thermal efficiency for E2.5 + 50Al2O3 compared to pure diesel fuel at maximum test load.
The findings of this study underscore the exceptional efficacy of the E2.5 + 50Al2O3 blend, showcasing a discernible advancement in both engine performance and emission reduction compared to a spectrum of other investigated fuels. This marked superiority positions our research at the forefront of contemporary endeavors in the realm of alternative fuel formulations for internal combustion engines. The nuanced integration of water–diesel emulsions, particularly in the form of the E2.5 variant, coupled with the judicious addition of aluminum oxide nanoparticles at the optimized concentration of 50 ppm, represents a novel and distinctive approach. Our confidence in the current results and models, as presented in the manuscript, is firmly recognized. The analysis conducted provides valuable insights and establishes a foundational understanding of the correlations between the studied additives and engine parameters. This work serves as a significant step in exploring the combined impact of nanoparticles and water–diesel emulsions on diesel engines. Moving forward, further research is indeed essential to deepen this understanding. Future studies should focus on employing more precise exhaust gas analyzers and fuel consumption meters to refine the accuracy of the findings. Expanding the scope to include a variety of engines and test stands is also recommended to ensure a comprehensive evaluation of torque and other vital parameters. Such extended research endeavors will not only validate and enhance the current conclusions but also contribute substantially to the field of engine performance and additive efficiency.

Author Contributions

Conceptualization, A.M. (A. Mostafa) and M.M.; methodology, A.M. (A. Mostafa) and A.M. (Ahmad Mustafa); software, A.M. (A. Mostafa) and A.M. (Ahmad Mustafa); validation, I.Y.; formal analysis, A.M. (A. Mostafa) and M.M.; investigation, I.Y. and A.M. (Ahmad Mustafa); resources, M.M. and I.Y.; data curation, A.M. (A. Mostafa) and M.M; writing—original draft preparation, A.M. (A. Mostafa); writing—review and editing, M.M., I.Y. and A.M. (Ahmad Mustafa); visualization, I.Y.; supervision, M.M., I.Y. and A.M. (Ahmad Mustafa). All authors have read and agreed to the published version of the manuscript.

Funding

This research received no external funding.

Data Availability Statement

Data are contained within the article.

Conflicts of Interest

The author declares no conflict of interest.

References

  1. Okumuş, F.; Kaya, C.; Kökkülünk, G. NOX based comparative analysis of a CI engine fueled with water in diesel emulsion. Energy Sources Part A Recovery Util. Environ. Eff. 2023, 45, 6710–6729. [Google Scholar]
  2. Mostafa, A.; Mustafa, A.; Youssef, I.; Mourad, M. Assessment of Performance and Emissions Characteristics of Diesel Engine using Water Diesel Emulsion: A Review. Environ. Asia 2022, 15, 117–130. [Google Scholar]
  3. Attar, A.; Waghmare, J.; Mane, S. Water in diesel emulsion fuel: Production, properties, performance, and exhaust emission analysis. Int. J. Energy Environ. Eng. 2022, 13, 729–738. [Google Scholar] [CrossRef]
  4. Wang, Z.; Yuan, B.; Cao, J.; Huang, Y.; Cheng, X.; Wang, Y.; Zhang, X.; Liu, H. A new shift mechanism for micro-explosion of water-diesel emulsion droplets at different ambient temperatures. Appl. Energy 2022, 323, 119448. [Google Scholar] [CrossRef]
  5. Gowrishankar, S.; Krishnasamy, A. Novel surfactants for stable biodiesel-water emulsions to improve performance and reduce exhaust emissions of a light-duty diesel engine. Fuel 2022, 330, 125562. [Google Scholar] [CrossRef]
  6. Hegde, R.R.; Sharma, P.; Raj, P.; Keny, R.; Bhide, P.J.; Kumar, S.; Bhattacharya, S.S.; Lohani, A.; Kumar, A.; Verma, A. Factors affecting emissions from diesel fuel and water-in-diesel emulsion. Energy Sources Part A Recovery Util. Environ. Eff. 2016, 38, 1771–1778. [Google Scholar] [CrossRef]
  7. Saha, D.; Roy, B. Influence of areca nut husk nano-additive on combustion, performance, and emission characteristics of compression ignition engine fuelled with plastic-grocery-bag derived oil-water-diesel emulsion. Energy 2023, 268, 126682. [Google Scholar] [CrossRef]
  8. Kesharvani, S.; Chhabra, M.; Dwivedi, G.; Verma, T.N.; Pugazhendhi, A. Execution and emission characteristics of automotive compression ignition engine powered by cerium oxide nanoparticles doped water diesel emulsion fuel. Fuel 2023, 349, 128670. [Google Scholar] [CrossRef]
  9. Okumuş, F.; Kökkülünk, G.; Kaya, C.; Aydın, Z. Thermodynamic assessment of water diesel emulsified fuel usage in a single cylinder diesel engine. Energy Sources Part A Recovery Util. Environ. Eff. 2023, 45, 3708–3721. [Google Scholar] [CrossRef]
  10. Mondal, P.K.; Mandal, B.K. Optimization of water-emulsified diesel preparation and comparison of mechanical homogenization and ultrasonic dispersion methods to study CI engine performances. Energy Sources Part A Recovery Util. Environ. Eff. 2023, 45, 6566–6595. [Google Scholar] [CrossRef]
  11. Anil, M.; Hemadri, V.B.; Swamy, M. Experimental investigation on impact of water in diesel emulsion in a single-cylinder research diesel engine. Int. J. Ambient Energy 2023, 44, 399–412. [Google Scholar] [CrossRef]
  12. Watanabe, S.; Yahya, W.; Ithnin, A.; Abd Kadir, H. Performance and emissions of diesel engine fuelled with water-in-diesel emulsion. J. Soc. Automot. Eng. Malays. 2017, 1, 12–19. [Google Scholar] [CrossRef]
  13. Alahmer, A.; Yamin, J.; Sakhrieh, A.; Hamdan, M. Engine performance using emulsified diesel fuel. Energy Convers. Manag. 2010, 51, 1708–1713. [Google Scholar] [CrossRef]
  14. Vali, R.H.; Wani, M.M. Optimal utilization of ZnO nanoparticles blended diesel-water emulsion by varying compression ratio of a VCR diesel engine. J. Environ. Chem. Eng. 2020, 8, 103884. [Google Scholar] [CrossRef]
  15. Jin, C.; Wei, J.; Chen, B.; Li, X.; Ying, D.; Gong, L.; Fang, W. Effect of nanoparticles on diesel engines driven by biodiesel and its blends: A review of 10 years of research. Energy Convers. Manag. 2023, 291, 117276. [Google Scholar] [CrossRef]
  16. Jin, C.; Wei, J. The combined effect of water and nanoparticles on diesel engine powered by biodiesel and its blends with diesel: A review. Fuel 2023, 343, 127940. [Google Scholar] [CrossRef]
  17. Lv, J.; Wang, S.; Meng, B. The effects of nano-additives added to diesel-biodiesel fuel blends on combustion and emission characteristics of diesel engine: A review. Energies 2022, 15, 1032. [Google Scholar] [CrossRef]
  18. Basha, J.S.; Anand, R. An experimental study in a CI engine using nanoadditive blended water–diesel emulsion fuel. Int. J. Green Energy 2011, 8, 332–348. [Google Scholar] [CrossRef]
  19. Khatri, D.; Goyal, R. Effects of silicon dioxide nanoparticles on the performance and emission features at different injection timings using water diesel emulsified fuel. Energy Convers. Manag. 2020, 205, 112379. [Google Scholar] [CrossRef]
  20. MD, A.; Hemadri, V.; Swamy, M. Impact of Cobalt Oxide Nanoparticles Dispersed in Water in Diesel Emulsion in Reduction of Diesel Engine Exhaust Pollutants. Pollution 2022, 8, 579–593. [Google Scholar]
  21. Veza, I.; Spraggon, M.; Fattah, I.R.; Idris, M. Response surface methodology (RSM) for optimizing engine performance and emissions fueled with biofuel: Review of RSM for sustainability energy transition. Results Eng. 2023, 18, 101213. [Google Scholar] [CrossRef]
  22. Razzaq, L.; Abbas, M.M.; Waseem, A.; Jauhar, T.A.; Fayaz, H.; Kalam, M.; Soudagar, M.E.M.; Silitonga, A.; Ishtiaq, U. Influence of varying concentrations of TiO2 nanoparticles and engine speed on the performance and emissions of diesel engine operated on waste cooking oil biodiesel blends using response surface methodology. Heliyon 2023, 9, e17758. [Google Scholar] [CrossRef] [PubMed]
  23. Mostafa, A.; Mourad, M.; Mustafa, A.; Youssef, I. Influence of aluminum oxide nanoparticles addition with diesel fuel on emissions and performance of engine generator set using response surface methodology. Energy Convers. Manag. X 2023, 19, 100389. [Google Scholar] [CrossRef]
  24. Mondal, P.K.; Mandal, B.K. Experimental investigation on the combustion, performance and emission characteristics of a diesel engine using water emulsified diesel prepared by ultrasonication. J. Braz. Soc. Mech. Sci. Eng. 2018, 40, 510. [Google Scholar] [CrossRef]
  25. Alahmer, H.; Alahmer, A.; Alamayreh, M.I.; Alrbai, M.; Al-Rbaihat, R.; Al-Manea, A.; Alkhazaleh, R. Optimal water addition in emulsion diesel fuel using machine learning and sea-horse optimizer to minimize exhaust pollutants from diesel engine. Atmosphere 2023, 14, 449. [Google Scholar] [CrossRef]
  26. El Shenawy, E.; Elkelawy, M.; Bastawissi, H.A.-E.; Shams, M.M.; Panchal, H.; Sadasivuni, K.; Thakar, N. Investigation and performance analysis of water-diesel emulsion for improvement of performance and emission characteristics of partially premixed charge compression ignition (PPCCI) diesel engines. Sustain. Energy Technol. Assess. 2019, 36, 100546. [Google Scholar] [CrossRef]
  27. Basha, J.S.; Al Balushi, M. Performance and emission features of a light duty diesel engine generator powered with water-diesel emulsions. Eur. J. Eng. Sci. Technol. 2019, 2, 72–78. [Google Scholar]
  28. Ithnin, A.M.; Ahmad, M.A.; Bakar, M.A.A.; Rajoo, S.; Yahya, W.J. Combustion performance and emission analysis of diesel engine fuelled with water-in-diesel emulsion fuel made from low-grade diesel fuel. Energy Convers. Manag. 2015, 90, 375–382. [Google Scholar] [CrossRef]
  29. Tamam, M.Q.M.; Yahya, W.J.; Ithnin, A.M.; Abdullah, N.R.; Kadir, H.A.; Rahman, M.M.; Rahman, H.A.; Mansor, M.R.A.; Noge, H. Performance and emission studies of a common rail turbocharged diesel electric generator fueled with emulsifier free water/diesel emulsion. Energy 2023, 268, 126704. [Google Scholar] [CrossRef]
  30. Azimi, M.; Mirjavadi, S.S.; Davari, E.; Seifi, M.R. The effect of water-diesel emulsion usage on a tractor engine performance and emission. Russ. Agric. Sci. 2016, 42, 488–492. [Google Scholar] [CrossRef]
  31. El-Din, M.N.; Mishrif, M.R.; Gad, M.; Keshawy, M. Performance and exhaust emissions of a diesel engine using diesel nanoemulsions as alternative fuels. Egypt. J. Pet. 2019, 28, 197–204. [Google Scholar] [CrossRef]
  32. Alahmer, A. Influence of using emulsified diesel fuel on the performance and pollutants emitted from diesel engine. Energy Convers. Manag. 2013, 73, 361–369. [Google Scholar] [CrossRef]
  33. Hassan, Z.U.; Usman, M.; Asim, M.; Kazim, A.H.; Farooq, M.; Umair, M.; Imtiaz, M.U.; Asim, S.S. Use of diesel and emulsified diesel in CI engine: A comparative analysis of engine characteristics. Sci. Prog. 2021, 104, 00368504211020930. [Google Scholar] [CrossRef] [PubMed]
  34. Selim, M.Y.; Ghannam, M.T. Performance and Engine Roughness of a Diesel Engine Running on Stabilized Water Diesel Emulsion; SAE Technical Paper; SAE: Warrendale, PA, USA, 2007. [Google Scholar]
  35. Saha, D.; Roy, B. Effects of plastic-grocery-bag derived oil-water-diesel emulsions on combustion, performance and emission characteristics, and exergoeconomic aspects of compression ignition engine. Sustain. Energy Technol. Assess. 2022, 54, 102877. [Google Scholar] [CrossRef]
  36. Zhang, W.; Chen, Z.; Shen, Y.; Shu, G.; Chen, G.; Xu, B.; Zhao, W. Influence of water emulsified diesel & oxygen-enriched air on diesel engine NO-smoke emissions and combustion characteristics. Energy 2013, 55, 369–377. [Google Scholar]
  37. Selim, M.Y.; Ghannam, M. Combustion study of stabilized water-in-diesel fuel emulsion. Energy Sources Part A Recovery Util. Environ. Eff. 2009, 32, 256–274. [Google Scholar] [CrossRef]
  38. Fahd, M.E.A.; Wenming, Y.; Lee, P.; Chou, S.; Yap, C.R. Experimental investigation of the performance and emission characteristics of direct injection diesel engine by water emulsion diesel under varying engine load condition. Appl. Energy 2013, 102, 1042–1049. [Google Scholar] [CrossRef]
  39. Khatri, D.; Goyal, R.; Jain, A.; Johnson, A.T. Modeling and optimization of stability aspects for water diesel emulsified fuel using response surface methodology. Energy Sources Part A Recovery Util. Environ. Eff. 2022, 44, 3055–3078. [Google Scholar] [CrossRef]
  40. Abed, K.; Gad, M.; El Morsi, A.; Sayed, M.; Elyazeed, S.A. Effect of biodiesel fuels on diesel engine emissions. Egypt. J. Pet. 2019, 28, 183–188. [Google Scholar] [CrossRef]
  41. Patil, H.; Gadhave, A.; Mane, S.; Waghmare, J. Analyzing the stability of the water-in-diesel fuel emulsion. J. Dispers. Sci. Technol. 2015, 36, 1221–1227. [Google Scholar] [CrossRef]
  42. Sugeng, D.; Abrori, M.; Syafrinaldy, A.; Kadir, H.; Saputro, F.; Kusdi, B.; Bahiudddin, I.; Yahya, W. Determining water content of non-surfactant emulsion fuel using bomb-calorimeter. In IOP Conference Series: Materials Science and Engineering; IOP Publishing: Bristol, UK, 2021. [Google Scholar]
  43. Ahmed, M.; Ismail, Y.; Mohamed, M. The influence of ethanol–gasoline blends on performance characteristics of engine generator set. Am. J. Eng. Res. 2017, 6, 71–77. [Google Scholar]
  44. Abd El Fattah, S.F.; Ezzat, M.F.; Mourad, M.A.; Elkelawy, M.; Youssef, I.M. Experimental Investigation of the Performance and Exhaust Emissions of a Spark-Ignition Engine Operating with Different Proportional Blends of Gasoline and Water Ammonia Solution. J. Eng. Res. 2022, 5, 38–45. [Google Scholar]
  45. Khulief, S.; Aboul-Fotouh, T.M. Experimental investigation of upgraded diesel fuel with copper oxide nanoparticles on performance and emissions characteristics of diesel engine. J. Energy Power Eng. 2017, 11, 541–552. [Google Scholar]
  46. Ebrahiem, E.E.; Hakim, Y.A.; Aboul-Fotouh, T.M.; Abd Elfattah, M. Improvement of diesel fuel to enhance engine performance and emissions using zinc oxide nanoparticle additive. Egypt. J. Chem. 2022, 65, 349–355. [Google Scholar] [CrossRef]
  47. Alur, S.; Shivashimpi, M.; Akkoli, K.; Banapurmath, N.; Sakthivel, D.; Sonawane, Y.D.; Islam, S.; Sharma, P.; Khan, M.A.; Razak, A. Optimization and modelling of EGR rate and MIS for POME fuelled CRDI diesel engine. Case Stud. Therm. Eng. 2023, 49, 103170. [Google Scholar] [CrossRef]
  48. Mendoza-Casseres, D.; Valencia-Ochoa, G.; Duarte-Forero, J. Experimental assessment of combustion performance in low-displacement stationary engines operating with biodiesel blends and hydroxy. Therm. Sci. Eng. Prog. 2021, 23, 100883. [Google Scholar] [CrossRef]
  49. Bezerra, M.A.; Santelli, R.E.; Oliveira, E.P.; Villar, L.S.; Escaleira, L.A. Response surface methodology (RSM) as a tool for optimization in analytical chemistry. Talanta 2008, 76, 965–977. [Google Scholar] [CrossRef] [PubMed]
  50. Simsek, S.; Uslu, S. Determination of a diesel engine operating parameters powered with canola, safflower and waste vegetable oil based biodiesel combination using response surface methodology (RSM). Fuel 2020, 270, 117496. [Google Scholar] [CrossRef]
  51. Uslu, S.; Celik, M. Response surface methodology-based optimization of the amount of cerium dioxide (CeO2) to increase the performance and reduce emissions of a diesel engine fueled by cerium dioxide/diesel blends. Energy 2023, 266, 126403. [Google Scholar] [CrossRef]
  52. Bi, Y.; Yan, J.; Liu, S.; Xiao, B.; Shen, L.; Wang, P.; Nie, X. Study on Diesel Engine Selective Catalytic Reduction Performance at Different Atmospheric Pressures Using the Response Surface Method. ACS Omega 2023, 8, 14549–14557. [Google Scholar] [CrossRef]
  53. Uslu, S. Optimization of diesel engine operating parameters fueled with palm oil-diesel blend: Comparative evaluation between response surface methodology (RSM) and artificial neural network (ANN). Fuel 2020, 276, 117990. [Google Scholar] [CrossRef]
  54. Tamoradi, T.; Kiasat, A.R.; Veisi, H.; Nobakht, V.; Besharati, Z.; Karmakar, B. MgO doped magnetic graphene derivative as a competent heterogeneous catalyst producing biofuels via transesterification: Process optimization through Response Surface Methodology (RSM). J. Environ. Chem. Eng. 2021, 9, 106009. [Google Scholar] [CrossRef]
  55. Esfe, M.H.; Alidust, S.; Motallebi, M.; Toghraie, D. Investigation of different transfer functions for modeling the dynamic viscosity of hybrid nanolubricant containing MWCNTs and MgO nanoparticles using the response surface methodology (RSM). Tribol. Int. 2023, 183, 108370. [Google Scholar] [CrossRef]
  56. Kakran, S.; Kaushal, R.; Bajpai, V.K. Experimental study and optimization of performance characteristics of compression ignition hydrogen engine with diesel pilot injection. Int. J. Hydrogen Energy 2023, 48, 33705–33718. [Google Scholar] [CrossRef]
  57. Tiwari, C.; Verma, T.N.; Dwivedi, G.; Verma, P. Energy-exergy analysis of diesel engine fueled with microalgae biodiesel-diesel blend. Appl. Sci. 2023, 13, 1857. [Google Scholar] [CrossRef]
  58. Zhang, Z.; Dong, R.; Tan, D.; Zhang, B. Multi-objective optimization of performance characteristic of diesel particulate filter for a diesel engine by RSM-MOPSO during soot loading. Process Saf. Environ. Prot. 2023, 177, 530–545. [Google Scholar] [CrossRef]
  59. International Organization of Legal Metrology. Available online: https://www.oiml.org/en/files/pdf_r/r099-1-2-e08.pdf (accessed on 8 December 2023).
  60. Mehta, R.N.; Chakraborty, M.; Parikh, P.A. Nanofuels: Combustion, engine performance and emissions. Fuel 2014, 120, 91–97. [Google Scholar] [CrossRef]
  61. Kumar, B.R.; Muthukkumar, T.; Krishnamoorthy, V.; Saravanan, S. A comparative evaluation and optimization of performance and emission characteristics of a DI diesel engine fueled with n-propanol/diesel, n-butanol/diesel and n-pentanol/diesel blends using response surface methodology. RSC Adv. 2016, 6, 61869–61890. [Google Scholar] [CrossRef]
  62. Mostafa, A.; Youssef, I.; Mourad, M. Impact of Ethanol-Gasoline Blends on Exhaust Emissions, Noise and Vibration Characteristics of Single Cylinder Spark Ignition Engine. Minia J. Eng. Technol. (MJET) 2018, 38, 275–283. [Google Scholar]
  63. Venkanna, B.; Venkataramana Reddy, C. Direct injection diesel engine performance, emission, and combustion characteristics using diesel fuel, nonedible honne oil methyl ester, and blends with diesel fuel. Int. J. Energy Res. 2012, 36, 1247–1261. [Google Scholar] [CrossRef]
  64. Abdollahi, M.; Ghobadian, B.; Najafi, G.; Hoseini, S.; Mofijur, M.; Mazlan, M. Impact of water–biodiesel–diesel nano-emulsion fuel on performance parameters and diesel engine emission. Fuel 2020, 280, 118576. [Google Scholar] [CrossRef]
  65. Annamalai, M.; Dhinesh, B.; Nanthagopal, K.; SivaramaKrishnan, P.; Lalvani, J.I.J.; Parthasarathy, M.; Annamalai, K. An assessment on performance, combustion and emission behavior of a diesel engine powered by ceria nanoparticle blended emulsified biofuel. Energy Convers. Manag. 2016, 123, 372–380. [Google Scholar] [CrossRef]
  66. Sadhik Basha, J.; Anand, R. Effects of nanoparticle additive in the water-diesel emulsion fuel on the performance, emission and combustion characteristics of a diesel engine. Int. J. Veh. Des. 2012, 59, 164–181. [Google Scholar] [CrossRef]
  67. Vigneswaran, R.; Balasubramanian, D.; Sastha, B.S. Performance, emission and combustion characteristics of unmodified diesel engine with titanium dioxide (TiO2) nano particle along with water-in-diesel emulsion fuel. Fuel 2021, 285, 119115. [Google Scholar] [CrossRef]
  68. Sivakumar, M.; Sundaram, N.S.; Thasthagir, M.H.S. Effect of aluminium oxide nanoparticles blended pongamia methyl ester on performance, combustion and emission characteristics of diesel engine. Renew. Energy 2018, 116, 518–526. [Google Scholar] [CrossRef]
  69. Wei, J.; Yin, Z.; Wang, C.; Lv, G.; Zhuang, Y.; Li, X.; Wu, H. Impact of aluminium oxide nanoparticles as an additive in diesel-methanol blends on a modern DI diesel engine. Appl. Therm. Eng. 2021, 185, 116372. [Google Scholar] [CrossRef]
  70. Santhosh, K.; Kumar, G. Impact of 1-Hexanol/diesel blends on combustion, performance and emission characteristics of CRDI CI mini truck engine under the influence of EGR. Energy Convers. Manag. 2020, 217, 113003. [Google Scholar] [CrossRef]
  71. Fayad, M.A.; Sobhi, M.; Chaichan, M.T.; Badawy, T.; Abdul-Lateef, W.E.; Dhahad, H.A.; Yusaf, T.; Isahak, W.N.R.W.; Takriff, M.S.; Al-Amiery, A.A. Reducing Soot Nanoparticles and NOX Emissions in CRDI Diesel Engine by Incorporating TiO2 Nano-Additives into Biodiesel Blends and Using High Rate of EGR. Energies 2023, 16, 3921. [Google Scholar] [CrossRef]
  72. Khanjani, A.; Sobati, M.A. Performance and emission of a diesel engine using different water/waste fish oil (WFO) biodiesel/diesel emulsion fuels: Optimization of fuel formulation via response surface methodology (RSM). Fuel 2021, 288, 119662. [Google Scholar] [CrossRef]
  73. Hosseinzadeh-Bandbafha, H.; Khalife, E.; Tabatabaei, M.; Aghbashlo, M.; Khanali, M.; Mohammadi, P.; Shojaei, T.R.; Soltanian, S. Effects of aqueous carbon nanoparticles as a novel nanoadditive in water-emulsified diesel/biodiesel blends on performance and emissions parameters of a diesel engine. Energy Convers. Manag. 2019, 196, 1153–1166. [Google Scholar] [CrossRef]
  74. Patel, K.R.; Dhiman, V.D. Effect of hybrid nanoparticles MgO and Al2O3 added water-in-diesel emulsion fueled diesel engine using hybrid deep neural network-based spotted hyena optimization. Heat Transf. 2022, 51, 5748–5788. [Google Scholar] [CrossRef]
  75. Tutak, W.; Jamrozik, A.; Grab-Rogaliński, K. Evaluation of Combustion Stability and Exhaust Emissions of a Stationary Compression Ignition Engine Powered by Diesel/n-Butanol and RME Biodiesel/n-Butanol Blends. Energies 2023, 16, 1717. [Google Scholar] [CrossRef]
  76. Kumar, N.; Raheman, H.; Machavaram, R. Performance of a diesel engine with water emulsified diesel prepared with optimized process parameters. Int. J. Green Energy 2019, 16, 687–701. [Google Scholar] [CrossRef]
  77. Sivaram, A.; Prabhu, N.; Praveen Kumar, R.; Navaneethakrishnan, G.; Palanisamy, R.; AboRas, K.M.; Bajaj, M.; Djidimbele, R.; Dieudonné, K.K.; Vinodhan, V.L. Performance Analysis of Compression Ignition Engines Using Emulsion Fuel Blended with Aluminium Oxide Nanoparticles. Adv. Mater. Sci. Eng. 2023, 2023, 3988117. [Google Scholar] [CrossRef]
  78. Ghanbari, M.; Mozafari-Vanani, L.; Dehghani-Soufi, M.; Jahanbakhshi, A. Effect of alumina nanoparticles as additive with diesel–biodiesel blends on performance and emission characteristic of a six-cylinder diesel engine using response surface methodology (RSM). Energy Convers. Manag. X 2021, 11, 100091. [Google Scholar] [CrossRef]
  79. Ghorbanzadeh, M.; Issa, M.; Ilinca, A. Experimental underperformance detection of a fixed-speed diesel–electric generator based on exhaust gas emissions. Energies 2023, 16, 3537. [Google Scholar] [CrossRef]
  80. Gumus, M.; Sayin, C.; Canakci, M. The impact of fuel injection pressure on the exhaust emissions of a direct injection diesel engine fueled with biodiesel–diesel fuel blends. Fuel 2012, 95, 486–494. [Google Scholar] [CrossRef]
  81. Koc, A.B.; Abdullah, M. Performance and NOx emissions of a diesel engine fueled with biodiesel-diesel-water nanoemulsions. Fuel Process. Technol. 2013, 109, 70–77. [Google Scholar] [CrossRef]
  82. Xin, G.; Ji, C.; Wang, S.; Hong, C.; Meng, H.; Yang, J.; Su, F. Experimental study on Miller cycle hydrogen-enriched ammonia engine by rich-burn strategy. Fuel 2023, 350, 128899. [Google Scholar] [CrossRef]
  83. Srithar, K.; Balasubramanian, K.A.; Pavendan, V.; Kumar, B.A. Experimental investigations on mixing of two biodiesels blended with diesel as alternative fuel for diesel engines. J. King Saud Univ.-Eng. Sci. 2017, 29, 50–56. [Google Scholar] [CrossRef]
  84. Raheman, H.; Ghadge, S. Performance of compression ignition engine with mahua (Madhuca indica) biodiesel. Fuel 2007, 86, 2568–2573. [Google Scholar] [CrossRef]
  85. Pradeep, P.; Senthilkumar, M. Simultaneous reduction of emissions as well as fuel consumption in CI engine using water and nanoparticles in diesel-biodiesel blend. Energy Sources Part A Recovery Util. Environ. Eff. 2021, 43, 1500–1510. [Google Scholar] [CrossRef]
  86. Lodi, F.; Zare, A.; Arora, P.; Stevanovic, S.; Ristovski, Z.; Brown, R.J.; Bodisco, T. Engine performance characteristics using microalgae derived dioctyl phthalate biofuel during cold, preheated and hot engine operation. Fuel 2023, 344, 128162. [Google Scholar] [CrossRef]
  87. Rao, G.P.; Prasad, L.S.V. Combined influence of compression ratio and exhaust gas recirculation on the diverse characteristics of the diesel engine fueled with novel palmyra biodiesel blend. Energy Convers. Manag. X 2022, 14, 100185. [Google Scholar]
  88. An, H.; Yang, W.; Chou, S.; Chua, K. Combustion and emissions characteristics of diesel engine fueled by biodiesel at partial load conditions. Appl. Energy 2012, 99, 363–371. [Google Scholar] [CrossRef]
Figure 1. A schematic depicting the process of making the water–diesel emulsion.
Designs 08 00003 g001
Figure 2. Real appearance of the prepared neat diesel fuel and water–diesel emulsion fuels.
Designs 08 00003 g002
Figure 3. TEM images of Al2O3 nanoparticles [23].
Designs 08 00003 g003
Figure 4. Schematic diagram of experimental apparatus.
Designs 08 00003 g004
Figure 5. A flowchart of the research approach.
Designs 08 00003 g005
Figure 6. Experimental data against predicted responses in stage I: (a) HC, (b) NOx, (c) CO, (d) CO2, (e) EGT, (f) BSFC, and (g) BTE.
Designs 08 00003 g006
Figure 7. Experimental data against predicted responses in stage II: (a) HC, (b) NOx, (c) CO, (d) CO2, (e) EGT, (f) BSFC, and (g) BTE.
Designs 08 00003 g007
Figure 8. A 3D plot of HC emissions in relation to (a) engine load and water ratio, and (b) engine load and nanoparticles concentration in E2.5 fuel.
Designs 08 00003 g008
Figure 9. A 3D plot of NOx emissions in relation to (a) engine load and water ratio, and (b) engine load and nanoparticles concentration in E2.5 fuel.
Designs 08 00003 g009
Figure 10. A 3D plot of CO emissions in relation to (a) engine load and water ratio, and (b) engine load and nanoparticles concentration in E2.5 fuel.
Designs 08 00003 g010
Figure 11. A 3D plot of CO2 emission of the engine in relation to (a) engine load and water ratio, and (b) engine load and nanoparticles concentration in E2.5 fuel.
Designs 08 00003 g011
Figure 12. A 3D plot of EGT in relation to (a) engine load and water ratio, and (b) engine load and nanoparticles concentration in E2.5 fuel.
Designs 08 00003 g012
Figure 13. A 3D plot of BSFC in relation to (a) engine load and water ratio, and (b) engine load and nanoparticles concentration in E2.5 fuel.
Designs 08 00003 g013
Figure 14. A 3D plot of BTE in relation to (a) engine load and water ratio, and (b) engine load and nanoparticles concentration in E2.5 fuel.
Designs 08 00003 g014
Table 1. The physical properties of Al2O3 nanoparticles.
ItemSpecification
Chemical nameAluminum oxide (Al2O3)
ManufacturerNanotech, Egypt
Appearance   ( Form ) powder
Appearance   ( Color ) White
Shape   ( TEM ) Spherical - like   Shape
Average   particle   size   ( TEM ) 11 ± 2   n m
Table 2. Egyptian diesel fuel’s technical specifications in compliance with ASTM standards [40].
Physical PropertyValue
Density   at   15.56   C   ( k g / m 3 ) 829
Cetane   Number 45
Flash   Point   ( C ) 75   C
Kinematic   Viscosity   at   40   C ( m m 2 / s ( c s t ) ) 2.8
Heating   Value ( kJ / kg ) 42,000
Table 3. Details of water–diesel emulsion fuels.
No.Fuel DesignationWater (%) by Vol.Span 20 (%) by Vol.Diesel Fuel (%) by Vol.Density kg/m3Heating Value kJ / kg
1E2.52.5394.5839.36539,690
2E55392843.6438,640
Table 4. The technical details of the engine-generator set.
EngineTypeSingle Cylinder, Four-Stroke Diesel Engine
Model5GF-SKM2 (Lister)
Cooling systemForce air cooled
Displacement406 cm3
Bore 86   m m
Stroke lenght70 mm
Rated power 9   h p
Rated speed3000 rpm
Start systemElectric start
GeneratorTypeAC generator with two-poles
Voltage220 VAC
Frequency 50   H z
Rated output 5 kW
Maximum output5.5 kW
Table 5. The technical details of the emission analyzer.
EmissionsUnitResolutionRange
CO % vol 0.01 0 9.99
CO2 % vol. 0.1 0 19.9
HC p p m 1 0 9999
NOXppm10–5000
Table 6. Experimental test uncertainty.
VariableUncertainty [%] at Stage IUncertainty [%] at Stage II
NOX±0.8±1.5%
HC±1.5±1.8%
CO2±0.4±0.3%
CO±6.8±7.1%
EGT±0.2%±0.1%
BSFC±0.6%±0.6
BTE±0.6%±0.6%
U(overall)±7.1±7.6
Table 7. Experimental variables and their levels for stage I based on CCD.
Experimental Design VariablesUnitCodeLevels
Low (−1)Central (0)High (1)
Water ratio % A 02.55
Engine load k W B 0.91.82.7
Table 8. Experimental design variables and their levels for stage II based on CCD.
Experimental Design VariablesUnitCodeLevels
Low (−1)Central (0)High (1)
Nanoparticles concentration in E2.5 fuel ppm A 050100
Engine load k W B 0.91.82.7
Table 9. The experimental design data from stage I.
Input VariablesEmission ParametersPerformance Parameters
RunWater Ratio (%)Load
(kW)
HC (ppm)NOx
(ppm)
CO
(% Vol.)
CO2
(% Vol.)
EGT
( C )
BSFC (g/kWh)BTE
(%)
12.52.718530.046.2299392.723.10
22.51.817420.034.9256524.617.29
352.719500.056.1297424.521.95
42.51.816420.044.8257516.517.56
52.51.817420.034.9256508.717.83
62.50.916310.053.7209754.512.02
701.8201040.054.7259480.617.84
850.916290.053.7207843.611.04
900.918830.063.6210698.112.28
1002.7231270.056300362.423.65
112.51.816410.044.9258516.517.56
122.51.817430.044.9257524.617.29
1351.818400.044.8256544.317.12
Table 10. The experimental design data from stage II.
Input VariablesEmission ParametersPerformance Parameters
RunNanoparticles Conc. in E2.5 Fuel (ppm)Load (kW)HC (ppm)NOx
(ppm)
CO
(% Vol.)
CO2
(% Vol.)
EGT
°C
BSFC (g/kWh)BTE
(%)
1502.715410.046.2285355.325.53
2501.814330.034.9244466.319.45
31002.716460.046.2286373.124.97
4501.814330.024.9244466.319.45
5501.813320.034.9243479.618.91
6500.912220.043.8200714.412.70
701.817420.034.9258524.617.56
81000.915230.043.8201737.912.63
900.916310.053.7209754.512.28
1002.718530.046.2299392.723.10
11501.813340.035245466.319.45
12501.813350.034.9244472.919.18
131001.815370.034.9244486.619.15
Table 11. Model evaluation for stage I.
Response Emission ParametersPerformance Parameters
HCNOxCOCO2 E G T BSFCBTE
p-value < 0.0001 < 0.0001 0.0172 < 0.0001 < 0.0001 < 0.0001 < 0.0001
F value (Lack of Fit)1.241.940.20360.65900.47293.591.64
Coefficient of Determination (R2)0.93600.99920.81340.99870.99970.99690.9976
Adjusted (R2)0.90400.99870.68010.99770.99950.99460.9959
Predicted (R2)0.74650.99500.52460.99440.99910.97710.9859
Adequate Precision19.2006131.75937.435192.5698185.96567.017371.1875
Standard Deviation0.07130.06460.01190.04130.73610.21290.2551
Mean4.217.280.20844.86255.4623.1917.43
Table 12. Model evaluation for stage II.
Response Emission ParametersPerformance Parameters
HCNOxCOCO2 E G T BSFCBTE
p -value0.0003 < 0.0001 0.0123 < 0.0001 < 0.0001 < 0.0001 < 0.0001
F value (Lack of Fit)0.94321.660.15350.28073.411.502.67
Coefficient of Determination (R2)0.94430.98670.83150.99890.99940.99860.9971
Adjusted ( R 2 )0.90450.97720.71120.99810.99890.99760.9950
Predicted ( R 2 )0.71870.91750.60240.99680.99540.99190.9788
Adequate Precision15.660035.16516.854898.8349145.39991.128263.3320
Standard Deviation0.54101.290.01130.03720.03236.560.0361
Mean14.6935.540.18494.9515.67514.654.31
Table 13. Final equations for stage I.
Quadratic ModelEquationTransformationResponse
HC (ppm)(6)Square RootSqrt (HC) = 4.08742 − 0.151511 × A + 0.192455 × B − 0.048573 × AB + 0.264602 × A2
NOx (ppm)(7)Square RootSqrt (NOx) = 6.47996 − 1.96619 × A + 0.926207 × B − 0.118273 × AB + 1.78284 × A2 − 0.0545217 × B2
CO (% vol.)(8)Square RootSqrt (CO) = 0.190024 − 0.0074915 × A −0.0074915 × B + 0.00533554 × AB + 0.019923 × A2 + 0.019923 × B2
CO2 (% vol.)(9)NoneCO2 = 4.87586 + 0.05 × A + 1.21667 × B + 1.05542 × 10⁻¹⁵ × AB −0.115517 × A2 + 0.0844828 × B2
E G T  °C(10)NoneEGT = 256.966 − 1.5 × A + 45 × B + 9.15884× 10⁻¹⁴ × AB + 0.12069 × A2 − 3.37931 × B2
BSFC (g/kWh)(11)Square RootSqrt (BSFC) = 22.726 + 0.932899 × A − 3.91319 × B − 0.264493 × AB − 0.00613766 × A2 + 1.00993 × B2
BTE (%)(12)NoneBTE = 17.5473 − 0.609208 × A + 5.55921 × B − 0.117002 × AB 0.174233 × A2 − 0.0908004 × B2
Table 14. Final equations for stage II.
Quadratic ModelEquationTransformationResponse
HC (ppm)(13)None(HC) = 13.3793 − 0.833333 × A + 1 × B − 0.25 × AB + 2.67241 × A2 + 0.172414 × B2
NOx (ppm)(14)None (NOx) = 33.3103 − 3.33333 × A + 10.6667 × B + 0.25 × AB + 6.41379 × A2 − 1.58621 × B2
CO (% vol.)(15)Square RootSqrt (CO) = 0.166911 − 0.00393447 × A − 0.00393447 × B + 0.0059017 × AB + 0.00613707 × A2 + 0.032932 × B2
CO2 (% vol.)(16)NoneCO2 = 4.92069 + 0.0166667 × A + 1.21667 × B − 0.025 × AB − 0.0224138 × A2 + 0.0775862 × B2
E G T  °C(17)Square RootSqrt (EGT) = 15.6237 − 0.183558 × A + 1.38478 × B − 0.0251741 × AB + 0.209543 × A2 − 0.119857 × B2
BSFC (g/kWh)(18)NoneBSFC = 0471.064 − 12.3718 × A − 180.953 × B − 0.763 × AB + 32.6036 × A2 + 61.8281 × B2
BTE (%)(19)Square RootSqrt (BTE) = 4.38965 + 0.0709963 × A + 0.705923 × B + 0.0355258 × AB − 0.101044 × A2 − 0.0761533 × B2
Disclaimer/Publisher’s Note: The statements, opinions and data contained in all publications are solely those of the individual author(s) and contributor(s) and not of MDPI and/or the editor(s). MDPI and/or the editor(s) disclaim responsibility for any injury to people or property resulting from any ideas, methods, instructions or products referred to in the content.