Article

Designs of Optomechanical Acceleration Sensors with the Natural Frequency from 5 Hz to 50 kHz

by
Marina Rezinkina
1,2,* and
Claus Braxmaier
1,3
1
Institute for Microelectronics, University of Ulm, 2022 Albert-Einstein-Allee 43, 89081 Ulm, Germany
2
Theoretical Electrical Technique Department, National Technical University “Kharkiv Polytechnic Institute”, 2 Kyrpychova Str., 61002 Kharkiv, Ukraine
3
Department of Quantum Metrology, Institute for Quantum Technologies, German Aerospace Center (DLR e.V.), 2022 Wilhem-Runge-Straße 10, 89081 Ulm, Germany
*
Author to whom correspondence should be addressed.
Designs 2024, 8(2), 33; https://doi.org/10.3390/designs8020033
Submission received: 29 February 2024 / Revised: 25 March 2024 / Accepted: 29 March 2024 / Published: 7 April 2024
(This article belongs to the Special Issue Design Sensitivity Analysis and Engineering Optimization)

Abstract

:
In many applications, such as space navigation, metrology, testing, and geodesy, it is necessary to measure accelerations with frequencies ranging from fractions of a hertz to several kilohertz. For this purpose, optomechanical sensors are used. The natural frequency of such sensors should be approximately ten times greater than the frequency of the measured acceleration. In the case of triaxial acceleration measurements, a planar design with two sensors that measure accelerations in two perpendicular in-plane directions and a third sensor that measures out-of-plane acceleration is effective. The mechanical characteristics of the existing designs of both in-plane and out-of-plane types of sensors were analyzed, and the improved designs were elaborated. Using numerical simulation, the dependencies of the natural frequency level in the range from several hertz to tens of kilohertz on the designs and geometric parameters of opto-mechanical accelerometers were modeled. This allows one to select the accelerometer design and its parameters to measure the acceleration at the assigned frequency. It is shown that the opto-mechanical accelerometers of the proposed designs have reduced dissipation losses and crosstalk.

1. Introduction

Accelerometers and optomechanical acceleration sensors (OMASs) [1,2] are widely used in various applications, starting from stationary and the very low-frequency range for geodesy and space navigation [3] to metrology and vibration tests with frequencies up to several kilohertz [4,5,6]. For acceleration measurements with the help of OMAS, a Fabry–Perot optical cavity is used. One of the cavity mirrors is located on the movable OMAS test mass, and the second mirror is mounted motionless relative to the first [1]. Both mirrors are covered with high reflective coatings. When acceleration is applied to such a system, the test mass displaces, changing the length of the cavity L. The change in L is measured with an optical cavity readout method [7].
The use of OMAS allows accurate measurements over long periods [7] and they are not influenced by electromagnetic disturbances [8].
In many applications, such as in space missions, triaxial acceleration measurement is required [7]. Such measurements are recommended to be performed with the help of a flat arrangement, having one out-of-plane sensor and two in-plane sensors oriented in perpendicular directions [7].
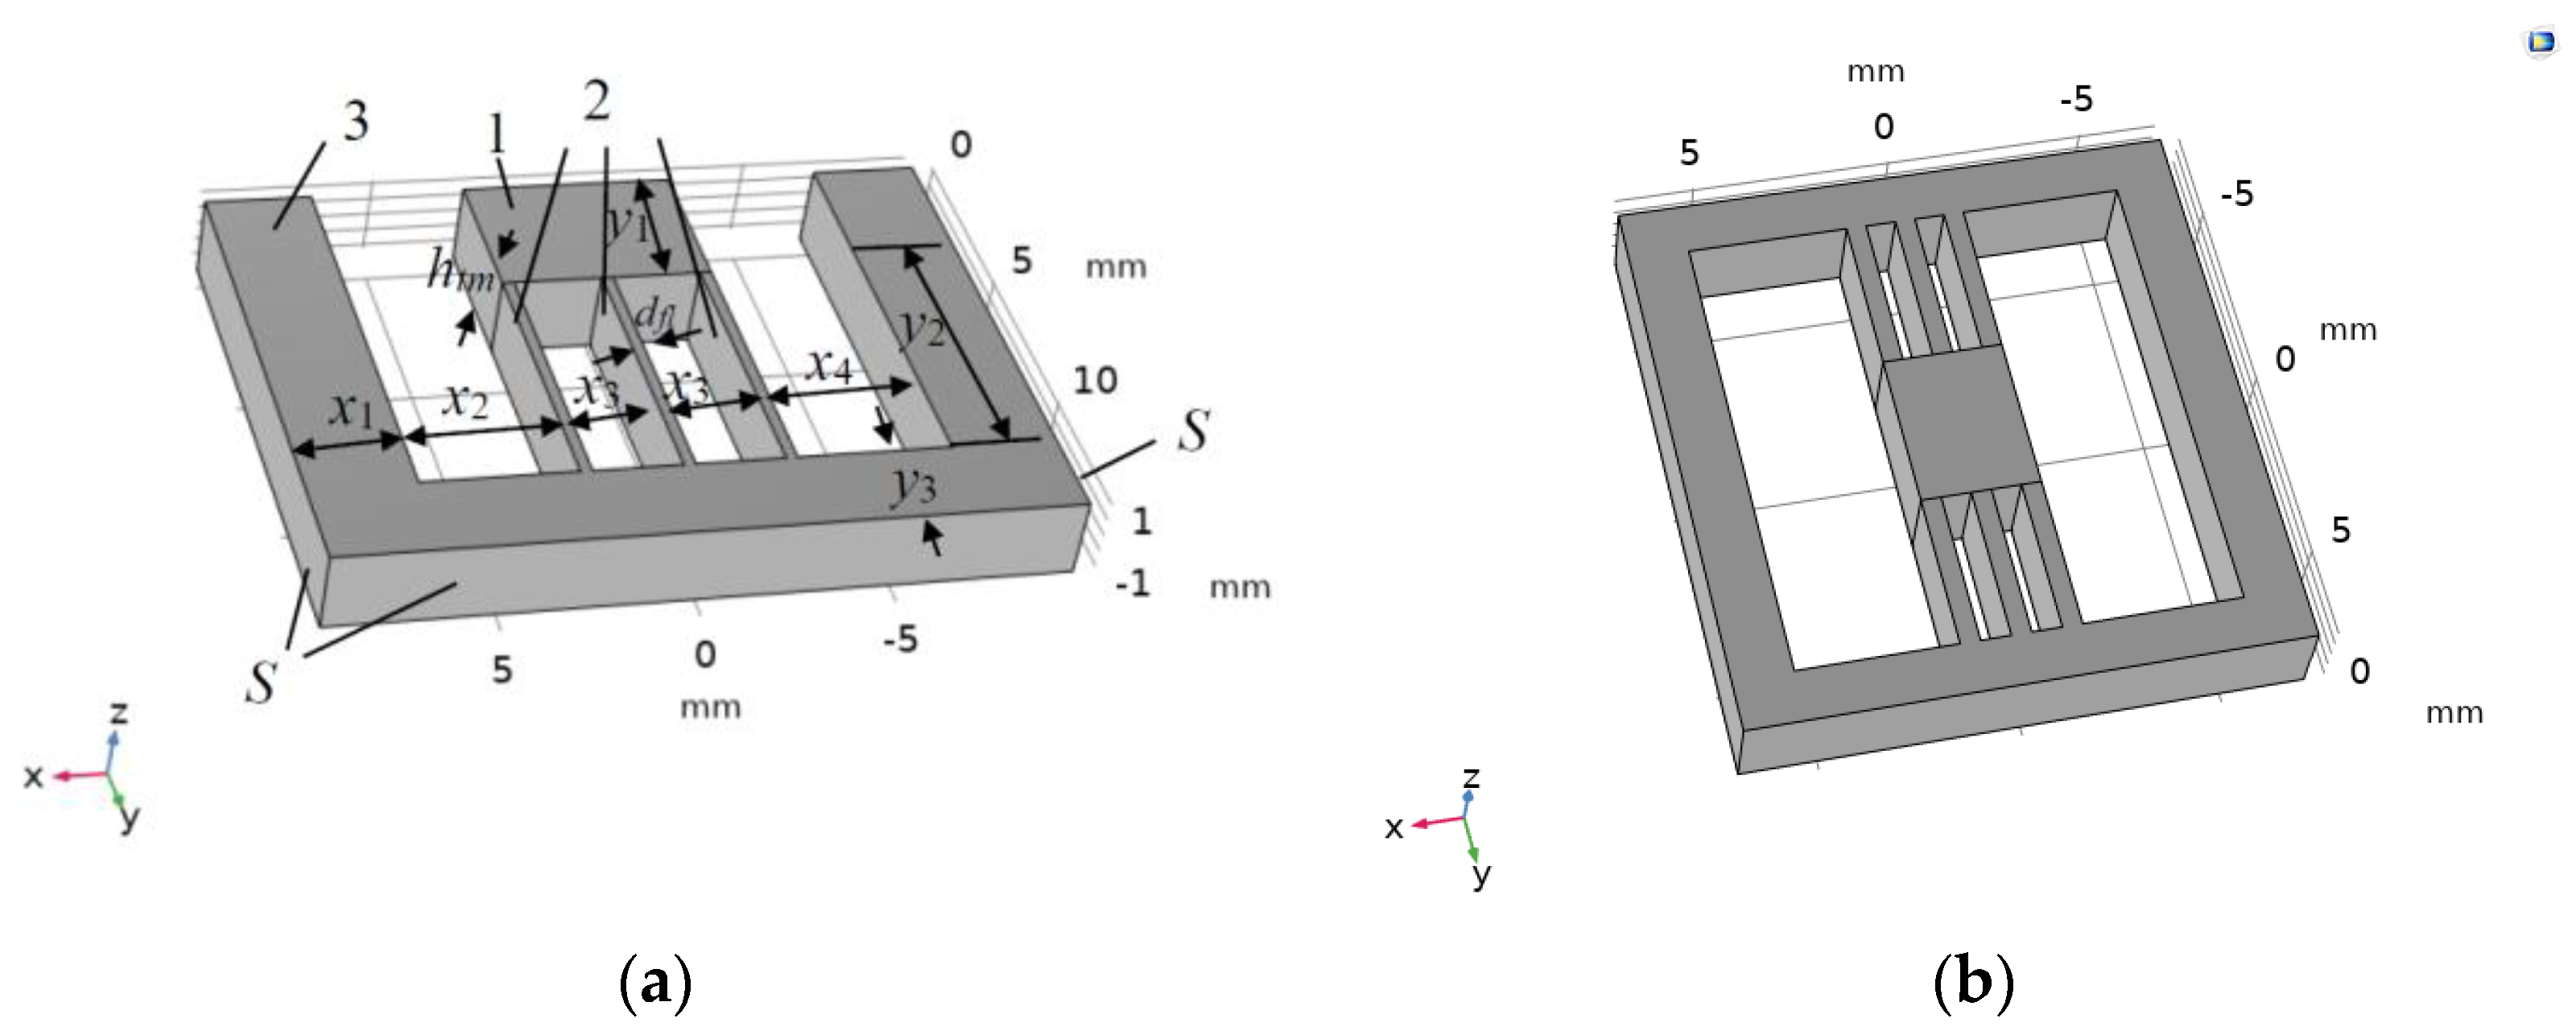
One of the known types of optomechanical inertial sensors [1,9] can be applied for in-plane acceleration measurement. It is used in different applications due to its rather plain and functional design, consisting of a flat proof mass fastened to the outer constrained frame by two flexible, thin consoles (see Figure 1). However, such sensors have a maximum level of the first eigenfrequency of about 10 kHz [9], so the improved design should be elaborated to provide higher natural frequencies.
For out-of-plane acceleration measurements, sensors with a drum-type design consisting of a proof mass suspended by four thin flexures in the middle of the outer constrained frame are currently used [1,10]. Such sensors were elaborated for providing higher natural frequencies, namely the first eigenfrequency is about 2 kHz. To ensure smaller (of several hertz) and higher natural frequencies (of tens of kilohertz), the improved designs should be elaborated.
OMASs are quite complex to manufacture because they are made from a single piece of fused silica to ensure their mechanical properties and highly reflective coatings must be applied to the surfaces that form the Fabry–Perot cavity [1,7]. This leads to a significant increase in their cost. It is advisable to manufacture several OMASs at once, rather than just one trial OMAS. This leads to the need for the preliminary modeling of mechanical processes in OMASs to select their design and parameters based on the required operating frequency, dimensions, and conditions for the optical readout of the movement of the moving part (out-of-plane or in-plane configurations). In this work, we compare the simulation data with known experimental levels to validate the obtained results. Further work is planned on the implementation of the developed OMAS designs and their experimental investigations.
The purpose of this work is to select both in-plane and out-of-plane OMAS designs, depending on the frequency of the measured acceleration. These OMASs must have reduced levels of dissipation loss and crosstalk.
Mathematical modeling can be used to achieve this goal by comparing the mechanical characteristics of OMASs of different designs. This allows us to evaluate the OMAS characteristics such as natural frequencies, as well as participation factors and dissipation losses.
To simulate mechanical processes, Newton’s second law is used, written in the frequency domain for linearly elastic materials [11]:
ρ 0 ω 2 u = P T + F e j ϕ ,
where u [m] is displacement; ω [1/s] is applied force circular frequency; ρ0 [kg/m3] is mass density; F [N/m3] and ϕ are the applied volume force module and its initial phase, respectively; P [N/m2] is the first Piola–Kirchhoff stress tensor; j = 1 .
For modeling the mechanical processes, the numerical calculations with the help of COMSOL Multiphysics 5.6 were used, as analytical methods can only be applied to structures with a rather plain design (see, for instance, [12,13]). To consider the processes connected with thermoelastic damping in linear viscoelastic materials, the generalized Kelvin–Voigt model was applied, which is recommended for describing processes in glassy polymers [14].
An analysis of the participation factors enables a prediction of the influence of displacements in different directions on the resulting shape of the movement modes. Participation factors calculation provides information on the “weight” of each eigenmode in a resulting movement. The displacement uk can be presented as a sum of the eigenmodes [11]:
u k i = 1 n q ^ k , i · u k , i ,
where q ^ k , i   m is (k,i)-th eigenmode amplitude; uk,i is a factor determining (k,i)-th eigenmode shape; and n is a total number of the eigenmodes;
q ^ k , i = S a , k Γ k , i ω i 2
is the pseudo-acceleration spectrum; S a , k [m/s2] is the acceleration spectra in the k-th direction (corresponds to the x, y, or z); i is an eigenmode number; ωi [1/s] is i-th circular eigenfrequency; and Γk,i is the i-th mode participation factor in the k-th direction.
Considering the participation factor levels allows us to better understand the influence of each eigenfrequency mode on the resulting displacement mode shape. Participation factors also help to evaluate the so-called crosstalk, i.e., the influence of the movement of the test mass in directions that do not coincide with the direction of the acceleration measurement.
OMAS design should provide high sensitivity to enable high-precision acceleration measurement. The acceleration measurement with the help of OMAS is based on using a Fabry–Perot optical cavity [1], but the accuracy of the acceleration measurements mainly depends on the OMAS mechanical characteristics. A simplified representation of the minimal measured acceleration is written as follows [10,15]:
a th = 4 k B T ω 0 m Q ,
where kB = 1.380649 × 10⁻²³ J/K is the Boltzmann’s constant; T is the temperature [K]; ω0 [1/s2] is the OMAS natural frequency; Q is the mechanical quality factor; m [kg] is the mass of the OMAS moving part.
From Equation (3), it is clear how the accuracy of acceleration measurement is affected by mass, quality factor, and natural frequency.
To provide the liner dependence between the measured acceleration a [m/s2] and the OMAS test mass displacement Z [m] [7]:
Z = α / ω 0 2 ,
the operating frequency should be at least an order less than ω0 corresponding to the first eigenfrequency of OMAS.

2. Analysis of the Mechanical Characteristics of the In-Plane OMAS

2.1. Designs of the In-Plane OMAS with Low and Medium Natural Frequencies

In cases where the measured accelerations change with a rather low frequency, for example, during satellite geodesy missions [1], gravitational waves detection [16], and others [17,18], the use of accelerometers with low natural frequencies turns out to be effective due to a rise in the sensitivity of the acceleration measurements (see Equation (3)).

2.1.1. The Eigenfrequencies, Rigidity, and Cross-Talk of the In-Plane OMASs with Low and Medium Natural Frequencies

Let us consider the known OMAS design used for the measurement of accelerations with low frequencies [1,16,17,19,20,21]. Such an OMAS comprises a rectangular movable test mass 1 and long, thin flexes 2 connecting the test mass with the constrained part of OMAS 3 (see Figure 1).
The considered OMAS made of fused silica has the overall dimensions in the x, y, and z directions: 80 mm × 90 mm × 6.6 mm and following geometrical parameters [1,17]: x1 = 26 mm, x2 = 12.5 mm, x3 = 16.75 mm, x4 = 14 mm, y1 = 10.75 mm, y2 = 67.5 mm, y3 = 12.25 mm, the test mass square Stm = 180 mm2, its thickness htm = 6.6 mm, its mass mtmVLEF = ρfs·y1·x3·htm = 2.6 g (ρfs = 2203 kg/m3 is fused silica density), two flexures supporting the test mass have a length Lfl = y2 = 67.5 mm, a width wfl = htm = 6.6 mm, and a thickness dfl = 100 μm (see Figure 1). In calculations for eigenfrequencies determination, it was specified that the OMAS is fixed constrained over its outer side surface S (see Figure 1). Such devices are used for the measurement of the accelerations changing with low frequencies that are at least an order less than its first eigenfrequency, so let us call such an OMAS “VLEF” (very low eigenfrequency).
Forms of the displacement modes for the first two eigenfrequencies simulated with the help of COMSOL Multiphysics 5.6 regarding viscoelasticity and thermal expansion are shown in Figure 2. As the viscoelasticity material model, the “Generalized Kelvin–Voigt Model” was chosen in the node “Viscoelasticity” (in the node “Solid mechanics, Linear elastic material”) [11,22,23]. The best coincidence with the measured quality factor Q = 4.76 × 10⁵ [1] is reached when a parameter “Relaxation time” in this node is assigned equal to τ = 800 s. The directions of the vectors of movement are shown by red arrows. Levels of displacements shown in the color legends are only to account for the relative differences between the movements of OMAS’ different zones, as upon calculating eigenfrequencies, the load is supposed to be applied in the considered system. The levels of the eigenfrequencies (the first eigenfrequency fef1 and the second eigenfrequency fef2) of the movement modes are written in the upper left corners of the figures. A relative difference between the calculated level of the first eigenfrequency and the experimental resonant frequency (ffr = 4.715 Hz) [1] is less than 2%.
Let us consider the so-called cross-talk that is determined by the correlation between the OMAS test mass translation in the direction in which acceleration is measured and its translations in the other directions. As follows from the carried modeling, the levels of the normalized participation factor for the X translation (the direction in which acceleration is measured) equal 0.052 for the first eigenfrequency and 6.2 × 10⁻⁵ for the second one. The participation factors for the Y and Z translations are less than 10−5 for the first and second eigenfrequencies. So, it can be concluded that the movement in the x direction prevails significantly over the movement in the other two directions. The calculations also show that the displacement in the x direction is negligibly small in all frequency ranges, for the application of forces in both the y and/or z directions that are perpendicular to the direction of acceleration measurement.
The same OMAS design was used in the case of bigger frequencies of measured acceleration, for which a bigger first eigenfrequency is required. Let us call such an OMAS “MEF” (medium eigenfrequency). Such OMASs are investigated elsewhere [9,15]. The geometry parameters of the considered OMAS made of fused silica were assigned as follows: x1 = 2 mm, x2 = 2 mm, x3 = 5.5 mm, x4 = 2 mm, y1 = 4 mm, y2 = 8.2 mm, y3 = 2 mm, the test mass square Stm = 22 mm2, its thickness htm = 1.7 mm, its mass mtmMEF = ρfs·y1·x3·htm = 0.0824 mg, two flexures supporting the test mass have a length Lfl = y2 = 8.2 mm, a width wfl = htm = 1.7 mm, and a thickness dfl = 150 μm (see Figure 1).
The best coincidence with the measured quality factor Q = 4.6 × 10⁵ [9] is reached when, for the viscoelasticity material model, a parameter “relaxation time” was assigned equal to τ = 550 s. The simulated forms of the displacement eigenmodes are shown in Figure 3. The eigenfrequency levels are in good agreement with the data from [9].
If a higher operating frequency is necessary, the flexures’ thickness can be increased. For instance, for dfl = 300 μm instead of 150 μm like in the MEF OMAS case, the first eigenfrequency becomes approximately two times higher, namely equal to 1793.5 Hz. We can also obtain the bigger first eigenfrequency by reducing the flexure length. For instance, if we decrease the length of the MEF OMAS flexures from 8.2 mm to 3 mm, the first eigenfrequency will increase up to 7728 Hz. However, for the OMAS of this design (see Figure 1), further increasing rigidity in the x direction by increasing either the flexures’ thickness or decreasing their length leads to an increase in the participation factor in the z direction. It causes a change in the main displacement mode from movement in the direction of acceleration measurement (x) to movement in the z direction. As the simulations showed, the maximum first eigenfrequency level for such an OMAS design does not exceed 10–12 kHz.
To assess the rigidity of the OMAS in all three directions, calculations were carried out to determine the displacements of its moving part 1 (see Figure 1) when forces were applied in various directions at operating frequencies no less than 10 times lower than the considered first natural frequency of the OMAS fef1. Figure 4 shows the results of modeling the shape of the displacement modes for MEF OMAS when applying a force F = mtmMEF·g = 0.001 N (where g = 9.8 m/s) with a frequency fo = 50 Hz < fef1/10 (fef1 = 660.8 Hz—see Figure 3a) in the x (Figure 4a) and z (Figure 4b) directions. The simulation also showed that, when forces are applied with frequencies f < fef1/10, the displacement levels for all frequencies are practically the same.
As can be seen from Figure 4, the maximum displacement in the z direction is approximately 20 times less than in the direction of the acceleration measurement. It also follows from the calculations that the maximum displacement in the y direction is approximately several orders less it is than in the x direction. Thus, we can conclude that the rigidity of the OMAS MEF in the direction of the acceleration measurements is much less (at least 20 times) than in the other directions.
To evaluate cross-talk, we simulate the application of the force F = mtmMEF·g having the first eigenfrequency in the y and z directions. The first eigenfrequency was chosen because, at this frequency, the participation factor of the displacement in the x direction is maximal; in other directions, it is many orders of magnitude smaller. So, if any cross-talk appears, it will be at this frequency. Calculations have shown that only the application of a force F in the z direction can cause some displacement in the x direction, which affects the shape of the total displacement mode. However, as simulations have shown, for all the considered OMAS, cross-talk is negligible compared to displacement levels at frequencies that are at least ten times lower than the first eigenfrequency.

2.1.2. Modeling of the Dissipation Power Density for the In-Plane VLEF and MEF OMASs

The important parameter characterizing the OMAS operating effectiveness is the maximum level of the dissipation power density Pdiss. This parameter is connected to OMAS reliability and durability. It is also connected with the decrease in the levels of the OMAS quality factor due to losses. This parameter was modeled considering the geometric nonlinearity (for this, we use the node “Include geometric nonlinearity” in the node “Study” of COMSOL) and viscoelasticity (we use the node “Viscoelasticity” in the node “Solid mechanics, Linear elastic material”). It follows from the simulations that the VLEF OMAS with long flexures has rather high levels of Pdiss (see Figure 5a). For the MEF OMAS with much shorter flexures, the maximum level of Pdiss is much less (see Figure 5b).
As can be seen from the presented distributions (see Figure 5), due to the large length of the flexures, in addition to zones with increased energy dissipation near their attachment to the movable and the constrained parts (see 2, Figure 5b), such areas also appear in the middle of the flexures (see 1, Figure 5a). Moreover, the energy dissipation levels in these middle zones are much higher than in the zones of attachment of the flexures.
As shown by numerical analysis, the appearance of zones with increased energy dissipation in the middle of OMAS flexures is affected by both a decrease in their thickness and an increase in their length.

2.1.3. Dependencies of the Mechanical Characteristics of VLEF and MEF OMASs on Their Geometric Parameters

To evaluate the influence of OMASs’ geometric parameters on their output characteristics, simulations were carried out in which the VLEF OMAS was used as a base variant. In the calculations, the dimensions y1 and htm of the side Sx of the test mass on which the accelerometer mirror is attached (see Figure 1) were assigned to be unchanged. The calculated dependencies of the first eigenfrequency fef1 versus the width of the test mass x3, as well as the length Lfl and the thickness dfl of the flexures, are presented in Figure 6.
From the obtained dependencies, it is seen that all three parameters significantly affect the OMAS characteristics: fef1 decreases with x3 and Lfl increasing, as well as dfl decreasing. As calculations showed, levels of the second eigenfrequency in all calculated variants were 30 or more times higher than levels of the first eigenfrequency, so the predominant movement of the test mass occurred in the direction of measuring acceleration, namely the x.
It follows from the performed modeling that the maximum level of the dissipation power density increases with increasing x3 and Lfl; it decreases with dfl increasing. To avoid the appearance of additional areas of increased Pdiss in the middle of the flexures (see 1, Figure 5a) in the case of the VLEF OMAS parameters, the value of Lfl should be reduced by a factor of 3.3. For such an OMAS, fef1 = 33.5 Hz and Pdiss decreases up to several orders.
If the overall optomechanical sensor, dimensions should be approximately the same as in [1,17], and for a decrease in the dissipation power density, the geometry of the VLEF OMAS can be changed, namely, the flexures’ length is slightly less: Lfl = y2 = 60 mm, their thickness is slightly bigger: dfl = 150 μm, but the test mass width is two times larger: x3 = 36 mm (see Figure 1), and so its mass is also two times bigger. Figure 7 shows the calculated distributions for such an OMAS: the displacement mode for the first eigenfrequency (a) and the dissipation power density (b). In this case, the maximum dissipation power density decreases by more than two orders compared to the VLEF OMAS (see Figure 5a and Figure 7b).
As modeling showed, in comparison with the VLEF OMAS, the level of the first eigenfrequency becomes 1.68 times higher (see Figure 2a and Figure 7a), and the quality factor is also bigger by a factor of 1.4. So, the minimal measured acceleration (see Equation (3)) for the proposed OMAS is approximately the same as for the VLEF OMAS.
Simulations were also performed when the MEF OMAS was used as a base variant. It was also considered that the dimensions of the side of the test mass on which the accelerometer mirror is attached were unchanged. The calculated dependence of the fef1 versus the length of the flexures is presented in Figure 8: it can be seen that the fef1 increases substantially with a decrease in the Lfl.
Usage of the graphs presented in Figure 6 and Figure 8 permits the choice of the parameters of the OMAS of VLEF and MEF types that provide the required levels of the operating frequency, which should be at least 10 times less than the first eigenfrequency.

2.2. Designs of the In-Plane OMAS with High Natural Frequency

As was mentioned, in some applications, we need the measurements of the acceleration with frequencies up to several kilohertz. As the operational frequency should be approximately an order less than the OMAS first eigenfrequency fef1, to measure such accelerations, the level of fef1 should be an order of several tens of kilohertz. It is bigger than the level, which we have now, namely, fef1 ≤ 10 kHz [9,15]. As mentioned above (see Section 2.1.1), for fef1 > 10–12 kHz, existing in-plane OMAS designs (see Figure 1) cannot be used, and improved designs providing higher first eigenfrequency levels should be elaborated. This can be achieved by increasing the OMAS rigidity in the direction of measured acceleration (x), so we propose to make them not with two flexures as in the prototypes (see Figure 1), but three. An example of such an accelerometer is presented in Figure 9a.
We consider that the OMAS is made of a single piece of fused silica. The geometrical parameters of the OMAS are as follows: x1 = 2.75 mm, x2 = 4 mm, x3 = 5.5 mm, x4 = 4 mm, y1 = 4 mm, y2 = 7.5 mm, y3 = 2.5 mm, the test mass 1 thickness htm = 2.2 mm, its mass mtm = ρfs·y1·x3·htm = 0.1 mg, flexures 2 supporting the test mass have a length Lfl = y2 = 7.5 mm, a width wfl = htm = 2.2 mm, and a thickness dfl = 300 μm (see Figure 9a). The outer frame 3 has a side surface S. In this case, the first natural frequency increases by almost 30% in comparison with the case of the same OMAS with two flexures (see Figure 10a,c) and the ratio between the second and the first eigenfrequencies remains practically the same (see Figure 10b,d).
To further increase the levels of the first natural frequency, as well as the ratio between the second and the first natural frequency, we propose an advanced design to make such an OMAS double, when its flexures are located on both sides of the test mass (see Figure 9b). As shown by the numerical simulation, the choice of such a double OMAS configuration makes it possible to increase the first natural frequency by more than 1.6 times compared to the case of the two-flexure prototype (see Figure 10a,e). The ratio of the second and first eigenfrequencies increases by 1.2 times (see Figure 10b,f).
As modeling showed, the most significant effect on the levels of natural frequencies of the OMASs presented in Figure 9, is caused by the length of the flexures and by their thickness. In this case, a decrease in the length of the flexures and an increase in their thickness lead to a significant increase in the natural frequency of the OMAS. Less significant, but still noticeable, is the influence of the thickness and width of the test mass. Namely, an increase in the test mass thickness and a decrease in its width lead to an increase in the natural frequency of the OMAS. Taking this into account, we selected the parameters of the proposed OMAS with six flexures (see Figure 9b) to achieve an even higher level of natural frequency.
The geometrical parameters of the OMAS design with bigger natural frequencies are the following: x1 = 1.375 mm, x2 = 4 mm, x3 = 2.75 mm, x4 = 4 mm, y1 = 2.5 mm, y2 = 2.5 mm, y3 = 0.38 mm, the test mass 1 thickness htm = 5.5 mm, its mass mtm = ρfs·y1·x3·htm = 0.0833 mg, six flexures supporting the test mass have a length Lfl = y2 = 2.5 mm, a width wfl = htm = 5.5 mm, and a thickness dfl = 500 μm (see Figure 9). We suppose that the OMAS is made of a single piece of fused silica. Figure 11 shows the results of the mechanical processes modeling in the OMAS of the proposed design. We only presented the normalized participation factors for the X and Z translations, as the participation factor for the Y translation is negligibly small.
As Figure 11 shows, the proposed OMAS configuration allows one to increase the first eigenfrequency to more than 50 kHz. Although the second eigenfrequency (fef2) is only twice as large as the first (see Figure 11a,b), due to the negligible levels of the participation factors for the fef2 in the X and Z directions (see Figure 11c,d), this eigenfrequency does not affect the shape of the resulting displacement mode.

3. Analysis of the Mechanical Characteristics of the Out-of-Plane OMAS

To provide acceleration measurement in the z axis direction, i.e., outside the plane in which accelerations in the x and y directions are measured, another type of sensor can be used, namely OMAS of the drum type, presented elsewhere [1,10,
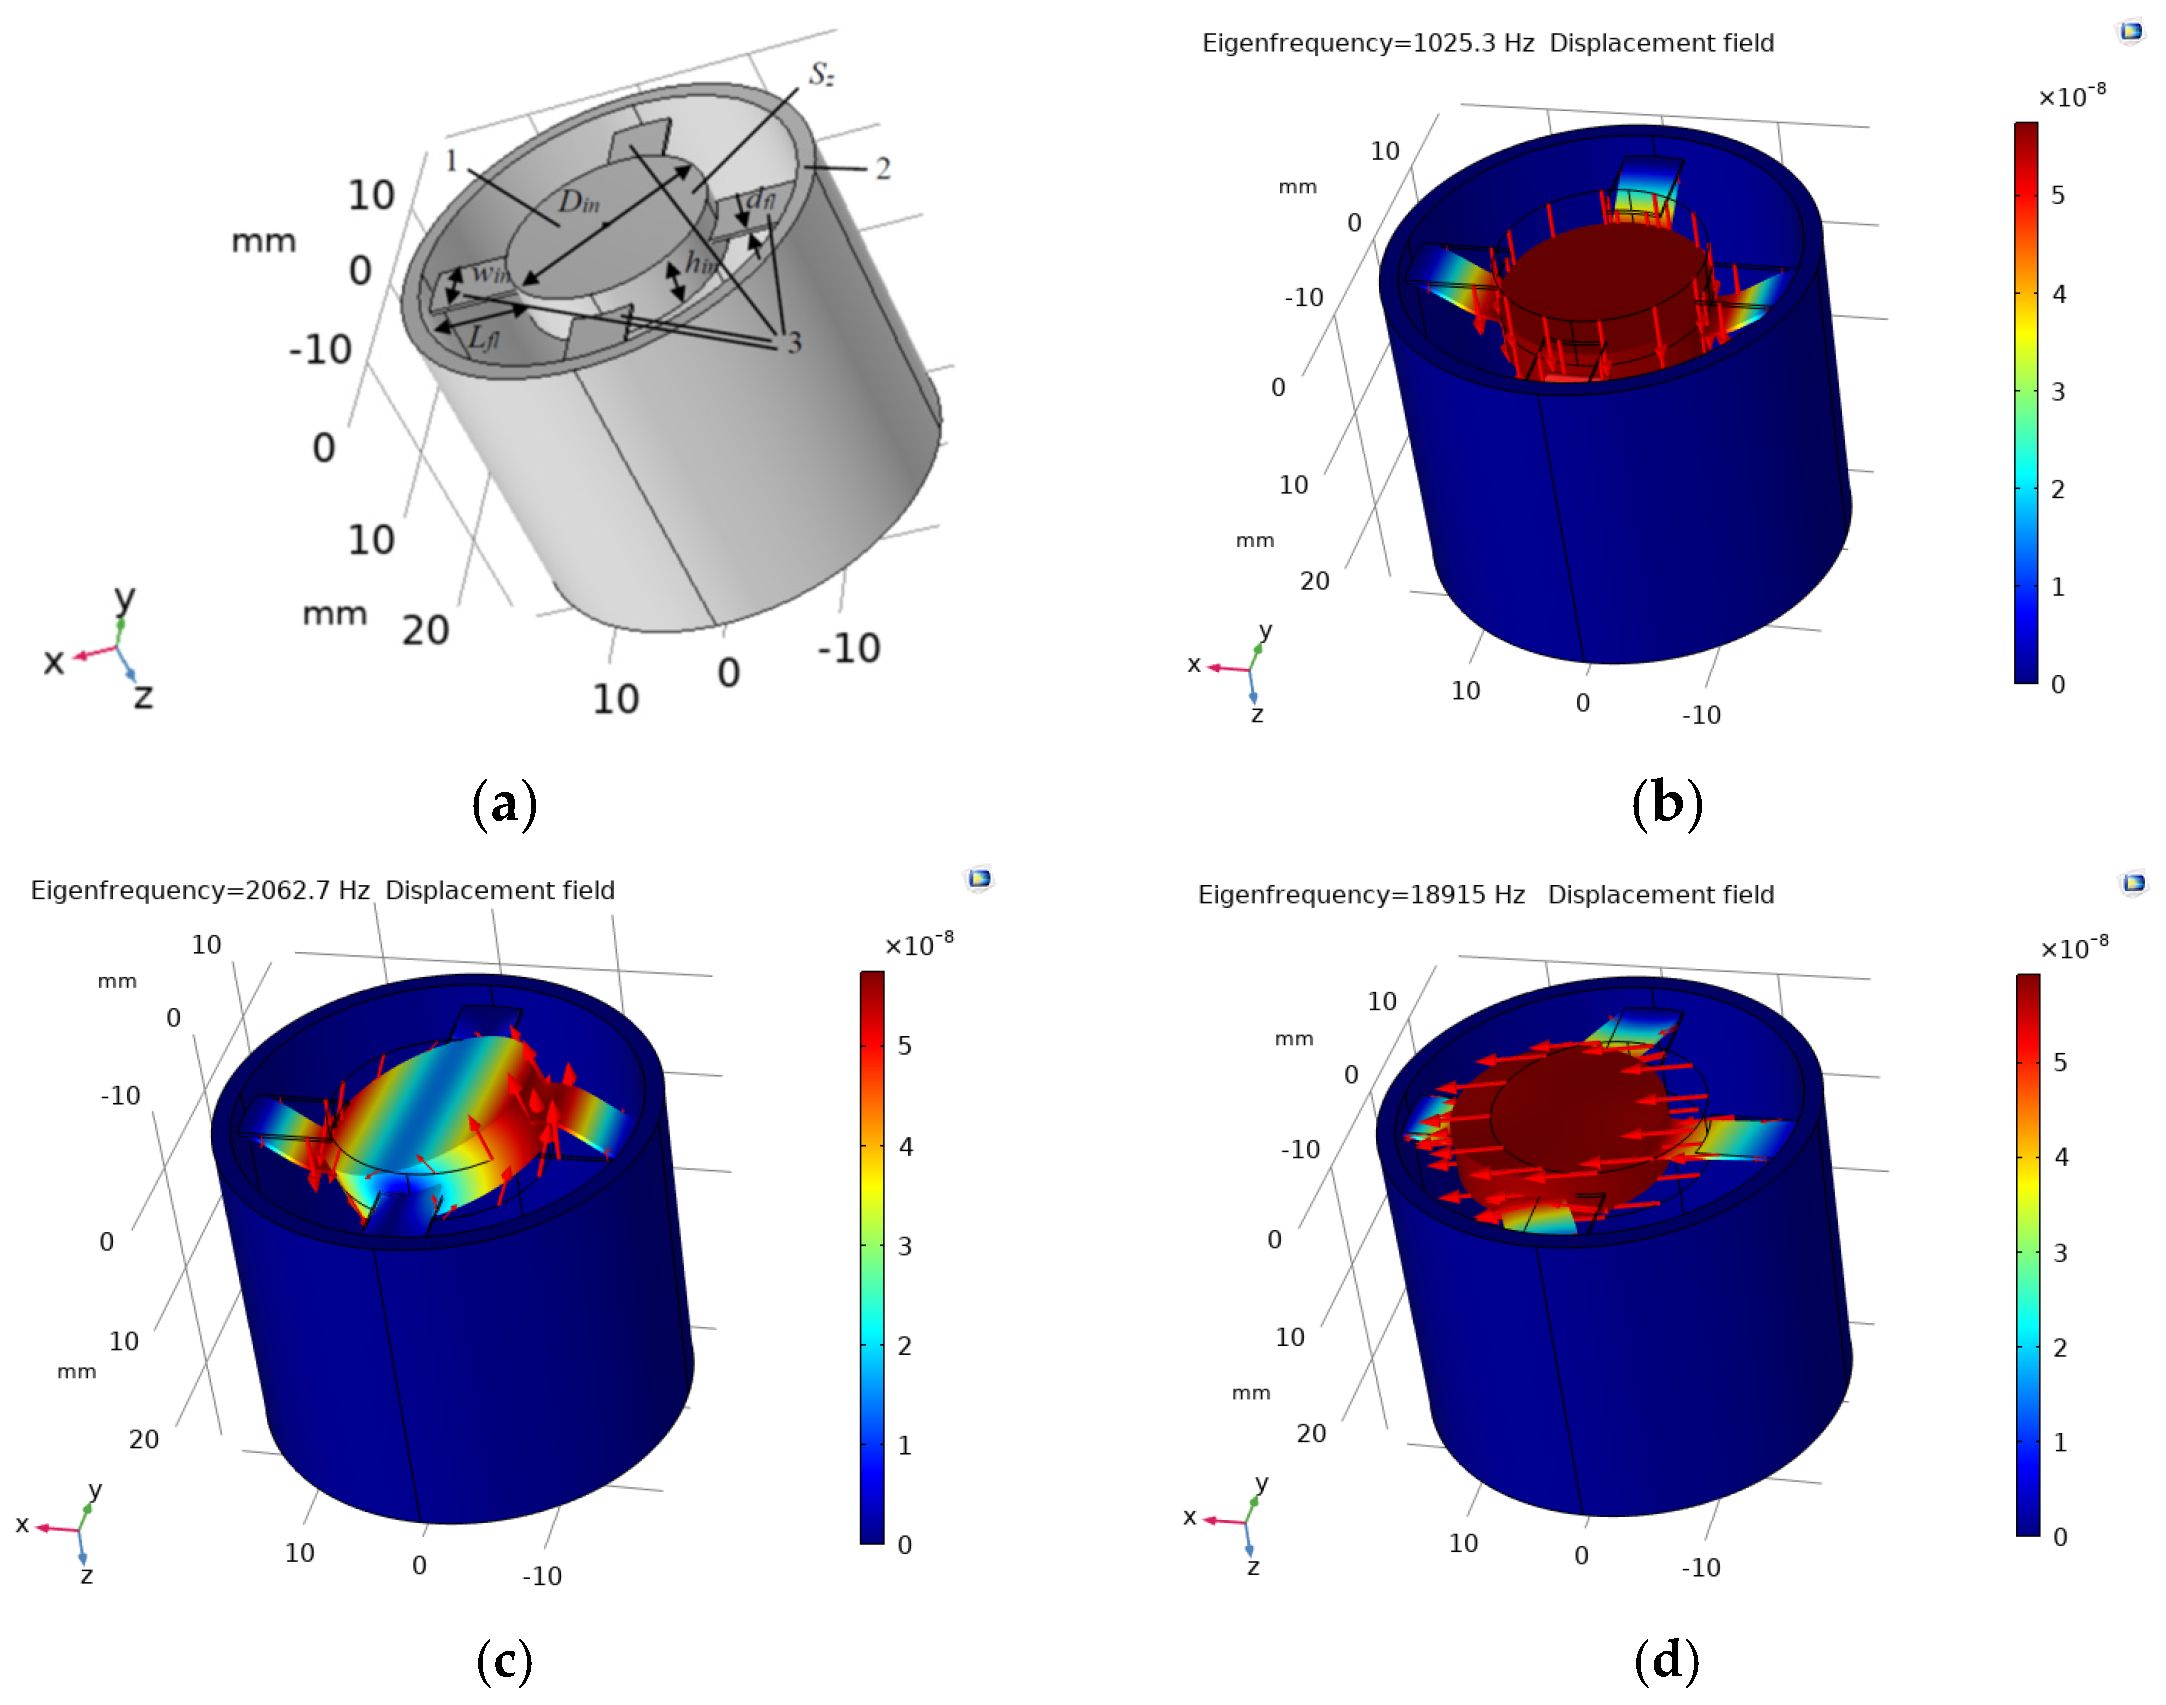
18]. The considered OMAS for acceleration measurements in the z direction is made of fused silica and has the following geometry [10]: the inner cylindrical structure 1 (the OMAS test mass) has a diameter Din = 17.3 mm, a square Sin = 235 mm2, a thickness hin = 4.44 mm, and a mass m = ρfs·π·(Din/2)2·hin = 2.3 g (see Figure 12a). The moving test mass 1, on which a mirror for acceleration measurements is located, fastens to the outer constrained cylinder 2 by four flexures 3 having a length Lfl = 7.6 mm, a width wfl = 5 mm, and a thickness dfl = 310 μm.
To appreciate the output characteristics of the OMAS with such a design, we modeled the mechanical processes in it, considering the thermoelastic viscoelasticity. Figure 12b–d shows calculated displacement mode shapes for the first three eigenfrequencies for this OMAS, where the red arrows present the displacement field. Comparison of the simulated levels of the first three eigenfrequencies with the data from [10] for such an OMAS experimental sample has shown that their relative differences are less than 2%.

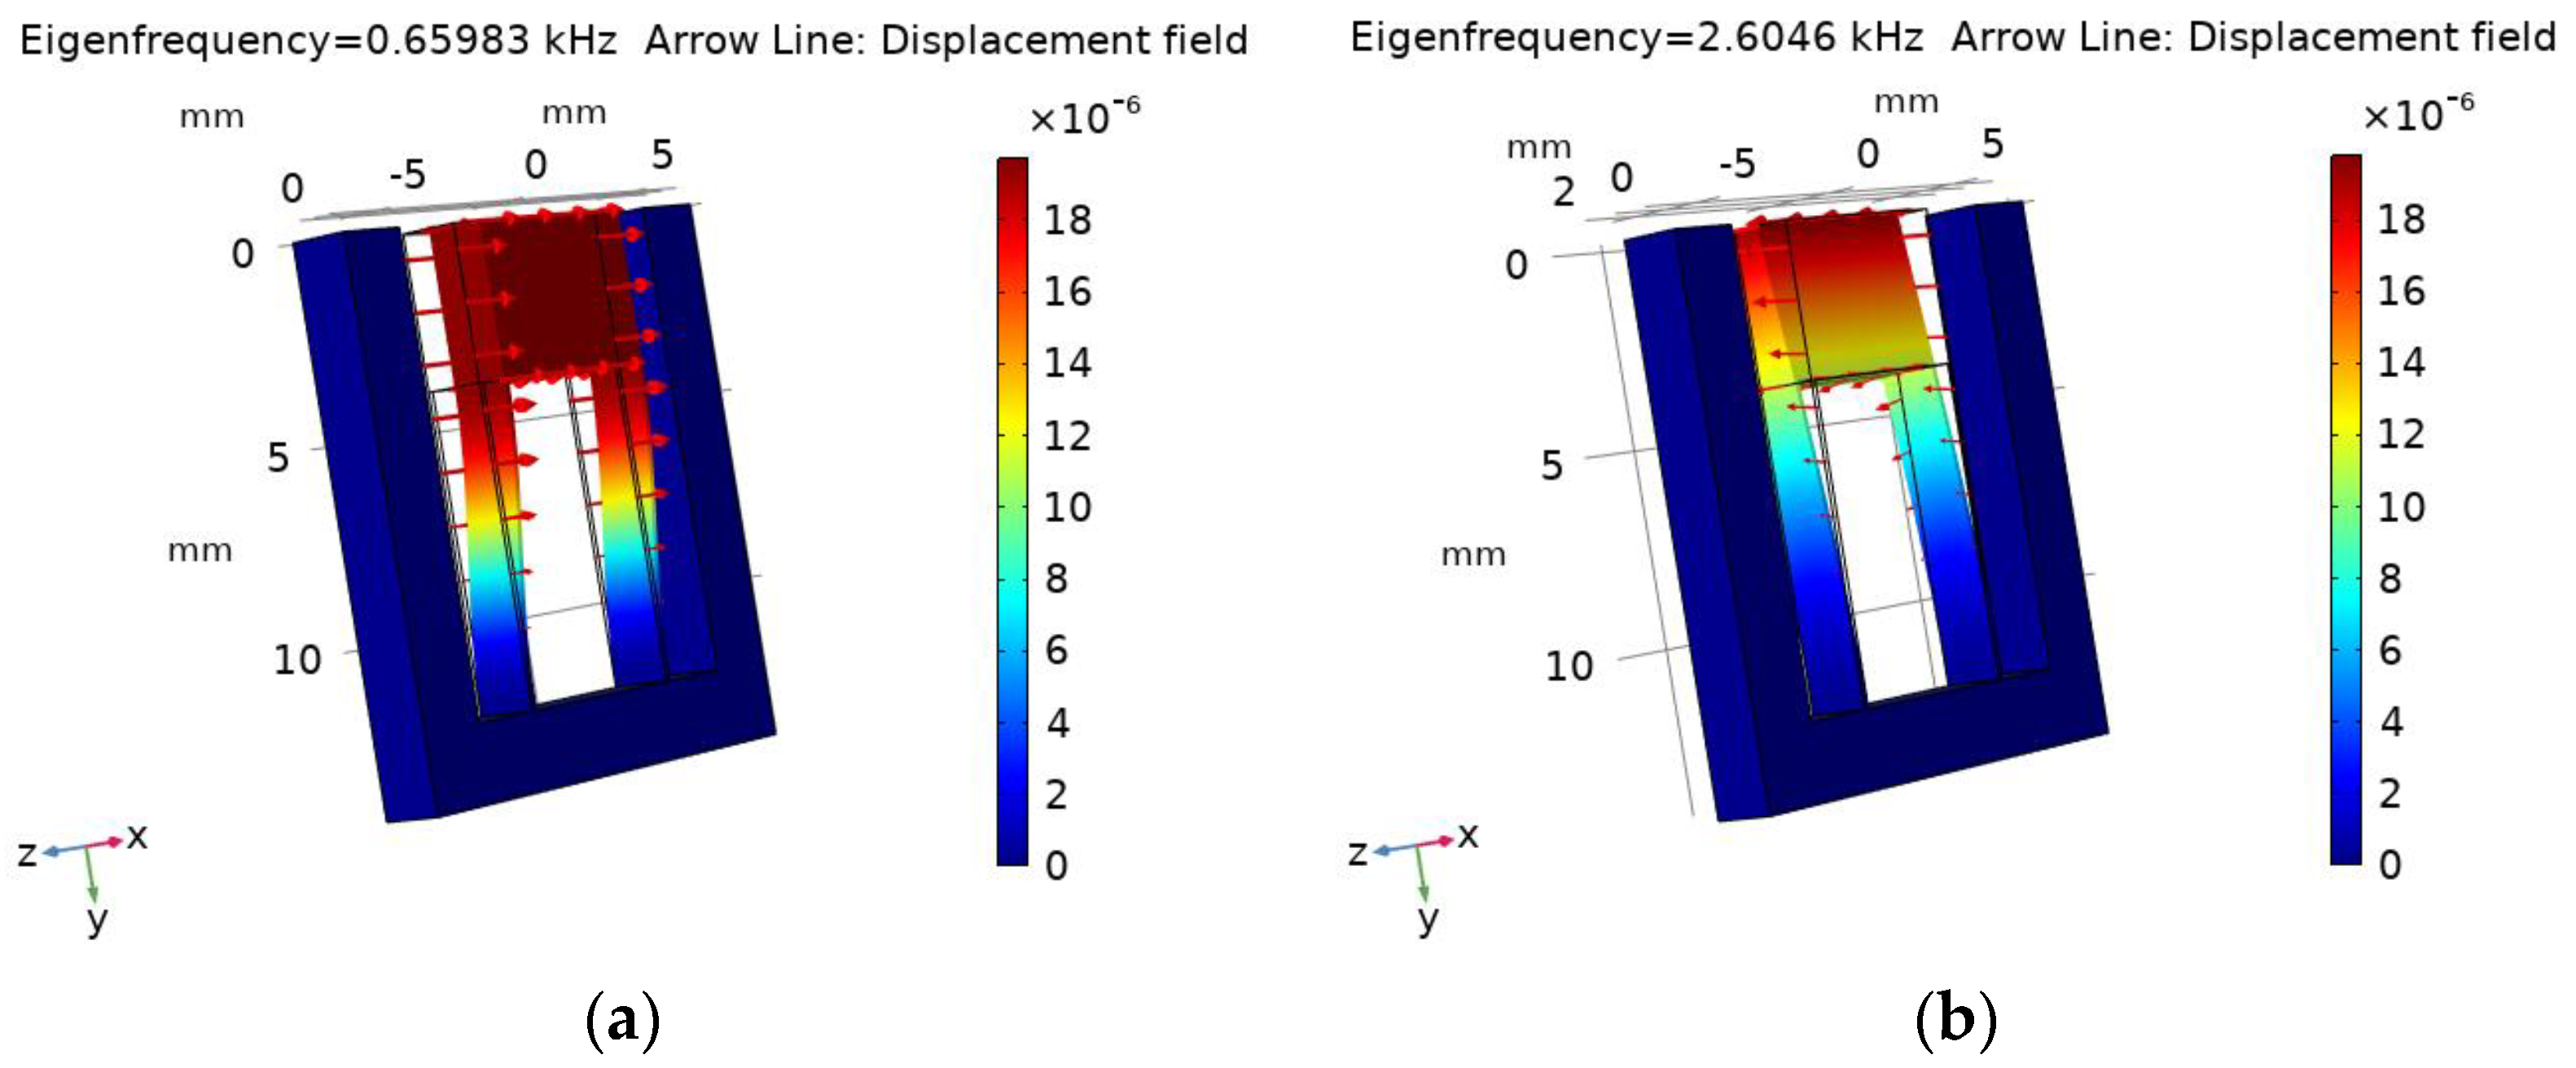
3.1. Designs of the Out-of-Plane OMAS with High Natural Frequencies

To provide a higher frequency of the three-axial acceleration measurements in the z axis direction outside the plane in which we measure accelerations in the x and y directions, we propose an upgraded design of the sensor. The purpose of upgrading the OMAS design was also to provide a reduction in the influence of higher harmonics and forces in directions perpendicular to the direction of measurement on the levels of measured accelerations.
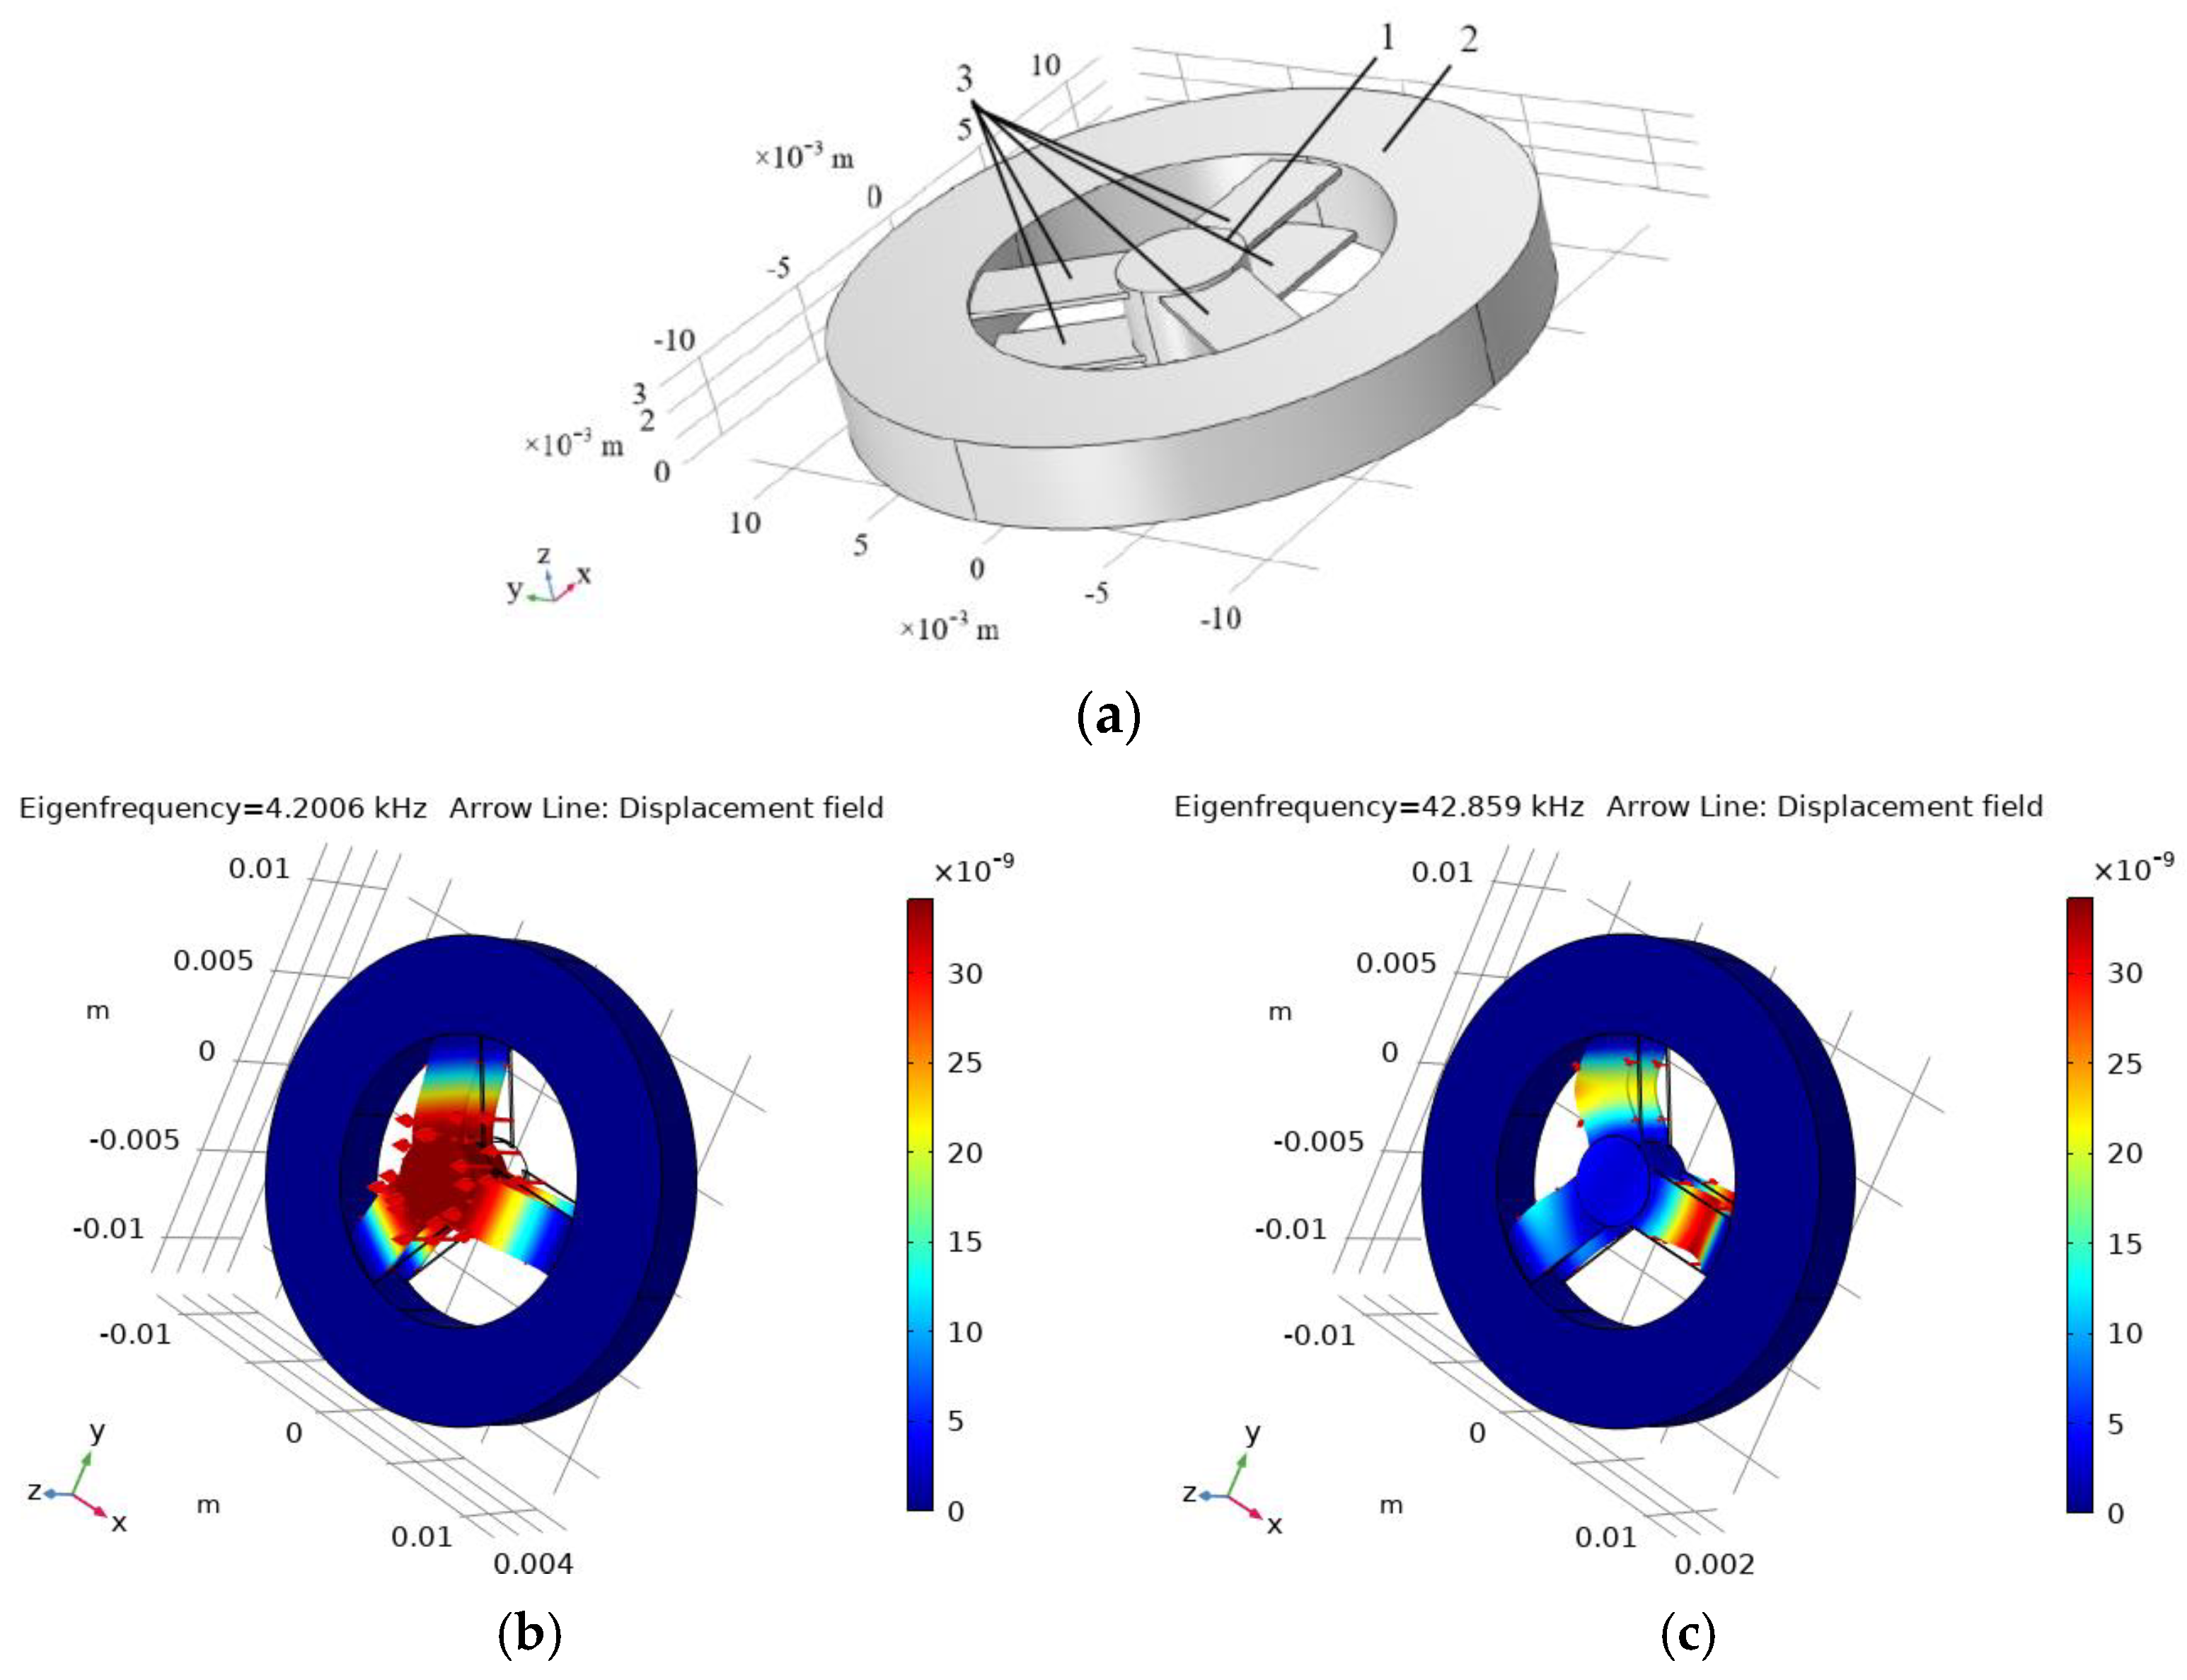
To achieve the higher levels of natural frequencies, it is proposed that we use three pairs of flexures 3 connecting the moving 1 and constrained 2 parts of the OMAS (see Figure 13a). In each such pair, the flexures are located one above the other so that one is attached to the lower and the other to the upper parts of the test mass 1 and the constrained structure 2. Such an OMAS has the following geometry: the OMAS test mass 1 has a diameter Din = 4.4 mm, a thickness hin = 3 mm, and a mass m = ρfs·π·(Din/2)2·hin = 0.1 mg. The moving test mass 1, on which a mirror for the acceleration measurements is located, is fastened to the outer cylinder 2 by six flexures 3 having a length Lfl = 5 mm, a width wfl = 3 mm, and a thickness dfl = 200 μm. The material is fused silica.
This OMAS design makes it possible to increase the first eigenfrequency by more than 4 times, as well as the ratio between the second and first eigenfrequencies from 2 to 10 compared to the OMAS prototype (see Figure 12b,c and Figure 13b,c).
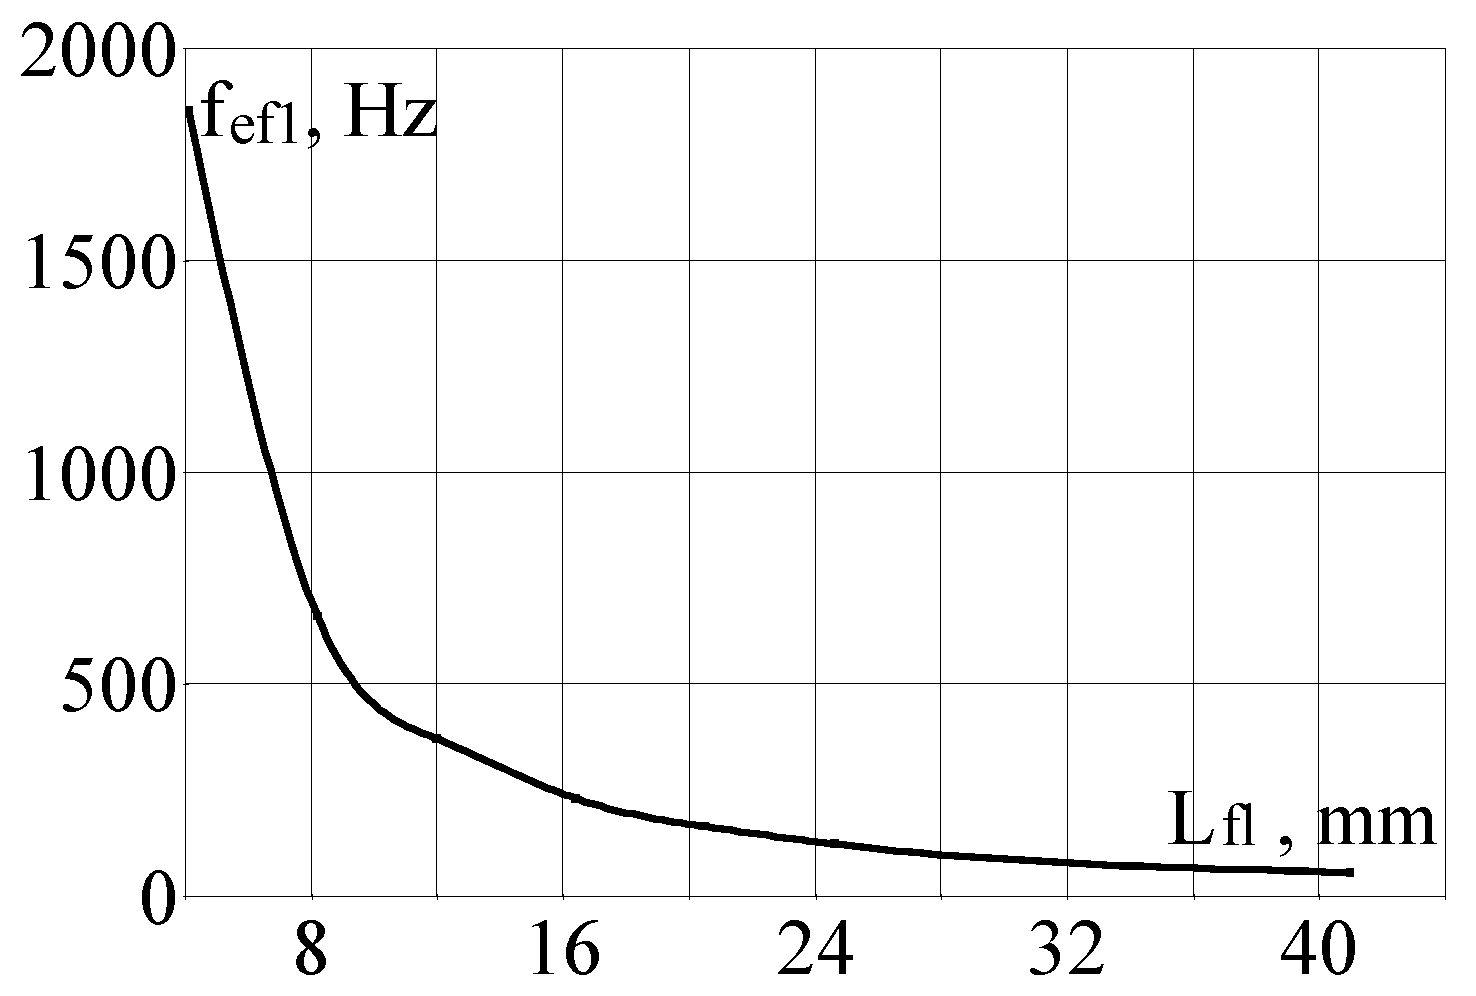
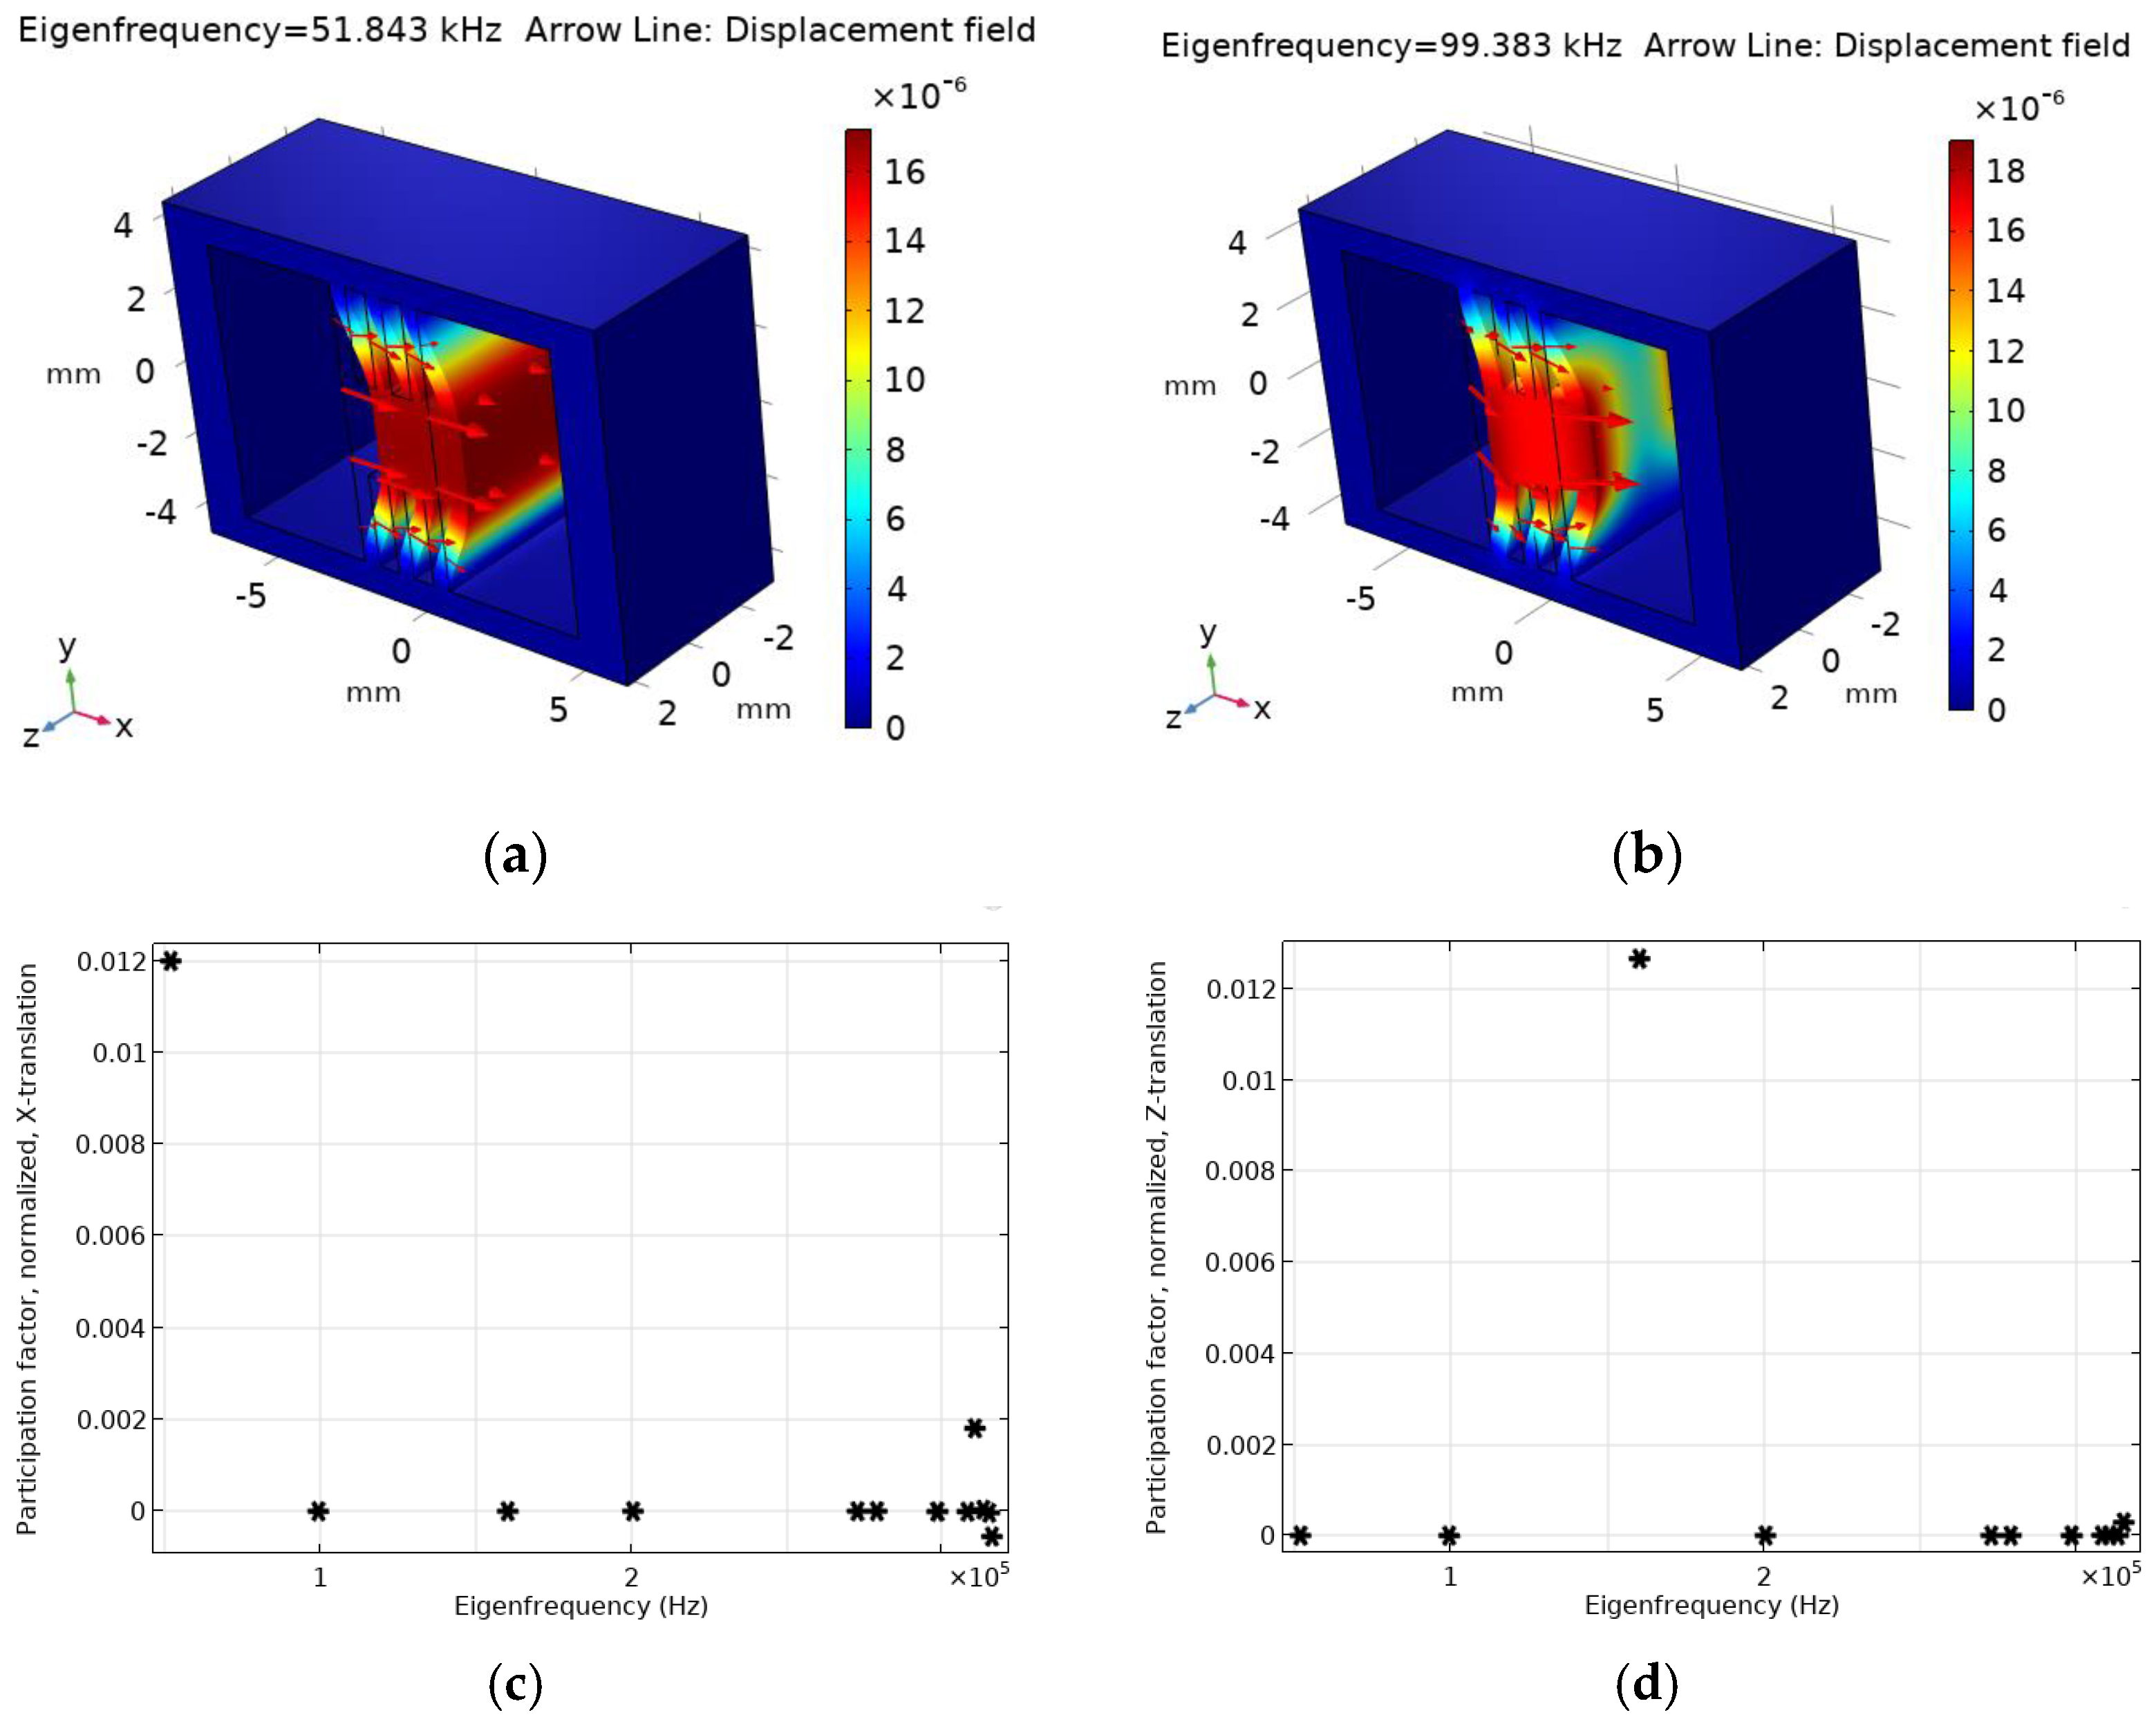
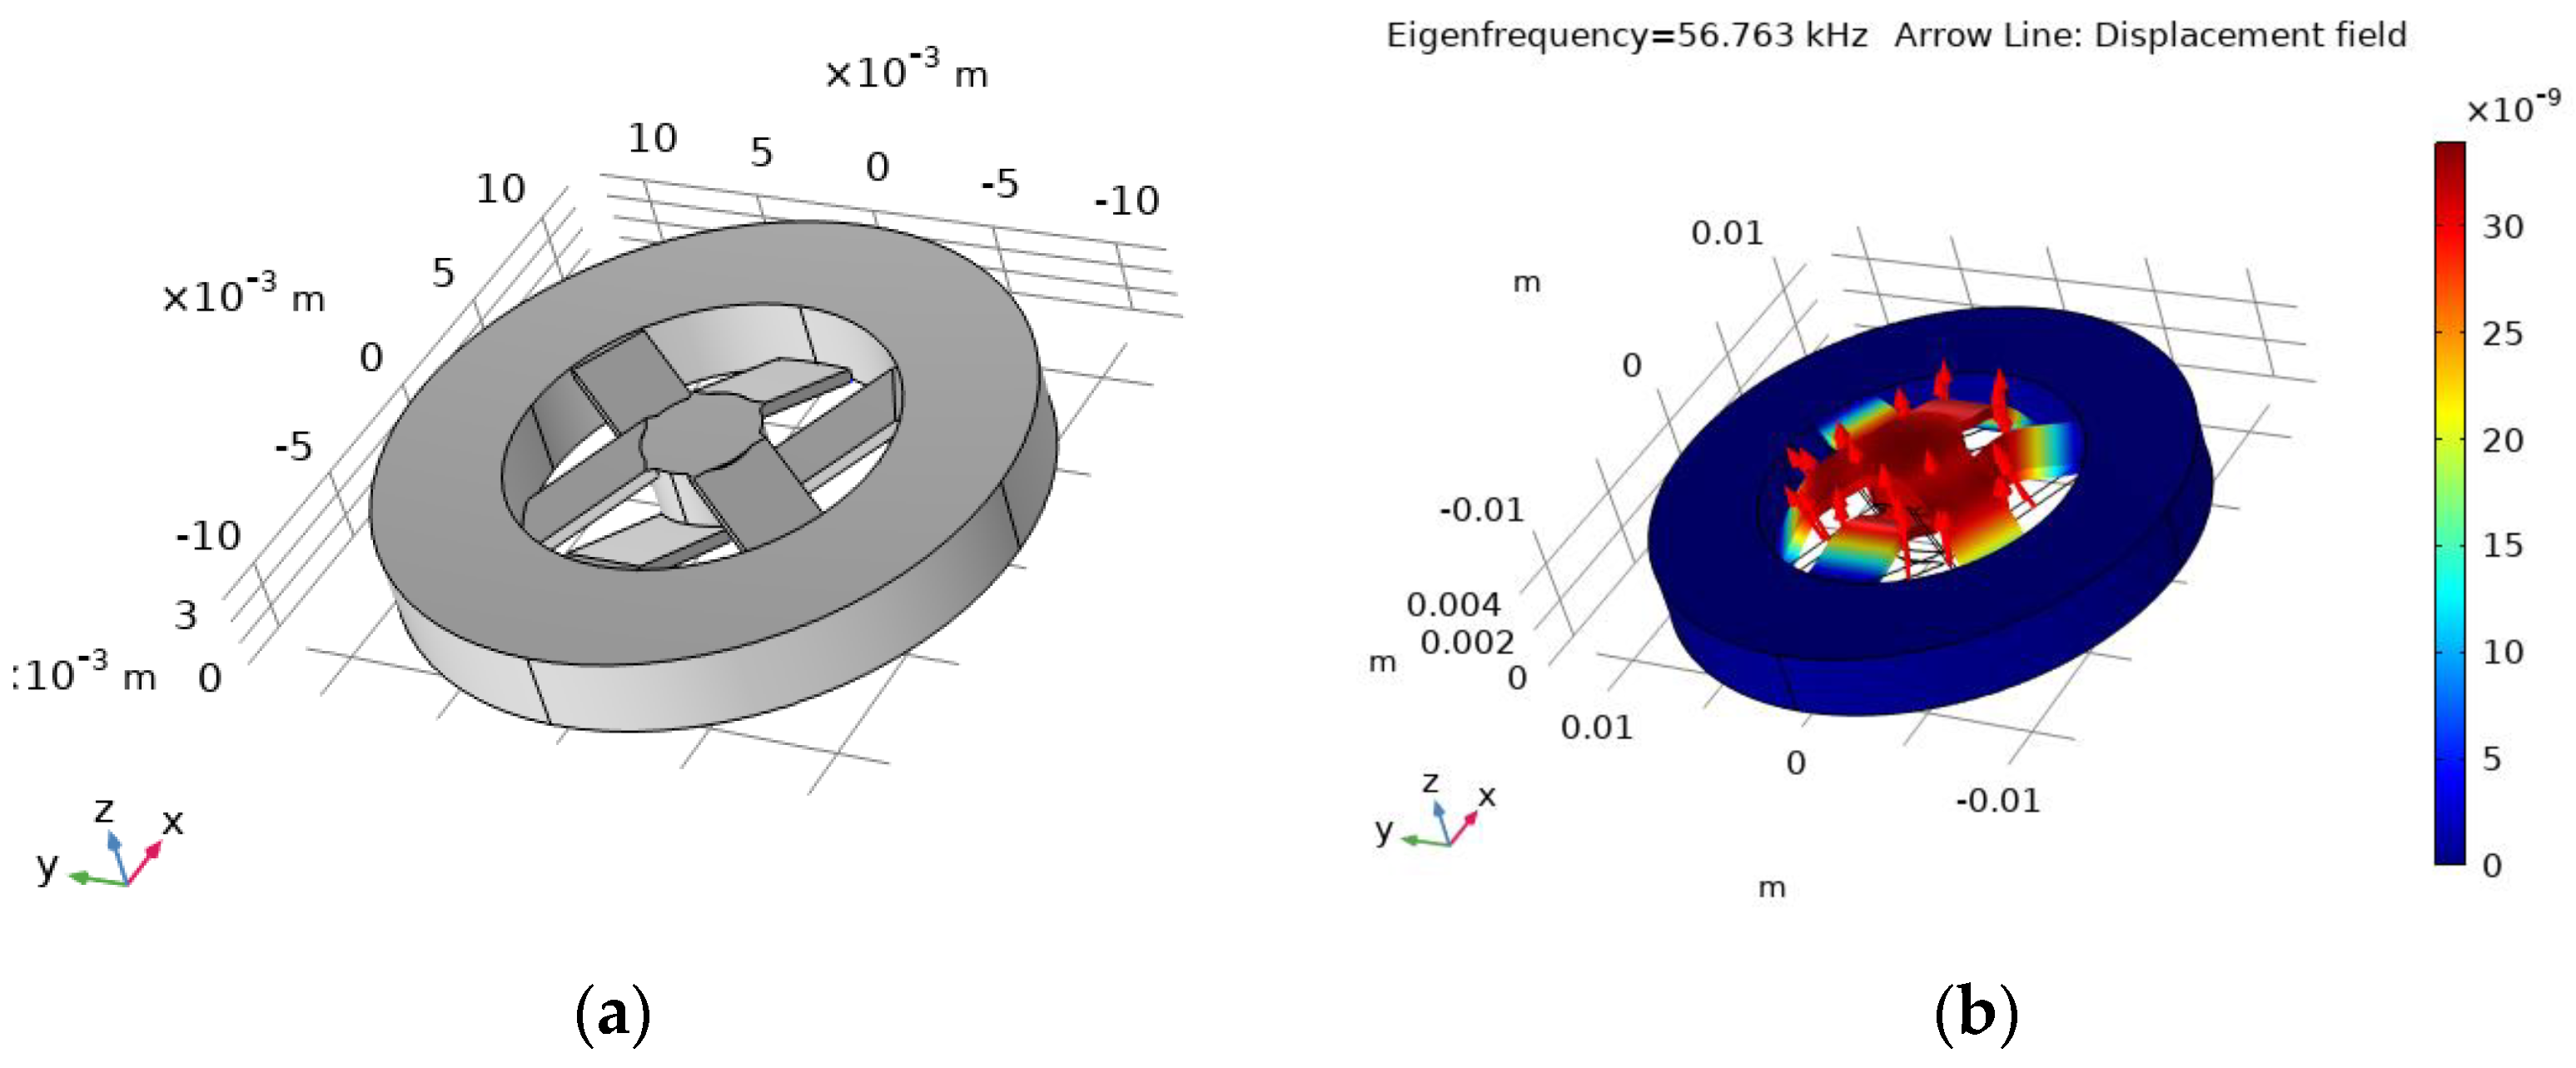
To further increase the level of natural frequencies, the OMAS-improved design is proposed (see Figure 14a), differing from that shown in Figure 13a in such a way that three of the flexures are attached with one end to the top of the test mass and the other end is attached to the bottom of the outer constrained ring. And, vice versa, another three flexures are attached with one end to the bottom of the test mass, and the other end is attached to the top of the outer constrained ring. To eliminate cross-talk with other directions, the flexures are connected identically through one (see Figure 14a). This OMAS configuration can provide the levels of the first eigenfrequency up to 56 kHz (see Figure 14b).
Such an OMAS made of fused silica has the following geometry: the test mass with a diameter Din = 4.4 mm, a thickness hin = 3 mm, a mass m = ρfs·π·(Din/2)2·hin = 0.1 mg, flexures length Lfl = 5 mm, a width wfl = 3 mm, and a thickness dfl = 500 μm.
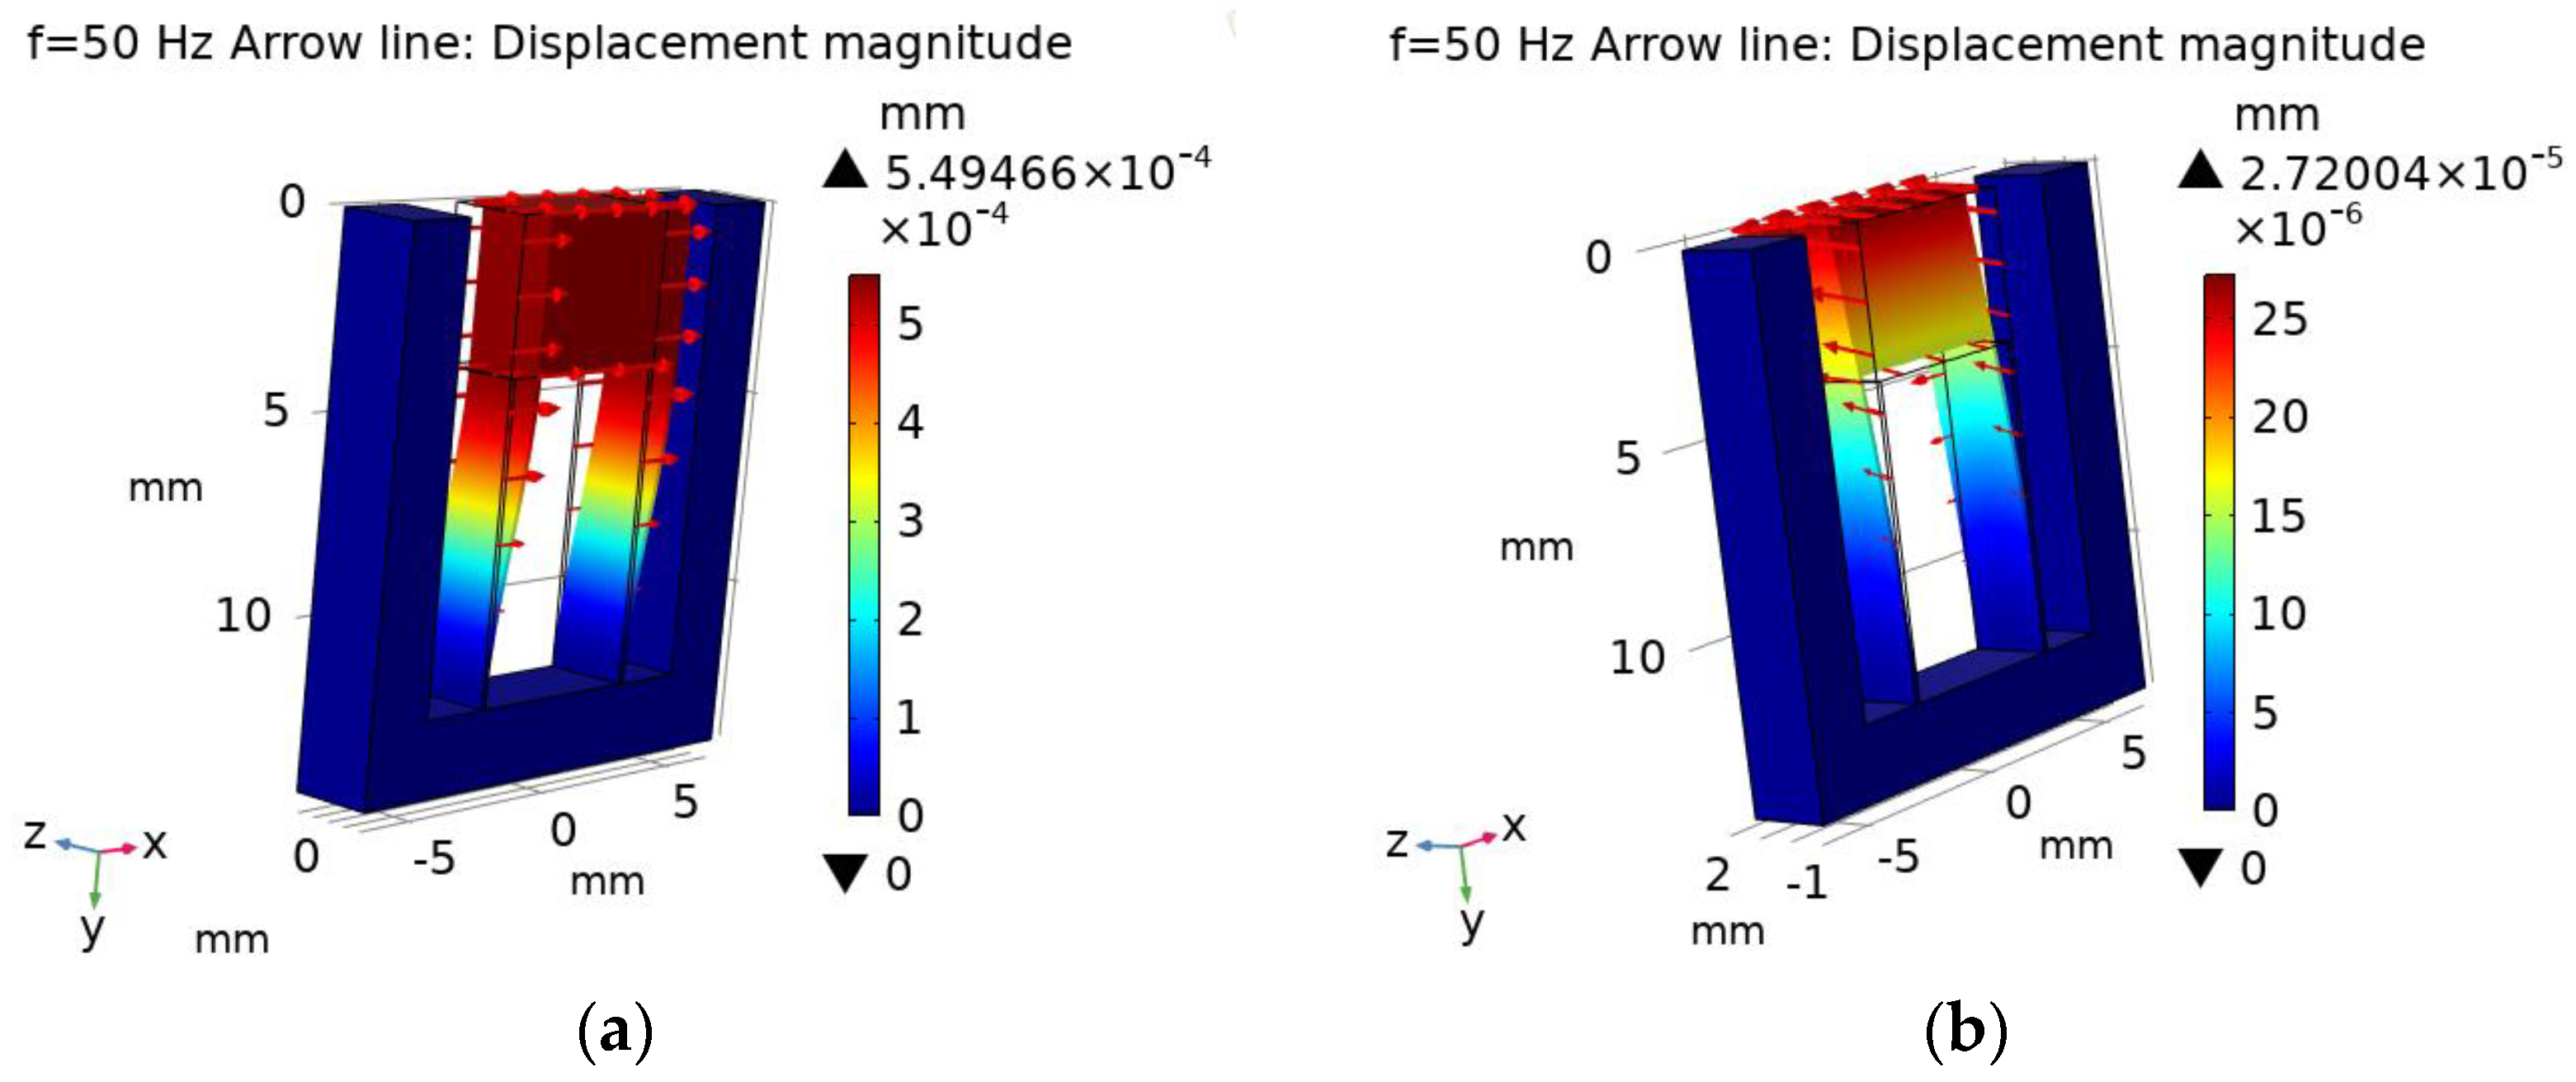
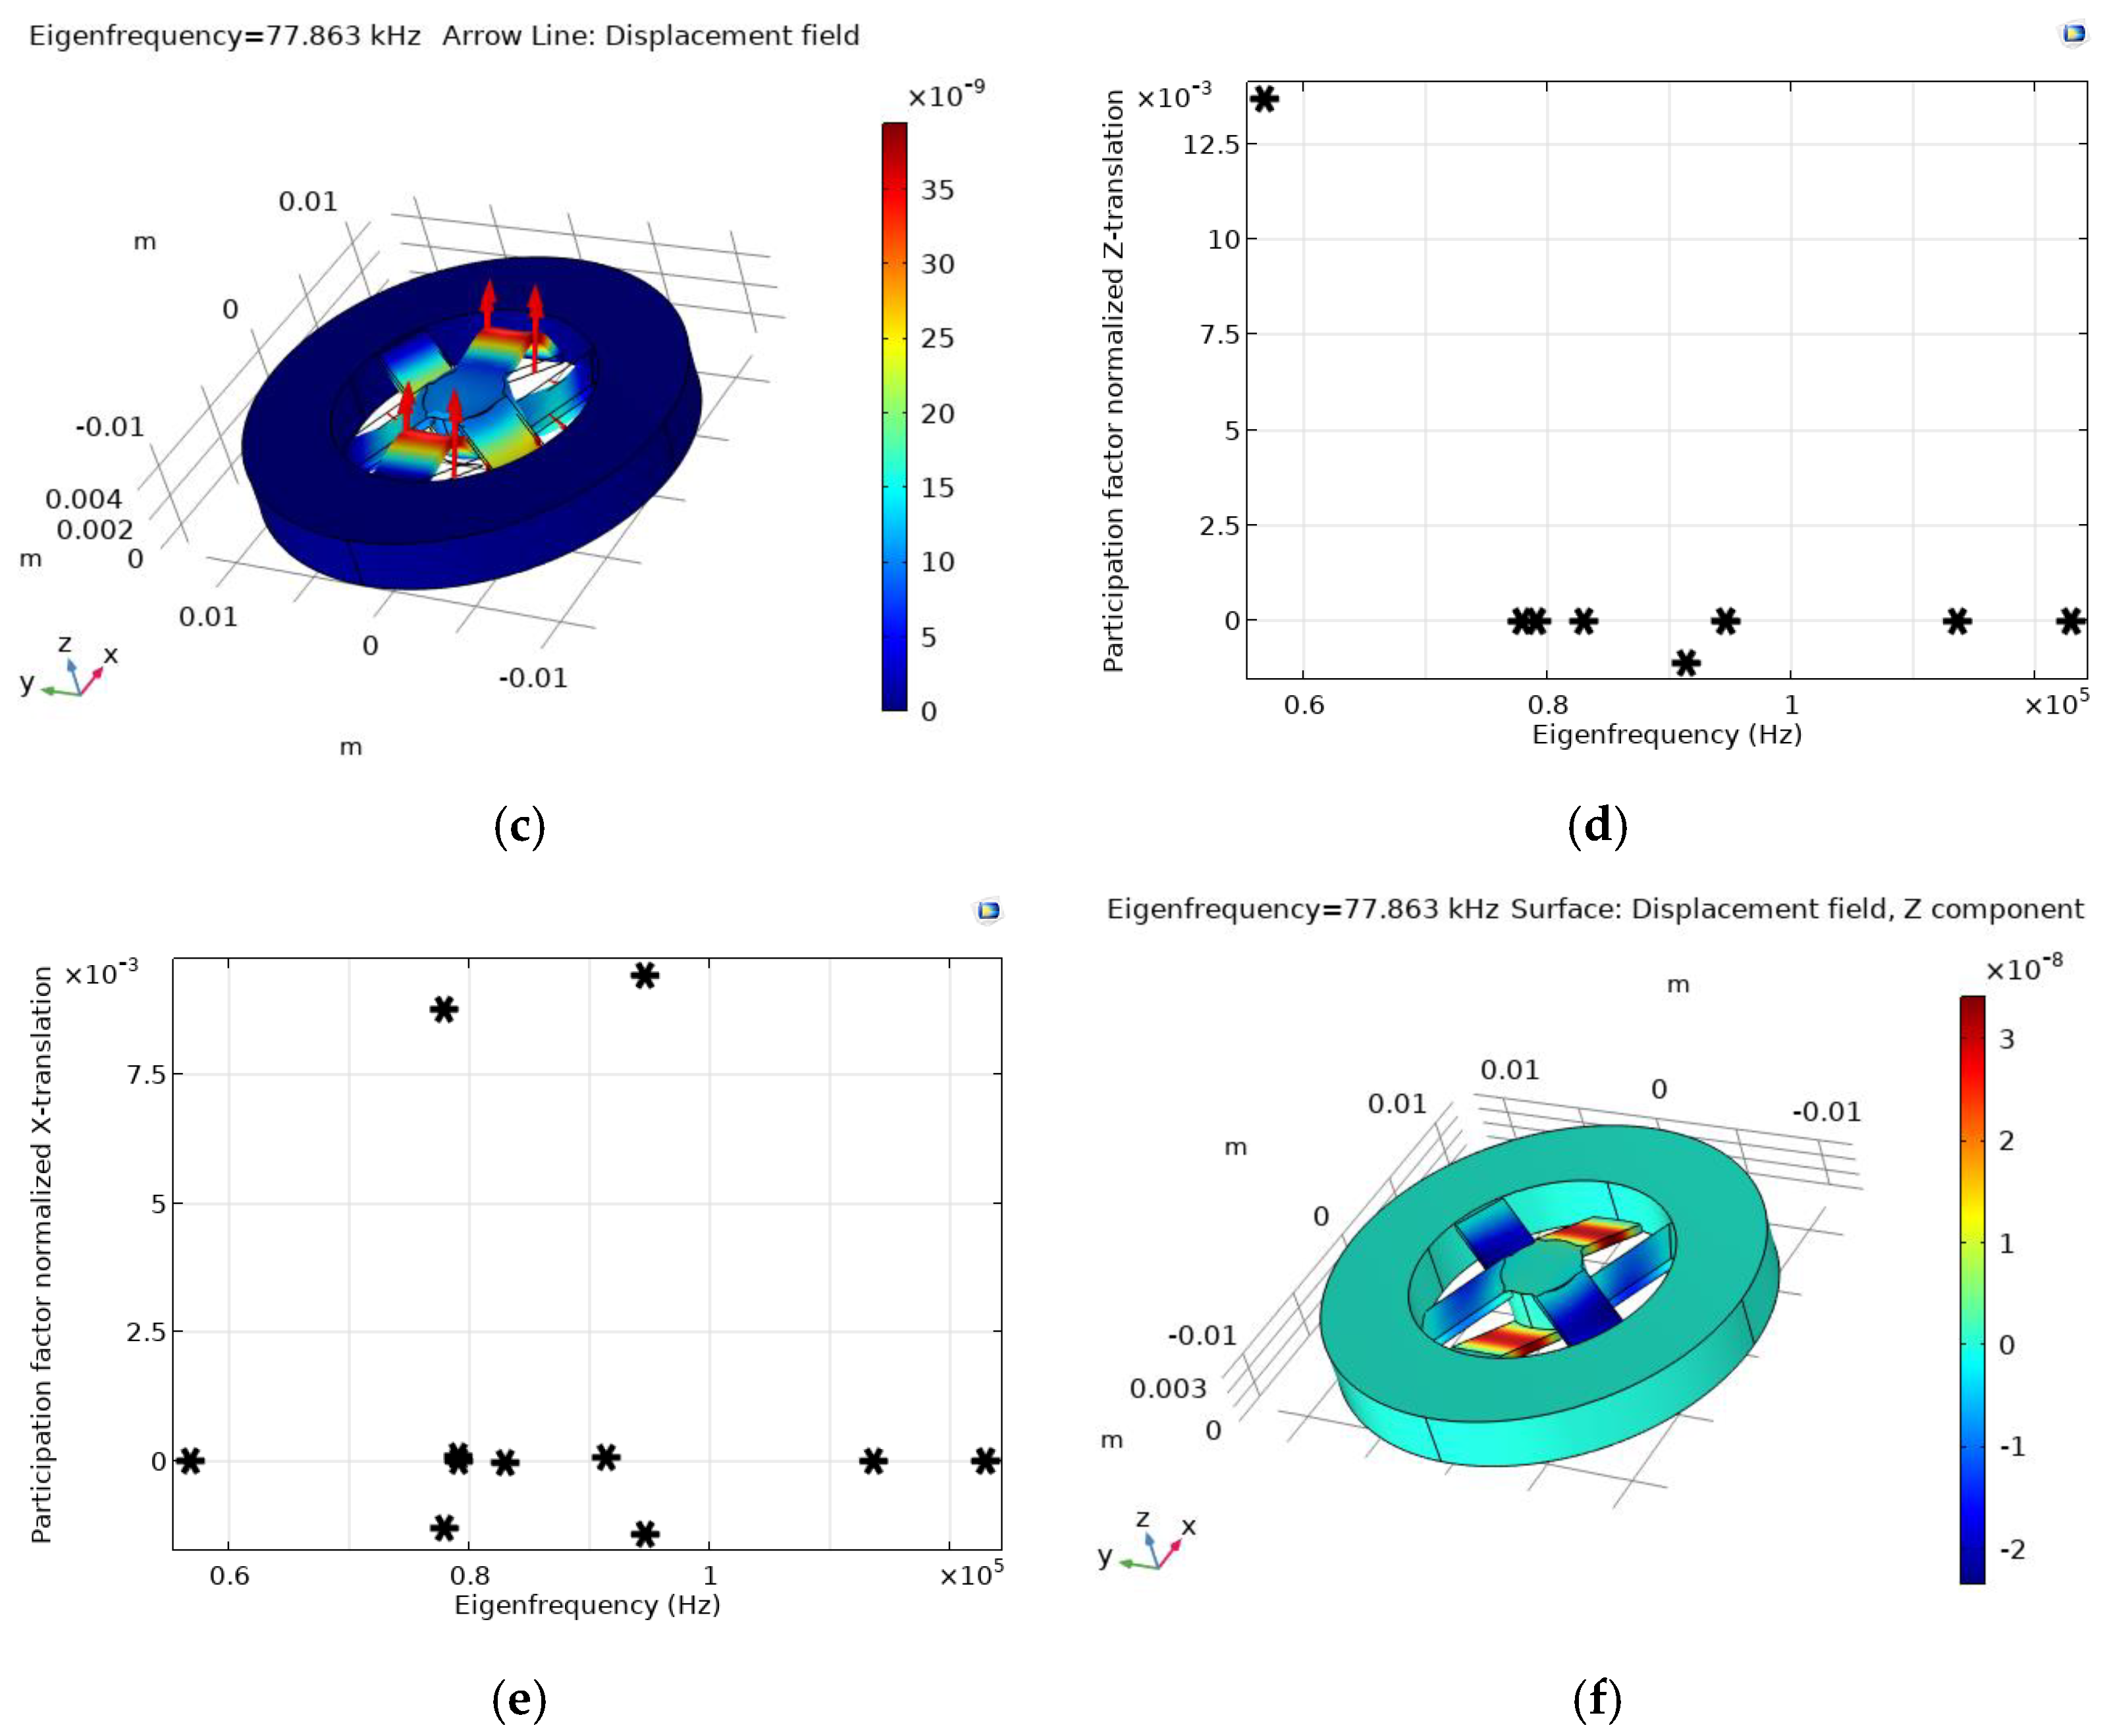
Only the participation factors of the X and Z translations are presented because, due to the symmetrical OMAS design, the participation factors of the Y translation are identical to those of X. As follows from the calculations, the value of the participation factor of the second eigenfrequency in the x direction perpendicular to the direction of measured acceleration (z), is comparable to the participation factor for the first eigenfrequency in the z direction (see Figure 14d,e). However, for the second eigenmode, we only have a displacement of the flexures in the z direction and no displacements of the test mass in this direction (see Figure 14f). This shows that cross-talk with the directions perpendicular to the z directions is negligible. We also used numerical modeling, which involved applying the acceleration at a frequency equal to the second eigenfrequency in the x or y directions and estimating the magnitude of the displacement of the test mass in this case compared to its displacement in the z direction. We found that the magnitude of such a displacement of the test mass in the z direction at the second eigenfrequency is an order of magnitude smaller than in the perpendicular directions.
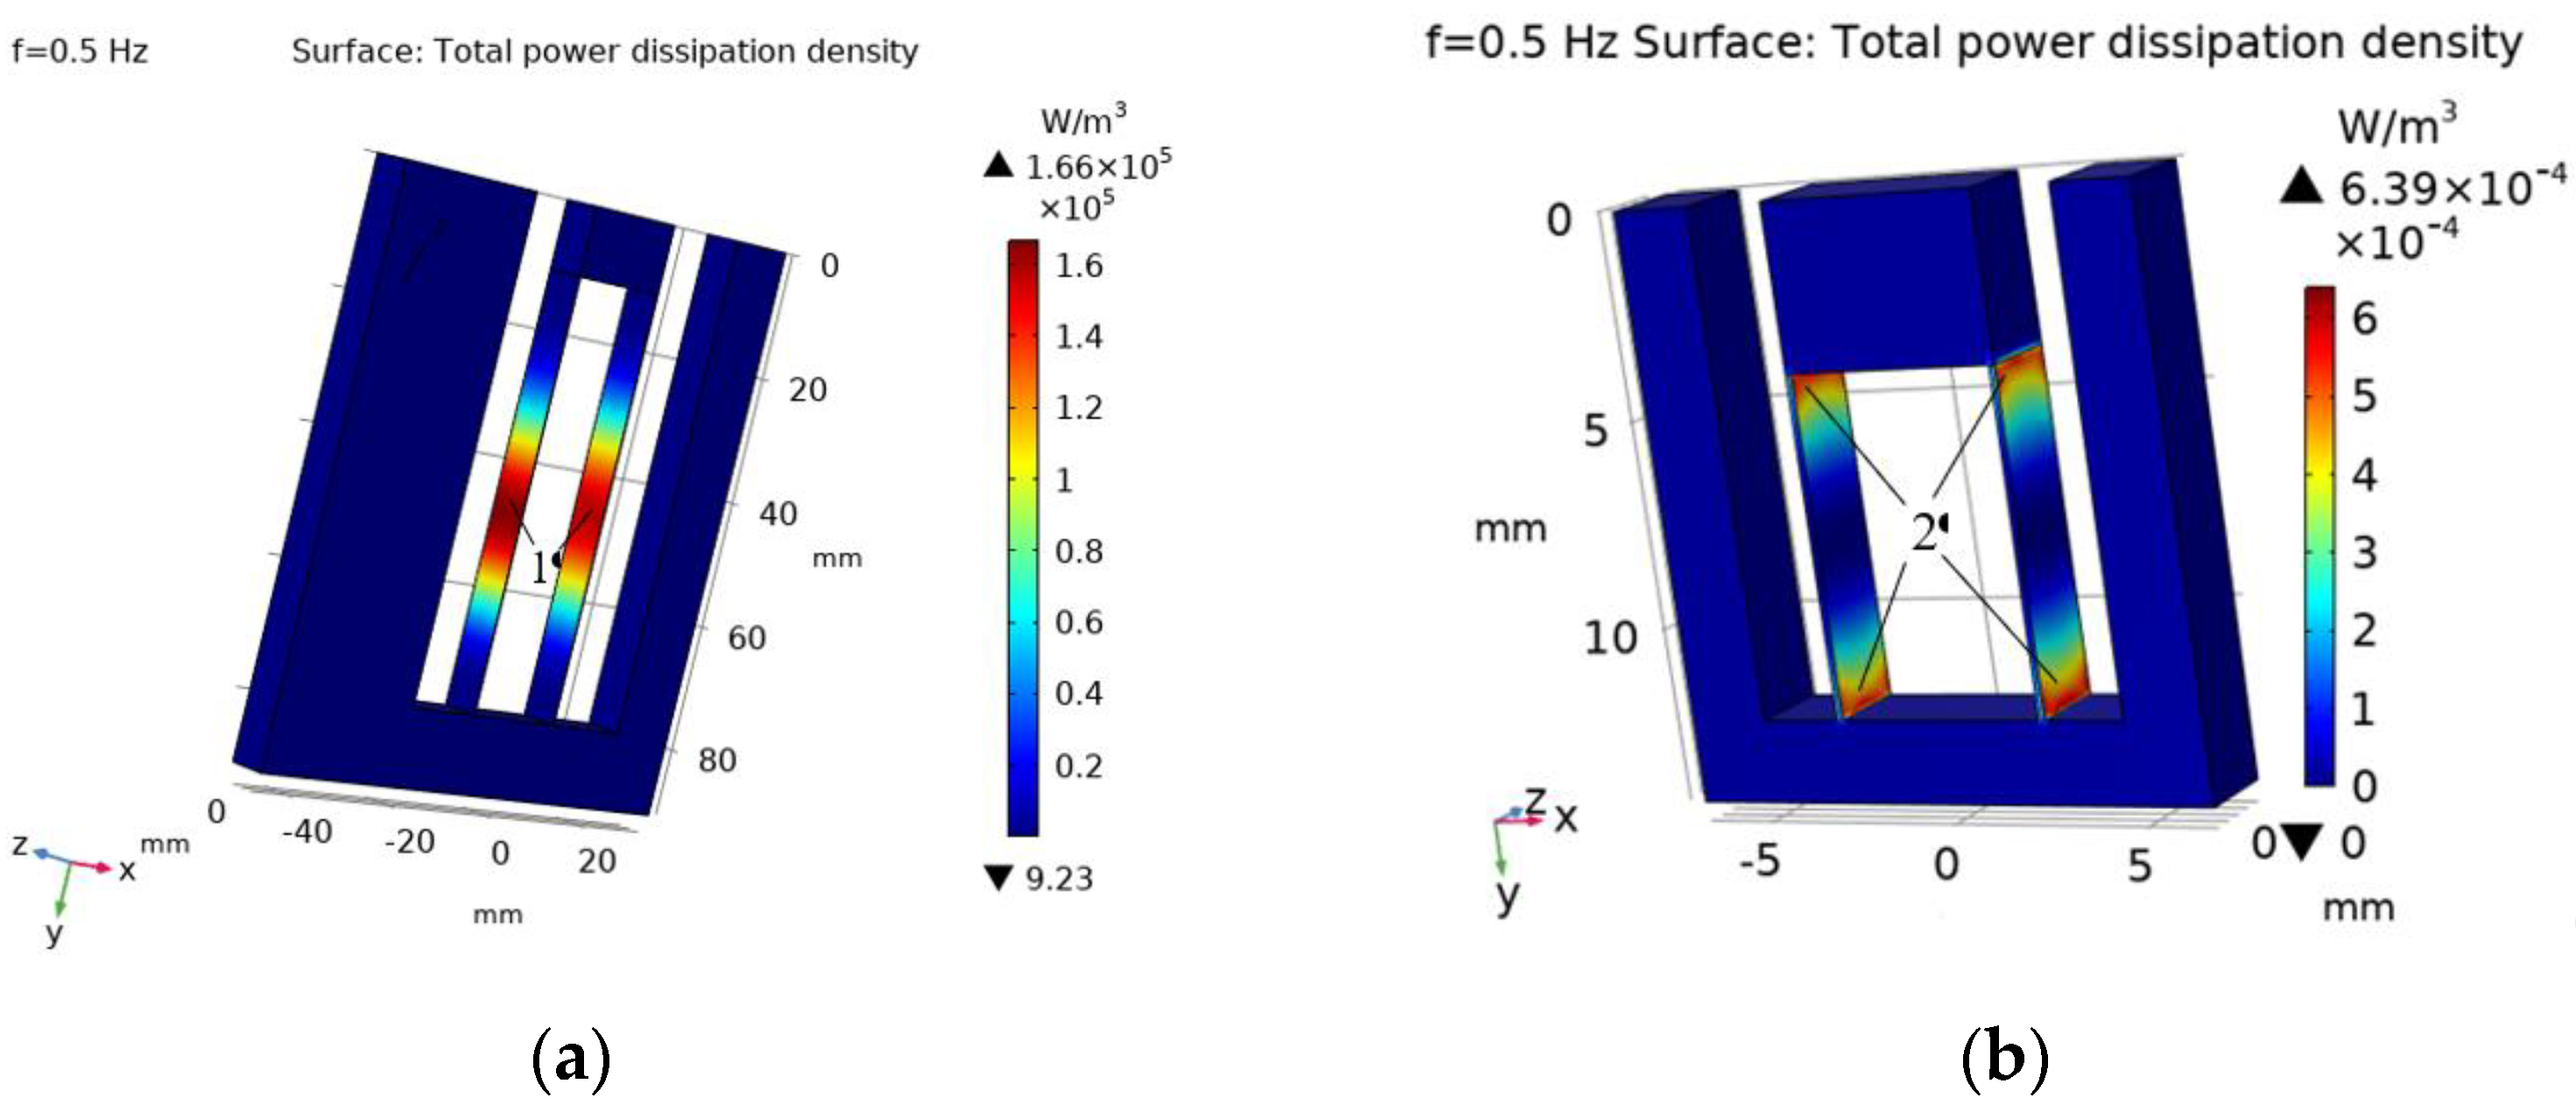
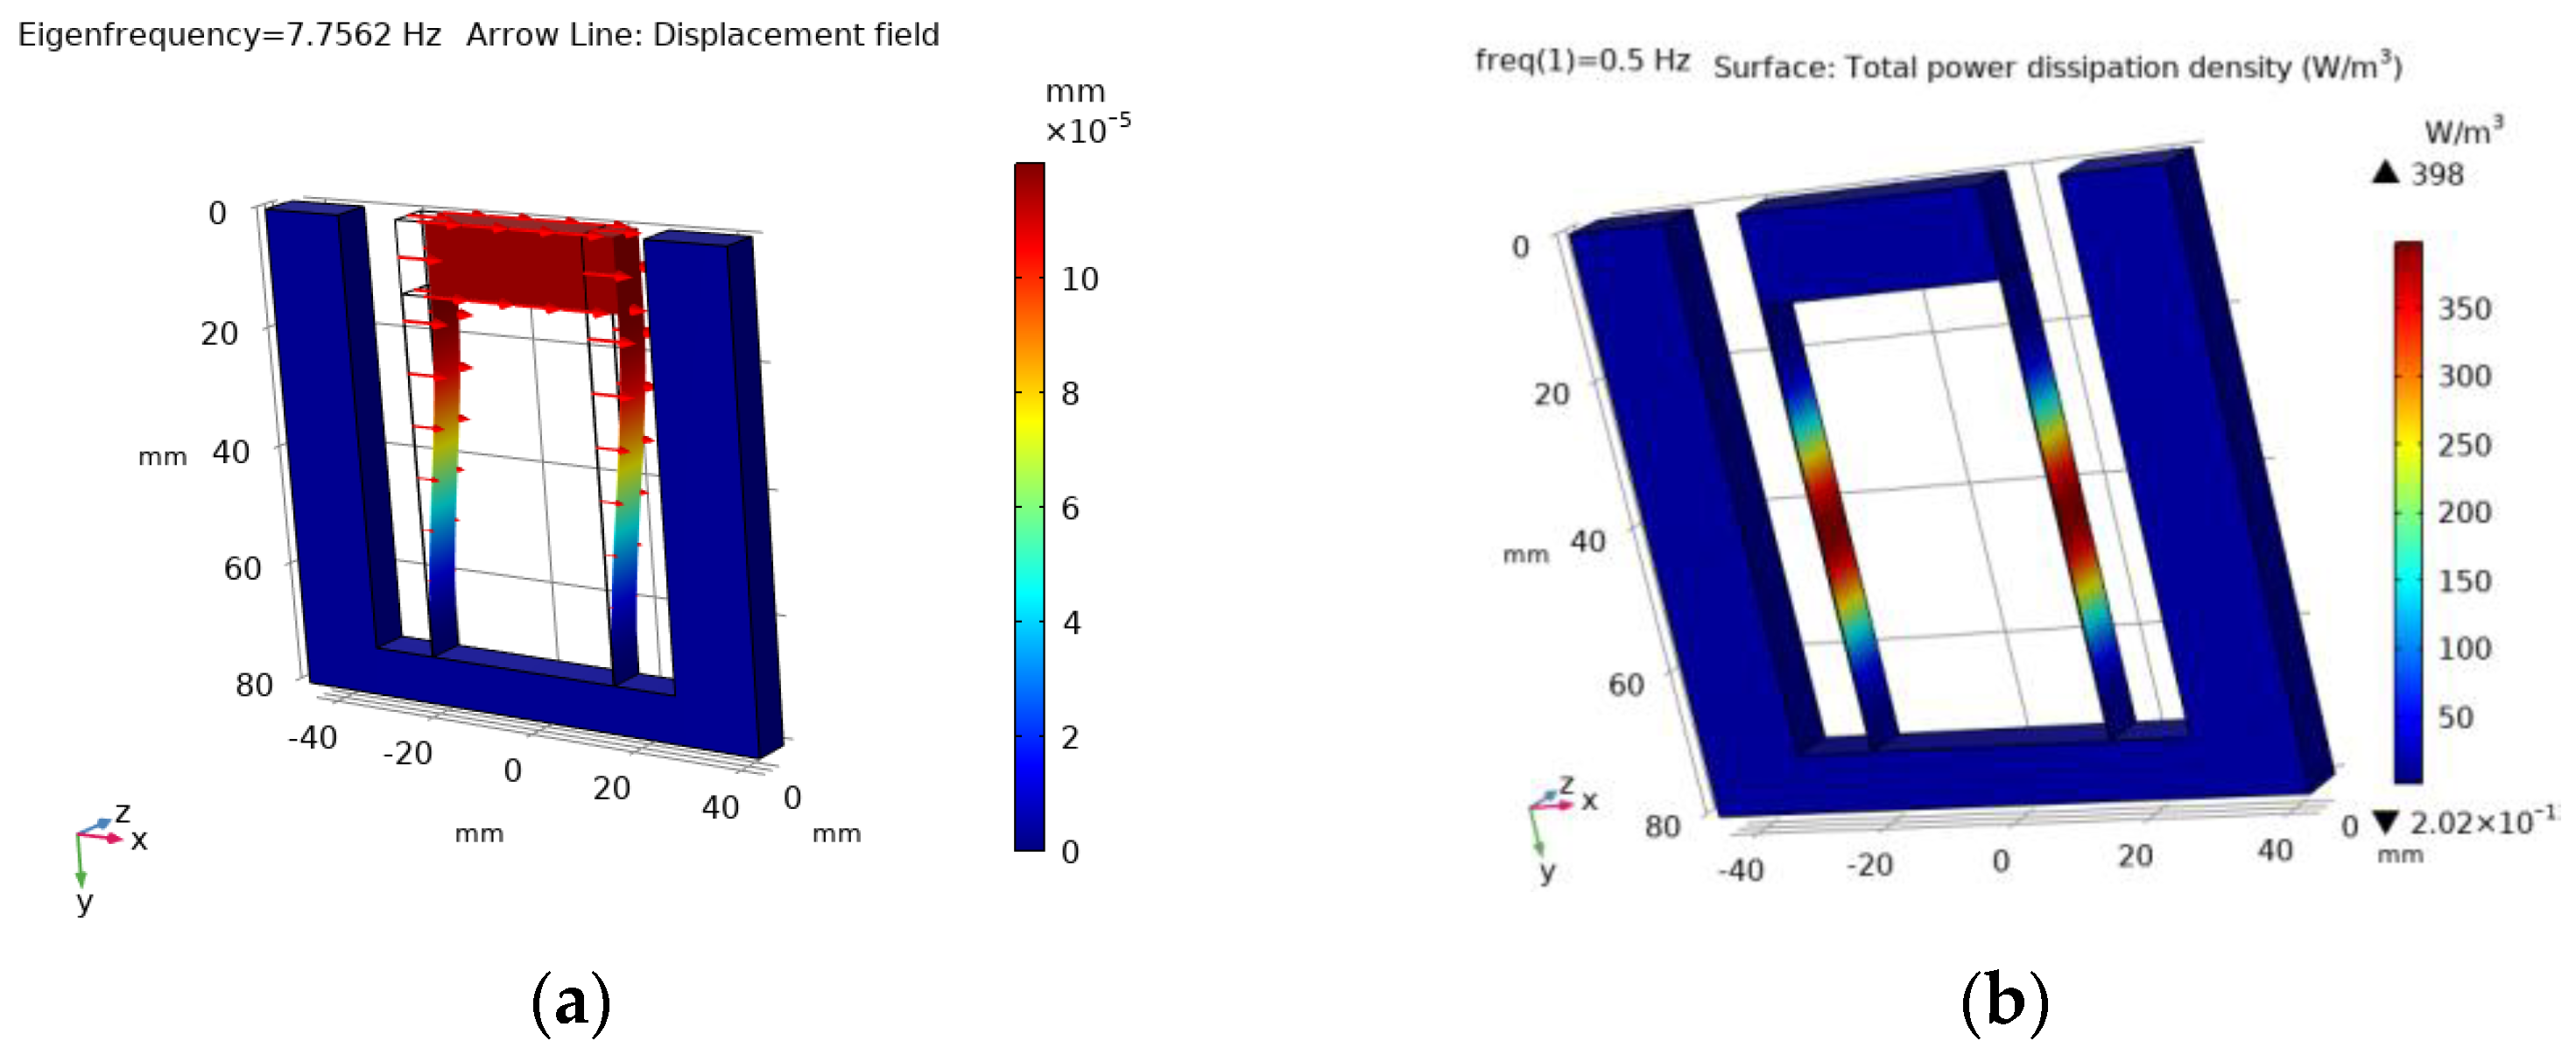
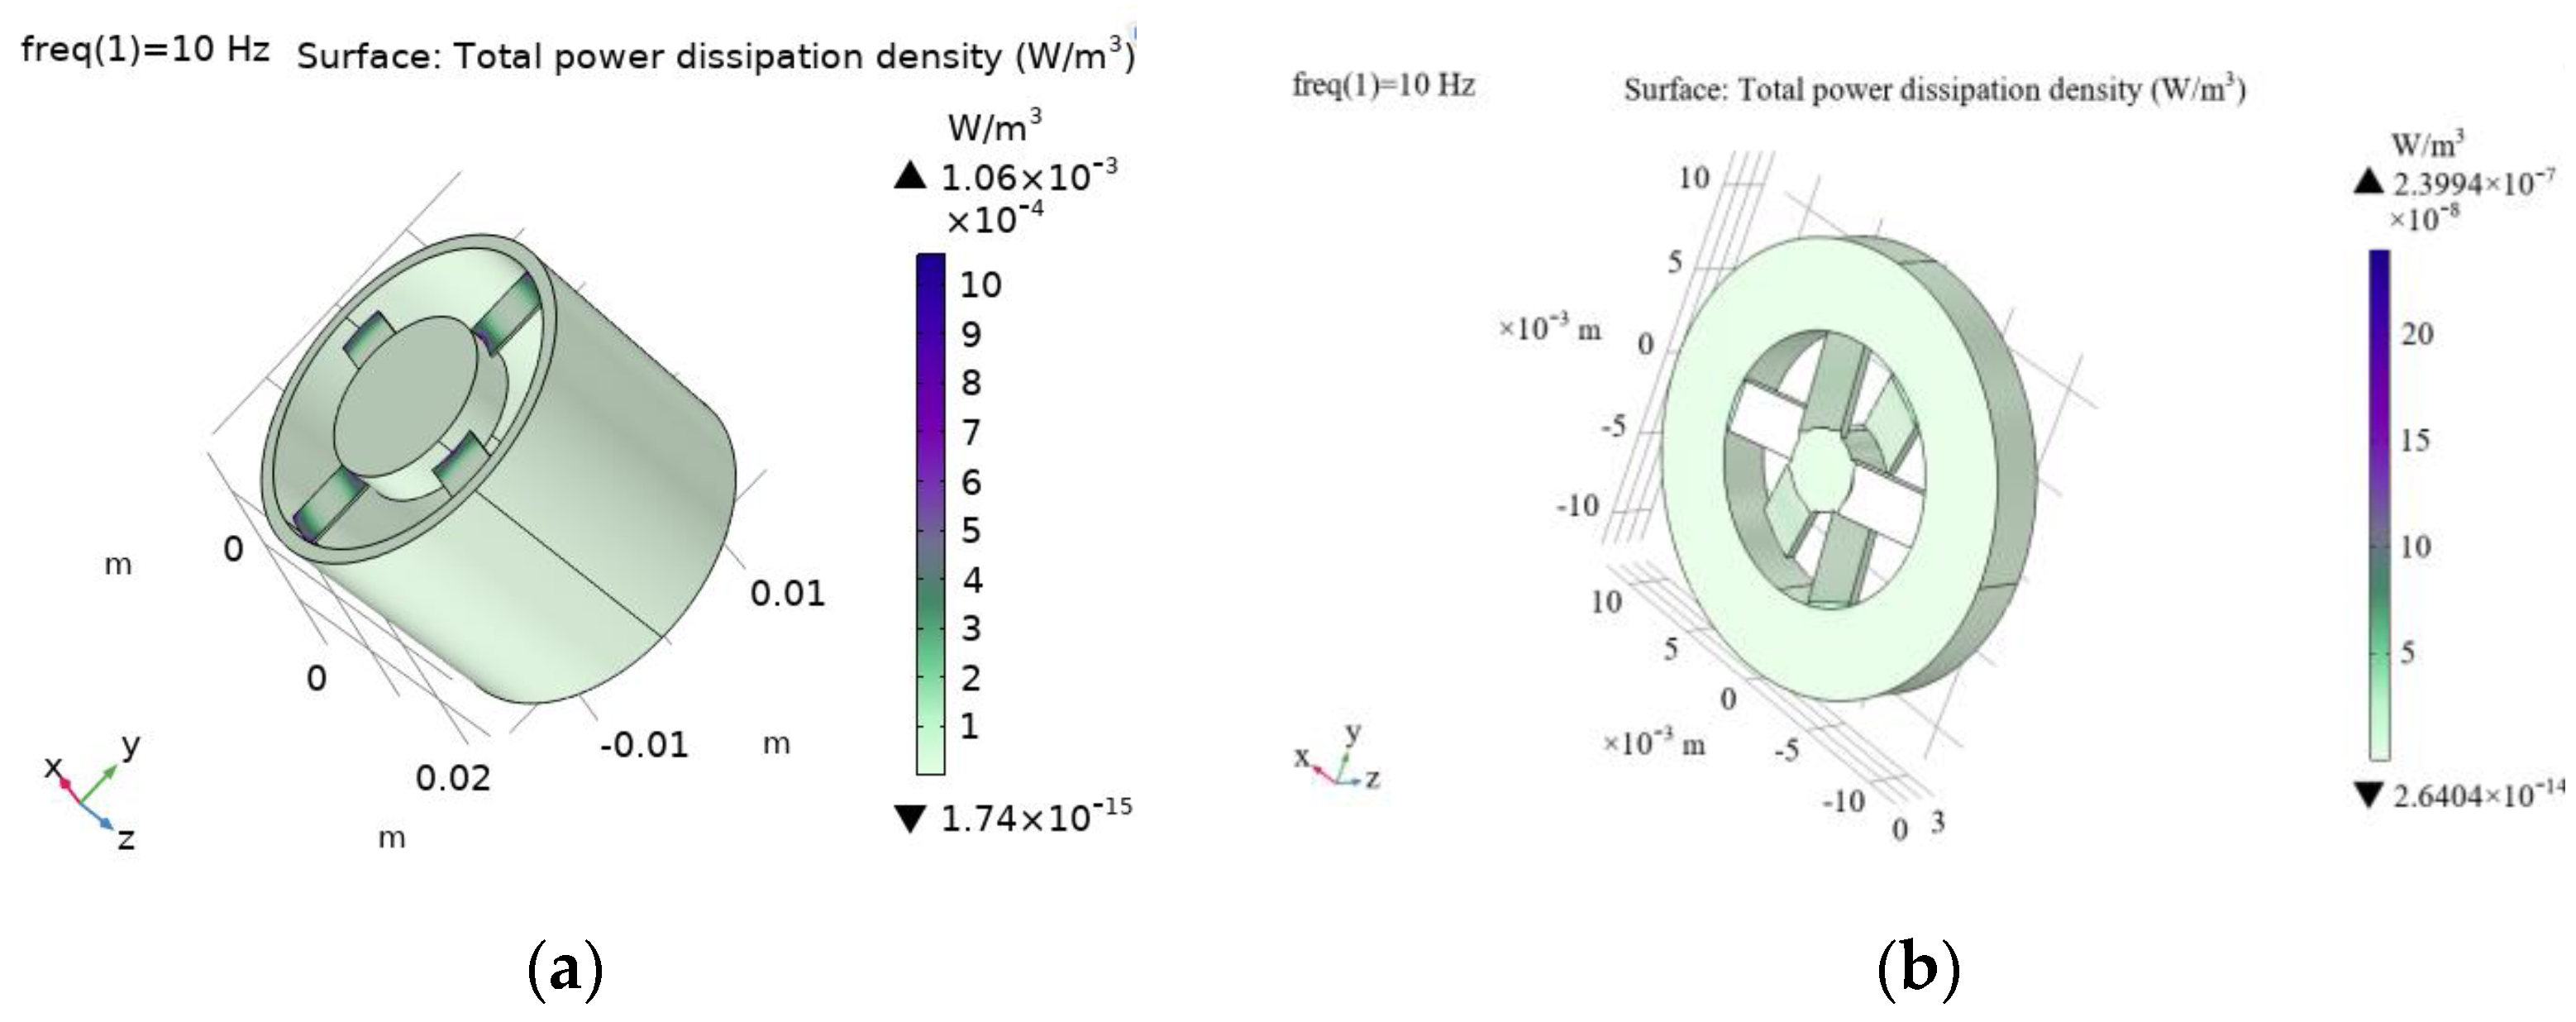
Simulations show that, due to a more uniform distribution of mechanical stress in the skewed flexures of the proposed drum-type OMAS (see Figure 14a), the power dissipation density is reduced substantially compared to the case of the OMAS prototype [10] (see Figure 15). The simulation was carried out when acceleration az = g with a frequency f = 10 Hz was applied to the outer part of the OMAS.

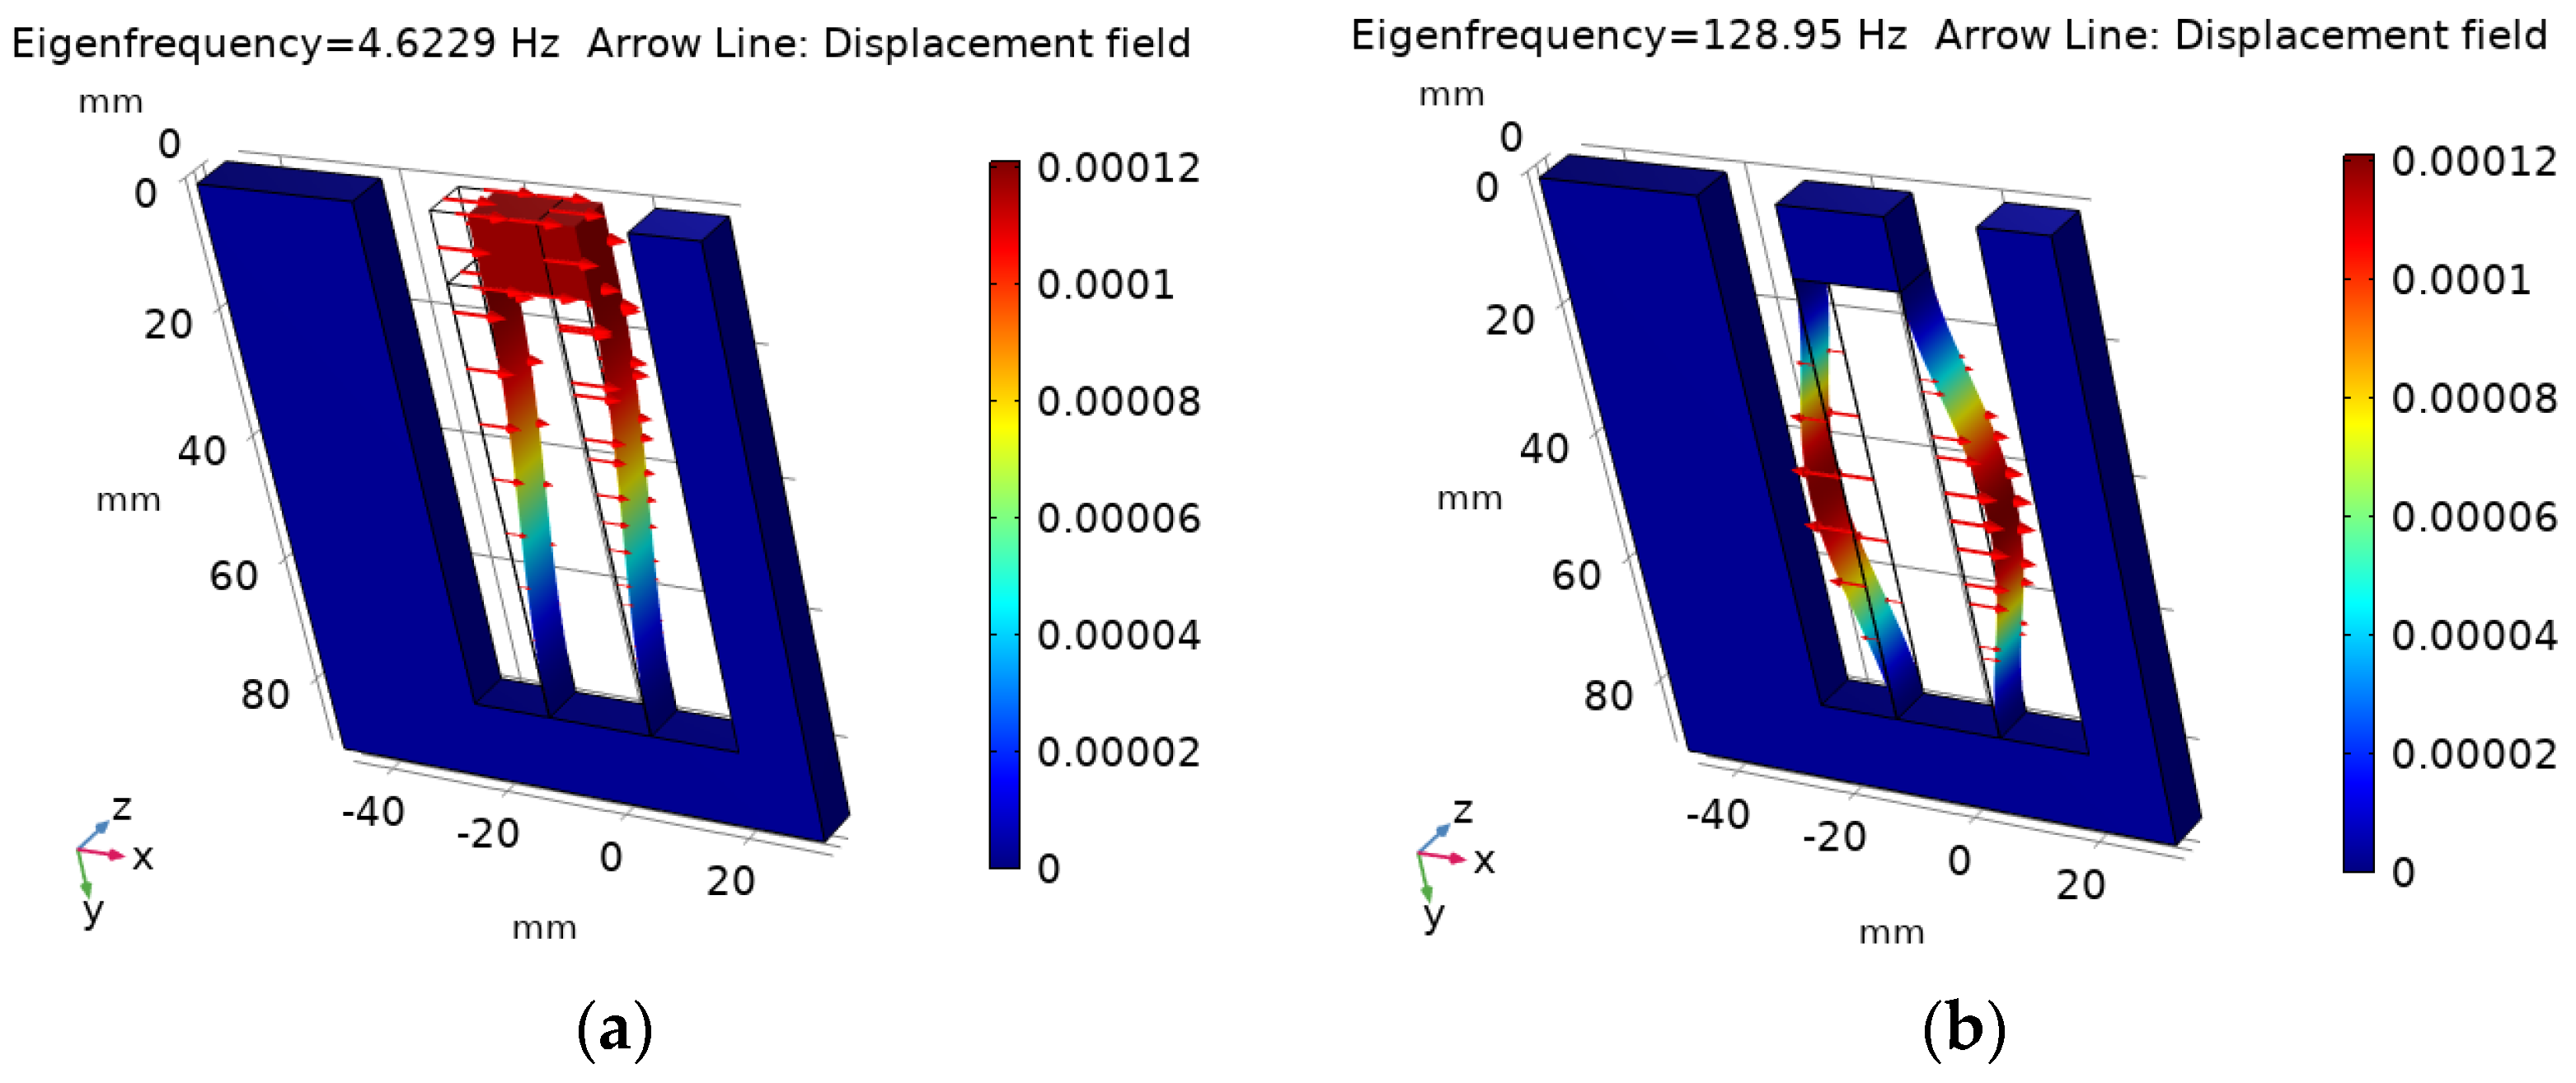
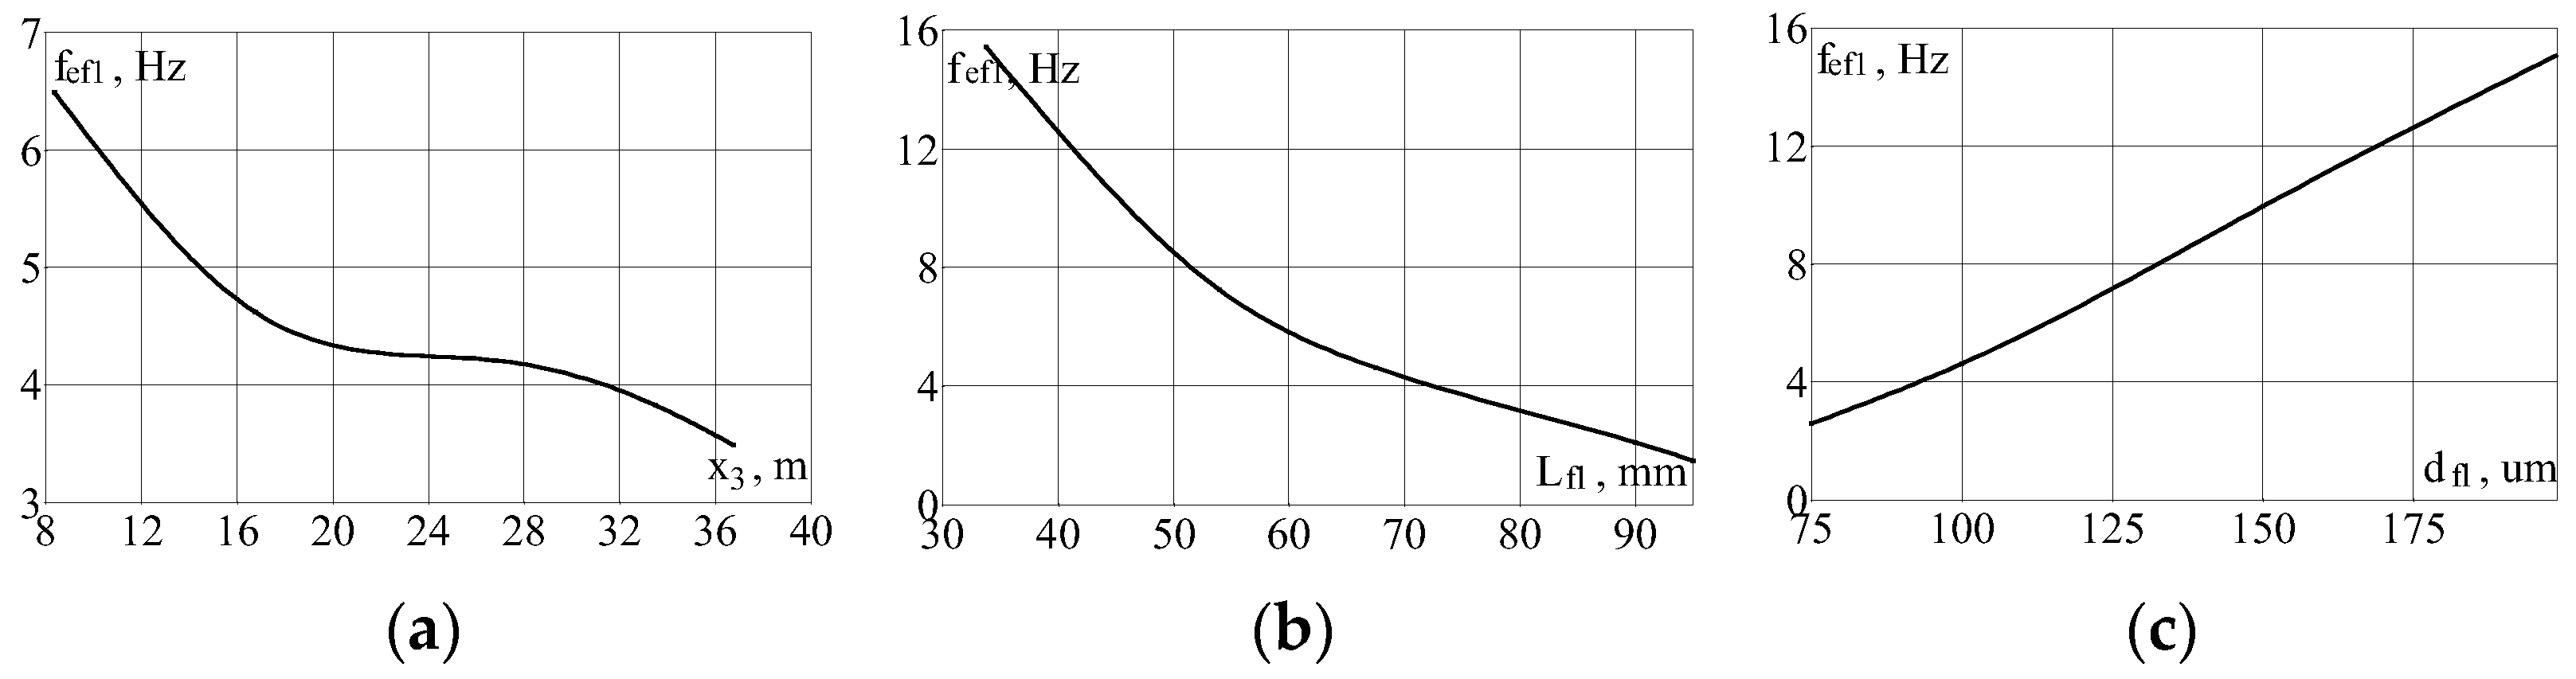
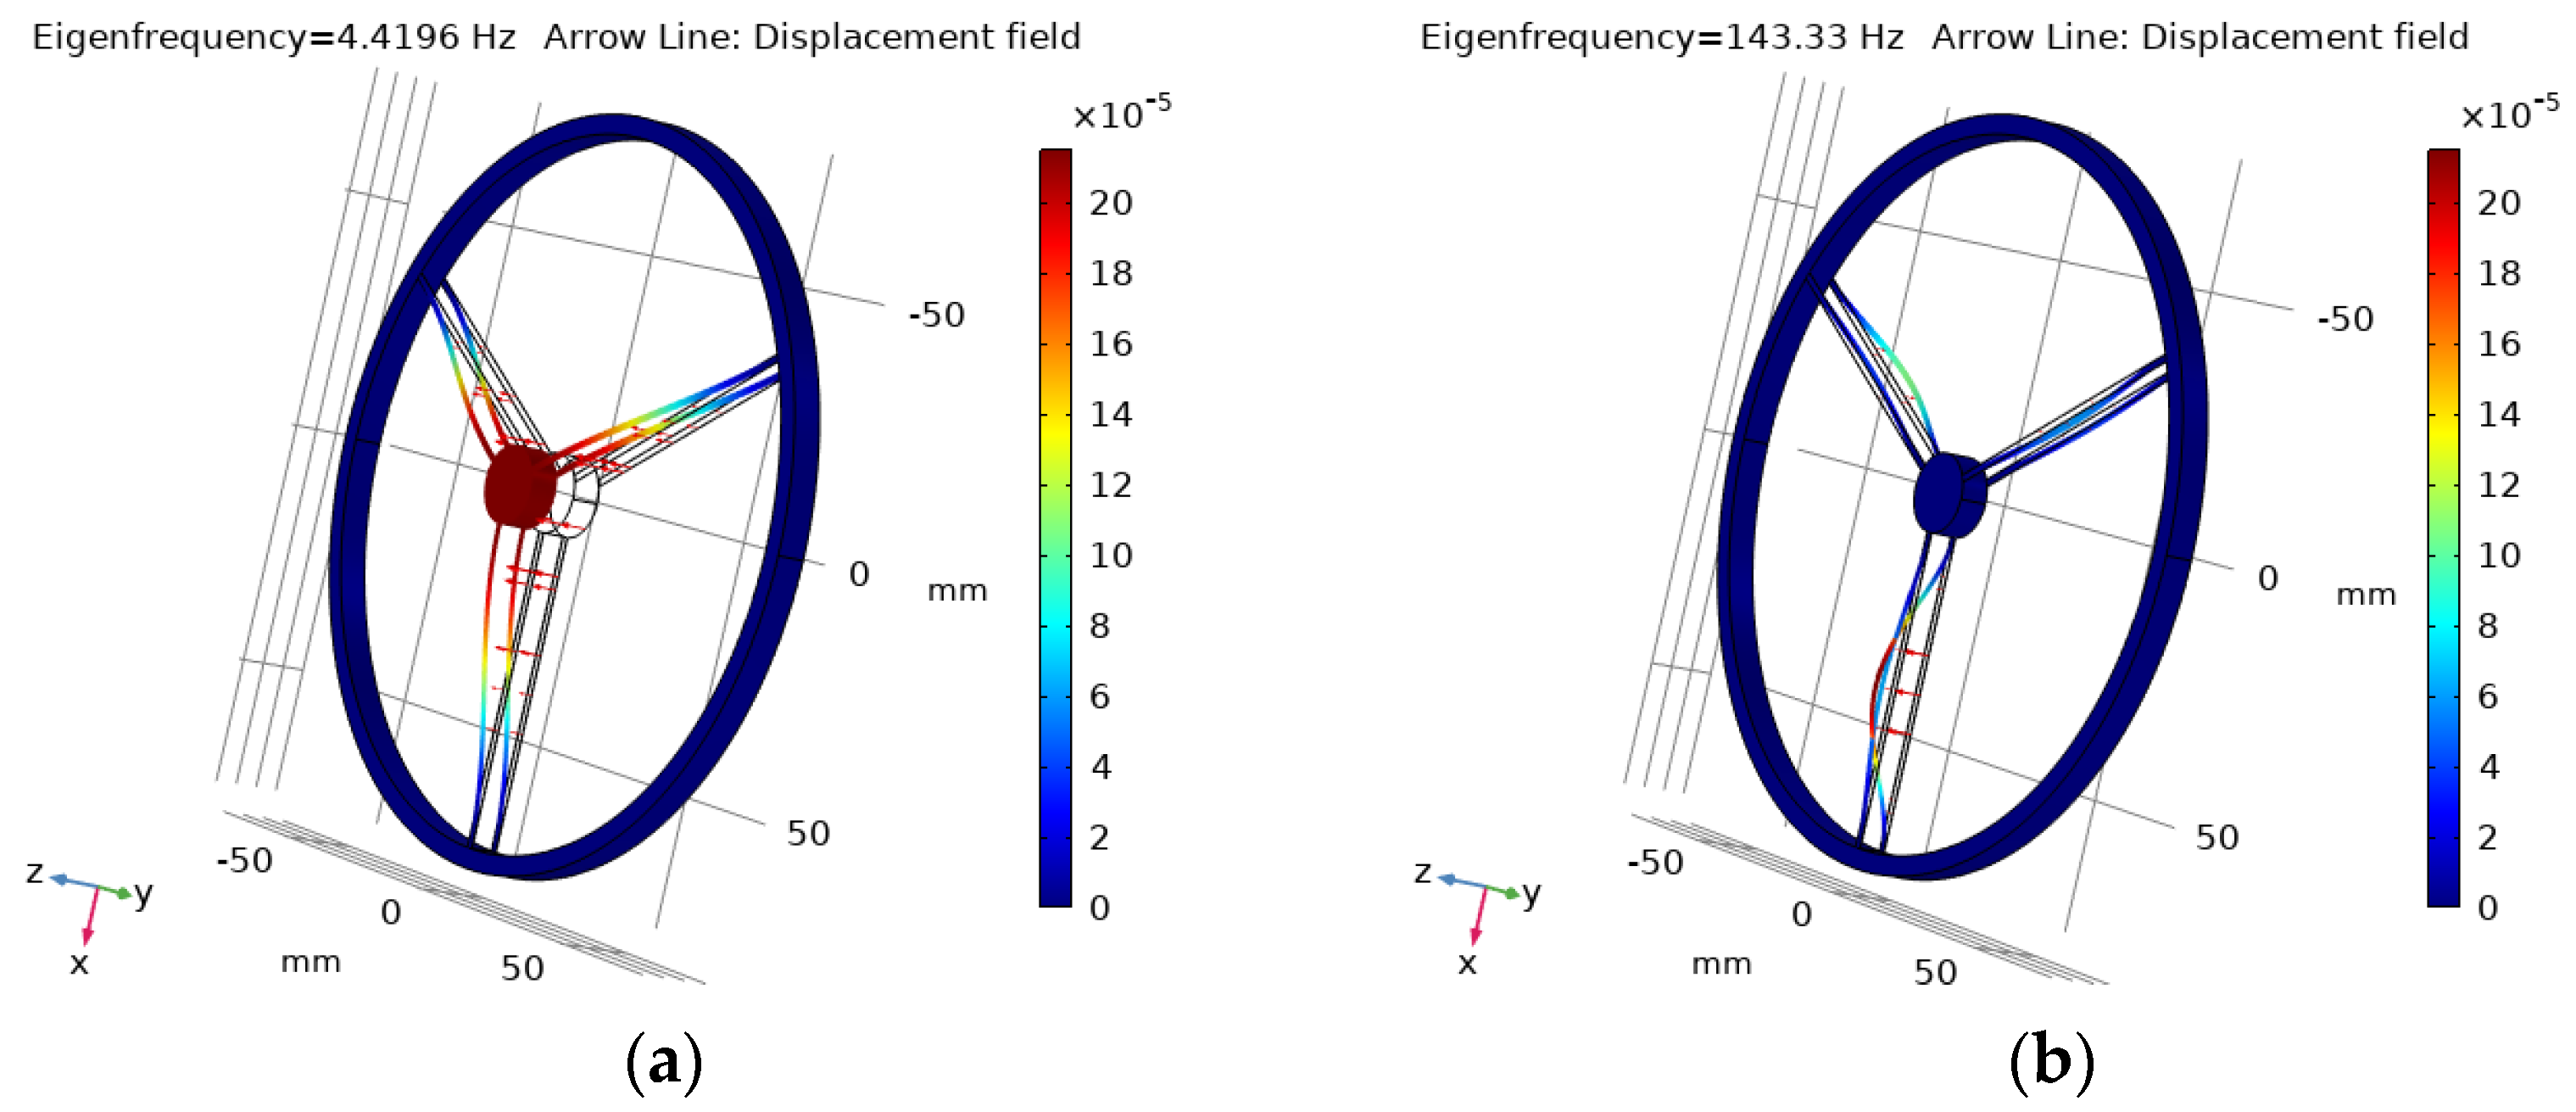
3.2. Designs of the Out-of-Plane OMAS with Low Natural Frequencies

For the cases where the low-frequency accelerations should be measured using out-of-plane OMAS, the design with the following parameters is proposed: test mass 1 has a diameter Din = 16 mm, a thickness hin = 6 mm, and a mass m = ρfs·π·(Din/2)2·hin = 2.66 g (see Figure 13a). The moving test mass 1, on which a mirror for acceleration measurements is located, is fastened to the outer cylinder 2 by six flexures 3 having a length Lfl = 6.4 mm, a width wfl = 2 mm, and a thickness dfl = 100 μm. The material is fused silica. The geometrical parameters of such an OMAS design were chosen to provide approximately the same eigenfrequencies as for in-plane VLF OMAS (see Figure 2 and Figure 16).
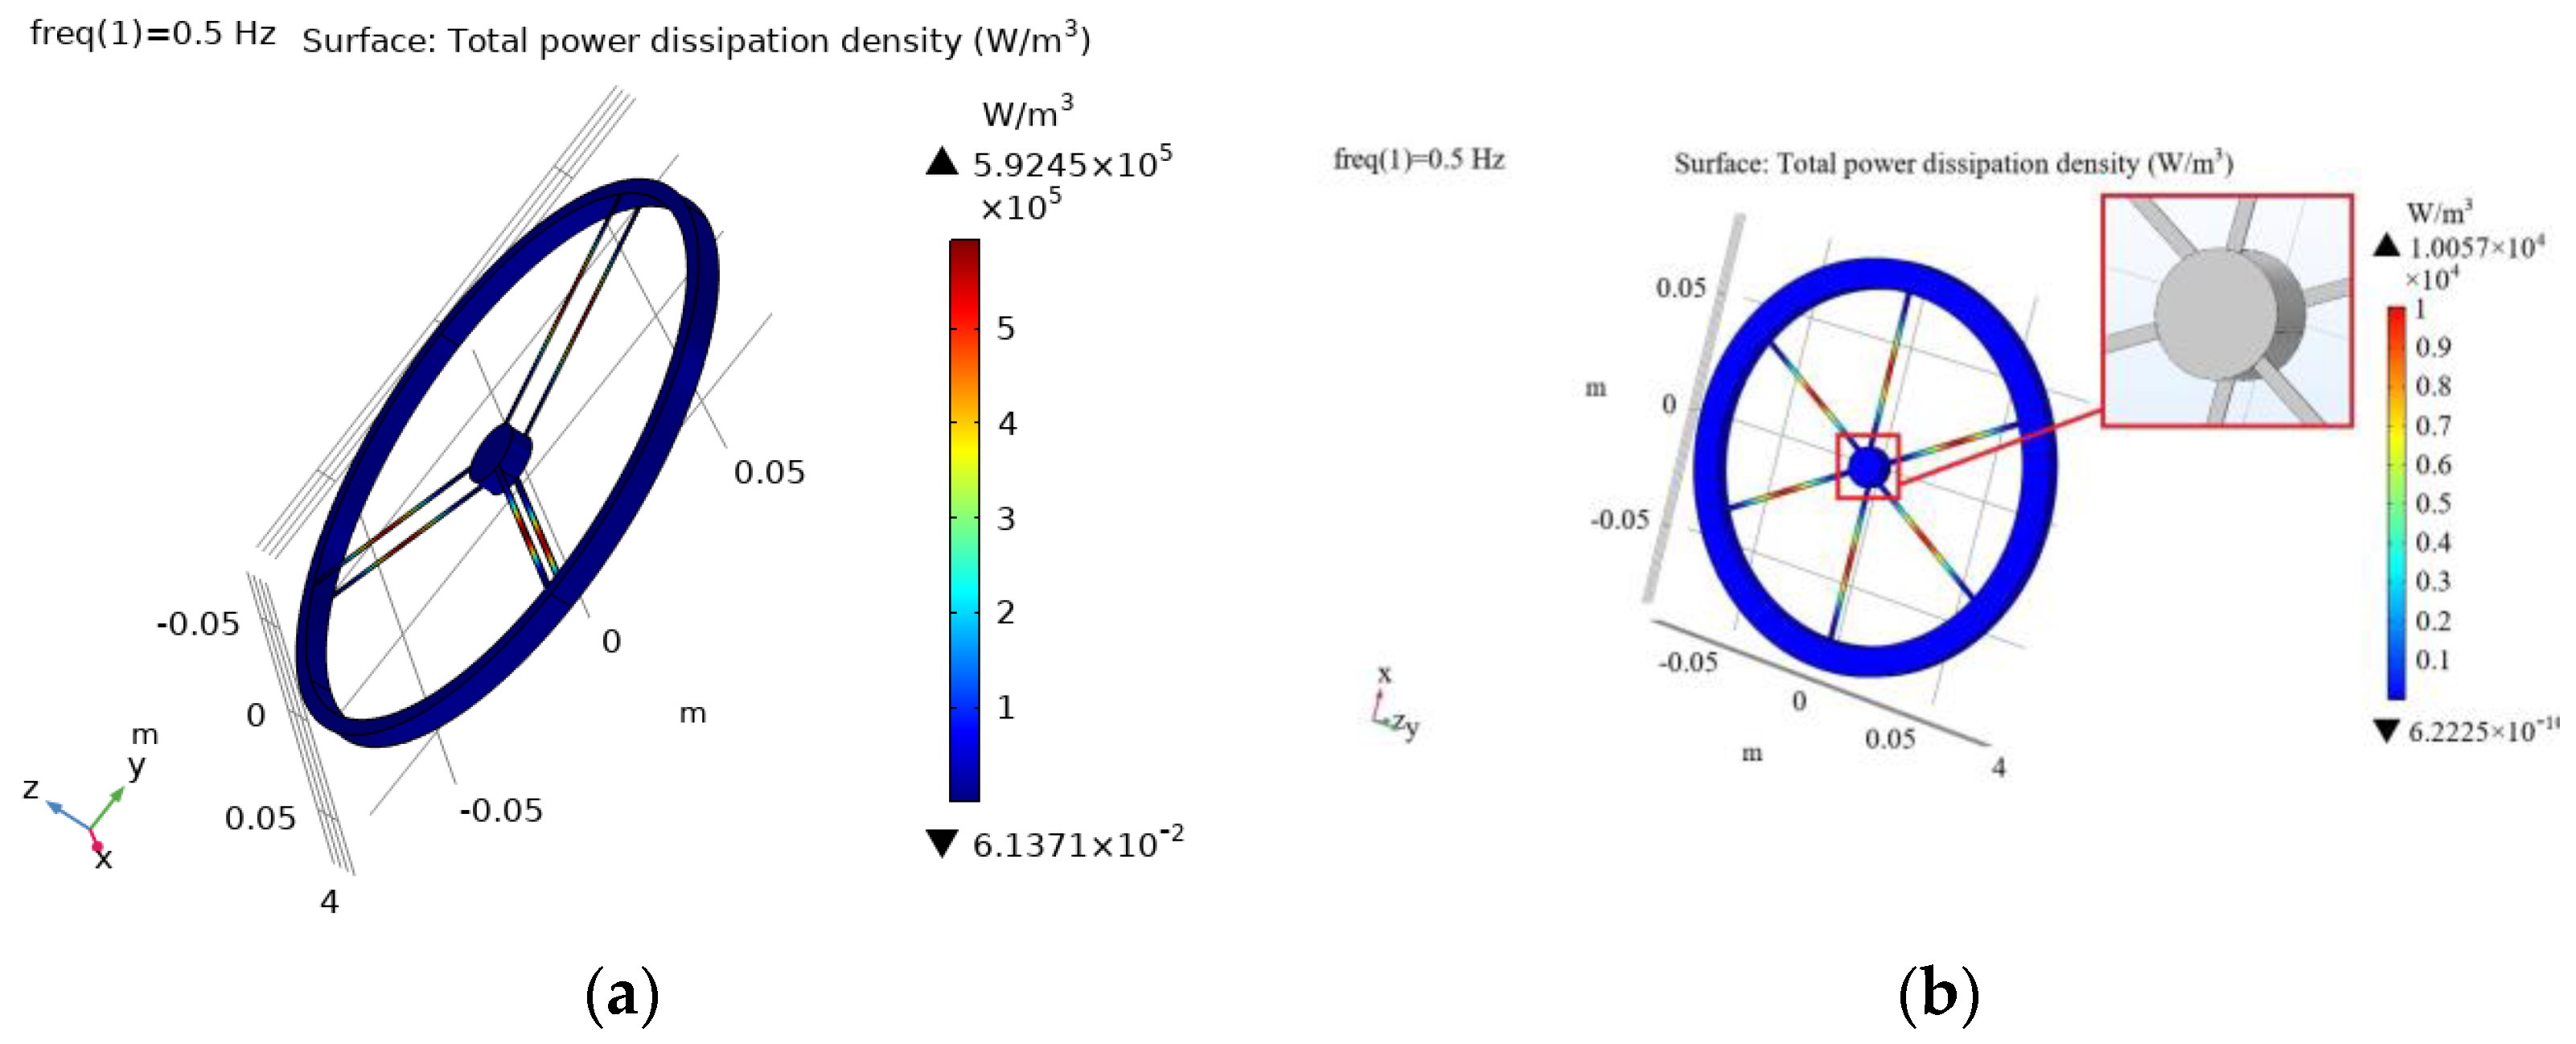
The distribution of losses in such an OMAS is shown in 
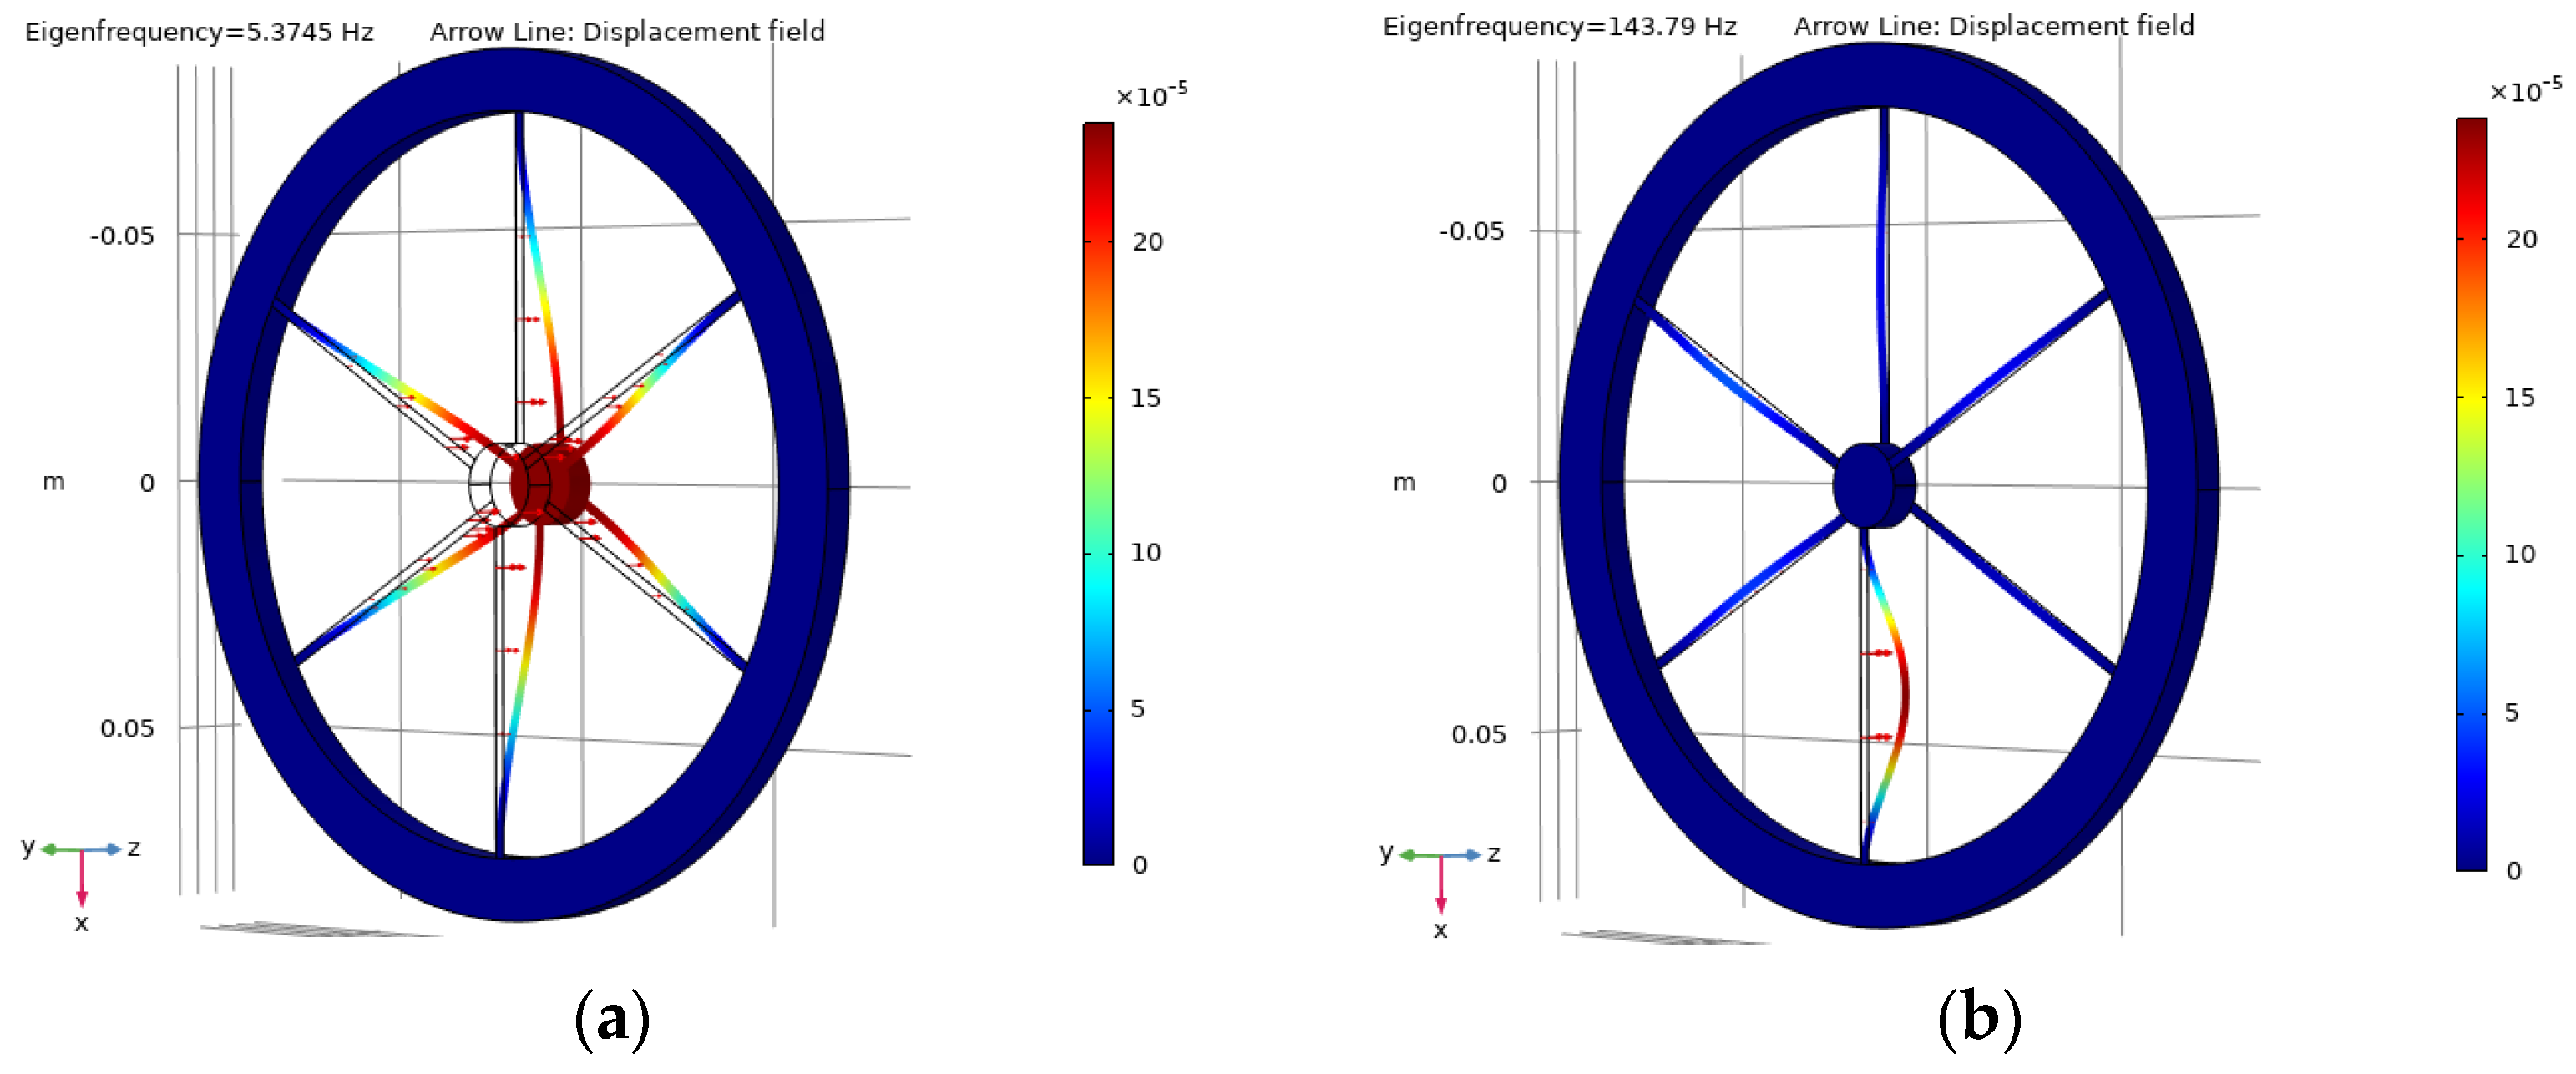
Figure 17a. To reduce losses, an advanced design is proposed (see Figure 17b). With the same dimensions of test mass and flexures as for OMAS in Figure 16, we have very close eigenfrequencies in the case of the OMAS of the improved design (see Figure 16 and Figure 18), but power dissipation losses are substantially reduced (see Figure 17a,b).
The proposed design change in comparison with OMAS from Figure 13a is that the attachment points of the three flexures connecting the upper parts of the test mass and the constrained outer part of the OMAS are rotated relative to those connecting their lower parts by an angle of 60° so that all flexures are located evenly along the circumference (see callout to Figure 17b).

4. Conclusions

With the help of the numerical modeling of mechanical processes using the finite element method, the natural frequencies and participation factors of the mechanical parts of optomechanical accelerometers were determined. The simulation was validated by comparing the calculated natural frequencies with the known literature data from [1,10]. Using such simulations, an analysis of the mechanical characteristics of optomechanical accelerometers of various designs was carried out. As a result of the analysis of the mechanical characteristics of existing in-plane and out-of-plane accelerometers, new designs of these devices have been proposed, providing their natural frequencies from a few hertz to 50 kHz. Such a variation can be achieved by changing the optomechanical acceleration sensors’ configuration and parameters.
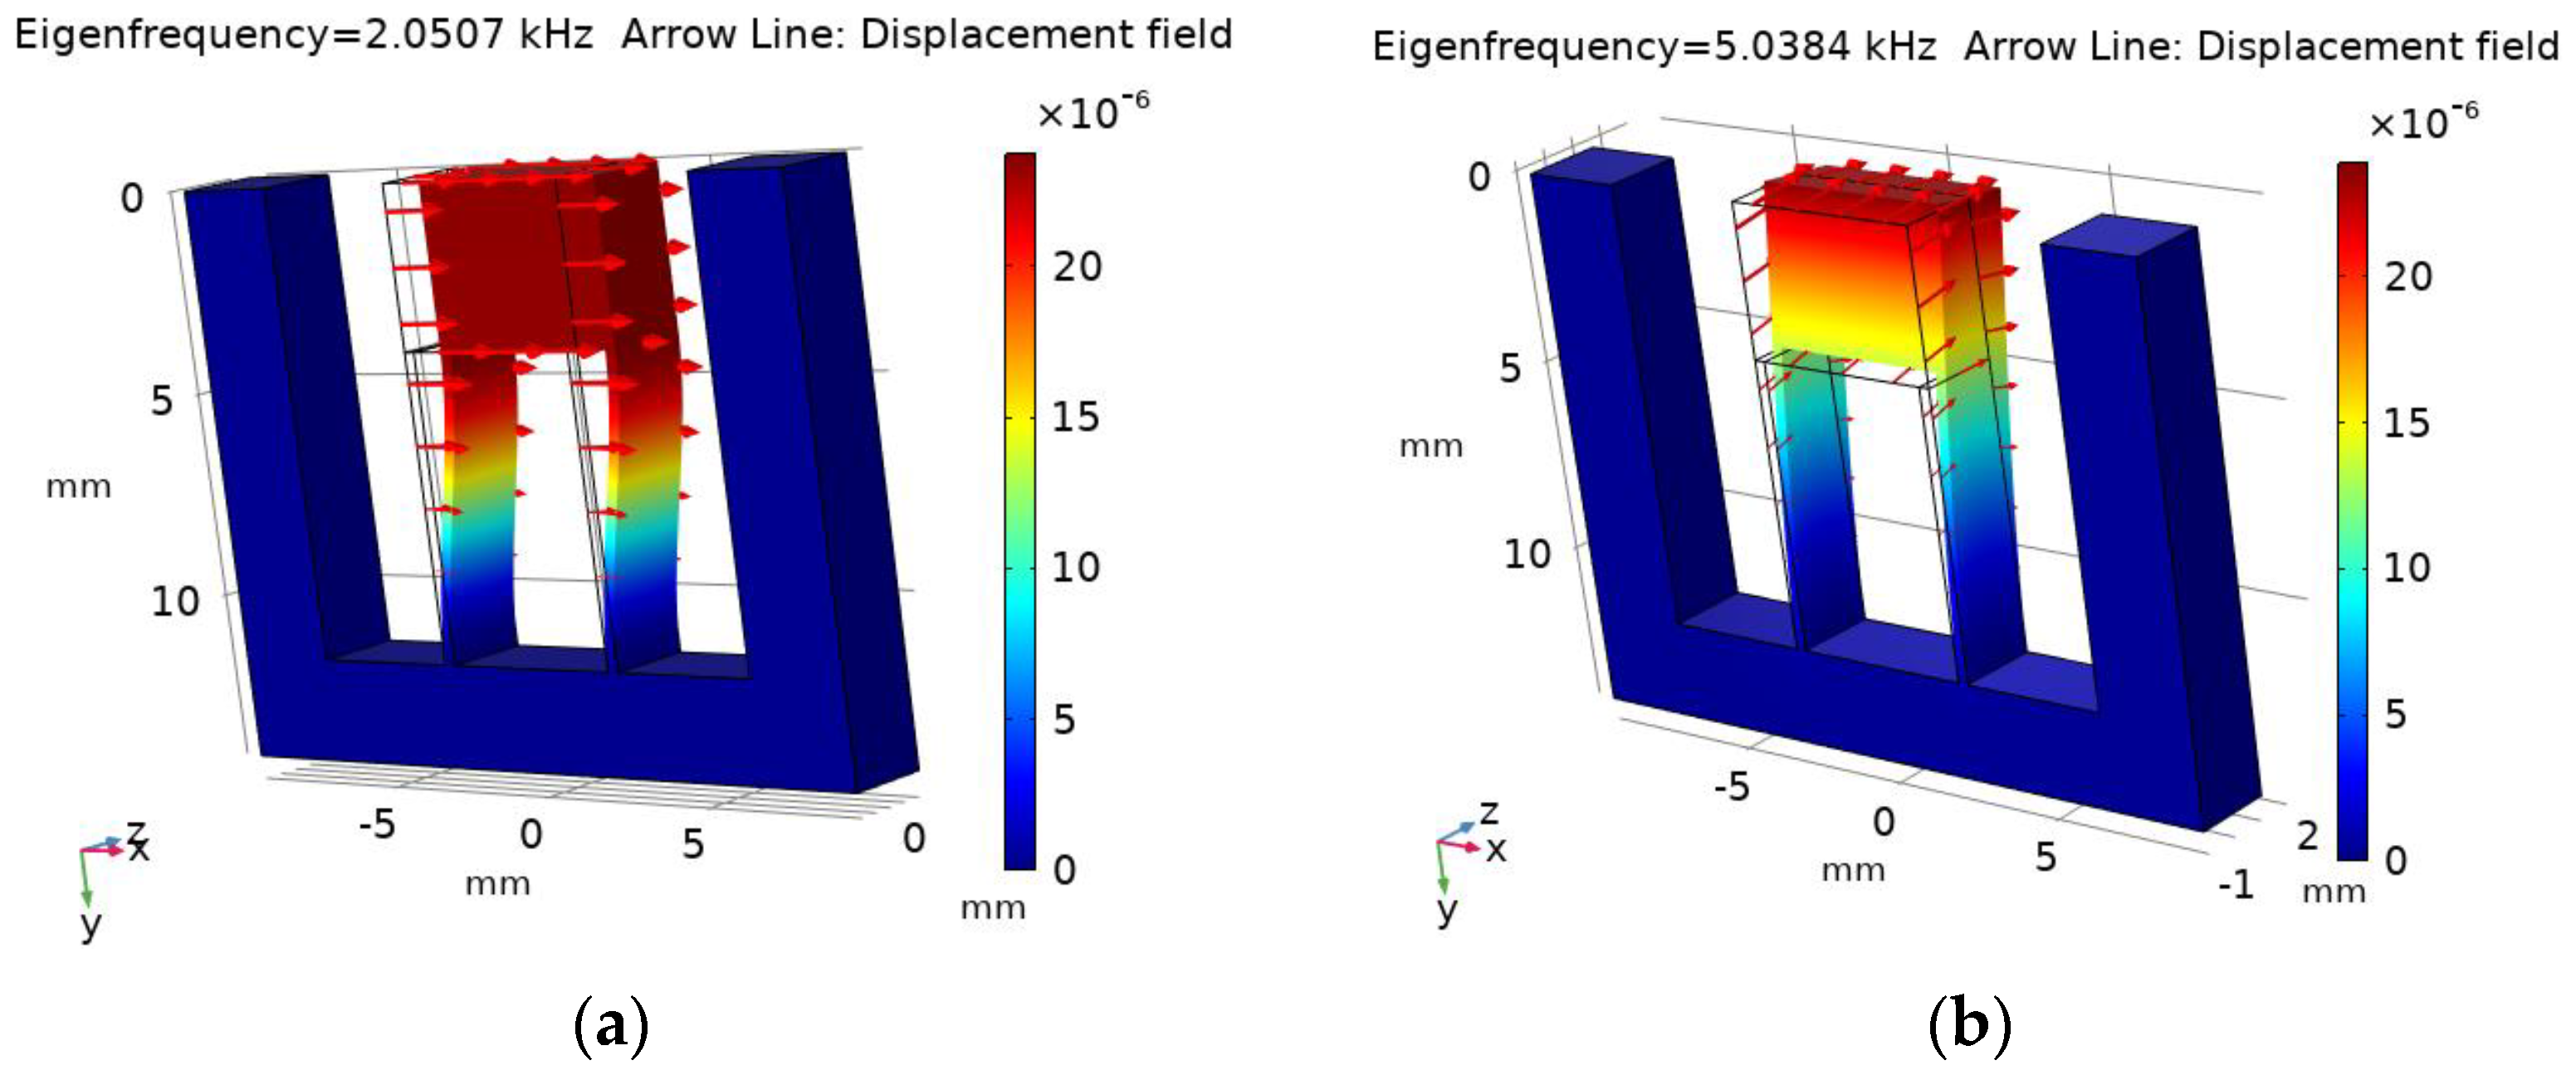
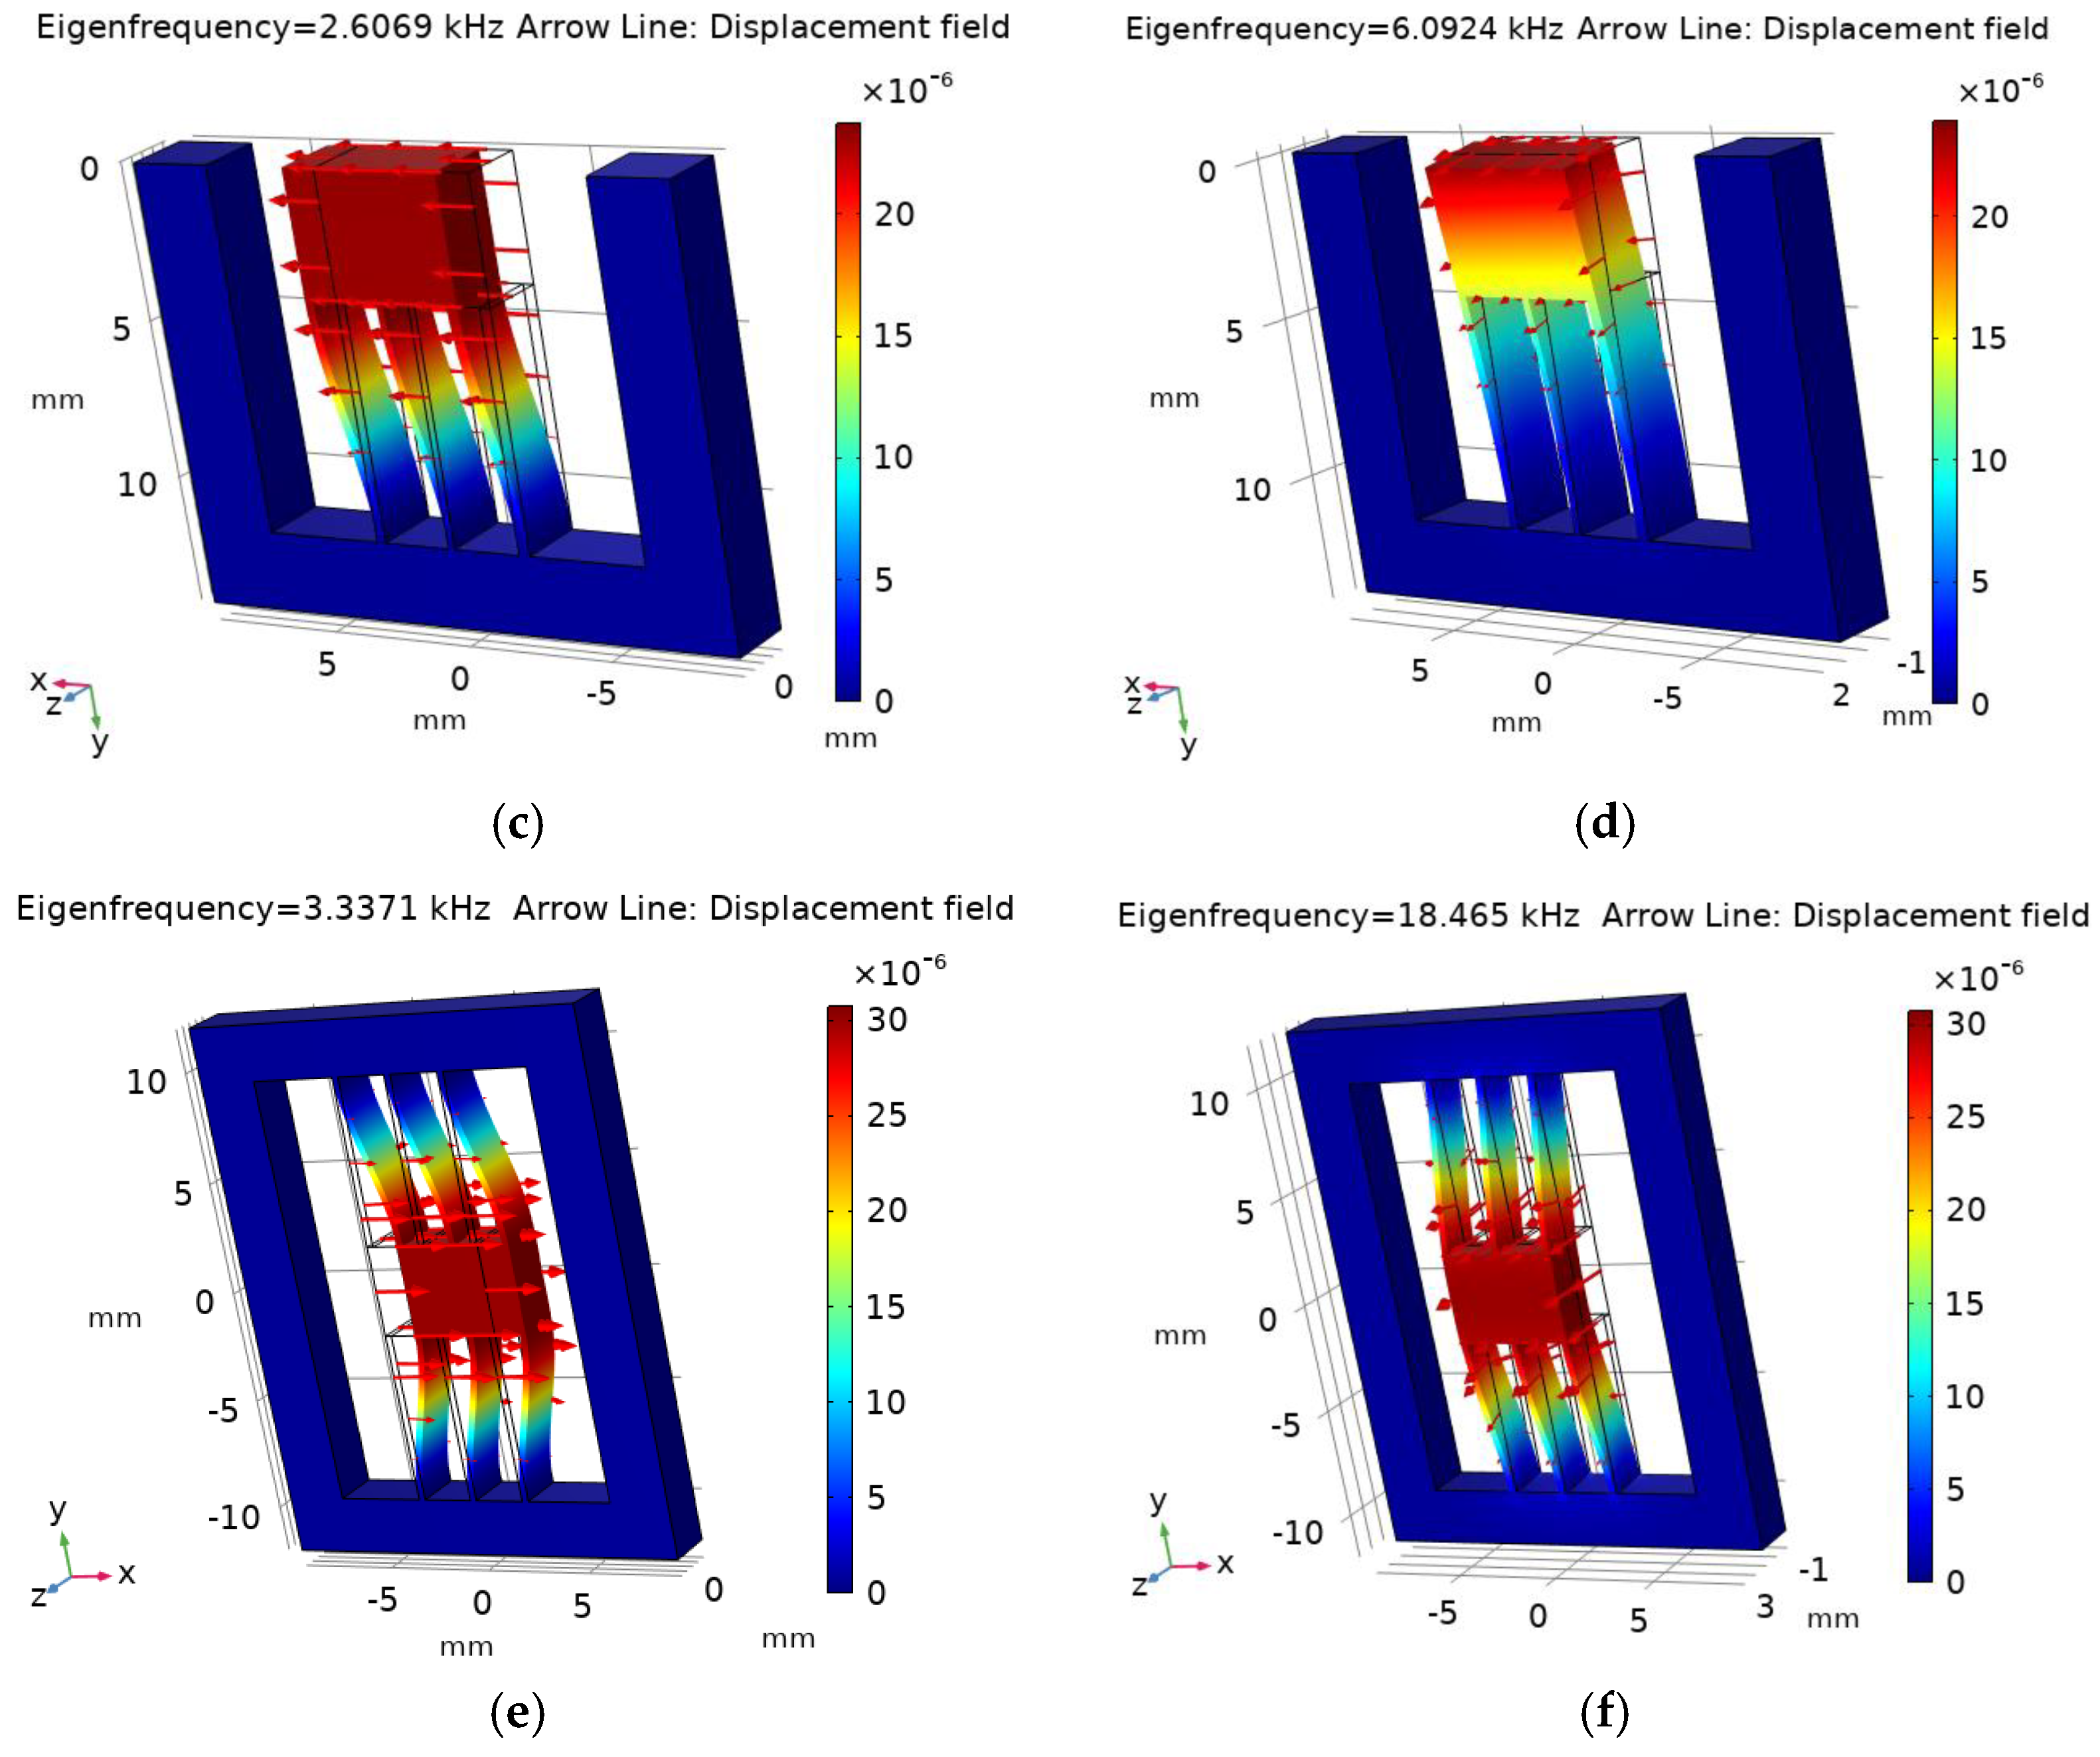
Numerical modeling shows that the existing design of an in-plane OMAS [1] (see Figure 1) has a limitation on the maximum first natural frequency, which for the studied parameters of the OMIS does not exceed 10–12 kHz. To overcome this limitation, improved designs have been proposed (see Figure 9), providing a first eigenfrequency of up to 50 kHz. To ensure the high natural frequencies of in-plane sensors, it is proposed that such OMISs are performed not with two flexures, as in known devices [1], but with two sets of three flexures, located on both sides of the test mass (see Figure 9).
For the out-of-plane acceleration measurements, the existing drum-type sensors [1,10] provide about 2 kHz natural frequency. The drum-type design sensors providing both very small natural frequencies down to several hertz (see Figure 16 and Figure 17) and high natural frequencies up to 50 kHz (see Figure 13 and Figure 14) have been proposed. To ensure high natural frequencies of out-of-plane sensors, a design is proposed, in which six flexures are attached through one with one end to the top of the test mass and the other end is attached to the bottom of the outer constrained ring (see Figure 14a).
The OMASs with the chosen designs for in-plane and out-of-plane measurements practically do not have cross-talk. They also provide a reduction in dissipated power density levels and, therefore, an increase in their reliability and quality factor.
Identifying the participation factors that can be used to describe the motion shape of optical-mechanical sensors allowed us to select vulnerable frequencies for the further studies of possible crosstalk. To eliminate the influence of higher harmonics on the nature of movement, the selected configuration of optical-mechanical sensors must provide either significantly lower levels of participation coefficients of higher harmonics (at least an order of magnitude lower than the participation coefficient of the first natural frequency) in the measurement direction) or significantly higher levels of natural frequencies of higher harmonics (not less than five times the first natural frequency).
Further work is planned in terms of implementing the developed OMAS designs and their experimental investigations.

Author Contributions

M.R. performed mathematical modeling, data curation, writing, review, and editing. C.B. conceptualized and supervised the study. All authors have read and agreed to the published version of the manuscript.

Funding

This work is supported by the German Space Agency (DLR e.V.), with funds provided by the Federal Ministry of Economic Affairs and Climate Action, under grant number 50WM2262B (HyQIS), BMBF by future cluster QSENS (project 03ZU1110JA QSPACE).

Data Availability Statement

The data presented in this study are available upon request from the corresponding author.

Conflicts of Interest

The authors declare no conflicts of interest.

References

  1. Hines, A.; Nelson, A.; Zhang, Y.; Valdes, G.; Sanjuan, J.; Stoddart, J.; Guzmán, F. Optomechanical Accelerometers for Geodesy. Remote Sens. 2022, 14, 4389. [Google Scholar] [CrossRef]
  2. Karlsson, R.; Hendeby, G. Speed Estimation from Vibrations Using a Deep Learning CNN Approach. IEEE Sens. Lett. 2021, 5, 7000504. [Google Scholar] [CrossRef]
  3. Lévèque, T.; Fallet, C.; Mandea, M.; Biancale, R.; Lemoine, J.M.; Tardivel, S.; Delavault, S.; Piquereau, A.; Bourgogne, S.; Dos Santos, F.P.; et al. Gravity field mapping using laser-coupled quantum accelerometers in space. J. Geod. 2021, 95, 15. [Google Scholar] [CrossRef]
  4. Noureldin, A.; Karamat, T.B.; Georgy, J. Fundamentals of Inertial Navigation, Satellite-Based Positioning and Their Integration, 1st ed.; Springer: Berlin, Germany, 2013. [Google Scholar]
  5. Schlager, B.; Goelles, T.; Behmer, M.; Muckenhuber, S.; Payer, J.; Watzenig, D. Automotive Lidar and Vibration: Resonance, Inertial Measurement Unit, and Effects on the Point Cloud. IEEE Open J. Intell. Transp. Syst. 2022, 3, 426–434. [Google Scholar] [CrossRef]
  6. Kumanchik, L.; Rezinkina, M.; Braxmaier, C. Choice of the miniature inertial optomechanical sensor geometric parameters with the help of their mechanical characteristics modelling. Micromachines 2023, 14, 1865. [Google Scholar] [CrossRef] [PubMed]
  7. Reschovsky, B.J.; Long, D.A.; Zhou, F.; Bao, Y.; Allen, R.A.; LeBrun, T.W.; Gorman, J.J. Intrinsically accurate sensing with an optomechanical accelerometer. Opt. Express 2022, 30, 19510–19523. [Google Scholar] [CrossRef] [PubMed]
  8. Abozyd, S.; Toraya, A.; Gaber, N. Design and Modeling of Fiber-Free Optical MEMS Accelerometer Enabling 3D Measurements. Micromachines 2022, 13, 343. [Google Scholar] [CrossRef] [PubMed]
  9. Guzmán, F.; Kumanchik, L.; Spannagel, R.; Braxmaier, C. Compact fully monolithic optomechanical accelerometer. arXiv 2018, arXiv:1811.01049. [Google Scholar]
  10. Richardson, L.L.; Hines, A.; Schaffer, A.; Anderson, B.P.; Guzmán, F. Quantum hybrid optomechanical inertial sensing. Appl. Opt. 2020, 59, G160–G166. [Google Scholar] [CrossRef] [PubMed]
  11. Structural Mechanics Module. User’s Guide 1998–2018. COMSOL. Available online: https://doc.comsol.com/5.4/doc/com.comsol.help.sme/StructuralMechanicsModuleUsersGuide.pdf (accessed on 16 February 2023).
  12. Low, K.H. A comparative study of the eigenvalue solutions for mass-loaded beams under classical boundary conditions. Int. J. Mech. Sci. 2001, 43, 237–244. [Google Scholar] [CrossRef]
  13. Gürgöze, M. On the eigenfrequencies of cantilevered beams carrying a tip mass and spring-mass in-span. Int. J. Mech. Sci. 1996, 38, 1295–1306. [Google Scholar] [CrossRef]
  14. Linear Viscoelastic Materials. Available online: https://doc.comsol.com/5.6/doc/com.comsol.help.sme/sme_ug_theory.06.26.html (accessed on 16 February 2023).
  15. Guzmán, C.F.; Kumanchik, L.; Pratt, J.; Taylor, J.M. High sensitivity optomechanical reference accelerometer over 10 kHz. Appl. Phys. Lett. 2014, 104, 221111. [Google Scholar] [CrossRef]
  16. Hines, A.; Nelson, A.; Zhang, Y.; Valdes, G.; Sanjuan, J.; Guzman, F. Compact optomechanical accelerometers for use in gravitational wave detectors. Appl. Phys. Lett. 2023, 122, 094101. [Google Scholar] [CrossRef]
  17. Zhang, Y.; Hines, A.; Wilson, D.; Guzman, F. Optomechanical cooling and inertial sensing at low frequencies. Phys. Rev. Appl. 2023, 19, 054004. [Google Scholar] [CrossRef]
  18. Carter, J.; Köhlenbeck, S.; Birckigt, P.; Eberhardt, R.; Heinzel, G.; Gerberding, O. A High Q, Quasi-Monolithic Optomechanical Inertial Sensor. In Proceedings of the 2020 IEEE International Symposium on Inertial Sensors and Systems (INERTIAL), Hiroshima, Japan, 23–26 March 2020; pp. 1–4. [Google Scholar] [CrossRef]
  19. Melcher, J.; Stirling, J.; Guzmán, C.F.; Pratt, J.R.; Shaw, G.A. A self-calibrating optomechanical force sensor with femtonewton resolution. Appl. Phys. Lett. 2014, 105, 233109. [Google Scholar] [CrossRef]
  20. Gerberding, O.; Guzmán, C.F.; Melcher, J.; Pratt, J.R.; Taylor, J.M. Optomechanical reference accelerometer. Metrologia 2015, 52, 654–665. [Google Scholar] [CrossRef]
  21. Hines, A.; Richardson, L.; Wisniewski, H.; Guzmán, F. Optomechanical inertial sensors. Appl. Opt. 2020, 59, G167–G174. [Google Scholar] [CrossRef] [PubMed]
  22. Mazeran, P.E.; Beyaoui, M.; Bigerelle, M.; Guigon, M. Determination of mechanical properties by nanoindentation in the case of viscous materials. Int. J. Mater. Res. 2012, 103, 715–722. [Google Scholar] [CrossRef]
  23. Zhou, T.; Yan, J.; Masuda, J.; Kuriyagawa, T. Investigation on the viscoelasticity of optical glass in ultraprecision lens molding process. J. Mater. Process. Technol. 2009, 209, 4484–4489. [Google Scholar] [CrossRef]
Figure 1. The in-plane OMAS design.
Designs 08 00033 g001
Figure 2. Calculated displacement modes for the first (a) fef1 = 4.63 Hz and second (b) fef2 = 128.95 Hz eigenfrequencies (the case of the VLEF OMAS).
Designs 08 00033 g002
Figure 3. Calculated displacement modes for the first (a) fef1 = 660.8 Hz and the second (b) fef2 = 2606.4 Hz eigenfrequencies (the case of the MEF OMAS).
Designs 08 00033 g003
Figure 4. Calculated distributions of the displacement mode shapes when the force F = mtmMEF·g (fo = 50 Hz) is applied in the x (a) and z (b) directions (the case of the MEF OMAS).
Designs 08 00033 g004
Figure 5. Calculated distributions of the dissipation power density when the acceleration ax = g (fo = 0.5 Hz) is applied in the x direction. (a) the VLEF OMAS; (b) the MEF OMAS.
Designs 08 00033 g005
Figure 6. Calculated distributions of the first eigenfrequency (fef1) versus the VLEF OMAS parameters: (a) fef1(x3); (b) fef1(Lfl); (c) fef1(dfl).
Designs 08 00033 g006
Figure 7. Calculated distributions of the first displacement mode (a) fef1 = 7.756 Hz, and the dissipation power density (b) when the acceleration ax = g (fo = 0.5 Hz) is applied in the x direction (case of the modified design of the VLEF OMAS).
Designs 08 00033 g007
Figure 8. Calculated distribution of the first eigenfrequency (fef1) versus the MEF OMAS flexures length (Lfl).
Designs 08 00033 g008
Figure 9. In-plane OMAS geometries: (a) three-flexure OMAS; and (b) six-flexure OMAS.
Designs 08 00033 g009
Figure 10. Calculated the first (a) −fef1 = 2050.7 Hz, (c) −fef1 = 2606.9 Hz, (e) −fef1 = 3337.1 Hz, and the second (b) −fef2 = 5038.4 Hz, (d) −fef2 = 6092.4 Hz, (f) −fef2 = 18,465 Hz eigenmodes for the two-flexure OMAS (a,b), the three-flexure OMAS (c,d), and the six-flexure OMAS (e,f).
Designs 08 00033 g010aDesigns 08 00033 g010b
Figure 11. Mechanical characteristics of the OMAS with six flexures (see Figure 9b). (a) −fef1 = 51.9 kHz, (b) −fef2 = 99.4 kHz are calculated the first and second eigenmodes correspondingly; (c,d) are calculated normalized participation factors for the X and Z translations (each asterisk corresponds to a definite level of a participation factor at a particular eigenfrequency).
Designs 08 00033 g011
Figure 12. (a) Round drum-type OMAS geometry [10]; (b) −fef1 = 1025.3 Hz, (c) −fef2 = 2062.7 Hz, and (d) −fef3 = 18,915 Hz are calculated displacement mode shapes for the first three eigenfrequencies.
Designs 08 00033 g012
Figure 13. (a) Proposed drum-type OMAS design with straight flexures; (b) fef1 = 4.2 kHz; and (c) fef2 = 42.859 kHz are the calculated first and second displacement eigenmodes, respectively.
Designs 08 00033 g013
Figure 14. (a) Proposed drum-type OMAS design with skewed flexures; (b) −fef1 = 56.756 kHz; and (c) −fef2 = 77.863 kHz are the calculated first and second displacement eigenmodes, respectively; (d,e) modeled normalized participation factors of the Z and X translations versus eigenfrequencies, respectively (each asterisk corresponds to a definite level of a participation factor at a particular eigenfrequency); and (f) is the calculated distribution of the Z component of the displacement for the second eigenfrequency.
Designs 08 00033 g014aDesigns 08 00033 g014b
Figure 15. The calculated distributions of the power dissipation in the OMASs with different designs. (a) OMAS design [10] (see Figure 12a); (b) Elaborated OMAS design (see Figure 14a).
Designs 08 00033 g015
Figure 16. Calculated the first (a) −fef1 = 4.4714 Hz and second (b) −fef2 = 126.87 Hz eigenmodes for the out-of-plane OMAS design with three pairs of flexures providing low first eigenfrequency.
Designs 08 00033 g016
Figure 17. Calculated distributions of the dissipation power density when the acceleration az = g (fo = 0.5 Hz) is applied in the z direction. (a) OMAS with three pairs of flexures; (b) OMAS with six evenly located flexures.
Designs 08 00033 g017
Figure 18. The first (a) −fef1 = 5.3745 Hz and second (b) −fef2 = 143.79 Hz displacement eigenmodes calculated for the out-of-plane OMAS design with six evenly located flexures (see callout to Figure 17b) providing the low first eigenfrequency and reduction in the dissipation losses.
Designs 08 00033 g018
Disclaimer/Publisher’s Note: The statements, opinions and data contained in all publications are solely those of the individual author(s) and contributor(s) and not of MDPI and/or the editor(s). MDPI and/or the editor(s) disclaim responsibility for any injury to people or property resulting from any ideas, methods, instructions or products referred to in the content.

