Abstract
This research is part of a broader investigation into innovative simulation-based approaches for improving traffic efficiency and road safety in roundabout corridors. These corridors, composed of successive roundabouts along arterials, present systemic challenges due to the dynamic interactions between adjacent intersections. While previous studies have addressed localized inefficiencies or proposed isolated interventions, this paper introduces possible replicable methodology based on a microsimulation and surrogate safety analysis to evaluate roundabout corridors as integrated systems. In this context, efficiency refers to the ability of a road corridor to maintain stable traffic conditions under a given demand scenario, with low delay times corresponding to acceptable levels of service. Safety is interpreted as the minimization of vehicle conflicts and critical interactions, evaluated through surrogate measures derived from simulated vehicle trajectories. The proposed approach—implemented through Aimsun Next and the SSAM tool—is tested on two real-world corridors: Via Aurelia Nord in Pisa (Italy) and Route de Marseille in Avignon (France), assessing multiple intersection configurations that combine roundabouts and signal-controlled junctions. Results show how certain layouts can produce unexpected performance outcomes, underlining the importance of system-wide evaluations. The proposed framework aims to support engineers and planners in identifying optimal corridor configurations under realistic operating conditions.
1. Introduction
In the context of urban mobility and road network optimization, the analysis and design of road corridors—particularly those composed of successive roundabouts—have gained increasing relevance [1]. Traditional approaches in traffic engineering often consider intersections as isolated elements, overlooking the interdependencies that arise when multiple junctions are closely spaced along a continuous arterial. This fragmented perspective can lead to suboptimal infrastructure transformations, especially when control strategies are modified (e.g., from traffic signals to roundabouts), potentially resulting in paradoxical inefficiencies [2,3]. This paper is located in this context and is part of a broader research program investigating a dynamic simulation-based approach to improve traffic efficiency and road safety in roundabout corridors. Specifically, it represents the core phase of the study, focusing on the development and application of a replicable methodology for analyzing road corridors as integrated systems. This methodological contribution follows an initial study that examined network-level inefficiencies emerging after infrastructure transformations, including paradoxical effects such as those associated with the Braess Paradox [4,5,6,7]. Moreover, it also anticipates future research addressing the dynamic integration of control strategies—such as Ramp Metering Systems (RMSs)—into roundabout corridors to mitigate identified inefficiencies [8,9].
The entire research was initially motivated by a real-world case: the transformation of a road corridor composed of five signalized intersections, Via Aurelia Nord in Pisa (Tuscany, Italy), into a sequence of five consecutive roundabouts, thus forming a proper roundabout corridor. However, this intervention did not yield the expected improvements, particularly in terms of delay reductions under certain traffic conditions. Initially, a comparison was made between the existing corridor with five roundabouts and the previous configuration with five signalized intersections. This analysis raised the question of what would happen in all the possible intermediate combinations. Then, maintaining a constant traffic demand scenario, all possible combinations of roundabouts and signalized intersections were simulated to identify the most effective configurations in terms of traffic efficiency and road safety. To address these challenges, the present paper pursues two main objectives. First, it develops a microsimulation-based methodology—grounded in a traffic microsimulation and surrogate safety analysis—that may be replicable for evaluating the operational efficiency and safety performance of roundabout corridors. Second, it applies this methodology to two real-world corridors to test the hypothesis that hybrid configurations (combining roundabouts and signal-controlled junctions) may, in some cases, outperform fully homogeneous layouts. These objectives support a system-level approach to assessing corridor performance in terms of both traffic efficiency and safety, under fixed demand conditions. In detail, efficiency is defined as the ability of a road corridor to maintain stable and continuous traffic conditions, with low delay times corresponding to acceptable service levels throughout the system. In this study, efficiency is quantitatively assessed through four key performance indicators: average delay time, mean speed, total vehicle flow, and queue length. Safety, on the other hand, refers to the reduction of potential vehicle conflicts and critical interactions, evaluated through surrogate indicators derived from simulated vehicle trajectories. These definitions provide a clear analytical basis for the integrated evaluation of roundabout corridors in both operational and safety terms. The proposed approach integrates two main analytical components: traffic micro-simulation (using Aimsun Next software, version 22.0.1 [2,10,11]) and surrogate safety analysis (via the SSAM tool, version 3.0 [12,13,14,15,16]). This methodology enables the identification of the nonlinear effects that are often overlooked in traditional static models, which evaluate intersections as isolated entities. The approach is tested on two real-world case studies: the aforementioned Via Aurelia Nord corridor in Pisa (Italy), composed entirely of roundabouts, and the Route de Marseille corridor in Avignon (France), which currently features a hybrid layout combining roundabouts and signalized intersections. Both corridors satisfy the geometric and functional requirements of roundabout corridors as defined in the literature [17,18] but represent distinct stages of infrastructural development: the Italian case exemplifies a fully implemented transformation—revealing some paradoxical performance effects—while the French corridor is still in transition, with the potential for future upgrades. This contrast allows the methodology to be tested across different planning contexts and levels of infrastructural maturity, enhancing its generalizability. Additionally, the two corridors are located in distinct European urban environments, enabling a comparative assessment of corridor performance under heterogeneous yet typologically consistent conditions. Comparative simulations of multiple configurations enable the identification of critical design parameters and performance thresholds. As a result, the study explores possible corrective strategies for the Italian corridor and preventive strategies for the French corridor, including the possible use of Intelligent Transportation Systems (ITSs), such as Ramp Metering Systems, which may help mitigate or prevent emerging inefficiencies in both cases.
The paper is structured as follows: following this Introduction (Section 1), Section 2 provides a review of the most relevant literature on the main topics addressed by the paper; Section 3 presents the methodological framework, including the simulation tools and performance indicators adopted; Section 4 describes the two case studies—Via Aurelia Nord in Pisa and Route de Marseille in Avignon—detailing their geometric and functional characteristics; Section 5 discusses the simulation results and offers a critical interpretation of the findings, reflecting on their implications for corridor design and control strategies; finally, Section 6 summarizes the main conclusions and outlines directions for future research and planning applications.
2. Literature Review
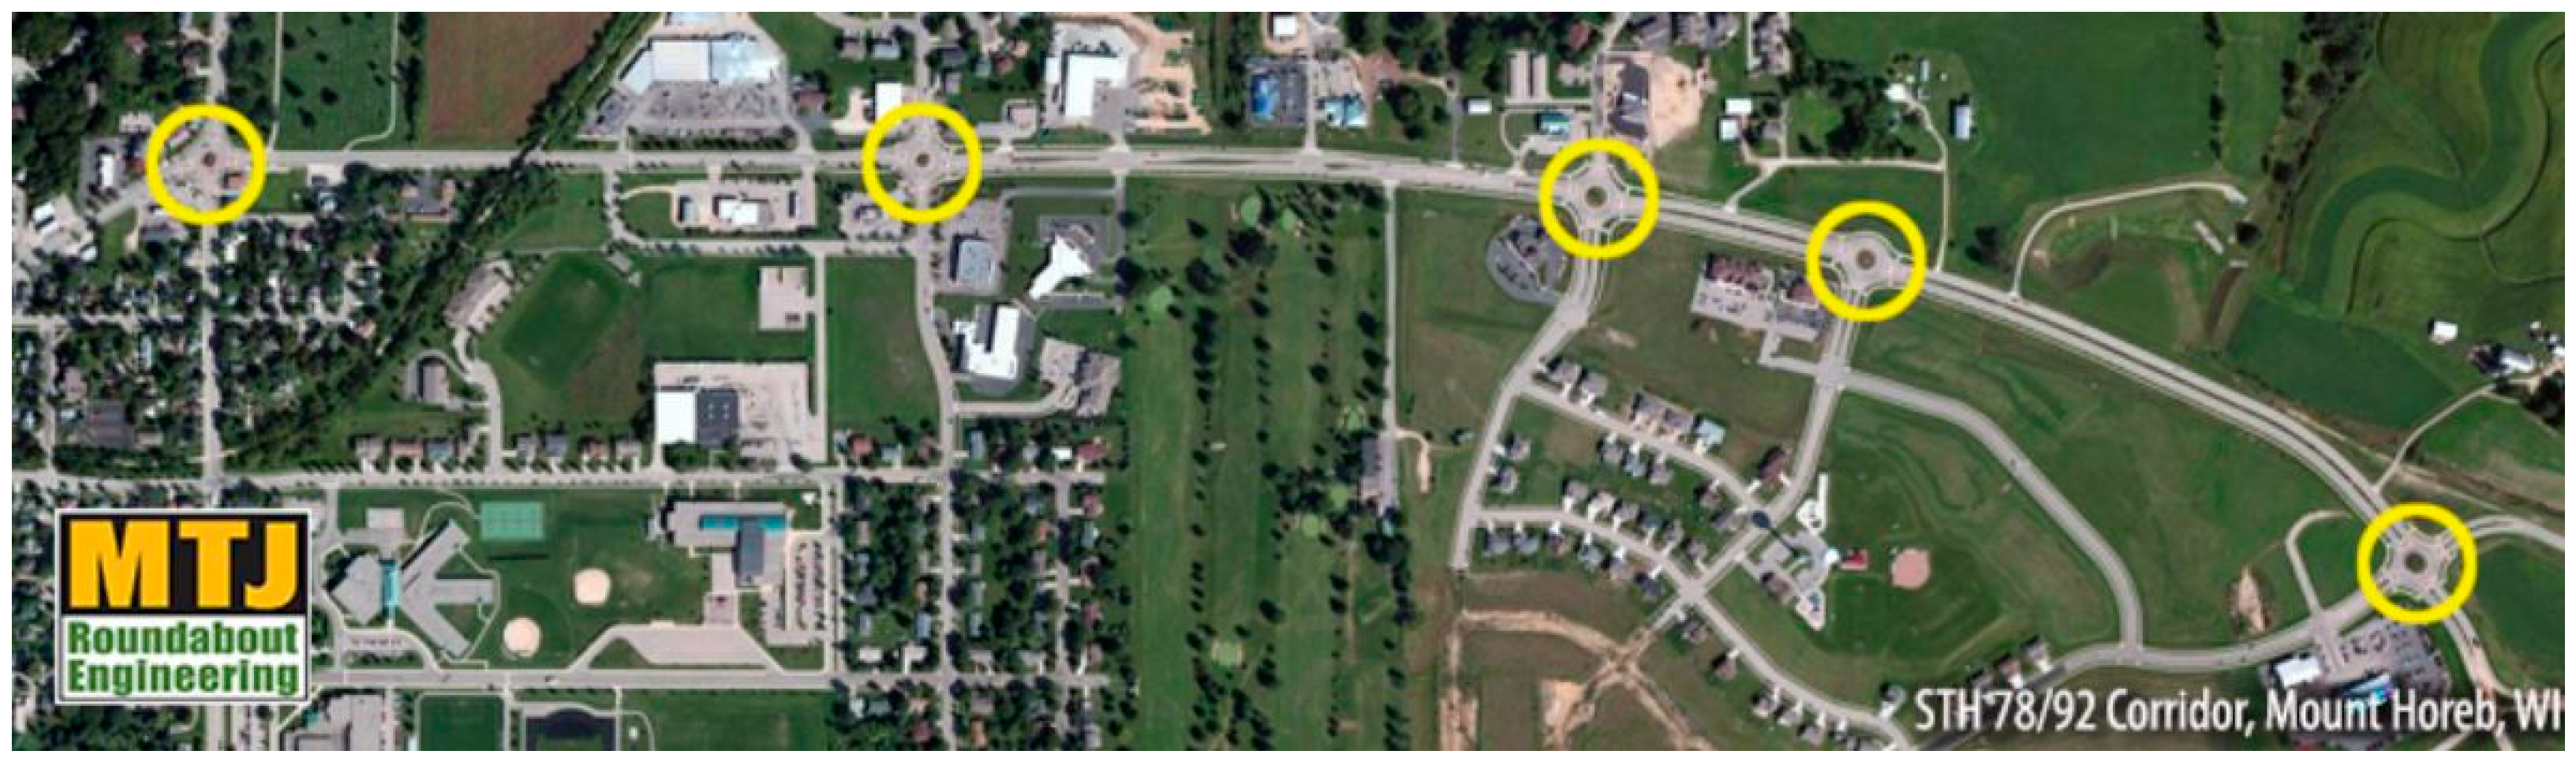
The study of road infrastructures composed of multiple consecutive roundabouts—delineated as roundabout corridors—has emerged as a significant topic in traffic engineering. A roundabout corridor, shown in Figure 1, is defined as “an infrastructure that includes a series of three or more roundabouts that function independently along an artery” [17]. These corridors typically exhibit the following characteristics:

Figure 1.
Example of a Roundabout Corridor along STH 78/92 in Mount Horeb WI, with the roundabouts considered in the corridor highlighted by yellow circles. (Source: MTJ Roundabout Engineering Website. Available online: https://www.mtjengineering.com/roundabout_corridors/ (accessed on 28 March 2025)).
- The corridor must have from three to six roundabouts;
- Branches must be two or four lanes, mainly suburban;
- Roundabouts must have one or two lanes in the ring;
- The speed limit must be between 25 mph (~40 km/h) and 50 mph (~80 km/h);
- The total length must be between 0.5 miles (~800 m) and 4.5 miles (~7200 m);
- The distance between two consecutive roundabouts must be between 650 feet (~200 m) and 6465 feet (~1970 m);
- The characteristics of the lateral arrangements may vary (e.g., the presence or absence of sidewalks, pedestrian crossings, cycle paths, rest areas).
These systems differ from signalized corridors in both operational logic and safety dynamics. Governed by gap-acceptance principles rather than fixed signal cycles, they influence vehicle platooning, entry delays, and speed profiles along the entire corridor.
Research has shown that roundabout corridors can improve travel time reliability, moderate vehicle speeds, and reduce crash severity, particularly by eliminating dangerous left-turn conflicts through the strategic use of U-turns [19,20,21,22,23]. However, conventional evaluation frameworks such as the Highway Capacity Manual (HCM) [24,25] lack dedicated methodologies for analyzing such corridors. To partially address this gap, a specific performance modeling framework has been proposed, incorporating the Free-Flow Speed (FFS), Roundabout Influence Area (RIA), geometric delay, and impeded delay [17,18]. However, these elements only allow for a static analysis of roundabout corridors and do not support effective comparisons between different intersection alternatives.
For this reason, a methodology based on dynamic simulation is required to capture the complex interactions within the corridor and evaluate alternative configurations more comprehensively in terms of both operational and safety performance. Moreover, the presence of unconventional roundabouts, including Two-Geometry and turbo designs, introduces further complexity that cannot be fully addressed using traditional capacity models. These layouts, which deviate from the classic circular geometry and are increasingly adopted, require refined simulation approaches and tailored safety analysis techniques [26,27,28,29,30,31,32]. As such, they should be appropriately considered within the study of roundabout corridors. Recent studies have leveraged dynamic microsimulations to capture corridor-wide dynamics with increasing precision. Tools such as Aimsun Next software 24.0.2 [2,10,11] provide a robust environment for modeling time-dependent traffic interactions at a microscopic level, simulating individual vehicle behaviors across complex networks. To complement efficiency analyses, the Surrogate Safety Assessment Model (SSAM) tool, developed by the Federal Highway Administration (FHWA), enables a proactive safety evaluation by identifying vehicle conflicts through surrogate safety metrics, such as the Time-to-Collision (TTC) and Post-Encroachment Time (PET) [12,13,14,15,16]. Unlike traditional crash-based methods, the SSAM tool evaluates safety conditions by analyzing vehicle trajectories exported from microsimulation models, detecting near-miss events and estimating their severity based on interaction dynamics [33,34].
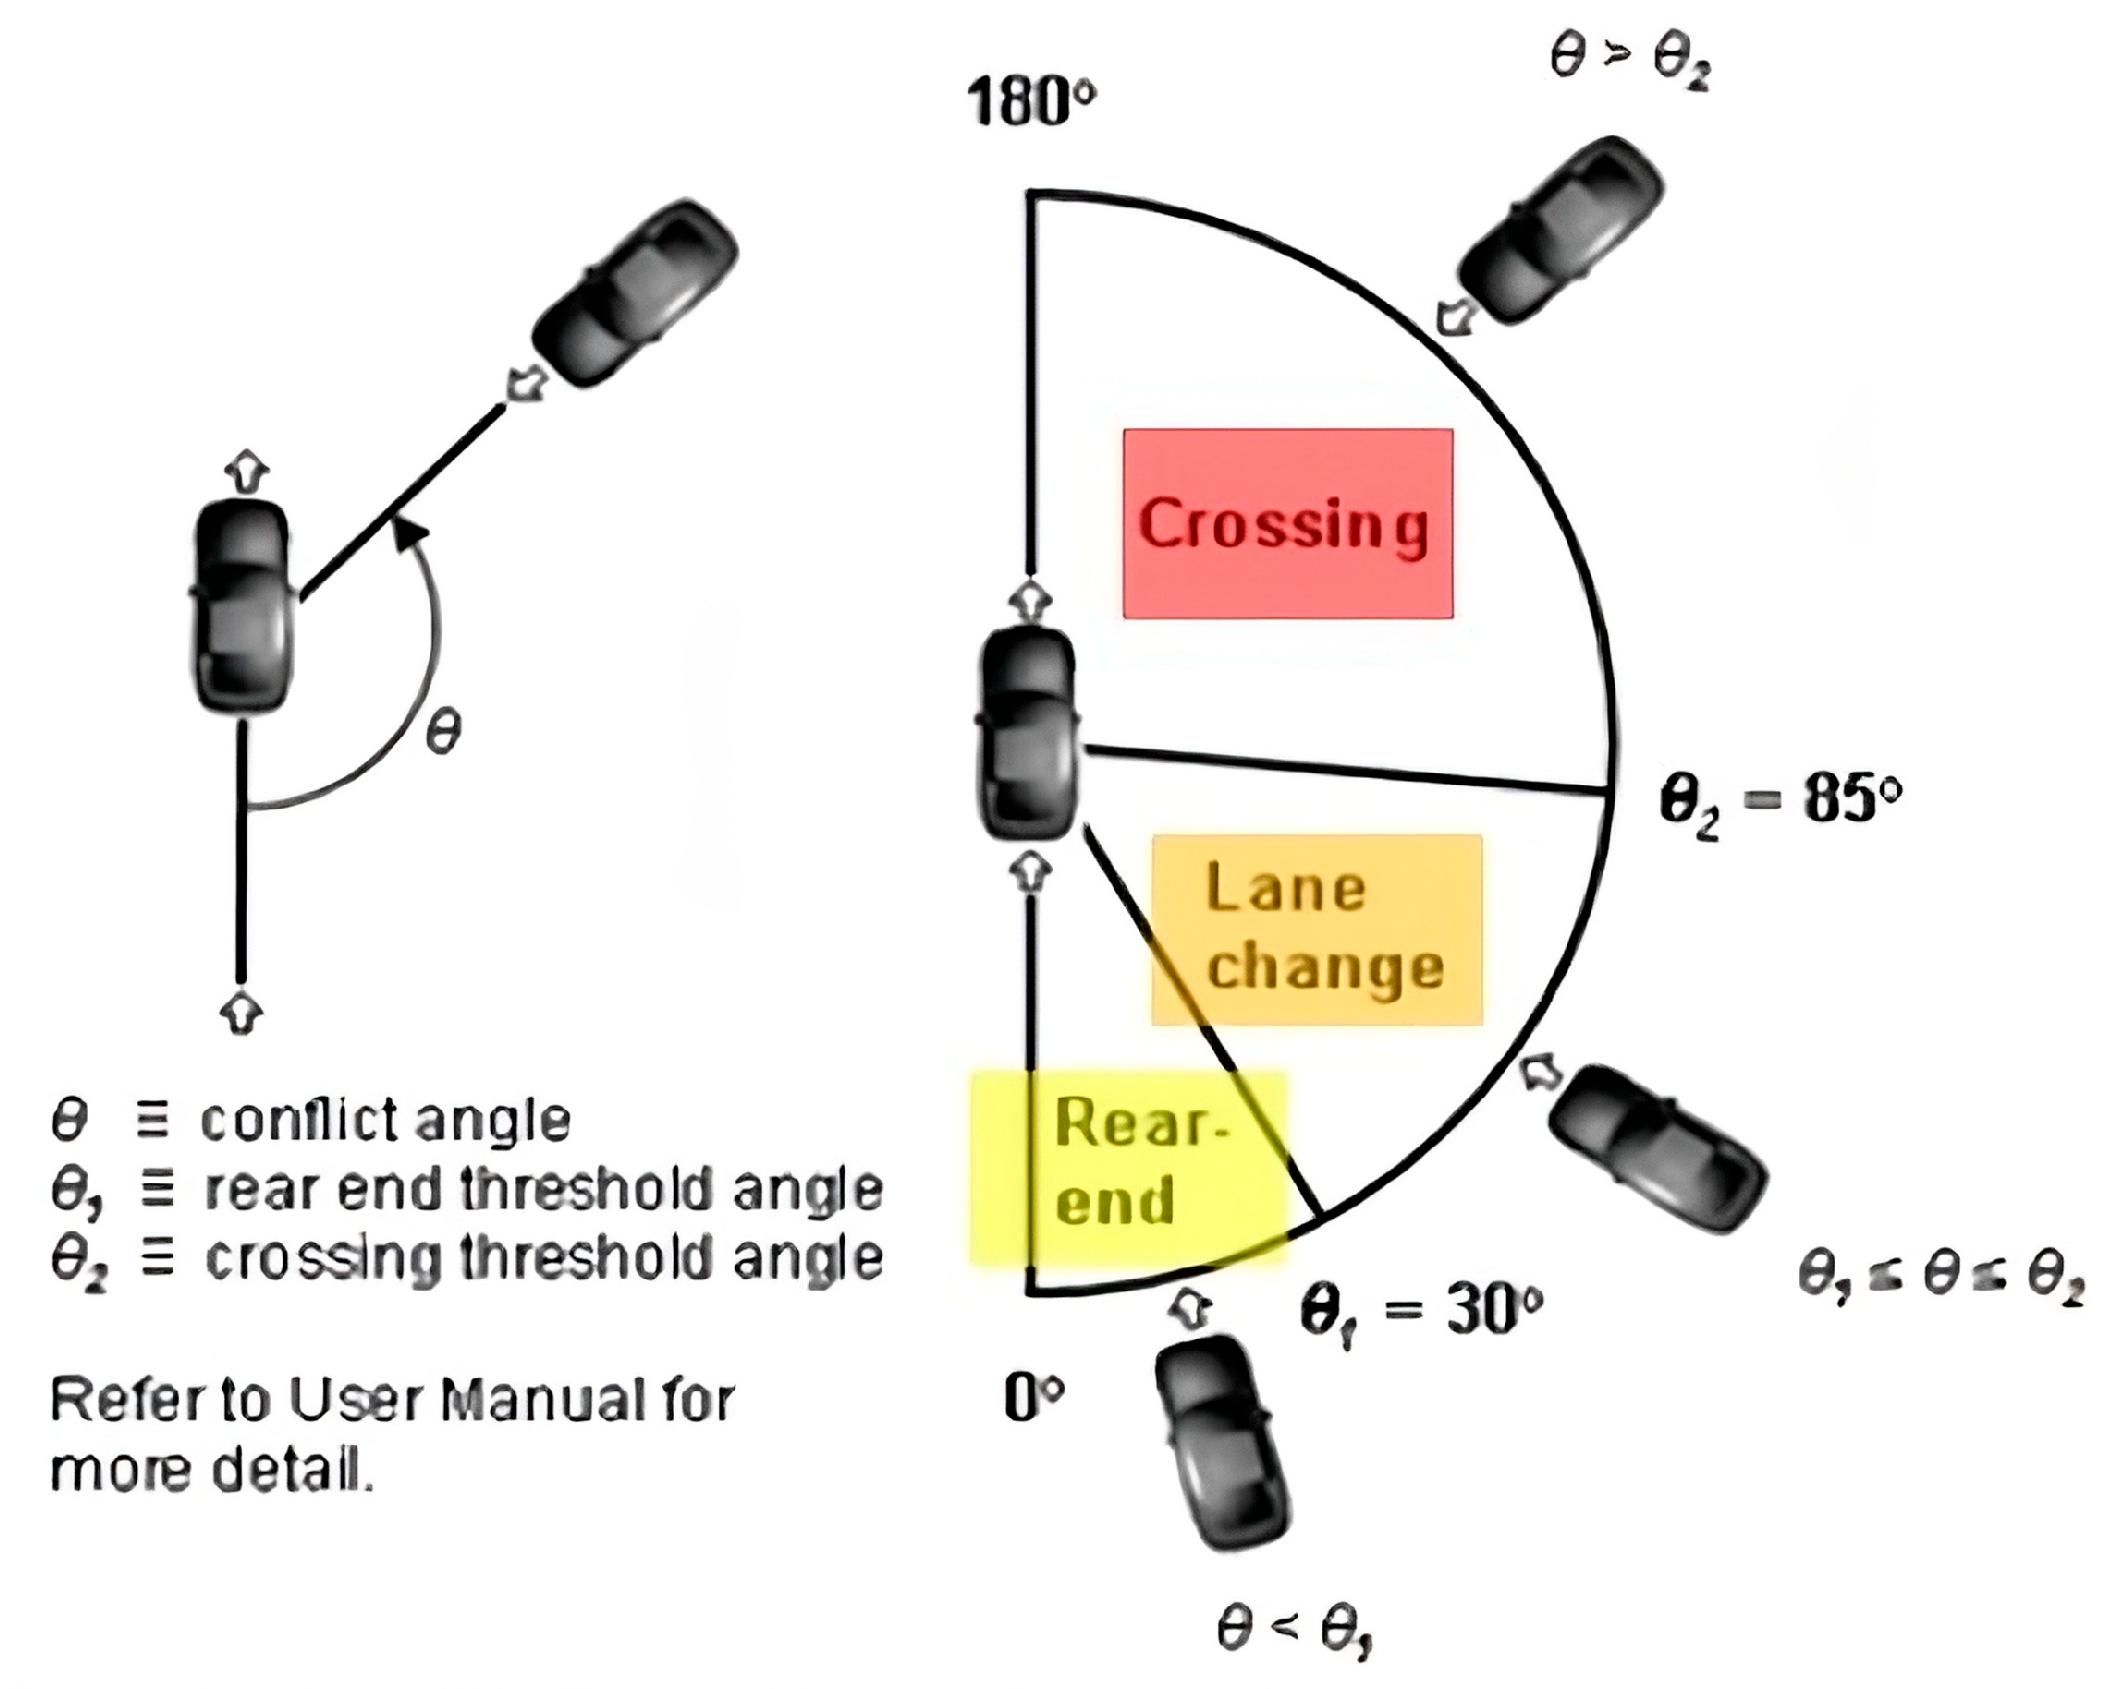
As shown in Figure 2, the SSAM tool classifies conflicts into three types—rear-end, lane-change, and crossing—based on the interaction angle between vehicle paths [12]. This categorization, combined with the possibility to adjust safety thresholds such as TTC and PET, allows for a refined and scenario-sensitive analysis of vehicle interactions. In this study, the SSAM tool was used in post-processing to assess the safety performance of the roundabout corridors.

Figure 2.
Conflicts angle diagram. (Source: SSAM tool).
Typically, the TTC threshold was evaluated using two values: 1.5 s, representing a standard safety benchmark where evasive maneuvers may still be feasible; and 0 s, identifying only the most critical conflicts where collision is imminent [15,35]. Other parameters were kept at their default values to ensure consistency across all tested scenarios [36]. The SSAM tool generates detailed reports, including the total number of conflicts, conflict type distribution, and severity indicators [16,37].
Some studies have also reported unexpected outcomes in roundabout corridors, with localized improvements producing adverse network-wide effects. These inefficiencies, often related to phenomena such as the Braess Paradox, highlight the importance of system-level assessments and support the use of simulation environments capable of capturing nonlinear interactions [5,6,7]. Building on Wardrop’s principles of user and system equilibrium [38], several traffic engineering paradoxes further challenge traditional infrastructure-improvement strategies. Notable examples include the Pigou–Knight–Downs Paradox, where added capacity can increase overall travel times [39]; the Downs–Thomson Paradox, where road expansion without corresponding public transport improvements can reduce system efficiency [40,41,42]; Beckmann’s Paradox, where local optimization leads to global inefficiencies [43,44]; and the Induced Demand Paradox, where added capacity generates additional traffic, offsetting any initial benefits [45,46]. These paradoxes are particularly relevant in roundabout corridors, where multiple interconnected intersections increase the probability of such counterintuitive effects. Therefore, adopting a systemic, simulation-based approach is essential to evaluate the impacts of alternative configurations and mitigate unintended consequences.
Even without explicitly referring to paradoxical effects, additional studies have highlighted the importance of assessing the broader network impacts and environmental consequences of intersection transformations. Some studies have evaluated the traffic-flow effects of converting signalized corridors into roundabout corridors, reporting mixed efficiency outcomes depending on the geometry and demand levels [47]. Others showed that replacing roundabouts with signals can markedly increase vehicle emissions, underscoring the need to weigh environmental trade-offs when selecting control strategies [48]. These studies highlight the need for a possible replicable simulation-based approach that can capture the operational and systemic implications of such transformations. This study builds upon the aforementioned contributions by proposing an integrated methodology for evaluating roundabout corridors, tested on real-world cases in Pisa and Avignon. The aim is to develop a replicable analytical approach that accounts for both operational and safety dimensions, offering insights for future design, planning, and policy-making.
3. Materials and Methods
This section outlines the methodological framework developed to assess the efficiency and safety of roundabout corridors—or road corridors in general—through a dynamic simulation. The presented approach considered road corridors as interconnected systems, modeling the interactions between successive intersections rather than analyzing each junction in isolation. This systemic perspective is crucial for identifying network-level effects—such as the emergence of traffic paradoxes—that may not be visible through traditional analysis techniques. The methodology integrates three core analytical components: traffic microsimulation using Aimsun Next software, surrogate safety assessment via the Surrogate Safety Assessment Model (SSAM) tool, and the post-processing of results using Microsoft Excel. These tools collectively enable a dynamic and multi-dimensional evaluation of corridor performance under varying geometric and control configurations. The proposed approach was applied to two real-world case studies: Via Aurelia Nord in Pisa (Tuscany, Italy) and Route de Marseille in Avignon (Provence, France).
These corridors were selected to represent distinct planning contexts—one in which full transformation into a roundabout corridor has already been implemented, and one still undergoing infrastructural transition. For each corridor, a calibrated base model was developed based on observed traffic data. Subsequently, multiple intersection configurations were simulated to explore the operational and safety outcomes of alternative layouts: 32 configurations for the Pisa corridor and 64 configurations for the Avignon corridor.
3.1. Methodological Framework
The methodological framework developed in this study integrates three complementary tools: Aimsun Next software, for traffic microsimulation at the corridor scale; the SSAM tool, for a proactive safety analysis based on vehicle trajectory conflicts; and Microsoft Excel, used for the processing of performance indicators and the aggregation of simulation outputs. The analysis adopts a systemic perspective, treating road corridors as interconnected systems of dynamically interacting intersections. This approach is based on the recognition that traditional node-based evaluations often fail to capture network-wide phenomena, including cumulative effects and paradoxical behaviors. In particular, the corridor in Pisa demonstrated that the full replacement of signalized intersections with roundabouts did not always yield performance improvements, especially under certain demand conditions—an observation consistent with the emergence of counterintuitive effects described in the literature on traffic paradoxes [4,5,6,7].
Aimsun Next software was selected for its capacity to simulate traffic behavior at multiple levels (micro, meso, macro) and for its ability to represent realistic vehicle interactions, signal control logic, and detailed network geometries [2,11,49]. The base models for each corridor were developed by accurately reproducing the physical road layout and by integrating the observed traffic demand through the Traffic State method. This method defines input flows and turn proportions for each entry section and junction, distinguishing between vehicle classes. Two distinct traffic states were created: CAR (95%) and TRUCK (5%), reflecting typical traffic compositions recorded during field surveys and consistent with established modeling practice [10]. Signalized intersections were replicated by applying the actual control plans, including phase splits and timing cycles, while behavioral parameters were adjusted to reflect realistic driving conditions. The calibration of the base models was conducted by refining three key parameters: “Simulation Step”, “Reaction Time at Stop”, and “Reaction Time at Signal” [50,51]. These values were adjusted iteratively to minimize discrepancies between observed and simulated traffic flows and were selected based on calibration performance. The final values adopted for each case study are reported in Section 4. The quality of calibration was assessed using the following:
- Correlation Coefficient (R);
- Theil’s Inequality Coefficient (U);
- GEH statistic.
They are considered with acceptance thresholds defined in accordance with international best practices [52,53,54]. In detail, for a model to be considered well-calibrated, the GEH value had to remain below 5 for at least 85% of the control points, in accordance with standard practice in traffic simulations [52]. Additionally, the calibration was evaluated using the Correlation Coefficient (R), which had to exceed 0.8 to confirm a strong positive relationship between observed and simulated traffic flows [54], and finally Theil’s Inequality Coefficient (U), which had to fall below 0.2 to indicate minimal average deviation and high predictive accuracy [53]. These thresholds collectively ensured that the simulation models offered a statistically sound and reliable representation of real-world traffic conditions. Moreover, driver behavior parameters—such as car-following models, lane-change aggressiveness, and gap acceptance thresholds—were retained at the default values provided by Aimsun Next across all scenarios. This modeling choice was made to maintain internal consistency and to isolate the effects of geometric and control configurations from those related to human behavior modeling. Although minor adjustments were made during the calibration phase to timing-related parameters, no local calibration of behavior models was performed. This ensures comparability across the full set of simulated scenarios but is acknowledged as a limitation of the study.
Future research could incorporate sensitivity analyses based on these behavioral parameters to assess their potential impact on both traffic efficiency and safety outcomes. Each configuration was tested with 12 replications of a one-hour duration, each using different random seeds to ensure robustness against stochastic variability [55]. The selected performance indicators included delay, flow, mean queue, and speed—metrics widely recognized in both national guidelines and simulation handbooks [10,56]. After simulating traffic dynamics, vehicle trajectory files (.trj) were exported and analyzed using the SSAM tool, which detects and classifies potential vehicle conflicts based on trajectory proximity, TTC (Time-to-Collision), and PET (Post-Encroachment Time). The SSAM tool categorizes conflicts into rear-end, lane-change, and crossing types, and outputs statistics such as the total number of conflicts, type distribution, and minimum TTC/PET values [12,35,57]. In this study, the analysis focused specifically on the Time-to-Collision (TTC) indicator, using two threshold values: 1.5 s, as a standard safety reference, and 0 s, to isolate only the most critical conflicts [15,42]. All other parameters were kept at their default settings to avoid introducing additional sources of variability and to ensure consistency across all simulation scenarios [34,36]. This modeling choice was made in the absence of reliable local calibration data for SSAM parameters and aimed to preserve internal consistency across all simulated configurations. Given the study’s focus on comparative performance under controlled conditions, modifying default values without empirical validation would have introduced unnecessary uncertainty. Nonetheless, it is acknowledged that default SSAM parameters may not fully capture the specific safety dynamics of each corridor. For this reason, their influence could be explored in future research through dedicated sensitivity analyses. To explore the influence of intersection types on overall corridor performance, all possible geometric and control combinations were simulated for each case study. The Pisa corridor, consisting of five intersections, allowed for 32 alternative configurations; the Avignon corridor, composed of six intersections, permitted 64 configurations. The total number of combinations was calculated using the binomial coefficient [58], enabling a structured exploration of layouts with different numbers of roundabouts and traffic-light-controlled junctions. Each configuration was modeled by modifying the intersection control types while preserving the same geometric alignment and demand distribution. Signal plans were inserted where necessary, and vehicle movements were updated accordingly. All scenarios were evaluated under fixed demand conditions to ensure comparability. Traffic efficiency was assessed using time series data from Aimsun Next software, with a focus on four key metrics:
- Delay Time (s/km);
- Flow (veh/h);
- Mean Queue (veh);
- Speed (km/h).
Safety performance was evaluated using the SSAM tool conflict data, with a particular emphasis on events detected at TTC = 0 s, corresponding to near-certain crash conditions. While both thresholds (0 s and 1.5 s) were initially considered to explore the spectrum of conflict severity, the comparative analysis of the simulated configurations was conducted exclusively using the TTC = 0 s threshold, to isolate and quantify only those interactions where no evasive maneuver was feasible. This choice ensured a more conservative evaluation of safety performance, focusing on the most critical and realistic collision scenarios. As previously shown in Figure 2, the SSAM tool classifies vehicle conflicts into three main types:
- Crossing conflicts: occur between vehicles on intersecting trajectories, typically at junctions;
- Rear-end conflicts: involve vehicles traveling in the same direction within the same lane;
- Lane-change conflicts: result from lateral maneuvers between adjacent lanes.
These categories were summed to also obtain the total number of interactions, referred to as total conflicts, which served as the primary safety metric for comparing the simulated scenarios. To further normalize the safety analysis across configurations, a Conflict Rate per Vehicle (CRV) index was introduced. This indicator accounts for both the frequency and severity of conflicts relative to the total traffic volume. It was calculated by weighting each conflict type according to its crash potential, with crossing conflicts assigned a weight of 0.5, rear-end conflicts 0.3, and lane-change conflicts 0.2. These values were also selected in accordance with similar weighting schemes adopted in previous studies, to ensure comparability and methodological consistency [12,13,14,36]. The CRV was computed using Equation (1), which aggregates conflict data across types and relates them to the total number of vehicles simulated in each scenario.
where Ci represents the number of conflicts of type i, wi is the weight assigned to the conflict type, and Q is the total number of vehicles (flow) in the corridor in the simulation considered. This allowed for a safety assessment that considered not only the number of conflicts but also their relative criticality. Compared to absolute conflict counts, the Conflict Rate per Vehicle (CRV) enables a normalized evaluation that accounts for total traffic volumes. This is particularly important because, although the simulations were run under fixed demand conditions, the actual simulated flows extracted from the time series may vary slightly across scenarios due to internal stochastic dynamics. By referencing the effective simulated vehicle flow, the CRV ensures consistency in safety comparisons across configurations. In addition, the weighted formulation based on conflict types adds a layer of interpretability, as it reflects the relative severity of different interaction categories. This type of composite indicator has been adopted in previous research and provides a more robust basis for cross-scenario evaluations. By systematically testing and comparing a wide range of control strategies and intersection layouts, this methodology supports data-driven decision-making for the optimization of urban arterial corridors. It enables the identification of configurations that maximize both efficiency and safety, while also revealing the conditions under which paradoxical outcomes may emerge. The comparison was conducted using Microsoft Excel, which was employed for the processing of performance indicators and to aggregate performance indicators into comparative tables. Before proceeding to the next section and in order to enhance the transparency and reproducibility of the proposed methodology, the complete workflow is summarized below:
- Data collection: geometric layouts (from field surveys and orthophotos), traffic counts, turn proportions, and signal plans;
- Model development: network building and traffic state definition in Aimsun Next;
- Model calibration: iterative adjustment of behavioral parameters, validated using GEH, Theil’s U, and Correlation Coefficient R;
- Scenario simulation: generation of all feasible R/TL combinations (32 for Pisa, 64 for Avignon), each simulated with 12 replications under fixed demand;
- Surrogate safety assessment: trajectory export and conflict analysis using SSAM (TTC = 0 s threshold), with classification of conflict types;
- Post-processing and comparison: aggregation of efficiency (delay, flow, queue, speed) and safety (conflicts, CRV) indicators using Excel;
- Interpretation of results: identification of optimal layouts and detection of system-level inefficiencies and paradoxical effects.
3.2. Case Study Areas
The methodological framework described above was applied to two urban arterial corridors located in different European contexts: Via Aurelia Nord in Pisa (Tuscany, Italy) and Route de Marseille in Avignon (Provence, France). Both corridors feature multiple intersections distributed along a linear axis, and both are undergoing or have undergone transformation processes involving the progressive conversion of traffic-light-controlled junctions into roundabouts. The Pisa corridor is located in the western sector of the city and is part of the SS1 national road. It includes five intersections that were originally regulated by traffic signals but were progressively converted into roundabouts between 2008 and 2021. This transformation aimed to improve traffic flow and reduce delays at junctions. However, as discussed in previous sections, the expected benefits were not consistently achieved across all traffic conditions. In fact, this specific case was the initial motivation for the entire research. The observed limitations—particularly regarding delay reduction under certain traffic scenarios—raised critical questions that ultimately led to the development of the simulation-based methodology presented in this study. The current layout of the corridor and the position of its five roundabouts are shown in Figure 3.
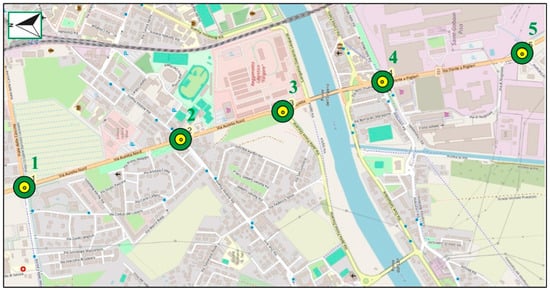
Figure 3.
Italian roundabout corridor in Pisa, scale 1:15,000, with the numbered circles indicating the five roundabouts that compose the corridor. (Source: OpenStreetMap. Available online: https://www.openstreetmap.org/ (accessed on 21 February 2025)).
The main geometric characteristics of the five roundabouts were accurately reproduced in the simulation model based on field observations and orthophotos. The corridor has a speed limit of 50 km/h and a total length of 2345 m. The distances between intersections are as follows: L1–2 = 735 m, L2–3 = 495 m, L3–4 = 465 m, and L4–5 = 650 m.
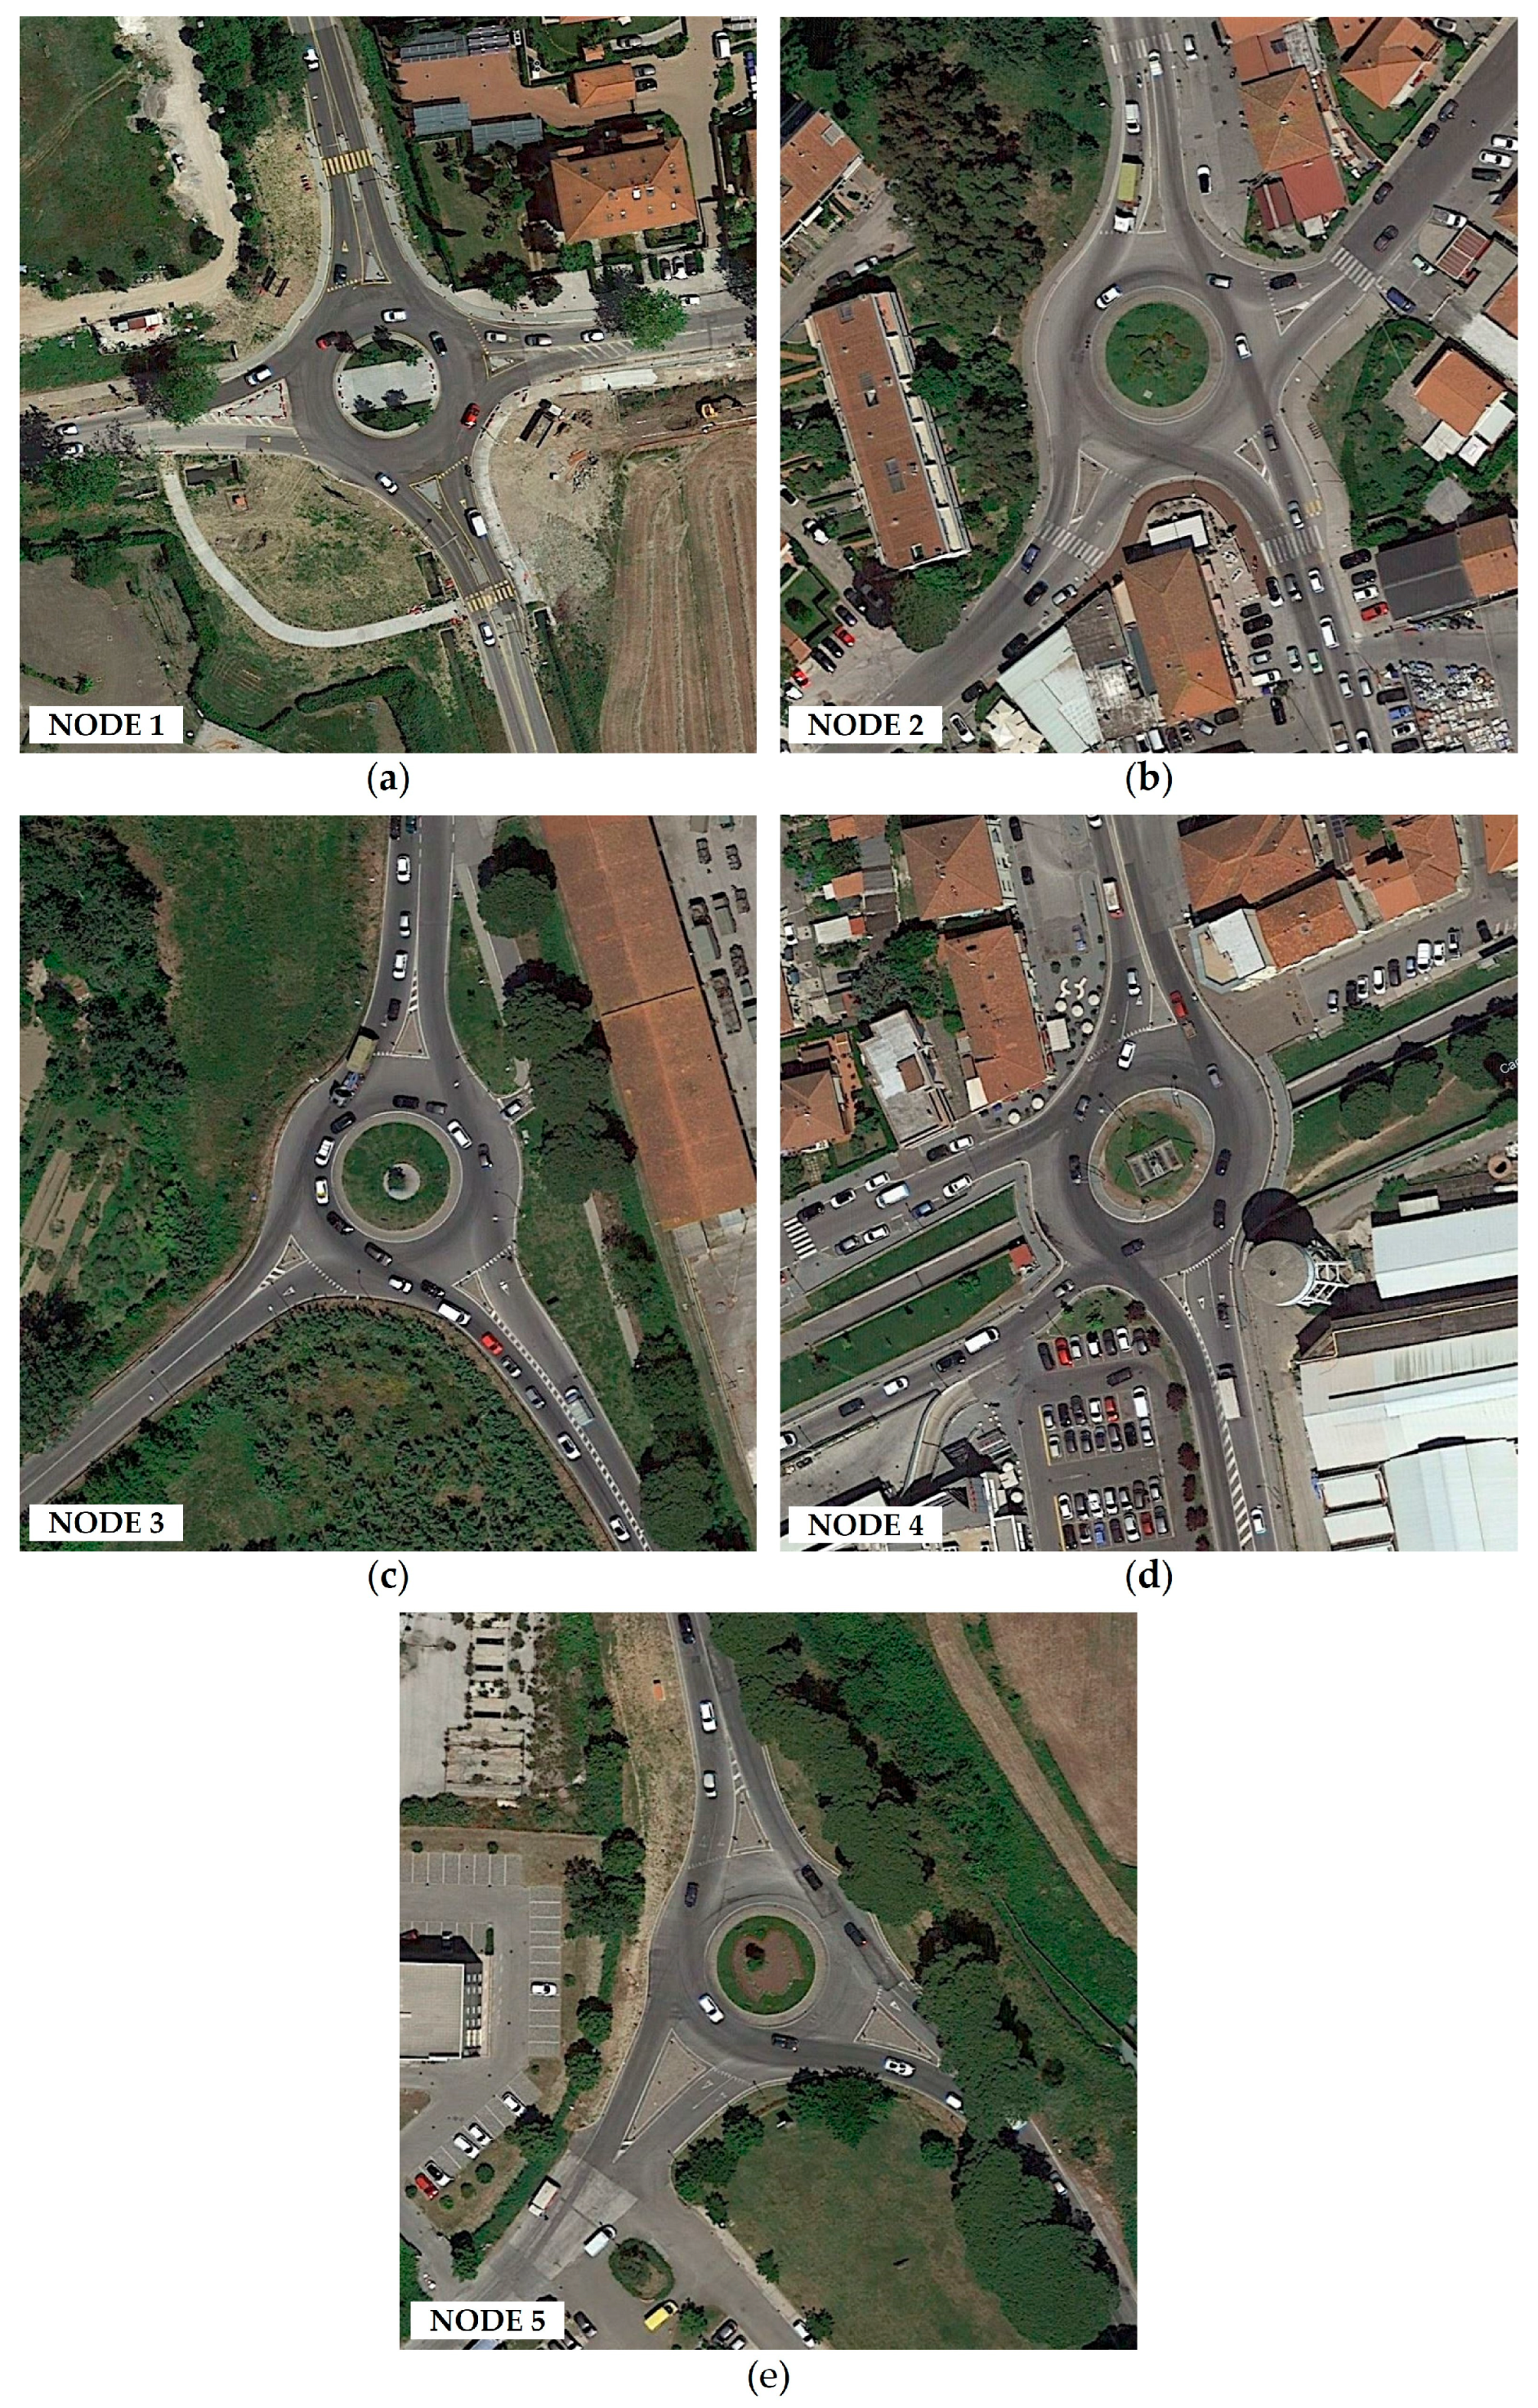
Annotated aerial views of the five roundabouts are shown in Figure 4, illustrating the layout and orientation of each node along the corridor. The corresponding geometric features are summarized in Table 1.

Figure 4.
Aerial views of the five roundabouts comprising the Pisa corridor: (a) Node 1; (b) Node 2; (c) Node 3; (d) Node 4; (e) Node 5. (Source: Google Earth Pro. Available online: https://www.google.com/earth/ (accessed on 21 February 2025)).

Table 1.
Geometric features of the five roundabouts comprising the Pisa corridor.
The corresponding O/D matrices used to simulate traffic demand in the Pisa corridor are presented in Figure 5. These were obtained through direct field traffic surveys and subsequently processed to define entry flows and turn proportions at each junction within the simulation model.
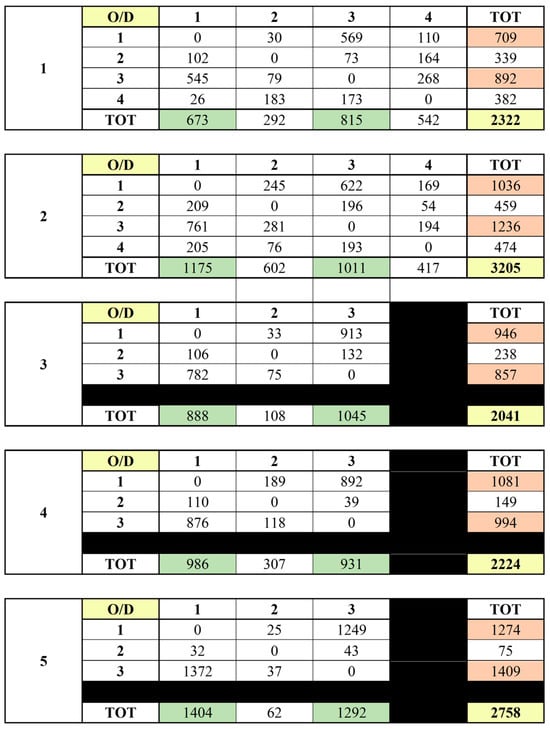
Figure 5.
Summary of the five O/D matrices of the Pisa corridor. Green and orange values indicate the total number of vehicles entering and exiting each intersection from the North and South along the main axis (Via Aurelia Nord), while yellow values represent the total number of vehicles per hour circulating within each intersection. (Source: authors).
In detail, all traffic data were collected through direct field surveys using digital cameras installed at each intersection. These measurement campaigns were authorized by local authorities and conducted in accordance with standard traffic engineering procedures. Two digital cameras were used, mounted on tripods and positioned at strategic locations near the entries of each node. Each device was configured to record both entering and exiting vehicles from one or more branches of the intersection. The video recordings were then processed in the laboratory to extract vehicle movements. For each roundabout, an origin-destination (O/D) matrix was generated by manually counting entries and exits and applying an iterative balancing algorithm to estimate turning movements based on observed inflow and outflow volumes. This process ensured a site-specific and consistent demand model for each corridor, accurately reflecting the traffic dynamics observed during peak periods.
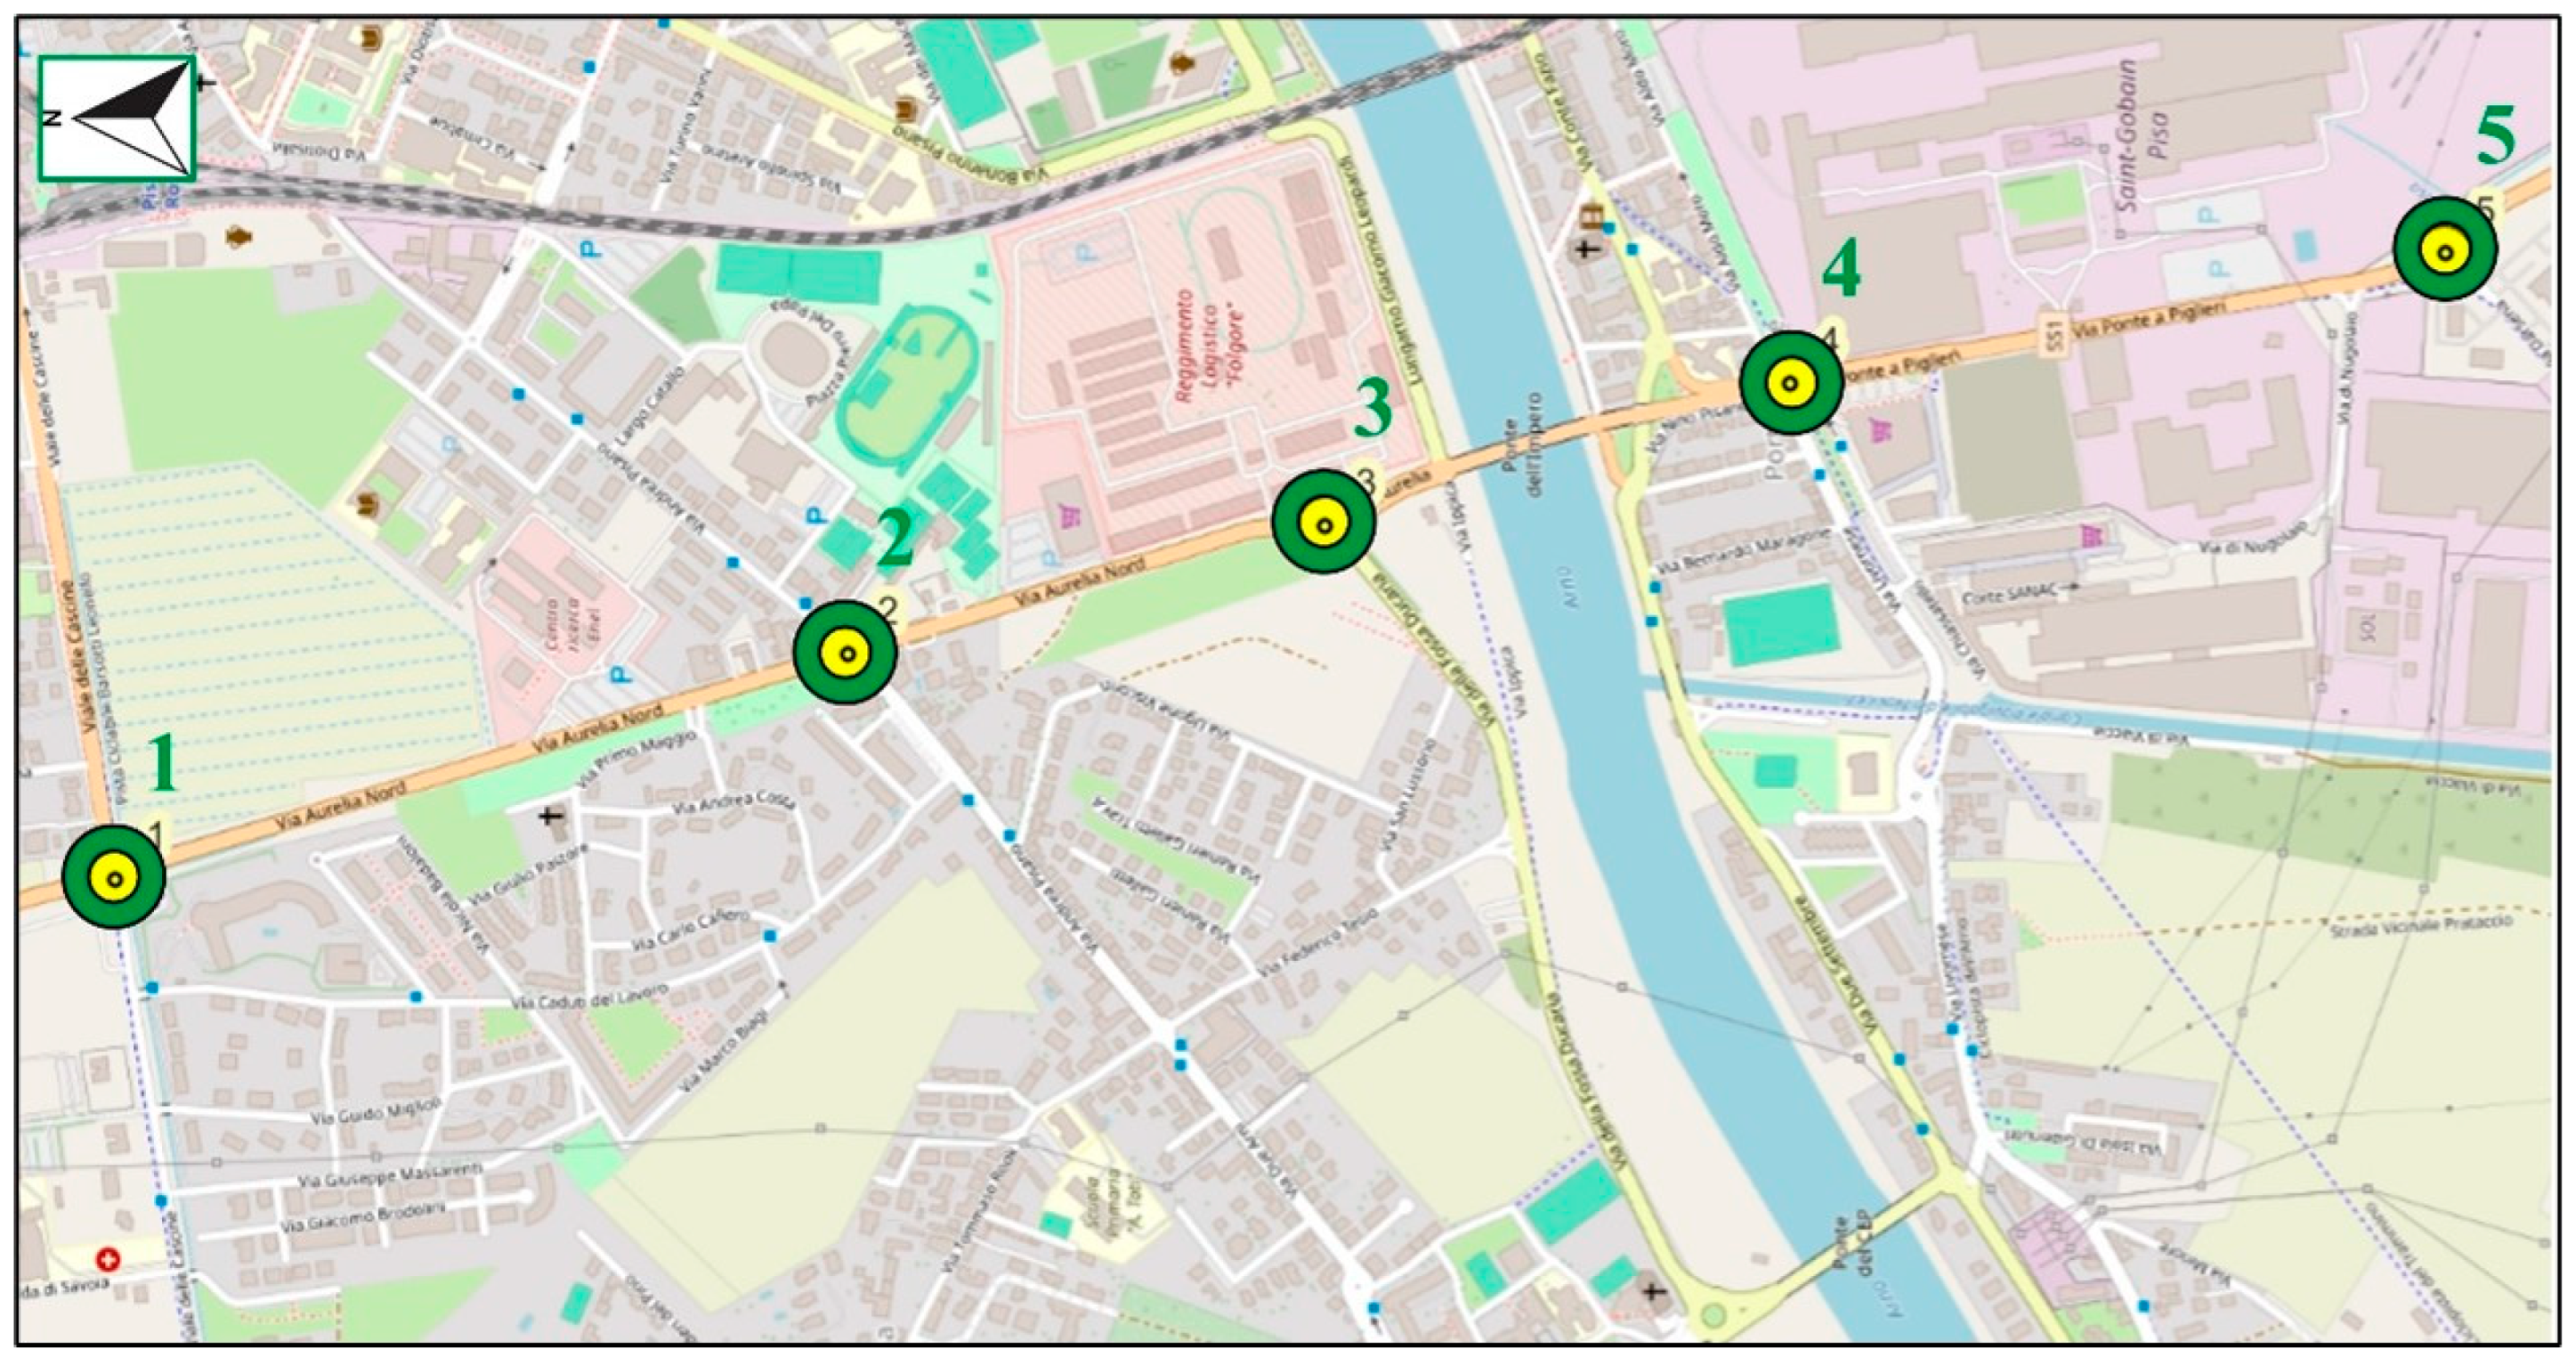
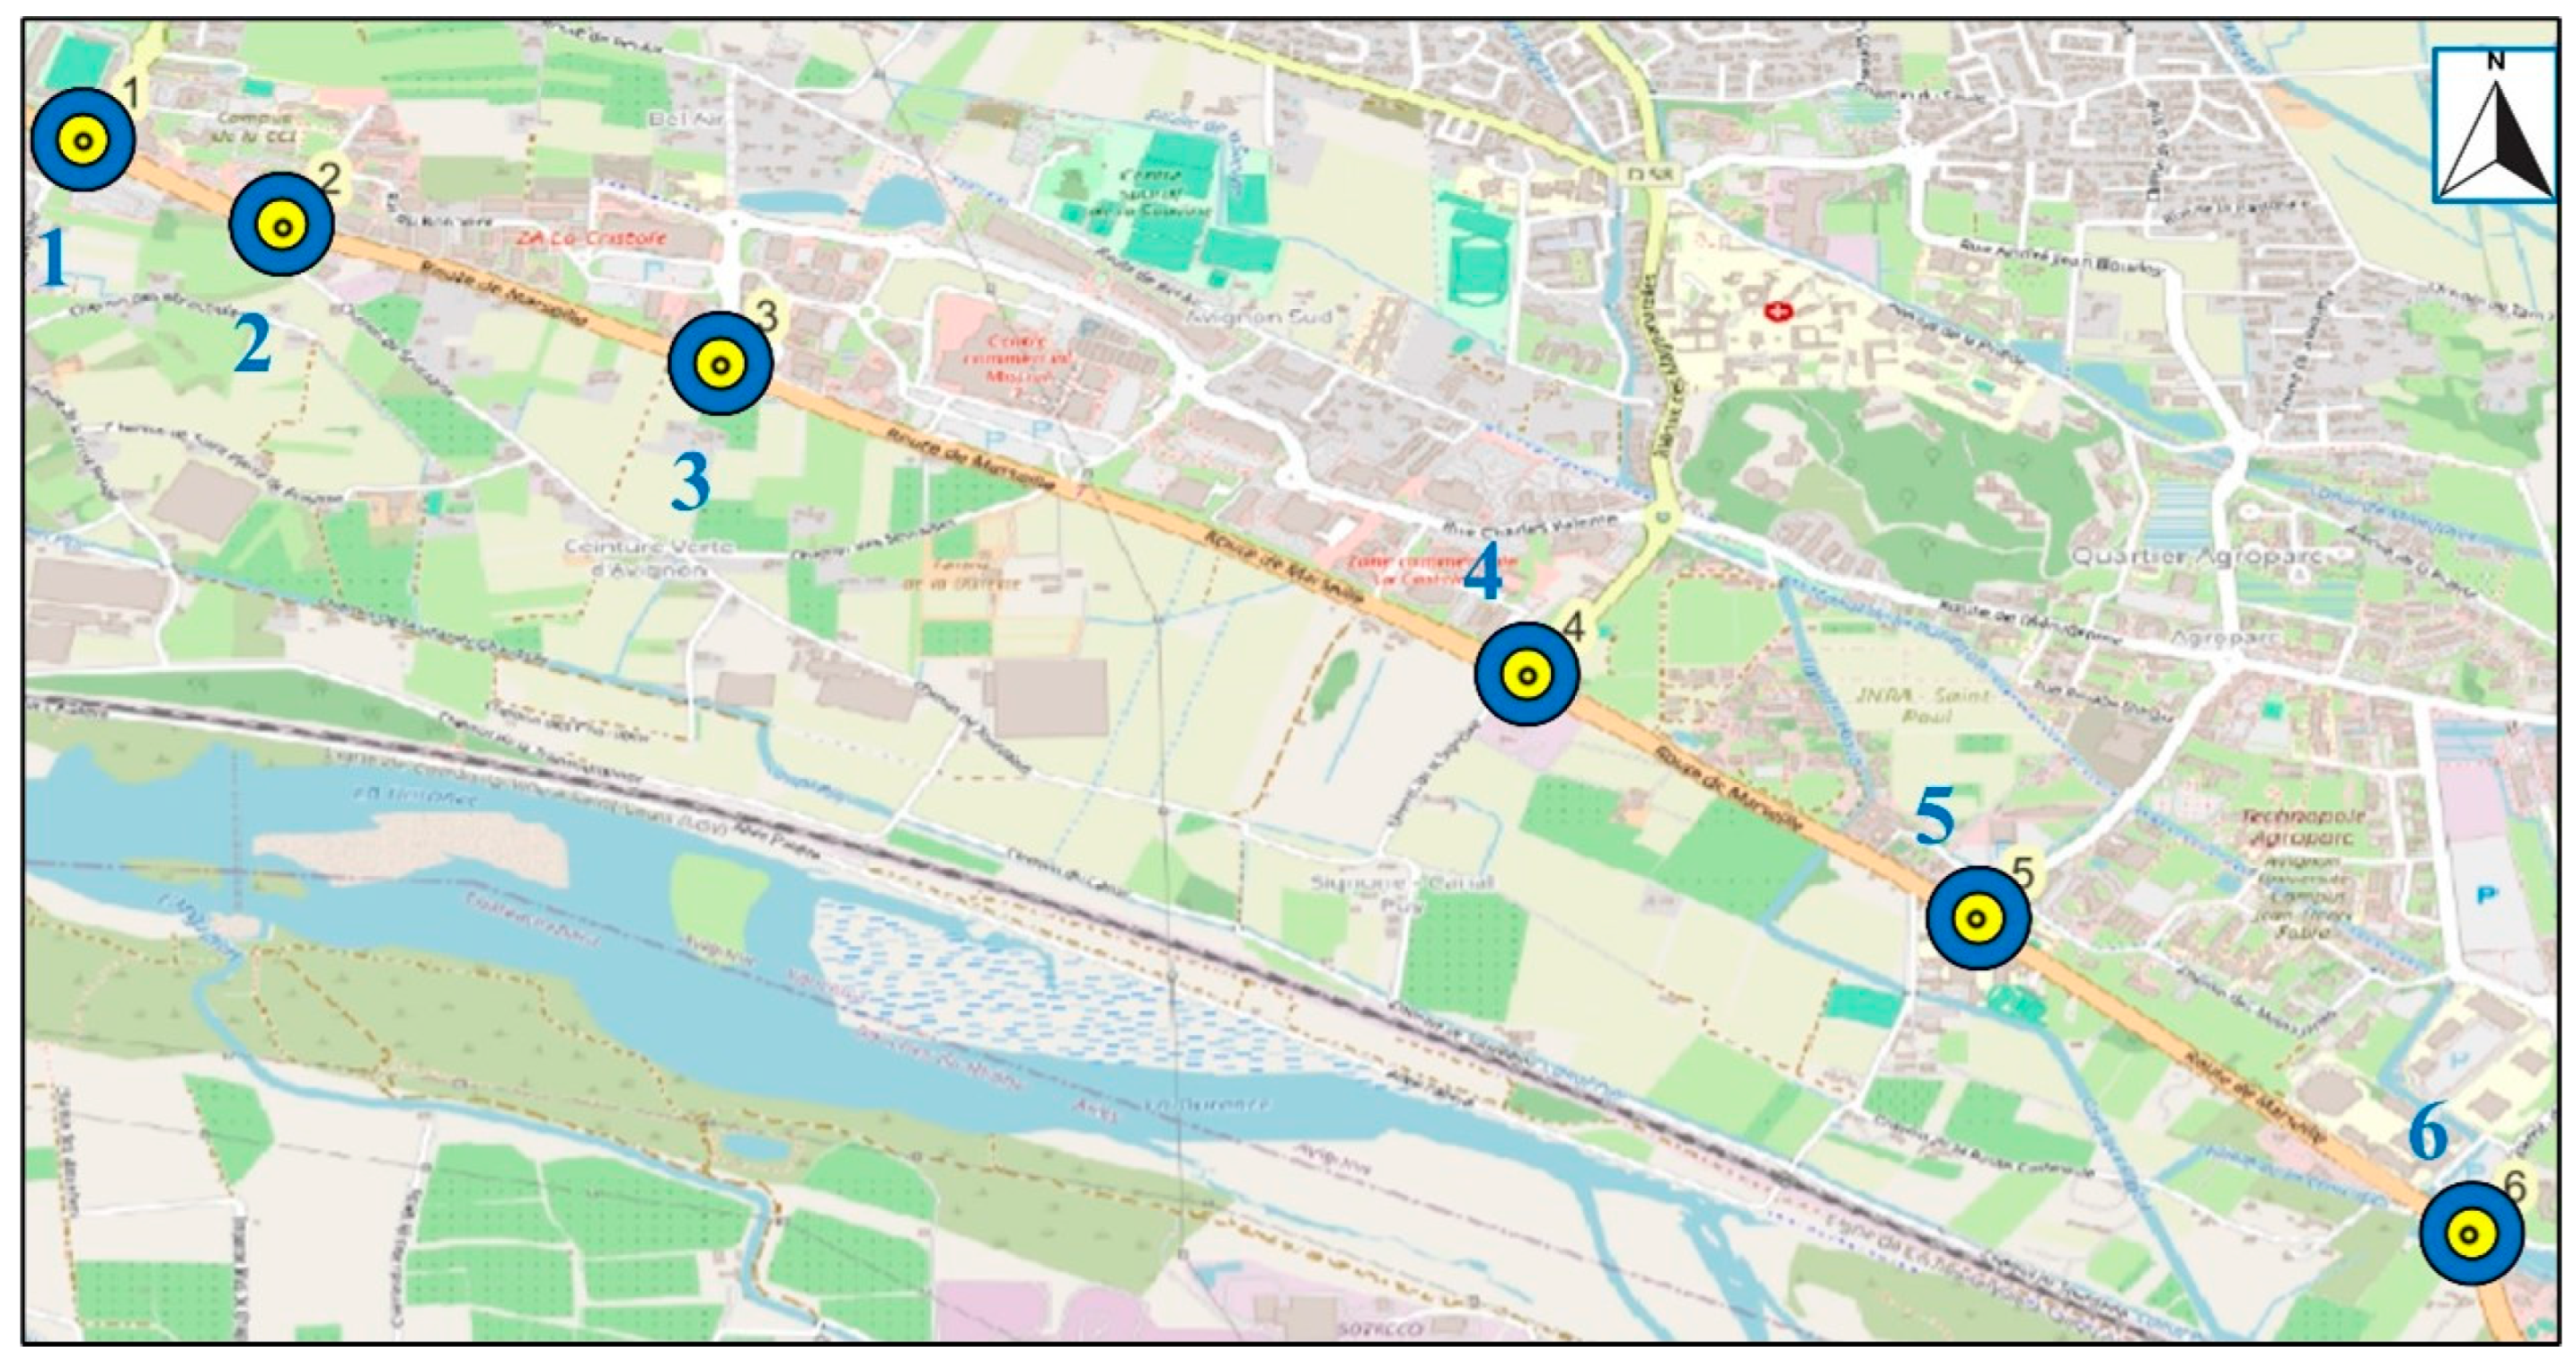
The Avignon corridor, located along the Route de Marseille in the southern part of the city, consists of six intersections. Three are already configured as roundabouts (nodes 1, 4, and 6), while the remaining three (nodes 2, 3, and 5) operate as hybrid nodes combining roundabout geometry with traffic signal control. This intermediate configuration reflects an ongoing infrastructure-upgrade process aimed at full roundabout conversion. The spatial layout of the six intersections is shown in Figure 6.
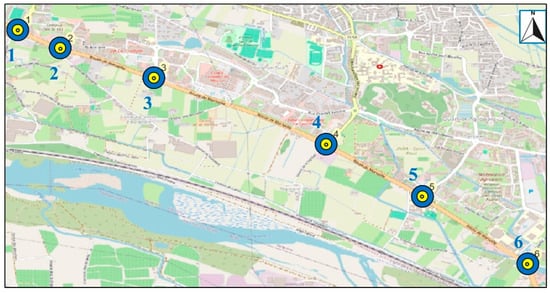
Figure 6.
French roundabout corridor in Avignon, scale 1:15,000, with the numbered circles indicating the six intersections that compose the corridor (Source: OpenStreetMap. Available online: https://www.openstreetmap.org/ (accessed on 21 February 2025)).
The main geometric characteristics of the six intersections were accurately reproduced in the simulation model based on field observations and orthophotos. The corridor has a speed limit of 70 km/h and a total length of 4670 m. The distances between intersections are as follows: L1–2 = 385 m, L2–3 = 775 m, L3–4 = 1505 m, L4–5 = 930 m, and L5–6 = 1075 m.
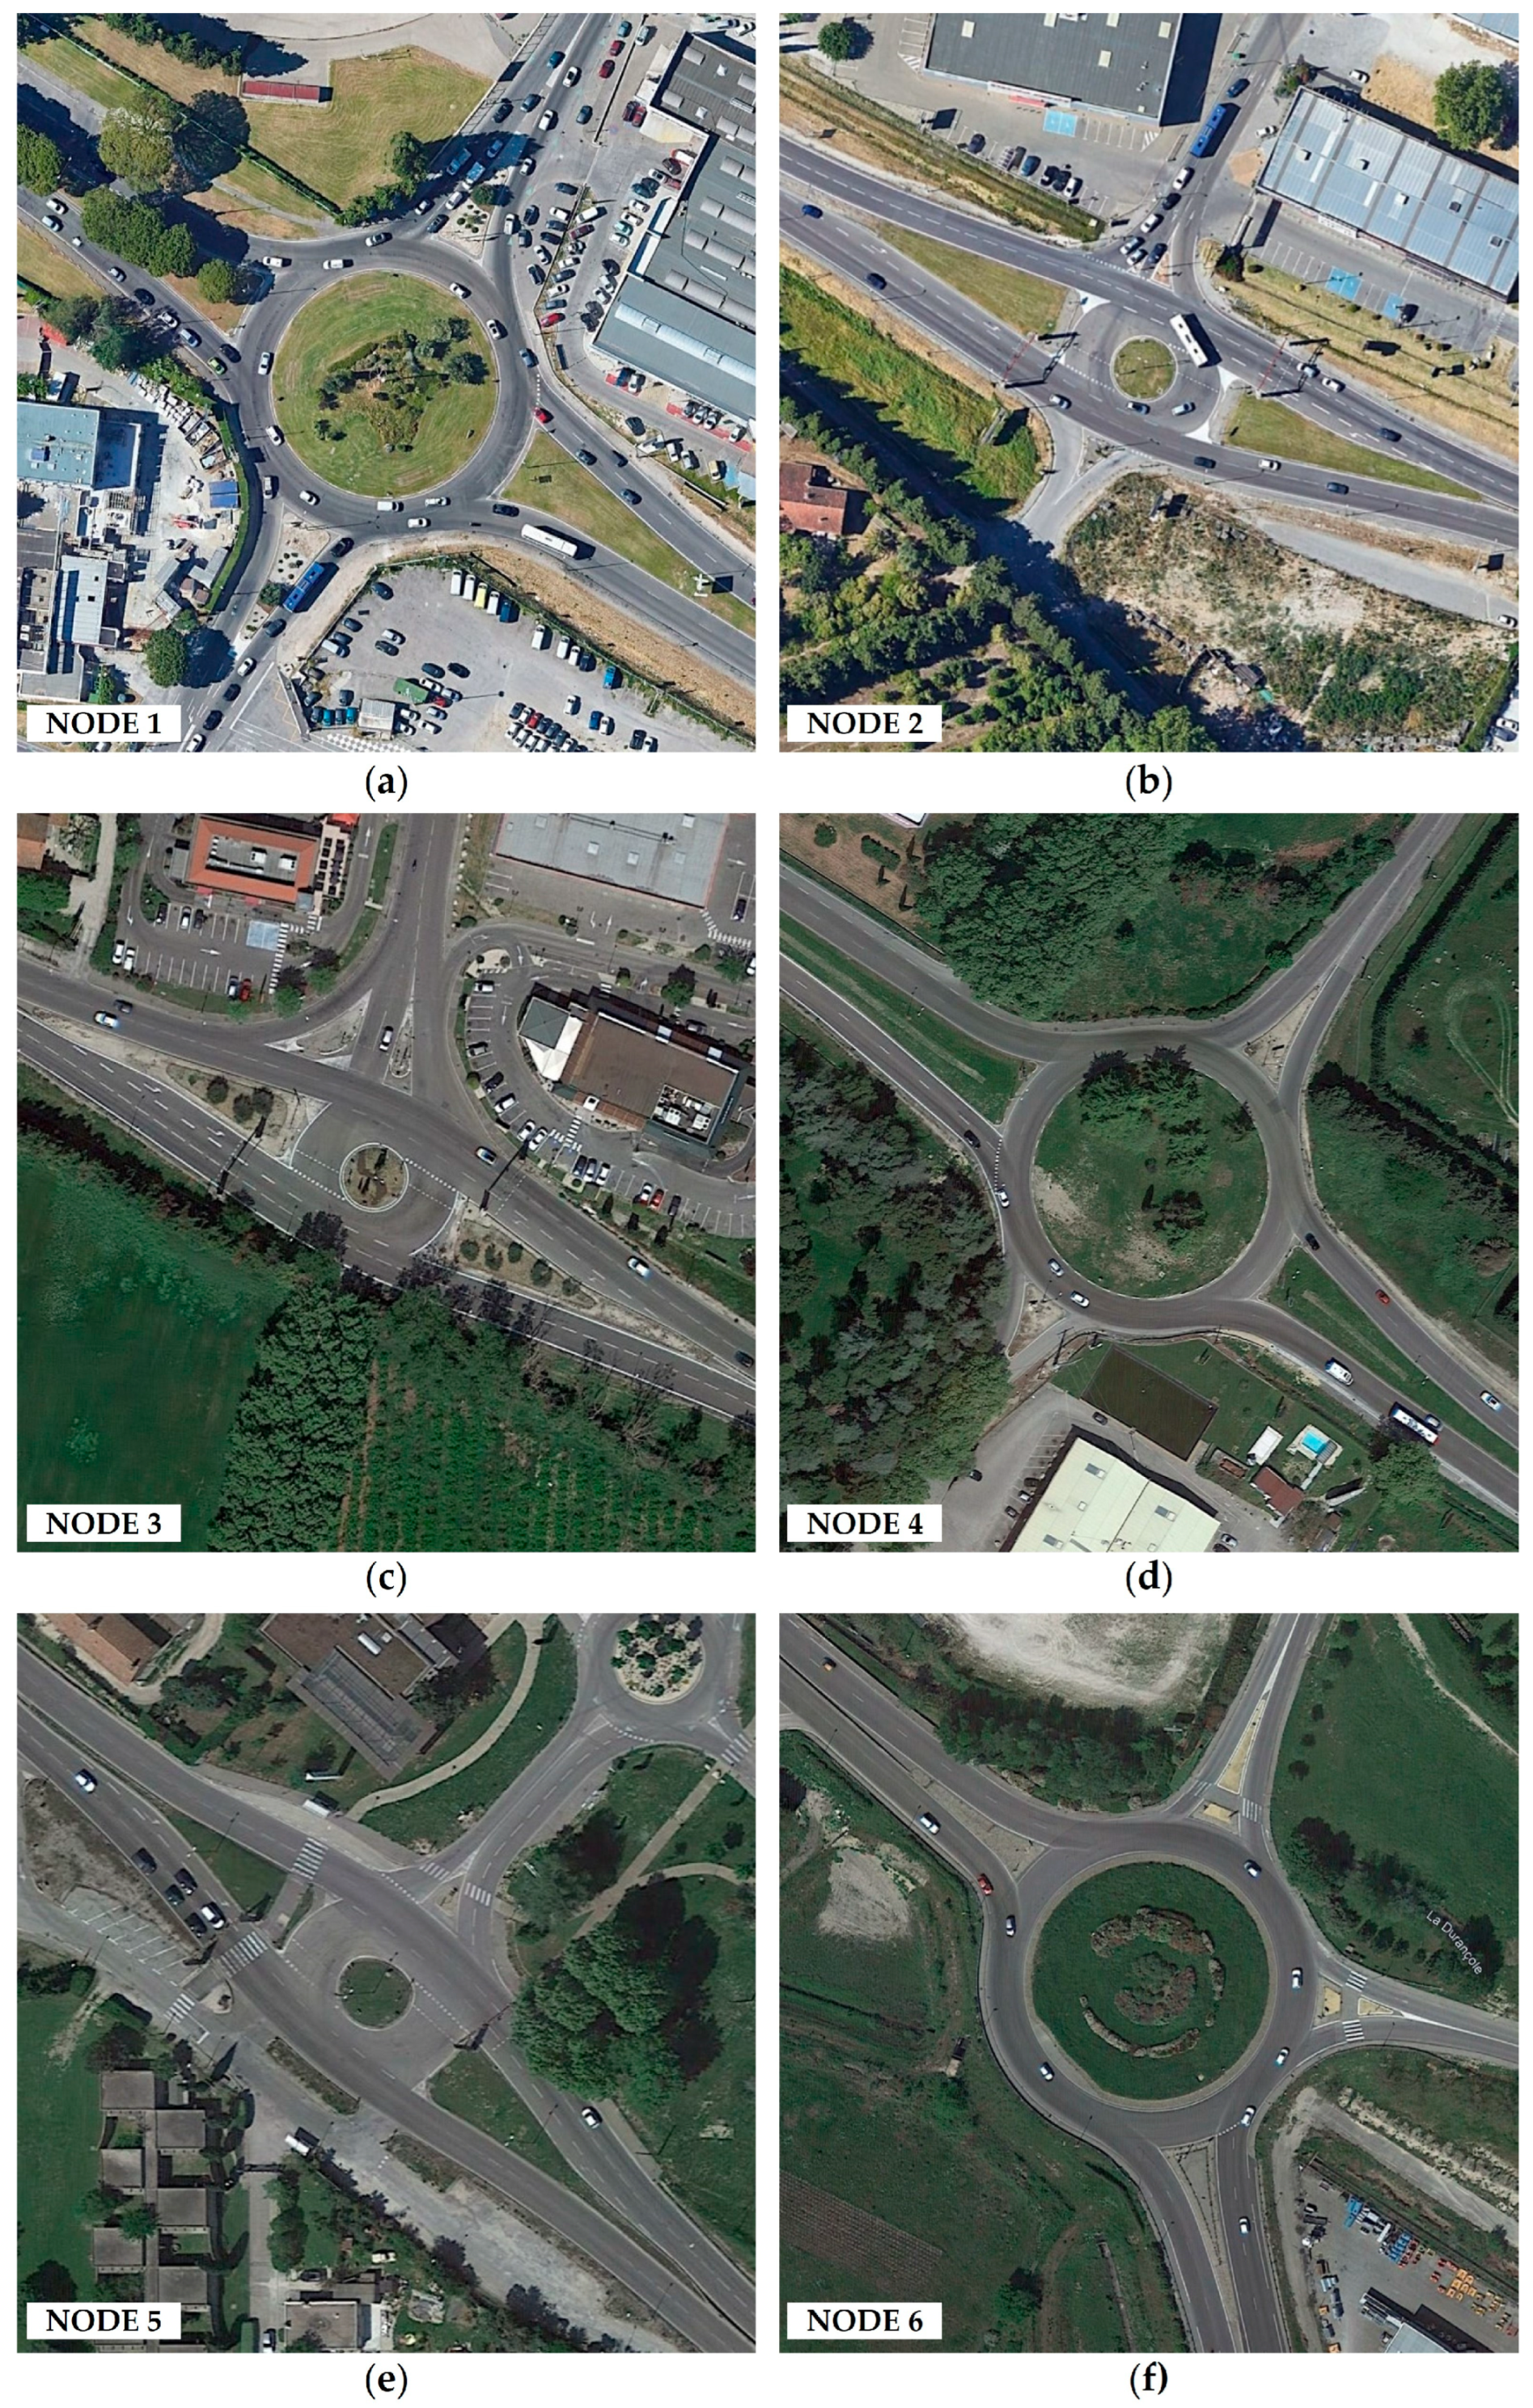
As for the Pisa corridor, annotated aerial views of the six intersections are shown in Figure 7, illustrating the layout and orientation of each node along the corridor. The corresponding geometric features are summarized in Table 2.
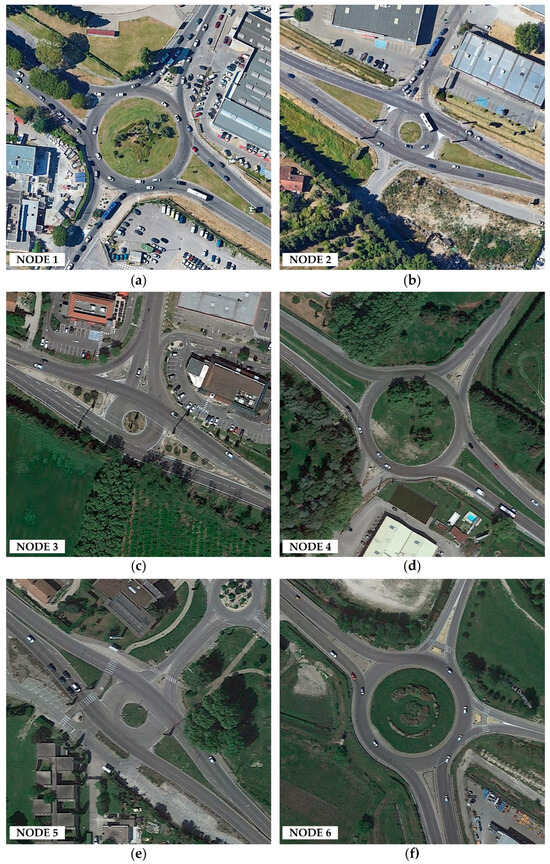
Figure 7.
Aerial views of the six intersections comprising the Avignon corridor: (a) Node 1; (b) Node 2; (c) Node 3; (d) Node 4; (e) Node 5; (f) Node 6. (Source: Google Earth Pro. Available online: https://www.google.com/earth/ (accessed on 21 February 2025)).
Table 2.
Geometric features of the six intersections comprising the Avignon corridor.
The O/D matrices used for the Avignon corridor, shown in Figure 8, were also derived from direct field surveys, including video-based traffic counts. These datasets were processed to define representative traffic patterns consistent with the simulation requirements. In detail, as in the Pisa corridor, traffic data were collected using digital cameras and processed through manual counting and an iterative algorithm to generate O/D matrices based on observed inflows and outflows. This ensured consistency in the methodology across both case studies.
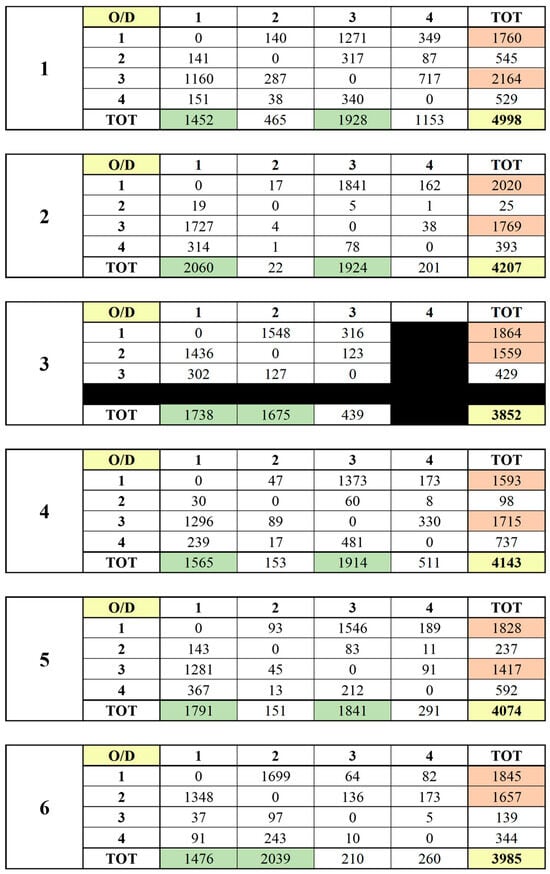
Figure 8.
Summary of the six O/D matrices of the Avignon corridor. Green and orange values indicate the total number of vehicles entering and exiting each intersection from the North and South along the main axis (Route de Marseille), while yellow values represent the total number of vehicles per hour circulating within each intersection. (Source: authors).
In both case studies, the simulation models were developed using Aimsun Next software. The geometric features of each corridor were accurately reproduced, including lane widths, number of entries and exits, curvature, and control strategies.
Traffic demand was introduced using the “Traffic State” approach, allowing for the specification of input flows and turn movements differentiated by vehicle class. The same fixed demand conditions were applied across all configurations to ensure internal comparability. To ensure the reliability of the simulation results, a dedicated calibration process was performed using observed traffic flow data collected through field surveys. For the Pisa corridor, ten measurement points were used, corresponding to the main entry arms of the five roundabouts along Via Aurelia Nord. Similarly, for the Avignon corridor, twelve points were considered, covering the main entries of the six intersections along Route de Marseille. These calibration points were selected to represent the actual demand distribution at critical nodes within each corridor. The calibration process involved iterative adjustments of key behavioral parameters—such as the Simulation Step and Reaction Times—and was validated through standard performance indicators, including the Correlation Coefficient (R), Theil’s Inequality Coefficient (U), and the GEH statistic. The results confirmed the reliability of the models and provided a robust foundation for the subsequent efficiency and safety evaluations. Furthermore, both corridors clearly meet the general definition of roundabout corridors as found in recent literature [17], being composed of three or more roundabouts distributed along a continuous arterial road, with consistent geometric and operational characteristics. The contrast between these two case studies—one in a completed state and the other still in transition—provides an ideal context for testing the adaptability of the proposed methodology. It also supports both a retrospective performance evaluation (Pisa) and forward-looking planning assessments (Avignon), offering applicable insights for infrastructure design and policy decision-making.
4. Results
This section presents the main findings from the dynamic simulation analyses and surrogate safety evaluations conducted on the two selected corridors: Via Aurelia Nord in Pisa (Italy) and Route de Marseille in Avignon (France).
The analysis assesses the traffic efficiency and safety performance of each corridor under different intersection configurations, based on a stable and calibrated demand scenario. A total of 32 configurations were simulated for Pisa (corridor with five intersections) and 64 for Avignon (corridor with six intersections), covering all possible combinations of roundabout (R) and traffic-light-controlled (TL) intersections. Each configuration was labeled according to the number of “R” and “TL” nodes—e.g., 2R-3TL—allowing for a clear and systematic representation of hybrid layouts. For example, the 1R-4TL scenario in Pisa indicates that the first intersection operates as a roundabout, while the remaining four are signal-controlled; similarly, the 3R-3TL layout in Avignon represents a fully hybrid configuration in which the first three intersections are roundabouts and the last three are traffic-light-controlled.
This structured approach enabled the comparison not only of the current real-world configurations but also of all feasible alternatives, ranging from fully signalized to fully converted roundabout corridors [17,18]. All simulations were performed using fixed traffic demand, with 12 replications per scenario to ensure consistency and reduce variability [55]. The evaluation focused on four main efficiency indicators—delay time, flow, mean queue, and speed—commonly adopted in microsimulation studies [10,56] and on five safety metrics derived from a critical conflict analysis (TTC = 0 s). These included the three conflict types (crossing, rear-end, and lane-change), the total number of conflicts, and the weighted conflicts (CRV), computed using Equation (1) to account for both the frequency and severity of interactions [12,13,36]. This integrated framework enabled a consistent interpretation of the results, which are presented in the following subsections for each corridor.
4.1. Case Studies of Pisa Corridor (Italy)
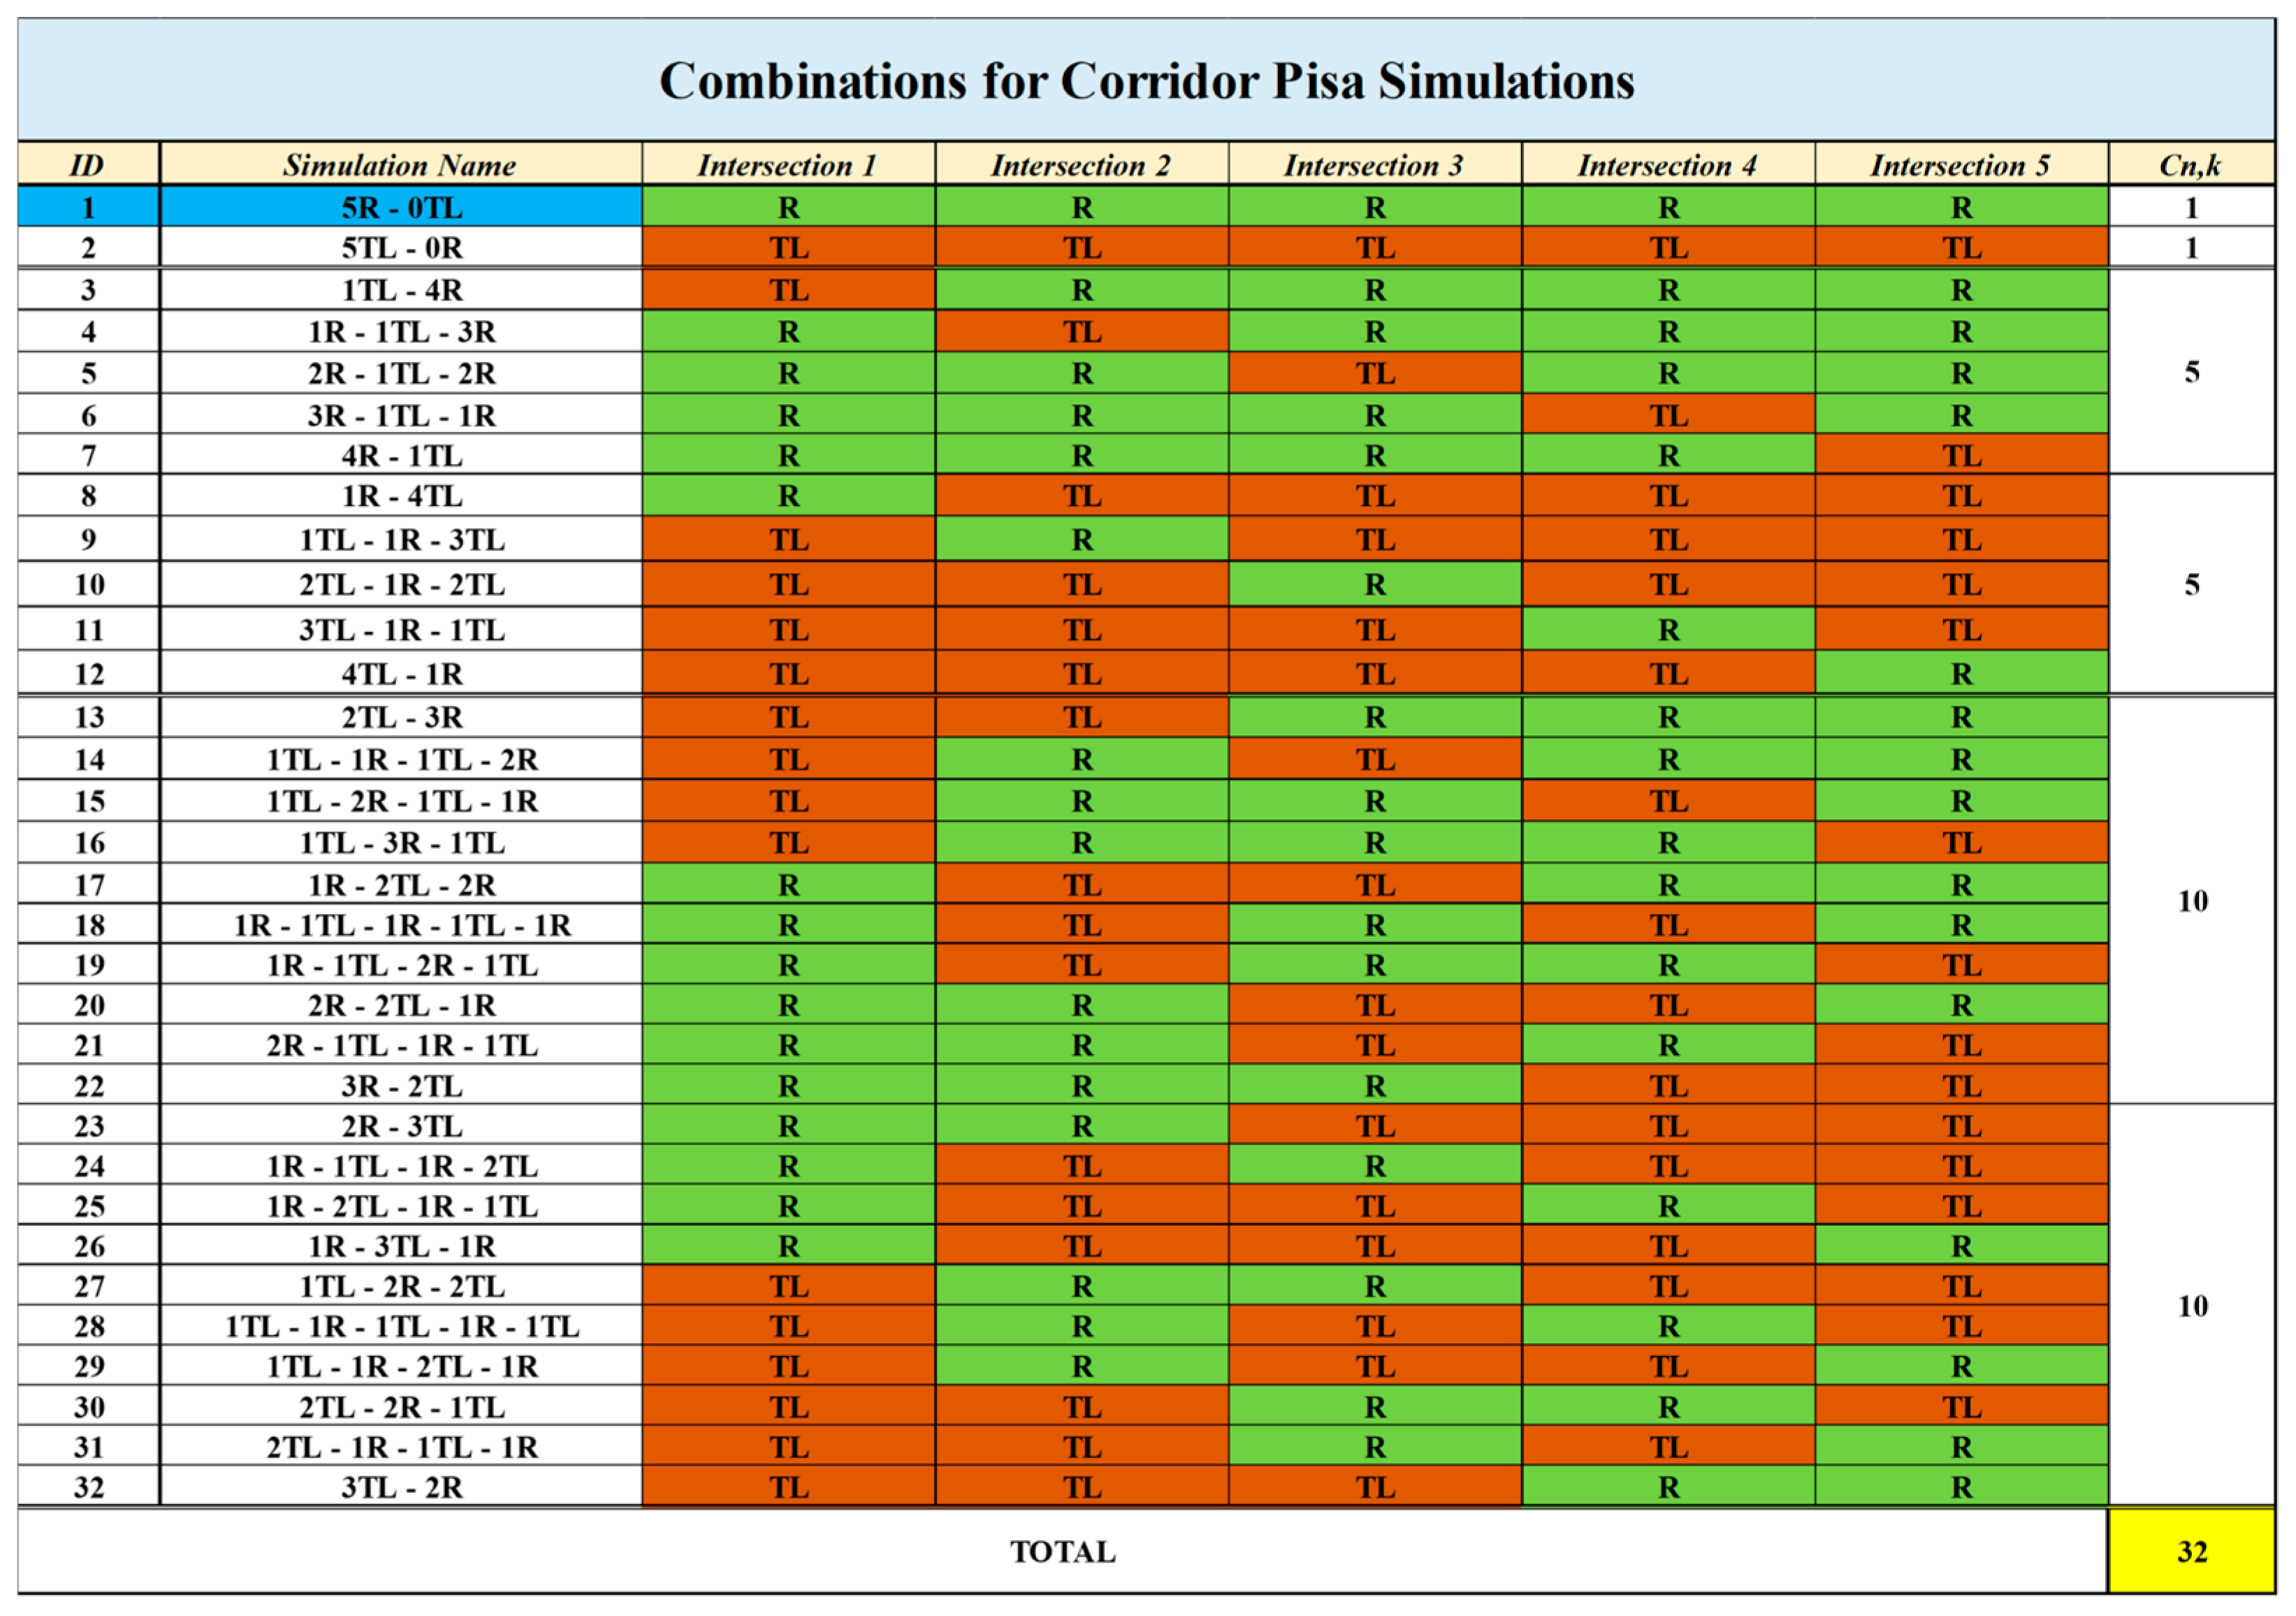
The first case study concerns the Via Aurelia Nord corridor in Pisa (Figure 3), which currently operates as a fully converted roundabout corridor. The simulation model was initially calibrated using ten traffic flow entry points corresponding to the five roundabouts along the corridor. As described in the previous sections, the calibration process aimed to minimize discrepancies between observed and simulated traffic conditions by verifying three key performance indicators: the GEH statistic, the Correlation Coefficient (R), and Theil’s Inequality Coefficient (U). The thresholds adopted for these indicators were defined in accordance with international best practices [52,53,54] and ensured that the model accurately represented real-world traffic dynamics. Once the model reached acceptable accuracy levels, the final calibrated parameters were set as follows: Simulation Step = 0.80 s; Reaction Time at Stop = 1.20 s; Reaction Time at Traffic Light = 1.60 s. The resulting final discrepancy indices confirmed the reliability of the model: R (Correlation Coefficient) = 0.830; U (Theil’s Inequality Coefficient) = 0.096; Mean GEH Statistic = 4.822. Following calibration, a total of 32 simulations were conducted to explore all feasible combinations of roundabouts (Rs) and traffic-light-controlled intersections (TLs) along the five-node corridor. These configurations include the current layout (5R-0TL, ID 1), its opposite (5TL-0R, ID 2), and a full range of intermediate hybrid layouts. As shown in Figure 9, each configuration is identified by a unique ID and describes the specific control type applied at each intersection.
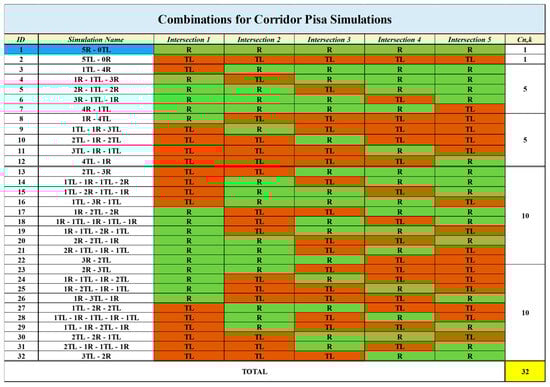
Figure 9.
List of the 32 tested intersection configurations for the Pisa corridor. Green cells indicate roundabouts, orange cells indicate signalized intersections, blue highlights the current layout, and yellow marks the total number of configurations. (Source: authors).
Each scenario was simulated in Aimsun Next software [2,10,11] using fixed traffic demand, with 12 replications and one average run per configuration. Starting from this, the key outputs of efficiency and safety were collected and are reported in a compact summary table that includes performance indicators and safety metrics, as shown in Figure 10.
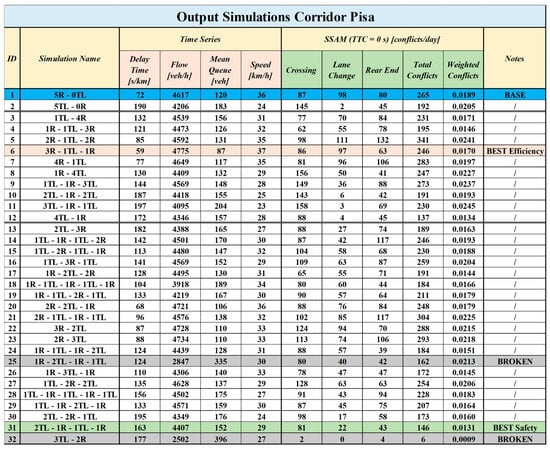
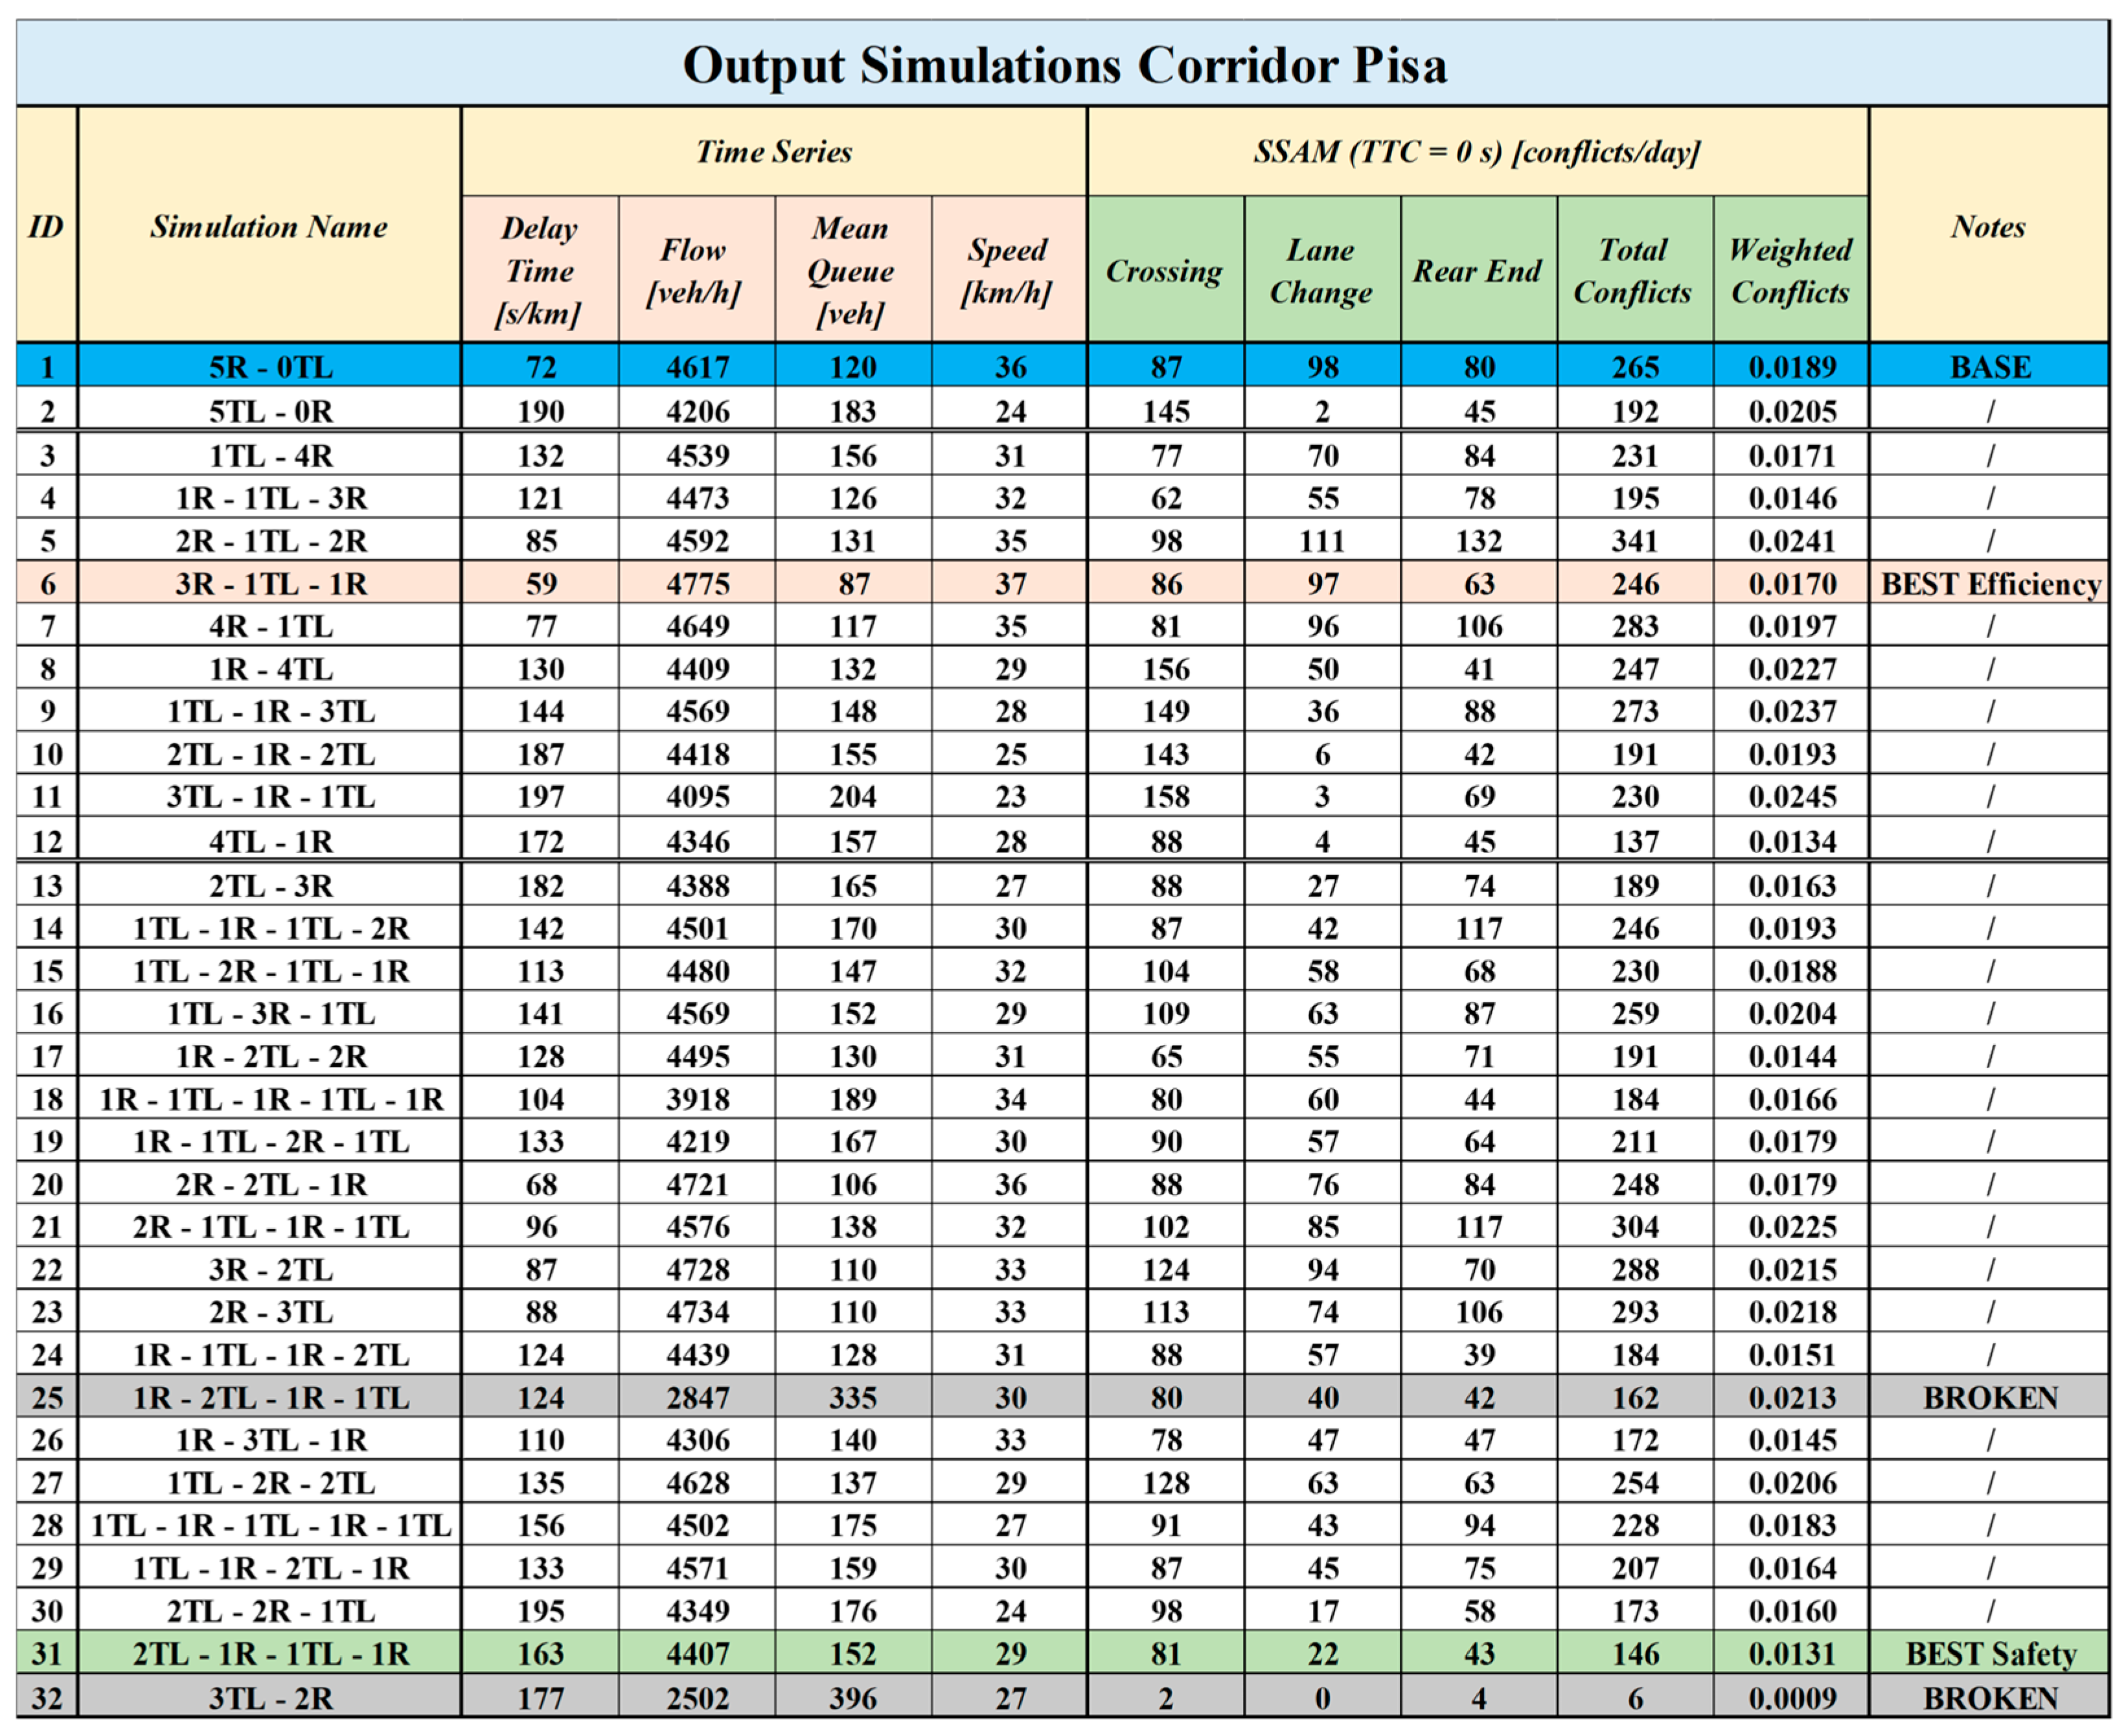
Figure 10.
Simulation outputs for the 32 intersection configurations of the Pisa corridor. The blue row indicates the current layout, the green row the best configuration in terms of efficiency, the pink row the best configuration in terms of safety, and the grey rows the broken configurations. (Source: authors).
The “Notes” column highlights selected cases: the current layout (BASE, ID 1), the most efficient configuration (BEST Efficiency, ID 6), the safest one (BEST Safety, ID 32), and BROKEN configurations (IDs 25, 32) where gridlock or simulation failure occurred due to excessive congestion. A detailed interpretation of these results is provided in Section 5.
4.2. Case Studies of Avignon Corridor (France)
The second case study focuses on the Route de Marseille corridor in Avignon (Figure 6), currently operating as a hybrid corridor with six intersections, three of which are already configured as roundabouts. The simulation model was calibrated using twelve traffic flow entry points corresponding to the six intersections. As outlined in previous sections, the calibration aimed to minimize discrepancies between observed and simulated traffic conditions by verifying three key performance indicators: the GEH statistic, the Correlation Coefficient (R), and Theil’s Inequality Coefficient (U), using the thresholds recommended in the established calibration guidelines [52,53,54]. Once acceptable accuracy was achieved, the final calibrated parameters were set as follows: Simulation Step = 0.50 s; Reaction Time at Stop = 0.80 s; Reaction Time at Traffic Light = 0.80 s. The final discrepancy indices confirmed the reliability of the model: R (Correlation Coefficient) = 0.848; U (Theil’s Inequality Coefficient) = 0.066; Mean GEH Statistic = 4.781. Following calibration, 64 simulations were conducted to explore all feasible combinations of roundabouts (Rs) and traffic-light-controlled intersections (TLs) along the six-node corridor. These included the current layout (1R-2TL-1R-1TL-1R, ID 61), the full roundabout scenario (6R-0TL, ID 1), the full signalized scenario (0R-6TL, ID 2), and a range of intermediate hybrid layouts. As shown in Figure 11, each configuration is identified by a unique ID and specifies the control type applied at each intersection.
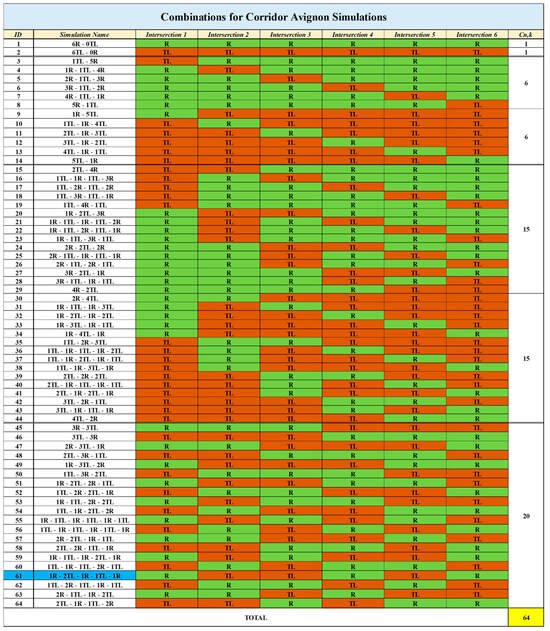
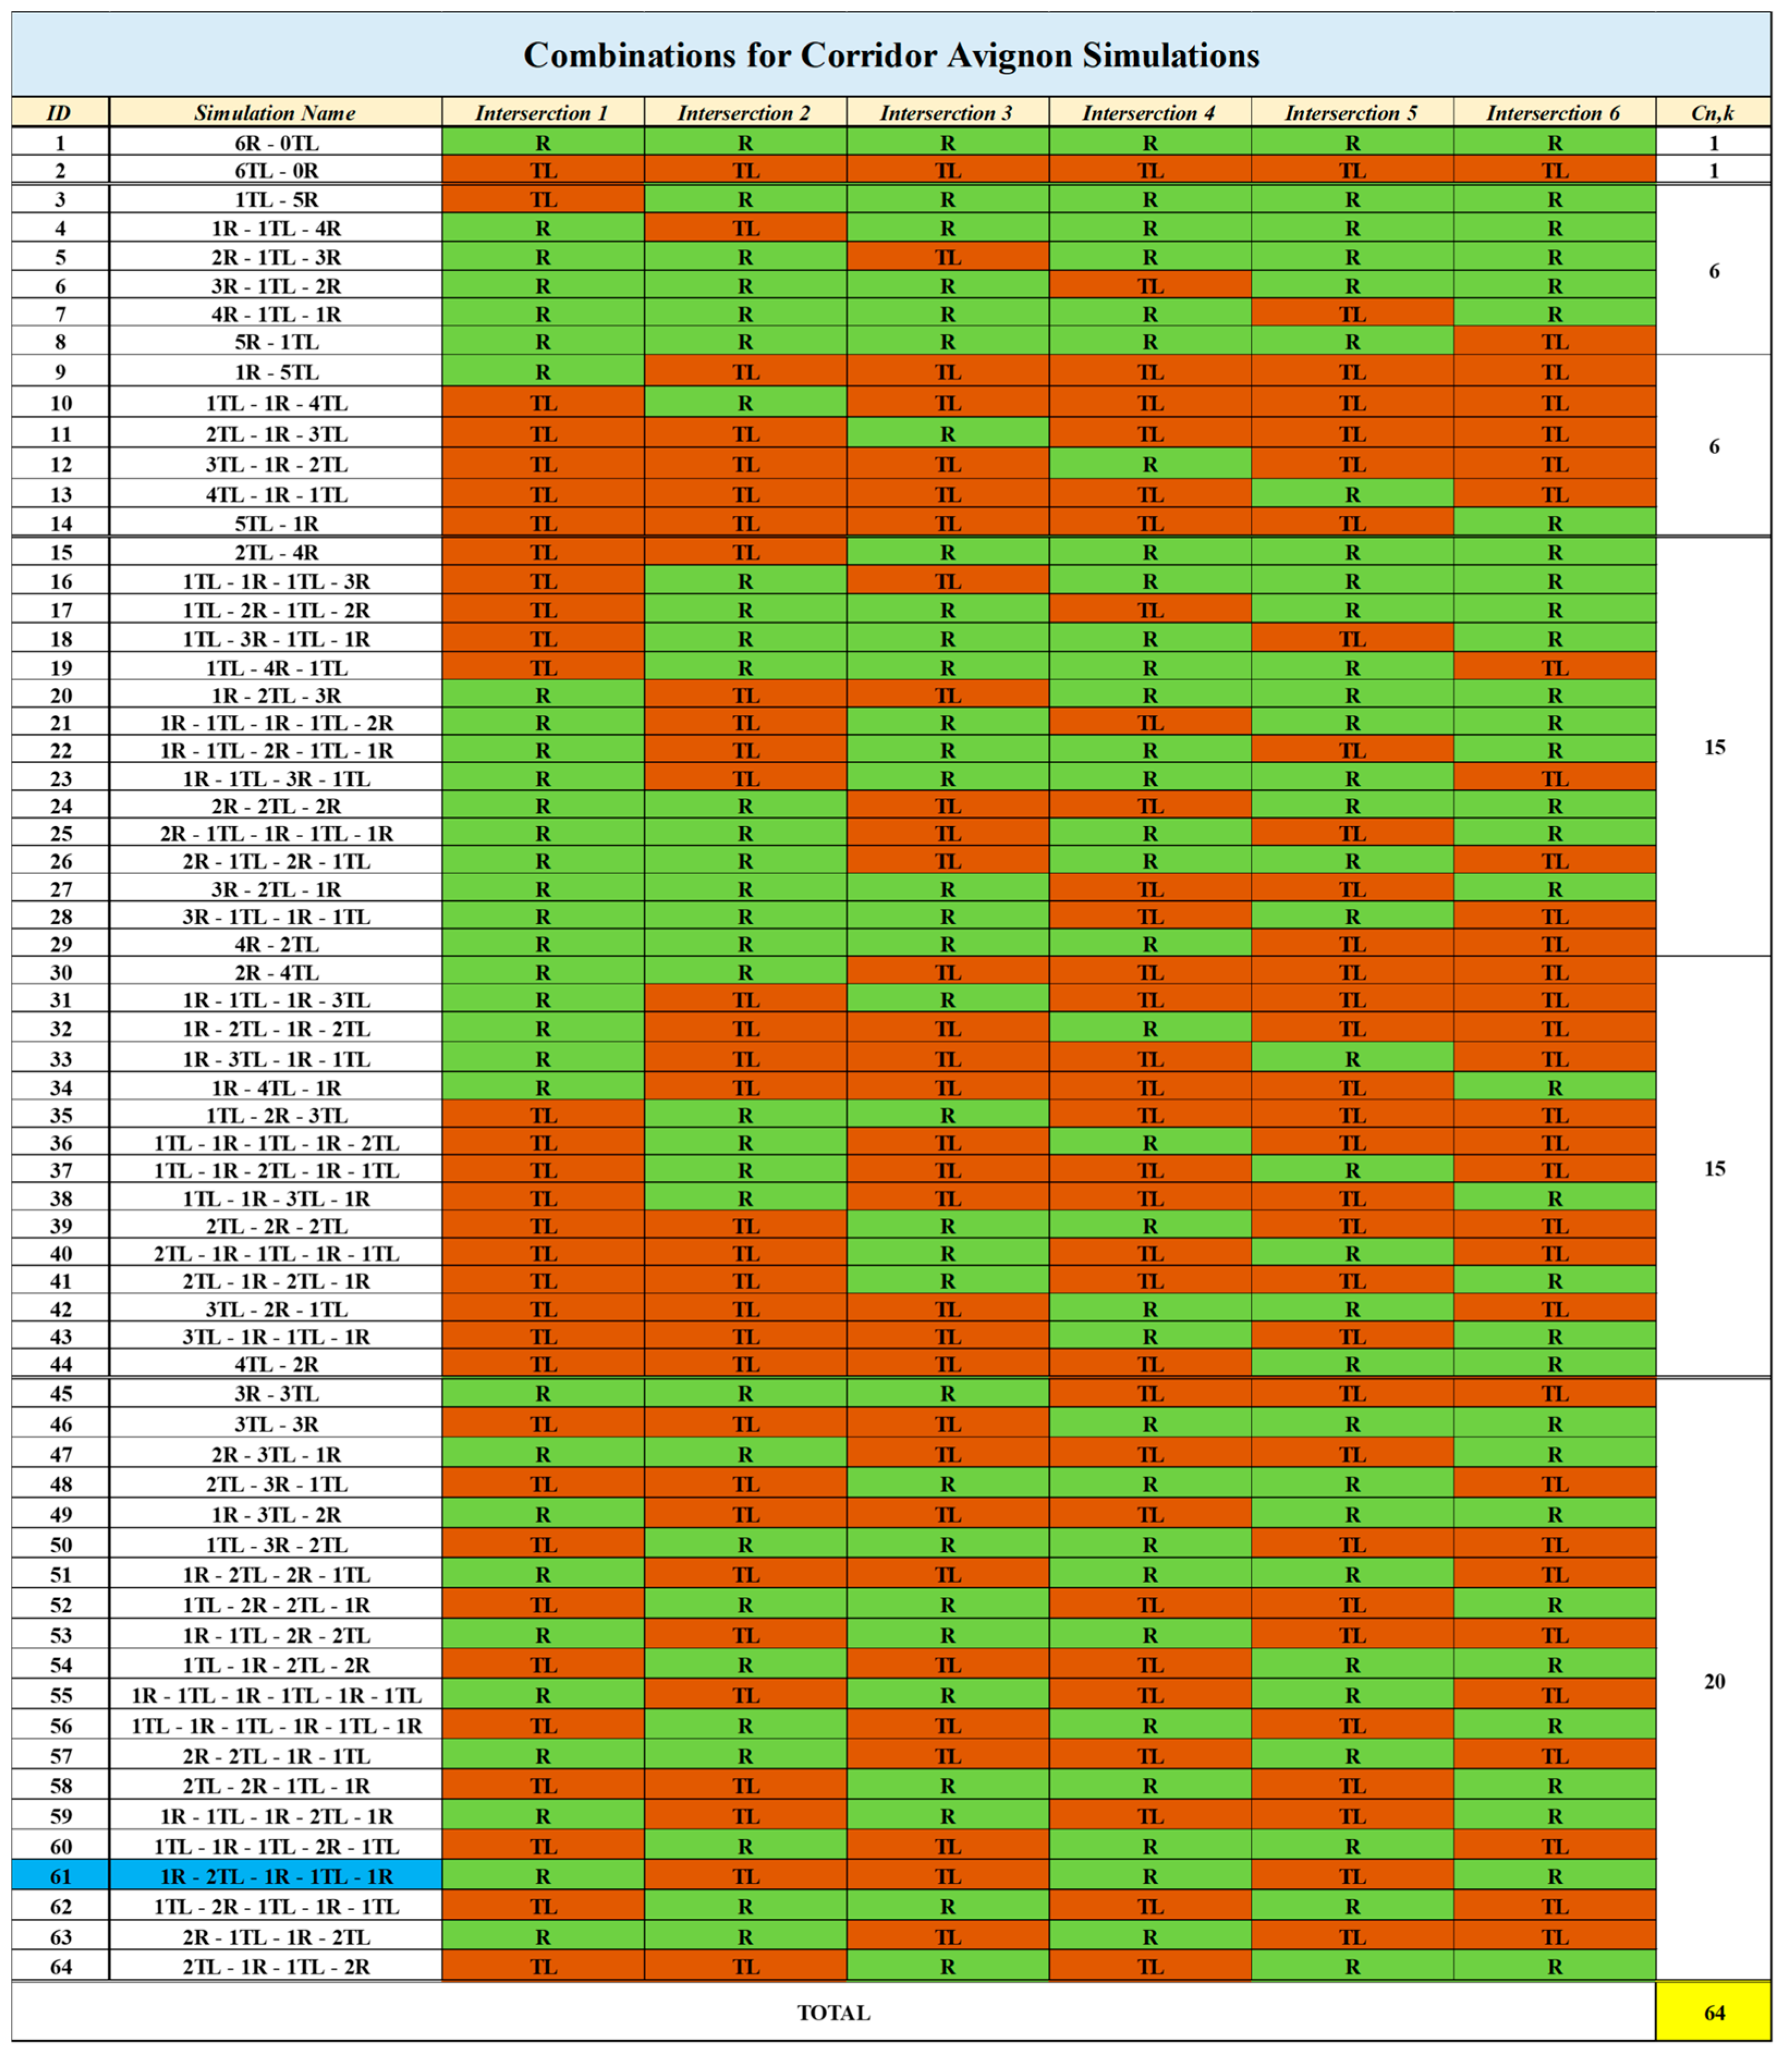
Figure 11.
List of the 64 tested intersection configurations for the Avignon corridor. Green cells indicate roundabouts, orange cells indicate signalized intersections, blue highlights the current layout, and yellow marks the total number of configurations. (Source: authors).
As for the Pisa corridor, each scenario was simulated in Aimsun Next software using the fixed traffic demand, with 12 replications and one average run per configuration. Based on these averaged results, key outputs of efficiency and safety were collected and are reported in a compact summary table shown in Figure 12. For each configuration, the table includes the main performance indicators and safety metrics.
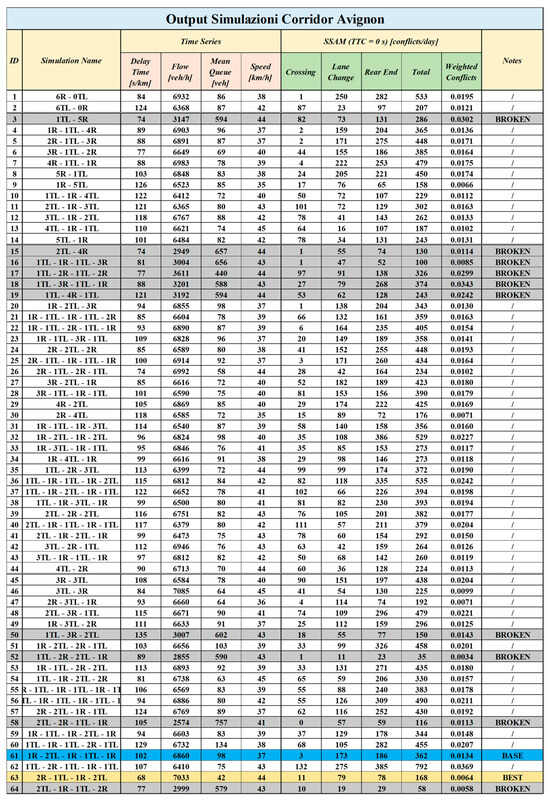
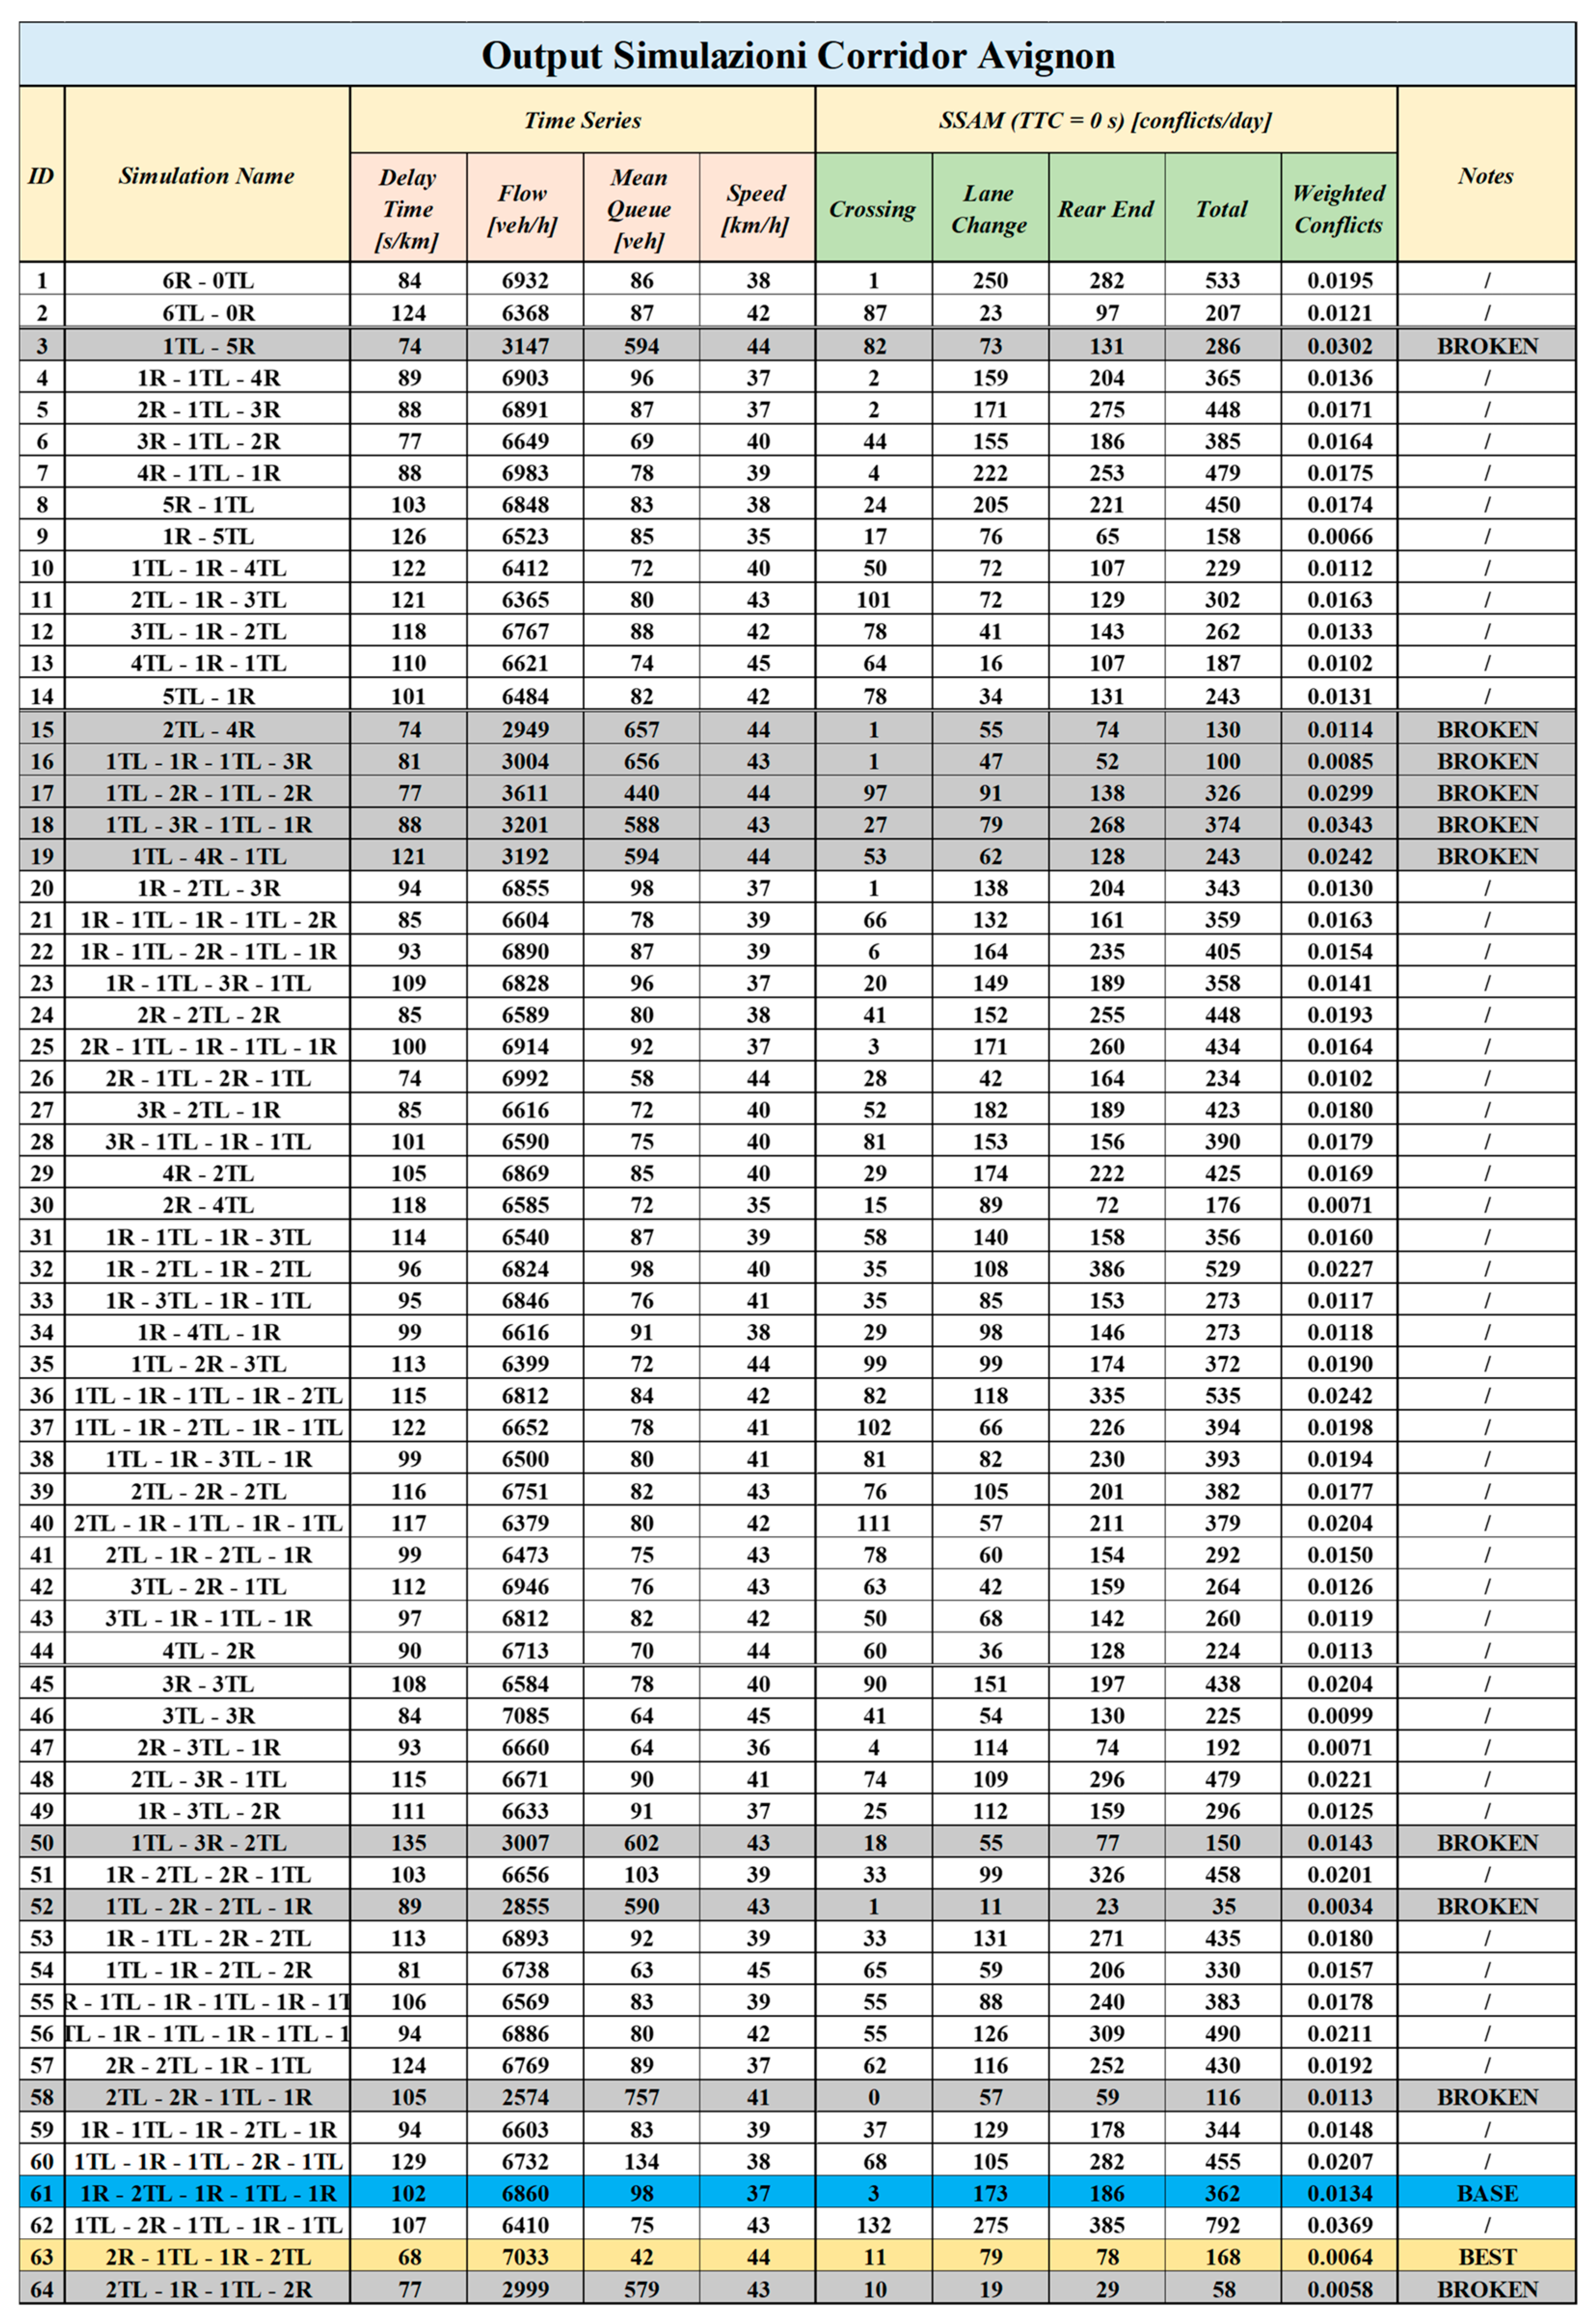
Figure 12.
Simulation outputs for the 64 intersection configurations of the Avignon corridor. The blue row indicates the current layout, the yellow row the best configuration in terms of efficiency and safety, and the grey rows the broken configurations. (Source: authors).
The “Notes” column highlights selected cases: the current layout (BASE, ID 61), the most efficient and safest configuration (BEST, ID 63), and BROKEN configurations (IDs 3, 15, 16, 17, 18, 19, 50, 52, 58, 64) where gridlock or simulation failure occurred due to excessive congestion. A detailed interpretation of these results is provided in the following Section 5.
5. Discussion
This section provides a critical interpretation of the simulation results presented above, highlighting the most relevant findings that emerged from the analysis of the Pisa and Avignon corridors. The discussion is articulated into two parts, each focused on one of the case studies, and aims to reflect on the implications of the intersection layout, control strategies, and network configuration in determining traffic efficiency and safety outcomes. Special attention is given to identifying the best-performing scenarios and understanding the conditions that led to inefficiencies or traffic breakdowns. The two corridors, while sharing similar geometric characteristics, represent different planning contexts and levels of infrastructural maturity, offering complementary insights into the systemic behavior of roundabout-based networks [17,18]. The observations made here will be further elaborated on and synthesized in the conclusions section, which addresses the broader implications of the study and formulates the final outcomes.
5.1. Analysis of the Pisa Corridor (Italy)
The simulation results for the Pisa corridor highlight several key insights into the performance of alternative intersection configurations under fixed demand conditions. Among the 32 tested scenarios, some configurations resulted in simulation breakdowns due to excessive congestion. These “broken” cases, marked in grey in the results table (Figure 10), were characterized by severe gridlock conditions in which queues propagated across multiple intersections, ultimately preventing network clearance. Such outcomes underscore the sensitivity of corridor performance to the intersection type and spatial arrangement, revealing that specific combinations of roundabouts and traffic lights can critically affect the system’s ability to maintain stable flow.
In terms of traffic efficiency, the best-performing configuration was ID 6 (3R-1TL-1R), which achieved the lowest delay time (59 s/km) while maintaining acceptable safety levels. This layout features a strategically placed signalized intersection that acts as a regulating element, mitigating oversaturation at downstream roundabouts and enhancing overall flow continuity. From a safety perspective, the most effective configuration was ID 31 (2TL-1R-1TL-1R), which recorded the lowest Conflict Rate per Vehicle (CRV = 0.0131). This arrangement effectively reduced the most severe conflict types, such as rear-end and crossing interactions, while preserving efficient traffic conditions.
Further observations confirm that neither fully homogeneous configuration yielded optimal results. The currently fully roundabout-based layout (5R-0TL) performed relatively well in terms of efficiency (72 s/km) but failed to eliminate local congestion effects and did not achieve the best safety outcomes. On the other hand, the fully signalized corridor (5TL-0R) exhibited the worst performance, with a delay time of 190 s/km, confirming that such layouts tend to generate excessive delays—despite recording a relatively low number of conflicts. Overall, these findings challenge the widespread assumption that full conversion to roundabouts is inherently the most effective design strategy.
Instead, the top-performing layouts all shared a common feature: a majority of roundabouts supported by one or two strategically located traffic lights. These hybrid configurations consistently achieved a better trade-off between efficiency and safety, reinforcing the idea that network performance depends not only on the proportion of roundabouts and signals but also on their precise sequence along the corridor. This aspect—the spatial distribution of control types—emerges as a promising direction for future research, particularly under fluctuating or asymmetric traffic demand conditions.
In conclusion, the systematic testing of alternative layouts confirms the importance of adapted, context-sensitive solutions over generic design assumptions. A mix of roundabouts and signalized intersections can deliver superior performance when carefully positioned. Excessive reliance on signalized control increases delay and, in some cases, leads to systemic breakdown. At the same time, while roundabouts tend to promote smoother traffic flow, they do not always guarantee optimal safety outcomes. This analysis contributes to a deeper understanding of urban corridor dynamics and supports a flexible methodological framework for optimizing intersection strategies. The proposed approach, based on a combinatorial simulation and conflict analysis, is both scalable and transferable—offering a valuable tool for traffic engineers and planners tasked with improving the performance of complex urban arterial corridors.
5.2. Analysis of the Avignon Corridor (France)
The simulation analysis of the Avignon corridor revealed a high degree of sensitivity to the intersection configuration, with several scenarios resulting in critical breakdowns due to network-wide congestion. Among the 64 tested layouts, a number of configurations led to incomplete or unstable simulations, marked in grey in the results table (Figure 12). These breakdowns were triggered by severe queuing and gridlock conditions, where traffic was unable to clear key intersections, resulting in total or partial corridor blockages. Notably, all “broken” configurations featured a signalized intersection at position 1, suggesting that this specific node is particularly predisposed to congestion when controlled by traffic lights. This observation highlights the crucial role of spatial placement: even a single mispositioned intersection type can compromise the operability of the entire corridor. Compared to the Pisa case, the Avignon corridor demonstrated greater vulnerability to poorly adapted layouts, likely due to its more heterogeneous geometry and higher network pressure.
The best-performing configuration in terms of both efficiency and safety was ID 63 (2R-1TL-1R-2TL), which achieved the lowest delay time (68 s/km) and the lowest Conflict Rate per Vehicle (CRV = 0.0064). This hybrid layout combines roundabouts and traffic lights in a sequence that optimizes flow distribution, prevents oversaturation at critical points, and reduces severe crossing conflicts. In contrast to Pisa—where the most efficient and safest configurations were distinct—this scenario in Avignon simultaneously delivers optimal performance across both dimensions. The results suggest that traffic lights, when strategically placed, can act as effective regulatory mechanisms within a roundabout corridor, particularly at locations inclined to unbalanced inflows or complex turning movements. While the current layout of the Avignon corridor is already hybrid in nature, the simulation outcomes indicate that its existing configuration does not reflect an optimal sequencing of control types. More broadly, the fully roundabout-based scenario (6R-0TL), which corresponds to a potential future transformation of the corridor, demonstrated only moderate improvements. Although it achieved relatively good efficiency levels (84 s/km), it did not outperform the best hybrid solutions and showed a higher number of conflicts—particularly of the crossing type—which could have been mitigated by the presence of signalized control at selected nodes. On the other hand, the fully signalized scenario (6TL-0R) exhibited poor performance, with a delay time of 124 s/km, frequent queue spillbacks, and limited safety benefits. These results reinforce the idea that neither extreme—a full roundabout nor full signalization—offers the most effective or resilient solution for this type of corridor. Across the simulations, the best-performing configurations consistently involved a majority of roundabouts complemented by one or two well-placed traffic lights. These layouts provided a balance between flow continuity and conflict mitigation, demonstrating that intersection placement, rather than quantity alone, plays a pivotal role in corridor performance. By regulating traffic at critical points, hybrid designs reduce congestion propagation and enhance safety, particularly under conditions of variable or peak demand. As observed in the Pisa case, future research should focus on the influence of intersection sequencing and the spatial distribution, which may prove more decisive than the mere proportion of control types.
In conclusion, the results for the Avignon corridor support a flexible, data-driven planning strategy. Rather than pursuing a full conversion to roundabouts, which does not guarantee superior performance in all scenarios, urban planners should consider hybrid approaches that integrate roundabouts and signalized intersections based on the local demand, network geometry, and operational constraints. The findings underline that effective corridor design must move beyond uniform solutions and embrace context-sensitive strategies that maximize both efficiency and safety. The proposed simulation framework offers a robust tool to guide such decisions and can be applied to other urban settings where roundabout-based systems are being introduced or upgraded.
6. Conclusions
This research presented a replicable, integrated simulation-based methodology for analyzing roundabout corridors as systems, combining efficiency and safety assessments through microsimulation and a surrogate safety analysis [2,12,36]. The framework was applied to two real-world corridors—Via Aurelia Nord in Pisa (Italy) and Route de Marseille in Avignon (France)—allowing for a comparative evaluation of various intersection configurations, including fully roundabout-based layouts, signal-controlled alternatives, and hybrid solutions.
In the Pisa corridor, the conversion of five signalized intersections into roundabouts did not yield the expected performance improvements. Several intersections—especially Nodes 2 and 4—showed persistent congestion and conflict risk. The current 5R-0TL layout resulted in 72 s/km of average delay and a CRV of 0.0189, compared to 59 s/km and a CRV of 0.0170 under the best-performing configuration (3R-1TL-1R). These findings highlight that full roundabout conversion may, in some instances, lead to paradoxical effects [4,5,6,7] and reinforce the need for corridor-level evaluations. Although the selective reintroduction of signalized intersections proved optimal from a technical standpoint, it was deemed politically and economically unfeasible. As an alternative, regulating inflows through Ramp Metering Systems (RMSs) emerges as a promising solution. Although an RMS was not simulated in the present study, previous research [8,9] has shown that such systems can reduce delays and conflicts at critical entries, offering low-cost, low-impact control strategies compatible with existing layouts and adaptable to real-time conditions. Future studies should further explore these impacts through dedicated simulation experiments and implementation trials.
In contrast, the Avignon corridor—still in transition—offers greater flexibility for planning. The current hybrid layout suffers from operational inefficiencies, but a full conversion to 6R-0TL would not represent the optimal configuration. The most effective scenario was a targeted hybrid (2R-1TL-1R-2TL), with 68 s/km average delay and the lowest CRV (0.0064) among all tested layouts. Here too, an RMS could offer performance improvements at existing signalized nodes (2, 3, and 5), as suggested by the Pisa findings.
Together, the two case studies demonstrate that isolated design interventions—whether geometric or control-based—risk overlooking systemic interdependencies. Nonlinear phenomena such as platoon fragmentation, delay propagation, and local conflict escalation can compromise the benefits of well-intentioned upgrades [49,56]. The proposed methodology addresses these issues by coupling a microsimulation with an SSAM-based safety evaluation [12,13,14,15,16], analyzing surrogate indicators such as TTC, and classifying conflict types (e.g., rear-end, crossing, lane-change). Although surrogate measures require calibration to estimate the crash probability, prior research has shown their value in identifying high-risk conditions, particularly under peak demand.
Beyond its empirical findings, this research contributes to a methodological advancement in urban traffic engineering by formalizing a corridor-level evaluation workflow [2,12]. It promotes the possible use of ITS-based solutions like RMS and supports the inclusion of nonstandard layouts (e.g., Two-Geometry Roundabouts) [26,27,28,29,30] in comparative assessments. The proposed approach is well-suited to real-world planning contexts, particularly when applied through interdisciplinary collaboration and supported by standard traffic data and widely available simulation tools.
Study Limitations and Future Research Directions
In addition to its contributions, this study presents several limitations that should be addressed in future work. First, the use of fixed traffic demand across all scenarios ensured internal consistency but limited the analysis of peak-hour variability or stochastic fluctuations. Future research should incorporate dynamic or variable demand conditions to improve realism and assess robustness. Second, while calibration involved adjustments to parameters such as the Simulation Step and Reaction Times, key behavioral aspects—like car-following, lane-change aggressiveness, and gap acceptance—were not locally calibrated and were kept at default values. This choice ensured comparability across scenarios but may have reduced the realism of driver responses. Sensitivity analyses based on these parameters would help assess their influence on traffic efficiency and safety outcomes. Third, the absence of empirical crash data prevented direct validation of the surrogate safety indicators generated via SSAM. Although the analysis relied on TTC-based conflict detection (with TTC = 0 s threshold) and used established conflict categories (rear-end, crossing, lane-change), future work should include real crash data to enhance the reliability of safety evaluations. Moreover, the use of default SSAM parameters—other than TTC—represents a further limitation. While this maintained consistency, it may have overlooked local variations in conflict severity. Future studies should evaluate the sensitivity of SSAM settings such as PET thresholds, conflict weightings, and speed-based filtering rules. Finally, future developments should also explore adaptive and AI-based control strategies, the integration of connected or automated vehicles (CAVs), and the inclusion of multimodal users such as pedestrians, cyclists, and public transport. Adding environmental metrics (e.g., emissions, fuel consumption) would support a more comprehensive and sustainability-oriented corridor assessment.
Author Contributions
Conceptualization, L.B. and A.P.; methodology, L.B.; software, L.B.; validation, L.B., A.P. and D.J.; formal analysis, L.B.; investigation, L.B.; resources, A.P. and D.J.; data curation, L.B.; writing—original draft preparation, L.B.; writing—review and editing, A.P., D.J. and M.L.; visualization, L.B.; supervision, A.P., D.J. and M.L.; project administration, A.P., D.J. and M.L.; funding acquisition, A.P. and M.L. All authors have read and agreed to the published version of the manuscript.
Funding
This research received no external funding.
Data Availability Statement
The data presented in this study are available on request from the corresponding author.
Conflicts of Interest
The authors declare no conflicts of interest.
References
- Priemus, H.; Zonneveld, W. What Are Corridors and What Are the Issues? Introduction to Special Issue: The Governance of Corridors. J. Transp. Geogr. 2003, 11, 167–177. [Google Scholar] [CrossRef]
- Barceló, J. Fundamentals of Traffic Simulation; Springer: New York, NY, USA, 2010. [Google Scholar] [CrossRef]
- Yuan, Y.; Yang, H. System Dynamics Approach for Evaluating the Interconnection Performance of Collaborative Transportation Infrastructure. J. Manag. Eng. 2022, 38, 04021015. [Google Scholar] [CrossRef]
- Brocchini, L.; Pratelli, A.; Josselin, D.; Losa, M. Exploring Traffic Paradoxes: A Study of Roundabout Corridors and Their Effects on Network Dynamics. 2025; submitted. [Google Scholar]
- Braess, D. Über ein Paradoxon aus der Verkehrsplanung. Unternehmensforschung 1968, 12, 258–268. [Google Scholar] [CrossRef]
- Bazzan, A.L.C.; Klügl, F. Case Studies on the Braess Paradox: Simulating Route Recommendation and Learning in Abstract and Microscopic Models. Transp. Res. Part C Emerg. Technol. 2005, 13, 299–319. [Google Scholar] [CrossRef]
- Sheffi, Y.; Daganzo, C.F. Another “Paradox” of Traffic Flow. Transp. Res. 1978, 12, 43–46. [Google Scholar] [CrossRef]
- Brocchini, L.; Pratelli, A. Exploring the Potential Application of Ramp Metering Systems to Improve the Performances of Roundabout Corridors. In ITFT 2024: International Conference on Intelligent Transport Systems; Springer: Cham, Switzerland, 2025; pp. 260–270. [Google Scholar] [CrossRef]
- Hummer, J.E.; Milazzo, J.S.; Schroeder, B.; Salamati, K. Potential for Metering to Help Roundabouts Manage Peak Period Demands in the United States. Transp. Res. Rec. 2014, 2402, 56–66. [Google Scholar] [CrossRef]
- Aimsun. Aimsun Next Users Manual, Version 24.0.2; Aimsun SLU: Barcelona, Spain, 2024. Available online: https://docs.aimsun.com/next/24.0.2/ (accessed on 21 May 2025).
- Barceló, J.; Casas, J. Dynamic Network Simulation with AIMSUN. In Simulation Approaches in Transportation Analysis; Hall, R., Ed.; Springer: Boston, MA, USA, 2005; pp. 57–98. [Google Scholar] [CrossRef]
- Federal Highway Administration (FHWA). Surrogate Safety Assessment Model and Validation: Final Report; Report No. FHWA-HRT-08-051; U.S. Department of Transportation: Washington, DC, USA, 2008. Available online: https://www.fhwa.dot.gov/publications/research/safety/08051/ (accessed on 21 May 2025).
- Federal Highway Administration (FHWA). Surrogate Safety Assessment Model (SSAM): TechBrief; Report No. FHWA-HRT-10-020; U.S. Department of Transportation: Washington, DC, USA, 2009. Available online: https://www.fhwa.dot.gov/publications/research/safety/10020/ (accessed on 21 May 2025).
- Federal Highway Administration (FHWA). Surrogate Safety Measures from Traffic Simulation Models: Final Report; Report No. FHWA-RD-03-050; U.S. Department of Transportation: Washington, DC, USA, 2003. Available online: https://www.fhwa.dot.gov/publications/research/safety/03050/ (accessed on 21 May 2025).
- Del Valle, M.; La Rosa, X.; Silvera, M.; Campos, F.; Palacios-Alonso, D. Vehicular Conflict Assessment on a Road with Lane Reduction Using the SSAM Methodology. In Proceedings of the 21st LACCEI International Multi-Conference for Engineering, Education, and Technology, Buenos Aires, Argentina, 17–21 July 2023; Available online: https://cris.pucp.edu.pe/en/publications/vehicular-conflict-assessment (accessed on 21 May 2025).
- Souleyrette, R.R.; Hans, Z.; Maze, T.H.; Smadi, O.; Preston, H. Development of a Conflict Analysis Methodology Using SSAM. Midwest Transportation Consortium Final Report; Iowa State University: Ames, IA, USA, 2012. Available online: https://www.intrans.iastate.edu/research/completed/ (accessed on 21 May 2025).
- Bugg, Z.; Schroeder, B.J.; Jenior, P.; Brewer, M.; Rodegerdts, L. Methodology to Compute Travel Time of a Roundabout Corridor. Transp. Res. Rec. 2015, 2483, 20–29. [Google Scholar] [CrossRef]
- Rodegerdts, L.A.; Jenior, P.M.; Bugg, Z.H.; Ray, B.L.; Schroeder, B.J.; Brewer, M.A. National Cooperative Highway Research Program (NCHRP). Report 772: Evaluating the Performance of Corridors with Roundabouts; Transportation Research Board: Washington, DC, USA, 2014. [Google Scholar] [CrossRef]
- Fernandes, P.; Salamati, K.; Rouphail, N.M.; Coelho, M.C. Identification of Emission Hotspots in Roundabouts Corridors. Transp. Res. Part D Transp. Environ. 2015, 37, 48–64. [Google Scholar] [CrossRef]
- Fernandes, P.; Coelho, M.C. Pedestrian and Cyclists Impacts on Vehicular Capacity and Emissions at Different Turbo-Roundabouts Layouts. Transp. Res. Procedia 2017, 27, 452–459. [Google Scholar] [CrossRef]
- Fernandes, P.; Fontes, T.; Pereira, S.R.; Rouphail, N.M.; Coelho, M.C. Multicriteria assessment of crosswalk location in urban roundabout corridors. Transp. Res. Rec. 2015, 2517, 37–47. [Google Scholar] [CrossRef]
- Raza, S.; Al-Kaisy, A.; Washburn, S. Investigation of Roundabouts Influence Areas Along Rural and Suburban Corridors. Adv. Transp. Studies Int. J. 2022, 58, 21–38. Available online: https://www.atsinternationaljournal.com/2022-issues/investigation-of-roundabout-influence-areas-along-rural-and-suburban-corridors/ (accessed on 21 May 2025).
- LeBas, M.A. A Comparative Analysis of Roundabouts and Traffic Signals through a Corridor. Master’s Thesis, Louisiana State University, Baton Rouge, LA, USA, 2015. Available online: https://repository.lsu.edu/gradschool_theses/3753/ (accessed on 21 May 2025).
- National Academies of Sciences, Engineering, and Medicine. Highway Capacity Manual, 6th ed.; The National Academies Press: Washington, DC, USA, 2016; Available online: https://nap.nationalacademies.org/catalog/24798/highway-capacity-manual (accessed on 21 May 2025).
- National Academies of Sciences, Engineering, and Medicine. Highway Capacity Manual, 7th ed.; The National Academies Press: Washington, DC, USA, 2022; Available online: https://nap.nationalacademies.org/catalog/26432/highway-capacity-manual (accessed on 21 May 2025).
- Pratelli, A.; Casella, S.; Farina, A.; Lupi, M. Conventional and unconventional roundabouts: A review of geometric features and capacity models. Int. J. Transp. Dev. Integr. 2018, 2, 225–239. [Google Scholar] [CrossRef]
- Tollazzi, T. Alternative Types of Roundabouts: An Informational Guide; Springer: Cham, Switzerland, 2015; Volume 6. [Google Scholar] [CrossRef]
- Pratelli, A.; Souleyrette, R.R.; Brocchini, L. Two-geometry roundabouts: Design principles. Transp. Res. Procedia 2022, 64, 299–307. [Google Scholar] [CrossRef]
- Pratelli, A.; Brocchini, L. Two-geometry roundabouts: Estimation of capacity. Transp. Res. Procedia 2022, 64, 232–239. [Google Scholar] [CrossRef]
- Ahac, S.; Ahac, M.; Majstorović, I.; Bašić, S. Speed Reduction Capabilities of Two-Geometry Roundabouts. Appl. Sci. 2023, 13, 11816. [Google Scholar] [CrossRef]
- Fortuijn, L.G.H. Turbo Roundabouts: Design Principles and Safety Performance. Transp. Res. Rec. 2009, 2096, 16–24. [Google Scholar] [CrossRef]
- Fortuijn, L.G.H. Turbo Roundabouts: Estimation of Capacity. Transp. Res. Rec. 2009, 2130, 83–92. [Google Scholar] [CrossRef]
- Singh, D.; Das, P. A Review on Surrogate Safety Measures in Safety Evaluation and Analysis. In Proceedings of the Sixth International Conference of Transportation Research Group of India, Tamil Nadu, India, 14–17 December 2021; Lecture Notes in Civil Engineering. Devi, L., Ed.; Springer: Singapore, 2023; Volume 273, pp. 113–129. [Google Scholar] [CrossRef]
- So, J.; Lim, I.-K.; Lee, S. Exploring Traffic Conflict-Based Surrogate Approach for Safety Assessment of Highway Facilities. Transp. Res. Rec. 2015, 2513, 56–62. [Google Scholar] [CrossRef]
- Muley, D.; Ghanim, M.; Kharbeche, M. Prediction of Traffic Conflicts at Signalized Intersections Using SSAM. Procedia Comput. Sci. 2018, 130, 255–262. [Google Scholar] [CrossRef]
- Huang, F.; Liu, P.; Yu, H.; Wang, W. Identifying if VISSIM simulation model and SSAM provide reasonable estimates for field measured traffic conflicts at signalized intersections. Accid. Anal. Prev. 2013, 50, 1014–1024. [Google Scholar] [CrossRef] [PubMed]
- Hasanvand, M.; Nasiri, A.S.A.; Rahmani, O.; Shaaban, K.; Samadi, H. A conflict-based safety diagnosis of SCI roundabouts using a surrogate safety measure model. Sustainability 2023, 15, 13166. [Google Scholar] [CrossRef]
- Wardrop, J.G. Some theoretical aspects of road traffic research. Proc. Inst. Civ. Eng. 1952, 1, 767–768. [Google Scholar] [CrossRef]
- Morgan, J.; Orzen, H.; Sefton, M. Network architecture and traffic flows: Experiments on the Pigou–Knight–Downs and Braess Paradoxes. Games Econ. Behav. 2009, 66, 348–372. [Google Scholar] [CrossRef]
- Afimeimounga, H.; Solomon, W.; Ziedins, I. The Downs–Thomson paradox: Existence, uniqueness and stability of user equilibria. Queueing Syst. 2005, 49, 321–334. [Google Scholar] [CrossRef]
- Dechenaux, E.; Mago, S.D.; Razzolini, L. Traffic congestion: An experimental study of the Downs–Thomson paradox. Exp. Econ. 2014, 17, 461–487. [Google Scholar] [CrossRef]
- Zhang, F.; Yang, H.; Liu, W. The Downs–Thomson paradox with responsive transit service. Transp. Res. Part A Policy Pract. 2014, 70, 244–263. [Google Scholar] [CrossRef]
- Boyce, D.E.; Mahmassani, H.S.; Nagurney, A. A retrospective on Beckmann, McGuire and Winsten’s “Studies in the Economics of Transportation”. Pap. Reg. Sci. 2005, 84, 85–103. [Google Scholar] [CrossRef]
- Boyce, D.E. Beckmann’s transportation network equilibrium model: Its history and relationship to the Kuhn–Tucker conditions. Econ. Transp. 2013, 2, 47–52. [Google Scholar] [CrossRef]
- Hymel, K. If you build it, they will drive: Measuring induced demand for vehicle travel in urban areas. Transp. Policy 2019, 76, 57–66. [Google Scholar] [CrossRef]
- Osman, A.B.Y. One More Lane: The Induced Demand Paradox; Kwame Nkrumah University of Science and Technology: Kumasi, Ghana, 2023; Preprint; Available online: https://www.academia.edu/107279476/One_More_Lane_The_Induced_Demand_Paradox (accessed on 21 May 2025).
- Hallmark, S.L.; Fitzsimmons, E.J.; Isebrands, H.N.; Giese, K.L. Roundabouts in Signalized Corridors: Evaluation of Traffic Flow Impacts. Transp. Res. Rec. 2010, 2182, 139–147. [Google Scholar] [CrossRef]
- Shaaban, K.; Abou-Senna, H.; Elnashar, D.; Radwan, E. Assessing the Impact of Converting Roundabouts to Traffic Signals on Vehicle Emissions along an Urban Arterial Corridor in Qatar. J. Air Waste Manag. Assoc. 2018, 69, 178–191. [Google Scholar] [CrossRef] [PubMed]
- Campo, A.; D’Autilia, R. Simulation tools to compare and optimize mobility plans. arXiv 2017. [Google Scholar] [CrossRef]
- Lu, X.-Y.; Lee, J.; Chen, D.; Bared, J.; Dailey, D.; Shladover, S.E. Freeway micro-simulation calibration: Case study using Aimsun and VISSIM with detailed field data. In Proceedings of the 93rd Annual Meeting of the Transportation Research Board (TRB), Washington, DC, USA, 12–16 January 2014; Available online: https://www.researchgate.net/publication/262912349 (accessed on 21 May 2025).
- Chiappone, S.; Giuffrè, O.; Granà, A.; Mauro, R.; Sferlazza, A. Traffic simulation models calibration using speed–density relationship: An automated procedure based on genetic algorithm. Expert Syst. Appl. 2016, 44, 147–155. [Google Scholar] [CrossRef]
- Feldman, O. The GEH measure and quality of the highway assignment models. In Proceedings of the European Transport Conference 2012, Glasgow, UK, 8–10 October 2012; Association for European Transport: Warwickshire, UK, 2012. Available online: https://trid.trb.org/view/1324899 (accessed on 21 May 2025).
- Tratar, L.F.; Strmčnik, E. Forecasting methods in engineering. IOP Conf. Ser. Mater. Sci. Eng. 2019, 657, 012027. [Google Scholar] [CrossRef]
- Leal, S.S.; de Almeida, P.E.M.; Ribeiro, R.G. Calibrating traffic microscopic simulation model parameters using an evolutionary approach. Transp. Res. Procedia 2020, 48, 1038–1045. [Google Scholar] [CrossRef]
- Burghout, W. A Note on the Number of Replication Runs in Stochastic Traffic Simulation Models. Res. Rep. 2004. Available online: https://www.researchgate.net/publication/237237852 (accessed on 21 May 2025).
- Federal Highway Administration (FHWA). Traffic Analysis Toolbox Volume VI: Definition, Interpretation, and Calculation of Traffic Analysis Tools Measures of Effectiveness; Report No. FHWA-HOP-08-054; U.S. Department of Transportation: Washington, DC, USA, 2007. Available online: https://ops.fhwa.dot.gov/publications/fhwahop08054/index.htm (accessed on 21 May 2025).
- Giuffrè, O.; Granà, A.; Tumminello, M.L.; Giuffrè, T.; Trubia, S. Surrogate measures of safety at roundabouts in AIMSUN and VISSIM environment. In Roundabouts as Safe and Modern Solutions in Transport Networks and Systems; Lecture Notes in Networks and Systems; Springer: Cham, Switzerland, 2018; Volume 52, pp. 53–64. [Google Scholar] [CrossRef]
- Ross, S.M. Introduction to Probability Models, 10th ed.; Academic Press: Cambridge, MA, USA; Elsevier: Amsterdam, The Netherlands, 2010; Available online: https://www.sciencedirect.com/book/9780123756862 (accessed on 21 May 2025).


Disclaimer/Publisher’s Note: The statements, opinions and data contained in all publications are solely those of the individual author(s) and contributor(s) and not of MDPI and/or the editor(s). MDPI and/or the editor(s) disclaim responsibility for any injury to people or property resulting from any ideas, methods, instructions or products referred to in the content. |
© 2025 by the authors. Licensee MDPI, Basel, Switzerland. This article is an open access article distributed under the terms and conditions of the Creative Commons Attribution (CC BY) license (https://creativecommons.org/licenses/by/4.0/).