Abstract
This study investigates cross-border cascading hazards and infrastructure vulnerabilities in the Sava River Basin, a seismically active and flood-prone region spanning the Slovenia–Croatia border. Conducted within the CROSScade project, the research focuses on assessing cross-border hazards and the vulnerabilities of levees and bridges. Key earthquake and flood scenarios were identified using advanced hydraulic and seismic modelling, forming the basis for evaluating the cascading effects of these events, including the potential failure of hydropower plants and associated flood protection systems. The analysis reveals that levees are particularly vulnerable to failure during the recession phase of flooding that follows an earthquake. At the same time, bridges are primarily affected by seismic loading, with minimal structural impact from flood forces. These findings underscore the pressing need for enhanced cross-border collaboration, updated design standards, and the reinforcement of critical infrastructure. The study provides essential insights for multi-hazard resilience planning and emphasises the importance of integrated risk assessments in managing cascading disaster impacts across national boundaries.
1. Introduction
The increasing frequency and intensity of natural disasters highlight the urgent need for an integrated, cross-disciplinary management of critical infrastructure. The increasing complexity of critical infrastructure systems makes them particularly vulnerable in cross-border contexts [1]. Examples include recent catastrophic events, such as the damaging earthquakes in Croatia in March and December 2020 [2,3], and the severe flooding in Slovenia in August 2023 [4], which significantly affected both countries.
Although Croatia and Slovenia have well-established national-level flood and seismic hazard assessments for the design and safety evaluation of critical infrastructure, these assessments are rarely coordinated across borders. This presents a major limitation, as natural hazards do not adhere to political boundaries or historical event patterns. The 2020 earthquakes in Croatia clearly demonstrated how the integrity of critical infrastructure, particularly transportation networks and flood protection systems, can be compromised. In the immediate aftermath, critical infrastructure managers (CIMs) and civil protection agencies (CPAs) primarily focused on seismic damage, often overlooking secondary hazards, such as flooding caused by earthquake-induced failures in flood protection systems [5].
Effective disaster risk management (DRM) in cross-border regions demands coordinated efforts across jurisdictions and sectors. A recent European Commission study [6] on strengthening the resilience of EU border regions emphasises the need for comprehensive risk mapping, gap identification, and the improvement of crisis management tools to enhance DRM capacity. Similarly, the Joint Research Centre [7] has expanded the understanding of complex and emerging cross-border risks in Europe, highlighting the growing challenges for the EU.
Cross-border collaboration in enhancing disaster risk management (DRM) for shared hazards has been addressed through EU-funded initiatives, such as Interreg and the EU Civil Protection Mechanism. These studies addressed specific phases or the full cycle of DRM, including prevention, preparedness, response, and recovery. They focused on the assessment of the resilience of various types of infrastructure, such as road and rail networks (including bridges) [8,9] or flood protection systems [10].
A common conclusion of these studies is that one of the biggest obstacles to effective cross-border DRM is the difficulty in collecting, harmonising, and processing data between neighbouring countries. This challenge was also evident in the current study, where significant efforts were required to gather and align data due to differences in data acquisition methods and the varying levels of detail and availability.
The methodology presented in this paper was developed within the CROSScade project (Cross-border Cascading Risk Management for Critical Infrastructure in the Sava River Basin), which addressed earthquake and flood risks and their cascading effects across the border between Slovenia and Croatia. Further details about the project, including partners, timeline, and funding, are available at [11]. The research focused on the Sava River Basin and involved the development of realistic earthquake and flood scenarios using advanced seismic and hydraulic modelling. These scenarios were used to assess the vulnerability of critical infrastructure, particularly levees and bridges, and to identify potential cascading failures.
The outcomes allow more effective cross-border risk management strategies, ultimately enhancing the resilience of infrastructure and protecting communities along the Sava River.
The paper covers the following main topics: applied hydraulic models, seismic models, vulnerability assessment of levees, and vulnerability assessment of the selected bridge. The structure of the paper is as follows: Introduction, Materials and Methods, Methodology of vulnerability assessment, Results and Discussion, and Conclusions.
2. Materials and Methods
This section describes the case study area, the assumed event tree, hydraulic simulations, and seismic simulations. The vulnerability assessments of levees and a bridge is given in Section 3.
2.1. Case Study Area
The selected case study area encompasses the Slovenian–Croatian border region along the Sava River basin (Figure 1).
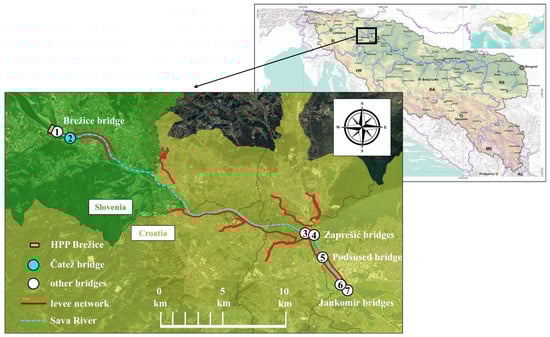
Figure 1.
The Sava River Basin with analysed critical infrastructure (upper map by [12]).
The Sava catchment area spans approximately 97,700 km2 and is one of the most significant sub-basins of the Danube basin, featuring numerous critical infrastructure objects. The study focuses on the Sava reach from the Brežice hydropower plant (HPP) in Slovenia to the Jankomir Bridge in Zagreb. The case study region is highly susceptible to earthquakes and flooding. Several significant seismic events and floods have occurred in this region, resulting in substantial damage to buildings and infrastructure. Recent events include the 2020 earthquake near Petrinja in Croatia, which caused infrastructure failures, such as large-scale deformations and cracks in the levee network (Figure 2a), while several bridges were damaged (Figure 2b), hampering the response to the event and the provision of first aid. Like many European areas affected by extreme climatic events in recent years, the Slovenian–Croatian border area experienced heavy rainfall, severe flooding and landslides in August 2023, causing extensive damage to buildings and infrastructure (Figure 2c).
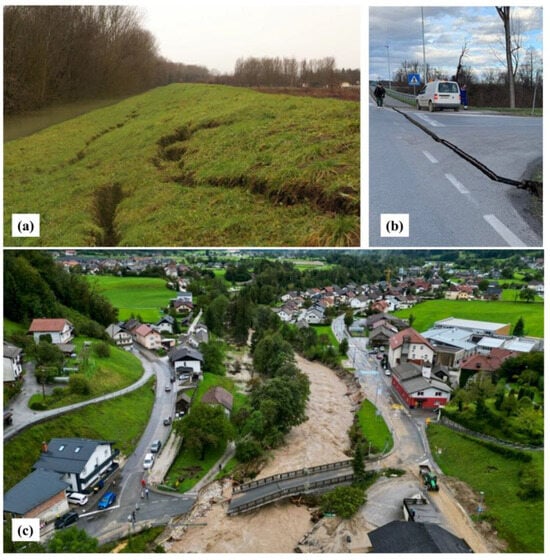
Figure 2.
Examples of damaged infrastructure in the area: (a) a levee after the Petrinja earthquake; (b) a bridge after the Petrinja earthquake; (c) a bridge after a recent extreme rainfall event. (Photos by [13]).
The present study considered 51 km of levees along the Sava River and its six tributaries, as well as seven bridges, two of which are located in Slovenia, near the Brežice HPP. In contrast, the remaining bridges are situated on the outskirts of Zagreb, Croatia. Among these, the Čatež Bridge in Slovenia was identified as the most critical due to its strategic role as part of a key regional transportation route, the absence of adequate scour protection, and its pronounced seismic vulnerability resulting from the lack of consideration of modern performance-based seismic provisions. In contrast, the first bridge downstream of the HPP was found to be less critical as it serves only local traffic and has recently undergone structural retrofitting. For the remaining bridges in the network, a more simplified analysis was performed, which supported the conclusion that the Čatež Bridge warranted the most comprehensive evaluation.
2.2. Concept of the Event Tree of Cascading Hazard Scenarios
To model the progression of cascading hazards, an event tree approach was employed as a conceptual qualitative framework to map out the chain of potential cascading events triggered by a primary hazard. A detailed insight into the event tree approach, along with an extensive literature review, can be found in [14]. The main components of the event tree include (1) the initial triggering hazard; (2) branches representing possible events and responses to the triggering hazard and diverging based on different outcomes; (3) cascading events, where the tree grows as each event triggers further hazards, illustrating a chain reaction or cascade of events; (4) probabilities, which are assigned to each branch to calculate the likelihood of different outcomes; (5) endpoints indicating scenarios ranging from minor to catastrophic. The event tree shown in Figure 3 illustrates how an initial seismic event in the Slovenia–Croatia cross-border region may propagate through multiple failure paths, depending on the integrity of critical infrastructure such as hydropower plants (HPP), levees, and bridges. It should be noted that damage or failure of critical infrastructure can be more severe than the effects of the triggering hazard itself. The construction of the shown event tree was based on interdisciplinary expert input and available infrastructure data.
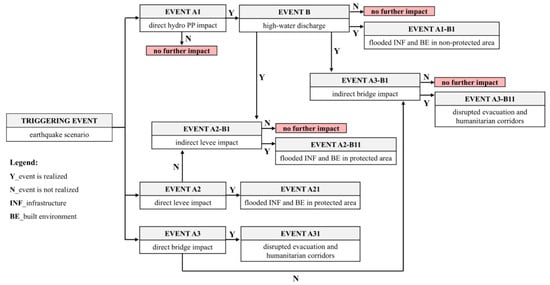
Figure 3.
Event tree of cascading hazard scenarios in the Slovenia–Croatia cross-border region.
In this study, an earthquake in a seismically vulnerable cross-border area was considered a triggering event. Following such an event, the assumed event tree could branch like this: Firstly, the triggering event might have no impact on the HPP, and a corresponding branch would end quickly (see Event A1, option N). Alternatively, a case of a significant impact would lead to high water discharges (Event B) caused by a malfunction of the HPP gates. In the next step, the branch could end with no further impact or continue with flooding in the cross-border area unprotected by the levees (Events A1–B1). The triggering event could affect the levee network (Event A2) and the bridges (Event A3), which serve as critical nodes of the evacuation routes. If there is a direct impact that results in the serviceability or carrying capacity being exceeded, this leads to flooding of the area protected by the levees (Event A21) and disruption of the evacuation routes (Event A31). However, if there is no direct impact that leads to the limit states being exceeded, levees and bridges are still affected to some extent by ground shaking. They are, therefore, more vulnerable to an increase in hydrodynamic loads caused by flood discharges from HPP (Event B). Levees that are now under the indirect seismic influence of flood discharges can either be damaged or fail, leading to flooding of the area protected by the levees (Events A2–B11), or the diversion can end with no further impact. Similarly, with bridges, the additional flood events may cause the limit states to be exceeded, interrupting the evacuation routes (Events A3–B11). These scenarios highlight the complex interplay between different infrastructure systems and the potential for a single triggering event to cause a series of cascading consequences across the region.
The presented conceptual event tree does not yet assign probabilities to branches but rather serves to explore plausible failure paths, prioritise scenarios for further simulation, and guide emergency planning. While this section focuses on the conceptual framework, the broader scope of the study advances toward the quantification of the event tree, including the assignment of probabilities to each branch, based on simulation results and available data. Validation of the full event tree is currently not feasible, given the lack of real-world seismic–flood cascading events of sufficient scale. The risk assessment that follows the described methodology, dealing with the analysis and quantification of the consequences of such cascading hazards, is beyond the scope of this paper.
2.3. Selection and Hydraulic Modelling of Flood Scenarios
Slovenia has a chain of five run-of-river HPPs along the 40 km section of the Sava from Vrhovo to Brežice. Another HPP in Mokrice, very close to the border with Croatia, is still in the planning stage. Over the past two decades, several hydraulic studies have been carried out to investigate various aspects of the operation of these HPPs [15,16]. Based on these previous studies, the five most relevant scenarios of exceptional malfunction of the spillways, breakage of the gates and breaching of the Brežice HPP embankment were selected as the most suitable for analysing earthquake-induced cascade events. The scenarios were based on the guidelines of the International Commission on Large Dams (ICOLD), as well as previous experience with the operation of HPPs in Slovenia, existing events, and established risk perceptions in the HPP’s influence area. These scenarios are listed in Table 1.

Table 1.
Overview of selected scenarios due to earthquake impact, showing the initial discharge of the Sava and the resulting peak discharge downstream of the Brežice HPP.
Note that in Table 1, the column Description gives scenarios of embankment breaching or spillway malfunctions as a result of an earthquake. Column 4 of Table 1 shows the resulting downstream discharge for each scenario at the Brežice HPP.
The hydraulic modelling was carried out in two main stages to capture the complexity of flood propagation in the region. The first stage covered the section from the town of Krško to the Slovenian–Croatian border and included the Brežice HPP (Model 1). This section of the river is characterised by a chain of HPPs. The modelling had to consider the operation of these plants and possible failures of dams and spillways. The second phase focused on the lower reaches from the Slovenian–Croatian border to the city of Zagreb, an area with significant floodplain development and numerous critical infrastructures at risk (Model 2).
In both models, the Sava River and all its tributaries were modelled using a dynamically coupled one-dimensional and two-dimensional (1D + 2D) approach that combines a 1D model to simulate flow in the river channels with a 2D model for the floodplains [16]. Lateral connections simulate the interaction between the grid cells of the 2D model and the cross-sections of the 1D model. These dynamically coupled 1D + 2D models are effective tools for simulating flood scenarios over large areas, focusing on analysing the main directions of water flows, water velocities, and depths, as well as the extent of flooding [17,18]. The numerical model MIKE FLOOD, developed by the Danish Hydraulic Institute, was used for the simulations in Model 1. The Model 1 was developed to support the planning and optimisation of HPPs’ design and operation. The software used enabled the simulation of gate operation, gate breakage, and embankment breaching. All rating curves used to simulate the outflow through the spillways for different scenarios were determined by physical modelling in previous studies. For Model 2, the HEC-RAS software from the Hydrologic Engineering Centre (Version 6.3.1) was used. The HEC-RAS software employs the sub-grid bathymetry approach and utilises unstructured meshes in 2D flow areas, enabling a flexible computational mesh that more accurately represents complex terrain and flow paths, particularly in regions with irregular boundaries or significant topographic variation. Both are well-established tools for hydraulic calculations of rivers and are frequently used in water management, hydro-environmental engineering and research [19,20,21,22,23,24,25]. The models were calibrated and validated using rating curves from six gauge stations and data from 16 temporarily installed pressure probes, collected during the design phase of the Brežice and Mokrice HPPs between 2007 and 2012. Model 1 was also validated with the results of a physical model used during the design process of the Brežice HPP [16,26]. The calculated water levels from both models closely matched the measurements from gauge stations and the physical model, with discrepancies of less than ±10 cm across the discharge range of 890 to 3750 m3/s. For both models, the digital terrain model (DTM) was generated from the following data: LIDAR, data from terrestrial surveys of the Sava River’s bathymetry, and data from the HPP design documentation (including the dam, embankments, spillways, flood protection measures, river regulation, etc.).
2.4. Selection and Seismic Modelling of Earthquake Scenarios
To comprehensively assess seismic risks in the Sava River Basin, the Crosscade project [27] developed earthquake scenarios based on the region’s seismic history and fault characteristics. The area’s seismicity is concentrated around two active reverse faults, the Artiče fault near Brežice and the North Medvednica fault near Zagreb (Figure 4a). These faults have been associated with significant historical earthquakes, such as the 1917 Brežice event (Mw 5.7) and the 1880 Zagreb event (Mw 6.0) (Figure 4b).
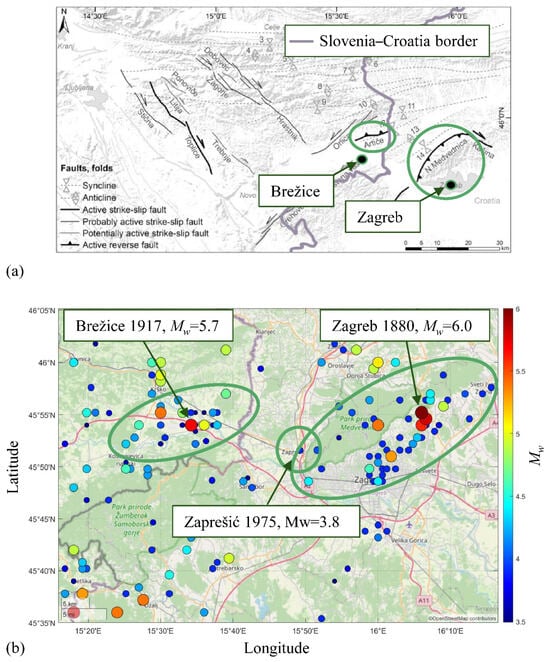
Figure 4.
(a) Mapping of fault systems in the case study region (adapted after [28]); (b) distribution of earthquake epicentres and magnitudes in the study area, derived from the Slovenian earthquake catalogue (up to 2004) and the ESHM20 catalogue for 2005–2018 [29], showing key events such as 1917 Brežice, 1880 Zagreb and 1975 Zapresić earthquake (adapted after [27]).
For this analysis, scenarios were modelled by adjusting the epicentres and considering conditions likely to produce significant cross-border impacts, allowing for a thorough evaluation of potential impact on the infrastructure. Selecting representative seismic scenarios was challenging due to numerous potential sources. Ideally, several scenarios should be analysed to identify the most severe events. However, for practical purposes and to facilitate future vulnerability analysis, it was decided to focus on replicating the two most significant historical events mentioned above. The exception is that the epicentre of the 1880 Zagreb earthquake was adjusted to the westernmost known reach of the North Medvenica fault, near the epicentre of the 1975 Zaprešić event, which was expected to provide larger cross-border impacts than the original event. The two seismic scenarios were quantified by modelling ground motion (GM) fields employing advanced numerical simulations using a ground-motion prediction equation (GMPE) [30,31], combined with stochastic methods. This approach enabled the generation of detailed spatial distributions of peak ground acceleration (PGA) on a rock across the study area, with a grid resolution of 0.5 km2.
3. Methodology of Vulnerability Assessment
3.1. Methodology of Vulnerability Assessment of Levees
The vulnerability assessment of levees was conducted using a multi-step approach designed to capture the potential effects of cascading hazards, where one event triggers another in sequence. Given that an earthquake occurs first, it may cause initial damage to the levees before the arrival of a subsequent water wave arising from partial dam failure. The challenge was to quantify this pre-existing damage in a way that could be meaningfully applied to stability analyses. To address this, a systematic yet simplified approach was adopted that balanced accuracy and computational efficiency by providing a range of possible outcomes rather than an exact result. The focus of the analyses was the mechanism of slope stability. Other mechanisms were mostly not relevant. The subsoil under the analysed levees does occasionally contain potentially liquefiable layers, but they are mostly found within the surface layers that are above the reference water level in the rivers. Thus, liquefaction potential could be safely ignored for this study. Mechanisms such as overflowing and piping require extremely high water-levels and relatively long water-wave durations, neither of which are characteristics of the analysed flood scenarios.
The analysis began with seismic slope stability evaluations using the pseudostatic limit equilibrium (LE) method to estimate the factor of safety (FS) for each levee segment (defined by 14 cross-sections) under two seismic scenarios: one representing an earthquake near Zagreb and another near Brežice, both having the same return period (RP). Considering the 14 levee cross-sections and the two seismic events, a total of 56 initial seismic stability assessments were made (both sides of each section). Following the seismic analyses, transient seepage modelling was performed to determine pore pressure conditions within the levees during each of the five flood scenarios (S1–S5), which were characterised by distinct hydrographs, disregarding possible changes to material parameters due to earthquake effects. This added another 31 valid analysis-cases (not all flood scenarios were relevant).
Subsequent seismic stability analyses were conducted, this time incorporating the effects of water waves from each flood scenario as if acting simultaneously. A total of 124 additional analyses were carried out to examine how the combined effects of ground acceleration and water waves might compromise levee stability (both sides of each section for all valid cases, for each earthquake source). Failure in deterministic analyses is determined by the FS being lower than 1. The probability of it being lower than 1, i.e., the probability of failure (pf), for each levee segment was efficiently determined using Rosenblueth’s Point Estimate Method (PEM) [32]. This statistical approach assumes that the factors of safety follow a normal distribution (which is a reasonable assumption unless demonstrated otherwise [33]) and are a function of one random variable, namely PGA as the most commonly used parameter for pseudo-static stability analyses, and simplifies the calculation by using three estimates of the FS to determine the mean and variance. The three PGA samples required for the PEM are taken from a lognormal distribution of PGA values. An additional 248 analyses were required for this step, bringing the total number of stability assessments to 428.
In certain flood scenarios, the water did not rise over the toe of the levee. In such cases the analyses were omitted, and the focus was solely placed on the most relevant scenarios, substantially reducing the required number of analyses (valid cases). It is important to note that although the combined seismic and flood stability analyses did not perfectly replicate the real-world conditions where an earthquake would precede the water wave, the approach provided an upper and lower bounds for failure probabilities. The lower bound was defined by the seismic analysis without considering flood effects, while the upper bound incorporated the impact of the water wave. The upper bound probabilities were used to categorise the levees. The actual probabilities are likely to be found between these bounds.
The described analyses were initially conducted for a 2475-year RP earthquake. To be able to make estimates for other earthquake return periods, too, additional analyses were conducted following the same procedure for PGA values scaled to a 475-year return period. The scaling was performed using the following expression:
By having probabilities of failure for two earthquake return periods, the RP was considered as the conditional variable for the construction of fragility curves (lines). The fragility curves thus show the probability of failure given that an earthquake of a specific RP occurred, i.e., P(FS < 1|RP), created from two data points (475 and 2475-year RP), and for this reason are assumed to be straight lines (in logarithmic space). It was also assumed that earthquakes of all RP on the fragility curve would damage the dam enough to generate the same flood scenarios.
The levee geometries were assessed from LiDAR data as well as from design reports where LiDAR was unavailable. The heights of the selected levees, in general, ranged from 1 to 5 m with crown widths from 3 to 5 m, with one exception of a 10 m high highway embankment with 28 m crown width. The slopes vary from 1:1.5 to 1:3, but are mostly found close to 1:2. Most levee sections were homogeneous (one exception with an impermeable core), built from coarse to fine-grained materials (with permeability k = 1 × 10⁻² to 6×10⁻⁹ m/s), with one to three different layers within the first 10 m of the foundation soil. The models for numerical analyses consider a significant width on both sides of the levees to take into account any channels and riverbeds in the vicinity that might affect stability, and are deep enough to allow critical slip surfaces to develop. The stratigraphy, composition of the levees and the respective parameters were assessed by field investigations, including standard penetration tests (SPT) and cone penetration tests (CPT), as well as laboratory investigations and from project design reports. To supplement the existing data, 14 new CPT investigations were performed, one at each cross-section location. All of the characteristics of the levees and foundation soils were defined deterministically within each section, i.e., no uncertainty regarding their parameters was assumed. The only source of uncertainty were the loads imposed on the levees, namely the seismic loads obtained from the seismic analyses described in Section 2.4, with PGAs corresponding to a 2475-year return period earthquake and defined through a lognormal distribution. For the 475-year return period earthquakes, the mean was scaled according to Equation (1), while the standard deviation, , remained the same, according to Equation (2):
where is the coefficient of variation.
The water waves obtained from the hydrographs described in the previous sections were considered as input. Figure 5 shows a map of the study area with the 14 levee sections and the LiDAR scans.
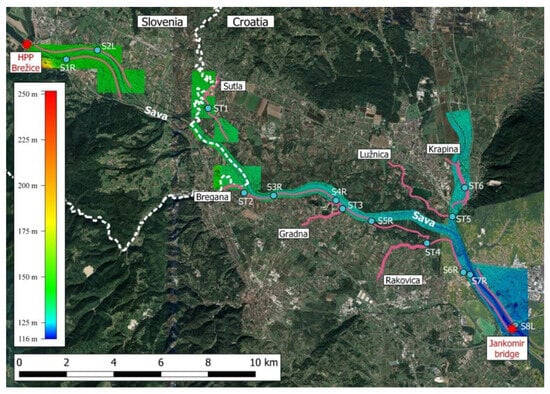
Figure 5.
Cross-section positions and LiDAR scan (colour scale represents altitude).
All numerical modelling of levees was performed using GeoStudio 2023.1, Bentley System Inc., Exton, Pennsylvania (US), where limit equilibrium (LE) analyses are performed along with finite element (FE) transient seepage analyses. Limit equilibrium methods present relatively simple ways of calculating the factor of safety for slope stability analyses. The LE method was chosen for its computational efficiency, as well as its adaptability through its settings. It required the definition of a slip surface apriori, but its efficiency circumvented this drawback by generating lots of trial surfaces to find the critical from. While the strength reduction method (SRM) does in theory give more realistic results by being based on numerically computed stresses and strains and without the need of having a predefined slip surface, it is very limited by the fact that no constraints can be placed on the slip surface, meaning that different situations in a similar stress–strain state could not be analysed.
Seepage analyses were conducted using the finite element method (FEM) for groundwater flow through porous media, independently from the soil’s stress–strain behaviour. The results of seepage calculations were used as input for slope stability analyses at various stages of the flood scenarios. The hydrograph properties dictated how much did a water wave affect the levees in terms of stability—higher peak, longer duration and faster drawdown meant lower factors of safety.
3.2. Methodology of Vulnerability Assessment of the Selected Bridge
The selected bridge’s vulnerability to earthquakes and floods was evaluated through non-linear time-history analysis. The particularity of this analysis lies in the sequential application of flood and scour actions following ground shaking within the same analysis, thereby incorporating the effects of all previous damage. A schematic representation of the different analysis phases considered in our study is given in Figure 6.
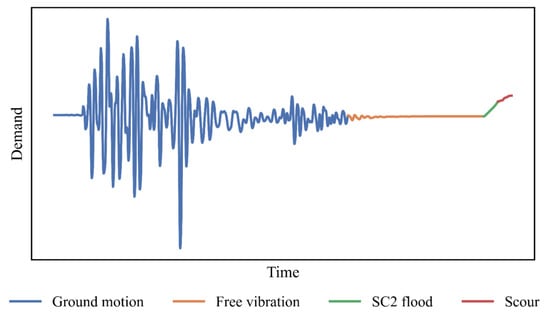
Figure 6.
Schematic representation of phases used in the combined seismic and flood vulnerability analysis.
The first phase involved conducting a non-linear time-history analysis for a ground motion (GM) event (represented with a blue line in Figure 6). This phase allowed earthquake-induced damage simulation, including reduced loading and unloading stiffness, and potential residual deformations. In lumped plasticity models, these are simulated using hysteretic models for reinforced concrete, such as Takeda hysteretic rules [34] or alternatives.
Following the GM event, the bridge was assumed to undergo free vibrations (orange line in Figure 6), letting the structure settle into a resting position. It should be noted that the bridge may experience permanent deformation and may not return to its original position. Therefore, its loading and unloading stiffness might be reduced.
The third phase involved applying flood loads (green line in Figure 6). For simplicity, this study treated the flood loads as static forces. The loads were incrementally applied to ensure convergence during analysis using a linear load pattern that increased iteratively to their final values. In Figure 6, this is visible through a gradual increase in the applied load.
The final phase (red line in Figure 6) simulated the effect of local pier scour by removing soil-structure interaction (SSI) springs from the FE model in the affected foundation areas, leading to a redistribution of loads in the pier and foundation. This removal of soil springs was performed in steps to allow for a smoother redistribution of forces, facilitating numerical convergence.
The described analysis can be implemented in conventional seismic vulnerability analysis methods, such as Incremental Dynamic Analysis (IDA) [35] or Multiple Stripe Analysis (MSA) [36]. The present research adopted the methodology previously employed in [37], which combined the techniques as mentioned above. Namely, the analysis was performed at predefined intensity levels; however, unlike MSA, which utilises different GM sets at different intensities, a single set of GMs was used for all intensity levels. While consistent with IDA in that it scales GMs to assess seismic response, it avoids estimating the intensity levels for specific damage states, reducing the required number of analyses.
The first step in deriving the bridge fragility curves was conducting time-history analyses of the bridge at eight predefined intensity levels, i.e., PGA = {0.10, 0.14, 0.18, 0.27, 0.40, 0.50, 0.60, 0.90} g. At each PGA level, the analysis was performed for all GMs in the set. The results were subsequently utilised to determine the conditional exceedance probability of a designated limit state at a specific PGA level. This probability was calculated as the ratio of the number of cases exceeding the limit state to the total number of GMs analysed. As suggested by [38], the observed conditional probabilities were then used to estimate the fragility function parameters using the maximum likelihood method. Baker [39] presented convenient software tools, including Matlab and Excel files, allowing for readable estimation of the fragility curve parameters, which were also used in our study.
Two limit states were examined in the bridge vulnerability analysis, i.e., (1) the serviceability limit state (SLS), and (2) the ultimate limit state (ULS). The SLS pertains to the operability of the bridge, while the ULS is associated with the bridge’s ultimate limit state, representing its ultimate capacity. The definition of specific threshold values is provided in Appendix A.
Bridge Geometry and Materials
The Čatež bridge, shown in Figure 7, is a 12-span prestressed reinforced concrete (RC) girder bridge with a total length of 359.8 metres. The bridge was designed in the mid-1970s without consideration of modern performance-based seismic provisions, which makes it vulnerable to seismic loading.
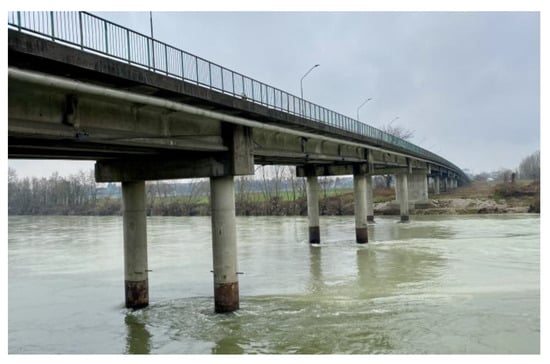
Figure 7.
Side view of the Čatež bridge over the Sava River.
Figure 8a presents the cross-section of the deck and pier cap, while Figure 8b shows the longitudinal section of the first half of the bridge.
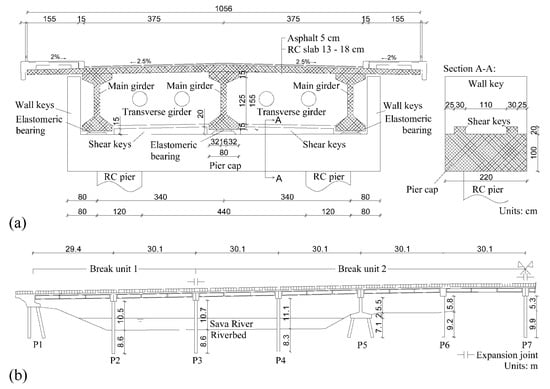
Figure 8.
Bridge details: (a) cross-section of the deck and pier cap; (b) longitudinal section of first two break units.
Shear keys restrain the transverse displacement of the deck at the pier caps, ensuring the deck remains stable under transverse loads. Four shear keys are located between the girders, while additional taller (wall) keys are constructed at both ends of the pier caps (Figure 8a). The substructure of the bridge is supported by 11 piers and two abutments. The intermediate piers are composed of circular column pairs of diameter 1.2 m, which are spaced 5.6 m apart, while piers 5 and 9 feature transverse RC walls. The circular columns are supported by bored piles of the same diameter, while the wall piers rest on top of a 1.5 m depth foundation mat and six inclined piles with diameters of 1.00 m. The bridge is divided into four independent brake units, each separated by expansion joints. The first two break units, i.e., the first half of the bridge, are presented in Figure 8b. The outer spans are 29.4 m each, while the remaining spans measure 30.1 m. Fixed bearings support main girders at piers P1 and P5, while elastomeric bearings are installed at the remaining piers. The cast-in-place slab ensures deck continuity over intermediate piers within each break unit. At the expansion joints, the deck is free to translate longitudinally and rotate about transverse and vertical axes.
Figure 9 presents the cross-section of the wall and circular piers. Concrete equivalent to C35/45, according to EN-1992-1-1 [40], is used in the superstructure, while C25/30 is employed in the piers and foundations. The reinforcement consists of smooth rebar of grade Č0200 and deformed rebar of grade Č0400 according to the old Yugoslavian design codes (JUS), with yield strengths of 220 MPa and 400 MPa, respectively.
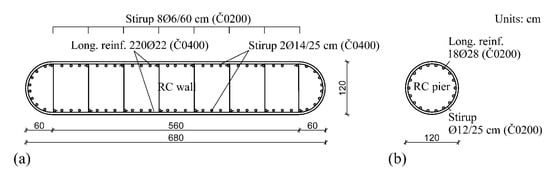
Figure 9.
Cross-section dimensions and reinforcement: (a) wall piers; (b) circular piers.
The soil at the location of the bridge is composed of a top quaternary sediment layer consisting of sandy and gravely soils overlaying a Miocene sandstone/marl base. The pile foundations extend up to the underlying sandstone/marl base. For analysis, the soil at the location of the bridge was idealised with a uniform layer, considering the following mechanical characteristics: dry unit weight of 19 kN/m3, friction angle of 40°, cohesion 0 kPa, and modulus of elasticity of 50 MPa. The of the soil profile was estimated to amount to 470 m/s, which corresponds to soil type B according to Eurocode 8 [41] categorisation.
4. Results and Discussion
This section describes the main results of the four main stages of our investigation: (1) hydraulic simulations, (2) seismic simulations, (3) vulnerability assessment of levees, and (4) vulnerability assessment of a bridge.
4.1. Results of Hydraulic Simulations
The hydraulic simulations showed that the characteristics of the flood waves varied significantly depending on the type of malfunction or breach scenario. A case with all 5 gates opened simultaneously at maximum speed (scenario 2) resulted in the most severe flood wave (Figure 10).
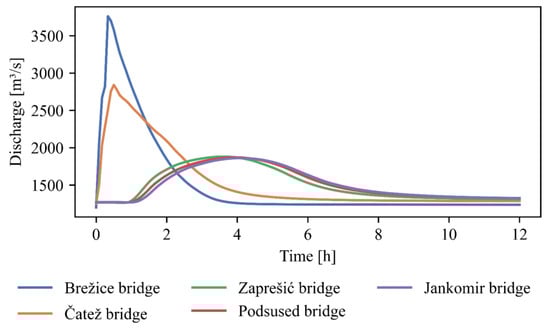
Figure 10.
Hydrograph transformation along the Sava River between the Brežice HPP and the city of Zagreb for Scenario 2.
The resulting peak discharge reached approximately 4100 m3/s, exceeding the flow associated with a 100-year return period flood event. The rapid release of water from the reservoir resulted in a hydrograph with a steeply rising limb, which emptied the reservoir in 1.5 to 2 h. However, as the wave propagated downstream, the extensive floodplains between Brežice and Zagreb helped dissipate the energy, causing a gradual attenuation of the flood wave hydrograph. In Zagreb, the peak discharge of the flood wave did not exceed 2000 m3/s, corresponding to a flood event with a return period of 2 to 5 years.
For example, scenario 5, which involved a breach of the right-bank embankment, led to a different flooding pattern. The embankment breaching led to a gradual water discharge into the floodplain, resulting in extensive localised flooding but a less pronounced peak discharge in the river’s main channel. The lateral water spread across the floodplain affected the extent and depth of flooding, altering flow paths and potentially increasing the risk of flooding in some low-lying regions. This scenario demonstrated how different failures can result in different flood consequences and emphasised the importance of multiple scenario assessments to understand the flood risk better. Figure 11 shows the maximum extent of flooding for Scenario 5, including the Sava River and its floodplains between the Slovenian–Croatian border and the city of Zagreb.
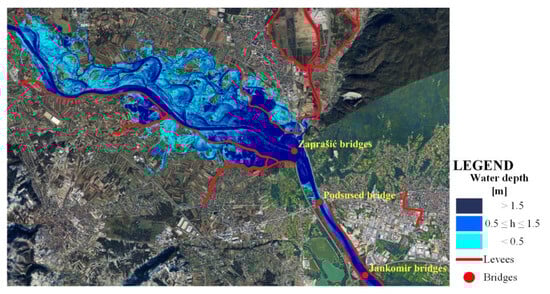
Figure 11.
Extent of flooding in the area between the Slovenia–Croatia border and the city of Zagreb for Scenario 5.
Hydraulic models provided time series of parameters, such as water levels, flow velocities, and discharge rates, which were critical for vulnerability assessments at levees and bridges. Results indicated that ageing levee sections could face overtopping or failure. At the same time, downstream bridges were exposed to strong hydrodynamic forces, particularly in scenarios with prolonged flood waves, thus increasing the risk of damage.
4.2. Results of Seismic Simulations
Examples of PGA fields from individual simulations of the Slovenian and Croatian seismic scenarios were briefly discussed in our previous work [42] and are here given in Figure 12.
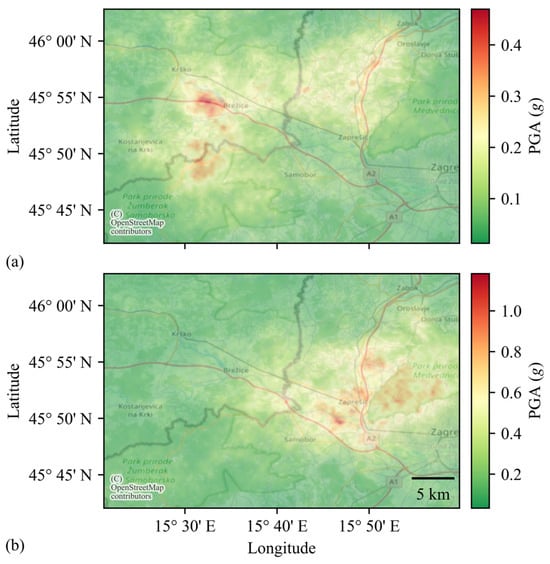
Figure 12.
PGA fields for a distinct simulation: (a) Slovenian seismic scenario; (b) Croatian seismic scenario [42].
Figure 12 shows that the PGA values in any given simulation did not uniformly disperse from the rupture plane projection. This underscored substantial differences in the ground-motion fields, demonstrating that uncertainties in the GMPE can result in substantially dissimilar outcomes for the analysed earthquake scenarios.
Monte Carlo simulations were conducted to account for the variability in GM, resulting in 500 realisations for each earthquake scenario. The results showed uniform PGA values near the fault rupture but highlighted substantial local variations, indicating areas with potentially higher-than-expected ground shaking intensity. This variability was critical for understanding how different parts of the cross-border region could experience varying levels of seismic impact. Determined by averaging the results from all 500 simulations, the mean PGA fields for the Slovenian and Croatian seismic scenarios are shown in Figure 13.
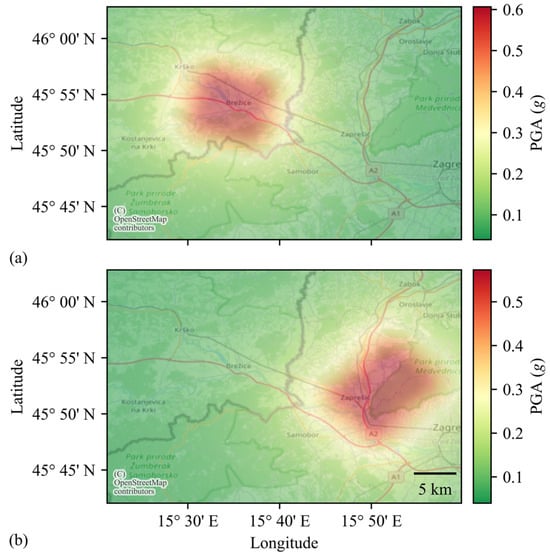
Figure 13.
Mean PGA fields on rock: (a) Slovenian seismic scenario; (b) Croatian seismic scenario [42].
The mean PGAs near the epicentre corresponded to a return period of approximately 3000 years. The results showed that the mean PGA at the rock level was relatively uniform above the rupture area. As predicted by GMPE, the PGA values decreased sharply as the distance from the rupture projection increased. However, there could still be a potential event, where the cross-border effects would be much larger than those suggested by the mean PGA fields alone.
4.3. Results of Vulnerability Assessment of Levees
For all analysed scenarios, the water waves were of too short duration to affect the landside slope stability, thus only the waterside slope probabilities of failure are reported, calculated during the receding phases of the water waves. The analyses revealed significant variations in the failure probabilities across different levee sections and hazard scenarios. Seismic events emerged as the primary factor driving instability, making segments closer to the epicentre more likely to fail. As shown in Table 2, for the 2475-year RP earthquakes, the probabilities of failure varied widely across different sections, influenced by soil composition, levee geometry, surrounding morphology, and proximity to fault lines. In Table 2, the results are shown in the form of probabilities of failure (pf [%]), where the probabilities are shown for the scenario with the earthquake acting without any water wave (Columns S0) and then for the earthquake acting with each flood scenario (Columns S1–S5). The location of each analysed section is marked in Figure 5.
Table 2.
Probabilities of failure (pf [%]) for all the analysed sections.
The results pertain to the probability of failure of the water-side slope during the receding phase of the water waves. Some cells in the table were left blank, indicating the scenarios where water elevations did not reach the levees’ toes. As previously explained, the true probability value should be found between S0 (indicating the lower bound) and the value of the scenario of interest (S1–S5, indicating the upper bound). An example of a visually improved representation of the data from Table 2 is shown in Figure 14a for a single cross-section only (ST1), where the relative contribution of the earthquakes is compared to each flood scenario acting alone. Figure 14b shows the fragility curves for the same cross-section, computed based on the two analysed return-periods, that are assumed to be linear (in the logarithmic scale).
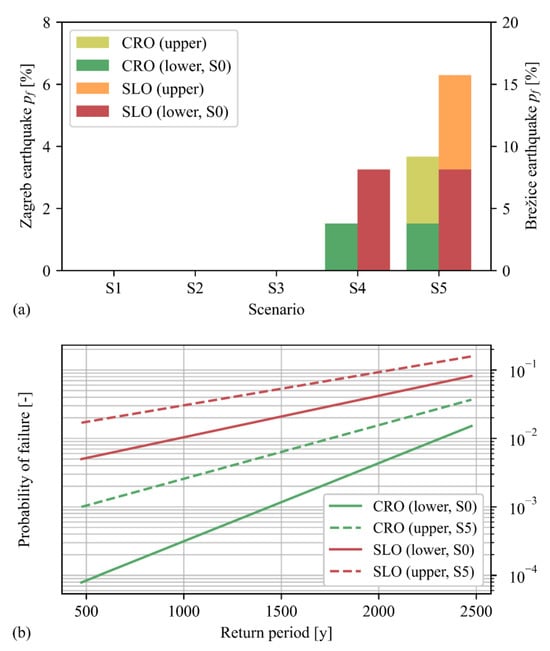
Figure 14.
(a) Example of a bar plot for the ST1 cross-section showing the lower (S0) and upper bound pfs for each scenario; (b) Fragility curves showing lower (S0) and upper bound (most critical, S5) pfs for earthquakes of variable return periods for the ST1 cross-section.
It can be seen that in most cases the earthquake contributed the most to the pf, while the water waves had a very limited effect. The data were used to classify the levees in relation to the earthquake hazard, based on upper bound probabilities, as illustrated for the 2475-year return period earthquakes in Croatia (Figure 15a) and Slovenia (Figure 15b).
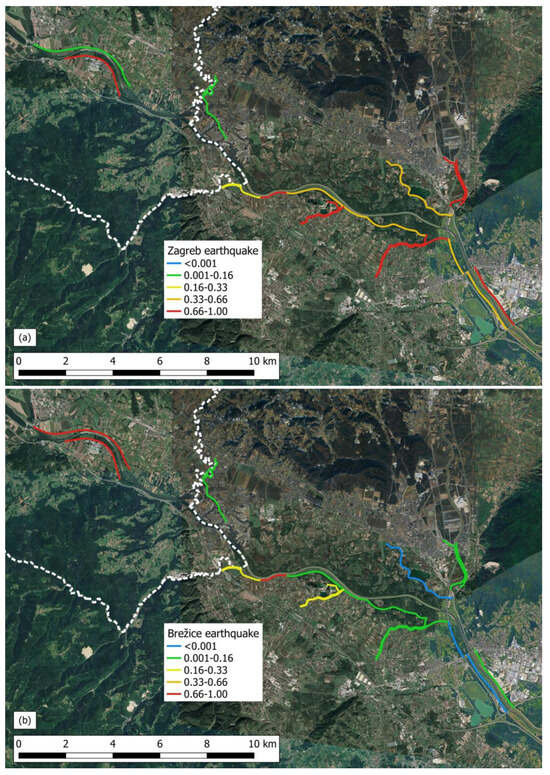
Figure 15.
Levee categorisation by the probability of failure for earthquakes of the 2475-year return period, using the upper bound pfs for the most critical scenario: (a) Croatian scenario; (b) Slovenian scenario.
Figure 15 shows the categorisation for the 2475-year return period earthquake. The categorisation is based on five categories, where the first two correspond to the values reported by USACE [43] to have “above average” and “hazardous” behaviour, respectively. Other categories are above the “hazardous” behaviour limit but are still divided into three more categories for the convenience of interpretation. The same results could also be generated for the 475-year return period earthquake, and interpolated for any other RP based on the developed fragility curves for each cross-section. The results showed that the calculated probabilities increased to almost 100%. However, it is essential to note that these probabilities pertained only to the likelihood of slope failure, not to the likelihood of breaching. Breaching might eventually occur as a result of a slope failure progression if the levees were left unrepaired during future events. Another thing to note is that the failures occur during the receding phase of the water waves. Thus, the considered flood events themselves did not pose a risk of flooding the protected area, because even in the unlikely case of a breaching failure, it would happen when the water was already receding. The presented results are based on a methodology that is applicable to large areas of interest covered with levees. As levees are long and continuous structures, the task of categorising them and assessing their stability depended on the available field investigation and time of the analysis. The detailedness of the analyses was proportional to the available data, which is usually inversely proportional to the area of interest.
4.4. Results of Vulnerability Assessment of the Selected Bridge
4.4.1. Input Data from Hydraulic Simulations
The flood vulnerability of the bridge was conducted based on the flood scenarios outlined in Section 2.3. The results of hydraulic simulations served as input for the bridge fragility analysis. The input data for the definition of flood loading on the bridge was represented by peak discharge Q, which uniquely defined the water height H and flow velocity v at a given bridge location. The input hydraulic data for the examined bridge is summarised in Table 3.
Table 3.
Input hydraulic data for the analysed bridge.
4.4.2. Input Data from Seismic Simulations
The seismic response of the bridge, as determined through non-linear time-history analysis, required the selection of input GM sets. For this purpose, a set consisting of 30 records was selected to match the Conditional Mean Spectrum (CMS) [44] for a 2475-year return period, reflecting the specific seismic conditions of the site [27]. The normalised acceleration spectra of the GM set are presented in Figure 16.
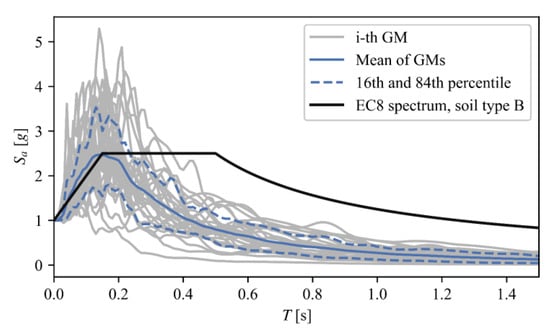
Figure 16.
Comparison of normalised acceleration spectra of the GM set used for non-linear time-history analysis of the Čatež bridge.
In Figure 16, the Eurocode 8 (EC8) elastic spectrum [41] for soil type B is also included for comparison purposes. The mean CMS spectrum provided significantly lower seismic demands for structures with medium to long vibration periods.
4.4.3. Numerical Modelling of the Bridge
The finite-element (FE) modelling of the bridge was conducted in two stages using the software Midas Civil [45] and OpenSeesPy ver. 3.7.0 [46], as schematically shown in Figure 17.
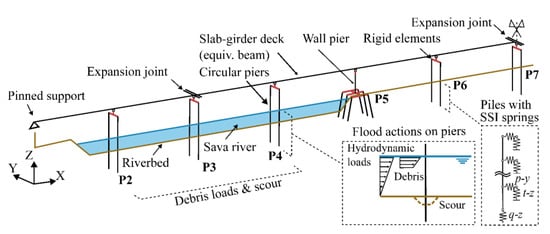
Figure 17.
FE model of the Čatež bridge in OpenSeesPy.
Initially, the bridge was modelled with Midas Civil software using linear-elastic beam-column elements. The numerical modelling was limited to the first two break units spanning the Sava River, representing the first half of the bridge. This section was selected due to its structural independence and its exposure to both seismic and earthquake-induced flood effects, making it the critical segment for assessing the bridge’s vulnerability in the transverse direction. Although the model did not encompass the entire bridge, the selected units were expected to capture the dominant response characteristics relevant to the examined loading scenarios.
This initial model accounted for the geometric and material characteristics of the bridge and served as input for subsequent non-linear analysis, considering SSI. The bridge deck was modelled using an equivalent beam element, incorporating the cross-section properties from Figure 8. Rigid vertical elements and crossbeams were used to connect the deck nodes with the supporting structure composed of circular piers. The piers and the deck were divided into 0.25 m and 1.0 m long elements, whereas the piles were initially modelled as single elements and were later subdivided in OpenSeesPy [46] when defining the SSI. At the expansion joints, longitudinal displacements (Ux) and rotations about transverse and vertical axes (Ry, Rz) were allowed, while pinned conditions were used at the end support. The mass and weight of the bridge were computed considering the self-weight of elements and an additional permanent load of 30.4 kN/m to account for the asphalt and sidewalks, not explicitly modelled in the analysis. Masses were concentrated in the nodes of the FE model. At midspan, above pier P7, half of the mass and weight of the adjacent span, which was omitted from the numerical model, was lumped at the deck level to approximate its influence. Traffic loads were not considered in the presented study.
In the second stage, the model was exported to OpenSeesPy for more detailed non-linear analysis, including SSI. The non-linear behaviour of the bridge was captured using a lumped-spring approach, allowing for plastic hinge formation at the base and top of the circular piers, and at the case of the wall pier. This was modelled using Giberson’s lumped plasticity model [47] with a trilinear moment-rotation envelope to simulate concrete cracking, yielding, and ultimate limit state, i.e., first crushing of the concrete core or rupture of the reinforcement. The cyclic response of RC members was simulated based on hysteretic rules implemented in the OpenSees uniaxial material Hysteretic Material [48]. Sectional moment-curvature analysis was performed for axial force levels corresponding to permanent loads. For the sectional analysis, we incorporated non-linear constitutive models for both unconfined and confined concrete and steel reinforcement. The calculations for yield and ultimate chord rotations were performed utilising equations from Annex A of Eurocode 8–3 [49]. This approach allowed for conservative reduction in the seismic capacity of the examined piers, such as inadequate seismic detailing, the presence of lap splices, the use of smooth reinforcement, and the reduction in the chord capacity of concrete walls. Dynamic analyses were conducted using Rayleigh damping, calibrated to achieve 5% critical damping based on the first two modal periods in the direction of analysis.
The SSI was modelled using a distributed spring approach (beam on non-linear Winkler foundation) with three types of springs: p-y springs to simulate lateral soil resistance, t-z springs to represent the frictional resistance along the pile shaft, and q-z springs to capture the end-bearing resistance at the pile tip. These soil springs were incorporated into the model using ZeroLength elements that connect the pile nodes to fixed nodes, generated at the exact location as the actual pile nodes. The force-displacement behaviour and cyclic response of the p-y, t-z and q-z springs were simulated using the OpenSees uniaxial materials PySimple1, TzSimple1, and QzSimple1, respectively [50,51,52], which implements appropriate hysteretic rules. The materials were defined specifying the ultimate forces (, , ) and displacements at 50% of the ultimate force (, , ). The non-linear behaviour of the pile itself was not considered. However, its serviceability and ultimate limit states were verified by assessing whether the pile moments exceed the yielding and ultimate capacities, as described in Appendix A. Although this simplified representation cannot fully capture the extent of pile damage, it is considered adequate for characterising global limit states of the bridge within the proposed vulnerability framework. For a more accurate simulation of pile damage, a fibre-based modelling approach would be required.
The soil spring parameters were informed using a similar approach as defined in [53]. The backbone curve of the p-y springs was derived following the guidelines provided in [54], with the ultimate force determined according to [55]. The displacement corresponding to 50% of the ultimate force was derived from the hyperbolic load–displacement curve recommended in [54].
For the t-z springs, the backbone curve was established based on the recommendation by [56], where the ultimate force of the spring was calculated using the Mohr-Coulomb failure criterion. As suggested in [57], the displacement at 50% of the ultimate force was set to 1.27 mm.
The q-z spring backbone curve was formulated according to recommendations by [58]. The ultimate bearing force at the tip was calculated using the Meyerhof method [59]. As per force-displacement curve by [58], the displacement at 50% of the ultimate force was taken as 12.5% of the pile’s ultimate displacement. The latter was assumed to occur at a displacement equal to 5% of the pile diameter.
The flood actions and local pier scour for each flood scenario from Table 1 (in Section 2.3) were evaluated using the methodology proposed within the previous UCPM project oVEFLOw [60], which was further elaborated by [61,62], and employed for rapid flood analysis of bridges within the CROSScade project [63]. The flood actions exerted on the bridge were influenced by water height and velocity. The hydrodynamic force acting on the pier (expressed in kN) was calculated using the equation from [64].
where represents the drag coefficient ( = 0.7 for piers with rounded nosing), v is the average upstream water velocity, and denotes the wetted cross-sectional area. In case of local scour, hydrodynamic forces were also applied to the exposed part of the pile foundations.
The debris force acting on the pier was estimated using the model proposed by [65], which assumes the shape of the debris mat resembles a half-cone pointing downward. The debris force was determined using Equation (3), assuming the projected area of debris and a drag coefficient of 1.6, as specified in [65]. The dimensions of the debris mat depended on the water velocity and the “key log length” (), which was defined as the longest debris log present in the upstream river reach. Following the recommendation by [61], was set to 16 m to provide an upper-bound estimation of the debris raft dimensions.
The hydrodynamic and debris forces were incorporated into the FE model as uniformly distributed loads, assuming an inversed triangular distribution of the water height. The debris loads were considered to act solely on piers within the riverbed (P2–P4).
The local scour depth around the bridge pier was estimated using the HEC18 empirical model [66]
The parameters of the model , and are correction factors accounting for pier nose shape, flow angle of attack (θ), and riverbed conditions. The parameter a is the pier width, and represents the Froude number, which depends on the flow parameters H and v.
Debris accumulation against the pier was found to increase the scour depth due to flow constriction and redirection. This effect was quantified using the methodology proposed by [67], which modifies the pier width a in Equation (4) to account for the increase in scour in the presence of debris. Similarly to debris loads, local scour was assumed to impact only piers located in the riverbed (P2–P4).
4.4.4. Results of Numerical Modelling of the Bridge
This section presents the results of the combined seismic and flood vulnerability assessment of the bridge, where seismic loading was followed by a free vibration phase and the application of flood loads and scour. The principles under which the analysis was performed were demonstrated for a specific GM (No. 4), scale at different seismic intensities, i.e., PGAs of 0.27 g and 0.60 g, followed by flood scenarios SC2. The focus of the demonstration was pier P7, located at the midspan of the bridge, which, due to the bridge’s eccentricity, experiences the most significant combined seismic-flood demands for the examined scenario.
In the scenario with a PGA of 0.27 g (Figure 18), the rotation in the critical pier remained below the threshold for the SLS, i.e., yielding of the pier, indicating the bridge remained operational.
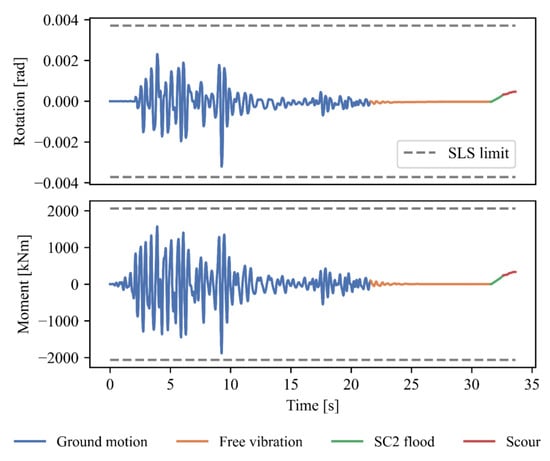
Figure 18.
Demand in the critical column (P7) for combined earthquake and SC2 flood scenario for a specific GM (No. 4) with PGA of 0.27 g.
However, for the scenario with a PGA of 0.60 g (Figure 19), the rotation exceeded the SLS threshold, meaning the bridge would no longer be operational under such conditions.
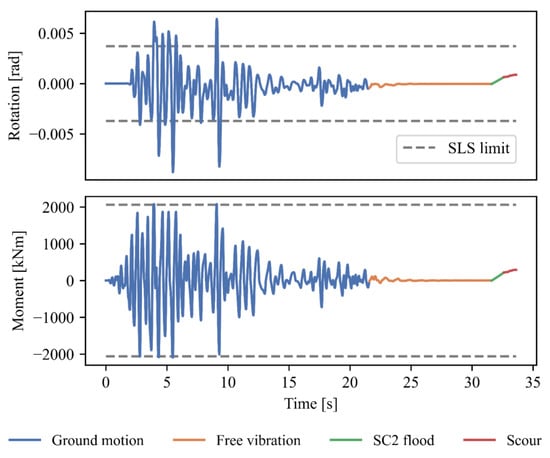
Figure 19.
Demand in the critical column (P7) for combined earthquake and SC2 flood scenario for specific GM (No. 4) with PGA of 0.60 g.
Interestingly, the flood actions, including scour effects, occurring after the seismic event, were found to be significantly lower than the SLS threshold. This indicated that flood forces alone were insufficient to cause the bridge to exceed the SLS. Therefore, seismic loading was the dominant factor in determining the bridge’s limit states. It is true, however, that if looking only at flooding actions, columns located in the riverbed (P2–P4) have larger utilisation ratios. However, due to the asymmetry of the bridge, the seismic demands were larger at the pier P7, which thus became the most critical pier.
The results of the fragility analysis suggested that the parameters of the fragility curve remained consistent across all scenarios, including the combined seismic and flood scenarios (SC1 to SC5) and the earthquake-only scenario. The median and logarithmic standard deviation of PGA at examined limit states amounted to {θPGA,SLS, βlnPGA,SLS} = {0.46, 0.38} g in case of SLS, and {θPGA, βlnPGA} = {0.73, 0.39} g in case of ULS. The uniformity of the fragility parameters across all scenarios indicated that the inclusion of flood as a secondary hazard did not influence the fragility curves. This suggested that the flood component had a negligible impact on the overall structural vulnerability, with seismic loading being the dominant factor.
An example of the simulation data points and fitted SLS and ULS fragility curves for the combined seismic and flood scenario SC2 is presented in Figure 20. The obtained fragility curve was used together with 500 GM fields simulation to perform the vulnerability assessment of the bridge for the two seismic scenarios: (1) earthquake in Slovenia and (2) earthquake in Croatia. For a given seismic scenario, the exceedance probability of a LS was computed using the following equation:
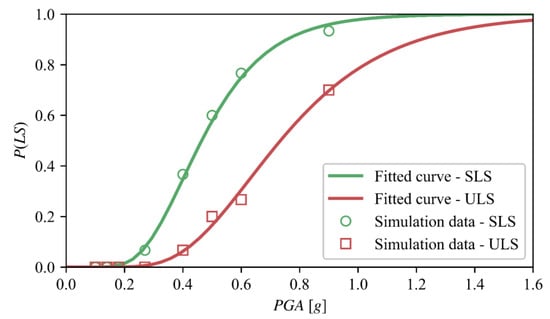
Figure 20.
Simulation data points and fitted fragility curves of the Čatež bridge for the combined seismic and flood scenario SC2.
Here, j represents the index of jth simulations, and is the conditional exceedance probability of a LS at a specific PGA level (), delivered from the fragility curve.
The obtained probabilities of exceeding the SLS and ULS of bridges are presented in Table 4.
Table 4.
Exceedance probabilities of the SLS and ULS of the Čatež bridge for the two seismic scenarios.
Results in Table 4 indicate that there is about a 60% probability that the bridge will not be operable in case of the Slovenia seismic event and about a 30% probability that the bridge will reach its ULS. In contrast, the Croatian seismic scenario yielded a very low probability of exceeding the SLS and ULS, indicating a minor cross-border effect in the examined case.
5. Conclusions
A comprehensive assessment of cross-border cascading hazards and the vulnerabilities of critical infrastructure in the Sava River Basin was performed. Special focus was given to levees and bridges. The study’s findings indicate that the existing national-level assessments in Croatia and Slovenia, although well-established, are insufficient to address the complexities of multi-hazard scenarios that involve cascading effects. By simulating various cascading earthquake-flood scenarios and evaluating their impact on critical infrastructure, this study indicates vulnerabilities of the considered infrastructure. The hydraulic modelling results reveal that, while the initial flood waves following the malfunction or breaching of hydropower plant components did not cause direct flooding of urban areas, the potential for cascading failures remains substantial. The scenarios demonstrate that levees and bridges, which are vital for flood protection and emergency response, are particularly susceptible to seismic damage that can exacerbate subsequent flooding events.
In this study, somewhat different approaches for vulnerability assessment of levees and bridges were followed, highlighting the need for tailored strategies that reflect the specific characteristics of each infrastructure type. For large-scale structures, such as levees, the study demonstrates the use of cross-section-based geotechnical stability analysis under diverse flood and seismic conditions to assess the vulnerability of the levee network. In contrast, bridges and distinct structures are localised and often require case-specific analyses to obtain realistic vulnerability estimates. To optimise the use of resources, the most critical bridge in the case study area was identified based on a prior simplified screening analysis. A detailed analysis was then conducted for this bridge, incorporating advanced numerical modelling techniques to capture the non-linear soil–structure interaction and assess its vulnerability to the combined effects of seismic loading, hydrodynamic and debris forces, and local scour.
The probabilistic vulnerability assessments of levees further emphasise that the likelihood of failure can reach high levels, especially during the receding phase of flood waves following an earthquake. For the examined bridge, the results of the fragility analysis suggest that the inclusion of earthquake-induced flood as a secondary hazard has negligible impact on the overall structural vulnerability, with seismic loading being the dominant factor.
The findings of this study provide essential input data for a comprehensive cross-border risk assessment, which can support the development of effective cross-border risk management strategies and inform decision-making for enhancing the resilience of critical infrastructure. Such an assessment was conducted within the CROSScade project, where a dedicated methodology was developed to analyse the consequences of cross-border cascading hazard events. This formed the basis for two targeted action plans aimed at increasing the structural resilience of critical infrastructure, and cross-border communication. With the coordinated enhancement of infrastructure resilience in the Sava River Basin between Slovenia and Croatia, by updating design standards, reinforcing existing levees and bridges, and adopting a proactive approach to infrastructure maintenance and emergency preparedness, more can be achieved with the same resources. Enhancing system resilience also involves promoting real-time data sharing and cross-border information exchange to facilitate coordinated emergency planning and quicker crisis responses.
This research supports ongoing regional collaboration and multidisciplinary methods in hazard assessment. Future efforts should emphasise interoperable early warning systems, the incorporation of climate change forecasts, and expanding the framework to cover additional critical infrastructure, which aids in preparing for complex, multi-hazard situations.
In conclusion, a step toward improving cross-border disaster resilience in the Sava River Basin was made. The outcomes provide a basis for future research on cross-border risk assessment and management, aimed at reducing the risk of cascading disasters and safeguarding critical infrastructure. The study advocates for continued collaboration between countries in the region and the integration of multi-disciplinary methodologies in hazard assessment and risk management to enhance infrastructure safety and community protection.
Author Contributions
Conceptualization: G.R., G.N., M.Č., A.A., M.K., M.B., N.R. and M.S.K.; methodology: G.R., A.A., M.K., N.R. and M.B.; software: G.R., A.A., M.K., N.R. and M.B.; validation G.R., G.N., A.A., M.K., N.R. and M.B.; formal analysis: G.R., M.K., A.A., N.R. and M.B.; investigation: G.R., G.N., M.K., A.A., N.R. and M.B.; resources: M.Č. and M.S.K.; data curation: G.R., G.N., M.K., A.A., N.R. and M.B.; writing—original draft preparation: G.R., G.N., A.A., M.K., M.B. and N.R.; writing—review and editing: G.R., G.N., M.Č., A.A., M.K., M.B., N.R. and M.S.K.; visualisation: G.R., M.K., A.A., N.R. and M.B.; supervision: M.Č. and M.S.K.; project administration: M.B., M.Č. and M.S.K.; funding acquisition: A.A., M.K., M.B., M.S.K. and M.Č. All authors have read and agreed to the published version of the manuscript.
Funding
This research was conducted as part of Project CROSScade (Cross-border cascading risk management for critical infrastructure in the Sava River Basin), which was co-funded by the European Union, Grant Agreement Number 101048395. Part of this research was also funded by the Slovenian Research Agency research core funding No. P2-0180 “Water Science and Technology”, core founding No. P2-0273 “Building structures and materials”, and infrastructure programme No. I0-0032 “Testing of Materials and Structures”.
Data Availability Statement
The survey data is not available. It was collected with the understanding that it would only be used for this study, and we cannot control its use if the data is provided. Literature references, modelling results, and the resulting functions are provided in this paper.
Acknowledgments
The authors would like to acknowledge the support by Maja Kreslin and Neža Gošte (Slovenian National Building and Civil Engineering Institute) in the preparation of the initial linear-elastic model of the examined bridge, and Jure Žižmond (SPEKTRAL d.d.) for the development of seismic scenarios and selection of ground motions that provided the input for the analyses described in this paper. During the preparation of this manuscript, the authors used ChatGPT ver. 4 for the purpose of enhancing the readability of this work. The authors have reviewed and edited the output and take full responsibility for the content of this publication.
Conflicts of Interest
The authors declare no conflicts of interest. The funders had no role in the design of the study; in the collection, analyses, or interpretation of data; in the writing of the manuscript; or in the decision to publish the results.
Abbreviations
The following abbreviations are used in this manuscript (in order of appearance):
| HPP | hydropower plant |
| DTM | digital terrain model |
| GM | ground motion |
| GMPE | ground motion prediction equation |
| PGA | peak ground acceleration |
| LE | limit equilibrium |
| FS | factor of safety |
| S1–S5 | scenario 1 to scenario 5 |
| PEM | point estimate method |
| pf | probability of failure |
Appendix A
Limit State Definition for Vulnerability Assessment of the Selected Bridge
This appendix provides a definition of the serviceability limit state (SLS) and ultimate limit state (ULS) for vulnerability analysis of the examined bridge.
The SLS is assumed to be triggered when the first of the listed criteria is reached:
- –
- yielding of piers at their ends according to EC8-3 rotation (CEN, 2005);
- –
- yielding of piers within elements (verification of moment capacity);
- –
- exceedance of 75% of the pier’s shear capacity according to EC8-3 (CEN, 2005);
- –
- exceedance of 75% of shear keys’ sliding shear capacity according to EC8-1 (CEN, 2004b);
- –
- shear deformation in the elastomeric bearings exceeds 100% [68];
- –
- exceedance of 75% of shear capacity of fixed bearings;
- –
- scour exceeds 50% of the foundation depth;
- –
- yielding of piles (verification of moment capacity).
The ULS is assumed to be triggered when the first of the listed criteria is reached:
- –
- ultimate (near collapse) rotation of piers according to EC8-3 (CEN, 2005) is exceeded;
- –
- pier moment capacity within the elements is exceeded (verification of moment capacity);
- –
- shear failure of the piers according to EC8-3 (CEN, 2005);
- –
- sliding shear failure of shear keys according to EC8-1 (CEN, 2004b);
- –
- shear deformation in the elastomeric bearings exceeds 300% [68];
- –
- shear failure of the fixed bearings;
- –
- scour exceeds the foundation depth;
- –
- pile moment capacity within the elements is exceeded (verification of moment capacity).
References
- Adrot, A.; Fiedrich, F.; Lotter, A.; Münzberg, T.; Rigaud, E.; Wiens, M.; Raskob, W.; Schultmann, F. Challenges in establishing cross-border resilience. In Urban Disaster Resilience and Security: Addressing Risks in Societies; Fekete, A., Fiedrich, F., Eds.; Springer International Publishing: Cham, Switzerland, 2018; pp. 429–457. ISBN 978-3-319-68606-6. [Google Scholar]
- Markušić, S.; Stanko, D.; Korbar, T.; Belić, N.; Penava, D.; Kordić, B. The Zagreb (Croatia) M5.5 Earthquake on 22 March 2020. Geosciences 2020, 10, 252. [Google Scholar] [CrossRef]
- Pollak, D.; Gulam, V.; Novosel, T.; Avanić, R.; Tomljenović, B.; Hećej, N.; Terzić, J.; Stipčević, J.; Bačić, M.; Kurečić, T.; et al. The Preliminary Inventory of Coseismic Ground Failures Related to December 2020–January 2021 Petrinja Earthquake Series. Geol. Croat. 2021, 74, 189–208. [Google Scholar] [CrossRef]
- Bezak, N.; Panagos, P.; Liakos, L.; Mikoš, M. Brief Communication: A First Hydrological Investigation of Extreme August 2023 Floods in Slovenia, Europe. Nat. Hazards Earth Syst. Sci. 2023, 23, 3885–3893. [Google Scholar] [CrossRef]
- Bačić, M.; Andačić, K.; Gavin, K.; Urumović, K. Soil Investigations As A Cornerstone For Geotechnical Design of Liquefaction Mitigation Measures Below Levees. In Proceedings of the 4th European Regional Conference of IAEG (EUROENGEO 2024), Dubrovnik, Croatia, 8 October 2024; pp. 218–227. [Google Scholar] [CrossRef]
- European Commission. Strengthening the Resilience of EU Border Regions; Publications Office of the European Union: Luxembourg, 2024; ISBN 9789268162132. [Google Scholar]
- Joint Research Centre. Cross-Border and Emerging Risks in Europe; Publications Office of the European Union: Luxembourg, 2024; ISBN 9789268164594. [Google Scholar]
- Borghetti, F.; Marchionni, G. Cross-Border Critical Transportation Infrastructure: A Multi-Level Index for Resilience Assessment. Transp. Res. Procedia 2023, 69, 77–84. [Google Scholar] [CrossRef]
- Sheshov, V.; Apostolska, R.; Salic, R.; Vitanova, M.; Bojadzieva, J.; Edip, K.; Stojmanovska, M.; Bogdanovic, A.; Jekic, G.; Borzi, B.; et al. Multi-Hazard Risk Assessment of Basic Services and Transport Infrastructure in RN Macedonia, Greece and Albania Cross-Border Region–CRISIS Project. In Building for the Future: Durable, Sustainable, Resilient, Proceedings of the fib Symposium 2023, Istanbul, Turkey, 5–7 June 2023; Ilki, A., Çavunt, D., Çavunt, Y.S., Eds.; Springer Nature: Cham, Switzerland, 2023; pp. 1754–1764. [Google Scholar]
- Lousada, S.; Gómez, J.M.N.; Vilčekova, S.; Delehan, S. Integrating Resilient Water Infrastructure and Environmental Impact Assessment in Borderland River Basins. Water 2025, 17, 1205. [Google Scholar] [CrossRef]
- CROSSCade Project. Available online: https://civil-protection-knowledge-network.europa.eu/projects/crosscade (accessed on 3 August 2025).
- Internatioinal Sava River Basin Commisssion. Sava River Basin Management Plan; Internatioinal Sava River Basin Commisssion: Zagreb, Croatia, 2014. [Google Scholar]
- Associated Press. Slovenia Suffers Worst-Ever Floods, Damage May Top 500 Million Euros. Available online: www.apnews.com (accessed on 29 May 2025).
- Zuccaro, G.; De Gregorio, D.; Leone, M.F. Theoretical model for cascading effects analyses. Int. J. Disaster Risk Reduct. 2018, 30, 199–215. [Google Scholar] [CrossRef]
- Rak, G.; Müller, M.; Šantl, S.; Steinman, F. Use of Hybrid Hidraulic Models in the Process of Hydropower Plants Design on the Lower Sava. Acta Hydrotech. 2012, 25, 59–70. [Google Scholar]
- Rak, G.; Kozelj, D.; Steinman, F. The Impact of Floodplain Land Use on Flood Wave Propagation. Nat. Hazards 2016, 83, 425–443. [Google Scholar] [CrossRef]
- Liu, Q.; Qin, Y.; Zhang, Y.; Li, Z. A Coupled 1D–2D Hydrodynamic Model for Flood Simulation in Flood Detention Basin. Nat. Hazards 2015, 75, 1303–1325. [Google Scholar] [CrossRef]
- Jamali, B.; Löwe, R.; Bach, P.M.; Urich, C.; Arnbjerg-Nielsen, K.; Deletic, A. A Rapid Urban Flood Inundation and Damage Assessment Model. J. Hydrol. 2018, 564, 1085–1098. [Google Scholar] [CrossRef]
- Patro, S.; Chatterjee, C.; Mohanty, S.; Singh, R.; Raghuwanshi, N.S. Flood Inundation Modeling Using MIKE FLOOD and Remote Sensing Data. J. Indian Soc. Remote Sens. 2009, 37, 107–118. [Google Scholar] [CrossRef]
- Vanderkimpen, P.; Melger, E.; Peeters, P. Flood Modeling for Risk Evaluation: A MIKE FLOOD vs. SOBEK 1D2D Benchmark Study. In Proceedings of the European Conference on Flood Risk Management Research into Practice (FLOODRISK 2008), Oxford, UK, 30 September–2 October 2008; pp. 77–84. [Google Scholar]
- Jongman, B.; Kreibich, H.; Apel, H.; Barredo, J.I.; Bates, P.D.; Feyen, L.; Gericke, A.; Neal, J.; Aerts, J.C.J.H.; Ward, P.J. Comparative Flood Damage Model Assessment: Towards a European Approach. Nat. Hazards Earth Syst. Sci. 2012, 12, 3733–3752. [Google Scholar] [CrossRef]
- Samantaray, D.; Chatterjee, C.; Singh, R.; Gupta, P.K.; Panigrahy, S. Flood Risk Modeling for Optimal Rice Planning for Delta Region of Mahanadi River Basin in India. Nat. Hazards 2015, 76, 347–372. [Google Scholar] [CrossRef]
- Namara, W.G.; Damisse, T.A.; Tufa, F.G. Application of HEC-RAS and HEC-GeoRAS Model for Flood Inundation Mapping, the Case of Awash Bello Flood Plain, Upper Awash River Basin, Oromiya Regional State, Ethiopia. Model. Earth Syst. Environ. 2022, 8, 1449–1460. [Google Scholar] [CrossRef]
- Afzal, M.A.; Ali, S.; Nazeer, A.; Khan, M.I.; Waqas, M.M.; Aslam, R.A.; Cheema, M.J.M.; Nadeem, M.; Saddique, N.; Muzammil, M.; et al. Flood Inundation Modeling by Integrating HEC–RAS and Satellite Imagery: A Case Study of the Indus River Basin. Water 2022, 14, 2984. [Google Scholar] [CrossRef]
- Burshtynska, K.; Kokhan, S.; Pfeifer, N.; Halochkin, M.; Zayats, I. Hydrological Modeling for Determining Flooded Land from Unmanned Aerial Vehicle Images—Case Study at the Dniester River. Remote Sens. 2023, 15, 1071. [Google Scholar] [CrossRef]
- Šantl, S.; Novak, G.; Rak, G.; Steinman, F. Hybrid Hydraulic Modelling Approach in the Process of Hydropower Plant Design. In Proceedings of the International Symposium on Hydraulic Physical Modelling and Field Investigation, Nanjing, China, 13–15 September 2010; pp. 54–61. [Google Scholar]
- Žižmond, J. Simulations of Ground Motions Field Intensities and Seismic Hazard Curves for the Slovenia and Croatia Cross-Border Area of the River Sava Basin, SPEKTRAL Engineering d.o.o.: Ljubljana, Slovenia, 2023; (Non-public report).
- Atanackov, J.; Jamšek Rupnik, P.; Jež, J.; Celarc, B.; Novak, M.; Milanič, B.; Markelj, A.; Bavec, M.; Kastelic, V. Database of Active Faults in Slovenia: Compiling a New Active Fault Database at the Junction Between the Alps, the Dinarides and the Pannonian Basin Tectonic Domains. Front. Earth Sci. 2021, 9, 604388. [Google Scholar] [CrossRef]
- Danciu, L.; Nandan, S.; Reyes, C.; Basili, R.; Weatherill, G.; Beauval, C.; Rovida, A.N.; Vilanova, S.; Sesetyan, K.; Bard, P.Y.; et al. The 2020 Update of the European Seismic Hazard Model ESHM20: Model Overview; EFEHR Technical Report 001, v1.0.0; EFEHR: Zurich, Switzerland, 2021. [Google Scholar]
- Kotha, S.R.; Weatherill, G.; Bindi, D.; Cotton, F. A Regionally-Adaptable Ground-Motion Model for Shallow Crustal Earthquakes in Europe. Bull. Earthquake Eng. 2020, 18, 4091–4125. [Google Scholar] [CrossRef]
- Weatherill, G.; Kotha, S.R.; Cotton, F. A Regionally-Adaptable “Scaled Backbone” Ground Motion Logic Tree for Shallow Seismicity in Europe: Application to the 2020 European Seismic Hazard Model. Bull. Earthquake Eng. 2020, 18, 5087–5117. [Google Scholar] [CrossRef]
- Christian, J.T.; Baecher, G.B. Point-Estimate Method as Numerical Quadrature. J. Geotech. Geoenviron. Eng. 1999, 125, 779–786. [Google Scholar] [CrossRef]
- Baecher, G.B.; Christian, J.T. Reliability and Statistics in Geotechnical Engineering; Wiley: Hoboken, NJ, USA, 2003. [Google Scholar]
- Takeda, T.; Sozen, M.A.; Nielsen, N.N. Reinforced Concrete Response to Simulated Earthquakes. ASCE J. Struct. Div. 1970, 96, 2557–2573. [Google Scholar] [CrossRef]
- Vamvatsikos, D.; Allin Cornell, C. Incremental Dynamic Analysis. Earthq. Eng. Struct. Dyn. 2002, 31, 491–514. [Google Scholar] [CrossRef]
- Jalayer, F.; Cornell, C.A. Alternative Non-Linear Demand Estimation Methods for Probability-Based Seismic Assessments. Earthq. Eng. Struct. Dyn. 2009, 38, 951–972. [Google Scholar] [CrossRef]
- Oblak, A.; Kosič, M.; Da, F.A.; Logar, J. Fragility Assessment of Traffic Embankments Exposed to Earthquake-Induced Liquefaction. Appl. Sci. 2020, 10, 6832. [Google Scholar] [CrossRef]
- Baker, J.W. Efficient Analytical Fragility Function Fitting Using Dynamic Structural Analysis. Earthq. Spectra. 2015, 31, 579–599. [Google Scholar] [CrossRef]
- Baker, J.W. Baker Research Group—Fragility Function Fitting. Available online: www.jackwbaker.com (accessed on 3 August 2025).
- Comite Europeen de Normalisation (CEN). Eurocode 2: Design of Concrete Structures—Part 1-1: General—Common Rules for Building and Civil Engineering Structures (EN 1992-1-1:2004); Comite Europeen de Normalisation (CEN): Brussels, Belgium, 2004. [Google Scholar]
- Comite Europeen de Normalisation (CEN). Eurocode 8: Design of Structures for Earthquake Resistance—Part 1: General Rules Seismic Actions and Rules for Buildings (EN 1998-1:2004); Comite Europeen de Normalisation (CEN): Brussels, Belgium, 2004. [Google Scholar]
- Rak, G.; Novak, G.; Četina, M.; Anžlin, A.; Žižmond, J.; Kosič, M. Cross Border Cascading Hazard Scenarios in Sava River Basin–Results of the Hydraulic and Seismic Simulations of the CROSScade Project. In Proceedings of the 8th IAHR Europe Congress (IAHR, 2024), Lisbon, Portugal, 4–7 June 2024; pp. 567–573. [Google Scholar]
- U.S. Army Corps of Engineers. Engineering and Design Introduction to Probability and Reliability Methods for Use in Geotechnical Engineering; U.S. Army Corps of Engineers: Washington, DC, USA, 1997; pp. 5–15.
- Baker, J.W. Conditional Mean Spectrum: Tool for Ground-Motion Selection. J. Struct. Eng. 2011, 137, 322–331. [Google Scholar] [CrossRef]
- Midas Engineering Software Midas Civil. Available online: https://www.midasuser.com/en/product/civil (accessed on 3 August 2025).
- Zhu, M. The OpenSeesPy, Version 3.7.0. Available online: https://openseespydoc.readthedocs.io/en/latest (accessed on 3 August 2025).
- Giberson, F.M. Two Nonlinear Beams With Definitions of Ductility. J. Struct. Div. 1969, 95, 137–157. [Google Scholar] [CrossRef]
- Michael, S.; Filip, F.; Mazzoni, S. OpenSeesWiki. Available online: https://opensees.berkeley.edu/wiki/index.php/Hysteretic_Material (accessed on 3 August 2025).
- Comite Europeen de Normalisation (CEN). Eurocode 8: Design of Structures for Earthquake Resistance-Part 3: Assessment and Retrofit of Buildings (EN 1998-3:2005); Comite Europeen de Normalisation (CEN): Brussels, Belgium, 2005. [Google Scholar]
- Boulanger, R. OpenSeesWiki—PySimple 1 Material. Available online: https://opensees.berkeley.edu/wiki/index.php/PySimple1_Material (accessed on 3 August 2025).
- Boulanger, R. OpenSeesWiki—TzSimple 1 Material. Available online: https://opensees.berkeley.edu/wiki/index.php/TzSimple1_Material (accessed on 3 August 2025).
- Boulanger, R. OpenSeesWiki—QzSimple 1 Material. Available online: https://opensees.berkeley.edu/wiki/index.php/QzSimple1_Material (accessed on 3 August 2025).
- McGann, C.; Arduino, P. OpenSees Examples: Laterally-Loaded Pile Foundation. Available online: https://opensees.berkeley.edu/wiki/index.php/Laterally-Loaded_Pile_Foundation (accessed on 3 August 2025).
- API RP 2A-WSD; Recommended Practice for Planning, Designing and Constructing Fixed Offshore Platforms-Working Stress Design. American Petroleum Institute: Washington, DC, USA, 2003.
- Reese, L.C.; Impe, W.F.V. Single Piles and Pile Groups Under Lateral Loading-2nd Edition; CRC Press: Boca Raton, FL, USA; Taylor & Francis Group: Boca Raton, FL, USA, 2011; ISBN 9781439894309. [Google Scholar]
- Mosher, R.L. Load-Transfer Criteria for Numerical Analysis of Axially Loaded Piles in Sand—Final Report; U.S. Army Engineer Waterways Experiment Station: Vicksburg, MS, USA, 1984. [Google Scholar]
- API RP 2A-WSD; RP2A: Recommended Practice for Planning, Designing and Constructing Offshore Platforms-Working Stress Design. American Petroleum Institute: Washington, DC, USA, 2007.
- Vijayvergiya, V.N. Load-Movement Characteristics of Piles. In Proceedings of the 4th Annual Symposium of the Waterway, Port, Coastal, and Ocean Division of ASCE, Los Angeles, CA, USA, 9–11 March 1977; pp. 269–284. [Google Scholar]
- Meyerhof, G.G. Bearing Capacity and Settlement of Pile Foundations. Found. J. Geotech. Engrg. Div. 1976, 102, 197–228. [Google Scholar] [CrossRef]
- Kosič, M.; Anžlin, A. Overflow Project Deliverable D4.2: Report on Vulnerability Assessment Methodology-Fragility Curves for Bridges Subjected to Flooding. 2022. Available online: https://projectoverflow.eu. (accessed on 3 August 2025).
- Kosič, M.; Anžlin, A.; Bau’, V. Flood Vulnerability Study of a Roadway Bridge Subjected to Hydrodynamic Actions, Local Scour and Wood Debris Accumulation. Water 2023, 15, 129. [Google Scholar] [CrossRef]
- Kosič, M.; Prendergast, L.J.; Anžlin, A. Analysis of the Response of a Roadway Bridge under Extreme Flooding-Related Events: Scour and Debris-Loading. Eng. Struct. 2023, 279, 115607. [Google Scholar] [CrossRef]
- Kosič, M.; Bačić, M.; Skokandić, D.; Kovačević, G.H.; Ivanković, A.M.; Anžlin, A. Rapid Flood Vulnerability Assessment of Bridge Networks: The CROSScade Project Case. In Proceedings of the 8th International Conference on Road and Rail Infrastructure (CETRA 2024), Cavtat, Croatia, 15–17 May 2024; pp. 1181–1187. [Google Scholar]
- AS-5100-2; Bridge Desing-Part 2: Design Loads. Standards Australia: Sydney, Australia, 2004.
- Panici, D.; de Almeida, G.A.M. Formation, Growth, and Failure of Debris Jams at Bridge Piers. Water Resour. Res. 2018, 54, 6226–6241. [Google Scholar] [CrossRef]
- Arneson, L.A.; Zevenbergen, L.W.; Lagasse, P.F.; Clopper, P.E. Evaluating Scour at Bridges. Hydraulic Engineering Circular No. 18 (HEC-18), 5th ed.; U.S. Department of Transportation, Federal Highway Administration (FHWA): Washington, DC, USA, 2012.
- Lagasse, P.F.; Zevenbergen, L.W.; Clopper, P.E. Impacts of Debris on Bridge Pier Scour. In Proceedings of the 5th International Conference on Scour and Erosion (ICSE-5), San Francisco, CA, USA, 7–10 November 2010; pp. 854–863. [Google Scholar]
- Stefanidou, S.P.; Kappos, A.J. Methodology for the Development of Bridge-Specific Fragility Curves. Earthq. Eng. Struct. Dyn. 2017, 46, 73–93. [Google Scholar] [CrossRef]


Disclaimer/Publisher’s Note: The statements, opinions and data contained in all publications are solely those of the individual author(s) and contributor(s) and not of MDPI and/or the editor(s). MDPI and/or the editor(s) disclaim responsibility for any injury to people or property resulting from any ideas, methods, instructions or products referred to in the content. |
© 2025 by the authors. Licensee MDPI, Basel, Switzerland. This article is an open access article distributed under the terms and conditions of the Creative Commons Attribution (CC BY) license (https://creativecommons.org/licenses/by/4.0/).