
Additive Manufacturing, Numerical and Experimental Analyses for Pentamode Metamaterials

 ,
,  , and
, and
Abstract
:1. Introduction
2. Materials and Methods
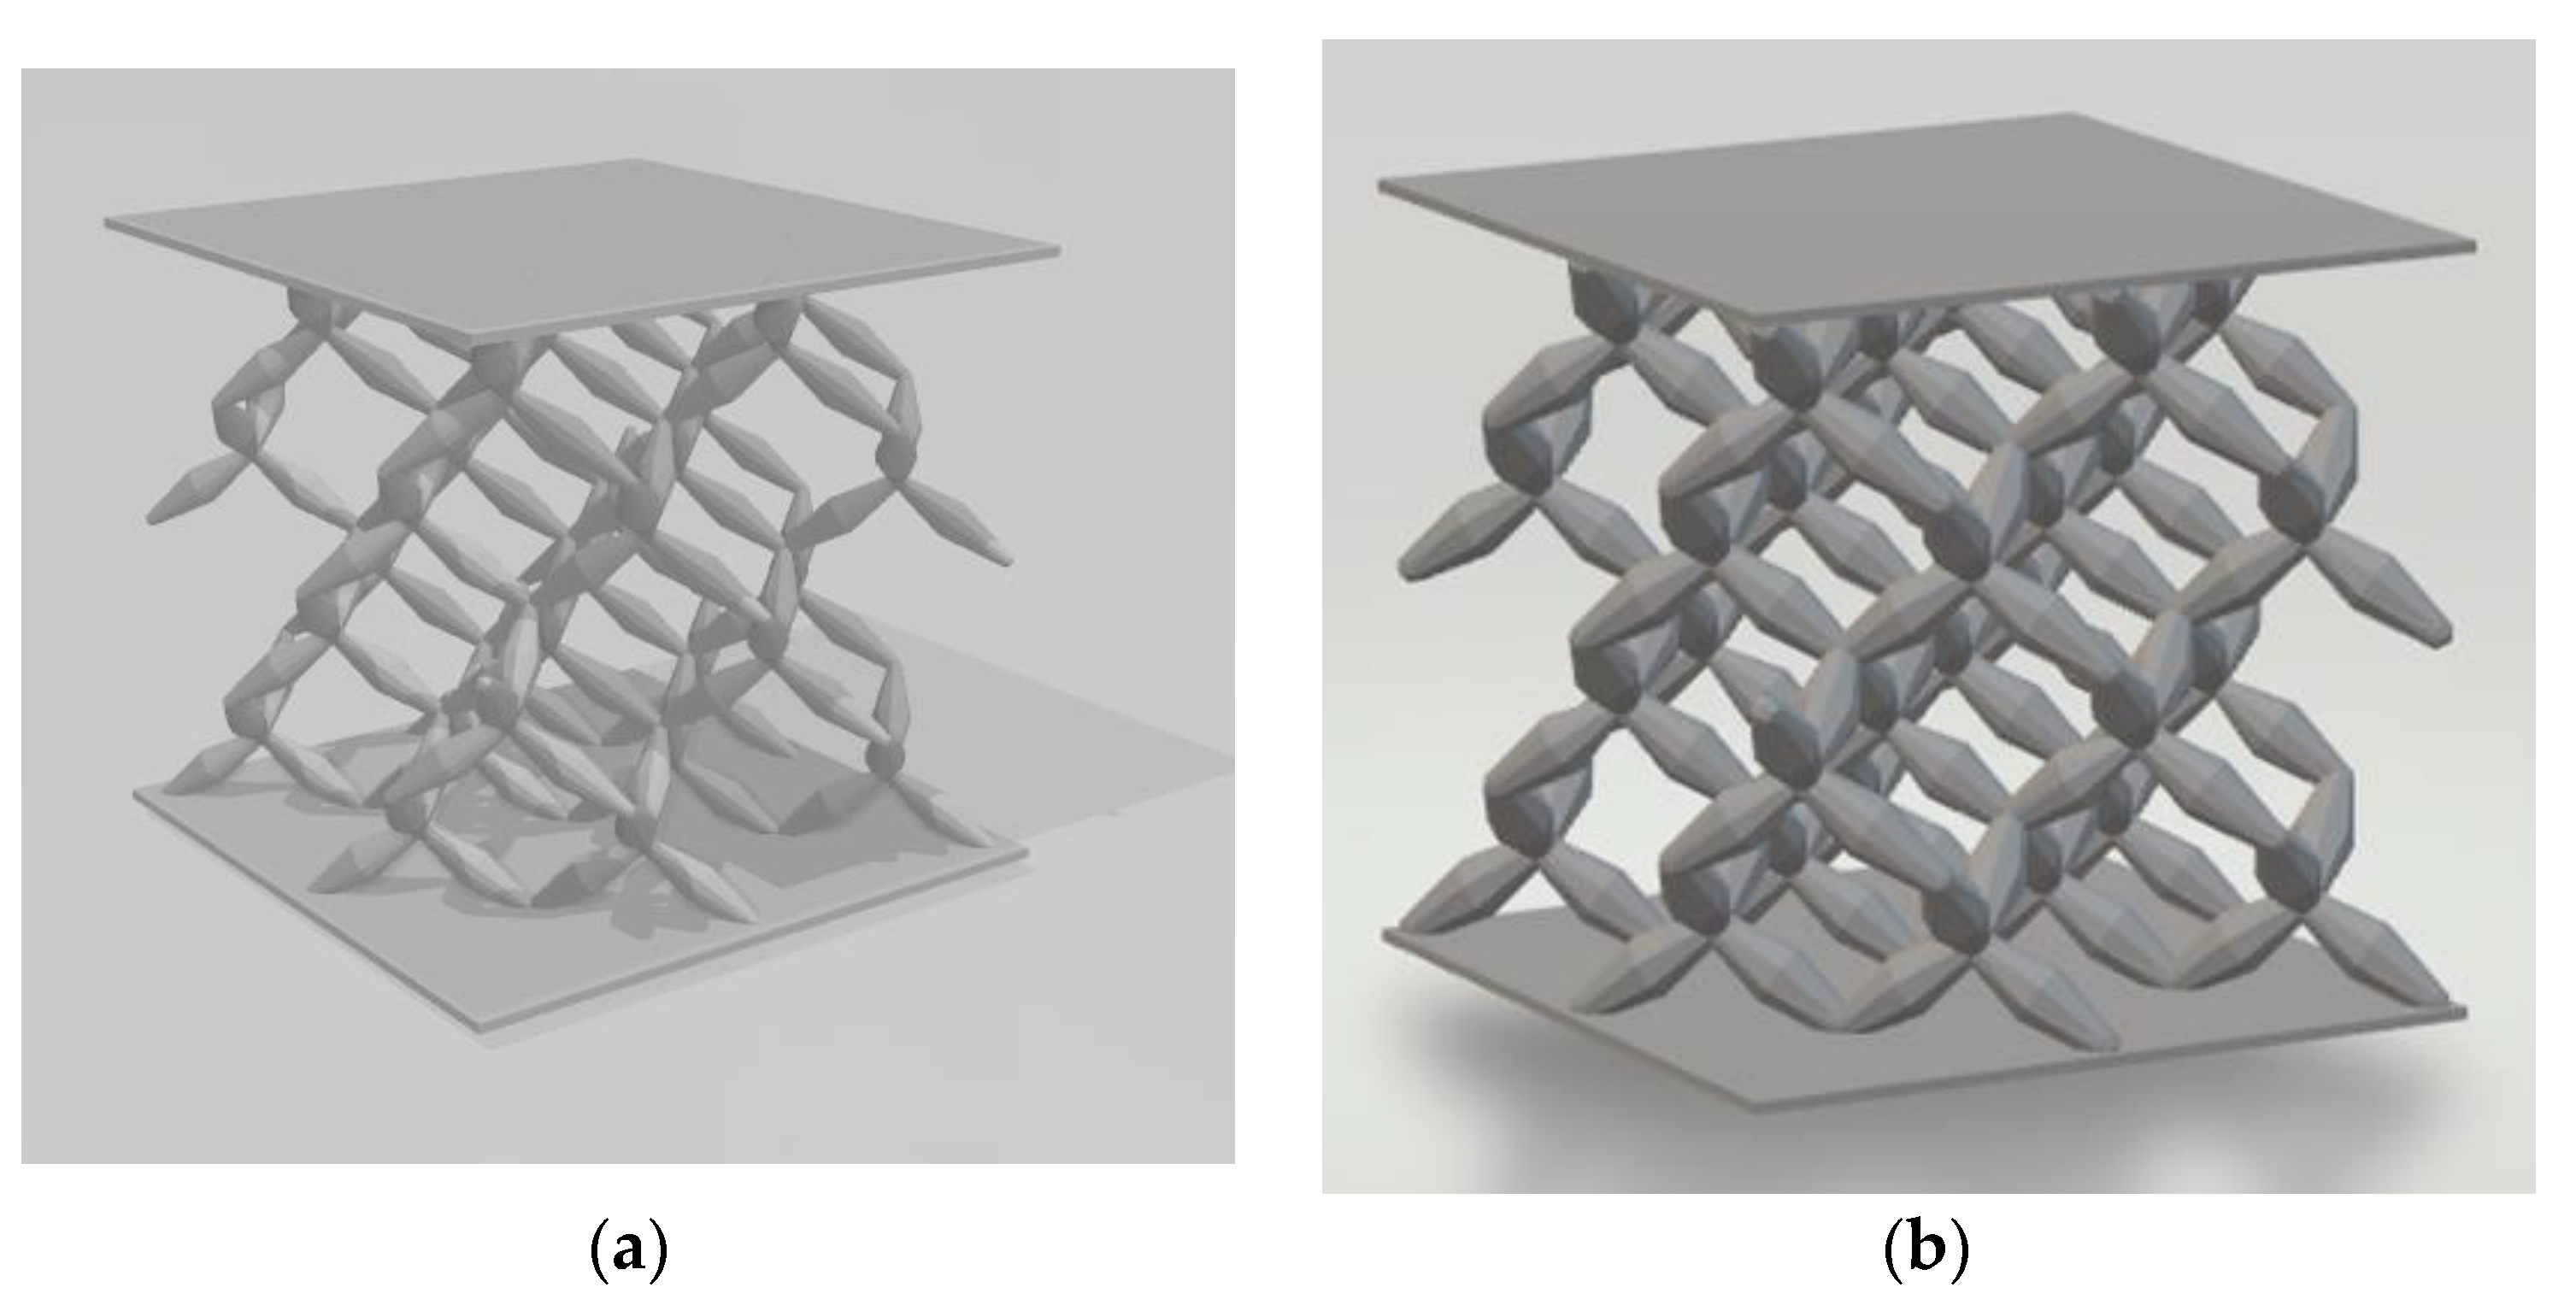
2.1. Pentamodes Structures
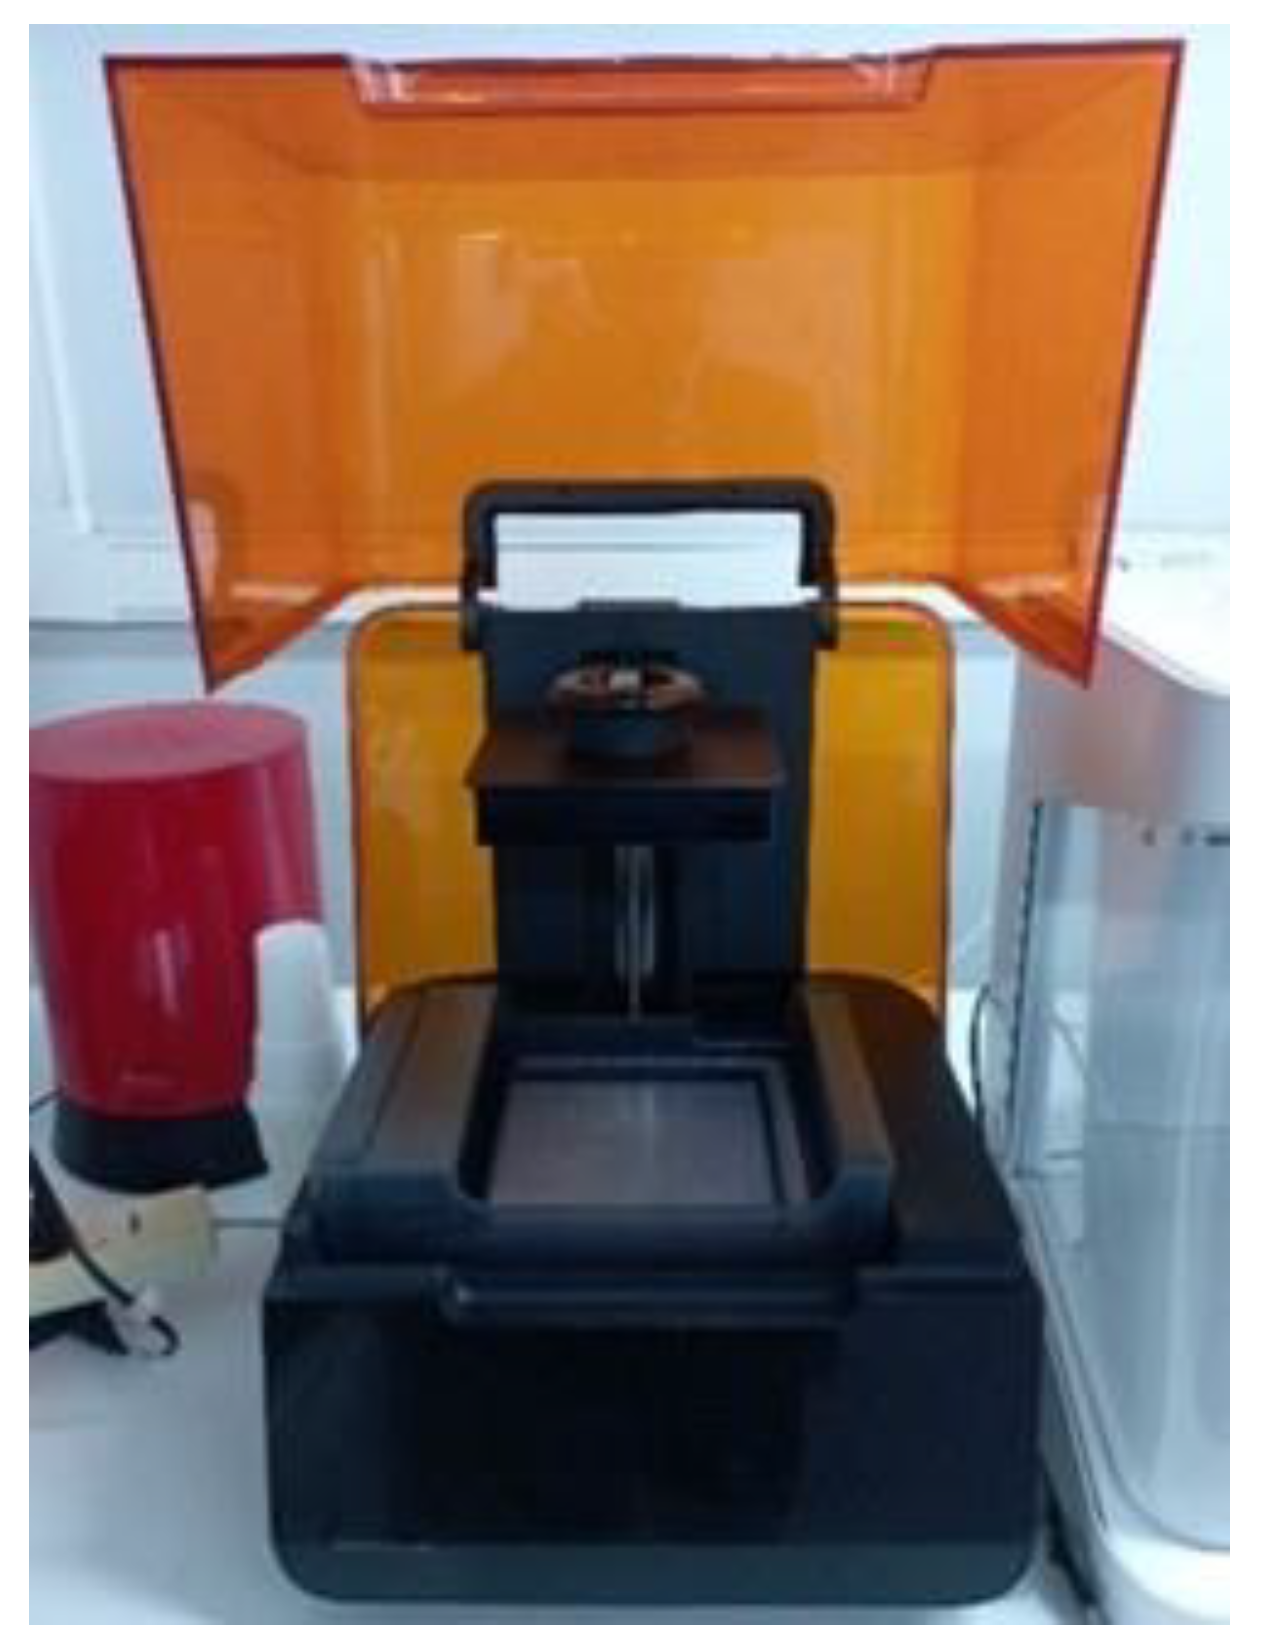
2.2. Fabrication Process
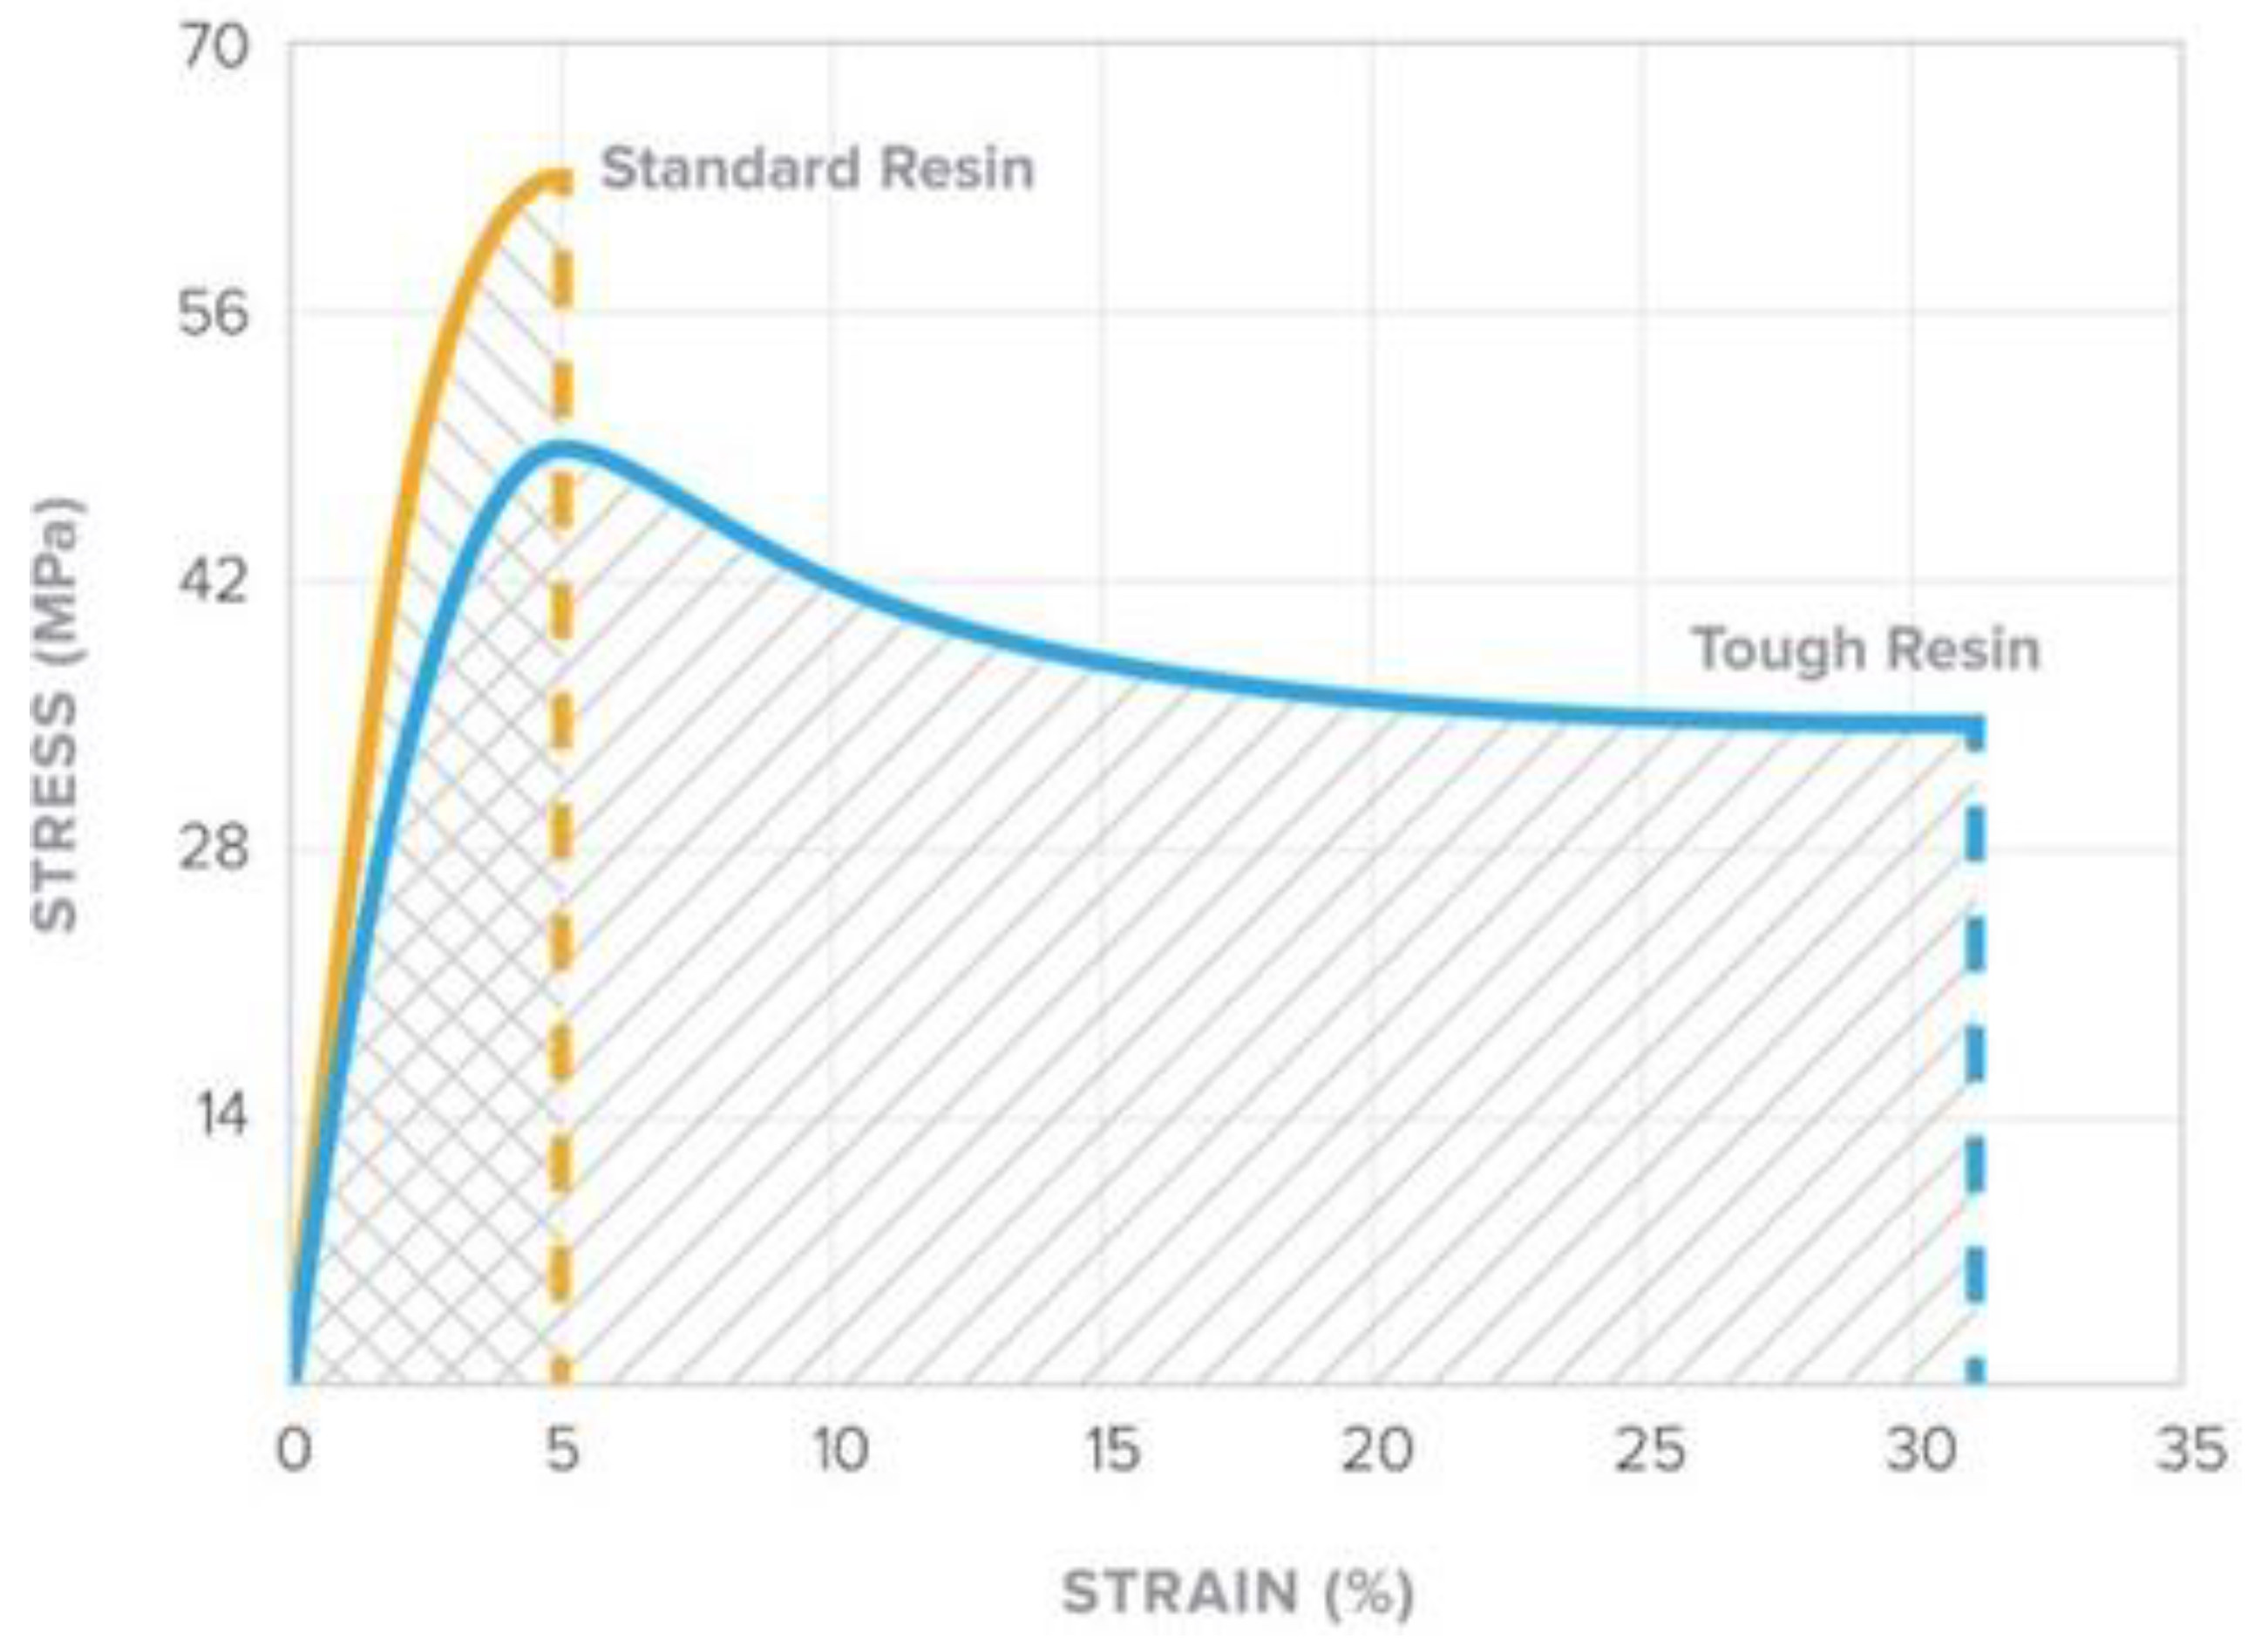
2.3. Material
2.4. Experimental Setup
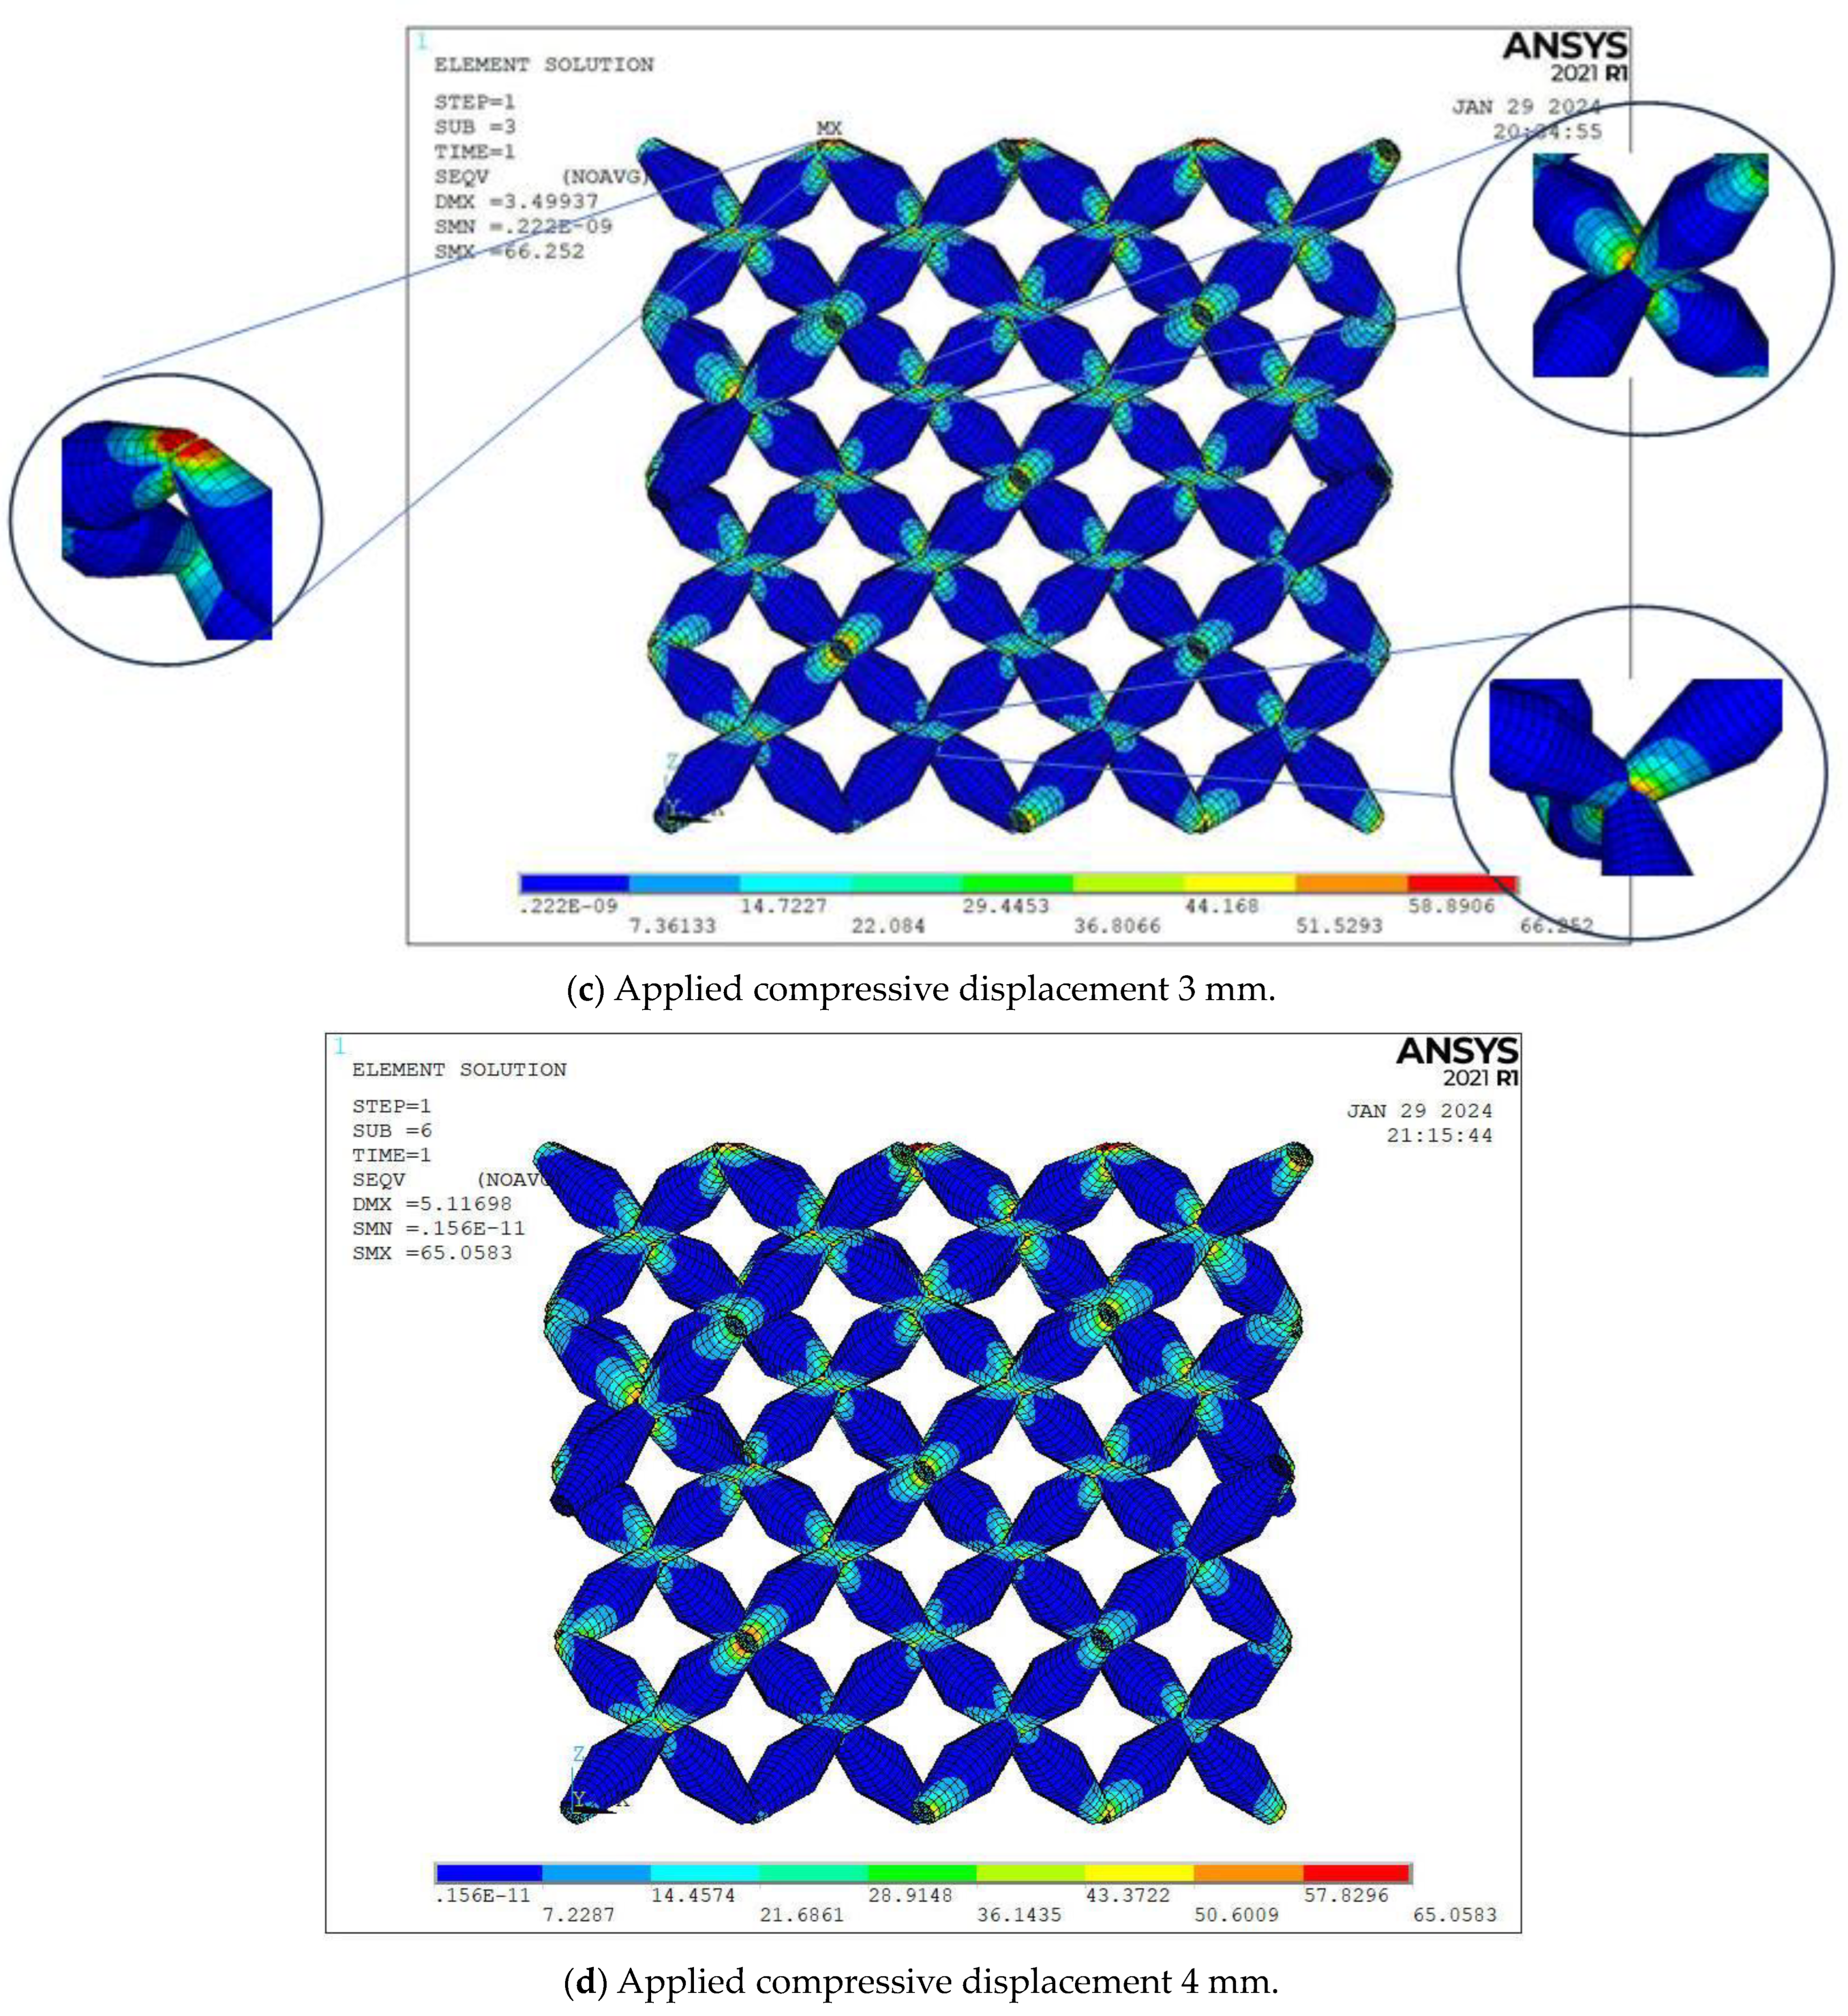
2.5. Computational Analysis
3. Results
4. Discussion
5. Conclusions
Author Contributions
Funding
Data Availability Statement
Conflicts of Interest
References
- Surjadi, J.U.; Gao, L.; Du, H.; Li, X.; Xiong, X.; Fang, N.X.; Lu, Y. Mechanical Metamaterials and Their Engineering Applications. Adv. Eng. Mater. 2019, 21, 1800864. [Google Scholar] [CrossRef]
- Barchiesi, E.; Spagnuolo, M.; Placidi, L. Mechanical metamaterials: A state of the art. Math. Mech. Solids 2019, 24, 212–234. [Google Scholar] [CrossRef]
- Christensen, R.M. Mechanics of Composite Materials. In Proceedings of the 29. National SAMPE Symposium, Reno, NV, USA, 3 April 1984; pp. 994–1006. [Google Scholar] [CrossRef]
- Milton, G.W.; Cherkaev, A.V. Which elasticity tensors are realizable? J. Eng. Mater. Technol. Trans. ASME 1995, 117, 483–493. [Google Scholar] [CrossRef]
- Amendola, A.; Smith, C.J.; Goodall, R.; Auricchio, F.; Feo, L.; Benzoni, G.; Fraternali, F. Experimental response of additively manufactured metallic pentamode materials confined between stiffening plates. Compos. Struct. 2016, 142, 254–262. [Google Scholar] [CrossRef]
- Fabbrocino, F.; Amendola, A.; Benzoni, G.; Fraternali, F. Seismic application of pentamode lattices. Ing. Sismica 2016, 33, 62–70. [Google Scholar]
- Fabbrocino, F.; Amendola, A. Discrete-to-continuum approaches to the mechanics of pentamode bearings. Compos. Struct. 2017, 167, 219–226. [Google Scholar] [CrossRef]
- Kadic, M.; Bückmann, T.; Stenger, N.; Thiel, M.; Wegener, M. On the practicability of pentamode mechanical metamaterials. Appl. Phys. Lett. 2012, 100, 191901. [Google Scholar] [CrossRef]
- Jia, Z.; Yu, Y.; Hou, S.; Wang, L. Biomimetic architected materials with improved dynamic performance. J. Mech. Phys. Solids 2019, 125, 178–197. [Google Scholar] [CrossRef]
- Wang, P.; Yang, F.; Li, P.; Zhang, W.; Lu, G.; Fan, H. Bio-inspired vertex modified lattice with enhanced mechanical properties. Int. J. Mech. Sci. 2023, 244, 108081. [Google Scholar] [CrossRef]
- Vyavahare, S.; Mahesh, V.; Mahesh, V.; Harursampath, D. Additively manufactured meta-biomaterials: A state-of-the-art review. Compos. Struct. 2023, 305, 116491. [Google Scholar] [CrossRef]
- Zheng, X.; Lee, H.; Weisgraber, T.H.; Shusteff, M.; DeOtte, J.; Duoss, E.B.; Kuntz, J.D.; Biener, M.M.; Ge, Q.; Jackson, J.A.; et al. Ultralight, ultrastiff mechanical metamaterials. Science 2014, 344, 1373–1377. [Google Scholar] [CrossRef]
- Needleman, A. Computational mechanics. Appl. Mech. Rev. 1985, 38, 1282–1283. [Google Scholar] [CrossRef]
- Gurtner, G.; Durand, M. Stiffest elastic networks. Proc. R. Soc. A Math. Phys. Eng. Sci. 2014, 470, 20130611. [Google Scholar] [CrossRef]
- Wang, G.; Jin, L.; Zhang, L.; Xu, Z. Phonon band structures of the three dimensional latticed pentamode metamaterials. AIP Adv. 2017, 7, 025309. [Google Scholar] [CrossRef]
- Sapountzakis, E.J.; Syrimi, P.G.; Pantazis, I.A.; Antoniadis, I.A. KDamper concept in seismic isolation of bridges with flexible piers. Eng. Struct. 2017, 153, 525–539. [Google Scholar] [CrossRef]
- Liu, K.; Wu, J.; Paulino, G.H.; Qi, H.J. Programmable Deployment of Tensegrity Structures by Stimulus-Responsive Polymers. Sci. Rep. 2017, 7, 3511. [Google Scholar] [CrossRef]
- Sapountzaki, O.E.; Kampitsis, A.E.; Lagaros, N.D. Modelling of Inelastic Pentamode-Based Bridge Bearings Using Beam Elements. J. Civ. Eng. Constr. 2023, 12, 126–141. [Google Scholar] [CrossRef]
- Craster, R.; Guenneau, S.; Kadic, M.; Wegener, M. Mechanical metamaterials. Rep. Prog. Phys. 2023, 86, 094501. [Google Scholar] [CrossRef]
- Lymperopoulos, P.N.; Theotokoglou, E.E.; Antoniadis, I.A. Computational analysis of metamaterials—An initial study. Procedia Struct. Integr. 2020, 25, 172–179. [Google Scholar] [CrossRef]
- Lymperopoulos, P.N.; Theotokoglou, E.E. Computational analysis of pentamode metamaterials for antiseismic design. Procedia Struct. Integr. 2020, 26, 263–268. [Google Scholar] [CrossRef]
- Lymperopoulos, P.N.; Theotokoglou, E.E. Numerical Investigation of Pentamode Mechanical Metamaterials. Wseas Trans. Appl. Theor. Mech. 2022, 17, 47–55. [Google Scholar] [CrossRef]
- Guo, D.; Jiang, S.; Zhou, Y.; Zhang, L.; Li, K.; Song, B.; Huang, Y. Ultrahigh compression-shear ratio of sandwich pentamode metamaterials. Compos. Struct. 2023, 322, 117331. [Google Scholar] [CrossRef]
- Zhang, Z. A review on additive manufacturing of wave controlling metamaterial. Int. J. Adv. Manuf. Technol. 2022, 124, 647–680. [Google Scholar] [CrossRef]
- Schittny, R.; Bückmann, T.; Kadic, M.; Wegener, M. Elastic measurements on macroscopic three-dimensional pentamode metamaterials. Appl. Phys. Lett. 2013, 103, 231905. [Google Scholar] [CrossRef]
- Zadpoor, A.A. Mechanical performance of additively manufactured meta-biomaterials. Acta Biomater. 2019, 85, 41–59. [Google Scholar] [CrossRef]
- Janbaz, S.; Bobbert, F.S.L.; Mirzaali, M.J.; Zadpoor, A.A. Ultra-programmable buckling-driven soft cellular mechanisms. Mater. Horiz. 2019, 6, 1138–1147. [Google Scholar] [CrossRef]
- Hedayati, R.; Amin Yavari, S.; Zadpoor, A.A. Fatigue crack propagation in additively manufactured porous biomaterials. Mater. Sci. Eng. C 2017, 76, 457–463. [Google Scholar] [CrossRef]
- Hu, Z.; Wei, Z.; Wang, K.; Chen, Y.; Zhu, R.; Huang, G.; Hu, G. Engineering zero modes in transformable mechanical metamaterials. Nat. Commun. 2023, 14, 1266. [Google Scholar] [CrossRef]
- Türk, D.A.; Brenni, F.; Zogg, M.; Meboldt, M. Mechanical characterization of 3D printed polymers for fiber reinforced polymers processing. Mater. Des. 2017, 118, 256–265. [Google Scholar] [CrossRef]
- Wu, S.; Luo, Z.; Li, Z.; Liu, S.; Zhang, L.C. Topological design of pentamode metamaterials with additive manufacturing. Comput. Methods Appl. Mech. Eng. 2021, 377, 113708. [Google Scholar] [CrossRef]
- Kladovasilakis, N.; Tsongas, K.; Karalekas, D.; Tzetzis, D. Architected Materials for Additive Manufacturing: A Comprehensive Review. Materials 2022, 15, 5919. [Google Scholar] [CrossRef] [PubMed]
- Hu, K.; Zhang, L.; Zhang, Y.; Song, B.; Wen, S.; Liu, Q.; Shi, Y. Electrochemical Corrosion Behavior and Mechanical Response of Selective Laser Melted Porous Metallic Biomaterials. Acta Metall. Sin. Engl. Lett. 2023, 36, 1235–1246. [Google Scholar] [CrossRef]
- Fraternali, F.; Amendola, A. Mechanical modeling of innovative metamaterials alternating pentamode lattices and confinement plates. J. Mech. Phys. Solids 2017, 99, 259–271. [Google Scholar] [CrossRef]
- Dallagoa, M.; Raghavendraa, S.; Luchinb, V.; Zappinib, G.; Pasinic, D.; Benedettia, M. The role of node fillet, unit-cell size and strut orientation on the fatigue strength of Ti-6Al-4V lattice materials additively manufactured via laser powder bed fusion. Int. J. Fatigue 2021, 142, 105946. [Google Scholar] [CrossRef]
- Ghannadpour, S.A.M.; Mahmoudi, M.; Nedjad, K.H. Structural behavior of 3D-printed sandwich beams with strut-based lattice core: Experimental and numerical study. Compos. Struct. 2022, 281, 115113. [Google Scholar] [CrossRef]
- Mahmoudi, M.; Ghannadpour, S.A.M.; Nedjad, K.H. Functionally graded multi-morphology lattice structures as an optimized sandwich core via digital light processing additive manufacturing. Mater. Des. 2024, 238, 112710. [Google Scholar] [CrossRef]
- Iandiorio, C.; Mattei, G.; Marotta, E.; Costanza, G.; Tata, M.E.; Salvini, P. The Beneficial Effect of a TPMS-Based Fillet Shape on the Mechanical Strength of Metal Cubic Lattice Structures. Materials 2024, 17, 1553. [Google Scholar] [CrossRef]
- FormLabs. Standard Materials for High-Resolution Rapid Prototyping; FormLabs: Somerville, MA, USA, 2017; pp. 1–3. [Google Scholar]
- PTC. Creo Parametric 9 Student Edition, PTC CREO; PTC: Boston, MA, USA, 2022. [Google Scholar]
- ANSYS. ANSYS Mechanical User’ s Guide; Release 19.0; Ansys Inc.: Canonsburg, PA, USA, 2021. [Google Scholar]


| Pentamode Batch | D [mm] | d [mm] | α [mm] |
|---|---|---|---|
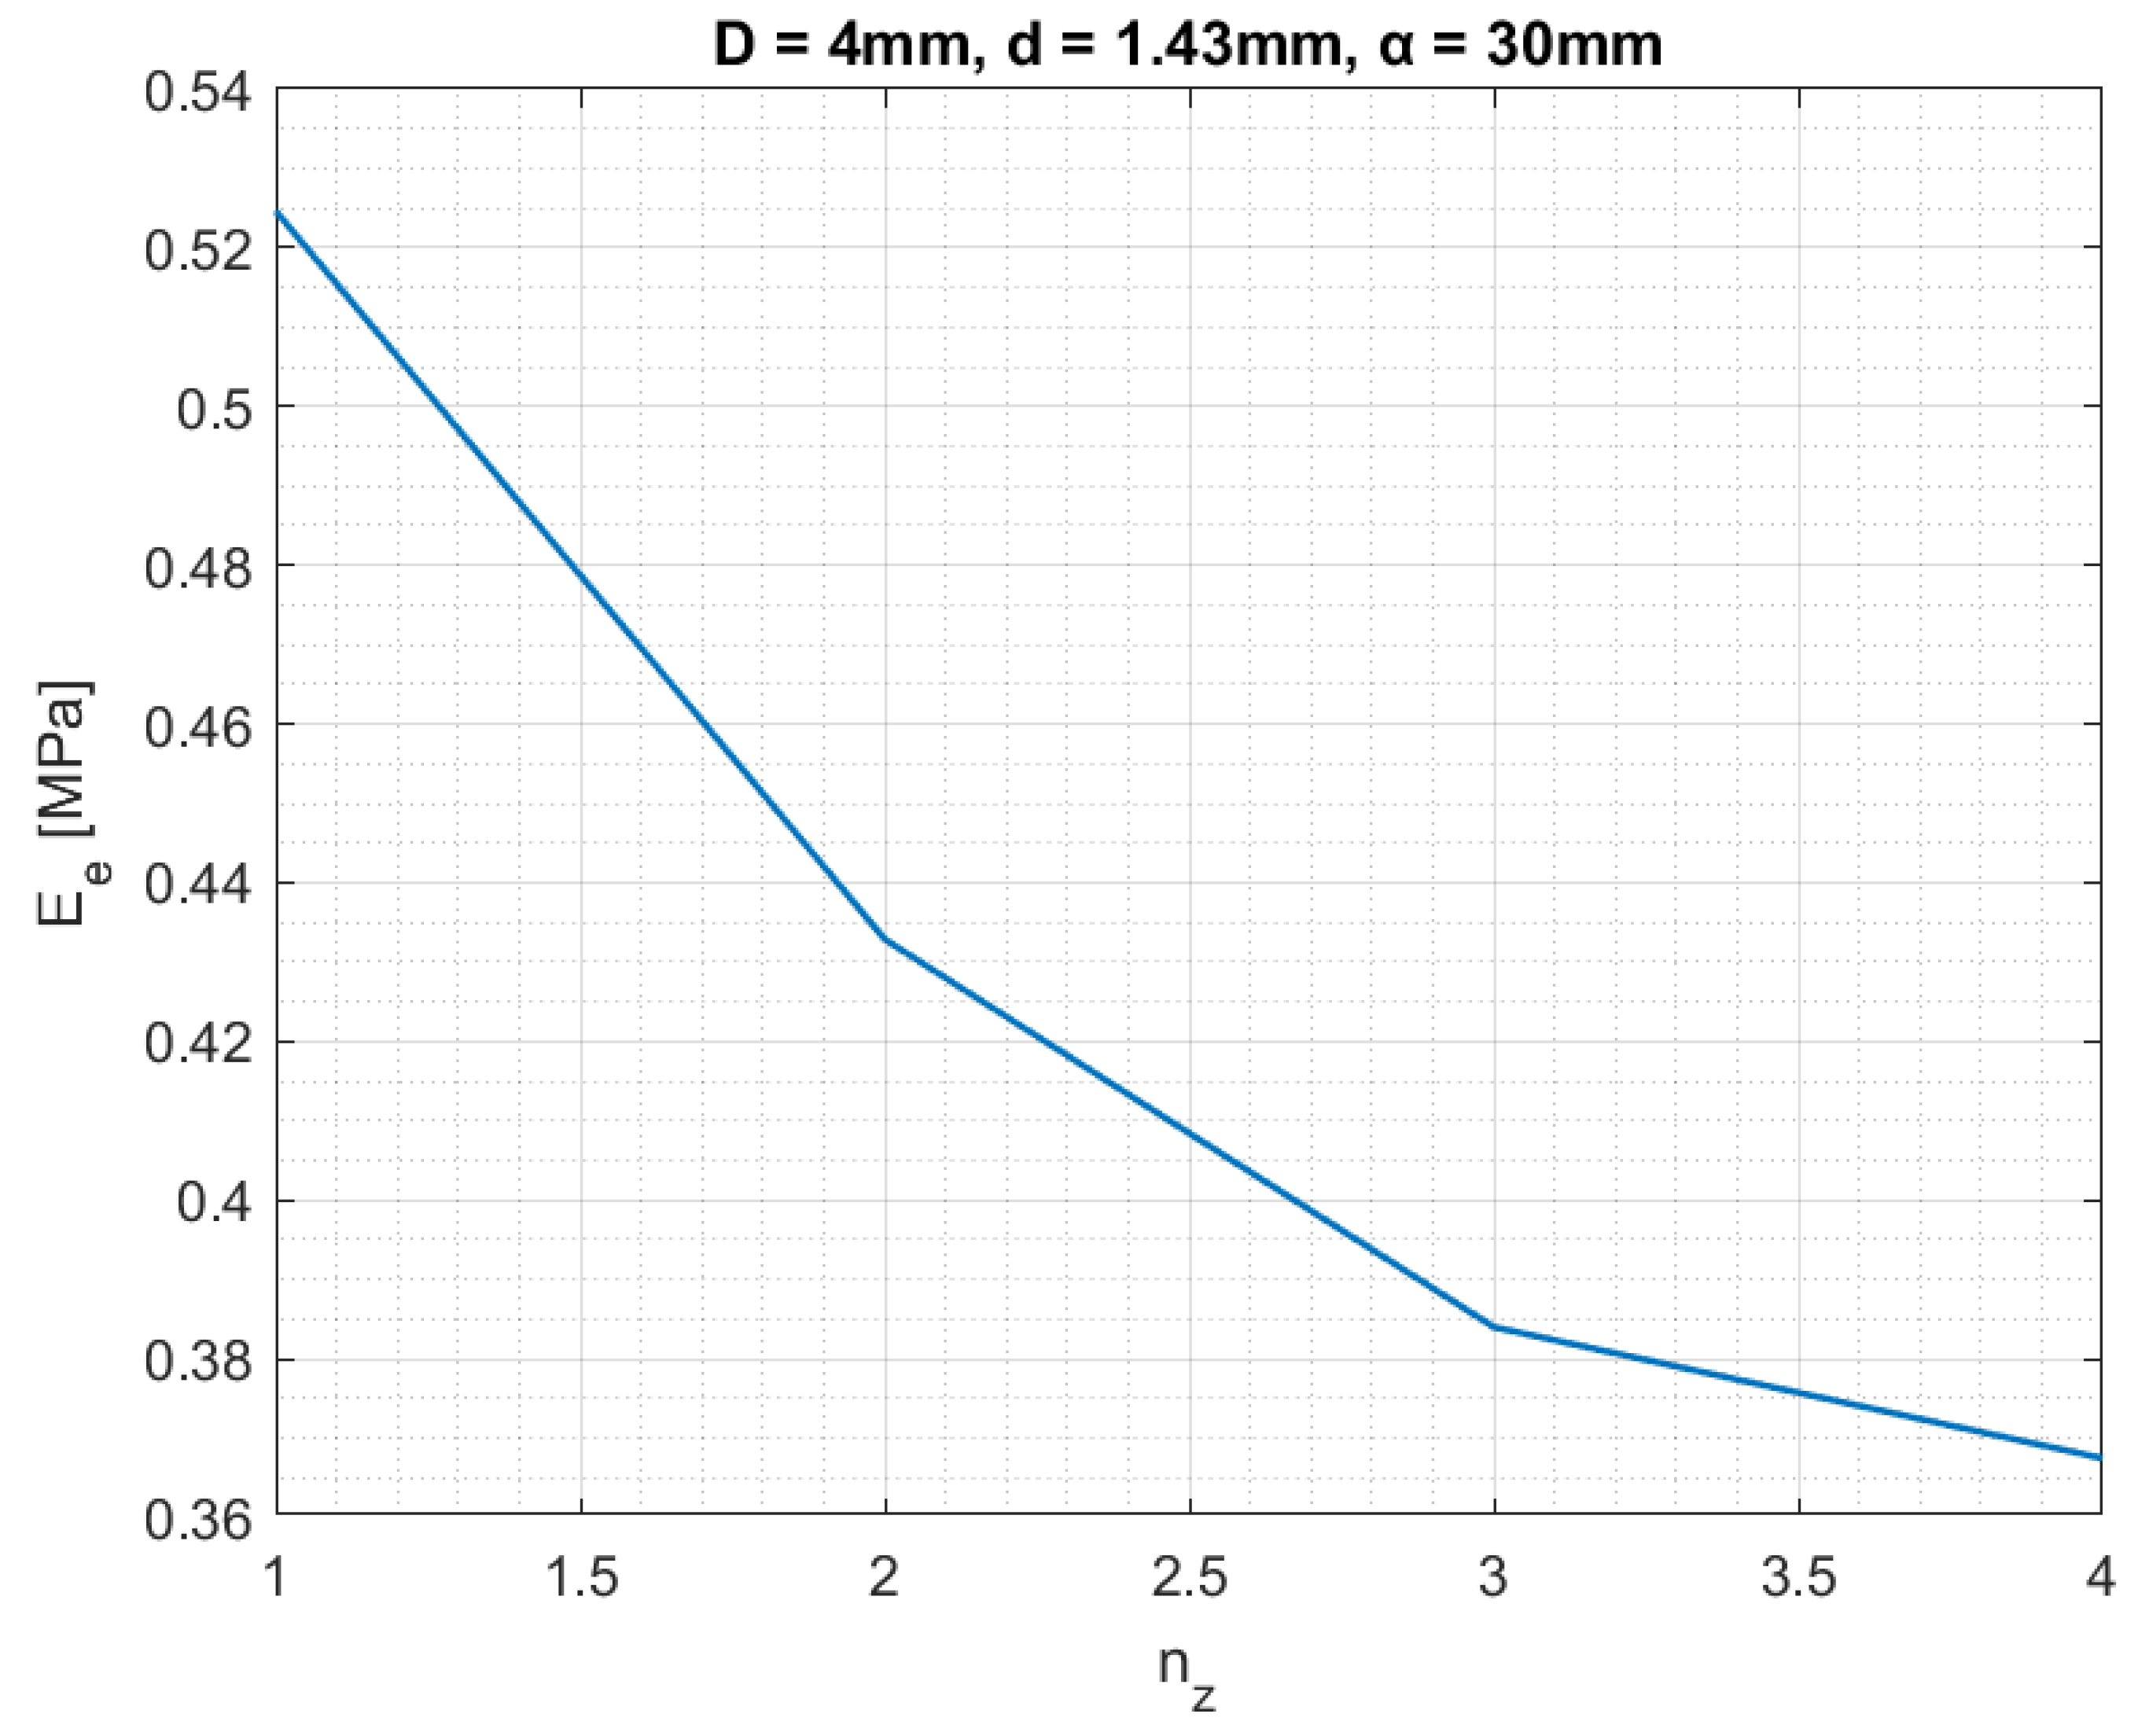
| Batch 1 | 4 | 1.43 | 30 |
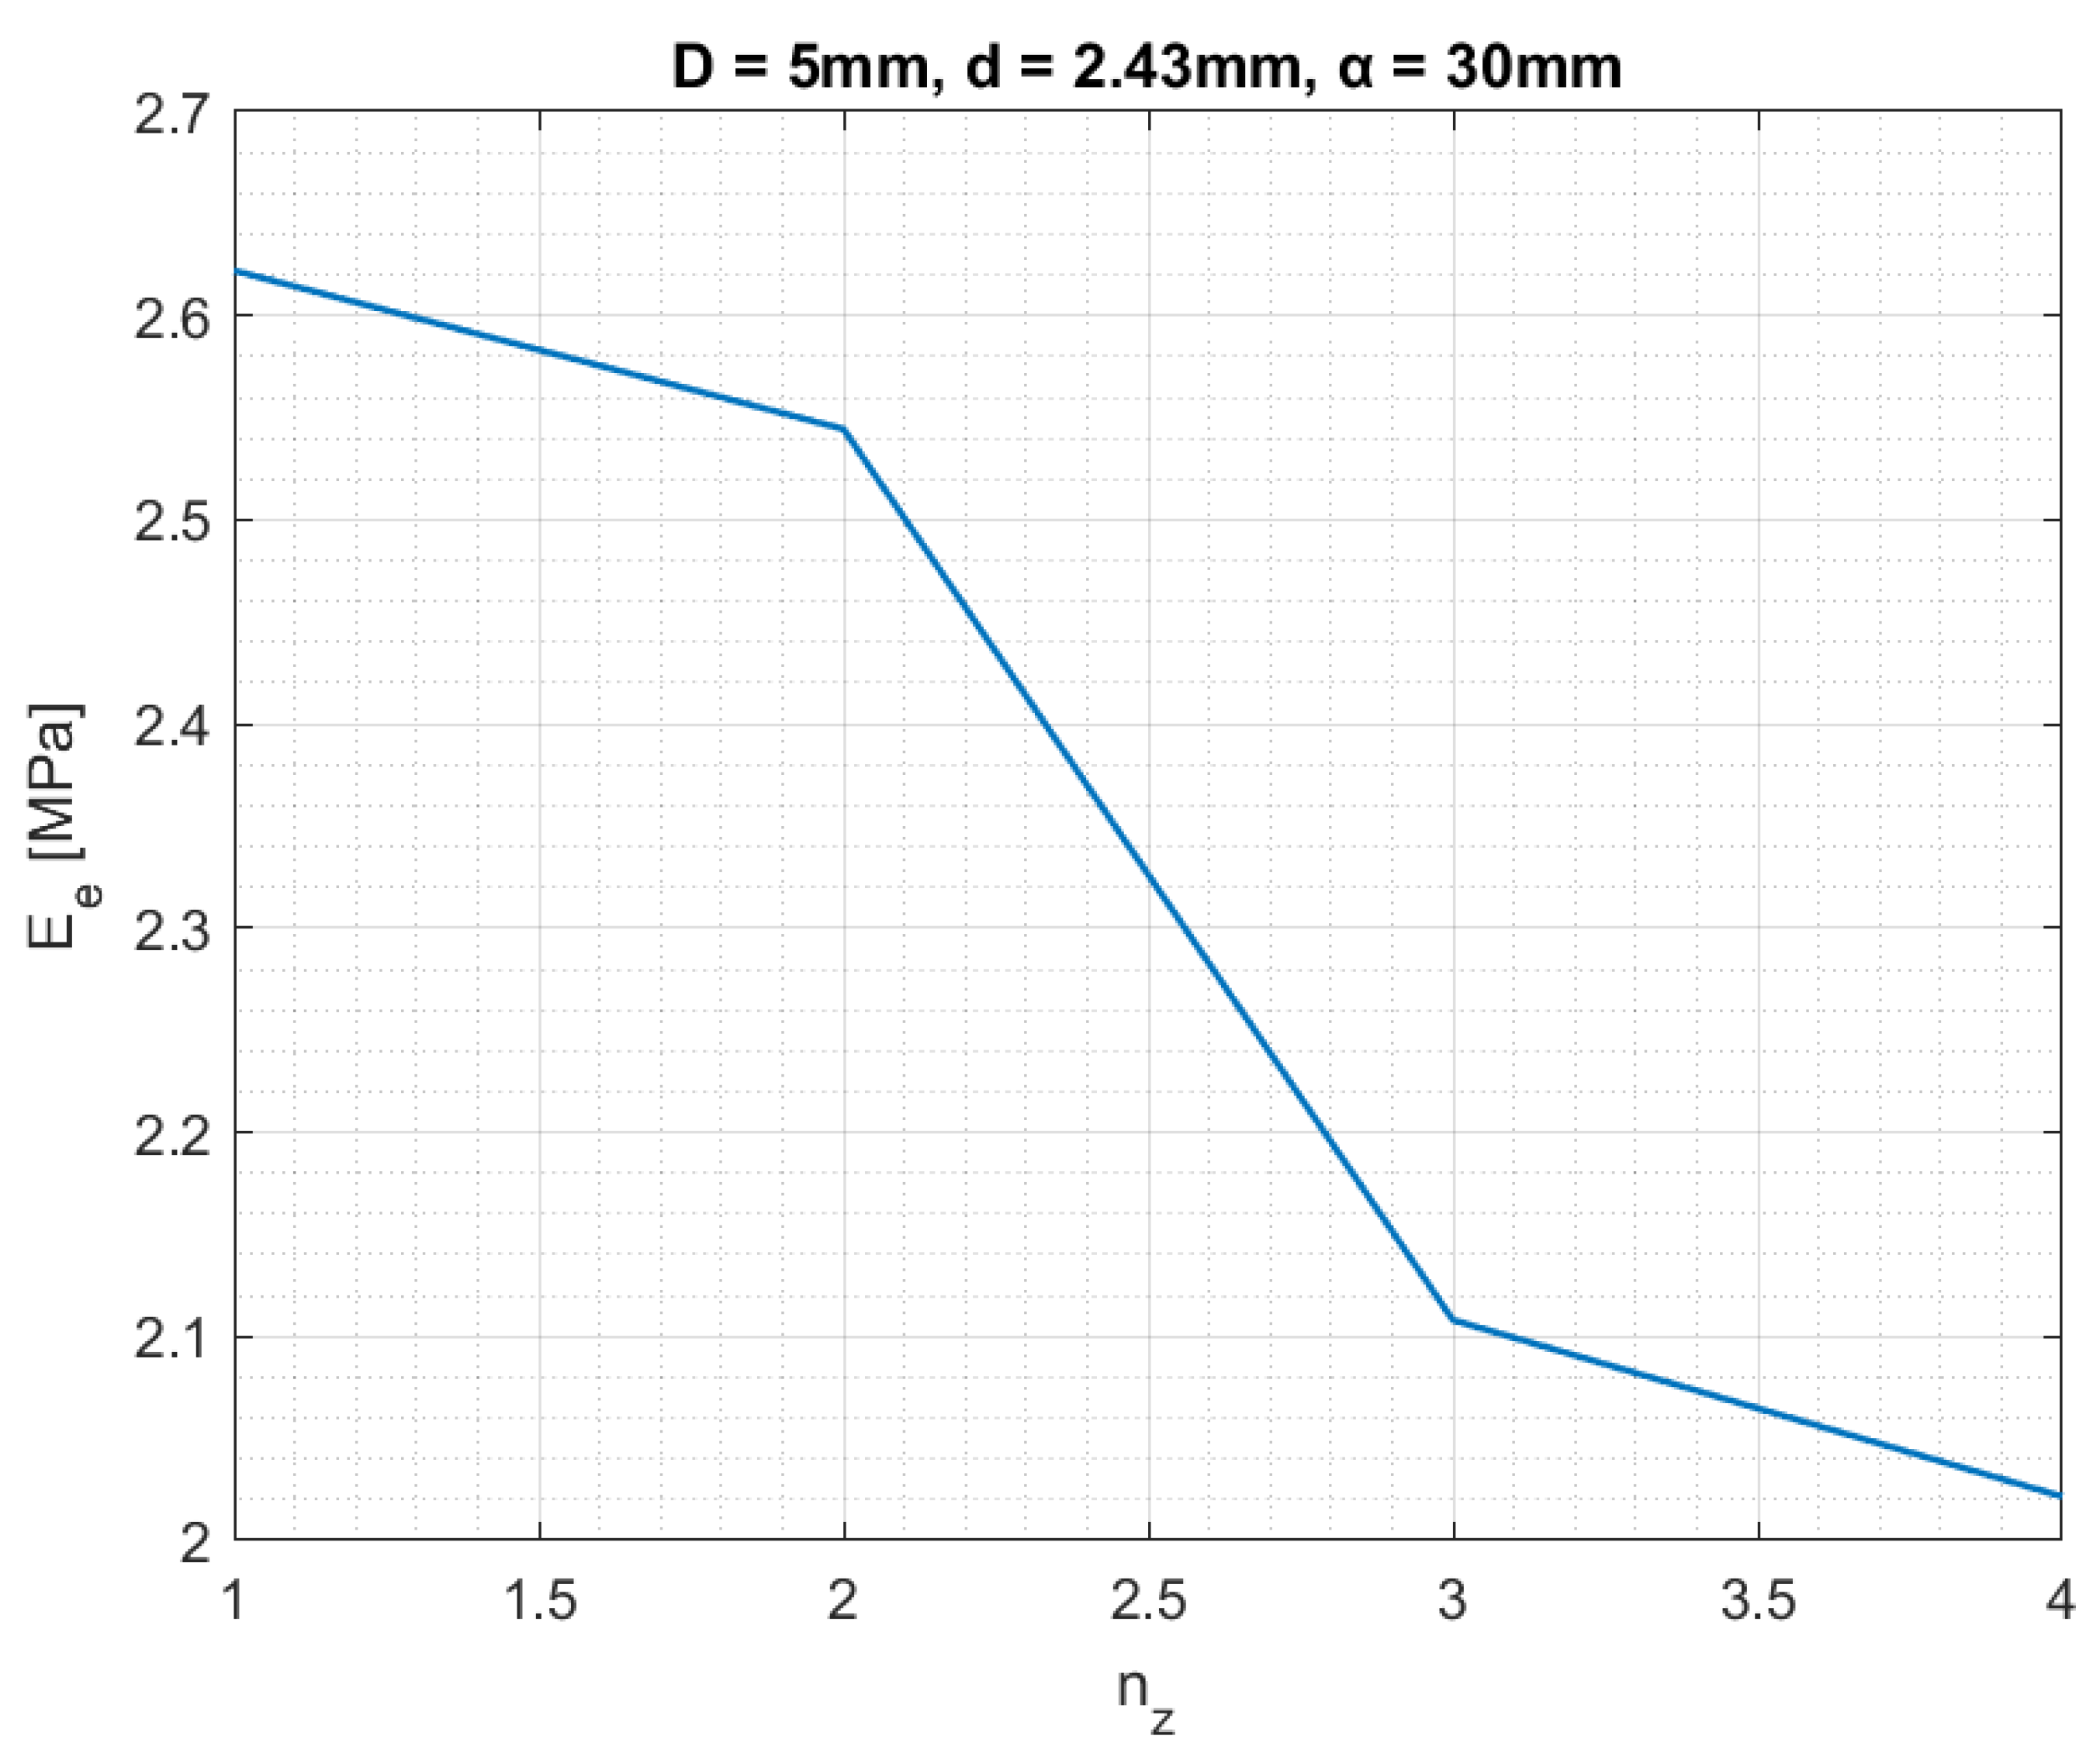
| Batch 2 | 5 | 2.4 | 30 |
| Ultimate Tensile Strength [MPa] | 65 |
| Tensile Modulus [GPa] | 2.8 |
| Elongation at Failure [%] | 6.2 |
| Diameter [mm] | Effective Young Modulus [MPa] |
|---|---|
| d = 1.43 | 0.4394 |
| d = 1.6 | 0.6057 |
| d = 1.8 | 0.8457 |
| d = 2.0 | 1.1365 |
| d = 2.2 | 1.4805 |
| d = 2.4 | 1.8796 |
| Displacement [mm] | Maximum Von Mises Stresses [MPa] |
|---|---|
| 1 | 44.686 |
| 2 | 68.3849 |
| 3 | 66.2494 |
| 4 | 67.9183 |
| Displacement [mm] | Maximum Von Mises Stresses [MPa] |
|---|---|
| 1 | 57.7105 |
| 2 | 65.6284 |
| 3 | 66.2525 |
| 4 | 65.0583 |
Disclaimer/Publisher’s Note: The statements, opinions and data contained in all publications are solely those of the individual author(s) and contributor(s) and not of MDPI and/or the editor(s). MDPI and/or the editor(s) disclaim responsibility for any injury to people or property resulting from any ideas, methods, instructions or products referred to in the content. |
© 2024 by the authors. Licensee MDPI, Basel, Switzerland. This article is an open access article distributed under the terms and conditions of the Creative Commons Attribution (CC BY) license (https://creativecommons.org/licenses/by/4.0/).
Share and Cite
Lymperopoulos, P.N.; Theotokoglou, E.E.; Dragatogiannis, D.; Karalekas, D.; Matsika-Klossa, C. Additive Manufacturing, Numerical and Experimental Analyses for Pentamode Metamaterials. Infrastructures 2024, 9, 172. https://doi.org/10.3390/infrastructures9100172
Lymperopoulos PN, Theotokoglou EE, Dragatogiannis D, Karalekas D, Matsika-Klossa C. Additive Manufacturing, Numerical and Experimental Analyses for Pentamode Metamaterials. Infrastructures. 2024; 9(10):172. https://doi.org/10.3390/infrastructures9100172
Chicago/Turabian StyleLymperopoulos, Panagiotis N., Efstathios E. Theotokoglou, Dimitrios Dragatogiannis, Dimitrios Karalekas, and Constantina Matsika-Klossa. 2024. "Additive Manufacturing, Numerical and Experimental Analyses for Pentamode Metamaterials" Infrastructures 9, no. 10: 172. https://doi.org/10.3390/infrastructures9100172