Article

Basic Study on the Proposal of New Measures to Improve the Ductility of RC Bridge Pier and Their Effectiveness

1
Department of Civil Engineering, Kyushu University, Fukuoka 819-0395, Japan
2
Nippon Koei Co., Ltd., Tokyo 102-8539, Japan
*
Author to whom correspondence should be addressed.
Infrastructures 2024, 9(11), 197; https://doi.org/10.3390/infrastructures9110197
Submission received: 26 September 2024 / Revised: 25 October 2024 / Accepted: 29 October 2024 / Published: 1 November 2024
(This article belongs to the Section Infrastructures and Structural Engineering)

Abstract

:
To enhance the seismic performance of reinforced concrete (RC) elements, it is essential to consider both strength and ductility post-yielding. This study proposed a novel method to improve the ductility of RC piers by using preformed inward-bending longitudinal reinforcements at the plastic hinges. Two full-scale model tests of standard and ductility-enhanced (DE) RC piers and numerical simulations were conducted. The lateral reversed cyclic loading experiments were conducted to assess the effectiveness of this new approach. The performance was evaluated regarding failure mode, plastic hinge distribution, hysteretic properties, normalized stiffness degradation, normalized energy dissipation capacity, bearing capacity, and ductility. Non-linear finite element method (FEM) analyses were also carried out to investigate the usefulness of the proposed method by DIANA, and simulation was validated against the experiment results by hysteretic curves, skeleton curves, failure mode crack pattern, ductility coefficient, and bearing capacity. The results indicated that the proposed method enhanced bearing capacity, resistance to stiffness degradation, energy dissipation capacity, and ductility. Additionally, it was observed that the preformed positions and curvature of the main steel bars influenced the plastic hinge location and the buckling of longitudinal reinforcements. FEM analysis revealed that it might be reasonable to deduce the other factors that influenced the ductility of the specimens by using the same material parameters and models.

1. Introduction

Seismic events inevitably exert a significant impact on reinforced concrete (RC) structures, particularly in the context of potential increases in earthquake frequency and intensity in the future. The deterioration of RC structures—mainly due to fatigue, corrosion, and environmental factors—has significantly influenced their seismic performance. Moreover, climate change is expected to exacerbate these issues, as the frequency of extreme weather events, increased humidity, and prolonged rainfall periods will accelerate rebar corrosion and concrete carbonation, further diminishing the seismic resilience of RC structures [1]. Given the increasing frequency and severity of such events, there is a growing demand for effective seismic strengthening measures.
RC piers play a crucial role in the seismic performance of viaduct structures. The collapse of viaduct structures during earthquakes is often a result of pier failure. While the damage to the pier is generally caused by various factors, the lack of ductility of piers is considered one of the most critical factors [2]. Ductility refers to the capacity of structures to withstand multiple cycles of loading without significant strength degradation. This characteristic is essential for RC piers to prevent sudden and catastrophic failure and provide early warning of potential collapse [3,4,5,6,7,8]. The stable ability of the column required to resist severe earthquake mainly depends on large inelastic deformations in the plastic hinge. However, as shown in Figure 1, the failure of column in the plastic hinge zone often occurs caused by the brittleness and cracking of concrete, the yielding and buckling of the main reinforcing bars, and the crushing of concrete. Therefore, it is crucial to enhance the ductile deformation capacity of piers to ensure piers can withstand severe ground motion.
Attributed to extensive experimental and analytical research over the past several decades, numerous techniques for enhancing the ductility of RC pier have been established. The ductility of RC piers indirectly depends on the amount and configuration of transverse, which confines the core concrete and provides resistance against buckling of longitudinal reinforcements. It is widely accepted that confinement in the form of transverse closed hoops or ties and axial compression are most used to enhance the ductility of piers [9,10]. However, under major earthquakes and high axial compression, the critical location of the piers, such as plastic hinges, may be needed to increase the amount of transverse reinforcement to enhance ductility. Consequently, the regions can be heavily congested, and it is difficult to arrange the required amount of transverse reinforcement [11].
In response to this challenge, researchers have explored alternative materials and techniques to improve ductility. For instance, Kim et al. [12]. introduces a velcro seismic reinforcement system (VSRS) that enhances ductility by utilizing a combination of velcro and urethane filler, which effectively dissipates energy under seismic loading. Another widely method is the use of steel jackets, which encase the RC pier in a steel shell, providing additional confinement and improving structural ductility under seismic loads [13,14,15,16,17]. Zhang et al. [13] conducted experimental investigations into the use of steel jackets combined with prestressed steel hoops to reinforce RC piers. Their study demonstrated that the method effectively increased axial load-bearing capacity while providing enhanced confinement to the core concrete. Choi et al. [15] and Islam and Hoque [16] explored various configurations of steel jacketing, including the use of both continuous and segmental steel jackets. Continuous jackets provide uniform confinement along the pier’s length, which is advantageous for structures subject to significant axial loads. In contrast, segmental jackets, which are applied only at specific sections, offer targeted reinforcement and can be more cost-effective while still enhancing ductility. However, the installation of steel jackets requires precise alignment and welding, as any gaps or misalignments can compromise the effectiveness of the confinement. Additionally, while steel jacketing is highly effective, it can add considerable weight to the structure, which may impact the overall design considerations.
Another approach involves the application of fiber-reinforced polymer (FRP) composites on the surface of RC piers [18,19,20,21,22,23,24]. FRP composites are applied externally to the surface of RC structures, where they act as a confining layer that improves both strength and ductility. Parvin and Brighton [18] demonstrated that FRP wraps provide excellent confinement, which helps to restrict lateral expansion of the concrete. Studies by Parvin and Wang [23] and De et al. [24] have shown that FRP composites can effectively prevent premature buckling of longitudinal reinforcements by applying confinement pressure. Despite its many advantages, FRP does have some limitations. It can be sensitive to UV exposure and environmental degradation over time, which may affect its long-term durability if not properly protected. Furthermore, the initial material cost of FRP, especially for CFRP, can be high, which may limit its use in cost-sensitive projects.
With the development of technologies for improving the seismic performance of RC pier, the RC structural design for easy-to-use and cost-effective reinforcement technologies has attracted increasing attention from academics and industry in recent years. To resolve the aforementioned defects, this paper proposes an innovative design methodology for RC bridge pier aiming at enhancing ductility. The proposed ductility-enhancing (DE) pier prevents the buckling of main rebars in the loading plane by embedding some pre-deforming longitudinal reinforcements. To the best of our knowledge, this method is novel and being introduced for the first time. In this paper, lateral reversed cyclic loading experiments are conducted to better understand the global behavior, i.e., failure mode, plastic hinge distribution, hysteretic properties, normalized stiffness degradation, normalized energy dissipation capacity, bearing capacity, and ductility, and to verify the effectiveness of the proposed design methodology.

2. Proposed DE Pier

2.1. Ductility

In this paper, ductility refers to the characteristic behavior of a pier from yielding to failure. Ductility is typically quantified using the ductility factor. The ductility factor μ is calculated using Equations (1) and (2) based on the skeleton curves and the maximum lateral load.
μ = δ d δ y
δ d = + δ d + δ d 2
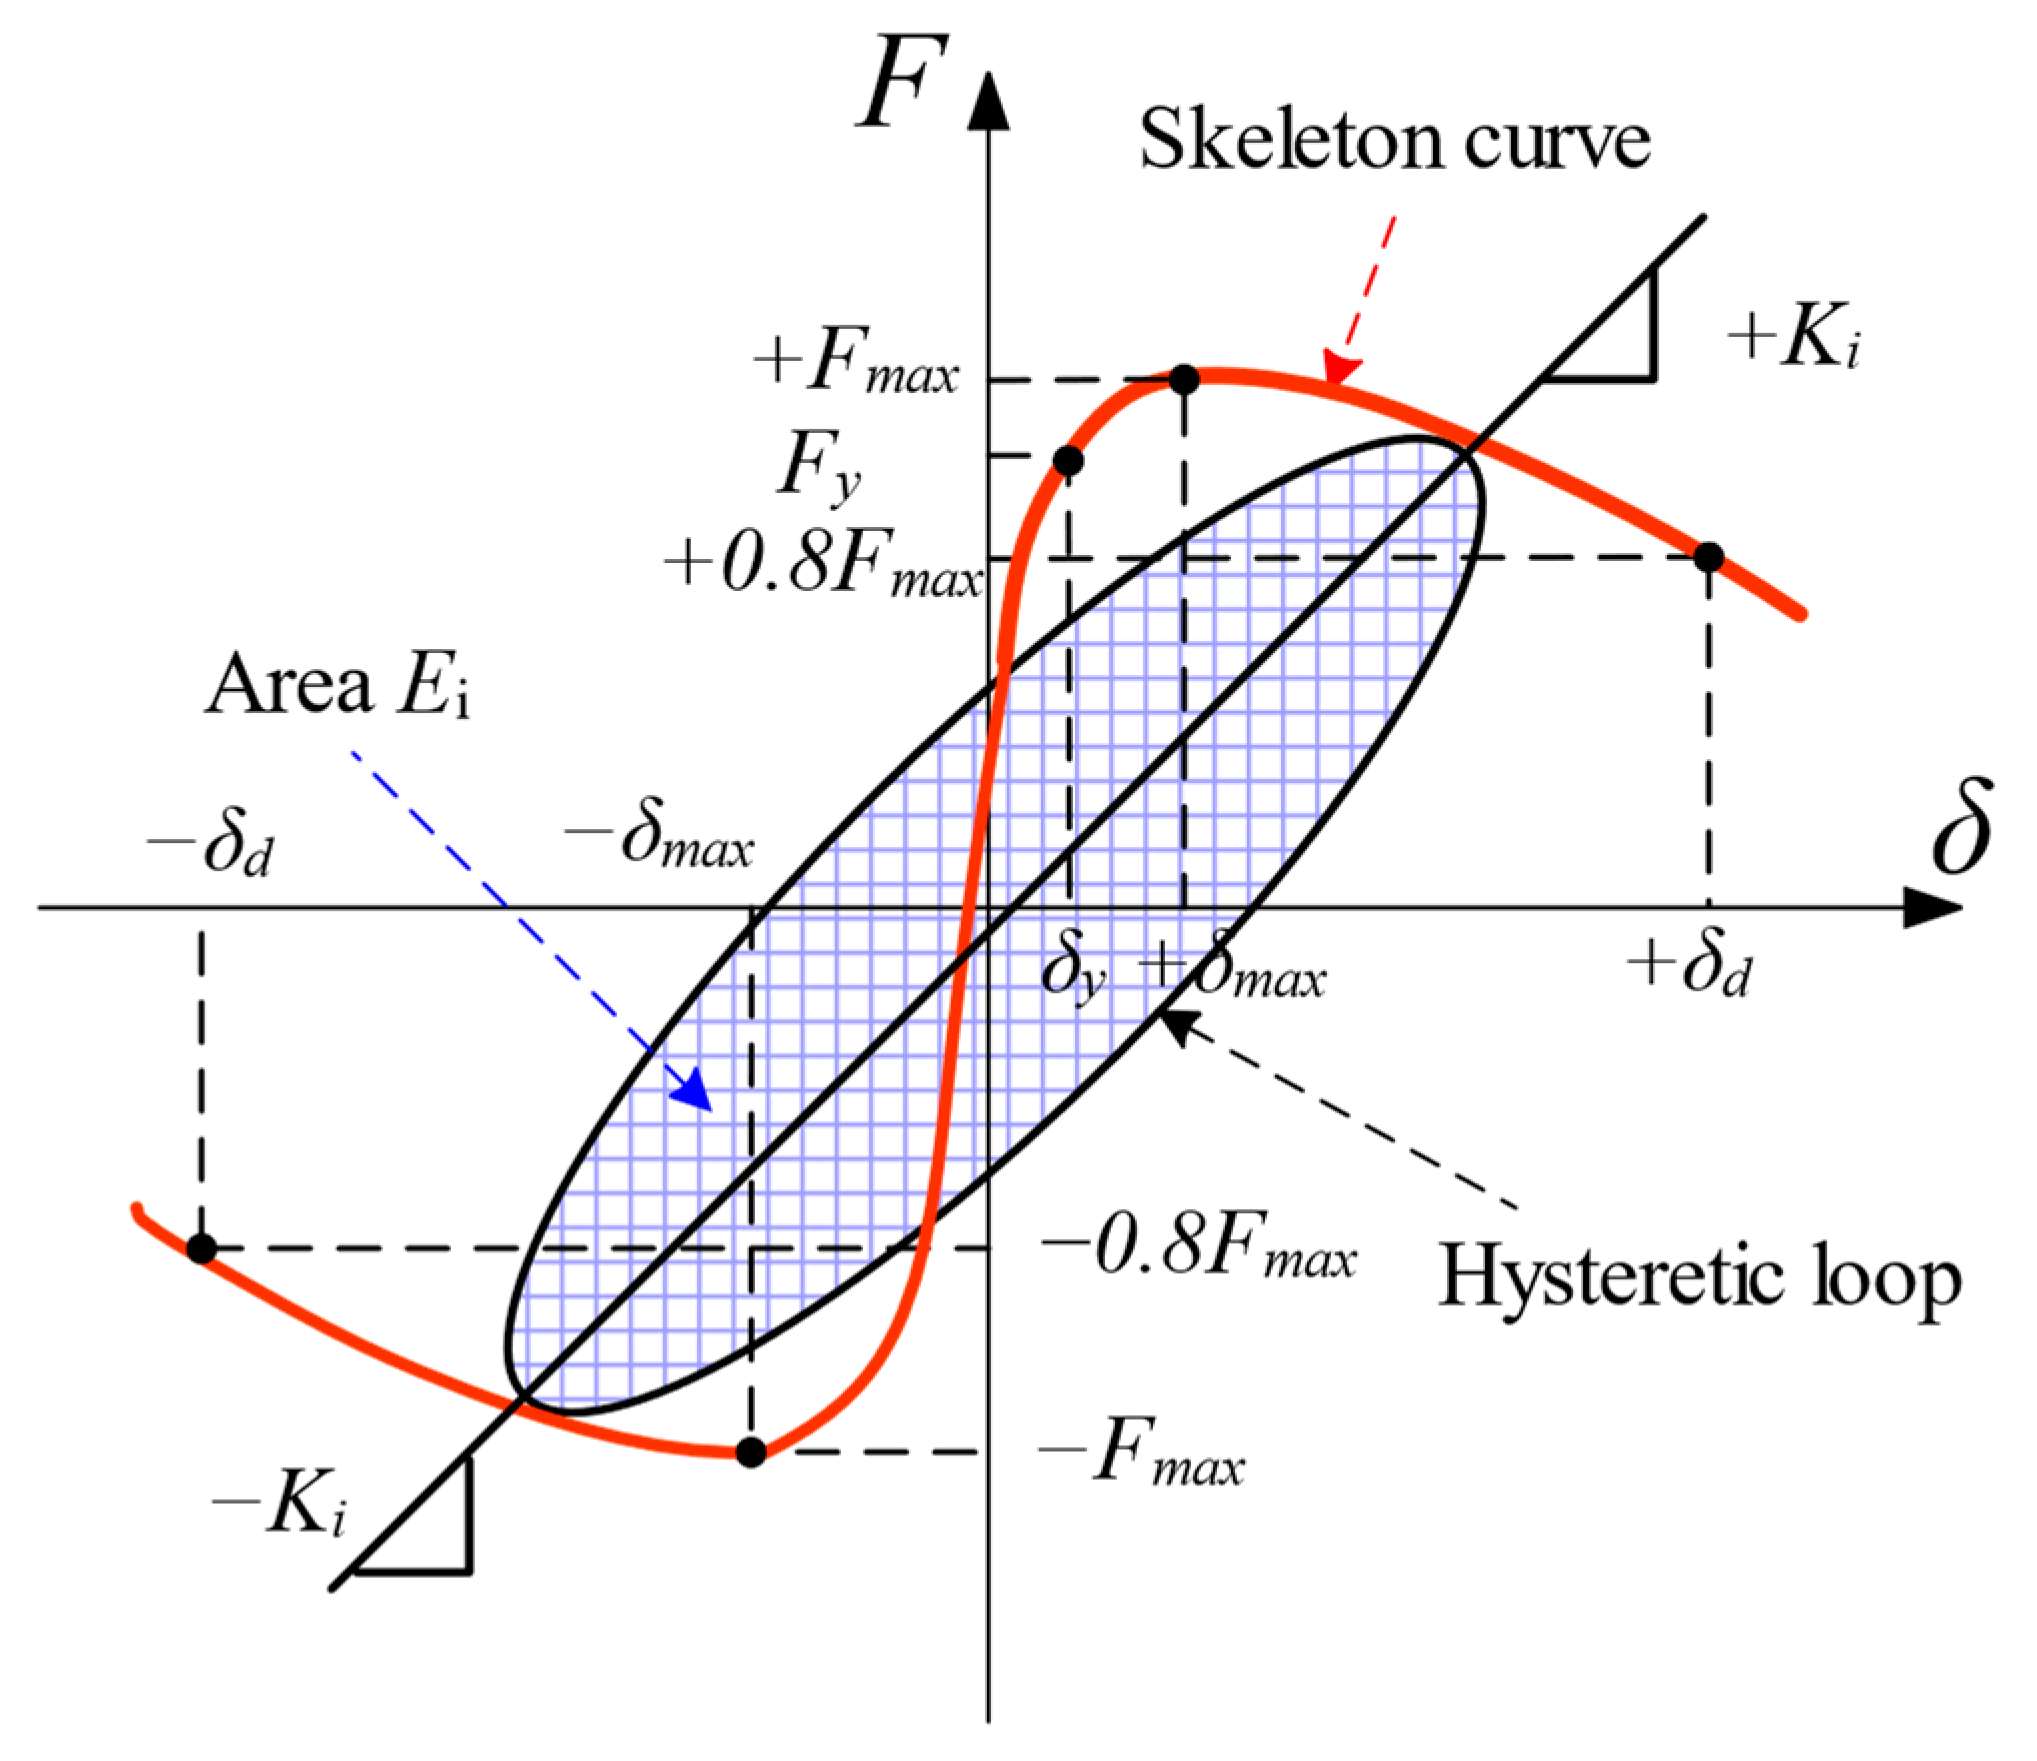
where δ y is the corresponding displacement when first yielding occurs, and δ d is the corresponding average ductility displacement when force has undergone a 20% reduction, as shown in Figure 2 and Equation (2).

2.2. Design Concept

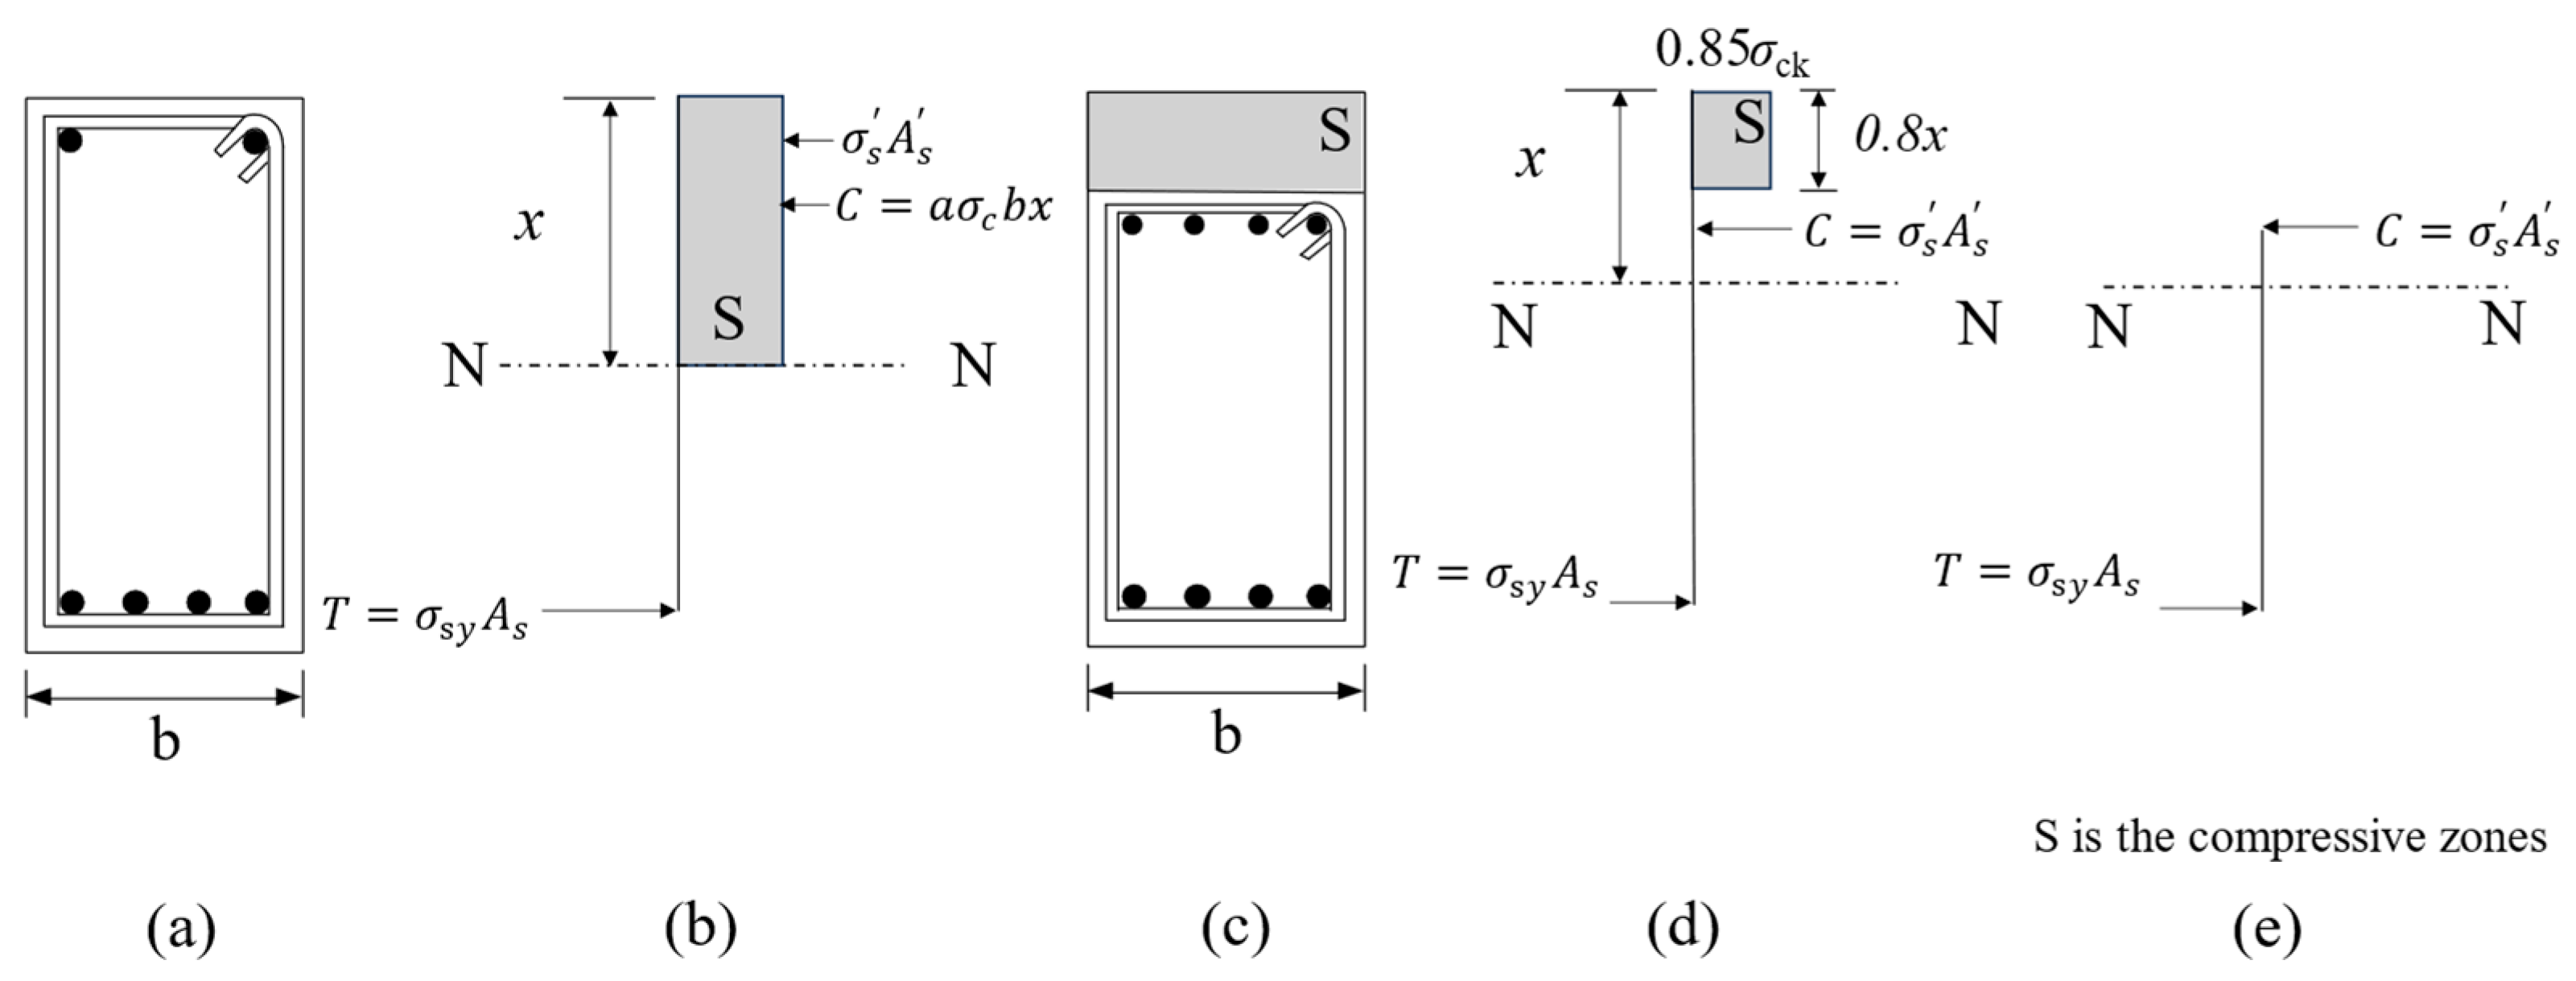
A DE pier is characterized by adopting some pre-deformed longitudinal reinforcement, which can effectively mitigate the buckling risk of longitudinal reinforcement. This design concept draws inspiration from high-ductility RC beams [25]. As illustrated in Figure 3a, in a standard RC beam, concrete failure under compression leads to an outward buckling of the compressive steel bars (with a cross-sectional area of about 1/2 to 1/3 that of the tensile steel bars). Consequently, an imbalance of forces between the compression and tension zones arises, often resulting in the collapse of the RC beam. In contrast, as depicted in Figure 3c, in a high-ductility beam, the compressive steel bars are embedded below the zone susceptible to compressive damage [25]. This arrangement ensures that the steel rebar remains resilient to buckling due to the confinement of concrete. Additionally, the forces in both the compression and tension zones of the RC beam are balanced, owing to bars under tension and compression having identical cross-sectional areas, as illustrated in Figure 3e. In essence, this approach maintains force equilibrium before and after the failure of concrete. Experimental results reveal that the design method can enhance the ductility of beams with a ductility rate of 38.
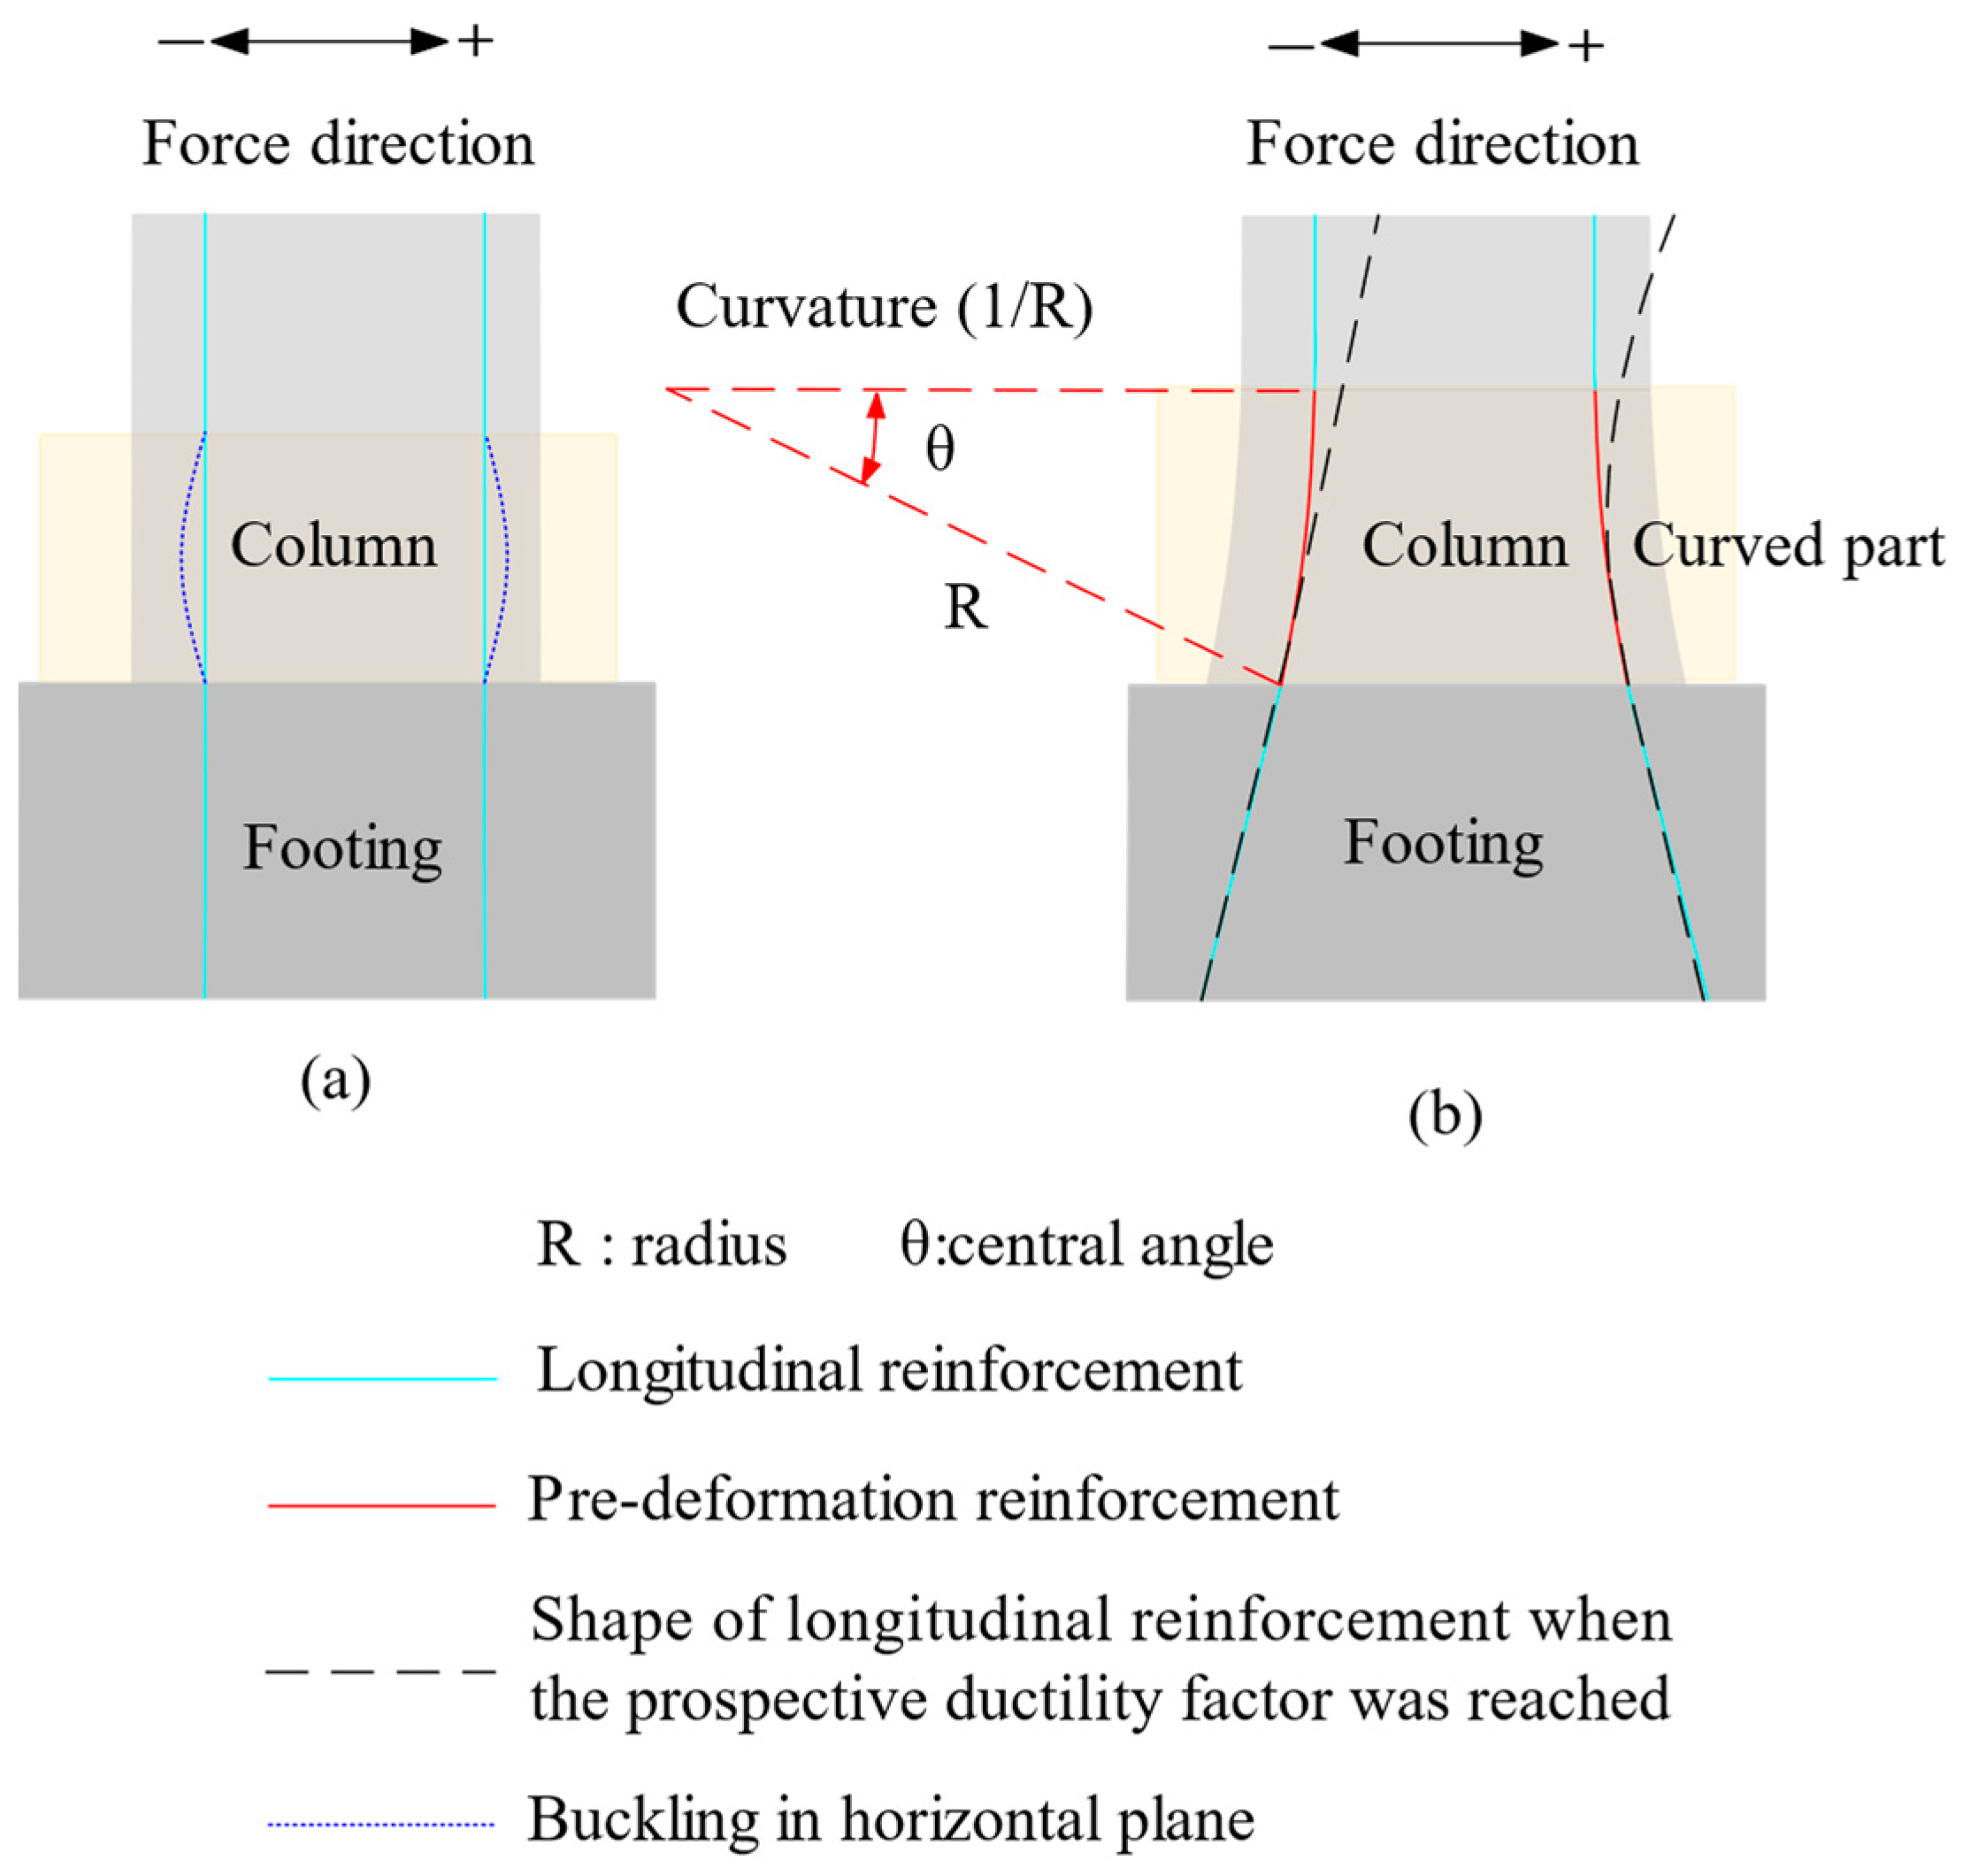
Based on the methodology described above, improving the ductility of RC structures requires balancing the compressive and tensile forces, even after compressive failure of the concrete. To achieve this balanced condition, two requirements must be met: (1) the buckling of the main rebar should be delayed or even prevented, and (2) the quantity of tensile and compressive rebar must be the same. In a standard pier, as Figure 4a shown, the rebars tend to buckle outwards in the load plane. As Figure 4b shown, a DE pier is designed by partly bending longitudinal reinforcements. The proposed design causes some longitudinal reinforcements to bend inward, which means the pre-deformed direction opposes the typical buckling direction of a standard pier. Additionally, this bending curvature is similar to that caused by the rotating of the plastic hinge of the standard member. This approach prevents the pre-deformed rebars from buckling, as with the dotted line shown in Figure 4, when the targeted displacement is reached.

2.3. Detail of Design Process

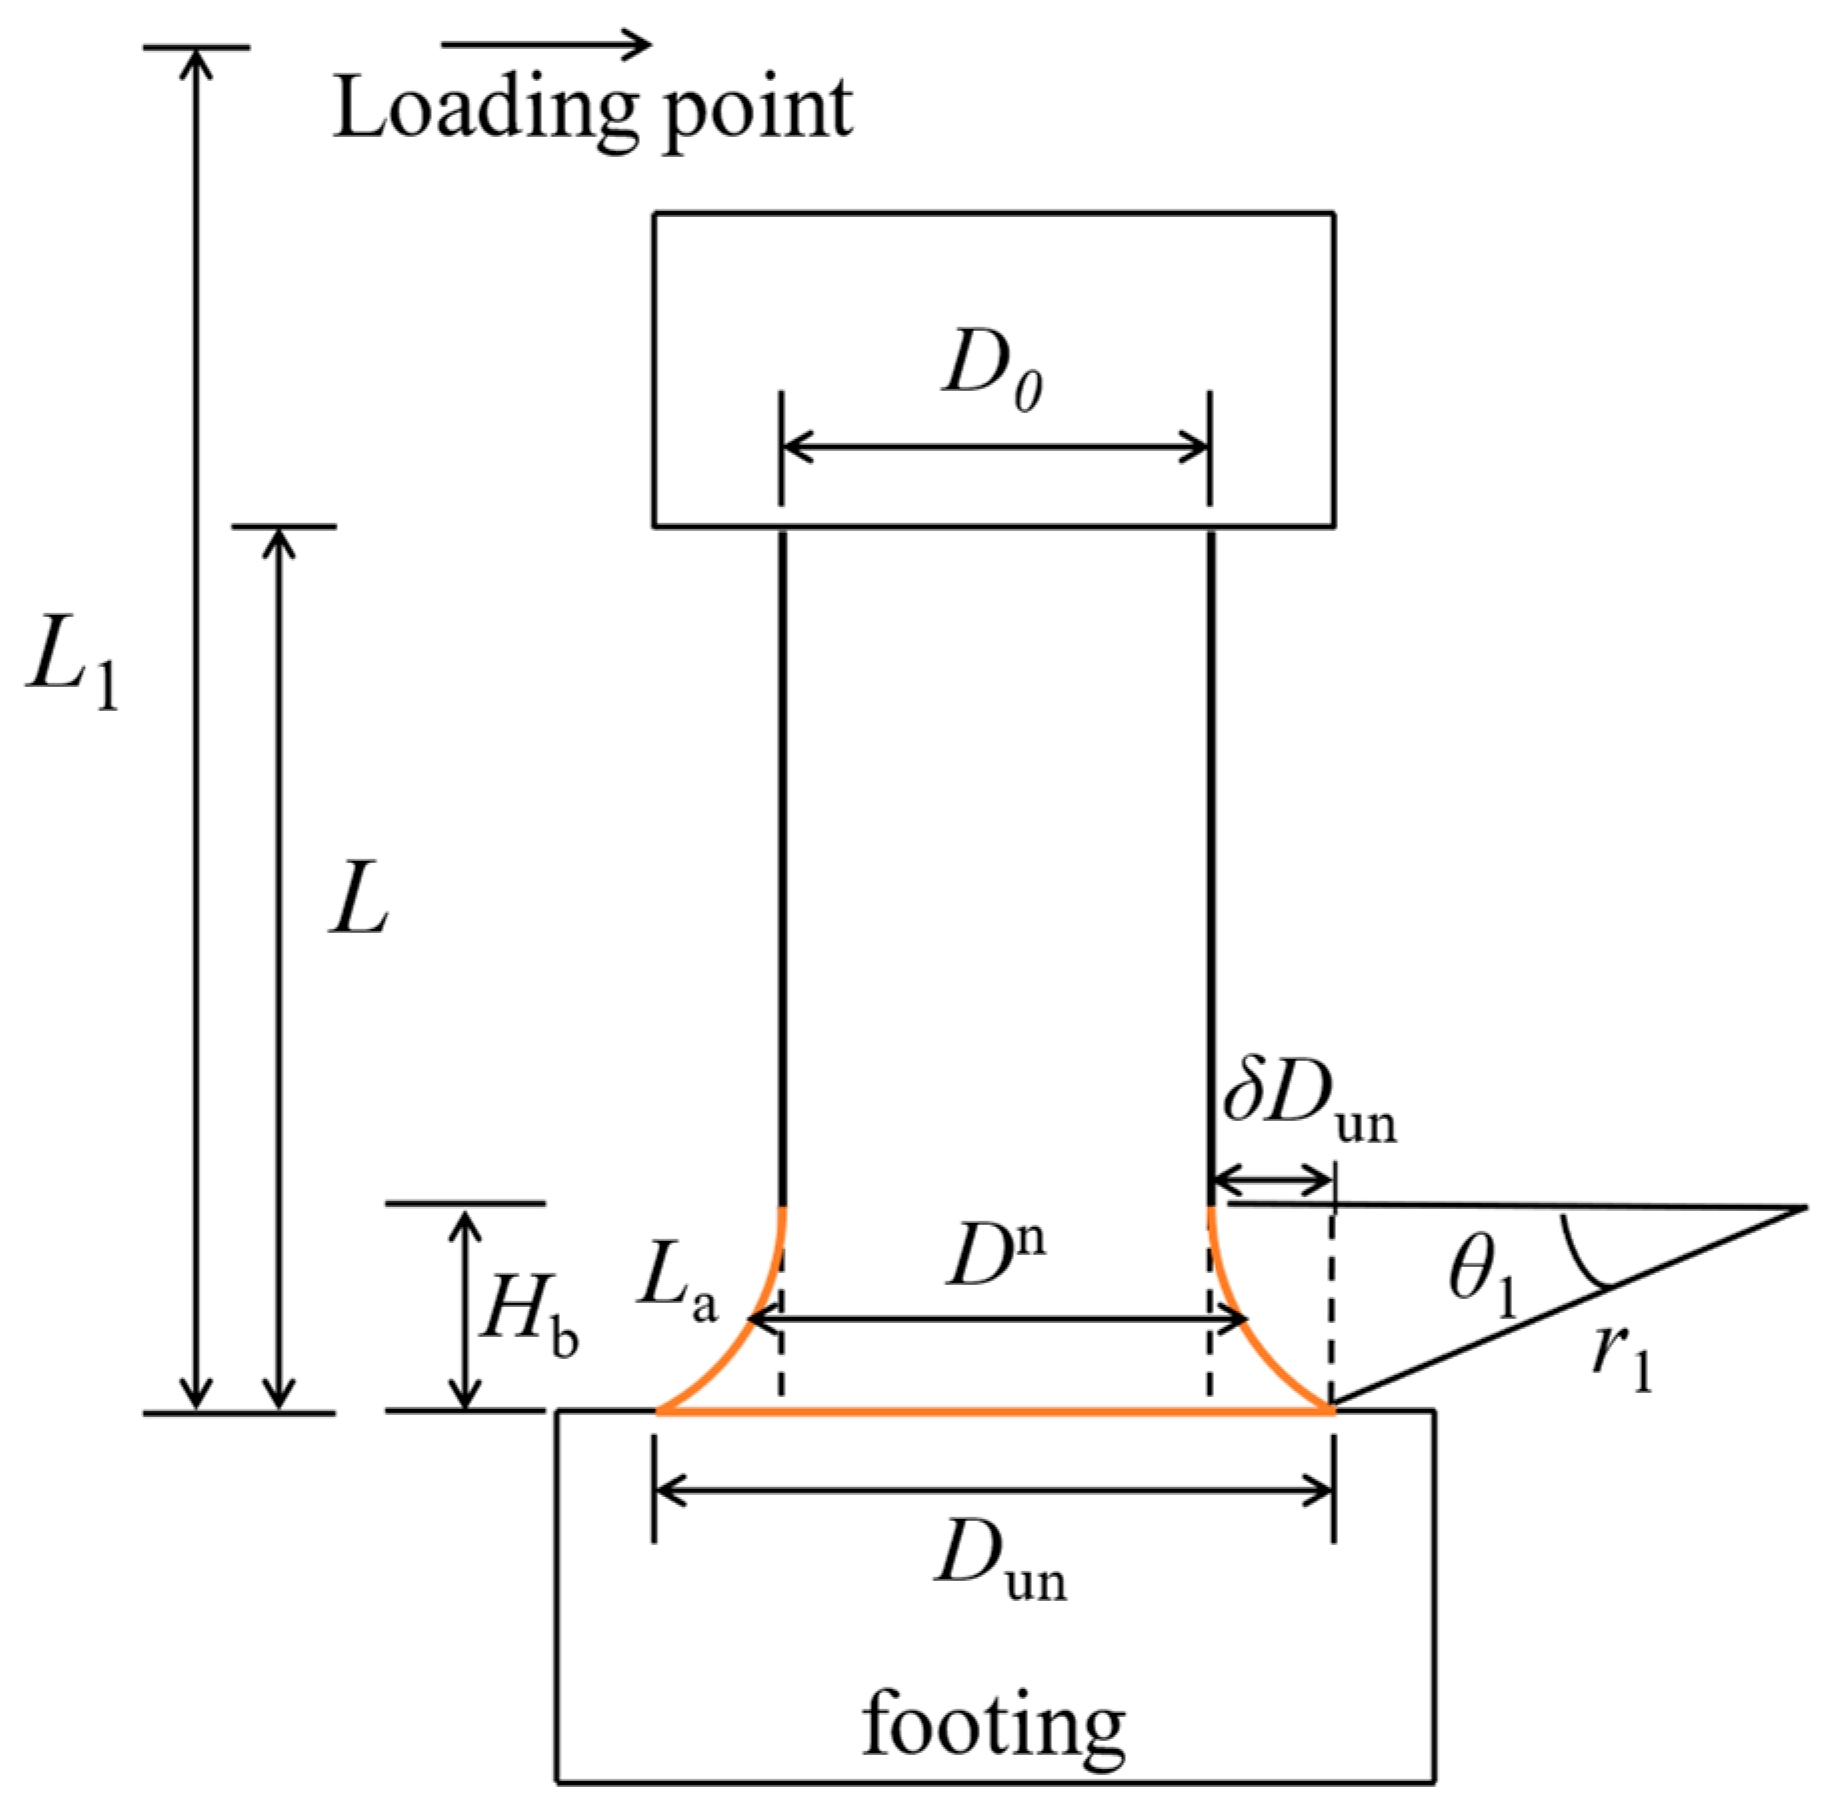
As discussed in the aforementioned section, the proposed pier can develop buckling resistance and maintain the force balance based on the key design criterion, which involves the pre-deformed curvature of the DE pier approximating the bending degree of the plastic hinge in a standard pier under load. The design procedures are organized into seven steps, as illustrated in the flowchart in Figure 5. The detailed parameters contained in the flowchart are further explained in Figure 6.

2.3.1. Step 1: Setting Targeted Displacement and Determining the Displacement Due to Plastic Hinge Rotation

The target pre-deformed displacement δ p d is set to 40 δ y . According to the Ref. [26], the displacement δ p θ u due to plastic hinge rotation can be calculated by the Equation (3).
δ p θ u = δ p d δ y
where δ y is the yield displacement of the pier. It is referred to the knowledge of material mechanic to derive δ y [27]. The maximum large displacement δ y (yield displacement) in the elastic phase of a cantilevered column subjected to a concentrated force at its free end can be derived from Equation (4), where P y is a force, L is the pier length. E is the elastic model of structure, I y is the inertia moment of the section. P y is derived from the relations between the yield moment M y and the length from loading point to bottom of column ( L 1 ) (Equation (5)), as Figure 6 shows. At the E I y is bending stiffness, which is calculated by the relationship between yield curvature φ y and bending stiffness E I y (Equation (6)). It is worth mentioning that M y and φ y can be obtained from the software ‘RC cross-sectional calculations Ver 8’ after ensuring the geometric dimension of RC pier.
δ y = P y L 3 3 E I y
P y = M y L 1
E I y = M y φ y

2.3.2. Step 2: Determining Plastic Hinge Length, Bending Reinforcement Intervals, and Curvature

The equivalent plastic hinge length L p and average curvature φ p θ u of the plastic hinge zone at ultimate displacement can be derived from Ref. [28].
L p = 52 L 0.6 D
δ p d = φ p θ u L p L L p 2
r 1 = 1 φ p θ u
It is difficult to manufacture bending length H (218 mm), which was determined by Equation (7). The length of pre-deformed interval H b is adopted as the bending length, as Figure 6 shown.

2.3.3. Step 3: Determine the Sectional Height Dun of the DE Pier

According to the geometric relationship, the sectional height D u n was determined by Equations (10)–(12).
r 1 s i n θ 1 = H b
r 1 1 c o s θ 1 = δ D u n
D u n = D 0 + 2 δ D u n
where θ 1 was the angle of the pre-deformed interval. δ D u n was enlarged sectional width of pre-deformation interval compared with standard pier. D u n was the cross-sectional height at the end of the DE pier.

2.3.4. Step 4: Check Whether the Pre-Deformed Rebars Are in the Strain Hardening or Not

When the strain is over 0.015, the pre-deformed rebar is considered in the strain-hardening in this study. The arc length after bending L a is calculated by Equation (13).
L a = 2 π r θ 1 360
The length before bending is H. Therefore, the strain ε is calculated by Equation (14)
ε   = L a H H

2.3.5. Step 5: Determine the Effective Height and Iterative Calculations for DE Piers

The effective height D n is the sectional height of half plastic hinge section. The calculation of D n is based on the configuration of the standard pier. The introduction of pre-deformation alters the sectional heights, which, in turn, affects parameters such as yield moment, yield curvature, and yield displacement. Consequently, the ultimate curvature of the pre-deformed structure is also impacted. This variation in ultimate curvature influences the geometry of the pre-deformed interval. Therefore, an iterative process is necessary to calculate the ultimate curvature of the pier in terms of previous steps. The iteration is terminated when the ratio of D n to D n + 1 falls within the range of 0.97 to 1.03.

3. Test Specimen and Procedure

3.1. Detail of Test Specimens

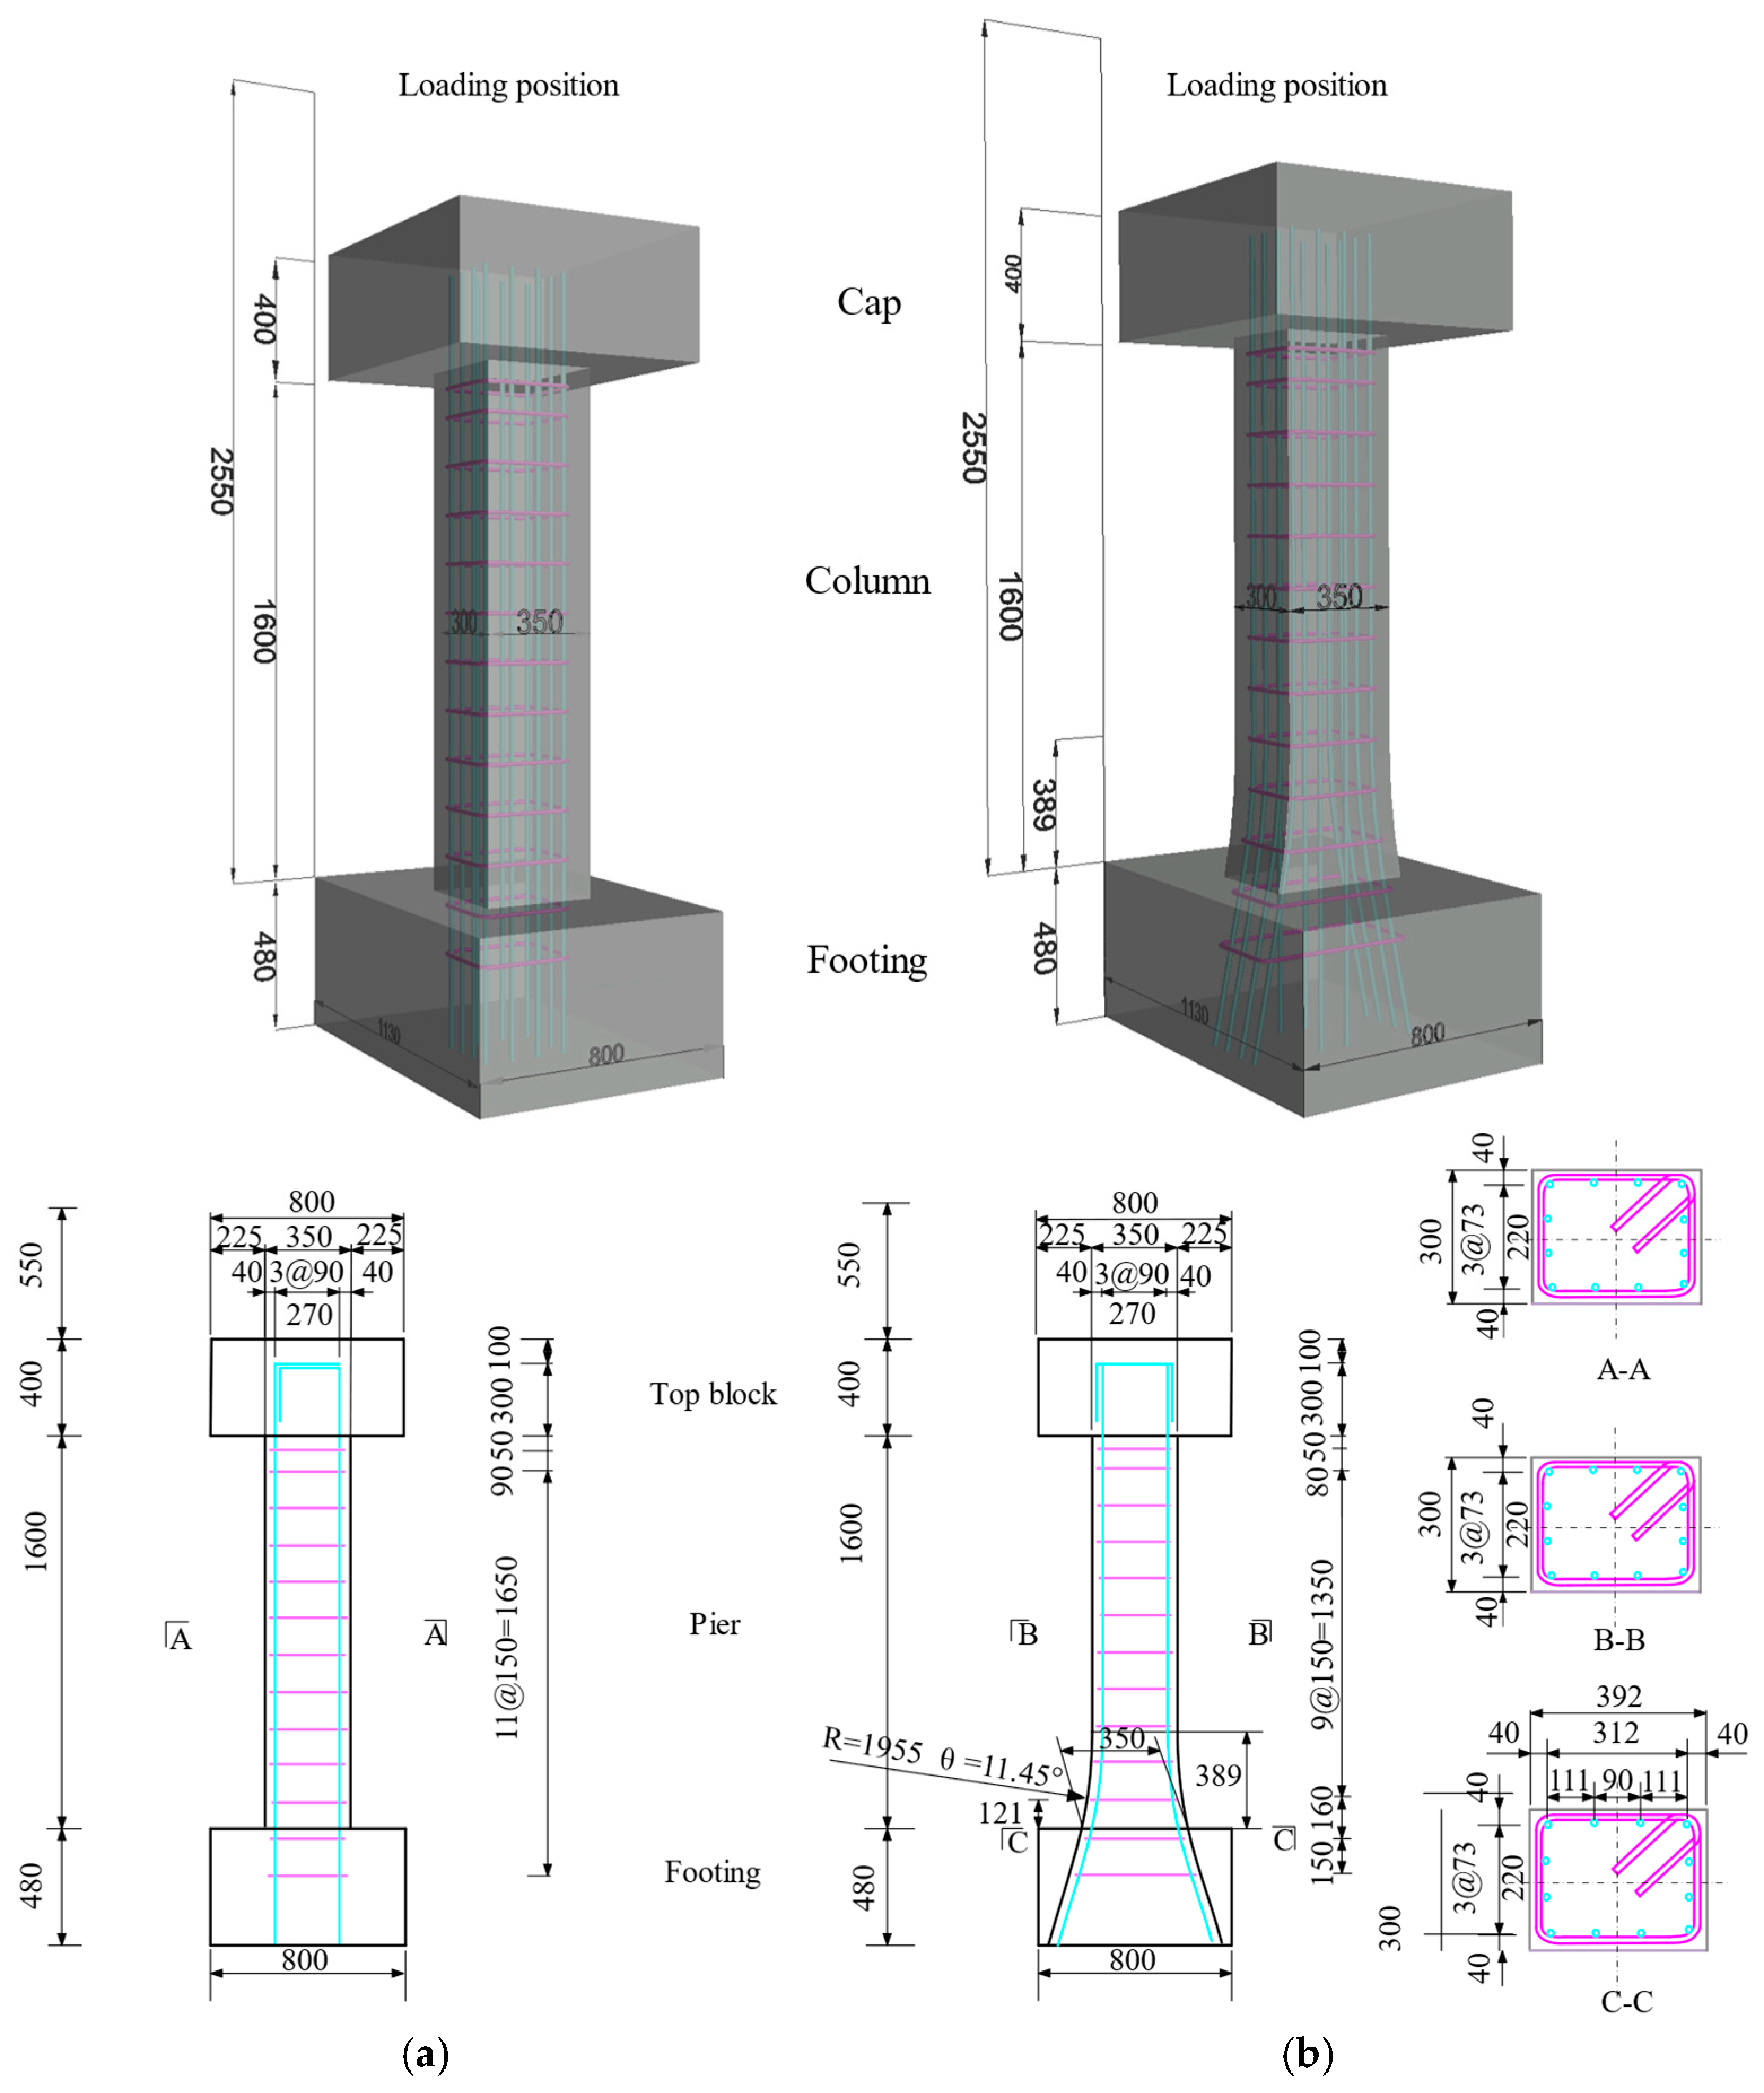
Two different RC pier specimens were fabricated for this study. The standard RC pier (Type 1) served as the reference specimen, while the DE pier was designated as Type 2. Figure 7 illustrates the details of the dimensions and reinforcement layout of test piers. The cross-section was 350 × 300 mm2 with a height of 1600 mm for Type 1. The dimensions of Type 1 were determined due to the installation constraints of the loading test equipment, but the slenderness ratio and reinforcement ratio were determined in accordance with the design guidelines for RC piers commonly used for actual bridges, such as the Specifications for Highway Bridges. The pre-deformed radius of Type 2 is 1955 mm. Both piers were connected to footings and top blocks with dimensions of 900 × 400 × 800 mm and 1130 × 480 × 800 mm, respectively. Steel bars with a diameter of 16 mm were used as longitudinal reinforcement. Transverse reinforcements with a diameter of 13 mm and a main spacing of 150 mm were employed for both piers.

3.2. Material Mechanical Properties

The compressive and tensile strengths of the concrete used for the piers were measured in accordance with the Compressive Strength Test Method for Concrete (JIS A 1108-2018) and the Tensile Strength Test Method for Concrete (JIS A 1113-2018)3-2). Table 1 presents the measurement results. The average concrete compressive strength was 40 N/mm2 and 39.4 N/mm2 for Type 1 and Type 2, respectively. The tensile strength was 3.24 N/mm2 and 2.82 N/mm2 for Type 1 and Type 2, respectively.
The yield stress, tensile strength, and static modulus of elasticity of the reinforcing bars used in the specimens were determined through uniaxial tensile testing. The parameters are summarized in Table 2. For Type 1, the main steel rebar yielded 404 N/mm2, a tensile strength of 549 N/mm2, and an elongation of 21%. However, for the pre-deformed longitudinal reinforcement in Type 2, these values were 400 N/mm2, 567 N/mm2, and 20%, respectively.

3.3. Test Procedure

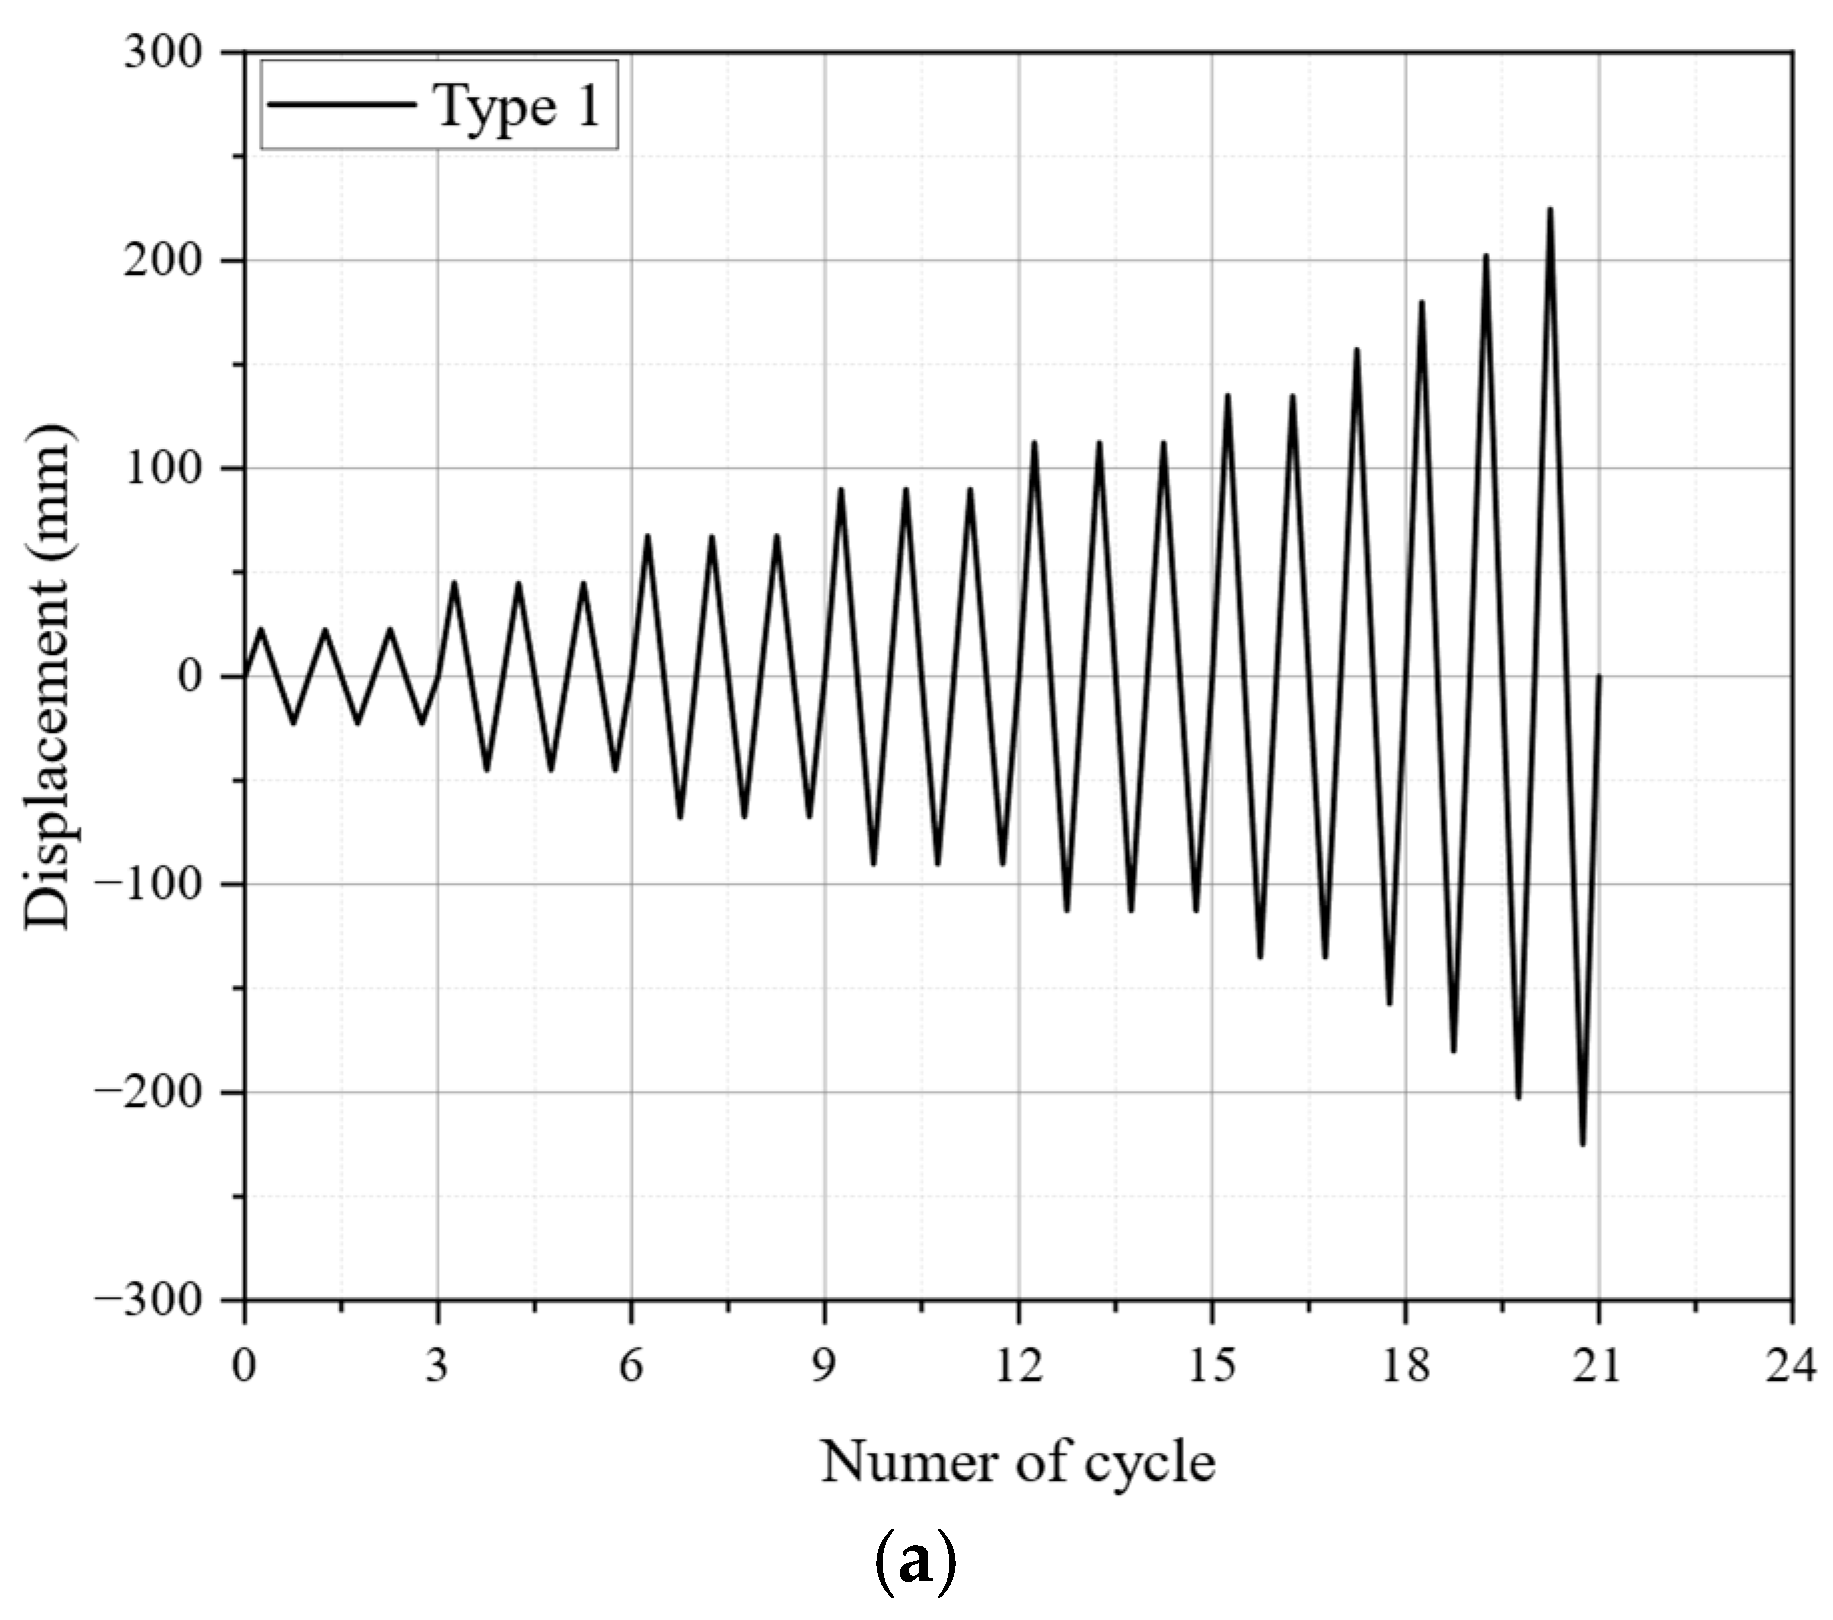
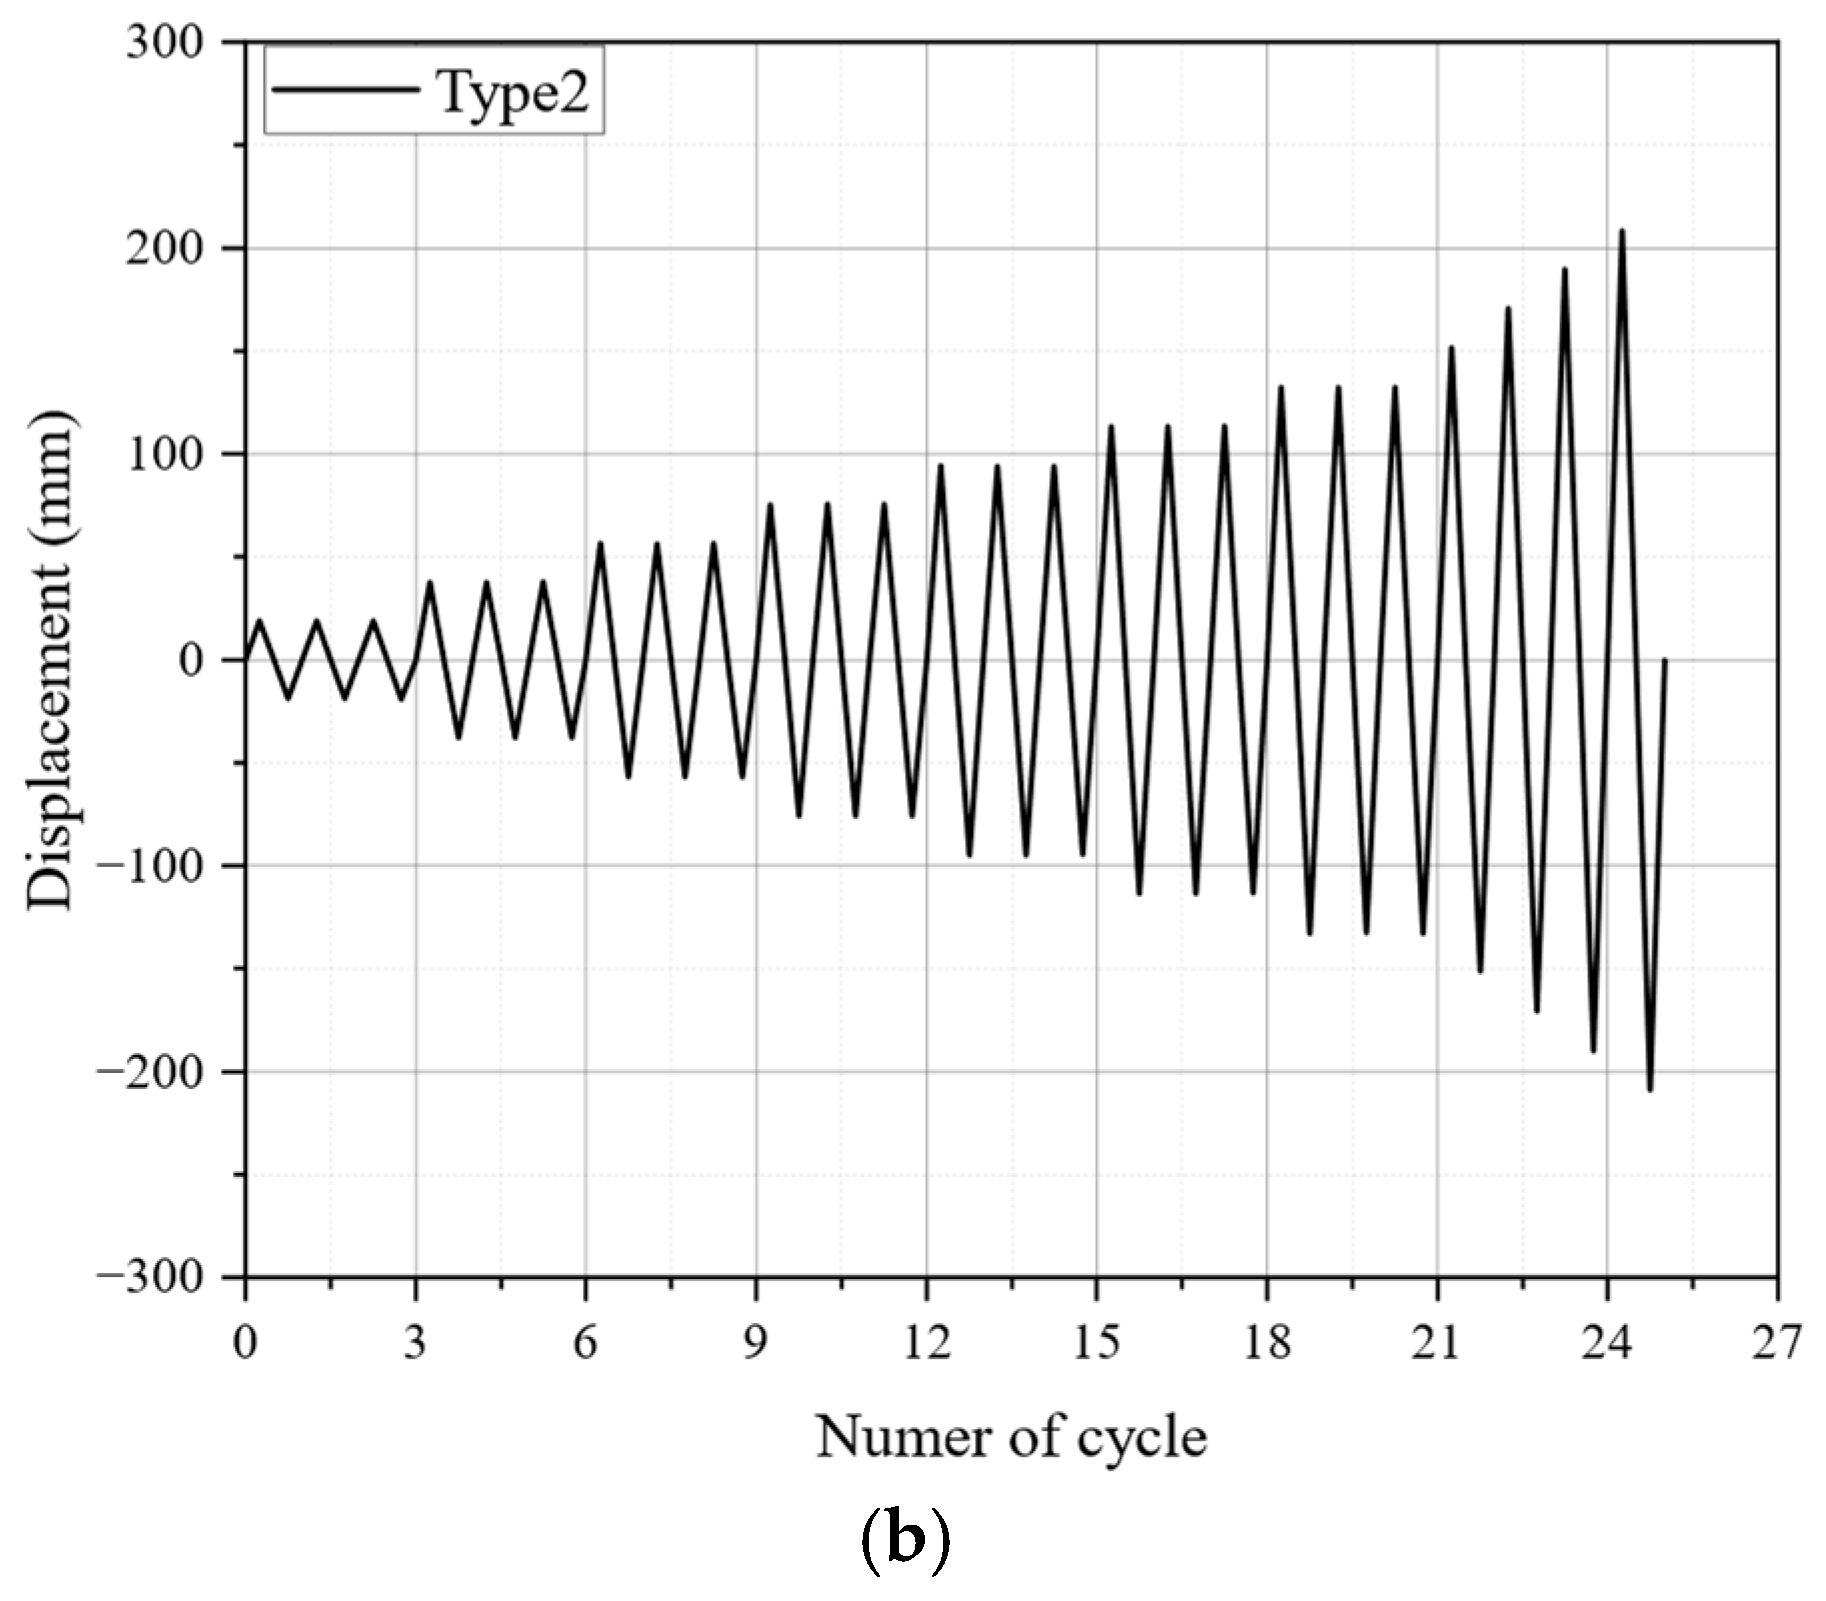
Both piers underwent reversed cyclic displacement-controlled loading with a constant axial load at Kyushu University, Fukuoka, Japan, as illustrated in Figure 8. Displacement sensors and strain gauges were strategically installed along the height of the pier. Cracks were identified, marked, and photographed at each cyclic lateral displacement level. Figure 9 depicts the lateral loading history, with three cycles applied at each level. The initial yield displacement of the main rebar ( δ y ) was set as the first level. Subsequent displacements were 2 δ y , 3 δ y , 4 δ y , and so forth. When the lateral load resistance dropped to 80% of the peak value ( F m a x ), the cycle was applied only once. The tests were concluded once the load dropped to 50% of F m a x .

4. Summary of Experimental Results

4.1. Experimental Observation

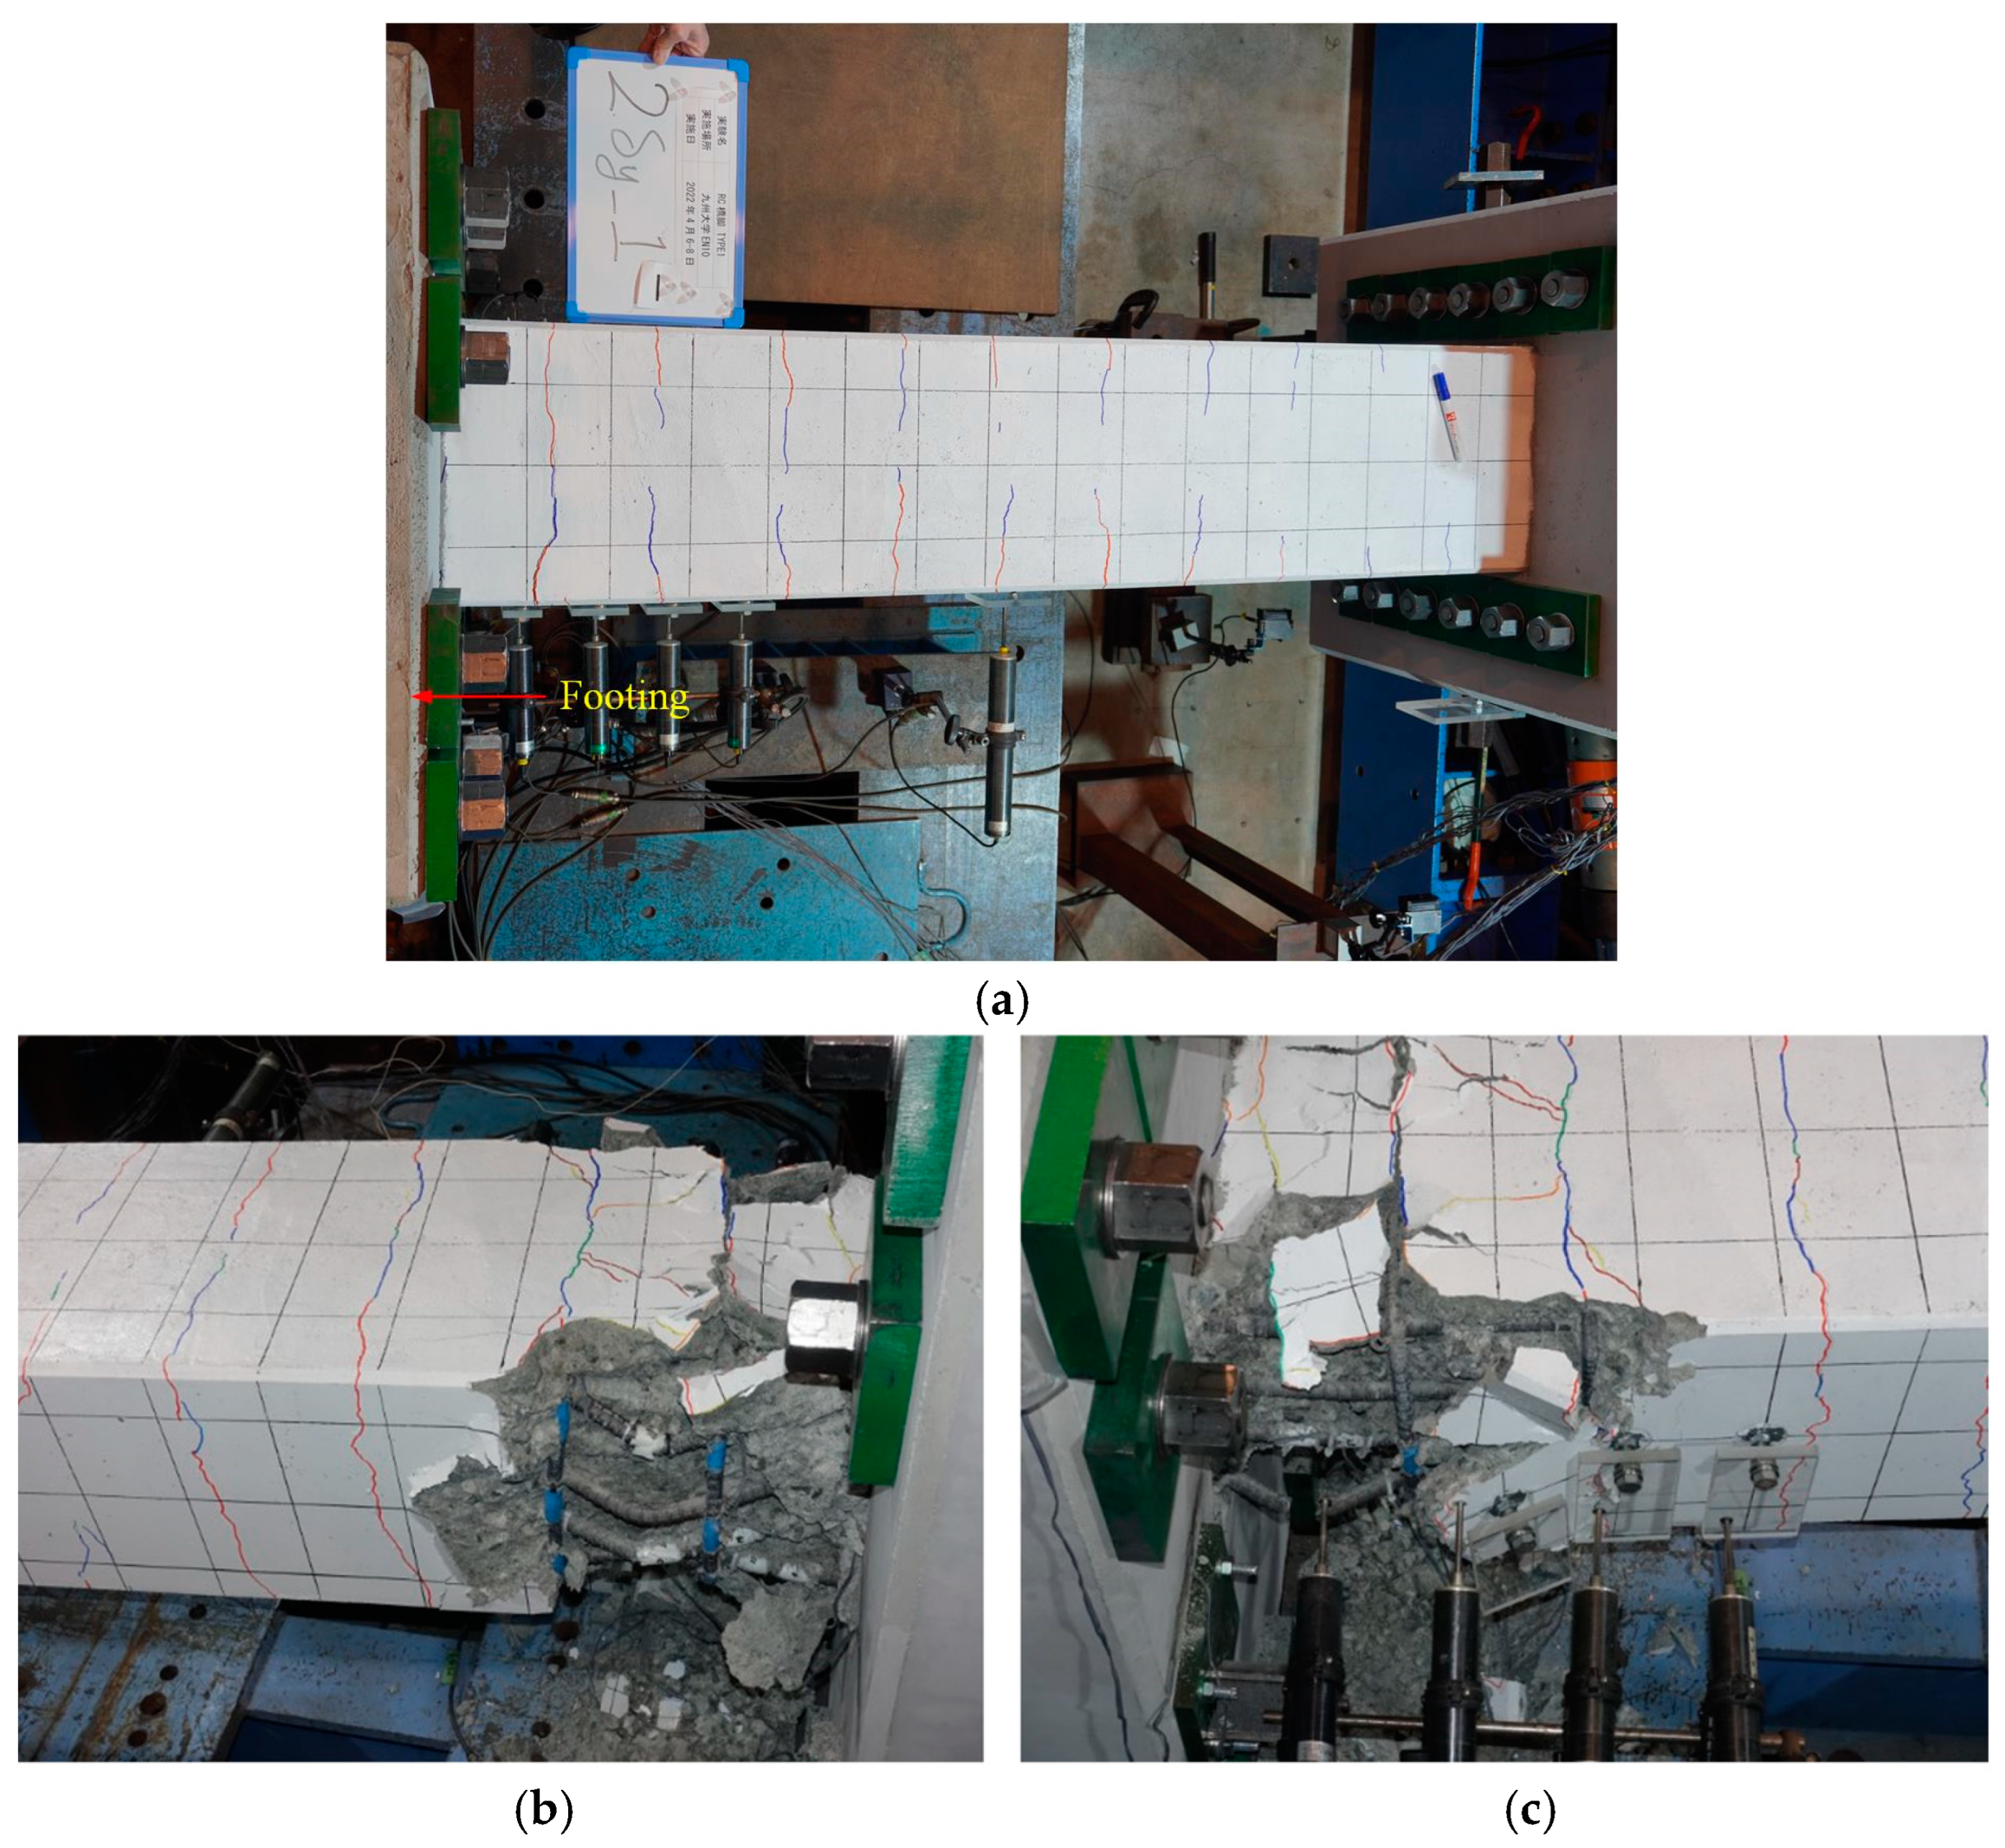
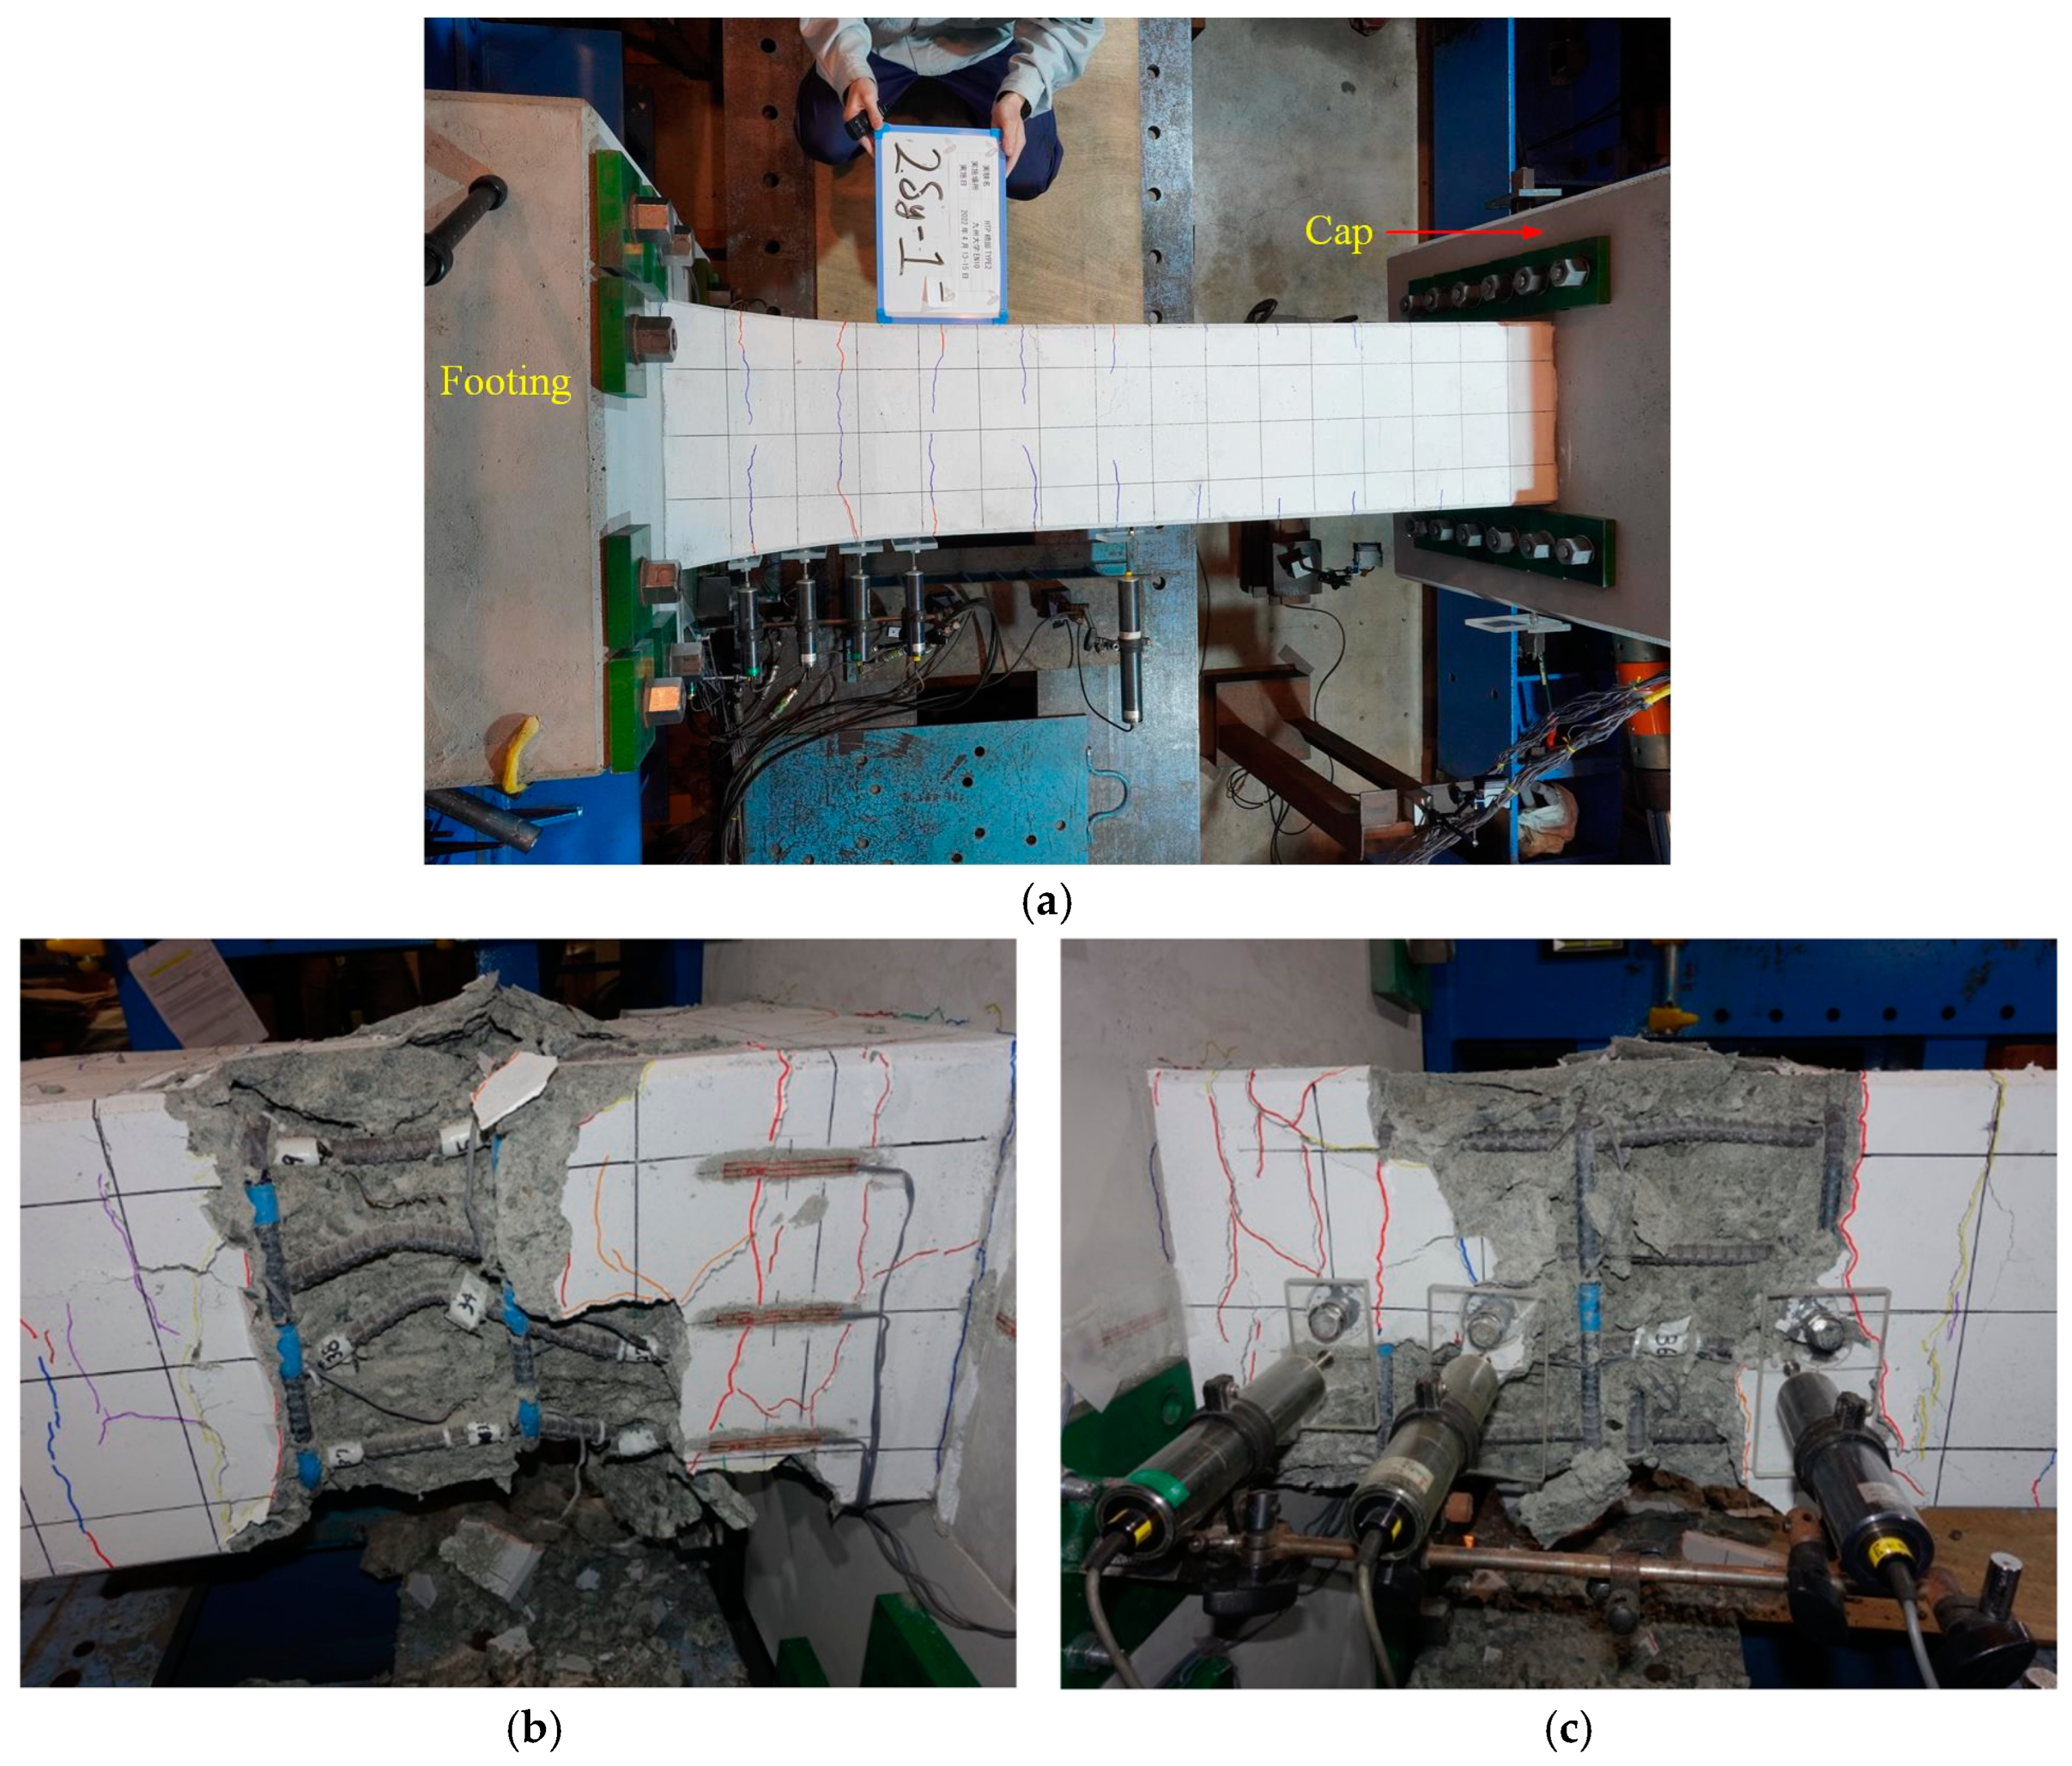
In both specimens, initial cracks appeared perpendicular to the pier axis near the footing before the longitudinal reinforcement yielded. As lateral displacement increased, the number and width of cracks continued to develop perpendicular to the pier axis. The crack spacing remained within 200 mm. In Type 1, no new primary cracks were observed after 2 δ y , while in Type 2, this occurred at 3 δ y . Concrete spalling initially occurred from first −3 δ y to second 3 δ y for Type 1 and from first −5 δ y to second 5 δ y for Type 2. Subsequently, buckling of the main rebars occurred at 9 δ y and −8 δ y for Type 1 and Type 2, respectively. Notably, the buckling in Type 1 occurred in the horizontal loading plane, whereas in Type 2, it occurred out of the plane, a phenomenon not considered during the design phase. The occurrence of the out-of-plane bucking before the maximum expected ductility led to earlier instability in RC pier and significantly affects the overall performance and reduces the ductility. The longitudinal reinforcements failed at 10 δ y in both piers due to bending. Figure 10 and Figure 11 illustrate the failure patterns of the piers.

4.2. Horizontal Displacement and Plastic Hinge of Piers

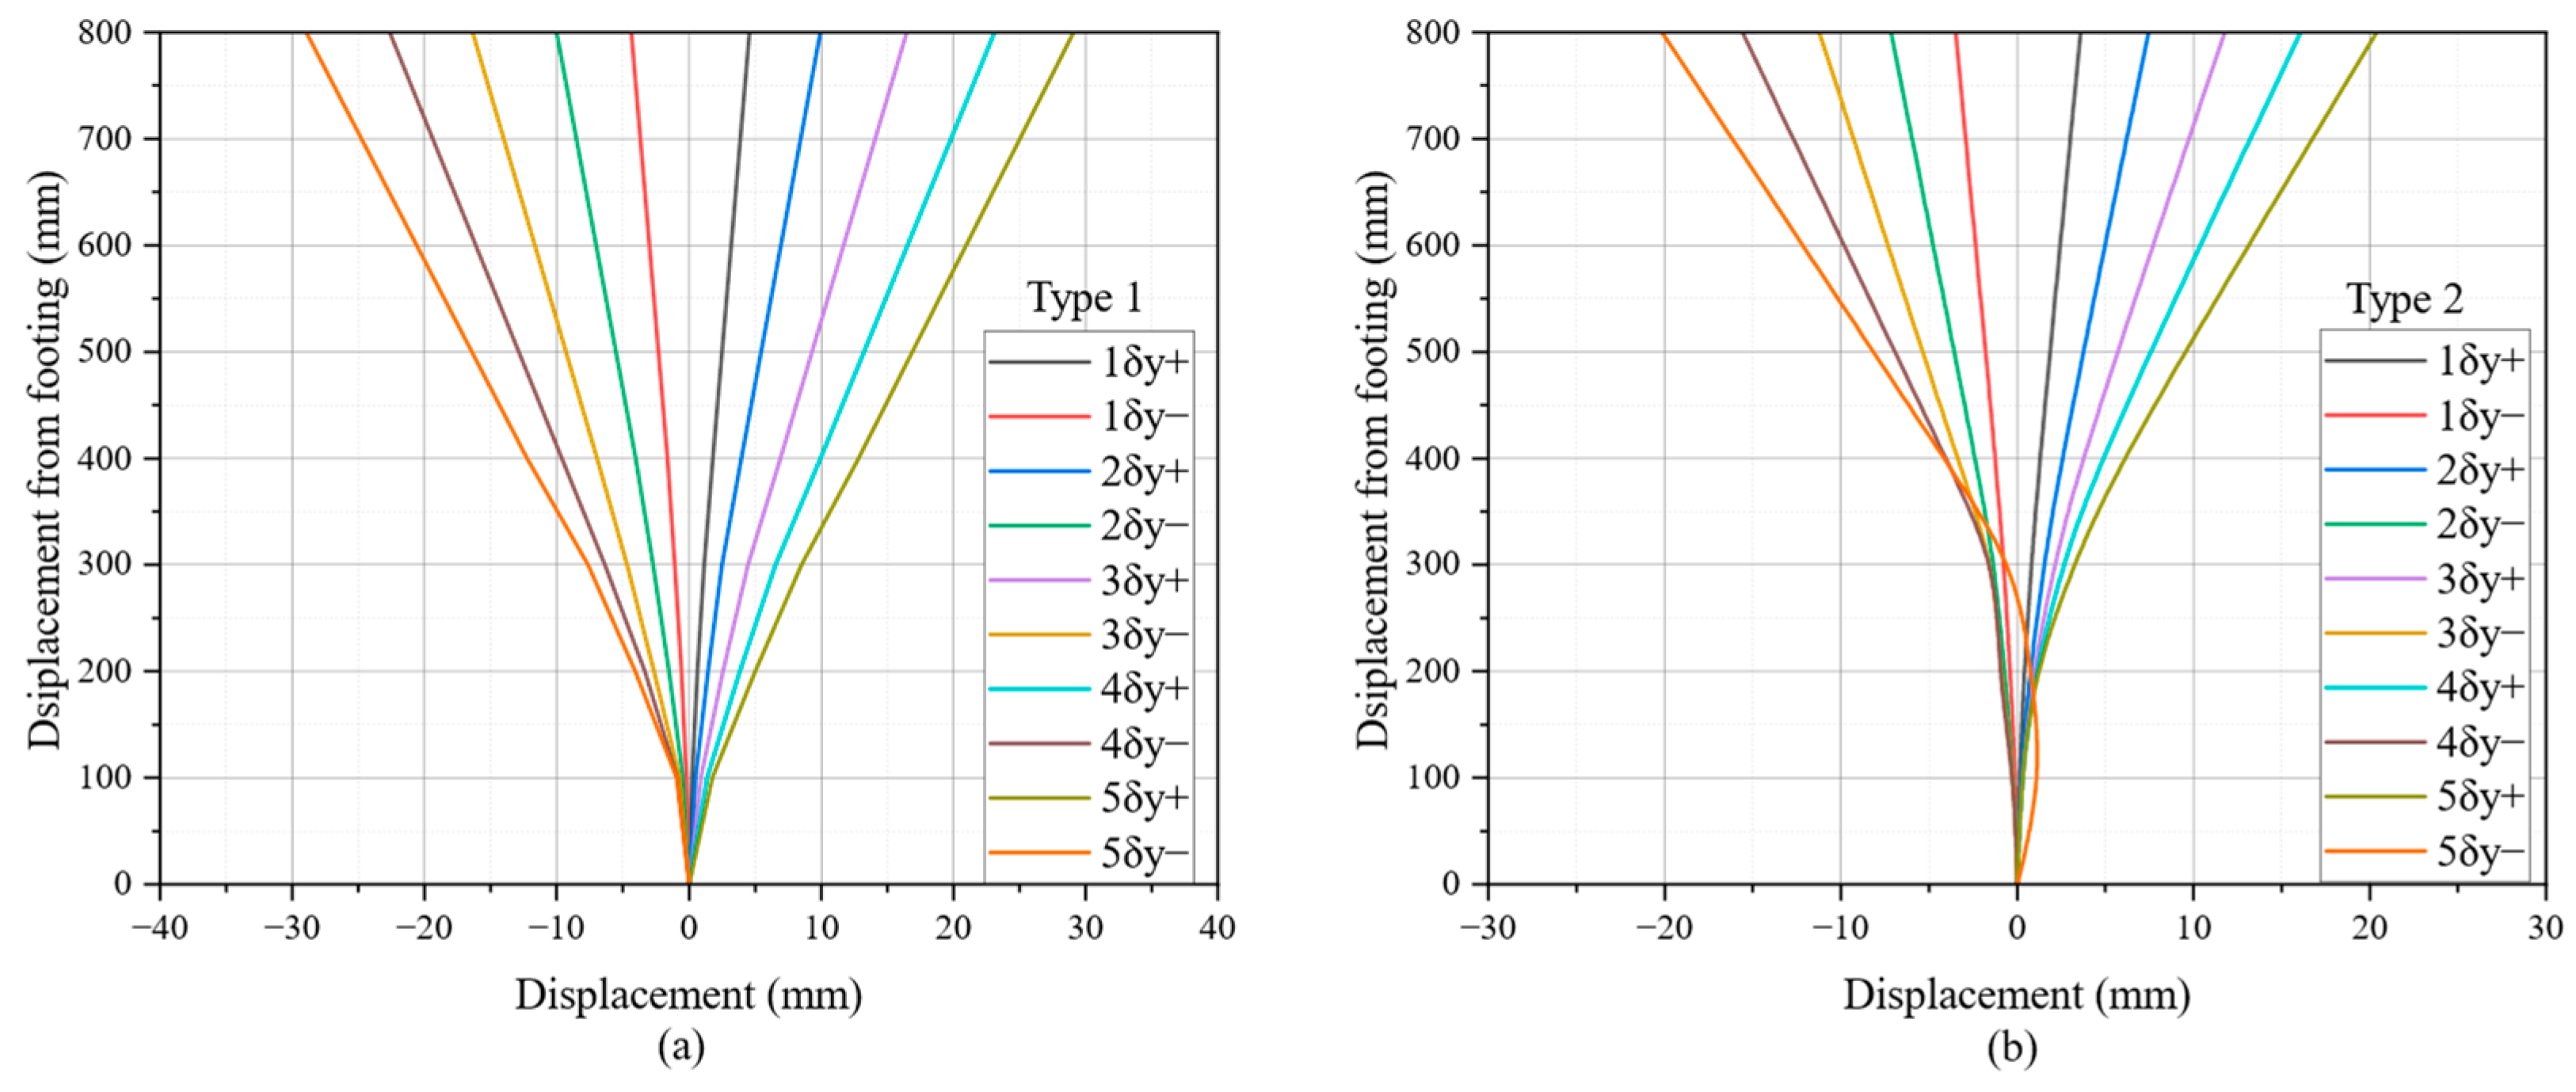
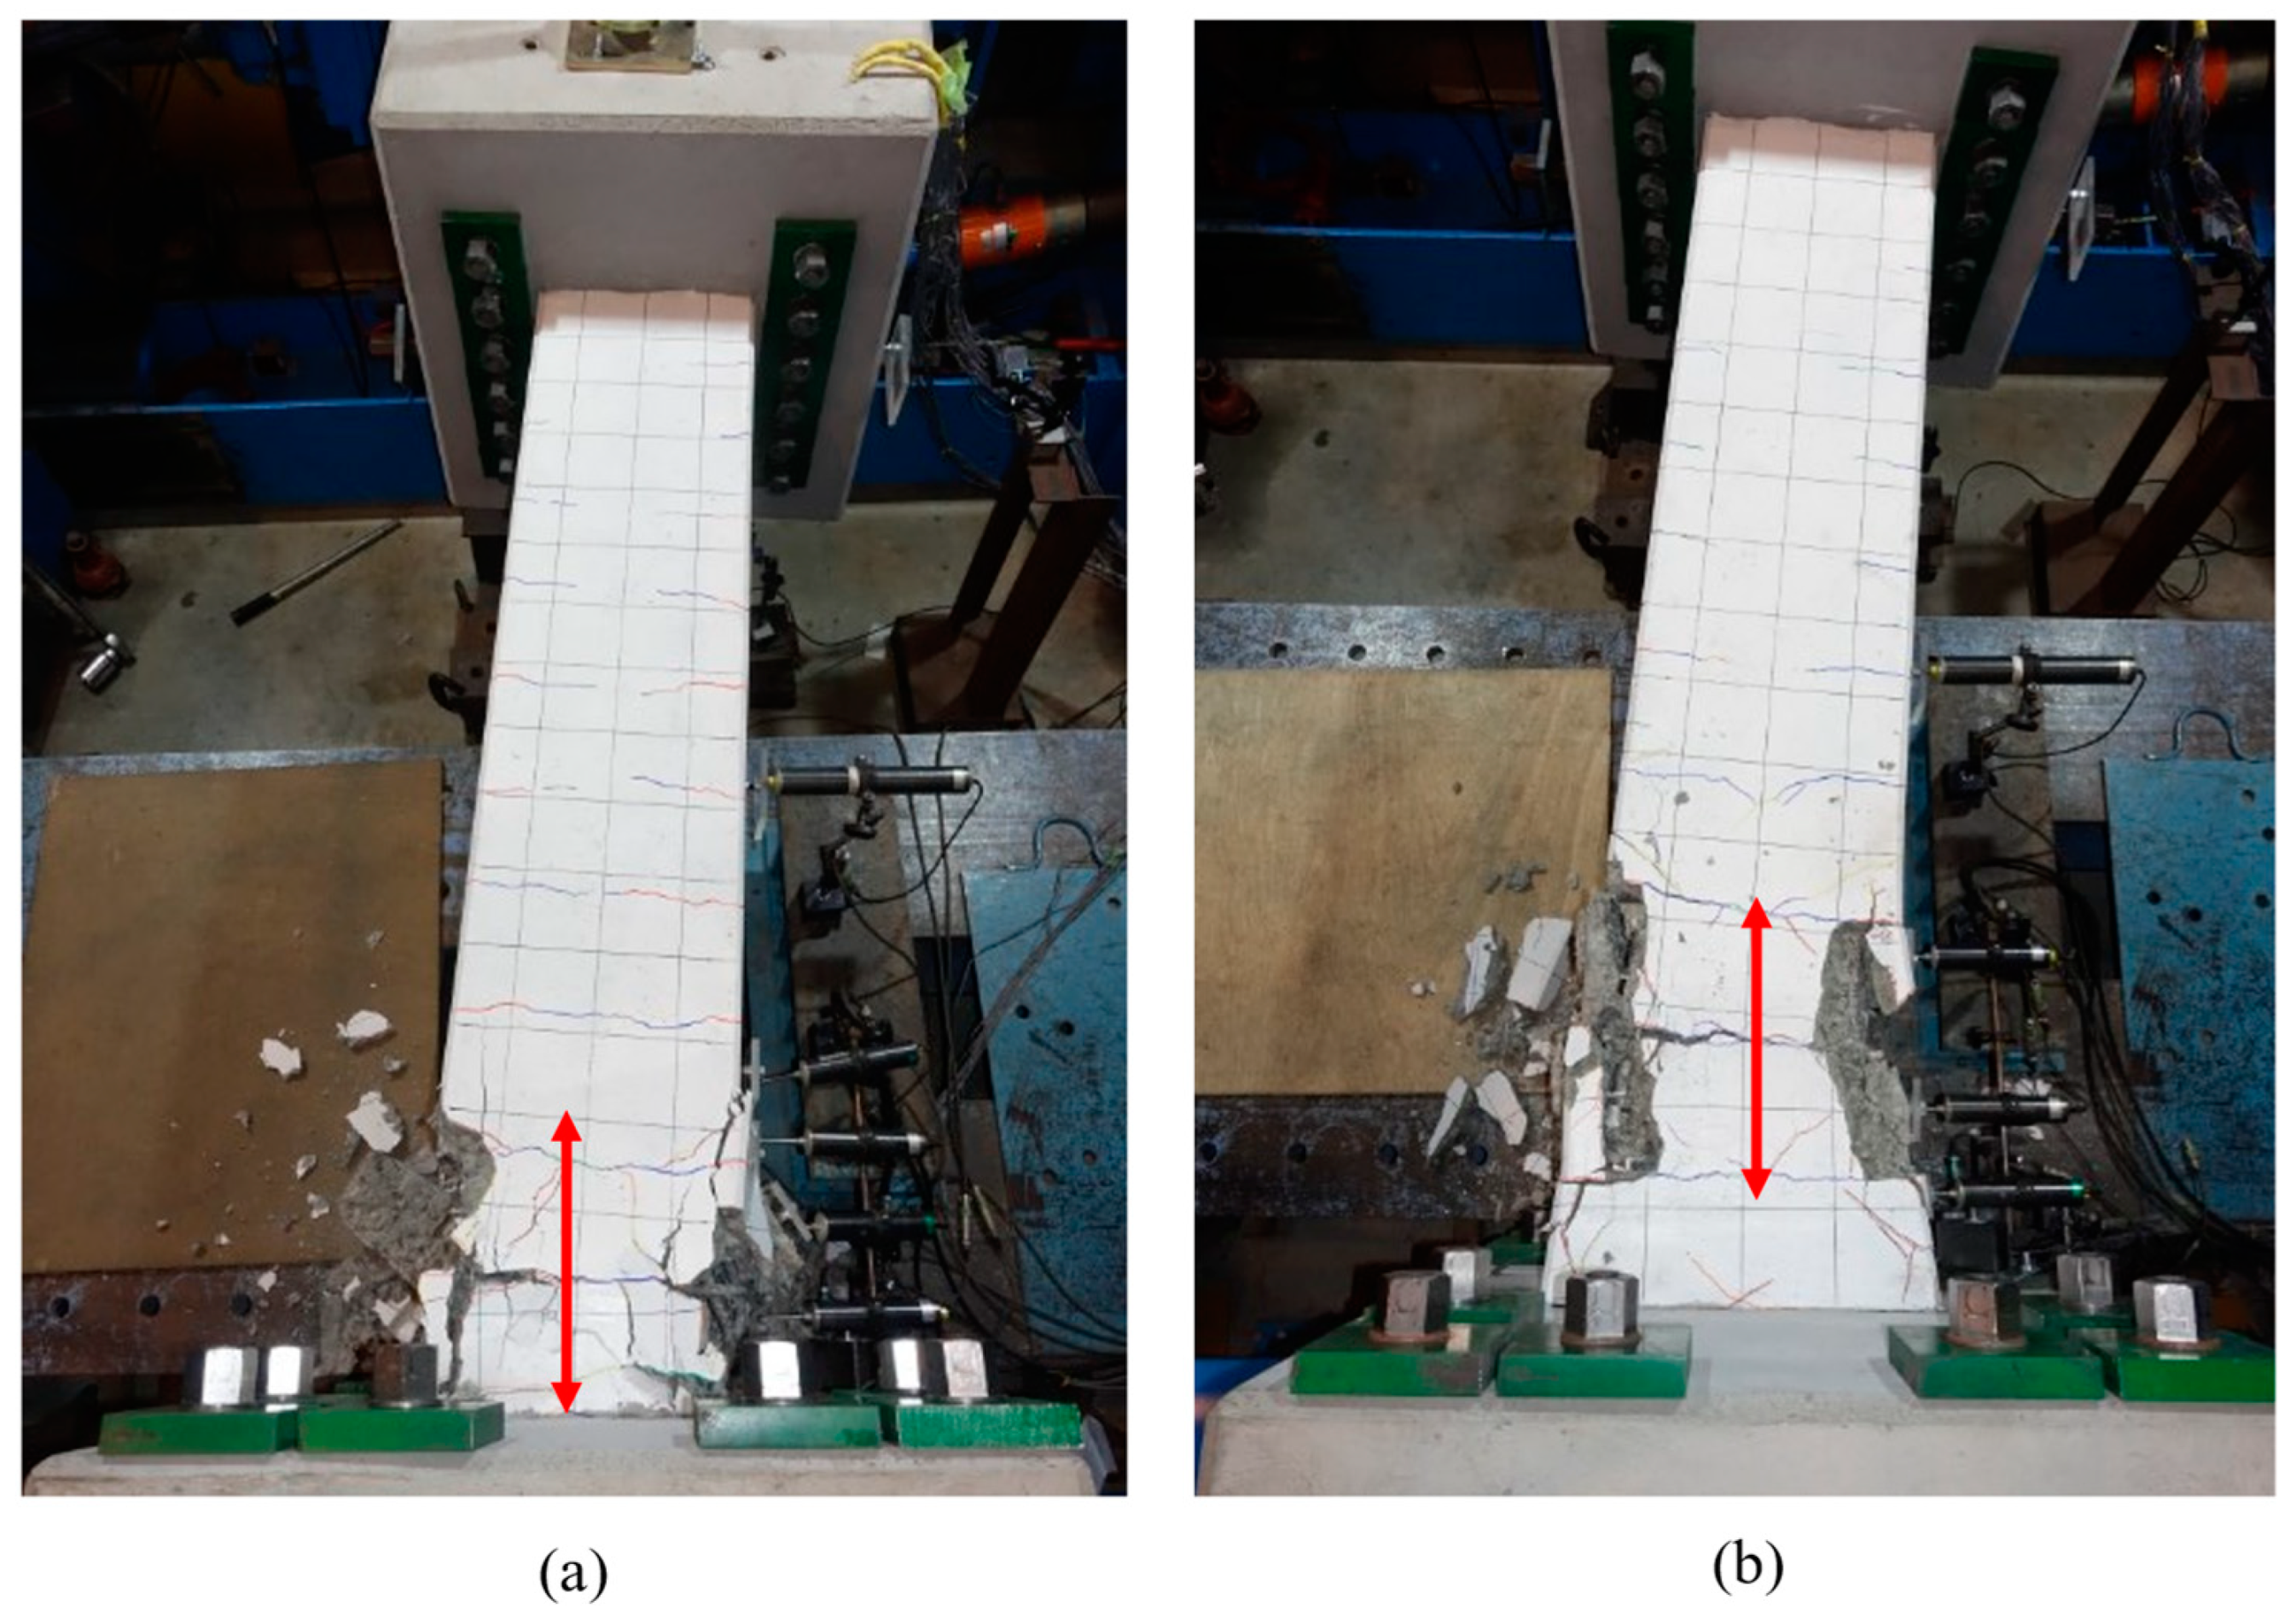
Figure 12 shows the displacements measured at distances of 100, 200, 300, 400, and 800 mm from the footing of Type 1 and Type 2 when each lateral displacement level was reached. The results only included data up to a lateral loading displacement of 5 δ y due to spalling of concrete. As shown in Figure 12a, for Type 1, the displacements measured within 100 mm from the footing were greater than zero, indicating the plastic hinge zone initiated near the footing. However, as depicted in Figure 12b, for Type 2, the horizontal displacements measured within 200 mm from the footing were almost zero. Beyond this range, horizontal displacement became apparent, suggesting that the plastic hinges for Type 2 were located farther from the footing. Additionally, as the red arrows illustrated in Figure 13, the severe damage zone for Type 1 was near the footing, whereas, for Type 2, it occurred at a distance from the footing. This suggested that the pre-deformation and curvature of the main bars could influence the position of the plastic hinge of the pier. For Type 1, the difference caused by the bending moment increases linearly with depth, resulting in maximum stress at the bottom where a plastic hinge forms due to the constant cross-section. In contrast, for Type 2, the cross-sectional area increases near the base, which enhances stiffness and shifts the location of maximum stress upward, away from the footing.

4.3. Hysteresis Curves

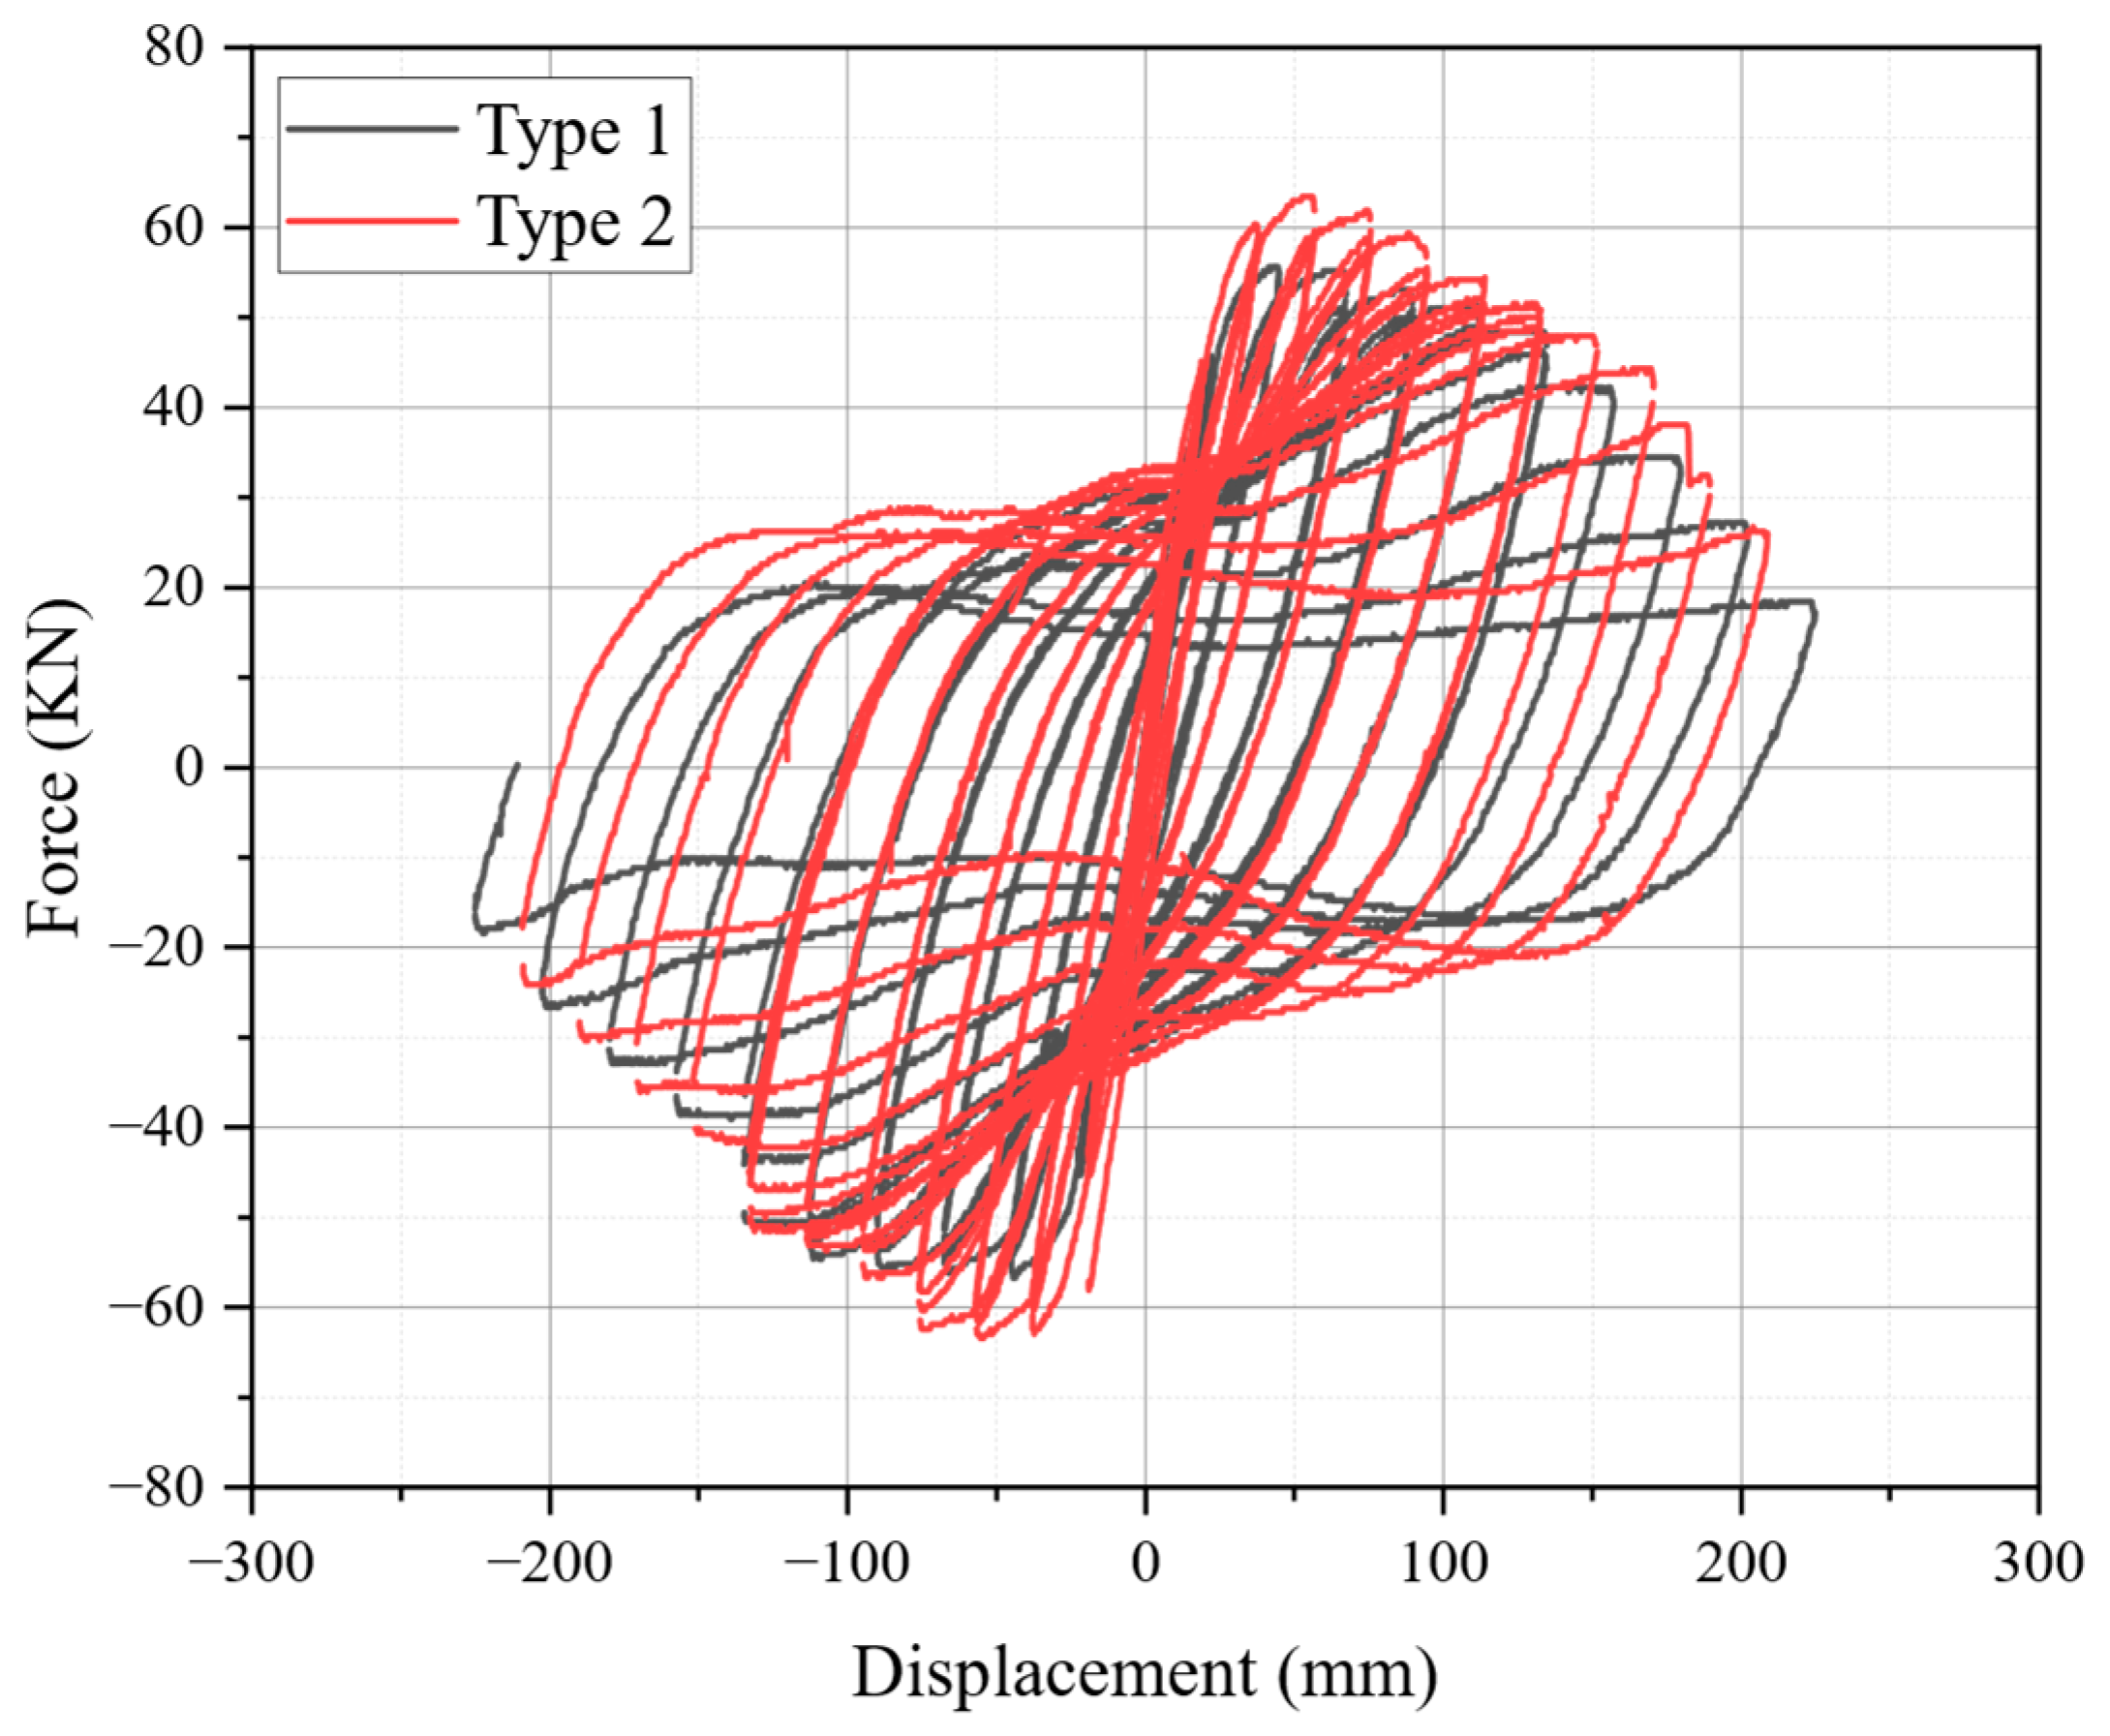
Figure 14 showed a detailed comparison of hysteresis curves between Type 1 and Type 2. Both types exhibited stable hysteretic behaviors, characterized by S-shaped hysteresis loops with pinching responses as lateral displacement increased. Additionally, the hysteresis curves of both piers were nearly centrosymmetric overall, indicating similar mechanical properties under reverse cyclic lateral displacement. However, due to the rupture of longitudinal reinforcement in Type 2, a sharp decline in curve was observed at 10 δ y . The terminal displacements for Type 1 and Type 2 were 10 δ y and 11 δ y , respectively, suggesting that pre-deformation could influence the terminal displacement. Furthermore, Type 2 exhibited slightly higher initial stiffness and load-bearing capacity, which can be attributed to the enlarged cross-section near the footing This increased stiffness is advantageous in resisting early-stage deformations. The energy dissipation capacity of the structure, a key parameter for assessing the pier’s resilience, could be quantitatively represented by the envelope area of the hysteresis curves. As depicted in Figure 14, under the same displacement load, the areas enclosed by the hysteresis curves for Type 2 were marginally larger than those for Type 1, particularly in the positive direction. This indicates that the use of pre-deformed steel bars in Type 2 enhanced the structure’s ability to dissipate energy, a noteworthy advantage for designing structures that require improved resilience and durability.

4.4. Skeleton Curve

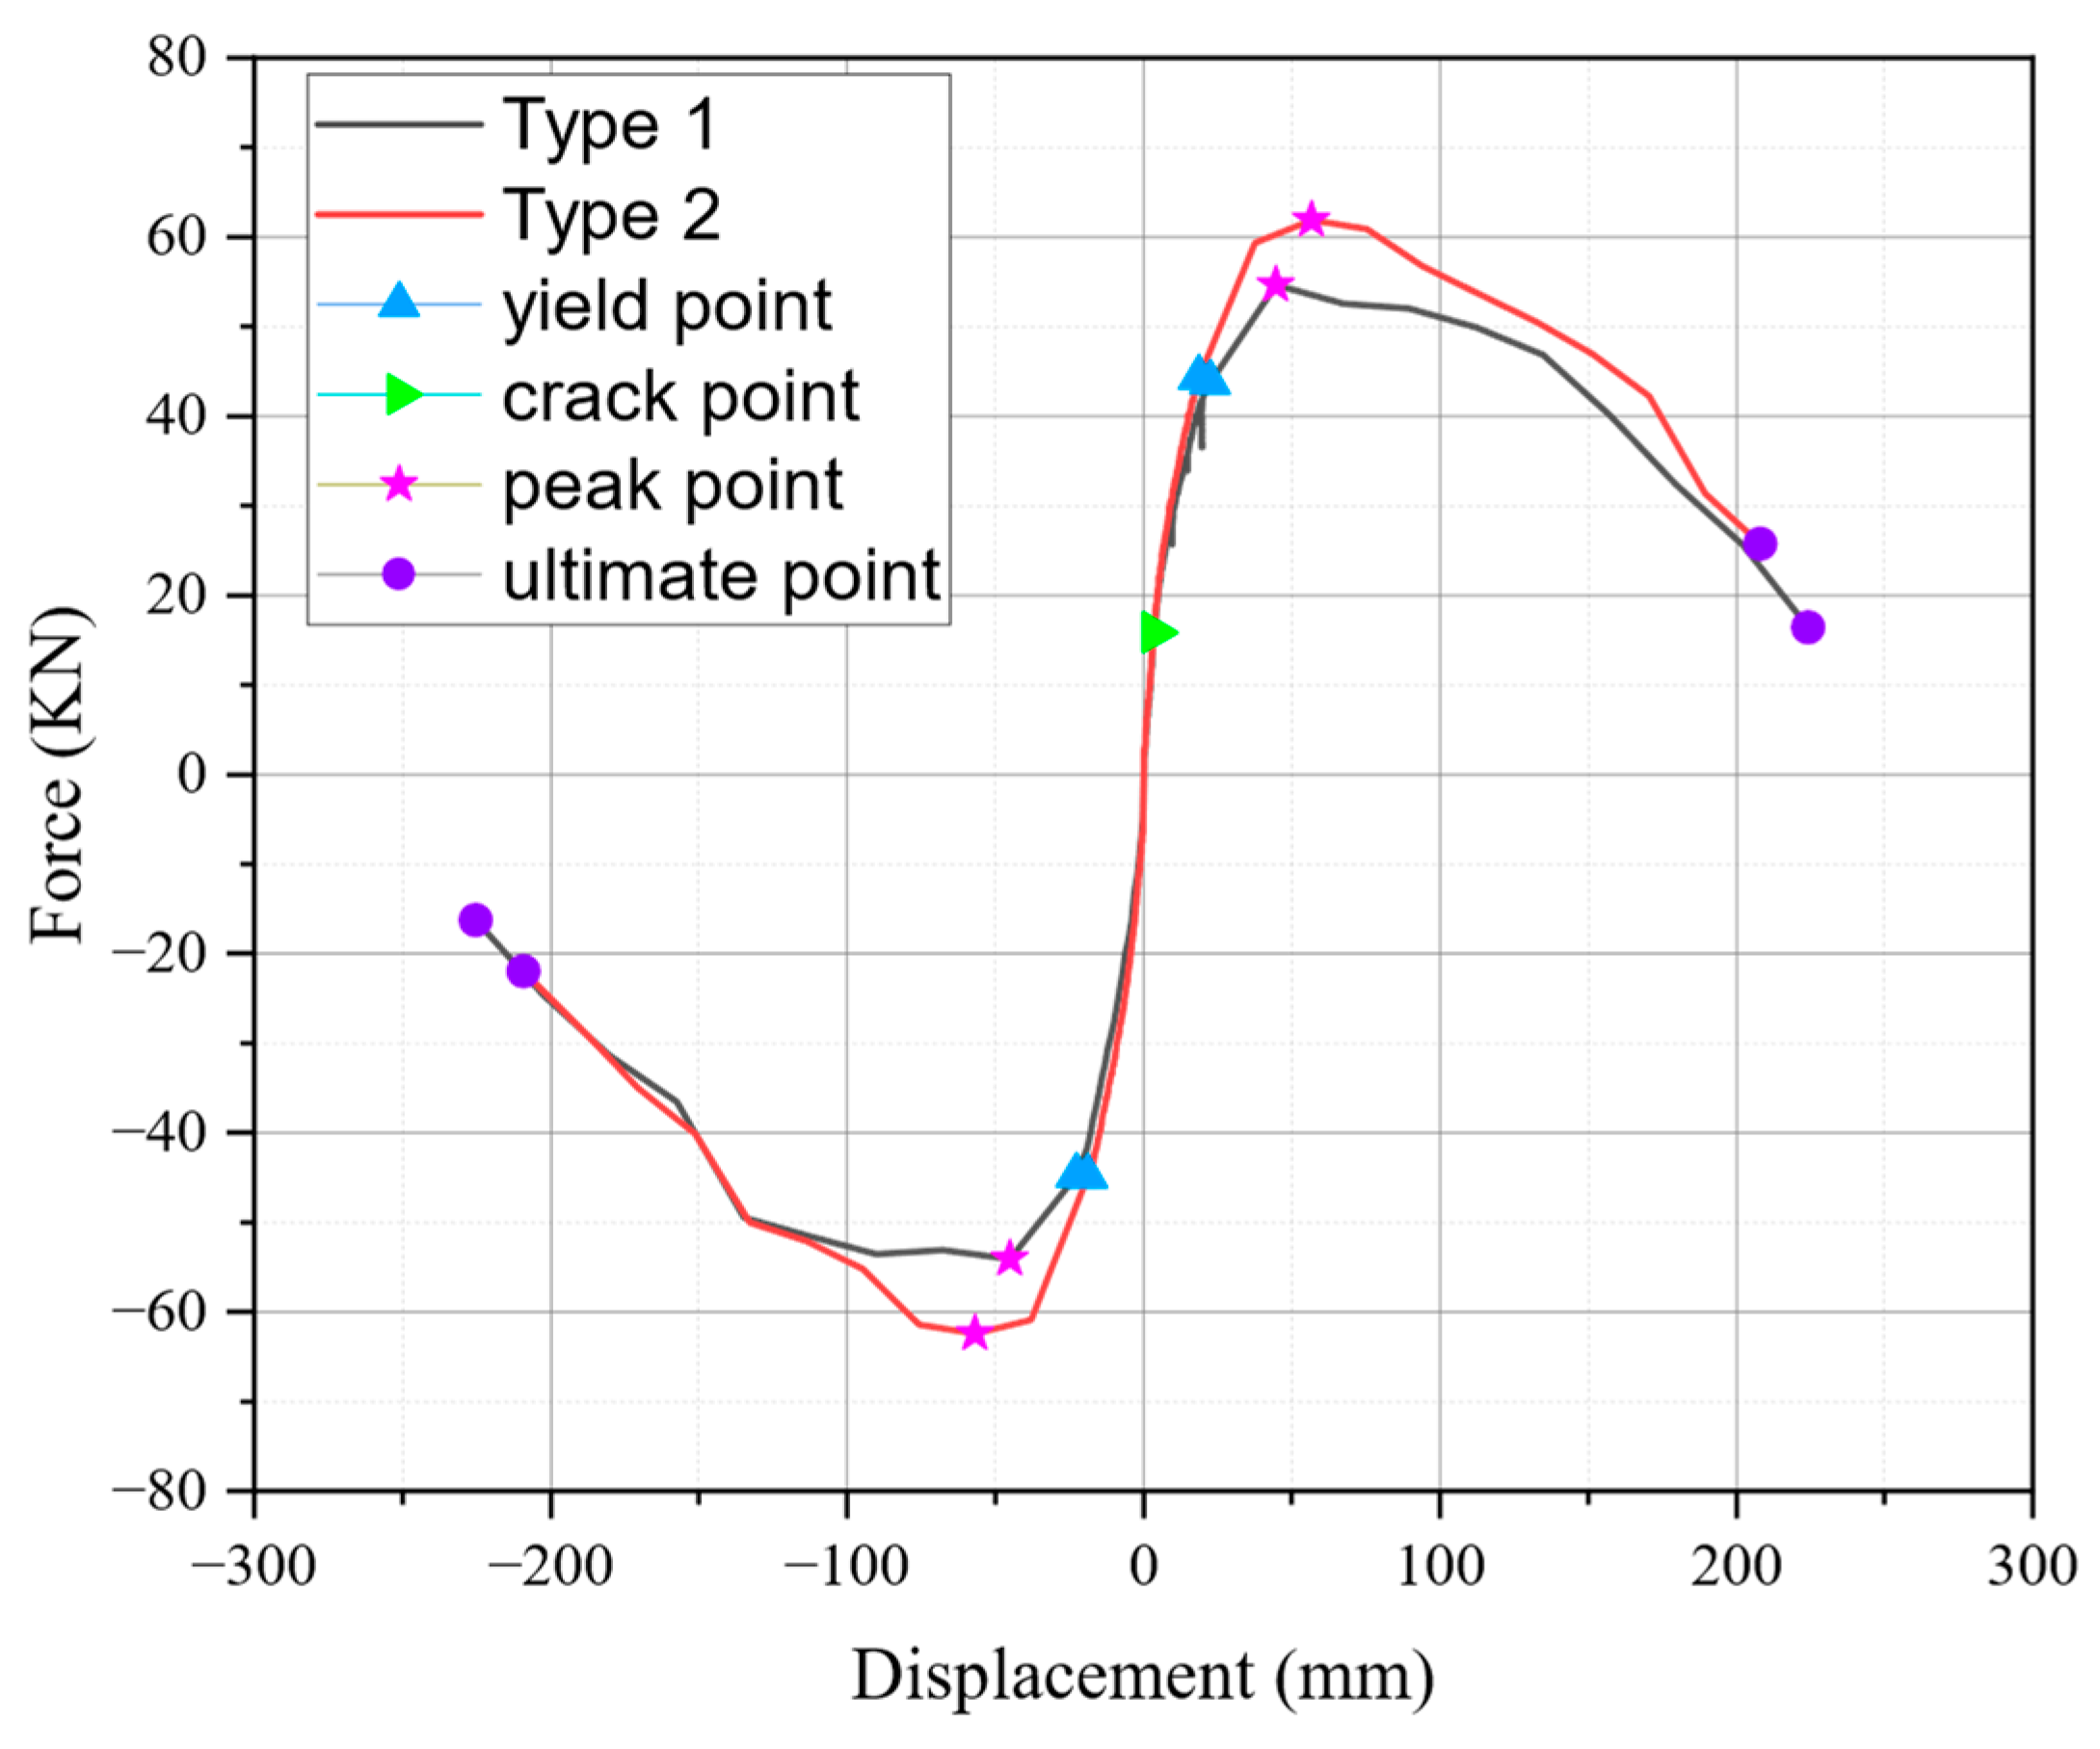
The skeleton curves were derived from the enveloping of the hysteretic curves by tracing the path of successive peak loading points at each loading displacement level. These curves provide insight into the bearing capacity, ductility, stiffness, and energy absorption characteristics [29,30]. Figure 15 compares the skeleton curves for Type 1 and Type 2. These curves exhibited four distinct stages: elastic, elastic-plastic, plastic, and failure. The ultimate point marked the stage when the pier lost half of its peak lateral load resistance. During the elastic stage, as depicted in the skeleton curves, the crack points for Type 1 and Type 2 were nearly identical, with the elastic lines of the two specimens almost overlapping. This suggested minimal differences in elasticity between Type 1 and Type 2 during this stage. As the specimens transitioned into the elastic-plastic stage, crack width and numbers increased with lateral displacement, while the initial stiffness of Type 2 surpassed that of Type 1. The plastic stage commenced upon reaching the yield point, where Type 2 exhibited higher bearing capacity than Type 1 in both positive and negative directions, with Type 2 showing a 14% higher average peak lateral load resistance. This difference persisted in the positive direction from the peak to the ultimate point. However, beyond a lateral displacement of −6 δ y , the disparities between Type 1 and Type 2 in the negative direction became negligible. Ultimately, the ultimate displacement of Type 1 exceeded that of Type 2.

4.5. Stiffness Degradation

To quantify the response of piers, it is imperative to establish response indices that provide a quantitative description of the behaviors of piers. Stiffness degradation is attributed to the inelastic behaviors of the pier, such as steel bar yielding and flexural cracking [31]. As Figure 2 shows, stiffness refers to the cut-line stiffness for each displacement amplitude, i.e., the slope of the line from the origin to the maximal lateral loads under the relative displacement amplitude. In this study, the stiffness was defined as
K i = + F i + F i + δ i + δ i
where + F i and − F i were the positive and negative maximal lateral loads under relative loading level; + δ i and − δ i were the corresponding displacements. The stiffness of both piers is listed in Table 3.
For comparison, both calculated stiffness and displacement were normalized with respect to the stiffness and displacements of the first loading level, respectively. The relationship between normalized displacement and normalized stiffness ( η ) is illustrated in Figure 16. From this figure, it can be found that all specimens exhibited a similar trend of stiffness degradation. During the whole loading process, the normalized stiffness of Type 1 decreased from 1 to 0.18, with a reduction of 82%. But for Type 2, the corresponding values were 84%. Figure 16 also depicts that the normalized stiffness of Type 1 is not larger than that of type 2. This is because the lateral resistance of Type 2 is better than that of Type 1 when the displacements are same, which is evidence by Figure 14 and Figure 15. The above observation indicates that the overall stiffness of normal pier will be enhanced by using pre-deformed longitudinal reinforcements in potential plastic hinge areas.

4.6. Energy Dissipation

Evaluating elastic-plastic deformation typically involves assessing energy dissipation capacity and ductility parameters. The cumulative energy dissipation could be determined as follows:
E s u m = i = 1 N E i
where N represented the number of loading levels until the lateral load resistance dropped below 80% of peak lateral load; E i denoted the energy dissipation corresponding to ith loading level and was calculated by the area enclosed by the hysteresis hoop, as Figure 2 shows. The accumulated energy dissipation of both specimens is presented in Table 3.
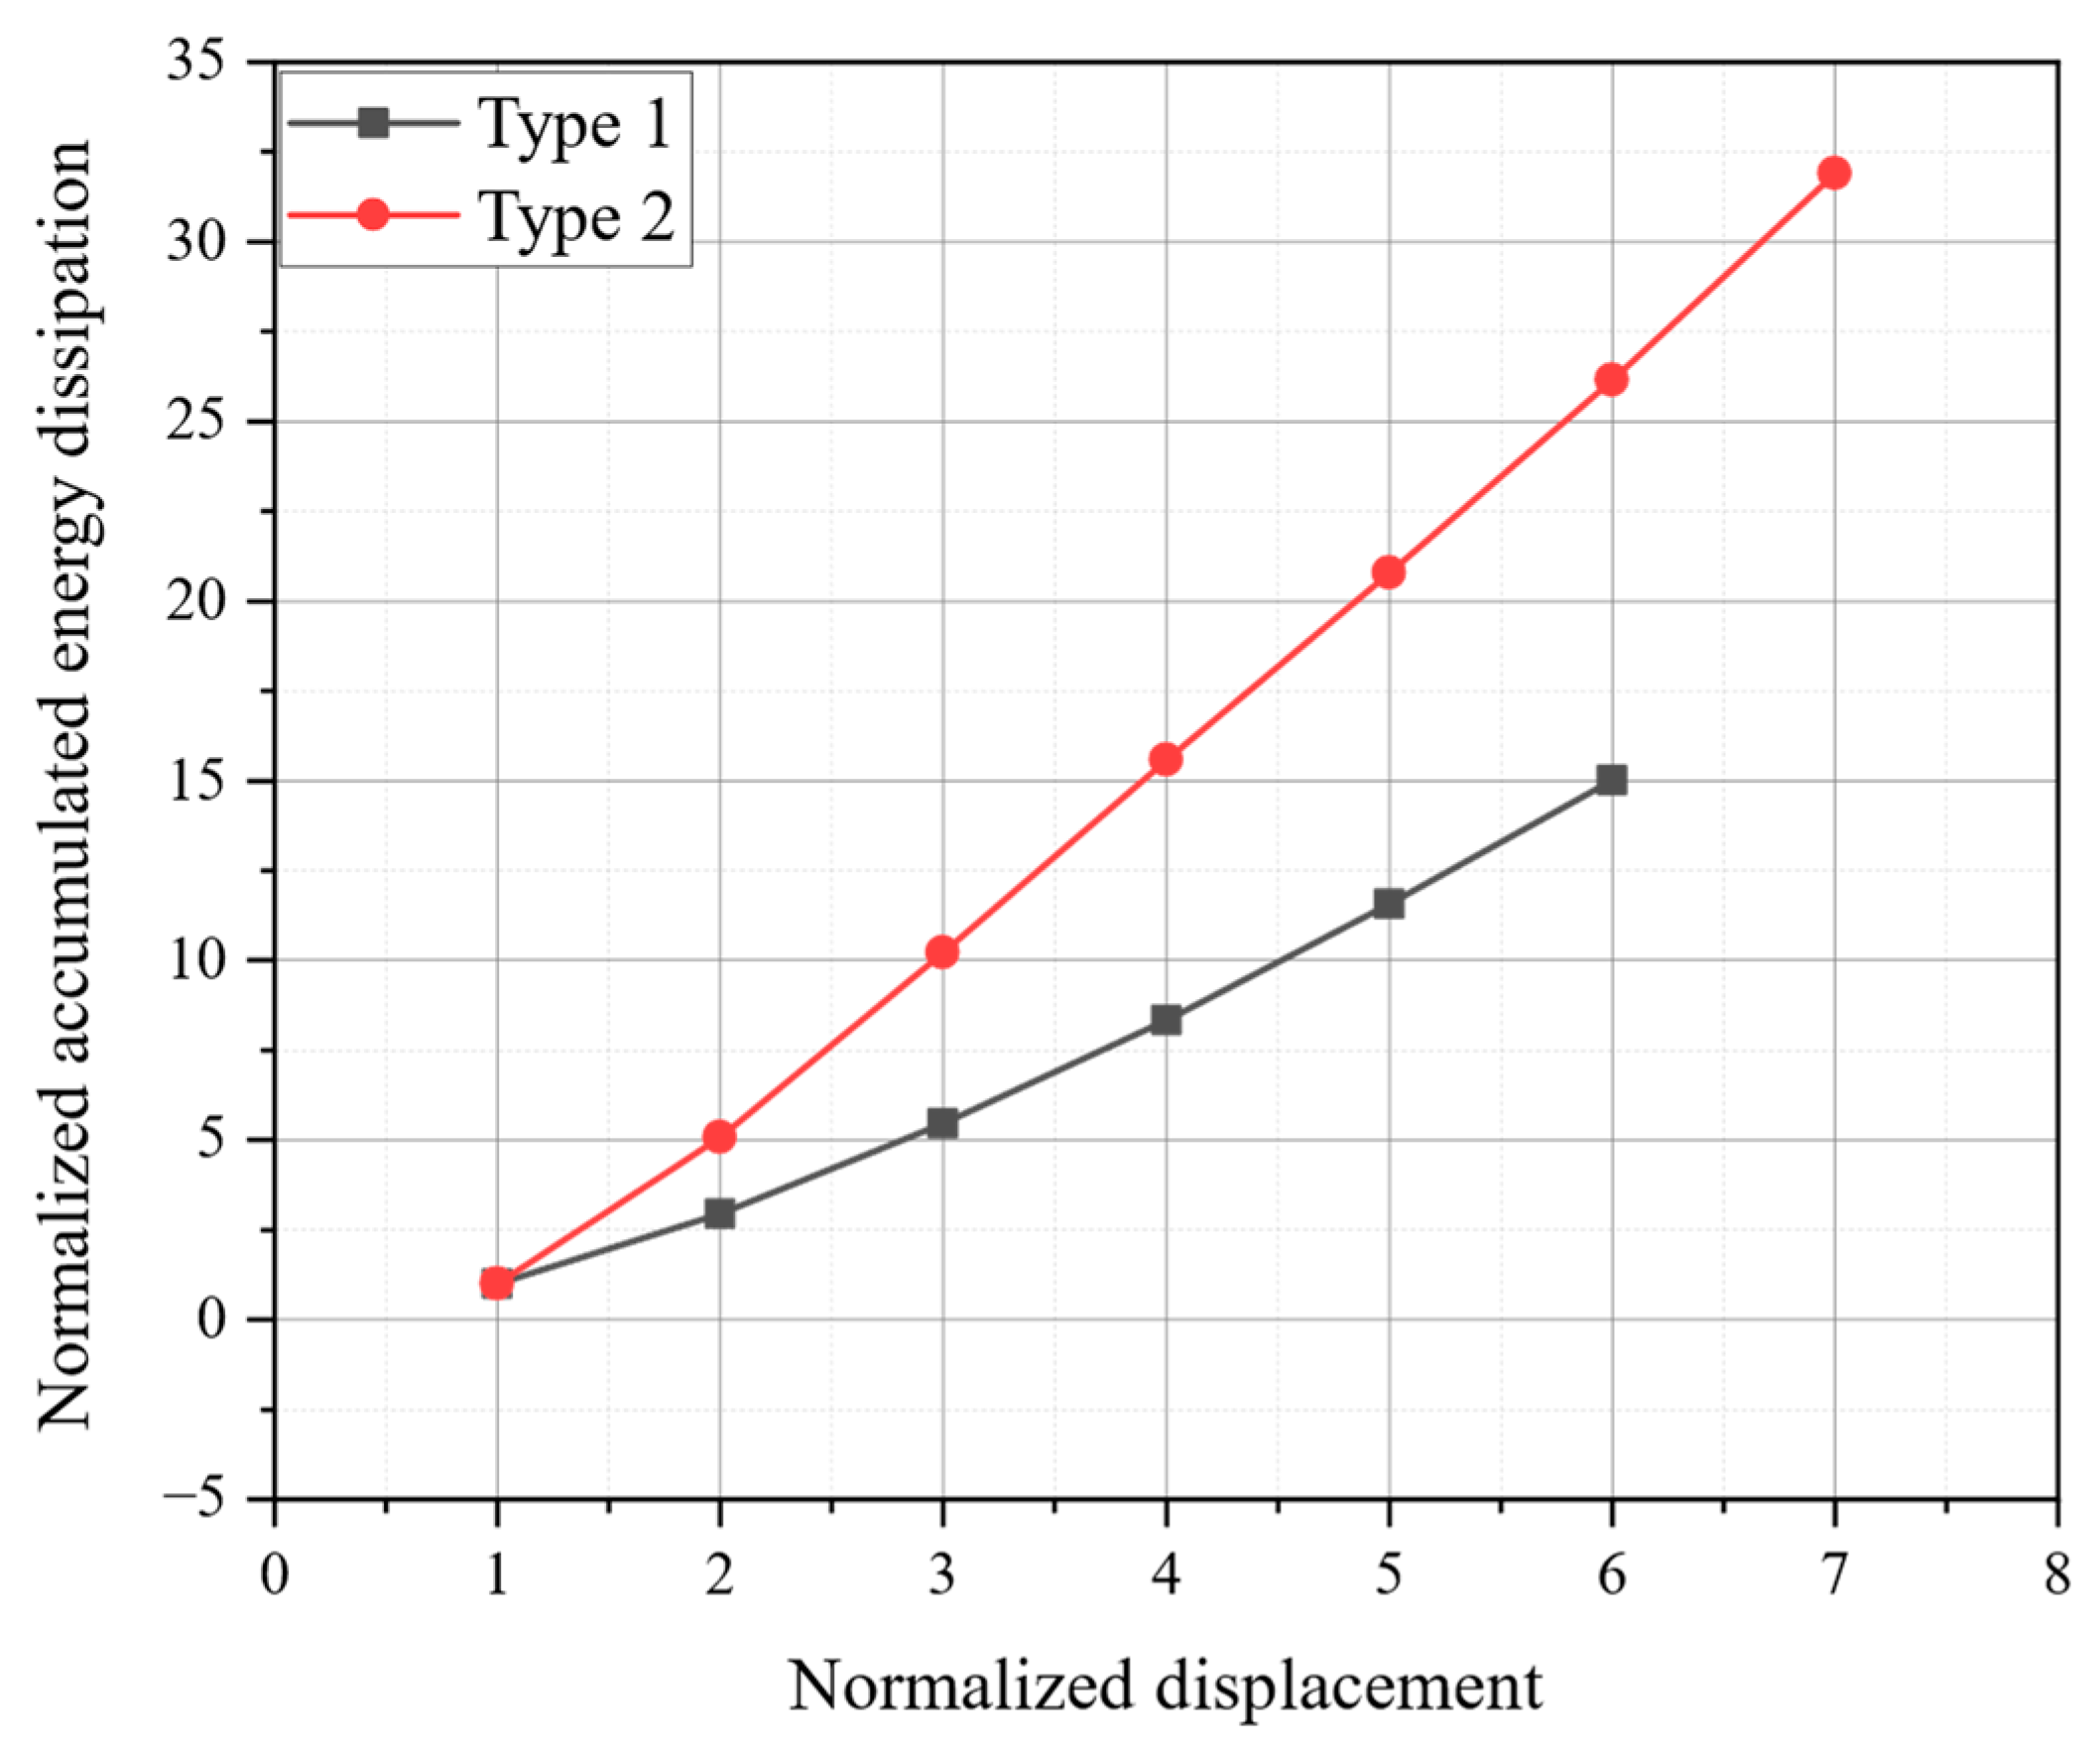
The accumulated energy dissipation reflected the structure’s energy absorption capability, which was related to plastic deformation and cumulative damage [29]. For comparative analysis, the accumulated dissipated energy was normalized with respect to that of the first loading level.
λ c i = E s u m i E 1 , ( i = 1 , 2 , 3 . )
where λ c i represented the normalized dissipated energy. The maximal value of i was determined by the loading level when the lateral load resistance dropped below 80% of peak lateral load resistance. As shown in Figure 17, the normalized accumulated energy dissipation of Type 2 exhibited an advantage.

4.7. Ductility Analysis

The ductility factor can assess the ability of a pier to withstand significant deformations during an earthquake. As described by Equation (1), the ductility factor equaled the ratio of the average displacement δ d at 80% of the peak lateral load resistance to the yield displacement δ y . As presented in Table 4, the ductility factors μ were approximately 6.47 and 7.19 for Type 1 and Type 2, respectively. The ductility of Type 2 was enhanced.

5. Finite Element Analysis

5.1. Overview of the Finite Element Model and Loading History

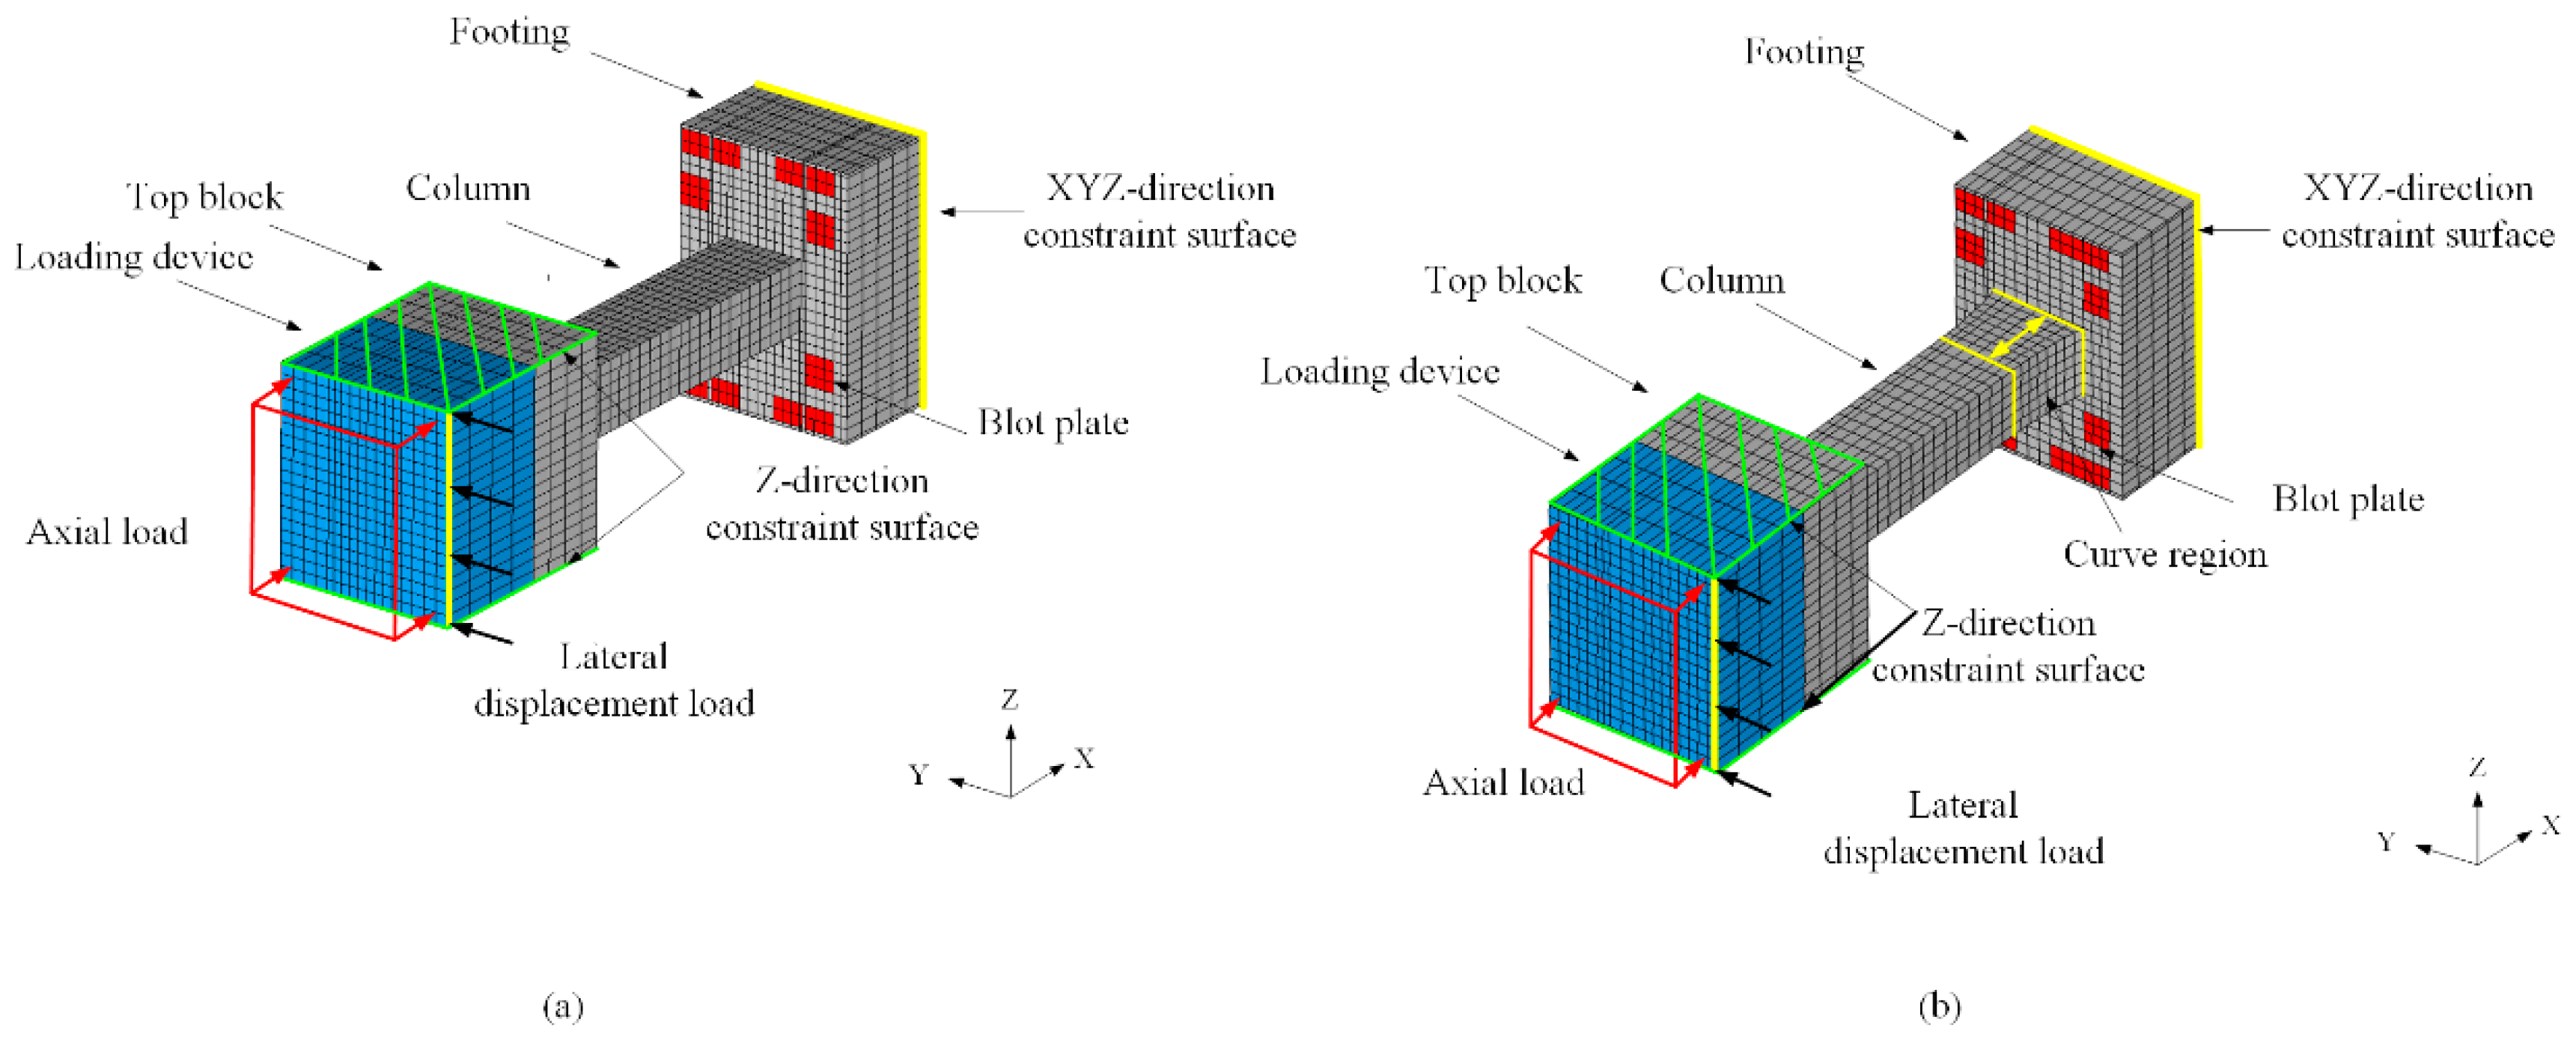
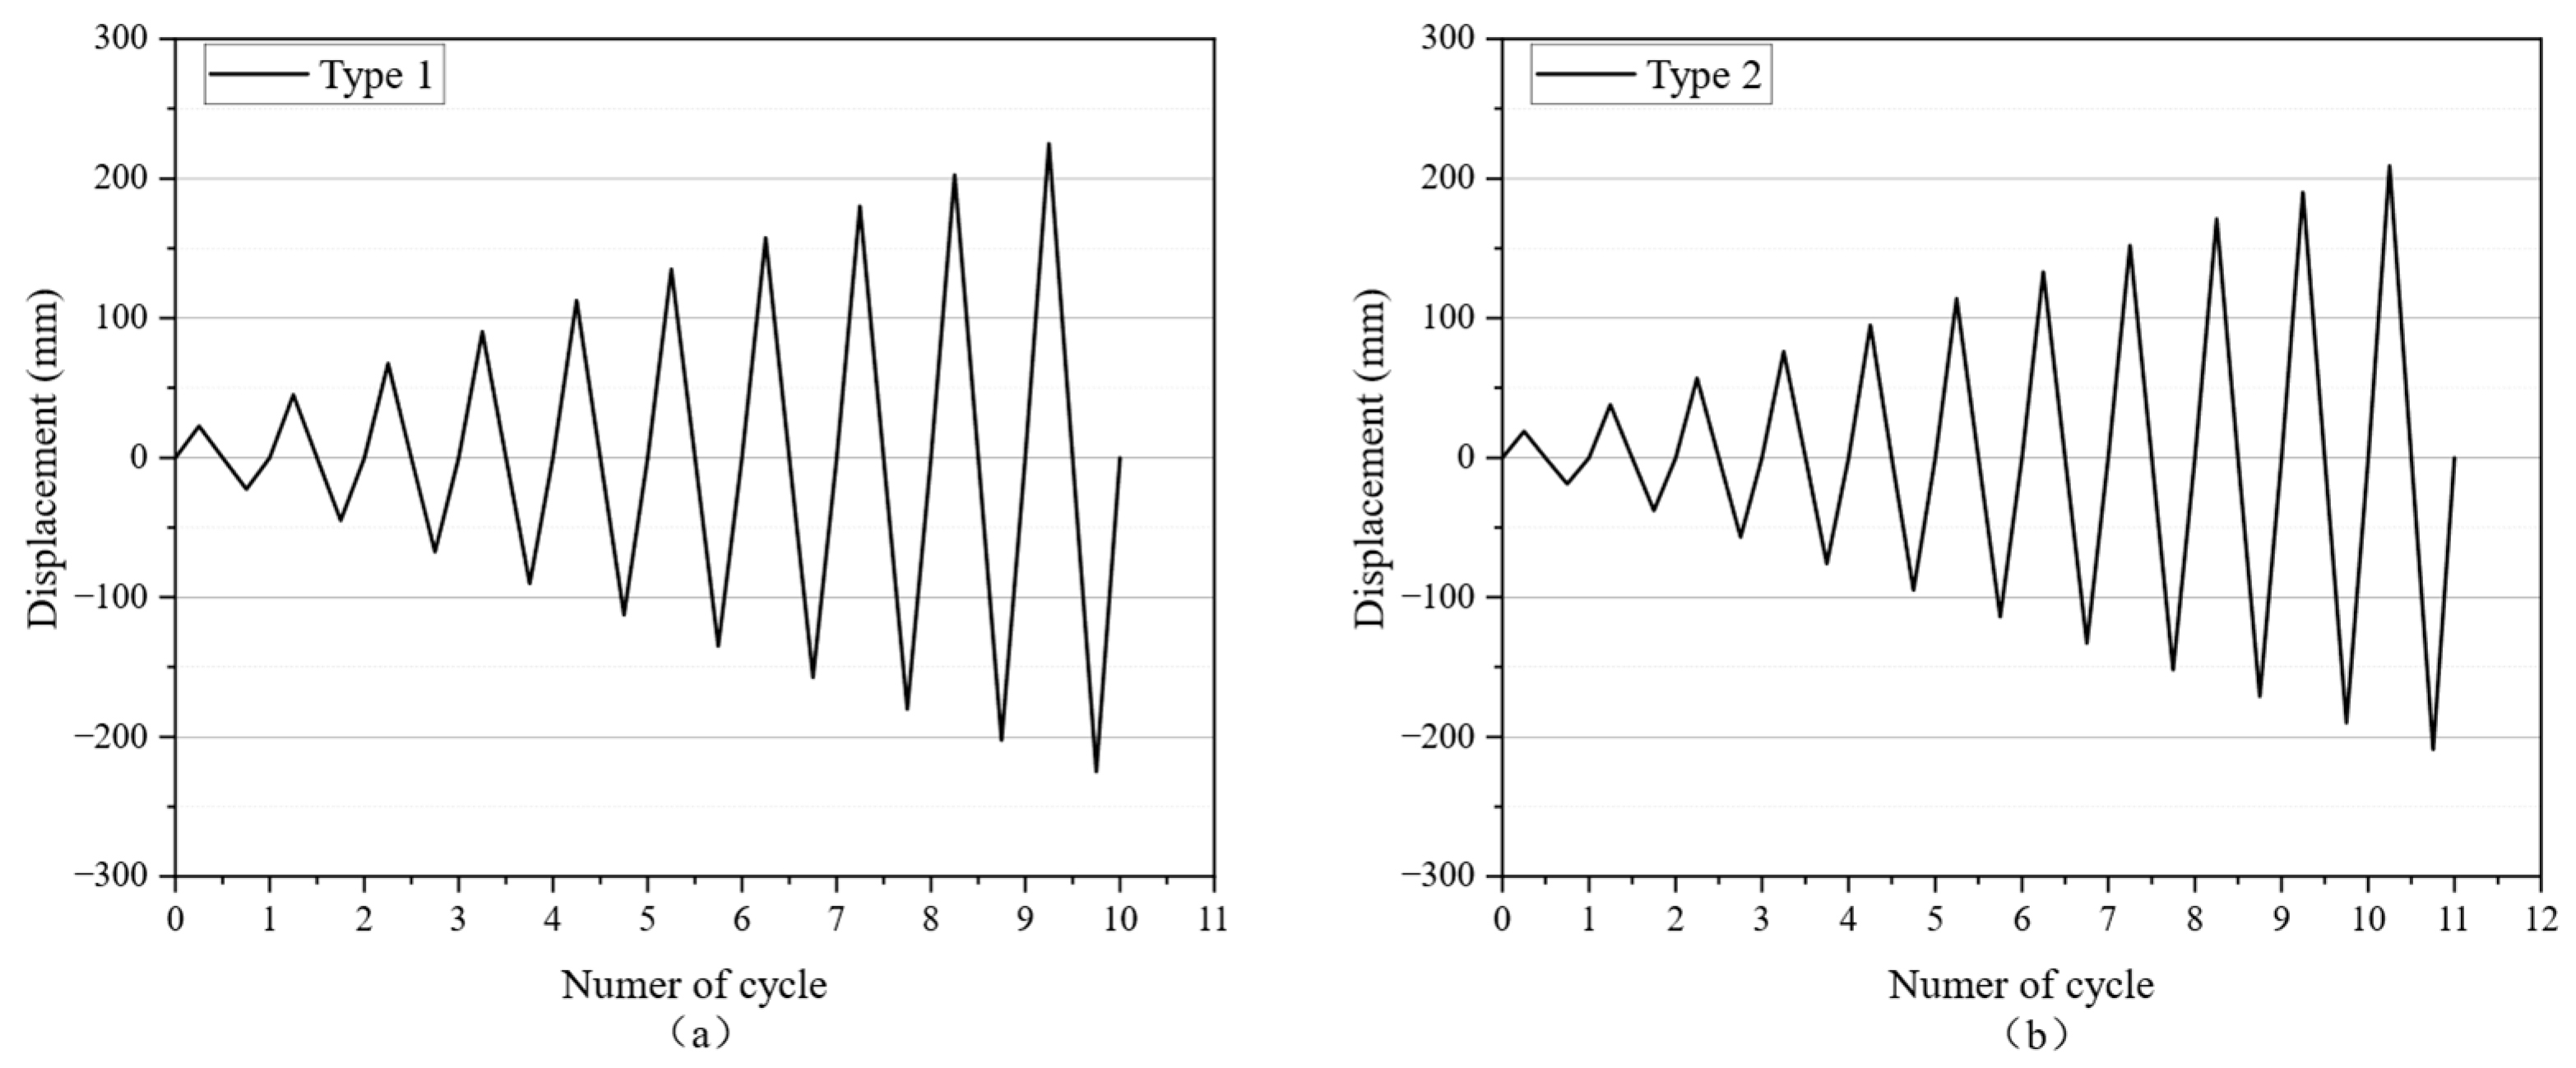
The numerical model was developed by DIANA 10.5. Three-dimensional (3D) nonlinear FEM model of piers were developed, as Figure 18 shows. The loading device, top block, and footing were modeled using a 20-node structural solid. Out of simplicity, the mechanical part of the loading device was modeled by an elastic rigid body. The main rebars and transverse were modeled by a truss bond-slip bar. The models were subjected to two stages of applied forces. Firstly, the constant axial compressive loads were added on the face of the loading device in the X direction. Then, the cyclic lateral load controlled by displacements was applied in the Y direction on one edge of the loading device. To simplify the loading history in simulation, the number of cycles in each lateral displacement phase was conducted only once, as Figure 19 shown. The Newton–Raphson method was adopted to calculate the nonlinear equations with a maximum of 100 iterations, and displacement and force norm (convergence tolerance = 0.01) were taken as convergence criteria.

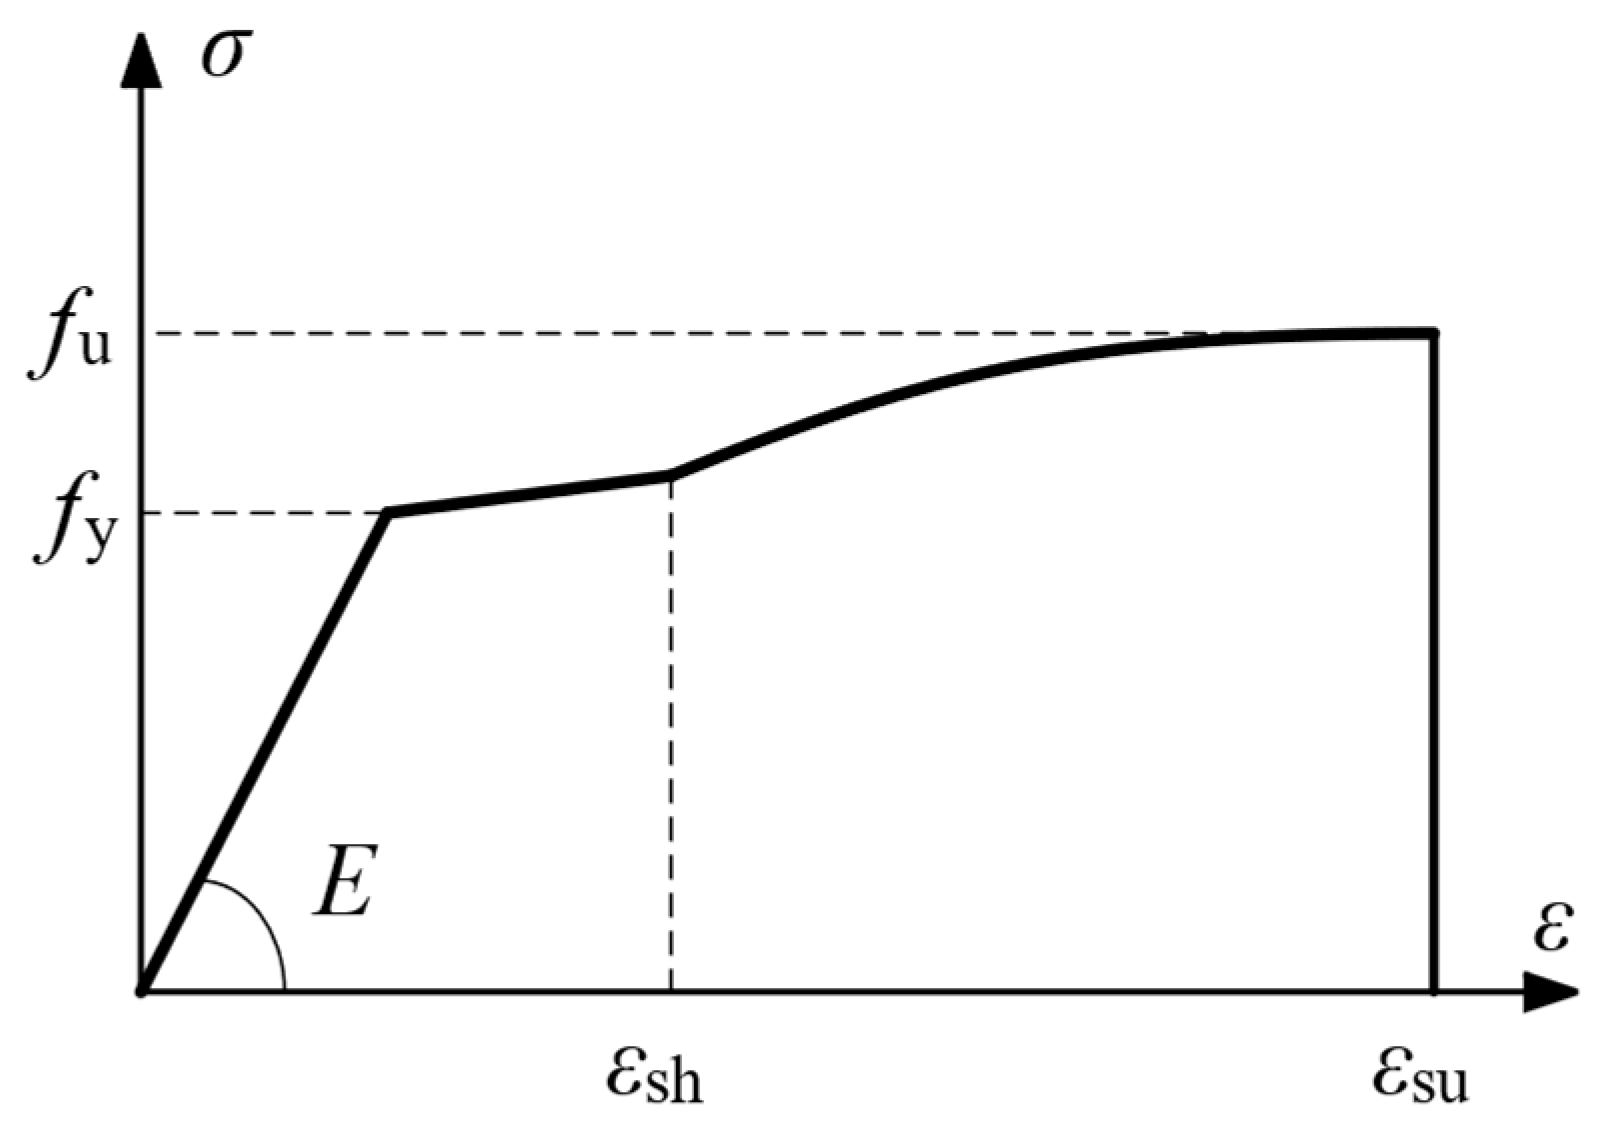
5.2. Material Model

5.2.1. Concrete

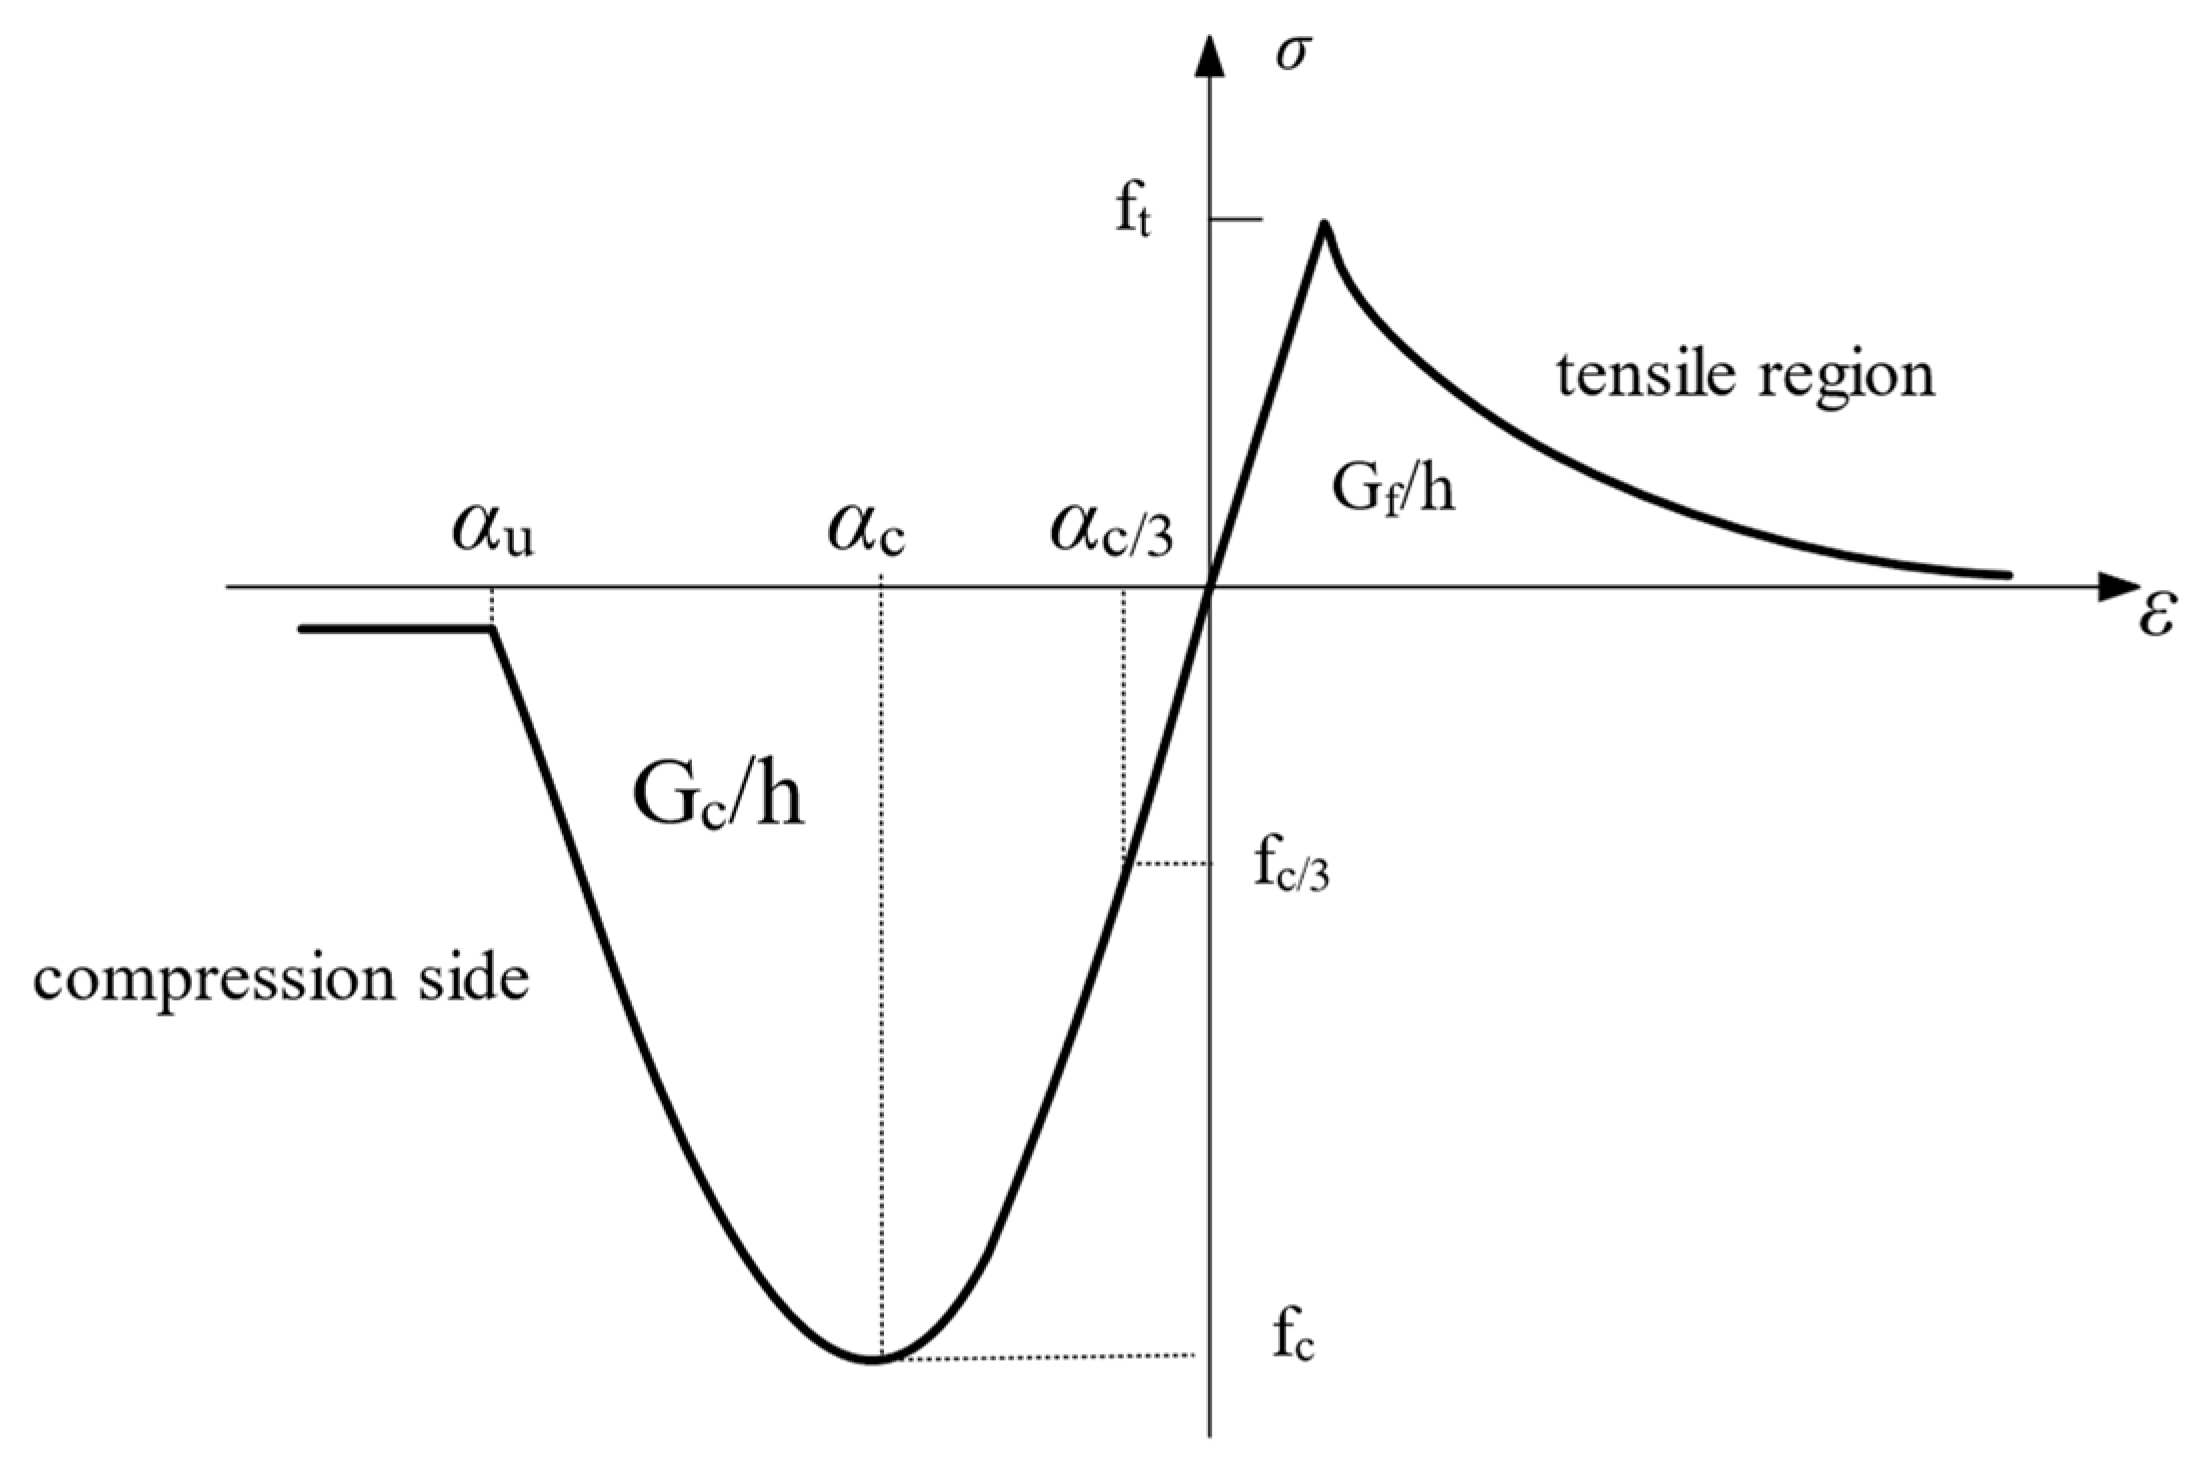
A total strain rotating crack model with parabolic behaviors for compression defined by Feenstra and exponential softening for tensile [31] was employed to simulate concrete behaviors. The total strain rotating crack model was based on the modified strain field theory, which was originally proposed by Vecchio and Collins [32], and further extended for 3D application by Selby and Vecchio [33].
The total strain rotating crack model is modeled in two different ways. The rotating crack model, as one of the total strain crack model categories, has been widely adopted and is well suited for RC structure. The approach is independent of the direction of the previous crack. It is a more accurate representation of the crack pattern compared with other categories of the total crack model, the fixed crack approach. Therefore, the rotating approach was applied to concrete in this study. In this study, the compression behaviors were considered as recommended by the predefined parabolic function, as Figure 20 shows. The curve was described by three characteristic strains corresponding to the maximum compressive strength f c . The first was the strain ( α c / 3 ), at which, one third of the maximum compressive strength was reached. The second one was α c , when the maximum compressive strength was reached. The last one was ultimate strain αu in compression, which meant the material was completely softened. The three values could be obtained from Equations (18)–(20).
α c / 3 = 1 3 f c E
α c = 5 3 f c E = 5 α c / 3
α u = m i n ( α c 3 2 G C h f c , 2.5 α c )
Table 5 summarizes the material parameters for concrete. The tensile fracture energy was calculated from FIB Model code 2010 [34], as shown in Equation (21). G f was the tensile fracture energy. As for compressive fracture energy, G c was characterized by Equations (22) and (23), where f c k is the characteristic cylinder compressive strength and f c m means the compressive strength. It was assumed that the compressive strength f c was equal to the characteristic cylinder compressive strength f c k .
G f = 0.073 f c m 0.18
G c = 250 × 0.073 f c m 0.18
f c m = f c k + 8 M P a

5.2.2. Rebars

The stress–strain relationship for steel bars is characterized by the Dodd–Restrepo model based on isotropic plasticity [35], as Figure 21 shows. The model was a macroscopic model that predicted the cyclic stress–strain behaviors of reinforcement steel and could consider the Bauschinger effect and the fracture behaviors by reducing the stress when the fracture strain was reached. The curve was defined using elastic modulus E , yield strength f y , strain at the end of yield plateau ε s u , peak stress fu, and ultimate strain ε u . In DIANA 10.5, assuming the power P in the strain hardening region was 3.5, the Bauschinger curve constant was 0.75. The relevant material parameters used in the simulation for the steel bar are summarized in Table 6. Due to pre-deformed bars having a residual strain, the strain at the end of the plateau (0.35%) was different from that (1.25%) in straight rebar.
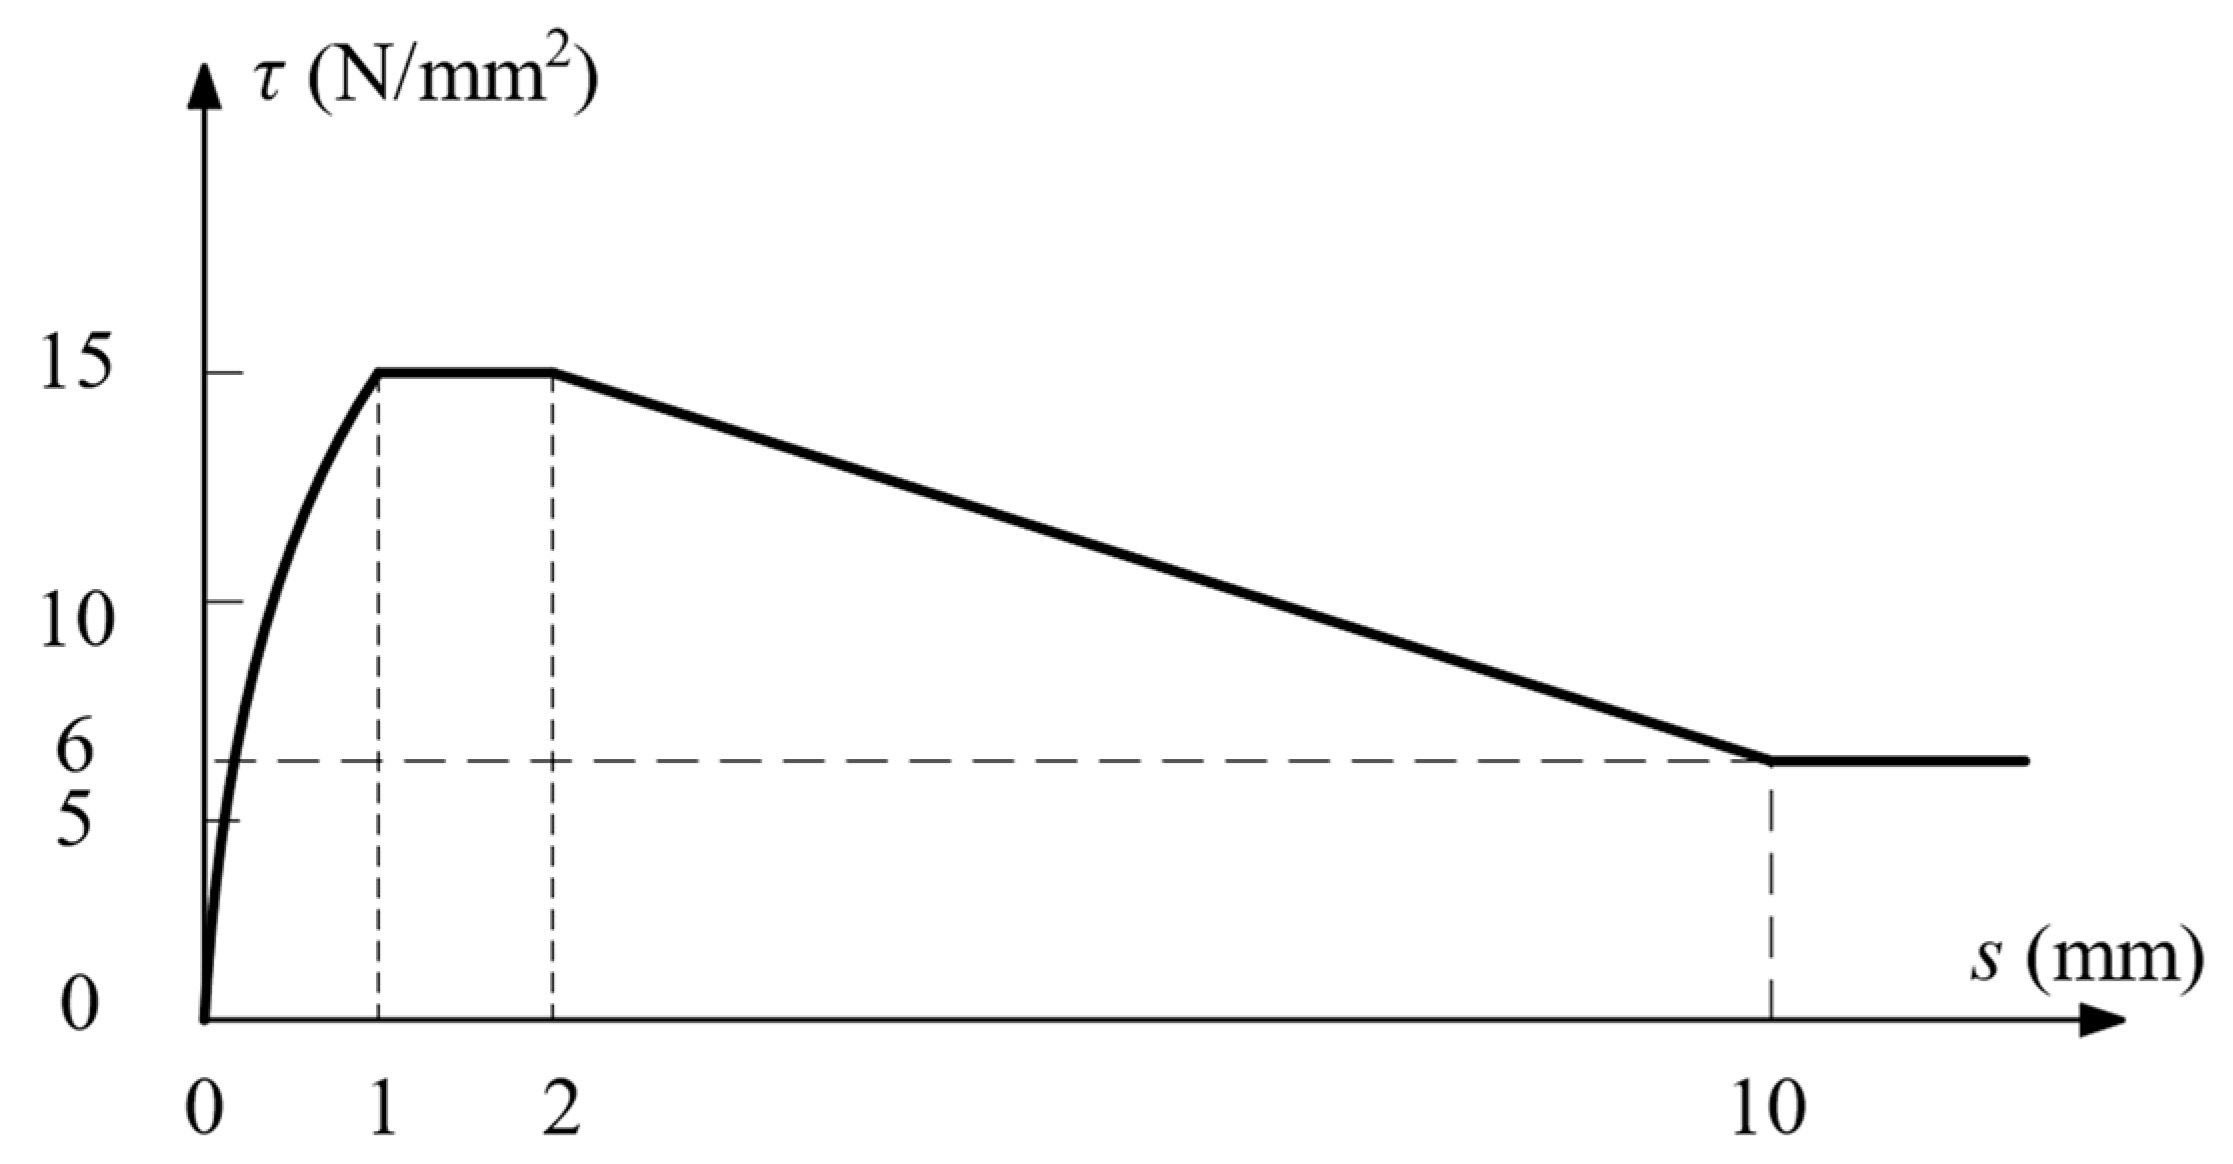
The bonding behaviors between concrete and longitudinal reinforcement, as well as the stirrup, were considered in this investigation. The nonlinear bond-slip interface failure model employed under cyclic loading was characterized by the CEB-FIB 2010 model [34] since the model adequately considered the variation of bond stress under cyclic loading. In the initial phase, the power function of the bond-slip stress τ was developed from 0 to the maximum bond-slip stress τ m a x at the relative slip displacement s 1 . Subsequently, in the second phase, the bond-slip stress τ remained constant at τ m a x until the relative slip displacement s 2 . In the third phase, the bond-slip stress τ was decreased linearly to the ultimate bond-slip stress τ f at the relative slip displacement s 3 . Post the relative slip displacement s 3 , the bond-slip stress τ maintained a constant value at τ f . The pertinent material parameters for concrete are presented in Table 7 and Figure 22.

5.3. Validation of the Numerical Model

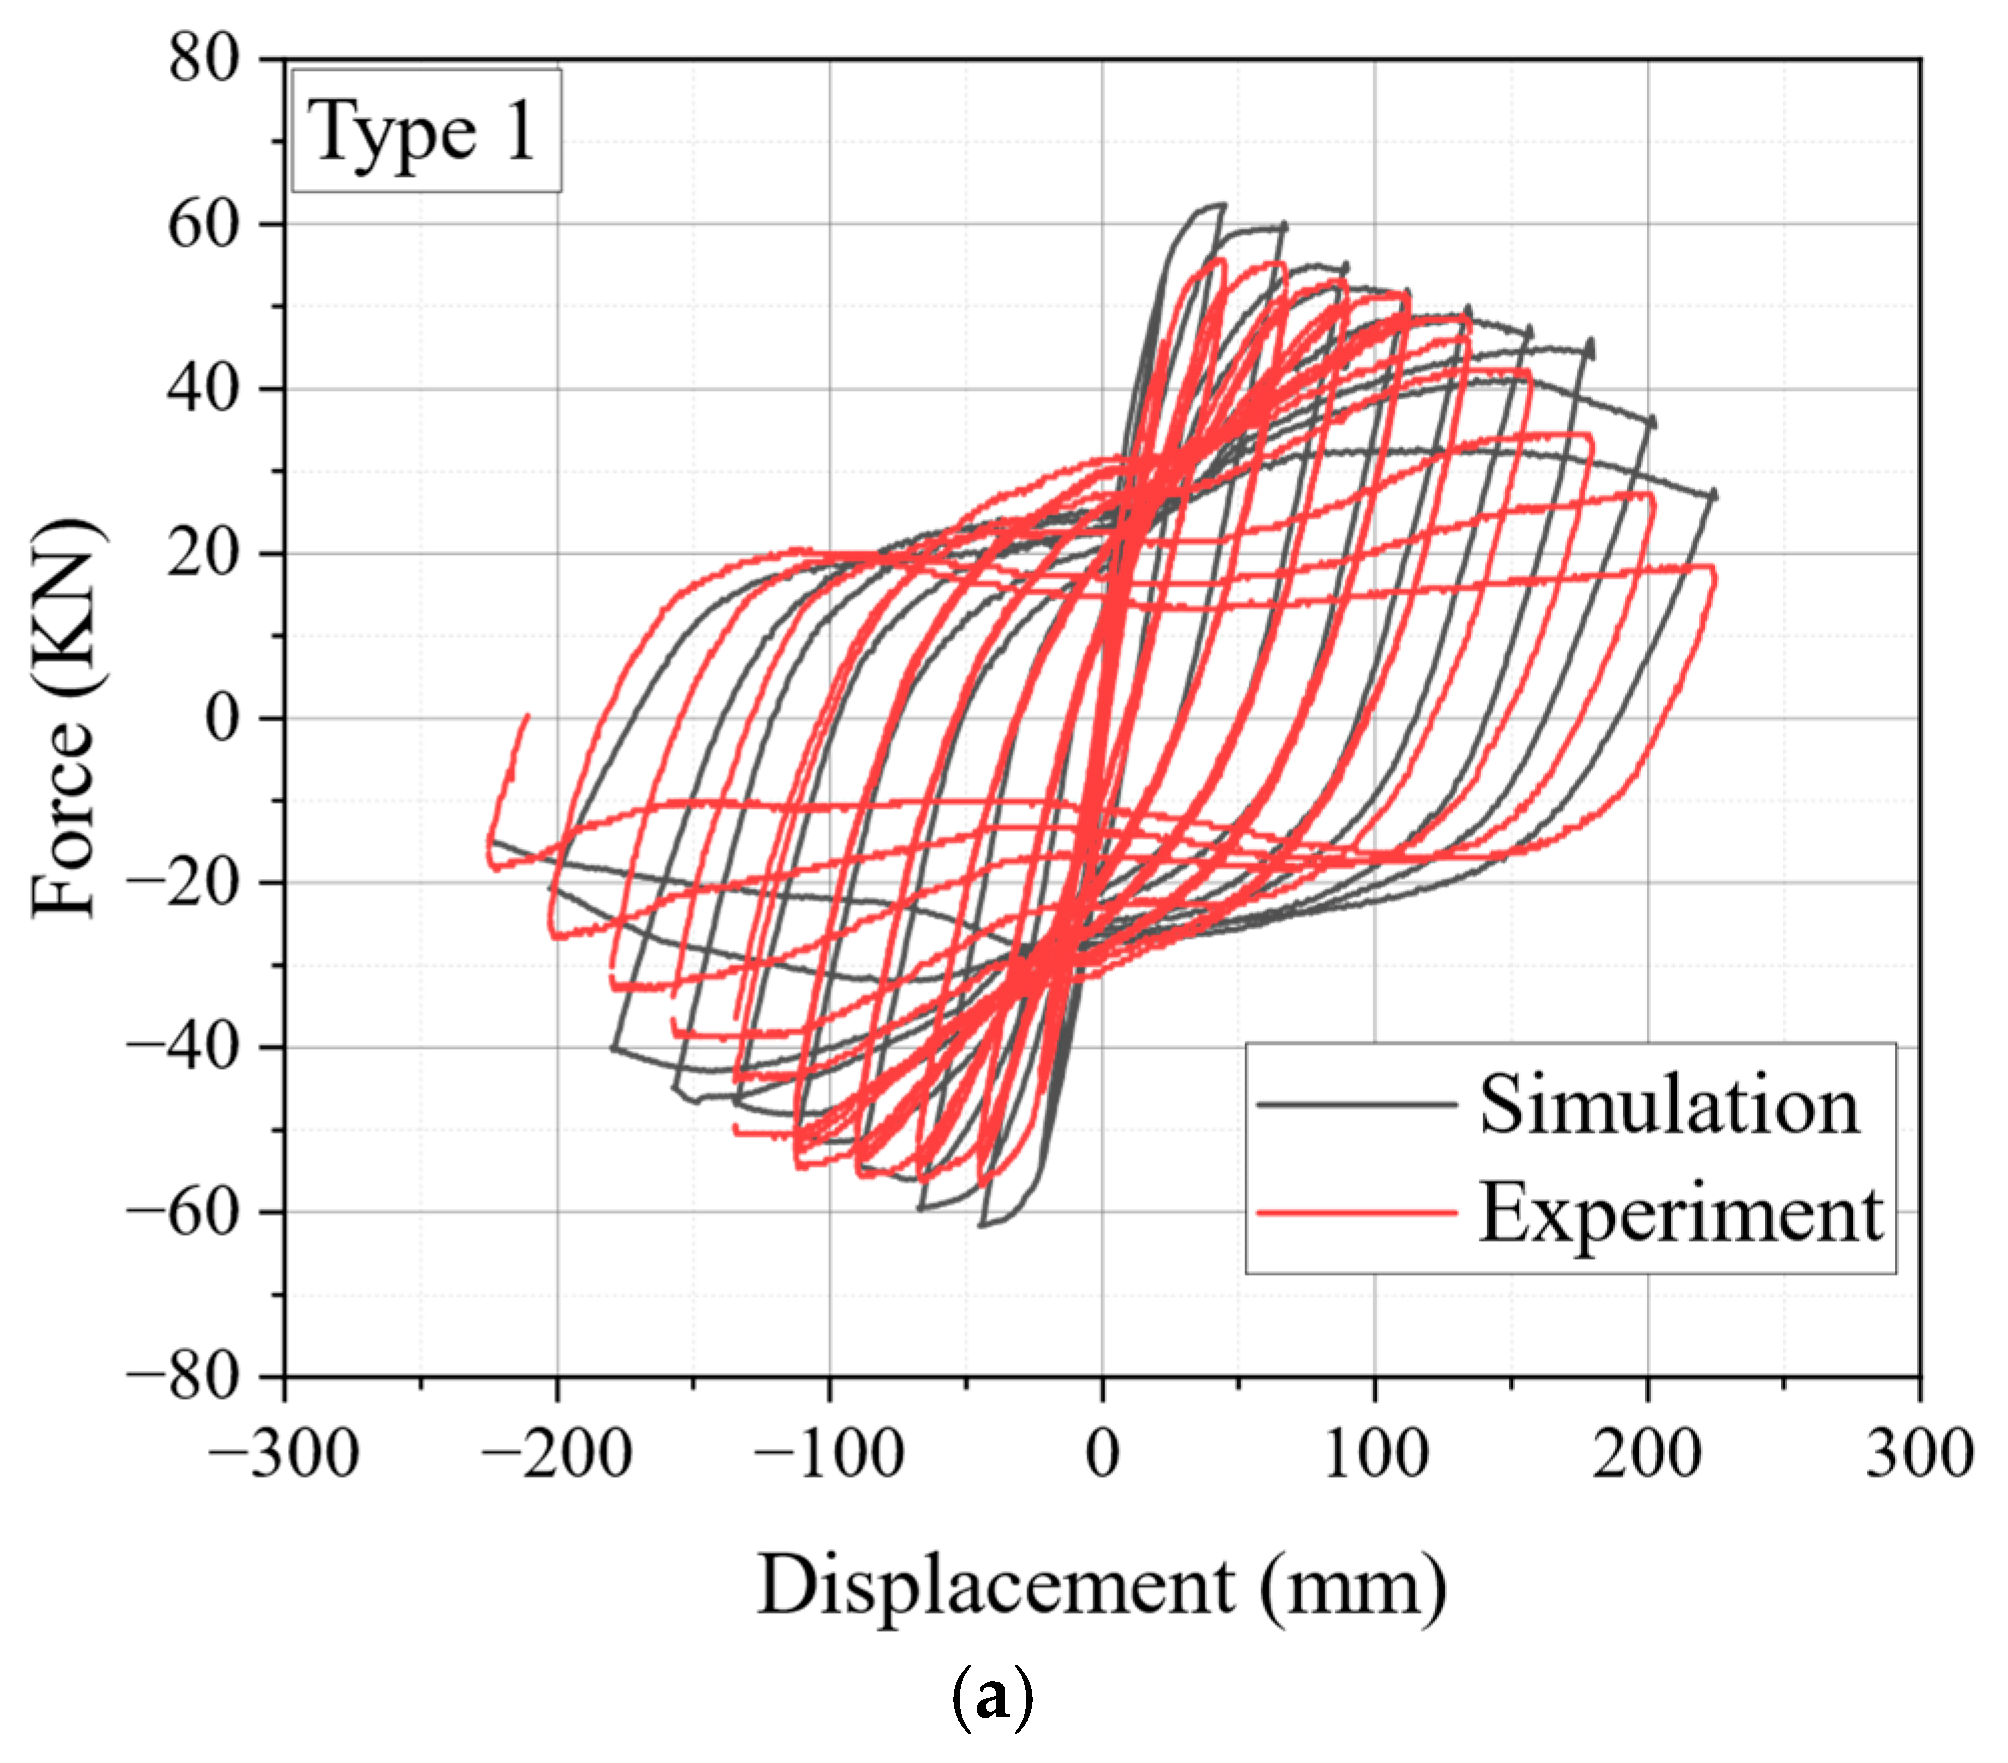
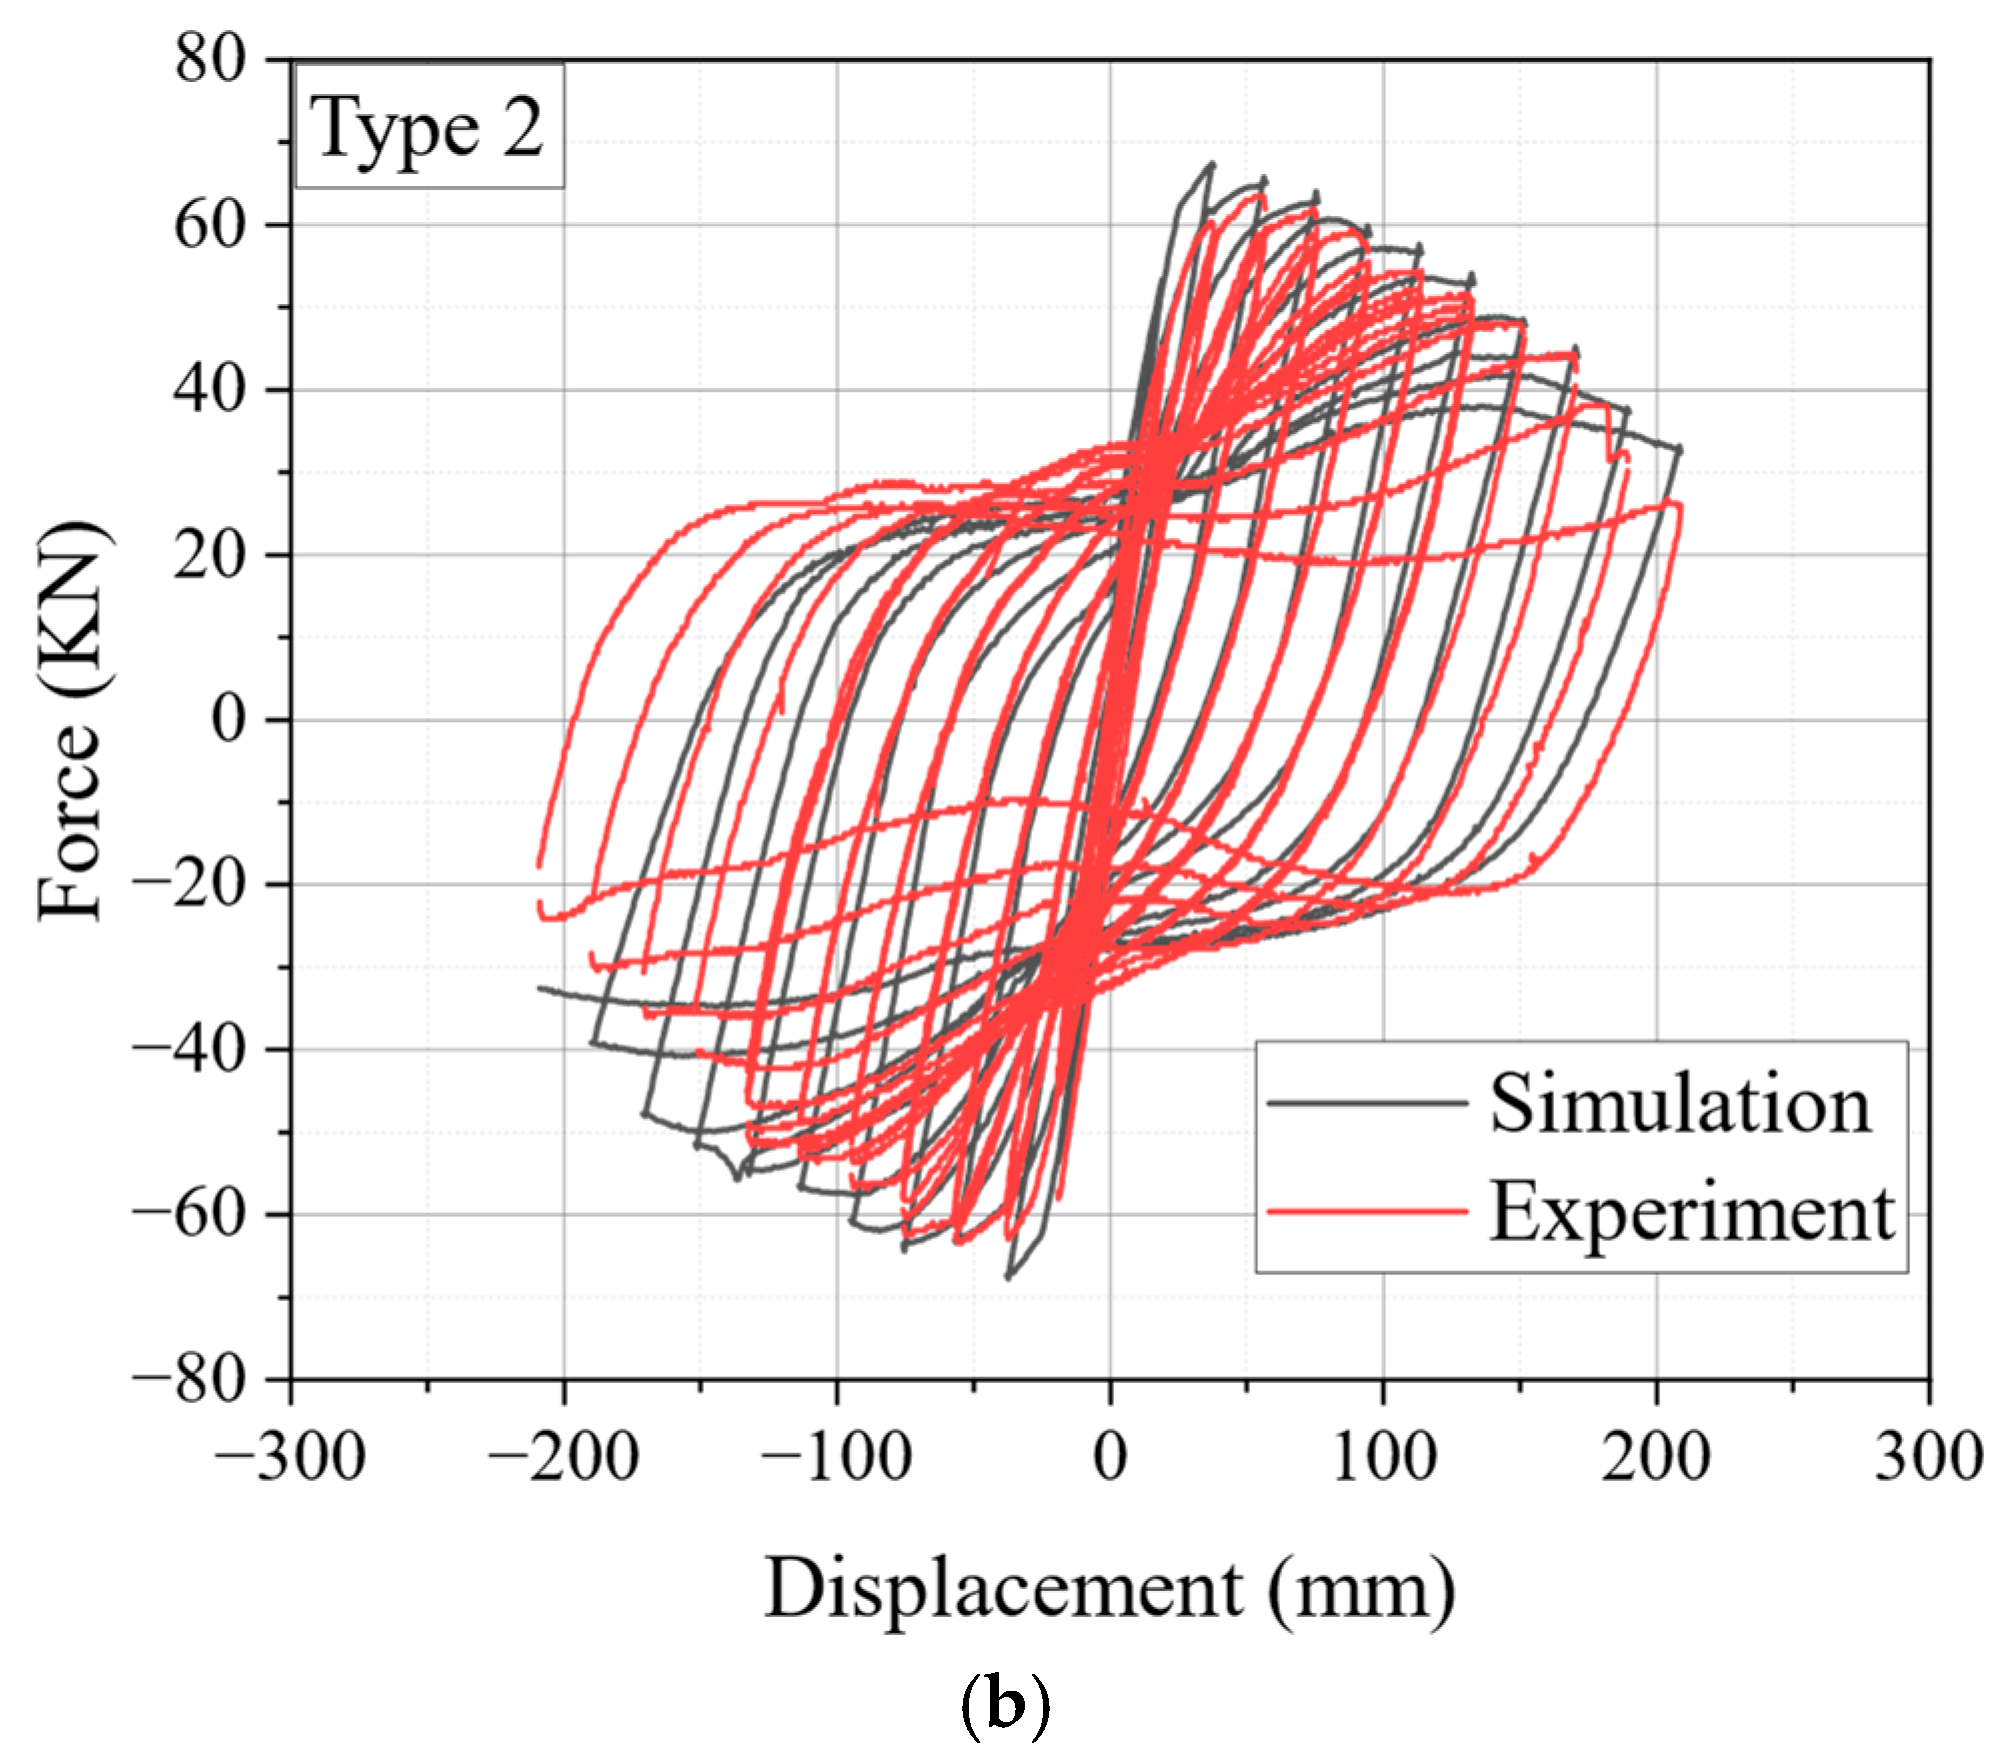
To verify the accuracy of the finite model, the simulation results were compared with the experimental results in terms of the force–displacement hysteretic curves, skeleton curves, damage pattern, ductility coefficient, and bearing capacity.
Figure 23 and Figure 24 compare hysteretic curves and skeleton curves between the simulation and experiment. The results of the hysteretic curves for the simulation agree with those in the experiment, as Figure 23 shows. At the same time, the trend that curves of Type 2 enclosed those of Type 1 also appeared in the simulation, as Figure 24 shows.
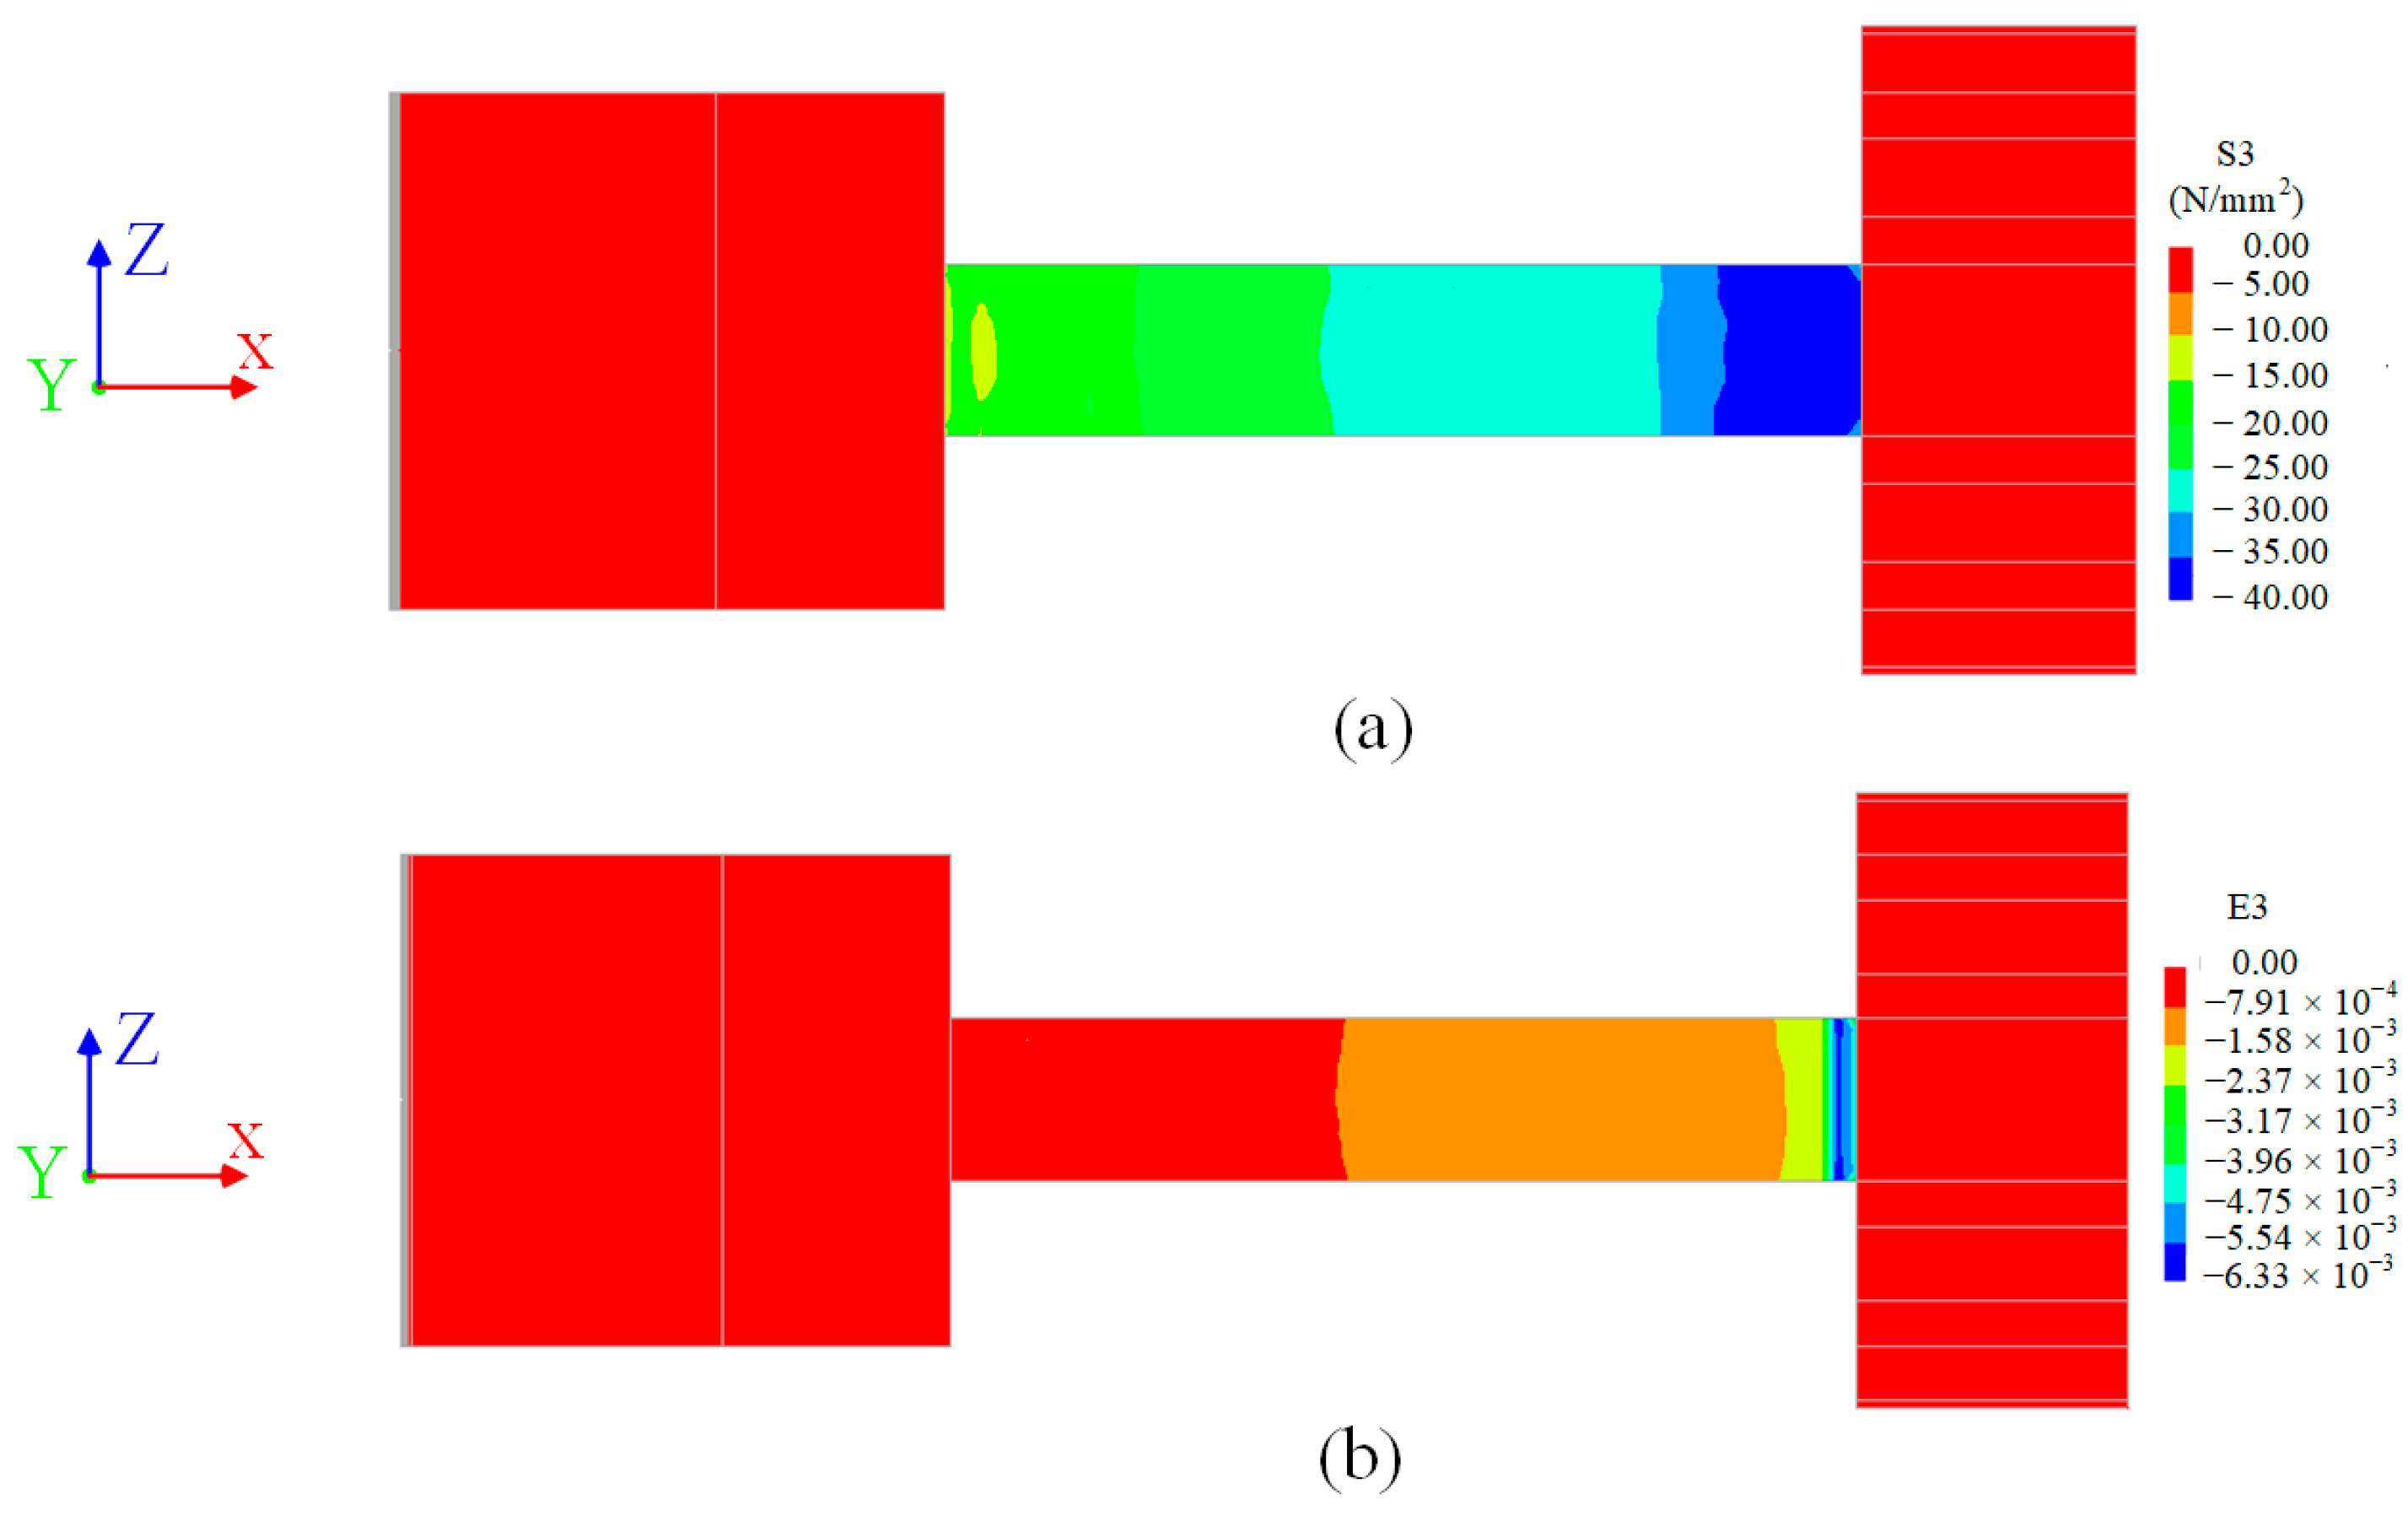
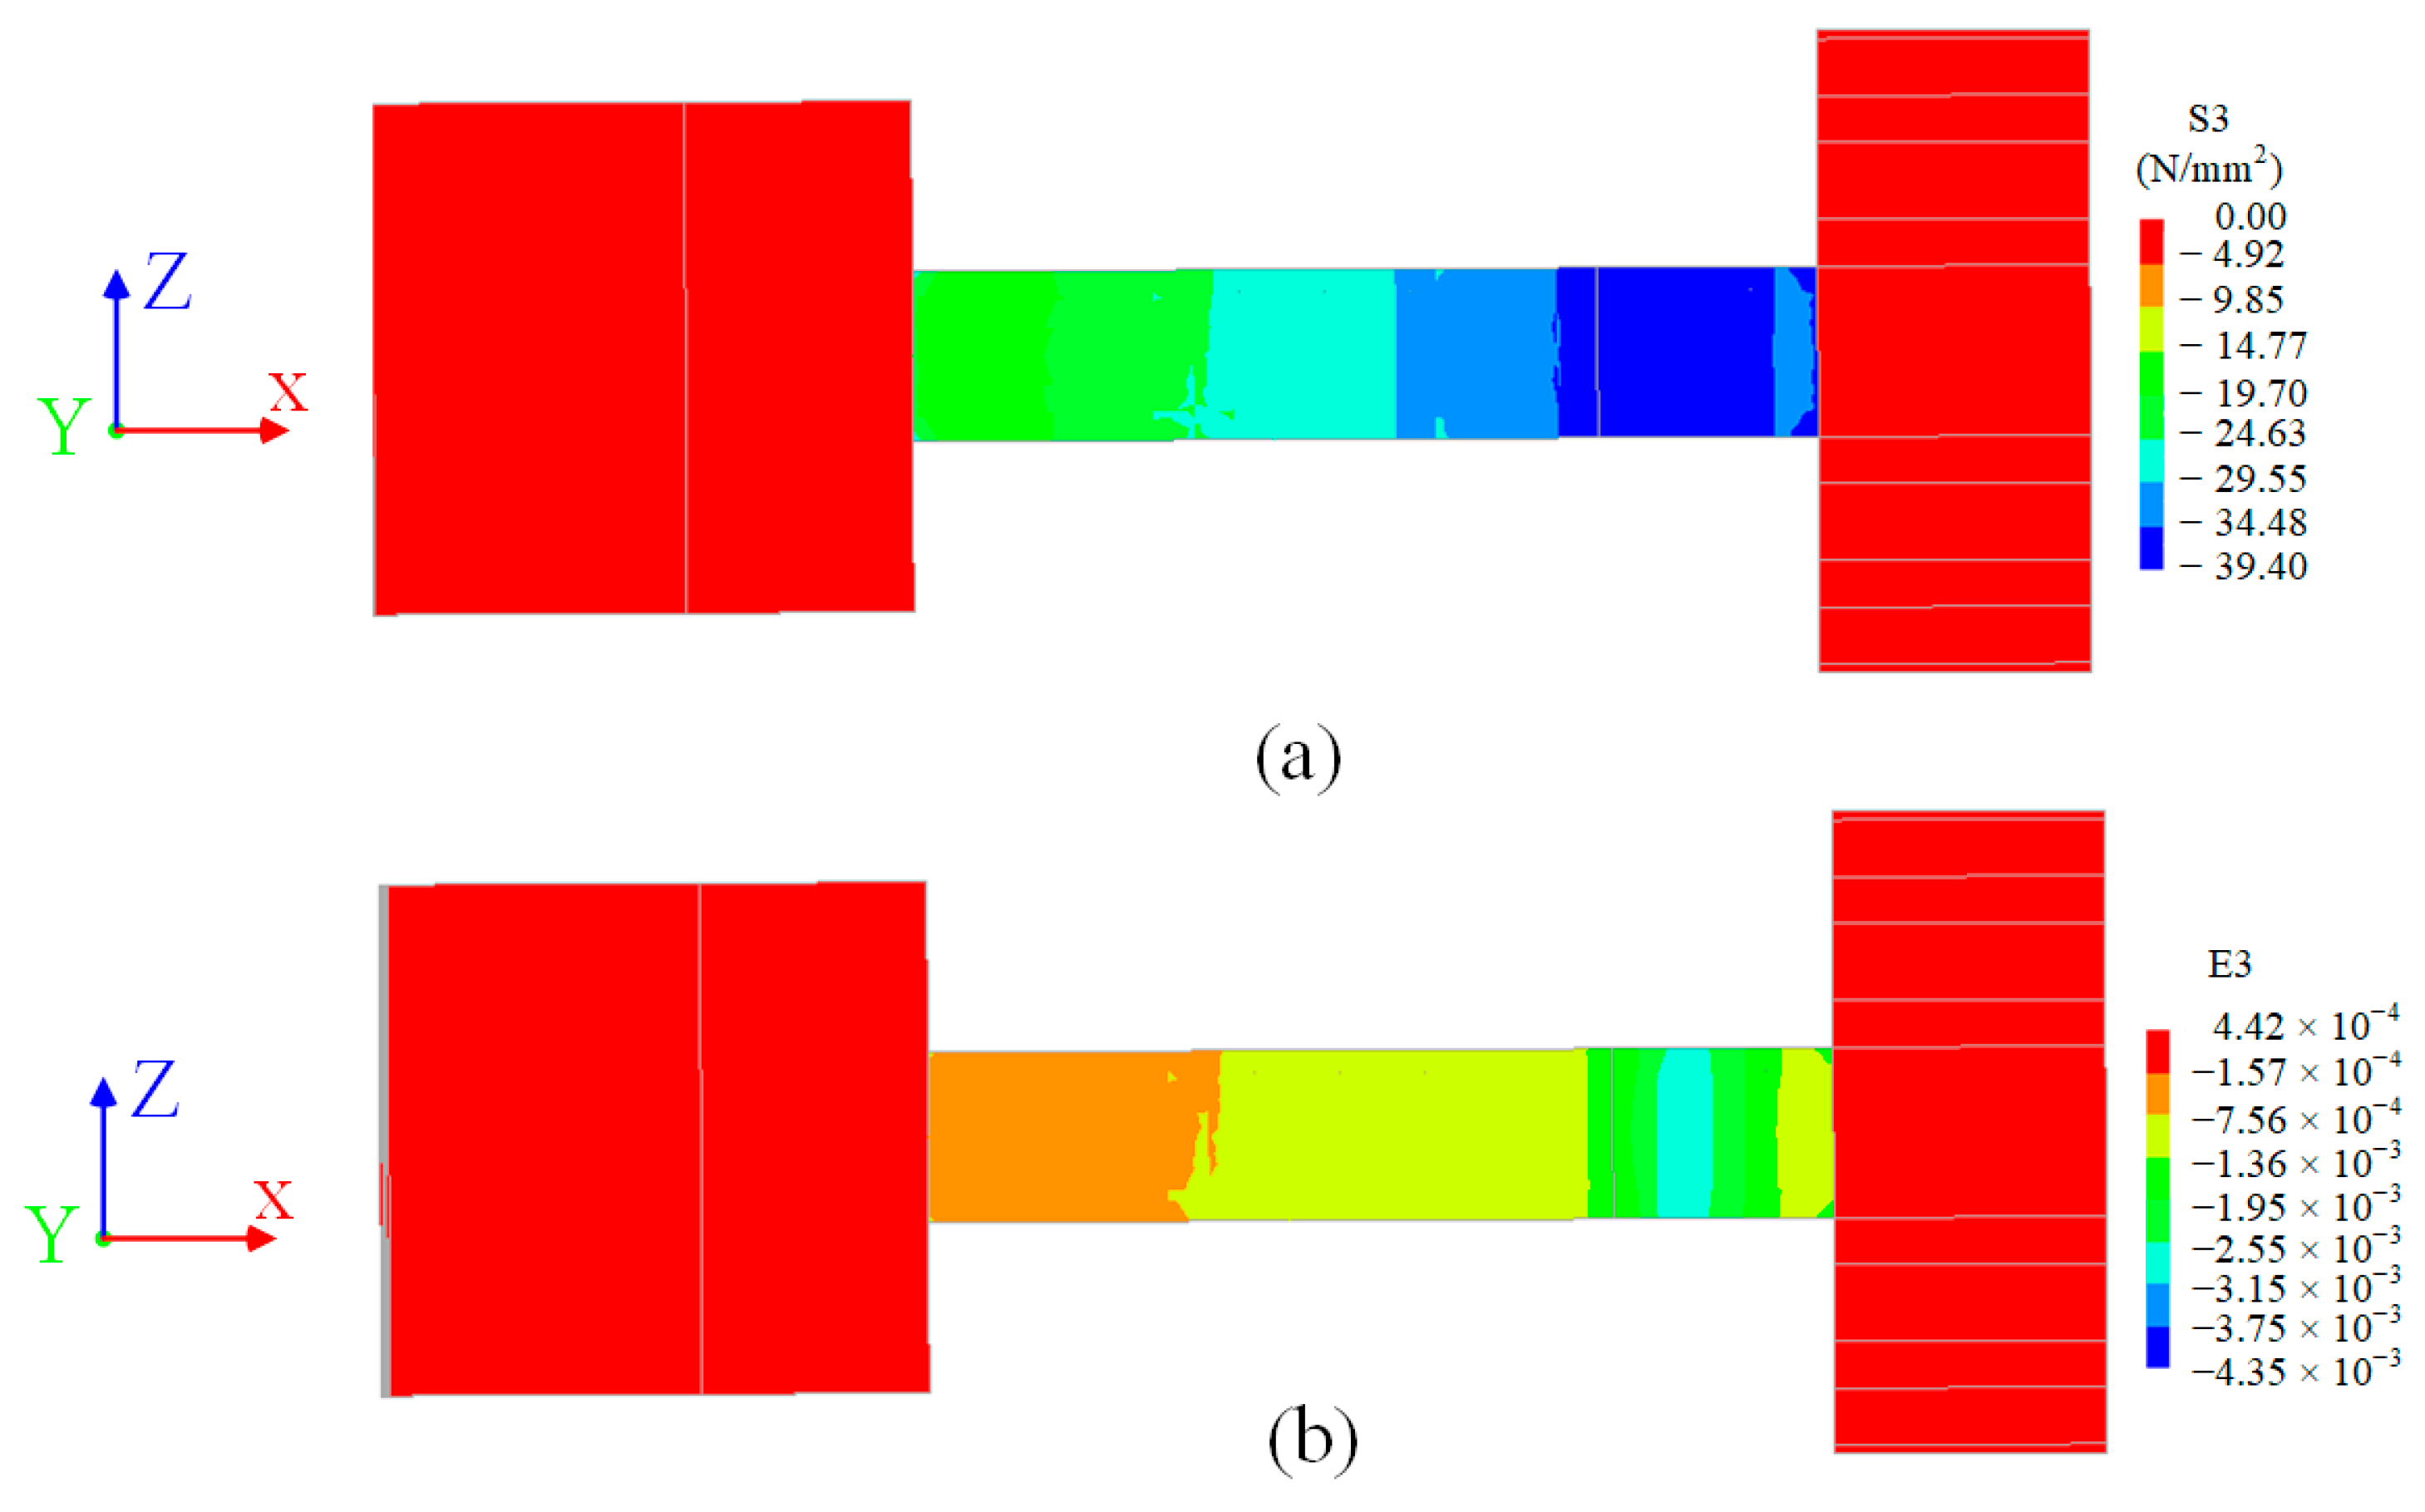
For Type 1, damages were concentrated 0–300 mm from the footing. However, for Type 2, the damage main extends from about 77–460 mm from the foundation, as Figure 25 and Figure 26 show. That was very close to the experimental results (0–300 mm for Type 1, 100–400 mm for Type 2).
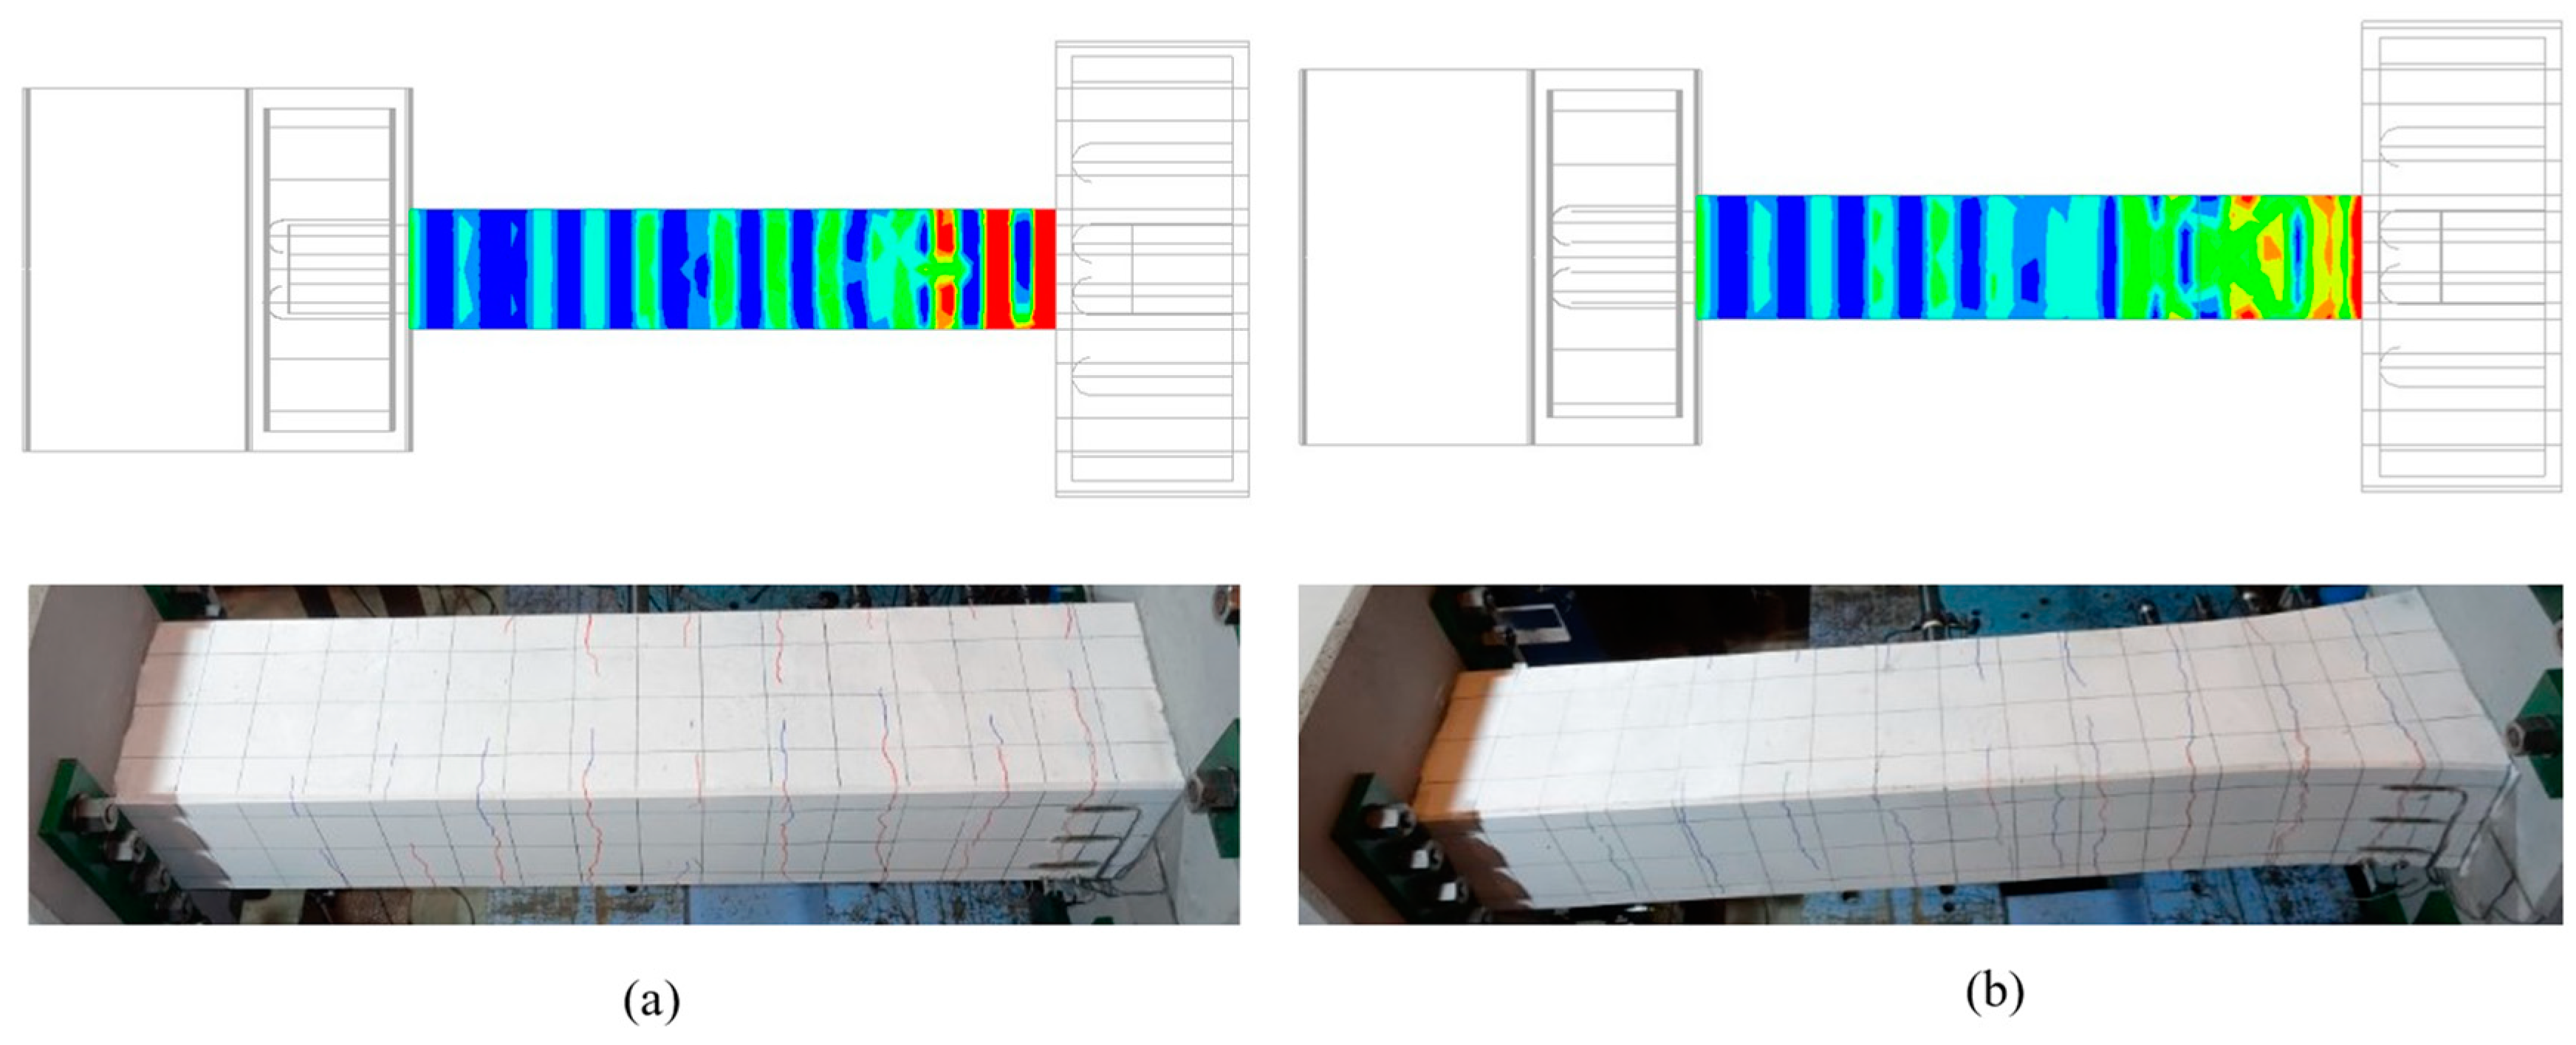
For both samples, although the number of cracks in the simulation was a little bigger than that in the experiment, the distributions of cracks in the simulation were close to those in the experiment, as Figure 27 shows.
Table 8 shows that the trend that the ductility coefficient and bearing capacity ( F m a x ) of Type 2 were better than those of Type 1 in the experiment also appeared in the simulation. F m a x was the average of the absolute values of the maximum force in both directions.
It deserves to be mentioned that the rupture and buckling of reinforcements did not explicitly appear in the model. However, considering the hysteretic curves, skeleton curves, damage pattern, ductility coefficients, and bearing capacity, it may be reasonable to deduce the other factors that influenced the ductility of the specimens by using the same material parameters.

6. Conclusions

This study introduced a novel ductility-enhancement technique for RC piers involving pre-deformed longitudinal reinforcements at the plastic hinges. Additionally, full-scale experiments were conducted on RC pier models subjected to cyclic lateral loading and constant axial load to assess the efficacy of the proposed technique. The performance of the piers was evaluated based on failure mode, plastic hinge distribution, hysteretic properties, normalized stiffness degradation, normalized energy dissipation capacity, bearing capacity, and ductility. The following key conclusions were drawn:
(1)
As a novel approach to enhance ductility, this paper proposes a method utilizing inwardly bent longitudinal reinforcement to mitigate in-plane buckling. The method offers a simple and cost-effective construction solution while improving seismic performance.
(2)
It was clarified that the RC pier with the proposed method had a plastic hinge part at a distance from the footing. It was indicated that the pre-deformed positions and curvature of the longitudinal reinforcements influenced the position of the plastic hinge.
(3)
The outcomes of the reversed cyclic load tests demonstrated that the proposed method enhanced energy dissipation capacity and stiffness. Furthermore, the load-carrying capacity increased by 14% and ductility improved by 11%. However, achieving greater ductility beyond this 11% improvement may require additional design adjustments. Additionally, although the technique successfully mitigated in-plane buckling, out-of-plane buckling of the longitudinal reinforcement was observed, indicating the need for further refinement to address this issue and enhance overall ductility.
(4)
FEM analysis revealed that it may be reasonable to deduce the other factors that influenced the ductility of the specimens by using the same material parameters mentioned above.

Author Contributions

Conceptualization, H.T. and M.K.; methodology, H.T. and M.K.; software, W.W.; validation, H.T. and W.W.; formal analysis, W.W.; investigation, W.W.; resources, H.T. and Y.S.; data curation, H.T.; writing—original draft preparation, W.W.; writing—review and editing, W.W.; visualization, W.W.; supervision, Y.S and H.T.; project administration, H.T.; funding acquisition, H.T. All authors have read and agreed to the published version of the manuscript.

Funding

This research received no external funding.

Data Availability Statement

The original contributions presented in this study are included in the article.

Conflicts of Interest

The author Masami Koshiishi is employed by Nippon Koei Co., Ltd. The remaining authors declare that the research was conducted in the absence of any commercial or financial relationships that could be construed as a potential conflict of interest.

References

  1. Milić, P.; Kušter Marić, M. Climate change effect on durability of bridges and other infrastructure. Građevinar Časopis Hrvat. Saveza Građevinskih Inženjera 2023, 75, 893–906. [Google Scholar]
  2. Jing, D.H.; Yu, T.; Liu, X.D. New configuration of transverse reinforcement for improved seismic resistance of rectangular RC columns: Concept and axial compressive behavior. Eng. Struct. 2016, 111, 383–393. [Google Scholar] [CrossRef]
  3. Dang, V.H.; François, R. Prediction of ductility factor of corroded reinforced concrete beams exposed to long term aging in chloride environment. Cem. Concr. Compos. 2014, 53, 136–147. [Google Scholar] [CrossRef]
  4. Stone, W.C.; Cheok, G.S. Inelastic Behavior of Full-Scale Bridge Piers Subjected to Cyclic Loading; Technical Report; U.S. Department of Commerce, National Institute of Standards and Technology: Gaithersburg, MD, USA, 1989; Volume 27.
  5. Park, R. Ductile design approach for reinforced concrete frames. Earthq. Spectra 1986, 2, 565–619. [Google Scholar] [CrossRef]
  6. Park, R. Ductility evaluation from laboratory and analytical testing. In Proceedings of the 9th World Conference on Earthquake Engineering, Tokyo-Kyoto, Japan, 2–9 August 1988; Volume 8, pp. 605–616. [Google Scholar]
  7. Sharma, U.K.; Bhargava, P.; Singh, S.P.; Kaushik, S.K. Confinement reinforcement design for plain and fibre reinforced high strength concrete columns. J. Adv. Concr. Technol. 2007, 5, 113–127. [Google Scholar] [CrossRef]
  8. Paulay, T.; Priestley, M.N. Seismic Design of Reinforced Concrete and Masonry Buildings; Wiley: New York, NY, USA, 1992; Volume 768. [Google Scholar]
  9. Yuen, T.Y.; Kuang, J.S.; Ho, D.Y. Ductility design of RC columns. Part 1: Consideration of axial compression ratio. HKIE Trans. 2016, 23, 230–244. [Google Scholar] [CrossRef]
  10. Yuen, T.Y.; Kuang, J.S.; Ho, D.Y. Ductility design of RC columns. Part 2: Extent of critical zone and confinement reinforcement. HKIE Trans. 2017, 24, 42–53. [Google Scholar] [CrossRef]
  11. Fischer, G.; Li, V.C. Effect of matrix ductility on deformation behavior of steel-reinforced ECC flexural members under reversed cyclic loading conditions. Struct. J. 2002, 99, 781–790. [Google Scholar]
  12. Kim, S.; Jeong, Y.; Kwon, M.; Kim, J. Ductile behavior of RC column reinforced with Velcro seismic reinforcement system (VSRS). Structures 2022, 44, 796–808. [Google Scholar] [CrossRef]
  13. Zhang, D.; Li, N.; Li, Z.X.; Xie, L. Experimental investigation and confinement model of composite confined concrete using steel jacket and prestressed steel hoop. Constr. Build. Mater. 2020, 256, 119399. [Google Scholar] [CrossRef]
  14. He, A.; Cai, J.; Chen, Q.J.; Liu, X.; Xue, H.; Yu, C. Axial compressive behaviour of steel-jacket retrofitted RC columns with recycled aggregate concrete. Constr. Build. Mater. 2017, 141, 501–516. [Google Scholar] [CrossRef]
  15. Choi, E.; Park, J.; Nam, T.H.; Yoon, S.J. A new steel jacketing method for RC columns. Mag. Concr. Res. 2009, 61, 787–796. [Google Scholar] [CrossRef]
  16. Islam, N.; Hoque, M. Strengthening of reinforced concrete columns by steel jacketing: A state of review. Asian Trans. Eng. 2015, 5, 6–14. [Google Scholar]
  17. Ibrahim, R.S.; Al-Zuhairi, A.H. Behavior of RC columns strengthened by combined (CFRP and steel jacket). Mater. Today Proc. 2022, 61, 1126–1134. [Google Scholar] [CrossRef]
  18. Parvin, A.; Brighton, D. FRP composites strengthening of concrete columns under various loading conditions. Polymers 2014, 6, 1040–1056. [Google Scholar] [CrossRef]
  19. Mo, Y.L.; Yeh, Y.K.; Hsieh, D.M. Seismic retrofit of hollow rectangular bridge columns. J. Compos. Constr. 2004, 8, 43–51. [Google Scholar] [CrossRef]
  20. Iacobucci, R.D.; Sheikh, S.A.; Bayrak, O. Retrofit of square concrete columns with carbon fiber-reinforced polymer for seismic resistance. Struct. J. 2003, 100, 785–794. [Google Scholar]
  21. Li, B.; Zohrevand, P.; Mirmiran, A. Cyclic behavior of FRP concrete bridge pier frames. J. Bridge Eng. 2013, 18, 429–438. [Google Scholar] [CrossRef]
  22. Wu, G.; Lü, Z.T.; Wu, Z.S. Strength and ductility of concrete cylinders confined with FRP composites. Constr. Build. Mater. 2006, 20, 134–148. [Google Scholar] [CrossRef]
  23. Parvin, A.; Wang, W. Behavior of FRP jacketed concrete columns under eccentric loading. J. Compos. Constr. 2001, 5, 146–152. [Google Scholar] [CrossRef]
  24. De Luca, A.; Nardone, F.; Matta, F.; Nanni, A.; Lignola, G.P.; Prota, A. Structural evaluation of full-scale FRP-confined reinforced concrete columns. J. Compos. Constr. 2011, 15, 112–123. [Google Scholar] [CrossRef]
  25. Koshiishi, M. High-Ductility RC Beam Structure. Japan Patent No. 6152975, 28 June 2017. [Google Scholar]
  26. Almeida, J.A.; Bandelt, M.J. Plastic hinge length in reinforced HPFRCC beams and columns. Eng. Struct. 2024, 315, 118345. [Google Scholar] [CrossRef]
  27. Sun, X.F. Mechanics of Materials (I); Higher Education Press: Beijing, China, 2018. [Google Scholar]
  28. Ishibashi, T.; Tshutoshi, T.; Kobayashi, K.; Yoshida, T.; Umihara, T. Study on evaluation of ductility of reinforced concrete columns subjected to reversed cyclic loading with large deformations. Trans. Jpn. Soc. Civ. Eng. 2002, 711, 45–57. [Google Scholar] [CrossRef] [PubMed]
  29. Park, R. Evaluation of ductility of structures and structural assemblages from laboratory testing. Bull. New Zealand Soc. Earthq. Eng. 1989, 22, 155–166. [Google Scholar] [CrossRef]
  30. Zhang, C.; Wu, L.; Elchalakani, M.; Cai, J. Cyclic loading test for reinforced concrete columns strengthened with high strength engineered cementitious composite jacket. Eng. Struct. 2023, 278, 115571. [Google Scholar] [CrossRef]
  31. Ghayeb, H.H.; Sulong, N.R.; Razak, H.A.; Mo, K.H. Enhancement of seismic behaviour of precast beam-to-column joints using engineered cementitious composite. Eng. Struct. 2022, 255, 113932. [Google Scholar] [CrossRef]
  32. Vecchio, F.J.; Collins, M.P. The modified compression-field theory for reinforced concrete elements subjected to shear. ACI J. 1986, 83, 219–231. [Google Scholar]
  33. Selby, R.G. Three-Dimensional Constitutive Relations for Reinforced Concrete. Ph.D. Thesis, University of Toronto, Toronto, ON, Canada, 1995. [Google Scholar]
  34. Taerwe, L.; Matthys, S. Fib Model Code for Concrete Structures 2010; Ernst & Sohn, Wiley: Weinheim, Germany, 2013. [Google Scholar]
  35. Dodd, L.L.; Restrepo-Posada, J.I. Model for predicting cyclic behavior of reinforcing steel. J. Struct. Eng. 1995, 121, 433–445. [Google Scholar] [CrossRef]
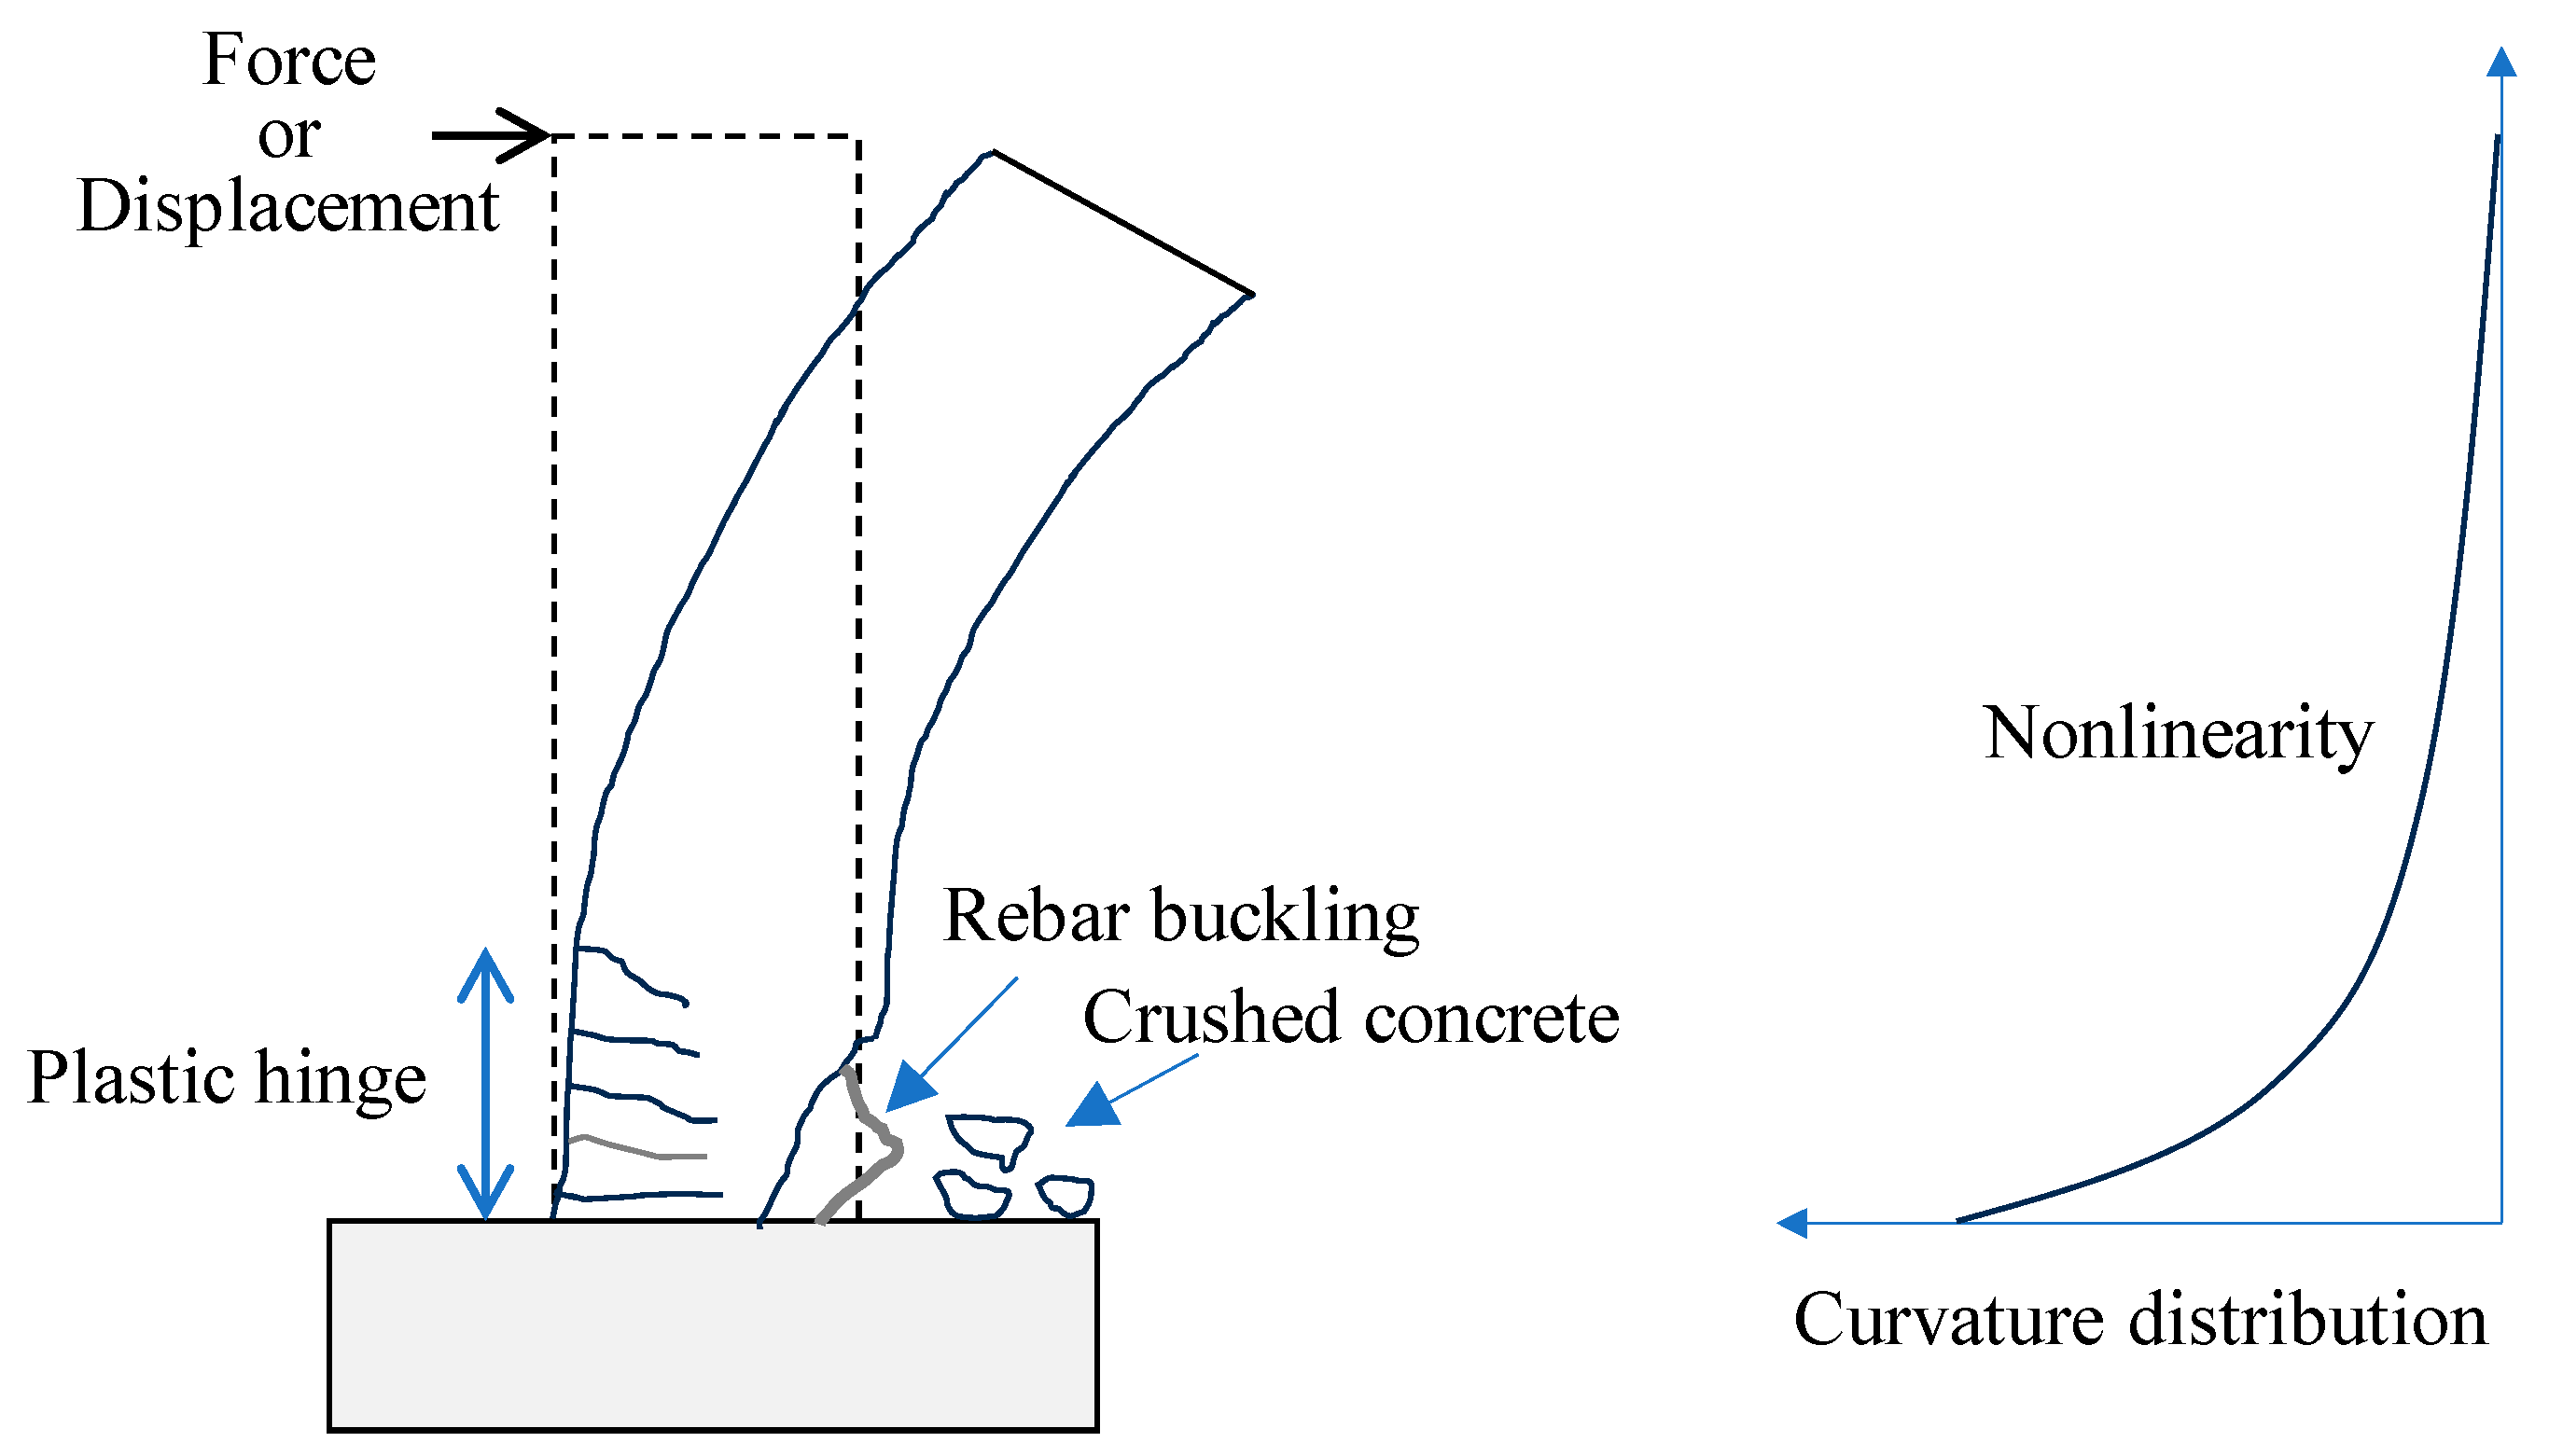
Figure 1. Failure of plastic hinge in RC pier or column.
Infrastructures 09 00197 g001
Figure 2. Diagram of parameters.
Infrastructures 09 00197 g002
Figure 3. Schematic diagram of force balance for standard and high-ductility beams: (a) cross section of the standard beam; (b) schematic diagram of the balance of forces of the standard beam; (c) cross-section of high-ductility beam; (d) schematic diagram of the balance of forces of high-ductility beam before the failure of concrete; (e) schematic diagram of the balance of forces of high-ductility beam after the failure of concrete.
Infrastructures 09 00197 g003
Figure 4. The comparison of the design philosophy between the standard pier and the proposed ductility improvement pier: (a) Standard pier and (b) DE pier.
Infrastructures 09 00197 g004
Figure 5. The flowchart of design.
Infrastructures 09 00197 g005
Figure 6. Geometric illustration in flowchart.
Infrastructures 09 00197 g006
Figure 7. Schematic diagram of reinforcements (unit: mm): (a) Type 1 and (b) Type 2.
Infrastructures 09 00197 g007
Figure 8. Installation of specimen on the loading device: (a) Schematic diagram of setup and (b) test setup photo.
Infrastructures 09 00197 g008
Figure 9. Lateral cyclic loading: (a) Type 1 and (b) Type 2.
Infrastructures 09 00197 g009aInfrastructures 09 00197 g009b
Figure 10. Failure pattern of Type 1: (a) crack pattern of top face at 2 δ y ; (b) west face at final state near bottom; and (c) east face at final state near bottom.
Infrastructures 09 00197 g010
Figure 11. Failure pattern of Type 2: (a) crack pattern of top face at 2δy; (b) west face at final state near bottom; and (c) east face at final state near bottom.
Infrastructures 09 00197 g011
Figure 12. Displacement of the pier at the arrival of each lateral loading displacement: (a) Type 1 and (b) Type 2.
Infrastructures 09 00197 g012
Figure 13. Plastic hinge of pier: (a) Type 1 and (b) Type 2.
Infrastructures 09 00197 g013
Figure 14. Comparison of hysteresis curves between Type 1 and Type 2.
Infrastructures 09 00197 g014
Figure 15. Skeleton curves.
Infrastructures 09 00197 g015
Figure 16. Normalized stiffness degradation curve.
Infrastructures 09 00197 g016
Figure 17. Normalized accumulated energy curve.
Infrastructures 09 00197 g017
Figure 18. FEM model of specimens (a) Type 1 (b) Type 2.
Infrastructures 09 00197 g018
Figure 19. The loading history of simulation: (a) Type 1 and (b) Type 2.
Infrastructures 09 00197 g019
Figure 20. Behaviors of concrete in tensile and compression.
Infrastructures 09 00197 g020
Figure 21. Stress–strain of rebar.
Infrastructures 09 00197 g021
Figure 22. The relationship of bond-slip.
Infrastructures 09 00197 g022
Figure 23. Comparison between simulation and experiment: (a) Type 1 and (b) Type 2.
Infrastructures 09 00197 g023aInfrastructures 09 00197 g023b
Figure 24. Comparison between simulation and experiment for skeleton curves: (a) Type 1 and (b) Type 2.
Infrastructures 09 00197 g024
Figure 25. The possible crushing area for Type 1: (a) minimal principal stress and (b) minimal principal strain.
Infrastructures 09 00197 g025
Figure 26. The possible crushing area for Type 2: (a) minimal principal stress and (b) minimal principal strain.
Infrastructures 09 00197 g026
Figure 27. The distribution of crack: (a) Type 1 and (b) Type 2.
Infrastructures 09 00197 g027
Table 1. Material mechanical parameters of concrete.
Type 1Type 2
SampleCompressive Strength
(N/mm2)
Split Tensile Strength
(N/mm2)
Compressive Strength
(N/mm2)
Split Tensile Strength
(N/mm2)
#139.63.2439.22.82
#240.4-39.6-
Average40.03.2439.42.82
Table 2. Material mechanical parameters of reinforcing bars.
SpecimensYield Strength
(N/mm2)
Tensile Strength
(N/mm2)
Elongation
(%)
Type 140454921
Type 240056720
Table 3. Summary of test results.
Load PhaseForce
(KN)
Displacement
(mm)
K
(KN/mm)
Esum
(KN ∗ mm)
ηλc
+FF+δδ
Type 1143.77−44.8022.44−22.491.97419.681.001.00
254.63−54.1144.823−45.0731.212466.020.612.94
352.56−53.0867.31−67.60940.786864.410.405.45
452.04−53.6089.65−90.0460.5913,989.000.308.33
549.98−51.53112.08−112.5820.4524,286.850.2311.57
646.87−49.46134.82−134.8190.3637,816.600.1815.02
Type 2144.32−44.8418.79−18.792.37193.431.001.00
259.33−60.8837.68−37.981.591960.420.675.07
361.91−62.4356.67−56.771.105922.430.4610.21
460.87−61.3975.36−75.750.8112,046.000.3415.57
556.74−55.1994.34−94.790.6020,091.070.2520.77
653.63−52.08113.23−113.730.4730,355.180.2026.15
750.53−50.01132.32−132.770.3843,199.590.1631.90
Note: Esum is cumulative energy dissipation; K is stiffness; η is normalized stiffness; and λc is normalized dissipated energy.
Table 4. Characteristic points and the ductility coefficient.
SpecimenDuctility Displacement (mm)Yield Displacement (mm)Ductility
positivenegativeAverage
Type 1145.34−145.61145.4822.56.47
Type 2137.61−132.90135.2618.87.19
Table 5. Parameters for concrete.
ParametersType 1Type 2
Young’s modulus (N/mm2)34,10034,100
Poisson’s ratio0.1670.167
Tensile behaviorTensile curveExponentialExponential
Tensile strength (N/mm2)3.242.82
Fracture energy (N/mm)0.1470.146
Compressive behaviorCompressive curveParabolicParabolic
Compressive behavior (N/mm2)4039.4
Compressive energy (N/mm)36.7536.5
Compressive behaviorResidual compressive strength (N/mm2)510
Table 6. Parameters for rebars.
ParametersLongitudinal ReinforcementStirrup
Type 1Type 2Type 1Type 2
Young’s modulus
(N/mm2)
200,000200,000200,000200,000
Yield stress (N/mm2)404400388388
Strain at the end of yield plateau1.25%1.25% (0.35%-pre-deformation)1.25%1.25%
Ultimate strain0.170.170.230.23
Peak stress (N/mm2)549567542542
Table 7. Parameters for bond-slip constitutive theory.
ParametersSteel Bar
Bond-slip interface failure modelCEB-FIB 2010 bond-slip function
Normal stiffness modulus (N/mm3)1000
Shear stiffness modulus (N/mm3)100
Maximum shear stress τ m a x (N/mm2)15
Ultimate shear stress (N/mm2)6
Relative slip section s 1 (mm)1
Relative slip section s 2 (mm)2
Relative slip section s 3 (mm)10
Exponent alpha 0.4
Table 8. Comparison of parameters between simulation and experiment.
ParametersType 1Type 2
SimulationExperimentSimulationExperiment
δ d (mm)120.23145.47132.60135.26
δ y (mm)2422.524.3218.8
F m a x (KN)61.9754.3767.1962.17
μ 5.016.475.457.19
Disclaimer/Publisher’s Note: The statements, opinions and data contained in all publications are solely those of the individual author(s) and contributor(s) and not of MDPI and/or the editor(s). MDPI and/or the editor(s) disclaim responsibility for any injury to people or property resulting from any ideas, methods, instructions or products referred to in the content.