

Improved Blob-Based Feature Detection and Refined Matching Algorithms for Seismic Structural Health Monitoring of Bridges Using a Vision-Based Sensor System

 ,
,  and
and
Abstract
1. Introduction
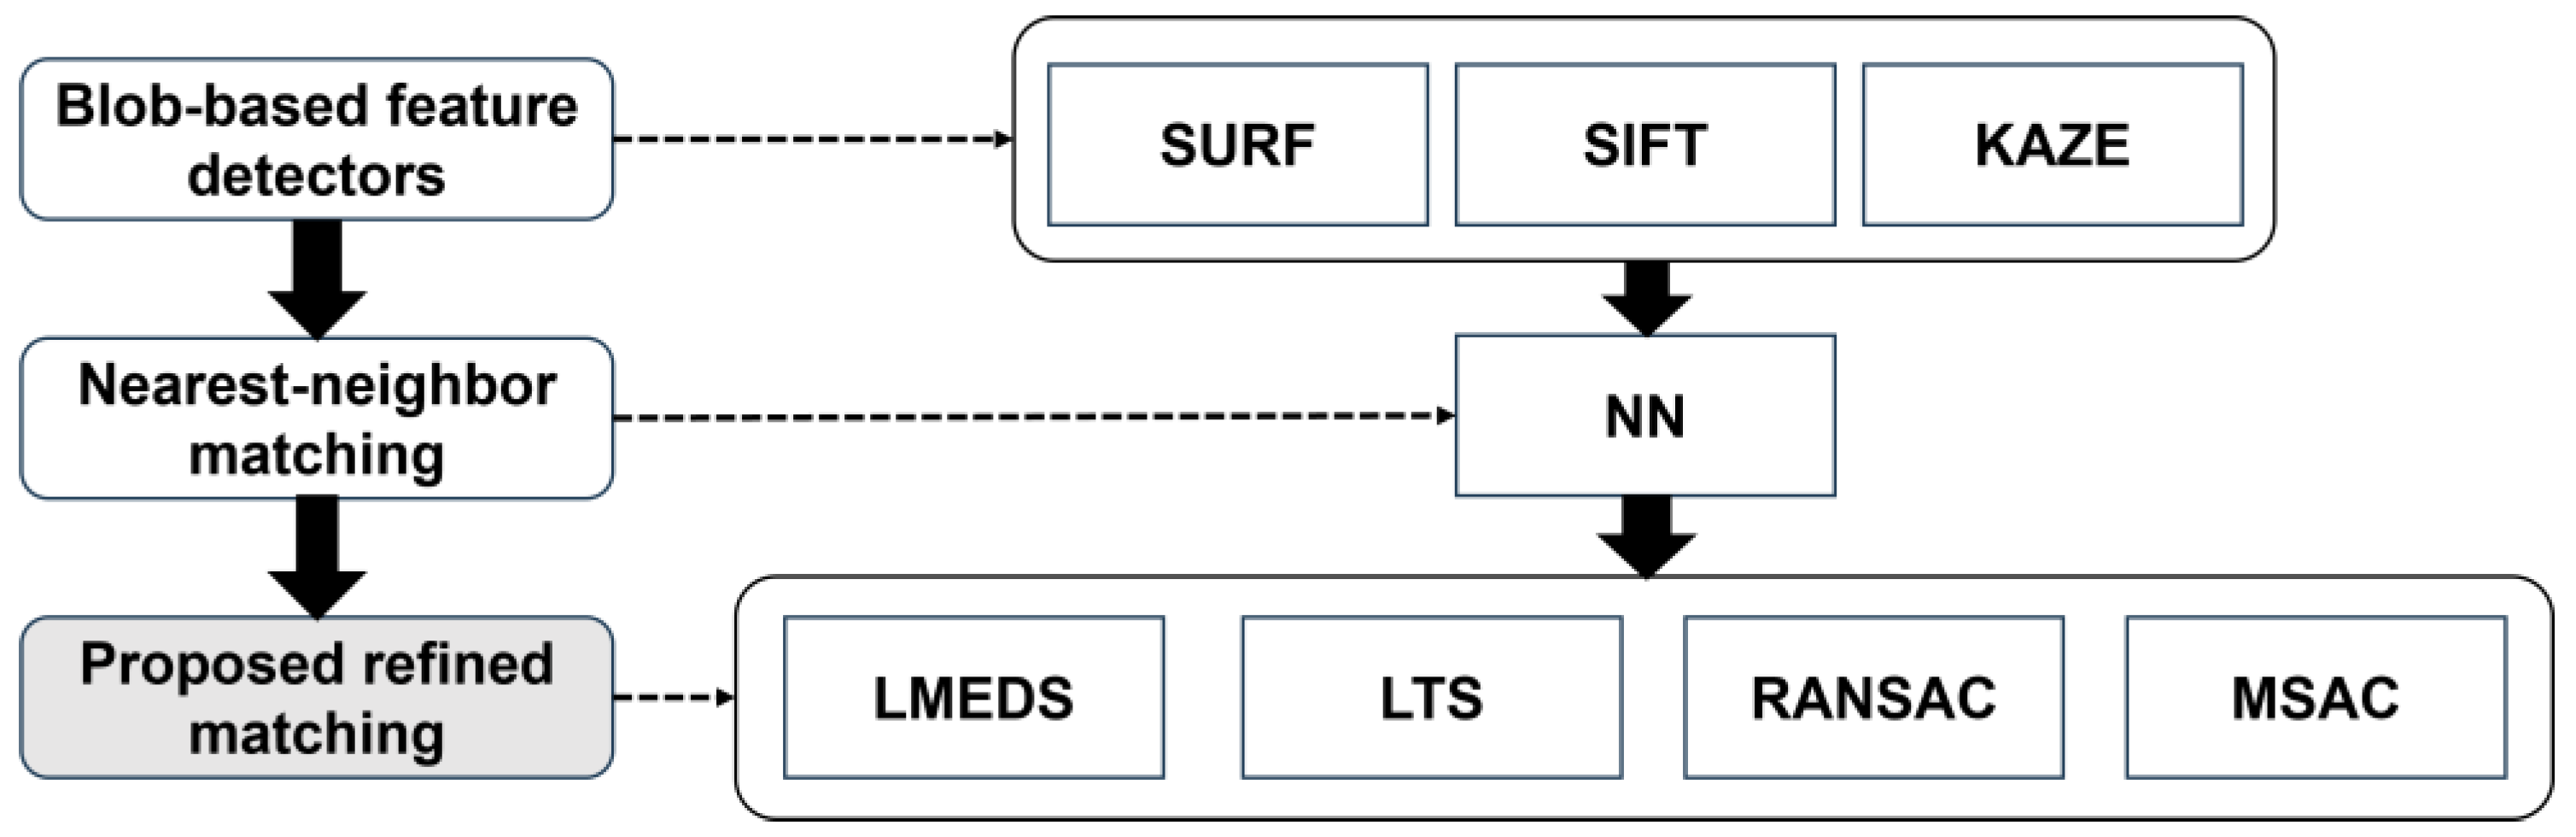
2. Methodology
2.1. Blob-Based Feature Detection Algorithm
2.2. Matching Algorithm
2.3. Proposed Refined Matching Algorithm
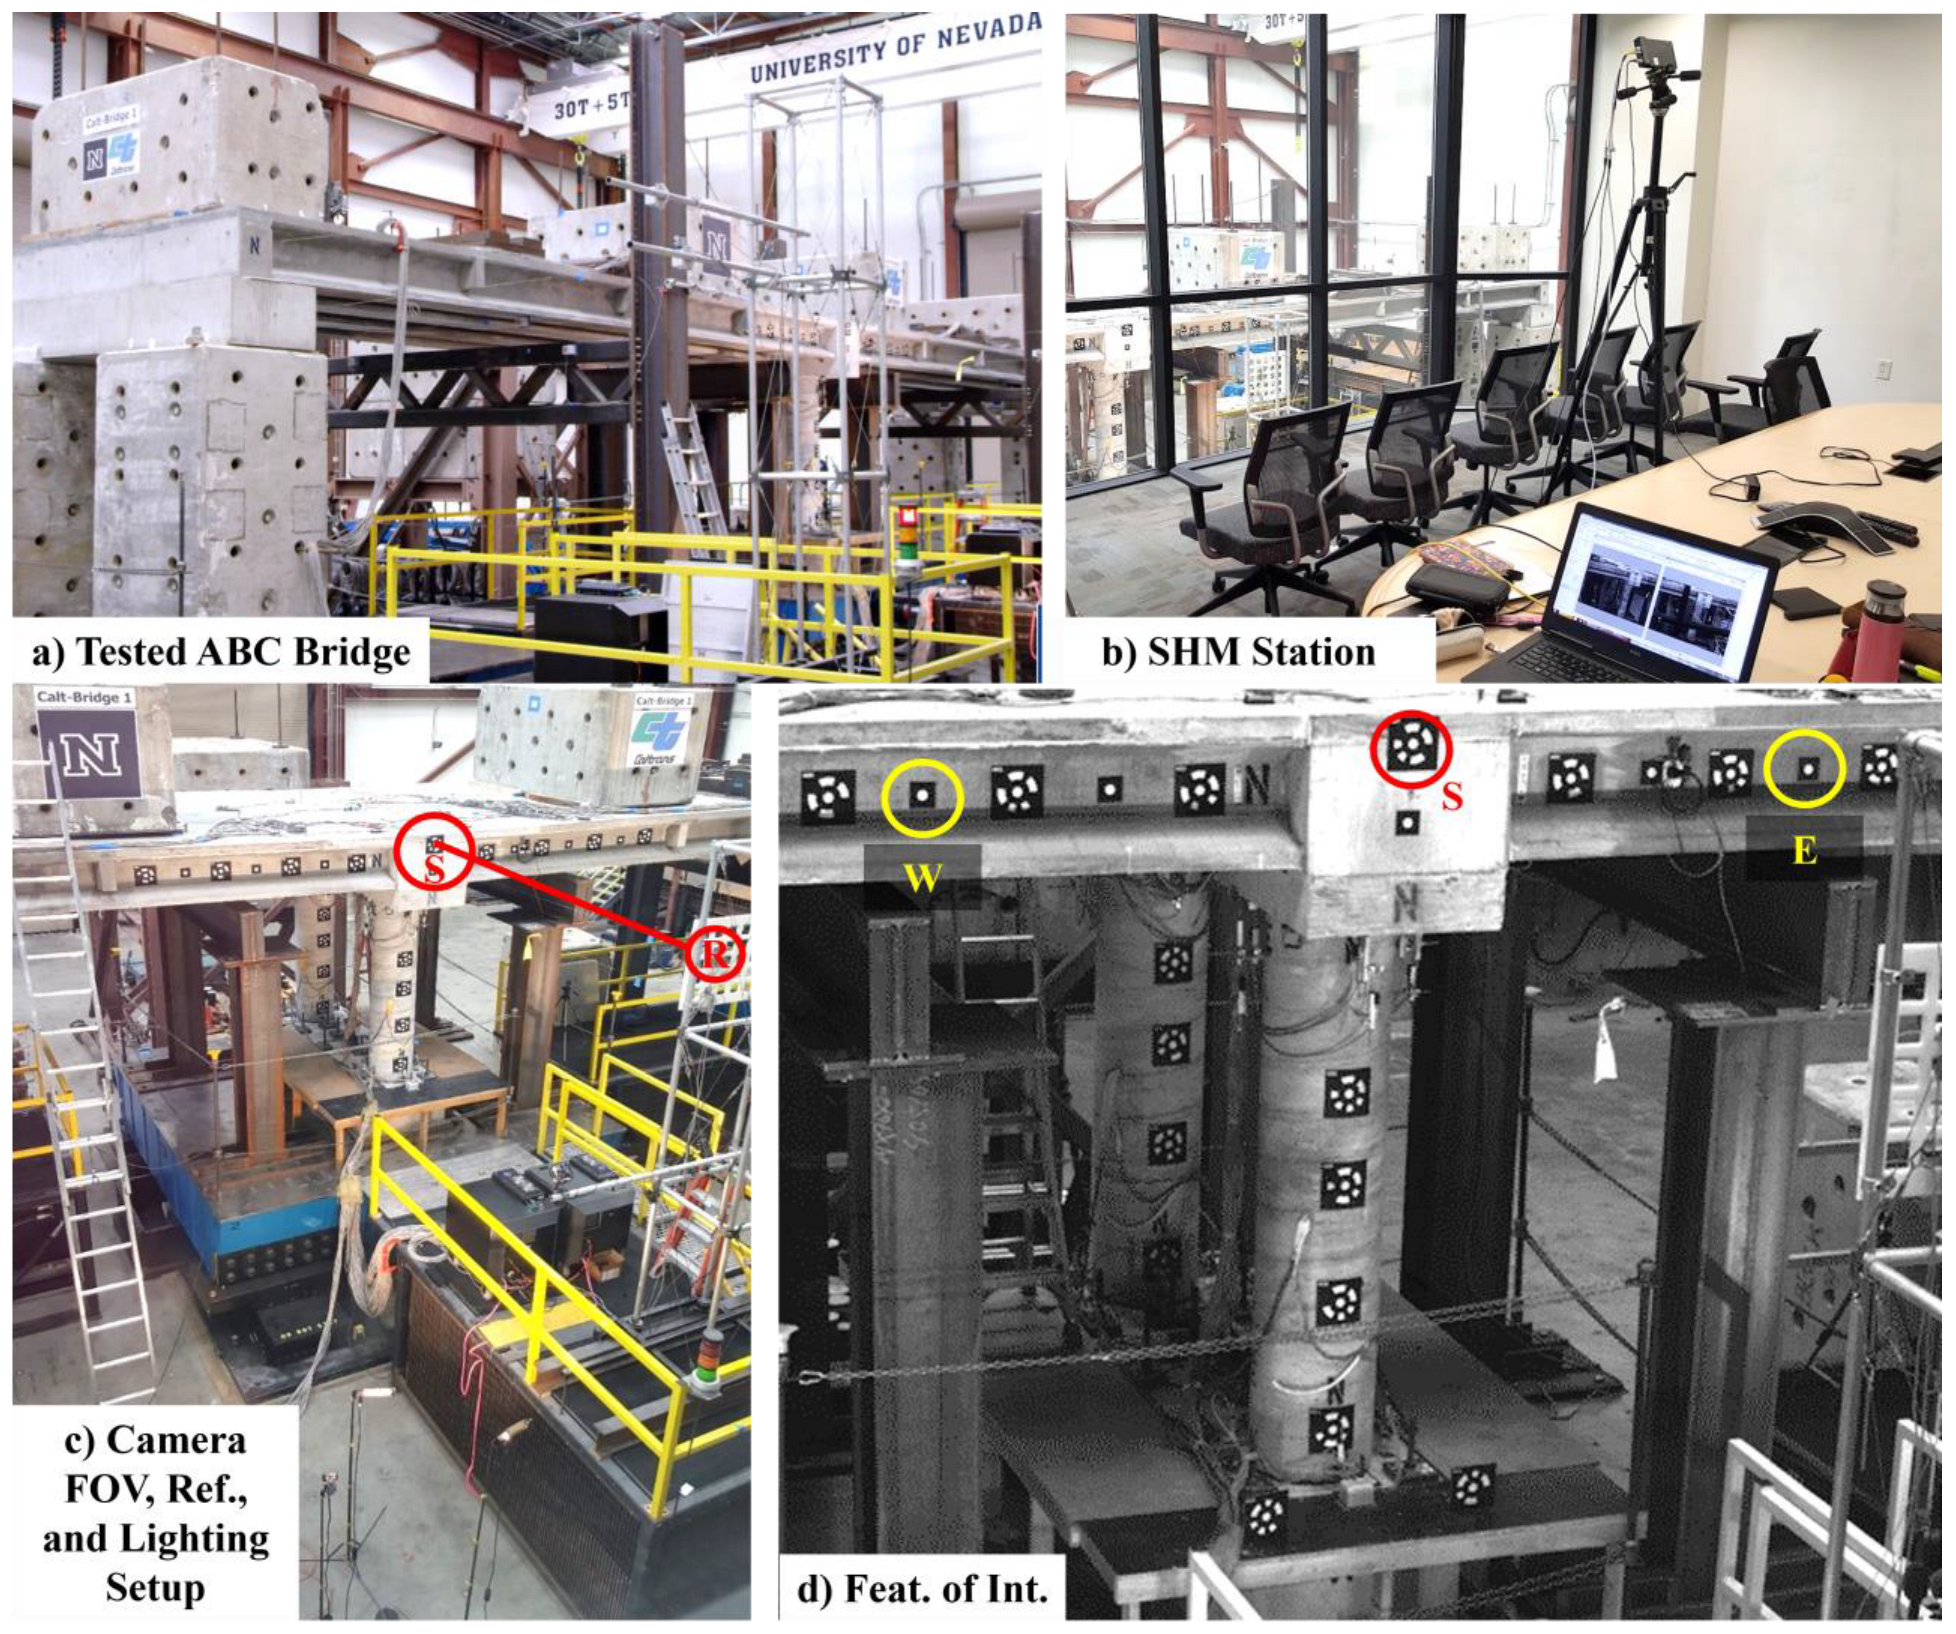
3. Testing Setup
4. Results and Discussions
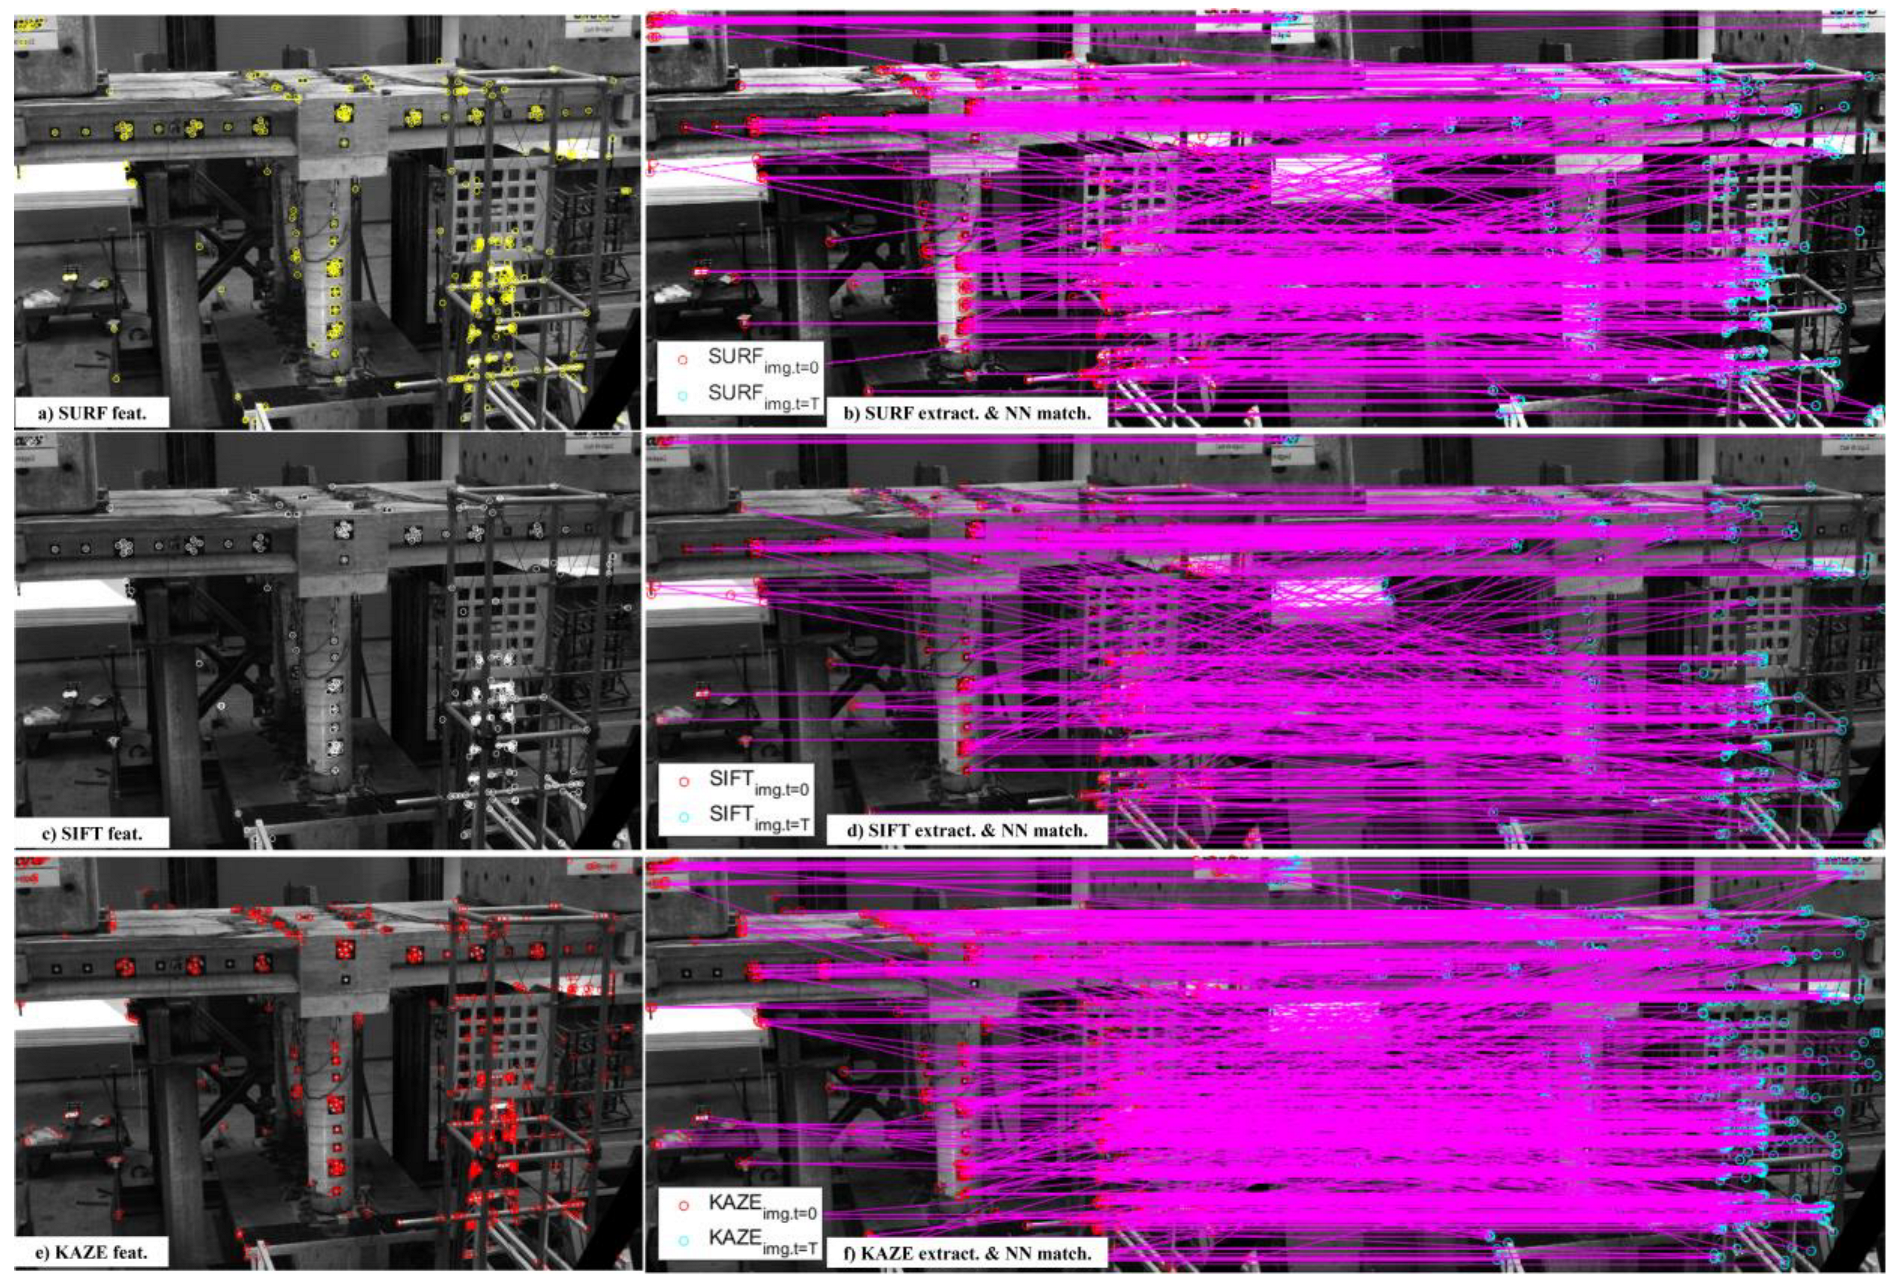
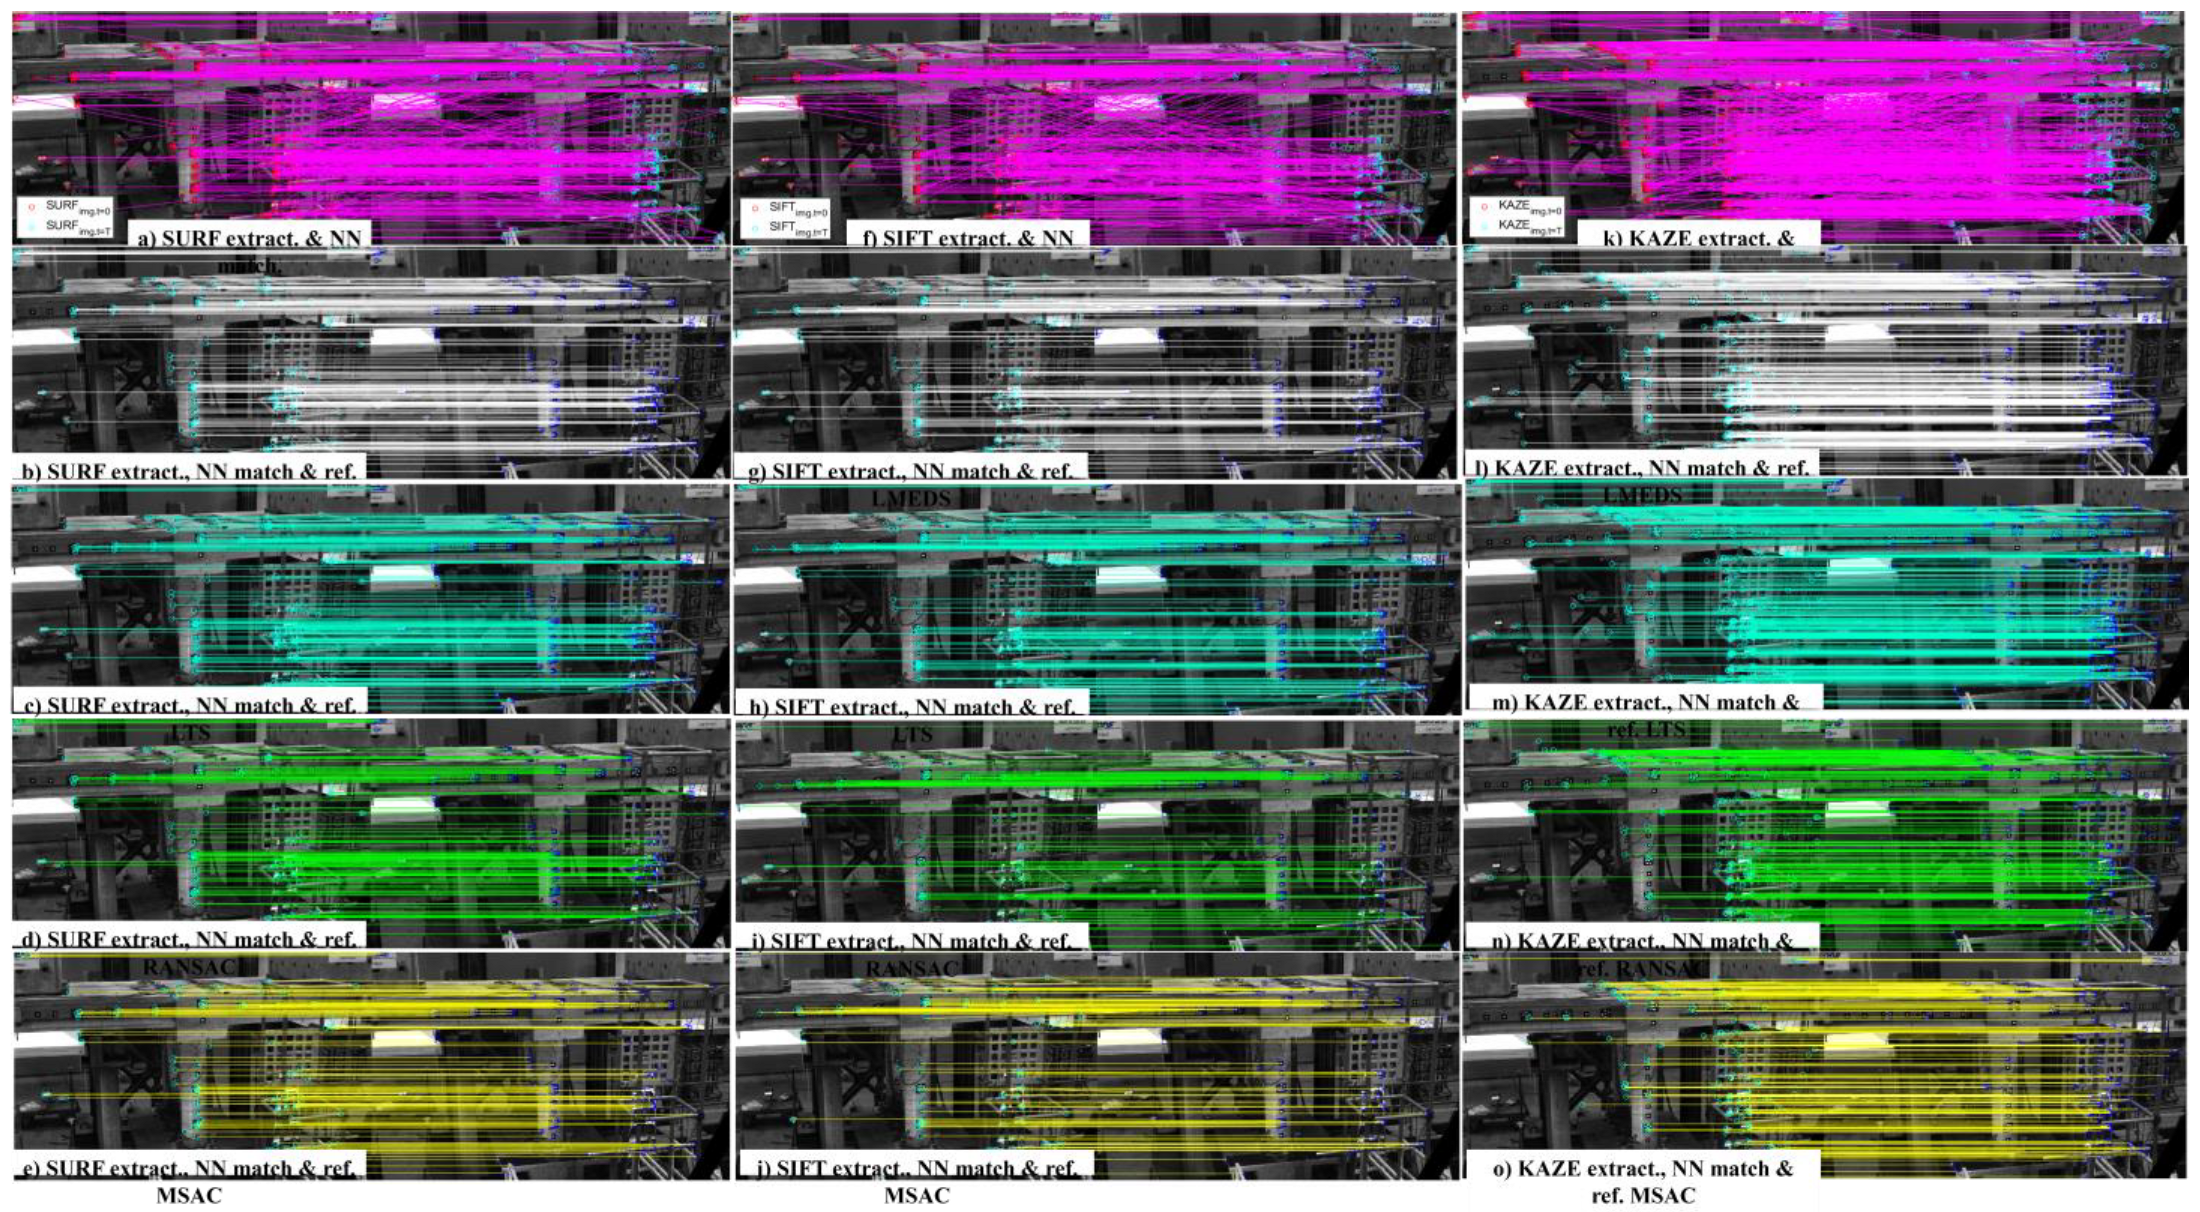
4.1. Blob-Based Feature Detection and Matching Results
4.2. Seismic Response of the ABC Bridge
5. Conclusions
- Using only the NN algorithm to return the exact match is not efficient, as only less than 60% of correct matches are returned for SURF, SIFT, and KAZE detectors. This confirms the results of previous works stating that using only the NN algorithm to find exact matches is challenging; combining it with a refined matching algorithm is necessary to improve the results.
- The LMEDS and LTS algorithms have no effect on refining the false matching; rather, they decrease the number of correct matches as well as the accuracies from NN matching. The change in their thresholds also has no impact; they show a constant number of matching features either at low- or high-threshold selection.
- RANSAC and MSAC, however, are proven to increase the number of correct matches as well as the matching accuracies of blob-based features using SURF, SIFT, and KAZE. Careful selection of threshold is mandatory because the matching accuracies decrease following the increase in the threshold. There is a chance that with selection of a higher threshold, the number of correct feature matches will even decrease from NN matching numbers, similar to when using LMEDS or LTS.
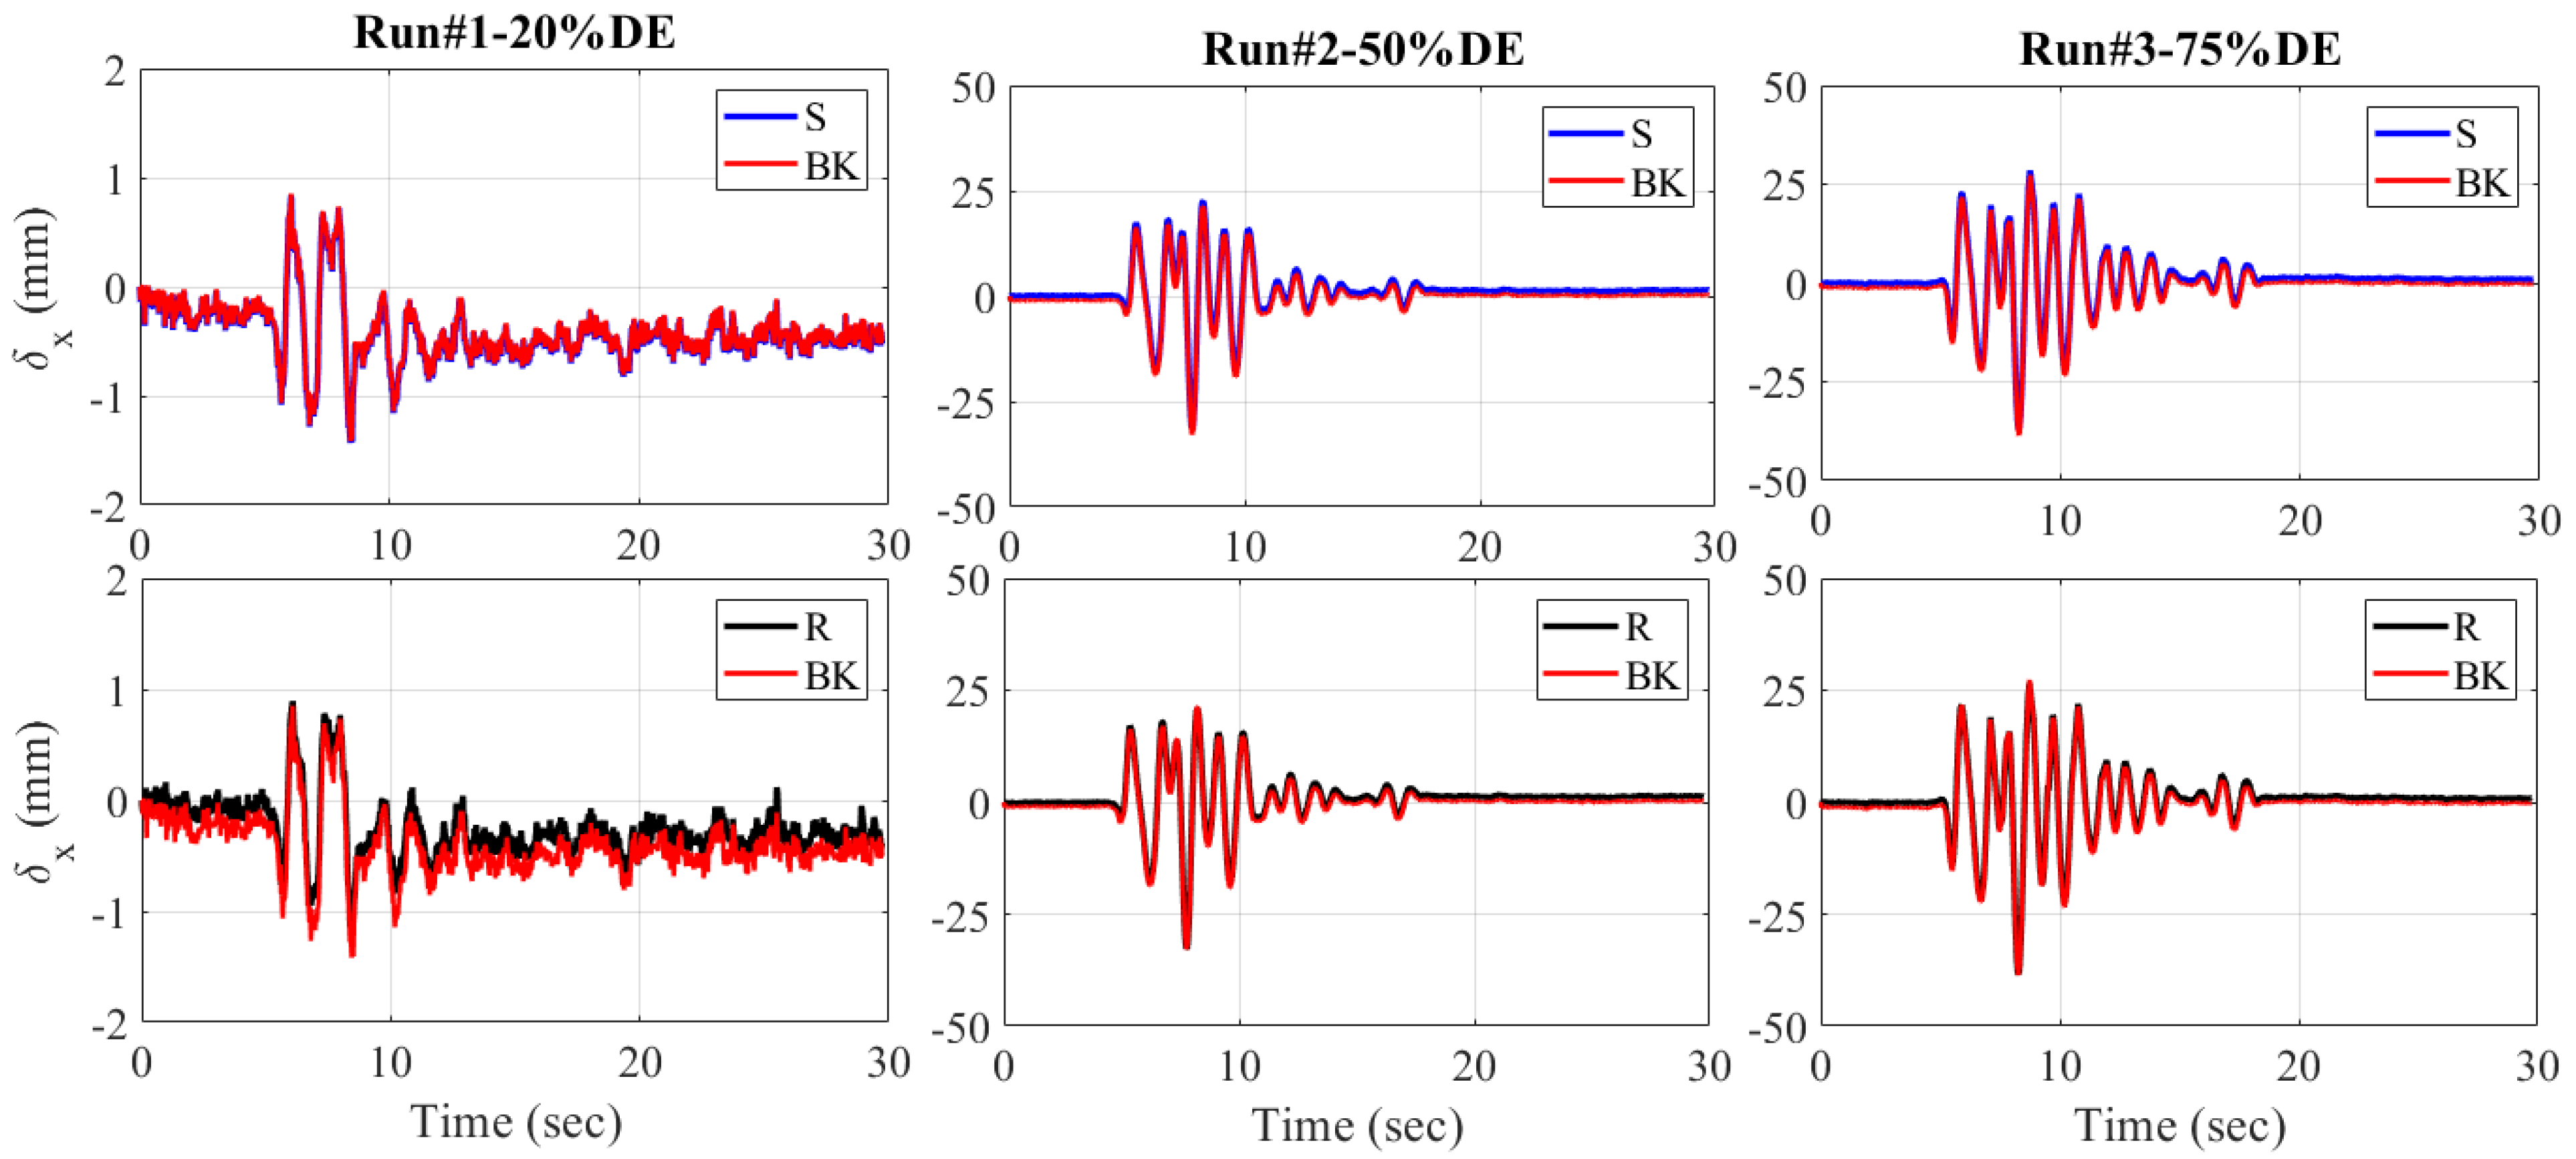
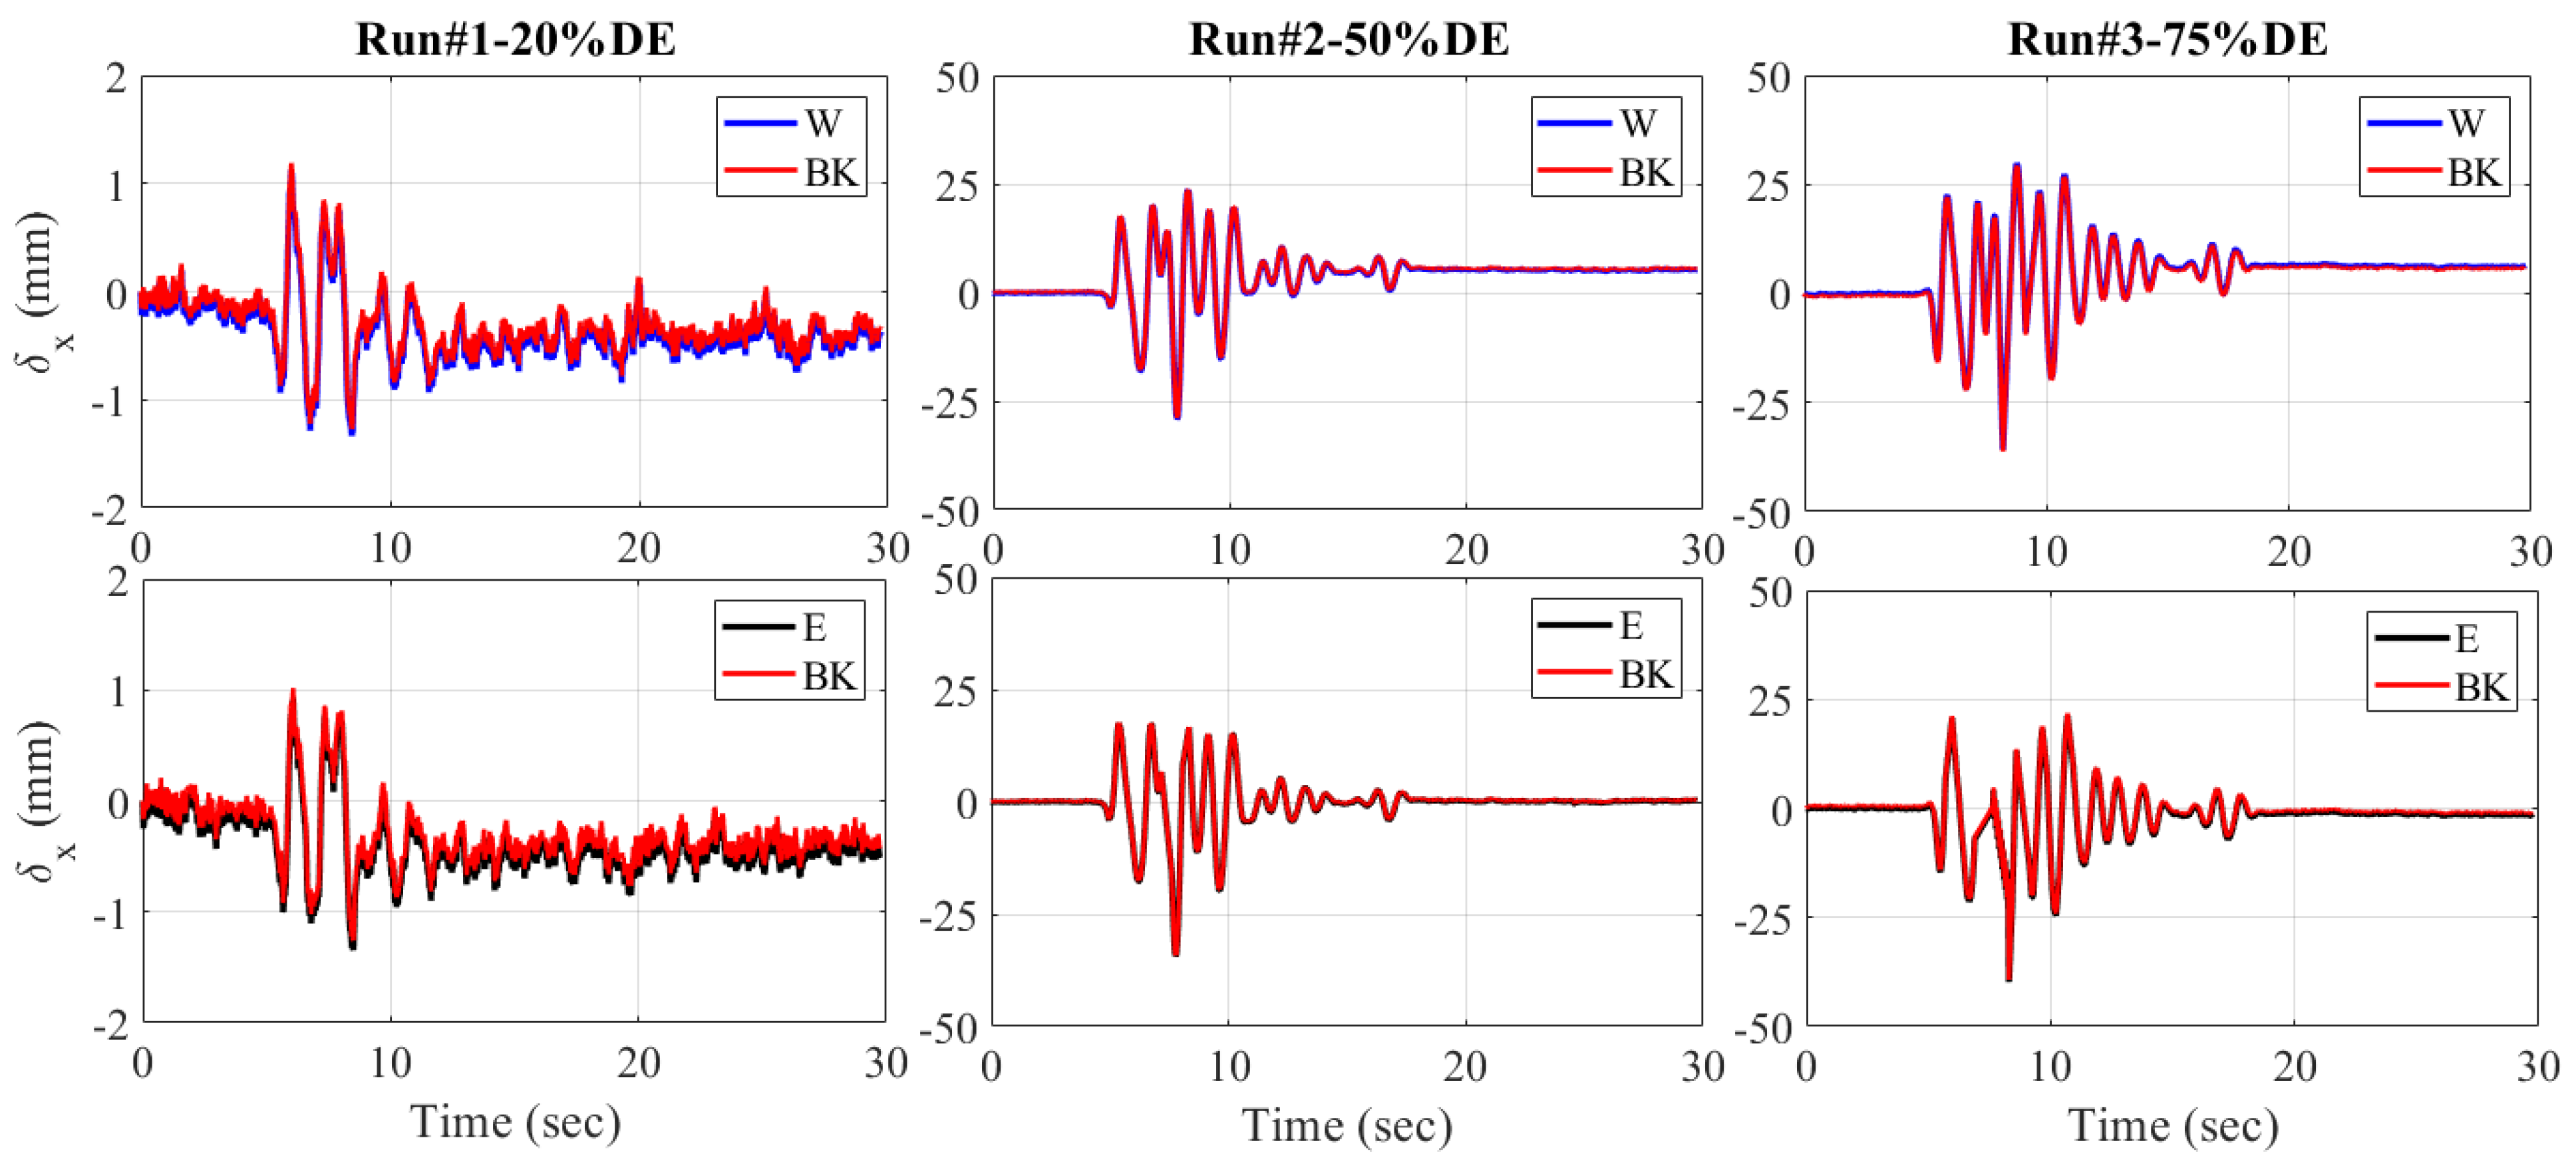
- The ABC bridge seismic test verifies the potential and accuracy of the proposed blob-based feature and refined matching algorithms, especially for bridge displacement responses. The displacement responses of the proposed algorithms show a similar trend to previous studies using target-tracking and string potentiometers. A minimum error of 0.02 mm is computed, while a slightly higher RMSE of 1.15 mm is calculated for the response to the higher-magnitude design earthquake.
- Overall, it is concluded that the proposed blob-based feature detection and refined matching algorithms have the potential for implementation in vision-based SHM of bridges. The combination of the blob-based feature detector SURF, SIFT, or KAZE with NN matching then refined with RANSAC and MSAC is proven to generate more accurate matching results. Therefore, they are recommended for implementation in detecting, extracting, and matching blob-based features of interest on bridge structures. Additionally, further study about detecting natural features on bridges or other civil infrastructures using the proposed algorithms is recommended.
Author Contributions
Funding
Data Availability Statement
Acknowledgments
Conflicts of Interest
References
- Ngeljaratan, L.; Moustafa, M.A.; Pekcan, G. A compressive sensing method for processing and improving vision-based target-tracking signals for structural health monitoring. Comput. Civ. Infrastruct. Eng. 2021, 36, 1203–1223. [Google Scholar] [CrossRef]
- Ngeljaratan, L.; Moustafa, M.A. Implementation and evaluation of vision-based sensor image compression for close-range photogrammetry and structural health monitoring. Sensors 2020, 20, 6844. [Google Scholar] [CrossRef] [PubMed]
- Ngeljaratan, L.; Moustafa, M.A. Structural health monitoring and seismic response assessment of bridge structures using target-tracking digital image correlation. Eng. Struct. 2020, 213, 110551. [Google Scholar] [CrossRef]
- Ngeljaratan, L.; Moustafa, M.A. System identification of large-scale bridges using target-tracking digital image correlation. Front. Built Environ. 2019, 5, 85. [Google Scholar] [CrossRef]
- Ngeljaratan, L.; Moustafa, M.A. Underexposed Vision-Based Sensors’ Image Enhancement for Feature Identification in Close-Range Photogrammetry and Structural Health Monitoring. Appl. Sci. 2021, 11, 11086. [Google Scholar] [CrossRef]
- Wang, X.; Wittich, C.; Hutchinson, T.; Bock, Y.; Goldberg, D.; Lo, E.; Kuester, F. Methodology and validation of UAV-based video analysis approach for tracking earthquake-induced building displacements. J. Comput. Civil Eng. 2020, 34, 04020045. [Google Scholar] [CrossRef]
- Wang, X.; Lo, E.; De Vivo, L.; Hutchinson, T.C.; Kuester, F. Monitoring the earthquake response of full-scale structures using UAV vision-based techniques. Struct. Control Health Monit. 2022, 29, e2862. [Google Scholar] [CrossRef]
- Bai, X.; Yang, M. UAV based accurate displacement monitoring through automatic filtering out its camera’s translations and rotations. J. Build. Eng. 2021, 44, 102992. [Google Scholar] [CrossRef]
- Asadzadeh, S.; de Oliveira, W.J.; de Souza Filho, C.R. UAV-based remote sensing for the petroleum industry and environmental monitoring: State-of-the-art and perspectives. J. Pet. Sci. Eng. 2022, 208, 109633. [Google Scholar] [CrossRef]
- Ngeljaratan, L.; Moustafa, M.A.; Sumarno, A.; Prasetyo, A.M.; Sari, D.P.S.; Maidina. Exploratory Study of Drone Data Stabilization with Implications in Vibration-based Structural Health Monitoring. Evergreen 2023, 10, 1776–1783. [Google Scholar] [CrossRef]
- Janeliukstis, R.; Chen, X. Review of digital image correlation application to large-scale composite structure testing. Compos. Struct. 2021, 271, 114143. [Google Scholar] [CrossRef]
- Pagani, A.; Azzara, R.; Carrera, E.; Zappino, E. Static and dynamic testing of a full-composite VLA by using digital image correlation and output-only ground vibration testing. Aerosp. Sci. Technol. 2021, 112, 106632. [Google Scholar] [CrossRef]
- Lowe, D.G. Distinctive Image Features from Scale-Invariant Keypoints. Int. J. Comput. Vis. 2004, 60, 91–110. [Google Scholar] [CrossRef]
- Bay, H.; Tuytelaars, T.; Van Gool, L. SURF: Speeded Up Robust Features; Springer: Berlin/Heidelberg, Germany, 2006; pp. 404–417. [Google Scholar]
- Alcantarilla, P.F.; Bartoli, A.; Davison, A.J. KAZE features. In Proceedings of the Computer Vision–ECCV 2012: 12th European Conference on Computer Vision, Florence, Italy, 7–13 October 2012; Part VI 12. pp. 214–227. [Google Scholar]
- Torr, P.H.; Zisserman, A. Robust parameterization and computation of the trifocal tensor. Image Vis. Comput. 1997, 15, 591–605. [Google Scholar] [CrossRef]
- Chum, O.; Matas, J. Matching with PROSAC-progressive sample consensus. In Proceedings of the 2005 IEEE computer society conference on computer vision and pattern recognition (CVPR’05), San Diego, CA, USA, 20–25 June 2005; pp. 220–226. [Google Scholar]
- Torr, P.H.; Zisserman, A. MLESAC: A new robust estimator with application to estimating image geometry. Comput. Vis. Image Underst. 2000, 78, 138–156. [Google Scholar] [CrossRef]
- Martínez-Otzeta, J.M.; Rodríguez-Moreno, I.; Mendialdua, I.; Sierra, B. Ransac for robotic applications: A survey. Sensors 2022, 23, 327. [Google Scholar] [CrossRef] [PubMed]
- Yu, S.; Zhang, J. Fast bridge deflection monitoring through an improved feature tracing algorithm. Comput. Civ. Infrastruct. Eng. 2020, 35, 292–302. [Google Scholar] [CrossRef]
- Duan, X.; Chu, X.; Zhu, W.; Zhou, Z.; Luo, R.; Meng, J. Novel method for bridge structural full-field displacement monitoring and damage identification. Appl. Sci. 2023, 13, 1756. [Google Scholar] [CrossRef]
- Prasad, S.; Chiang, C.-H.; Kumar, D.; Kalra, S.; Khandelwal, A. Robust and efficient feature-based method for structural health monitoring of large structures. J. Civil Struct. Health Monit. 2023, 13, 961–982. [Google Scholar] [CrossRef]
- Nugraha, G.D.; Sudiarto, B.; Ramli, K. Machine learning-based energy management system for prosumer. Evergreen 2020, 7, 309–313. [Google Scholar] [CrossRef]
- Srivastava, A.K.; Singh, B.K.; Gupta, S. Prediction of Tool Wear Using Machine Learning Approaches for Machining on Lathe Machine. Evergreen 2023, 10, 1357–1365. [Google Scholar] [CrossRef]
- Nugroho, A.C.P.T.; Al Hakim, B.; Hendrik, D.; Sasmito, C.; Muttaqie, T.; Tjolleng, A.; Kurniawan, M.A.; Komariyah, S. Mission Analysis of Small-Scale LNG Carrier as Feeder for East Indonesia: Ambon City as the Hub Terminal. Evergreen 2023, 10, 1938–1950. [Google Scholar] [CrossRef]
- Prasetyo, A. Gait Analysis Parameter Study Using Xbox Kinect Aimed at Medical Rehabilitation Tool. Evergreen 2022, 9, 511–518. [Google Scholar]
- Kamra, M.M.; Hu, C. Implementation of unstructured multi-dimensional THINC for practical multi-phase flow simulations. Evergreen 2017, 4, 52–57. [Google Scholar] [CrossRef]
- Hesty, N.W.; Supriatna, N.K.; Akhmad, K.; Kuncoro, A.H.; Nurliyanti, V.; Rahardja, M.B.; Sudarto, S.; Mulyadi, W.; Utama, P.A. Promoting Wind Energy by Robust Wind Speed Forecasting Using Machine Learning Algorithms Optimization. Evergreen 2024, 11, 354–370. [Google Scholar]
- Rousseeuw, P.J.; Leroy, A.M. Robust Regression and Outlier Detection; John Wiley & Sons: New York, NY, USA, 2005. [Google Scholar]
- Ruppert, D.; Carroll, R.J. Trimmed least squares estimation in the linear model. J. Am. Stat. Assoc. 1980, 75, 828–838. [Google Scholar] [CrossRef]
- Fischler, M.A.; Bolles, R.C. Random sample consensus: A paradigm for model fitting with applications to image analysis and automated cartography. Commun. ACM 1981, 24, 381–395. [Google Scholar] [CrossRef]
- Benjumea, J.; Saiidi, M.S.; Itani, A. Biaxial Seismic Performance of a Two-Span Concrete Bridge Model with Six ABC Connections. J. Bridge Eng. 2021, 26, 04021056. [Google Scholar] [CrossRef]
- Benjumea, J.; Saiidi, M.S.; Itani, A. Large-Scale Biaxial Shake-Table Studies of a Precast Bridge Model. J. Struct. Eng. 2021, 147, 04021104. [Google Scholar] [CrossRef]
- Ngeljaratan, L.; Bas, E.E.; Moustafa, M.A. Unmanned Aerial Vehicle-Based Structural Health Monitoring and Computer Vision-Aided Procedure for Seismic Safety Measures of Linear Infrastructures. Sensors 2024, 24, 1450. [Google Scholar] [CrossRef]

| Sensor | CMOS | Shutter | – | Format | .tiff |
| Lens | 35 mm | Image resolution (pix.) | Image type | Monochrome |
| Parameters | Algorithm | ||
|---|---|---|---|
| SURF | SIFT | KAZE | |
| Threshold | 6000 | 0.05 | 0.005 |
| Matching | Nearest neighbour (NN) | Nearest neighbour (NN) | Nearest neighbour (NN) |
| Algorithm | SURF | SIFT | KAZE |
|---|---|---|---|
| 387 | 448 | 909 | |
| 632 | 499 | 1610 | |
| Matching feat. | 229 | 254 | 533 |
| NN Accuracy (%) | 59.17 | 56.69 | 58.63 |
| SURF Detection | ||||||||
| Ref. Alg. | LMEDS | LTS | RANSAC | MSAC | ||||
| TH | Exact Match | Acc. (%) | Exact Match | Acc. (%) | Exact Match | Acc. (%) | Exact Match | Acc. (%) |
| 0.001 | 193 | 49.87 | 194 | 50.13 | 364 | 94.06 | 363 | 93.80 |
| 0.01 | 193 | 49.87 | 194 | 50.13 | 328 | 84.75 | 329 | 85.01 |
| 0.1 | 193 | 49.87 | 194 | 50.13 | 254 | 65.63 | 252 | 65.12 |
| 1 | 193 | 49.87 | 194 | 50.13 | 172 | 44.44 | 167 | 43.15 |
| SIFT Detection | ||||||||
| Ref. Alg. | LMEDS | LTS | RANSAC | MSAC | ||||
| TH | Exact Match | Acc. (%) | Exact Match | Acc. (%) | Exact Match | Acc. (%) | Exact Match | Acc. (%) |
| 0.001 | 224 | 50 | 224 | 50 | 421 | 93.97 | 409 | 91.29 |
| 0.01 | 224 | 50 | 224 | 50 | 372 | 83.04 | 388 | 86.61 |
| 0.1 | 224 | 50 | 224 | 50 | 310 | 69.20 | 289 | 64.51 |
| 1 | 224 | 50 | 224 | 50 | 229 | 51.12 | 241 | 53.79 |
| KAZE Detection | ||||||||
| Ref. Alg. | LMEDS | LTS | RANSAC | MSAC | ||||
| TH | Exact Match | Acc. (%) | Exact Match | Acc. (%) | Exact Match | Acc. (%) | Exact Match | Acc. (%) |
| 0.001 | 454 | 49.94 | 455 | 50 | 877 | 96.48 | 881 | 96.92 |
| 0.01 | 454 | 49.94 | 455 | 50 | 828 | 91.09 | 831 | 91.42 |
| 0.1 | 454 | 49.94 | 455 | 50 | 651 | 71.62 | 702 | 77.23 |
| 1 | 454 | 49.94 | 455 | 50 | 440 | 48.40 | 446 | 49.06 |
| Alg. | SURF Detection | SIFT Detection | KAZE Detection | |||||||||
|---|---|---|---|---|---|---|---|---|---|---|---|---|
| Ref. Alg. | (1) | (2) | (3) | (4) | (1) | (2) | (3) | (4) | (1) | (2) | (3) | (4) |
| TH | ||||||||||||
| 0.001 | −9.30 | −9.04 | 34.88 | 34.63 | −6.70 | −6.70 | 37.28 | 34.60 | −8.69 | −8.64 | 37.84 | 38.28 |
| 0.01 | −9.30 | −9.04 | 25.58 | 25.84 | −6.70 | −6.70 | 26.34 | 29.91 | −8.69 | −8.64 | 32.45 | 32.78 |
| 0.1 | −9.30 | −9.04 | 6.46 | 5.94 | −6.70 | −6.70 | 12.50 | 7.81 | −8.69 | −8.64 | 12.98 | 18.59 |
| 1 | −9.30 | −9.04 | −14.73 | −16.02 | −6.70 | −6.70 | −5.58 | −2.90 | −8.69 | −8.64 | −10.23 | −9.57 |
| (1) LMEDS (2) LTS (3) RANSAC (4) MSAC | ||||||||||||
| EQ Test | RMSE (mm) | |||
|---|---|---|---|---|
| S to BK | R to BK | E to BK | W to BK | |
| RUN#1-25%DE | 0.02 | 0.17 | 0.08 | 0.06 |
| RUN#2-50%DE | 1.09 | 0.96 | 0.16 | 0.22 |
| RUN#3-75%DE | 1.02 | 1.15 | 0.50 | 0.38 |
Disclaimer/Publisher’s Note: The statements, opinions and data contained in all publications are solely those of the individual author(s) and contributor(s) and not of MDPI and/or the editor(s). MDPI and/or the editor(s) disclaim responsibility for any injury to people or property resulting from any ideas, methods, instructions or products referred to in the content. |
© 2024 by the authors. Licensee MDPI, Basel, Switzerland. This article is an open access article distributed under the terms and conditions of the Creative Commons Attribution (CC BY) license (https://creativecommons.org/licenses/by/4.0/).
Share and Cite
Ngeljaratan, L.; Moustafa, M.A.; Sumarno, A.; Prasetyo, A.M.; Sari, D.P.; Maidina, M. Improved Blob-Based Feature Detection and Refined Matching Algorithms for Seismic Structural Health Monitoring of Bridges Using a Vision-Based Sensor System. Infrastructures 2024, 9, 97. https://doi.org/10.3390/infrastructures9060097
Ngeljaratan L, Moustafa MA, Sumarno A, Prasetyo AM, Sari DP, Maidina M. Improved Blob-Based Feature Detection and Refined Matching Algorithms for Seismic Structural Health Monitoring of Bridges Using a Vision-Based Sensor System. Infrastructures. 2024; 9(6):97. https://doi.org/10.3390/infrastructures9060097
Chicago/Turabian StyleNgeljaratan, Luna, Mohamed A. Moustafa, Agung Sumarno, Agus Mudo Prasetyo, Dany Perwita Sari, and Maidina Maidina. 2024. "Improved Blob-Based Feature Detection and Refined Matching Algorithms for Seismic Structural Health Monitoring of Bridges Using a Vision-Based Sensor System" Infrastructures 9, no. 6: 97. https://doi.org/10.3390/infrastructures9060097
APA StyleNgeljaratan, L., Moustafa, M. A., Sumarno, A., Prasetyo, A. M., Sari, D. P., & Maidina, M. (2024). Improved Blob-Based Feature Detection and Refined Matching Algorithms for Seismic Structural Health Monitoring of Bridges Using a Vision-Based Sensor System. Infrastructures, 9(6), 97. https://doi.org/10.3390/infrastructures9060097