Article

Steel Slag Sub-Ballast for Sustainable Railway Track Infrastructure

1
CONSTRUCT-GEO, Faculty of Engineering, University of Porto, Rua Dr. Roberto Frias, s/n, 4200-465 Porto, Portugal
2
Federal Institute of Education, Science and Technology of Rio Grande do Norte (IFRN), Av. Sen. Salgado Filho, 1559, Natal 59015-000, RN, Brazil
3
CONSTRUCT-LESE, Faculty of Engineering, University of Porto, Rua Dr. Roberto Frias, s/n, 4200-465 Porto, Portugal
4
School of Civil Engineering, University of A Coruña, Campus de Elviña, s/n, 15008 A Coruña, Spain
*
Author to whom correspondence should be addressed.
Infrastructures 2024, 9(7), 106; https://doi.org/10.3390/infrastructures9070106
Submission received: 20 May 2024 / Revised: 26 June 2024 / Accepted: 1 July 2024 / Published: 4 July 2024

Abstract

:
Railway lines require a significant amount of natural raw materials. Industrial by-products can be used instead, reducing the costs of natural aggregate exploration. This work analyzes a ballasted track’s short- and long-term performances when replacing conventional sub-ballast aggregate with steel slag. After an extensive laboratory characterization of the steel slag, the material performance was analyzed in a 3D numerical model of a ballasted track when included in a railway track. An empirical model was implemented and calibrated to predict the long-term permanent deformation induced in the track after many train passages. The results are compared with the allowable deformation limits required for conventional high-speed ballasted track railway lines. An additional analysis was conducted to assess the influence of steel slags on the critical speed of conventional railway tracks when used. The results show a residual impact on the critical speed value compared to the conventional sub-ballast made with natural aggregates.

1. Introduction

The ballasted track bed of a railway structure is composed of three main layers: ballast; sub-ballast; and subgrade. This type of structure is capable of supporting high loads applied by the train passage. The sub-ballast layer reduces and transfers the stresses to the subjacent layers and avoids the ascension of fine particles from the subgrade. However, after many repetitions over time, damages may occur (namely, in terms of excessive permanent deformation and rutting by fatigue), highlighting the need to evaluate the long-term performance of the substructure [1]. Indeed, understanding the deformation and failure mechanisms of geomaterials under cyclic loading is of paramount importance, as plastic or permanent deformation can lead to passenger discomfort [2]. Thus, the full comprehension of these aspects holds significant value in planning the maintenance of railway structures, aiming to minimize annual maintenance costs.
With the increase in train speed and freight trains, Railway Infrastructure Managers are concerned about the efficiency and sustainability of railway structures. Indeed, it is difficult to find natural aggregates that meet the technical specifications required to be applied as railway materials. Besides that, sustainability concerns highly encourage the reduction in natural raw material consumption together with the reuse and recycling of industrial by-products, contributing to a circular economy.
The steel industry produces a large quantity of slags discarded during the steel production process. The estimated production of steel slags generated in the process of melting steel scraps in electric arc furnaces (EAF) is approximately 200 kg per ton of steel produced [3]. The total worldwide steel production in 2022 was 1.88 × 10⁹ tons, resulting in approximately 376 million tons of EAF slag produced [3]. Steel slags are a composite of various components, including silica, calcium oxide, magnesium oxide, as well as aluminum and iron oxides. Most steel slags are strong, dense, cube-shaped aggregates with good polishing resistance [4]. Therefore, steel slag aggregates have demonstrated high friction angles, high stiffness modulus, low abrasion indicated by Los Angeles and micro-Deval values, and high specific weight [5]. This material finds application in several areas of civil engineering, such as in the production of conventional concrete [6] and asphalt concrete [7], road bases and sub-bases [8], railway ballast [9], and sub-ballast [10]. Additionally, it can be used in cement production, among other applications [11].
The expansion of new railway lines and renewal of old ones bring new opportunities to the use of industrial by-products instead of natural aggregates. To validate the effectiveness of steel furnace slag in railway construction, numerous studies have been conducted. Delgado et al. [12] have proved that the use of steel slag aggregates in scaled ballast shows superior strength parameters and higher long-term stiffness when compared to granite aggregate. They also demonstrated a greater tendency to stabilize permanent deformations and lower particle breakage after long-term cyclic testing. These characteristics resulted in less vertical displacements of the rail observed in numerical analysis [13,14,15]. Jing et al. [16] and Esmaeili and Askari [17] suggested a combination of 75% steel slag and 25% natural aggregate to compose a ballast layer since the quantity of steel slag produced was insufficient for constructing long railway sections. Moreover, they indicated that this combination provided favorable properties in terms of stiffness, damping ratio, and friction angle, resulting in enhanced mechanical behavior of the railway track.
Most of these studies have analyzed the feasibility of using slag as ballast [18,19], but very few studies have evaluated the possibility of using steel slag as an aggregate for the sub-ballast layer, taking into account the short- and long-term performance of the railway tracks and its influence on the critical speed of the track. Indeed, several researchers have focused on the experimental characterization of different aggregates through laboratory tests simulating their long-term behavior [20,21,22,23,24]. However, comprehensive works examining the overall performance of steel slags incorporated into a railway track using sophisticated numerical simulations supported by experimental tests are still lacking.
As demonstrated previously by Alves Costa et al. [25] and Fernández-Ruiz et al. [26], railway tracks crossing geotechnical profiles with low shear wave velocities may encounter challenges linked to the critical speed phenomenon. This phenomenon arises when the train’s operational velocity matches the wave propagation speed of the track–soil system, causing an amplification of displacements and subsequently escalating the demands for track maintenance. Within this context, the possibility of replacing the conventional sub-ballast material with a new material requires the evaluation of its effect on the attained critical speed value.
Consequently, a case study was formulated to assess the repercussions on critical speed resulting from the substitution of sub-ballast with steel slag for both a ballasted track and a slab track using 3D simulation models of the track. Moreover, this paper presents a detailed and innovative analysis of steel slag performance in the short and long term. The short-term analysis focused on the frictional and resilient behavior, while the long-term analysis simulated the permanent deformation after a large number of cycles. The numerical analyses are supported by experimental tests, including triaxial compression tests in monotonic and cyclic conditions. Therefore, this work is able to analyze the effect of steel slag properties (such as increased weight or increased friction angle) on the railway track performance.

2. Steel Slag Characterization

2.1. Steel Slags

In this work, Portuguese electric arc furnace slags certified to be used as aggregates for construction were characterized in the laboratory to allow for calibration of the constitutive models used in the subsequent numerical analysis. These slags have suffered an industrial process described by Gomes Correia et al. [5], leading to constant material properties of being dense, stiff, clean, and resistant to abrasion. With a slag production of 240,000 tons per year, there would be enough material to include in the sub-ballast layer of 30 km of railway line.
As can be observed in the grain size distribution curve illustrated in Figure 1, it comprises a well-graded gravel with silt according to the Unified Classification System. The curve shown is within the Portuguese specification range for sub-ballast, which enables the layer to fulfill the main functions as both a separator and a filter. This allows for drainage and prevents excessive pore pressure resulting from cyclic loads. Additionally, it prevents the migration of fine particles from the subgrade to the ballast and the penetration of ballast particles into the subgrade. Table 1 includes the main physical parameters derived from the material grading, the specific gravity (EN 1097-6 [27]), as well as the compaction characteristics obtained from the Modified Proctor test [28] and California Bearing Ratio [29].

2.2. Experimental Program

The experimental program comprised triaxial compression tests in monotonic conditions and cyclic triaxial tests. The specimens for both tests were prepared by compacting the steel slag in the optimum point of the Modified Proctor curve in a mold 300 mm high and with 150 mm of diameter, allowing for a ratio specimen diameter/maximum particle dimension of around 5 in agreement with the standard 0520-2009 from the Japanese Geotechnical Society [31]. The compaction was performed with a vibrating hammer adapted for this purpose, applying 1 min of vibratory compaction for each layer of 50 mm. After placing the specimen in the triaxial cell, a consolidation phase followed to apply the desired effective isotropic confining stress. Although there was no attempt to saturate the specimen, the applied confining pressure was assumed to be effective because suction could be considered insignificant for these materials [32]. More information regarding the specimen preparation can be found in Alves et al. [10].
For the shearing stage of monotonic tests, a 100 kN load frame was used, and the tests were sheared at a strain rate of 0.2 mm/min. The cyclic triaxial tests followed method B of EN 13286-7 [33], which corresponded to a cyclic test with constant effective confining stress. A sinusoidal load was applied, oscillating between small deviatoric stress of 5 kPa (qmin) and maximum deviatoric stress (qmax), the deviatoric being stress defined as the difference between vertical and horizontal stresses. The tests were instrumented with four Linear Variable Differential Transformers (LVDT), three axial transformers, and one radial transformer to allow for a more accurate evaluation of specimen deformation during the test. Table 2 summarizes those load stages for the two types of tests performed: (i) for the resilient modulus evaluation; (ii) for the permanent deformation evaluation. The resilient modulus test was performed at 1 Hz, while the permanent deformation test was performed at 2 Hz to speed the 1,000,000 cycles test, although it was observed that the frequency did not have any influence on the results.

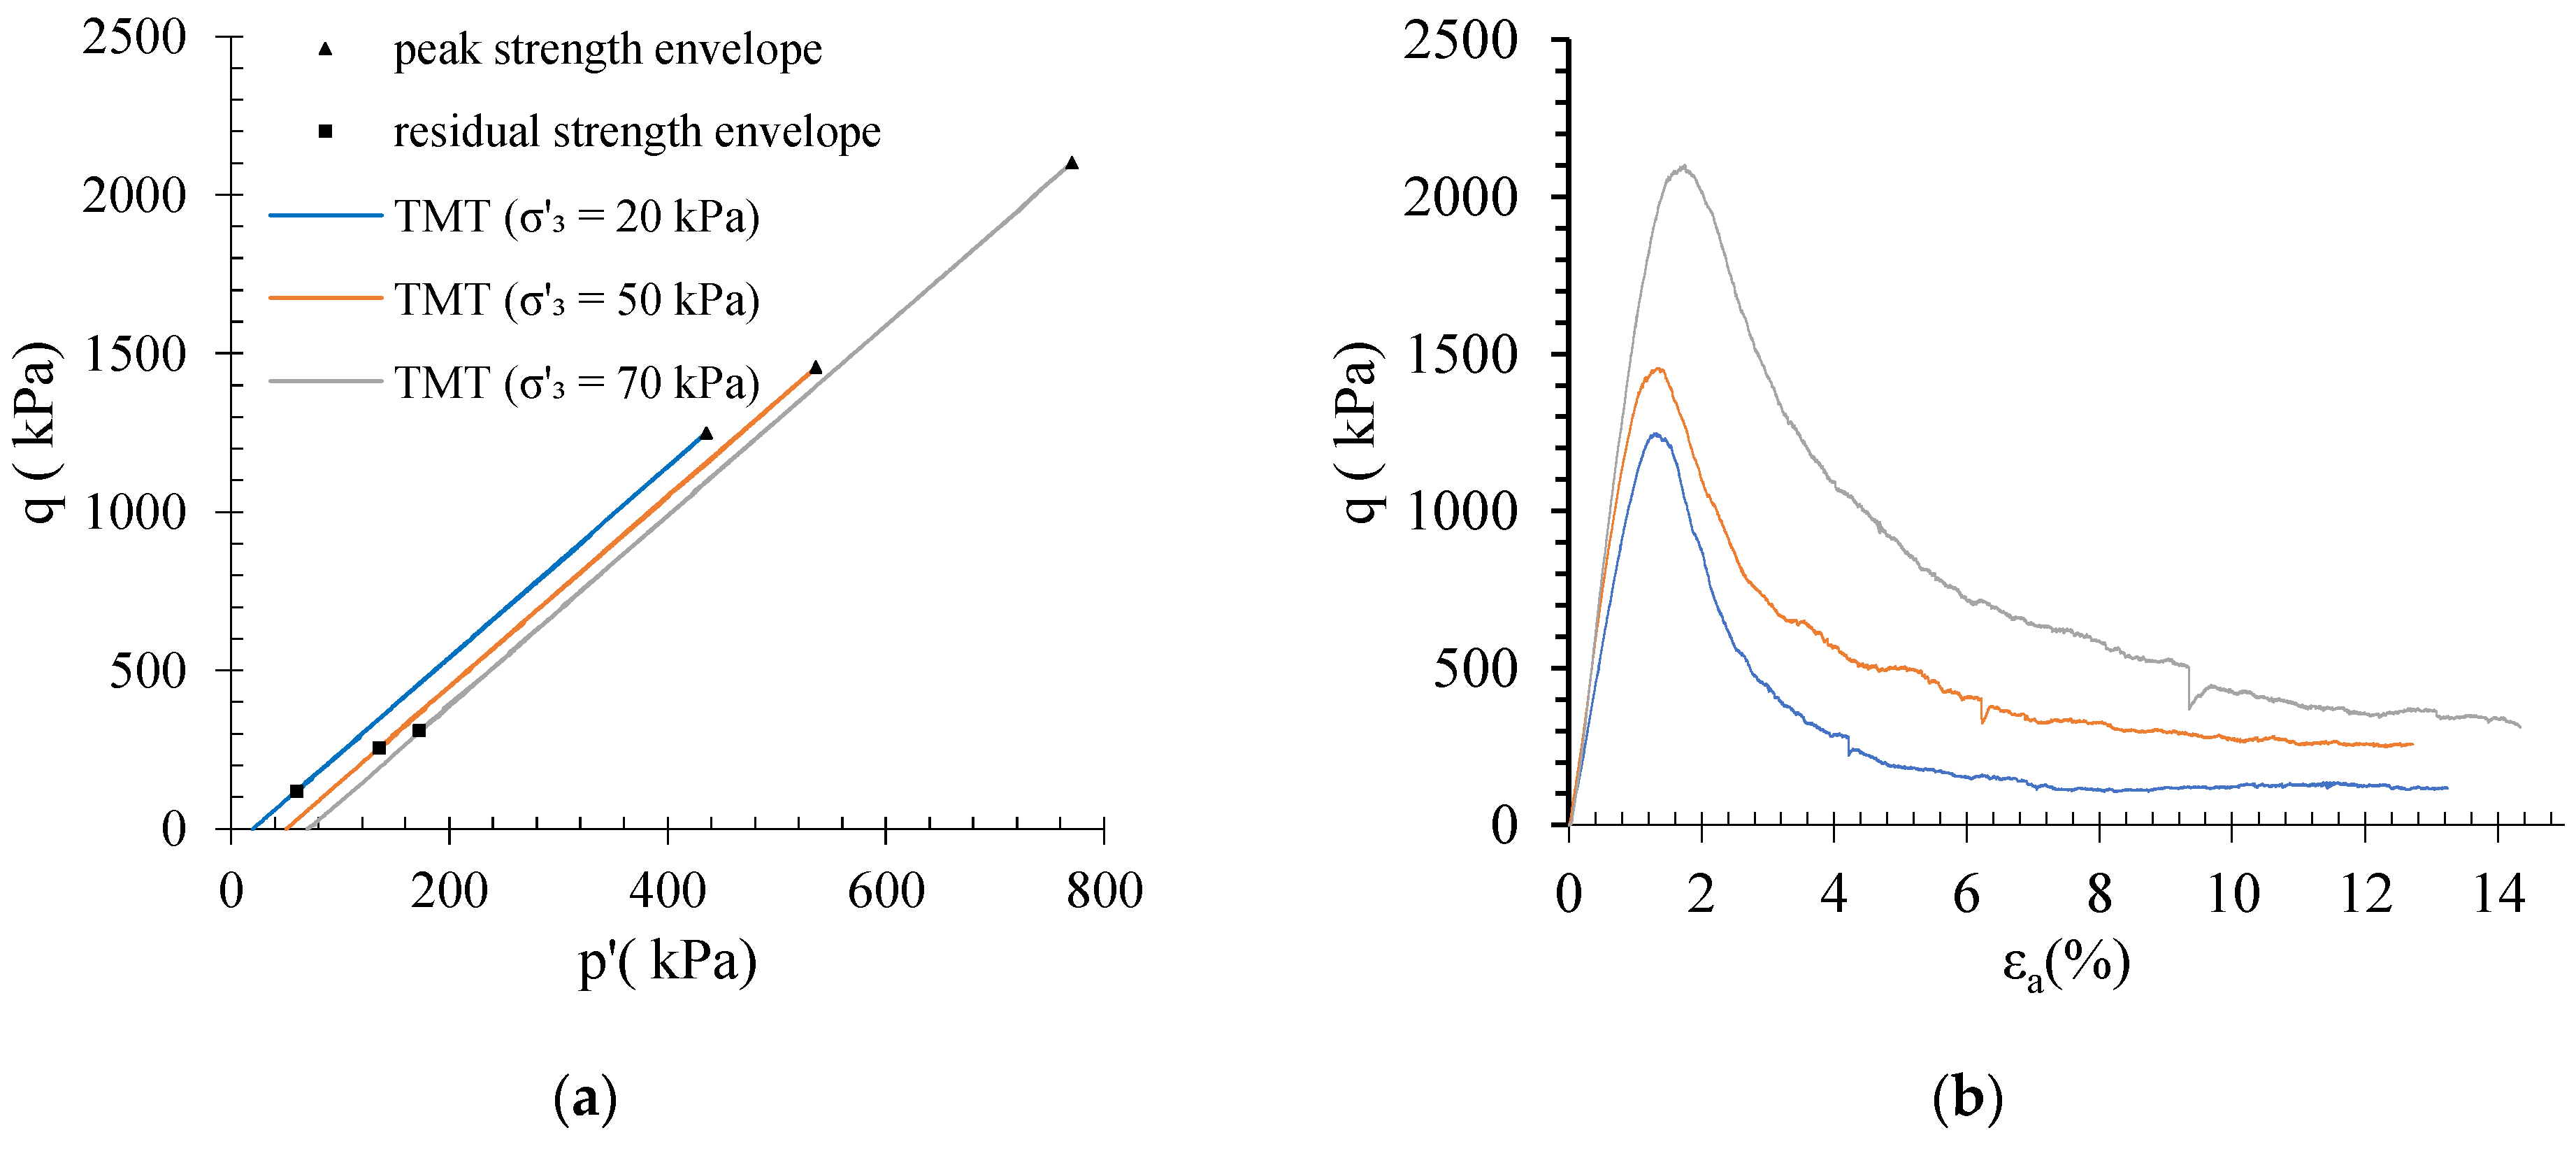
2.3. Stress–Strain Behavior

The results of the monotonic triaxial tests are presented in Figure 2, where the stress paths (Figure 2a) are presented in terms of deviatoric stress (q =   σ 1 σ 3 ) and mean effective stress ( p  =   σ 1 + 2 σ 3 3   ). In Figure 2b, the stress–strain curves in terms of deviatoric stress and axial strain are also presented. The stress–strain curves are typical of dense granular materials with a peak strength followed by a post-peak softening. As expected, the slope of the initial tangents to the stress–strain curves increases with confining pressure because the stiffness increases with effective stress. From the stress paths, the peak strength envelope was obtained, which corresponded to a peak angle of shearing resistance of 64° and a cohesion intercept of 85 kPa. Such a high peak angle, higher than the typical values of conventional sub-ballast materials, is the consequence of the grain size, particle angularity, and particle strength, leading to significant interlocking and dilatancy [5,12,34]. Although granular materials typically present a non-linear strength envelope for a large range of effective stresses [35]; in this case, a linear envelope for the range of confining stresses analyzed was assumed. For this reason, an artificial cohesion intercept is included, although the materials do not have any cohesion due to the lack of fine particles or cementation.

2.4. Resilient and Permanent Deformation Parameters for the Steel Slag

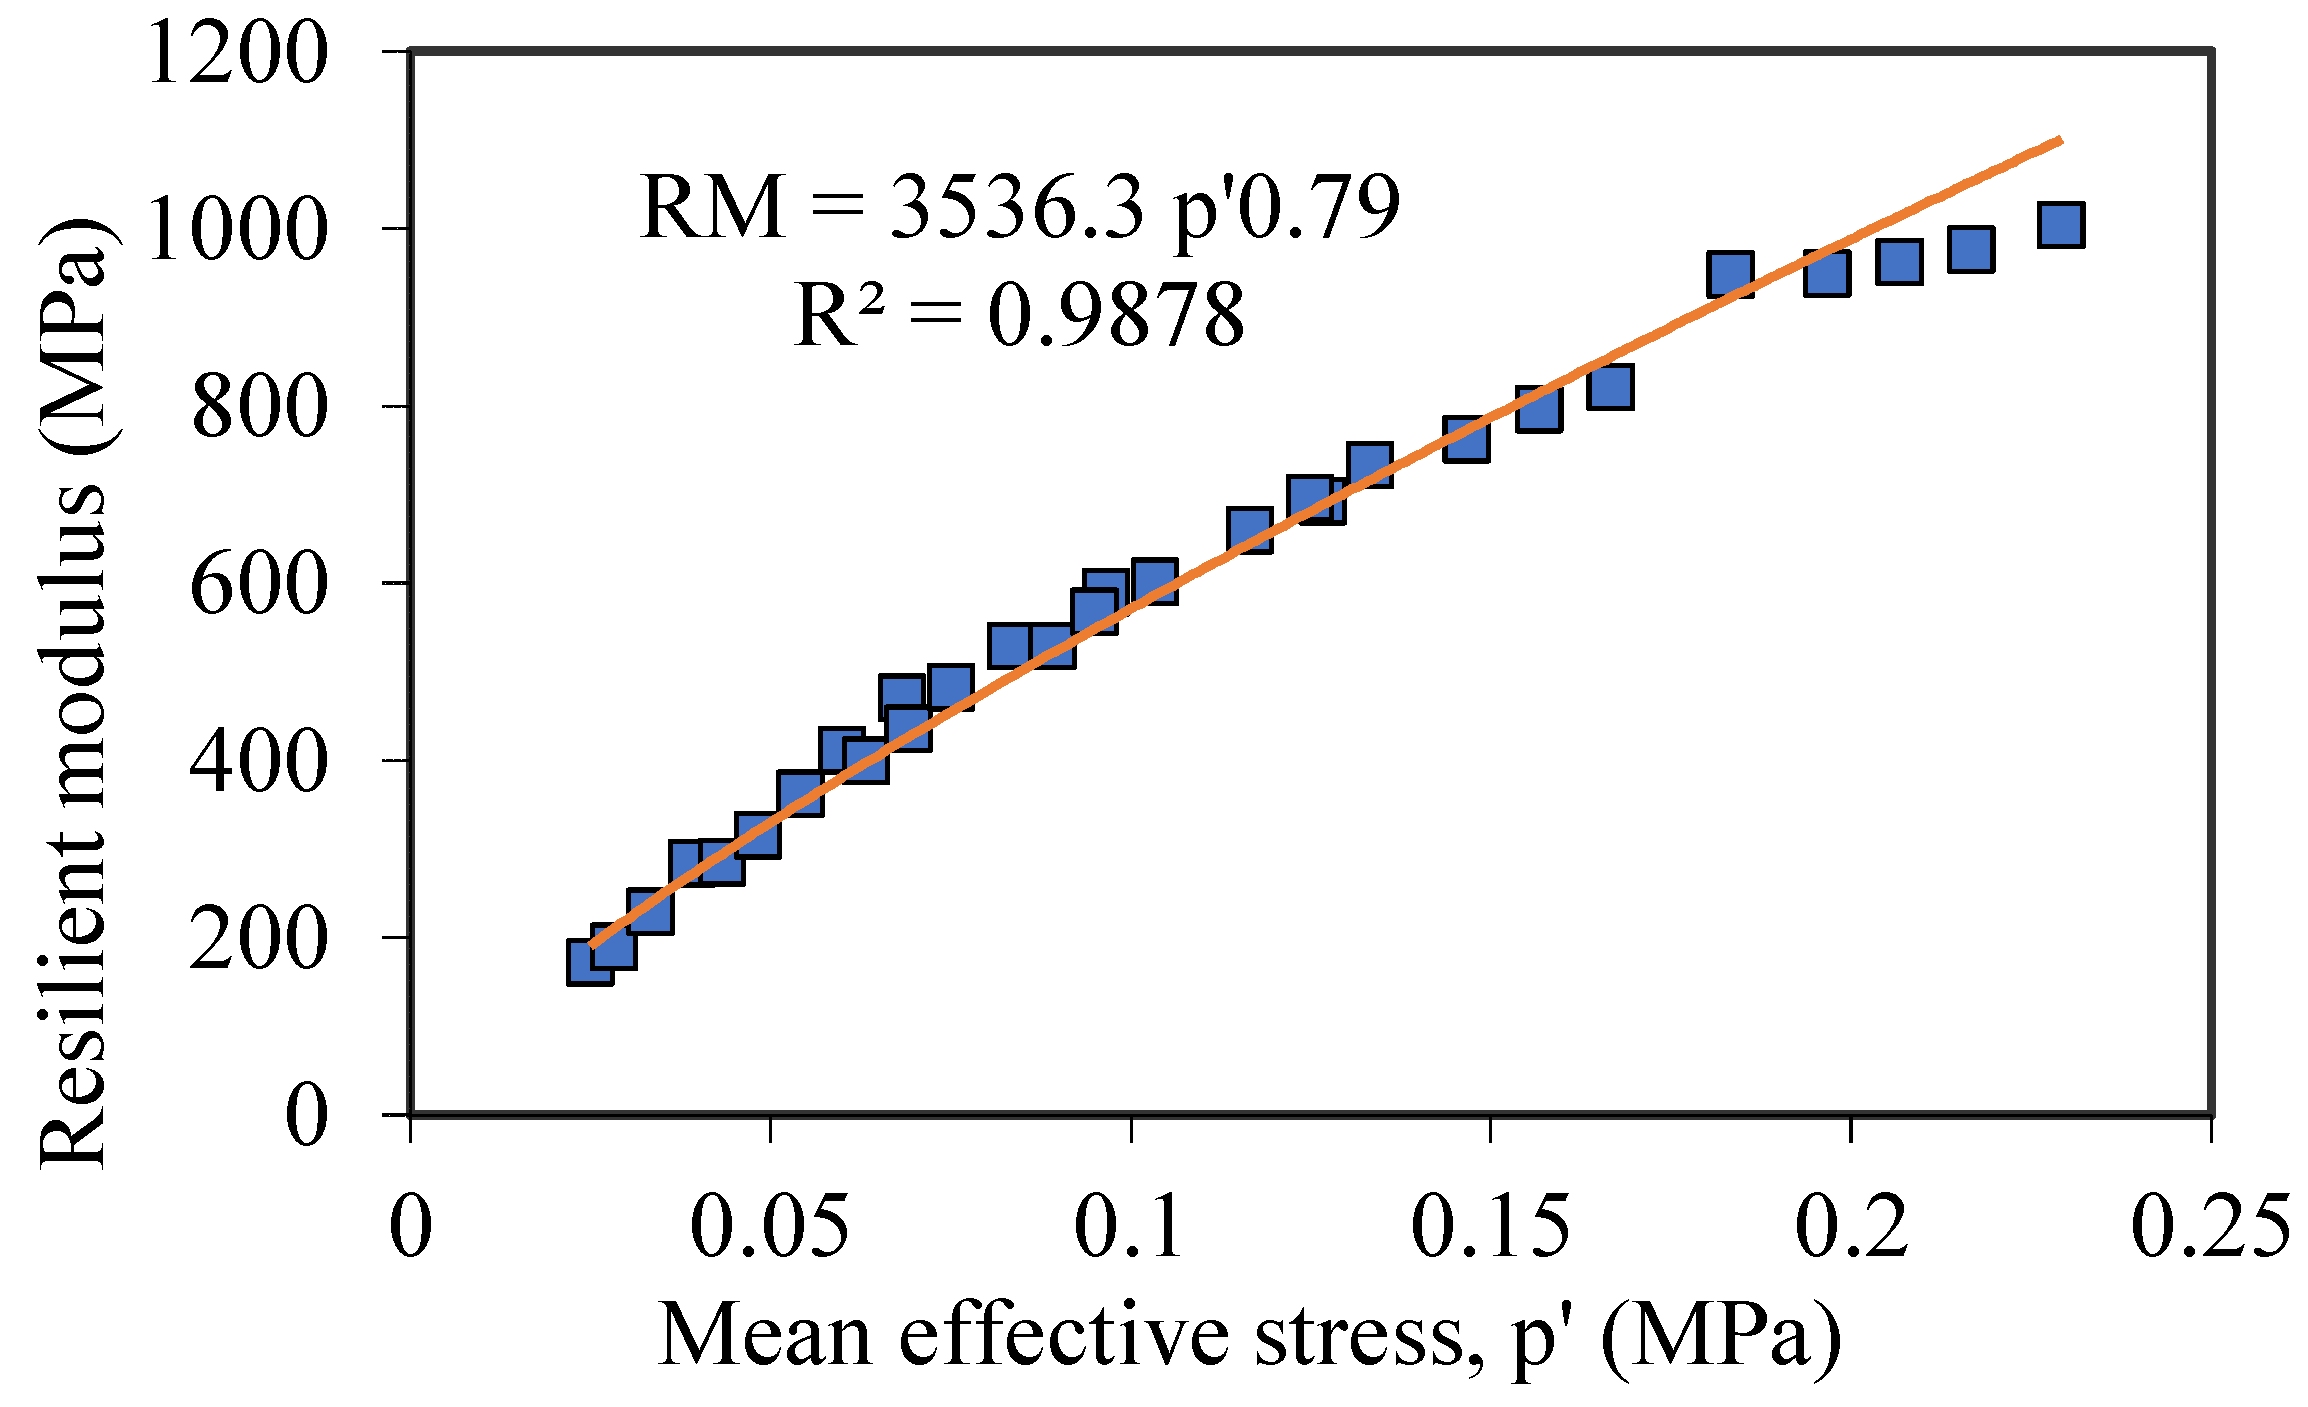
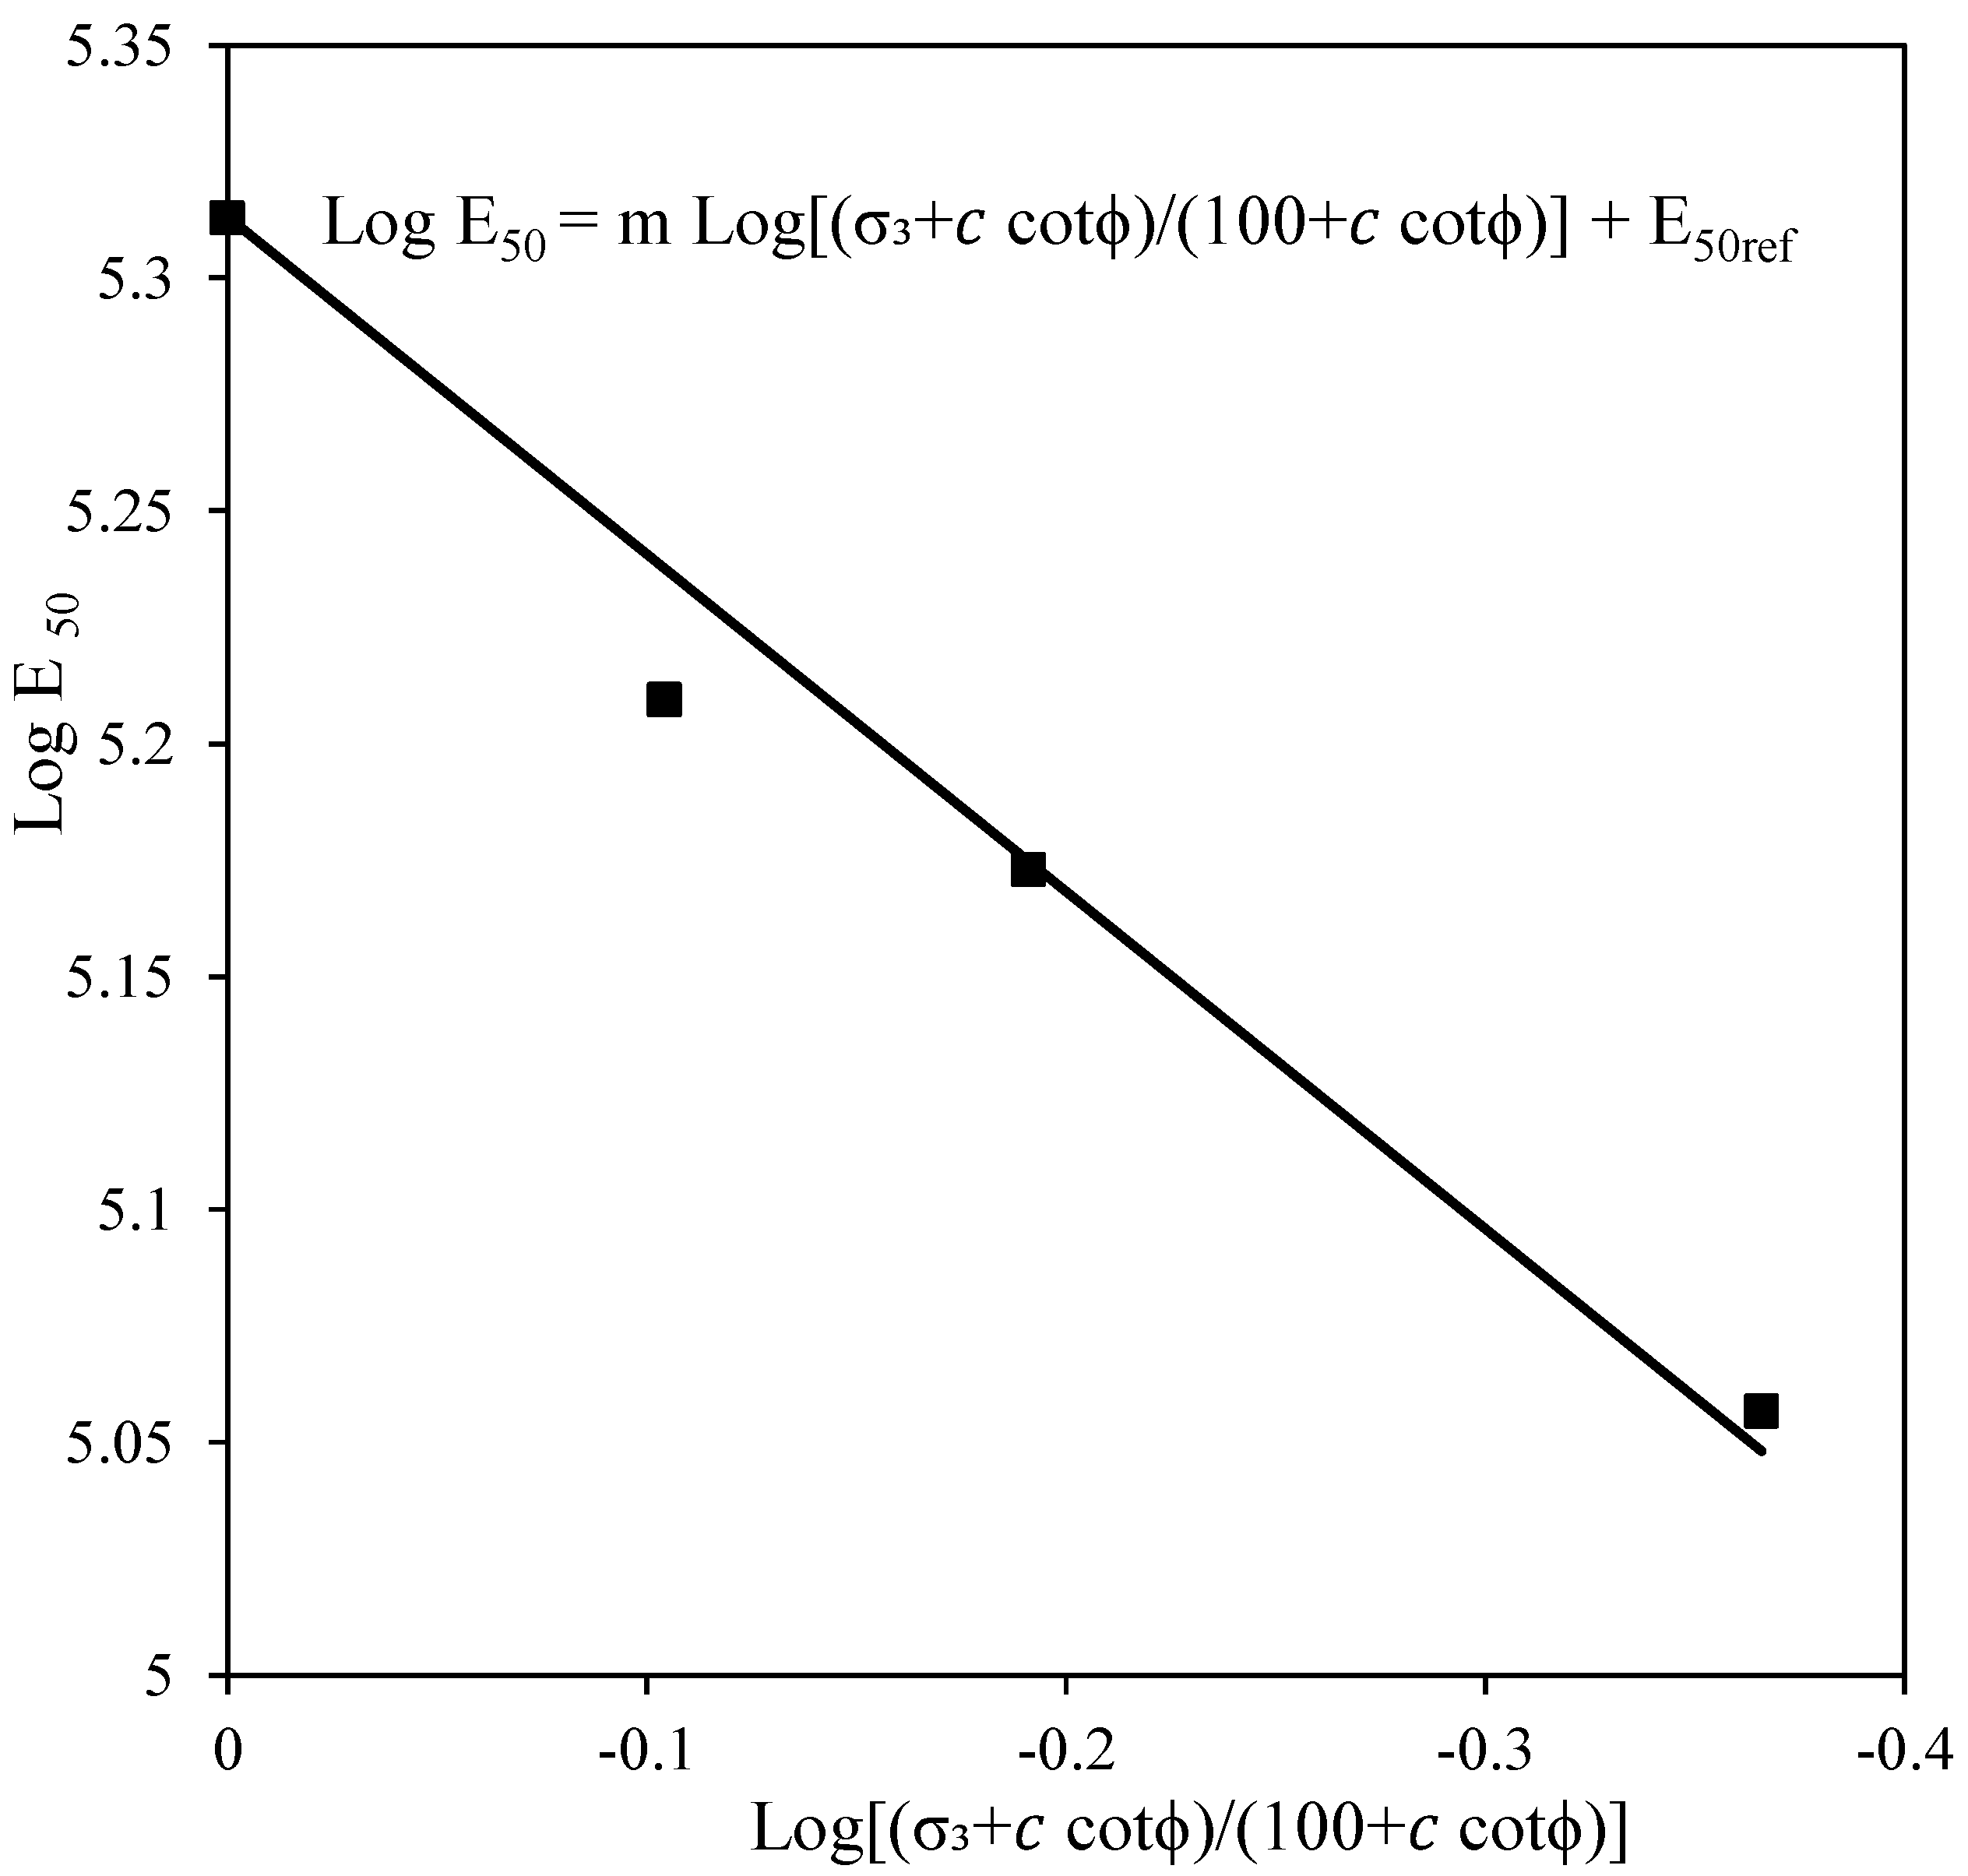
2.4.1. Resilient Modulus Evaluation

As mentioned above, two types of cyclic triaxial tests were performed: one for the evaluation of the resilient modulus; and another one for the evaluation of the permanent deformation.
The resilient modulus was calculated for each cycle. Then, for each load level with 100 cycles, an average value was considered in the last 10 load cycles. The evolution of resilient modulus for the different load levels was analyzed by plotting it against the mean effective stress, p’, defined as the average of the principal effective stresses, as shown in Figure 3.

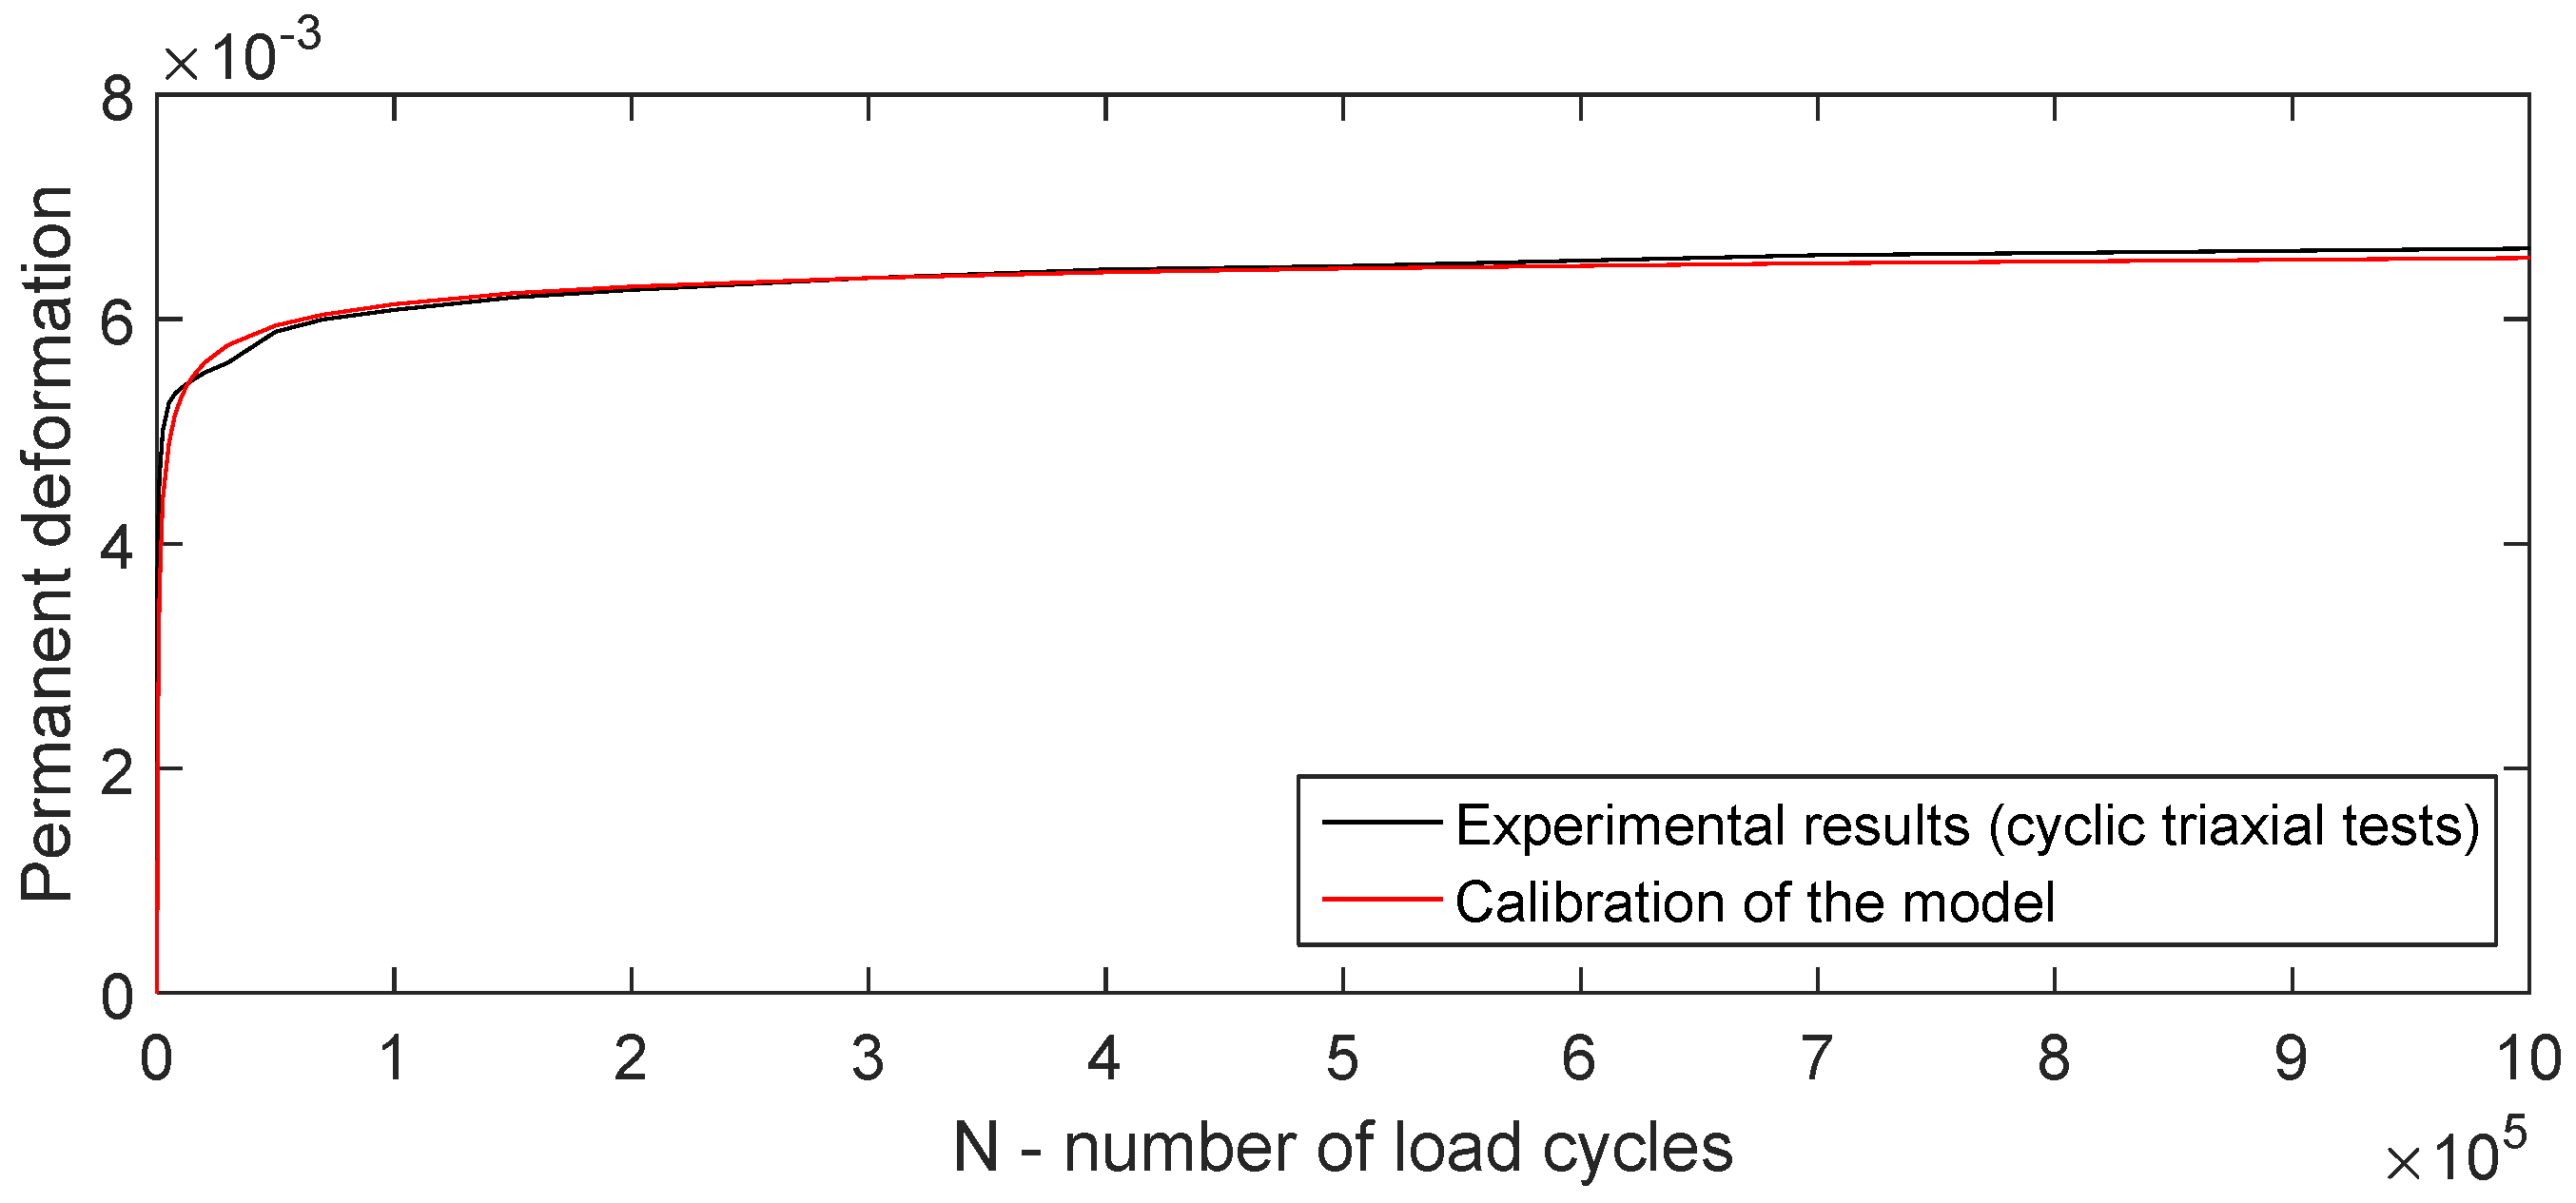
2.4.2. Permanent Deformation Evaluation

The permanent deformation was analyzed for one million load cycles, greater than what is proposed in EN 13286-7 [33], because the steel slag is a man-made material, and the standards were developed for natural materials. The results, illustrated in Figure 4, demonstrate that the material presents a plastic shakedown behavior [36], leading to a stabilization of the permanent deformation after 300,000 load cycles.

3. Long-Term Performance of a Ballast Track with Steel Slag

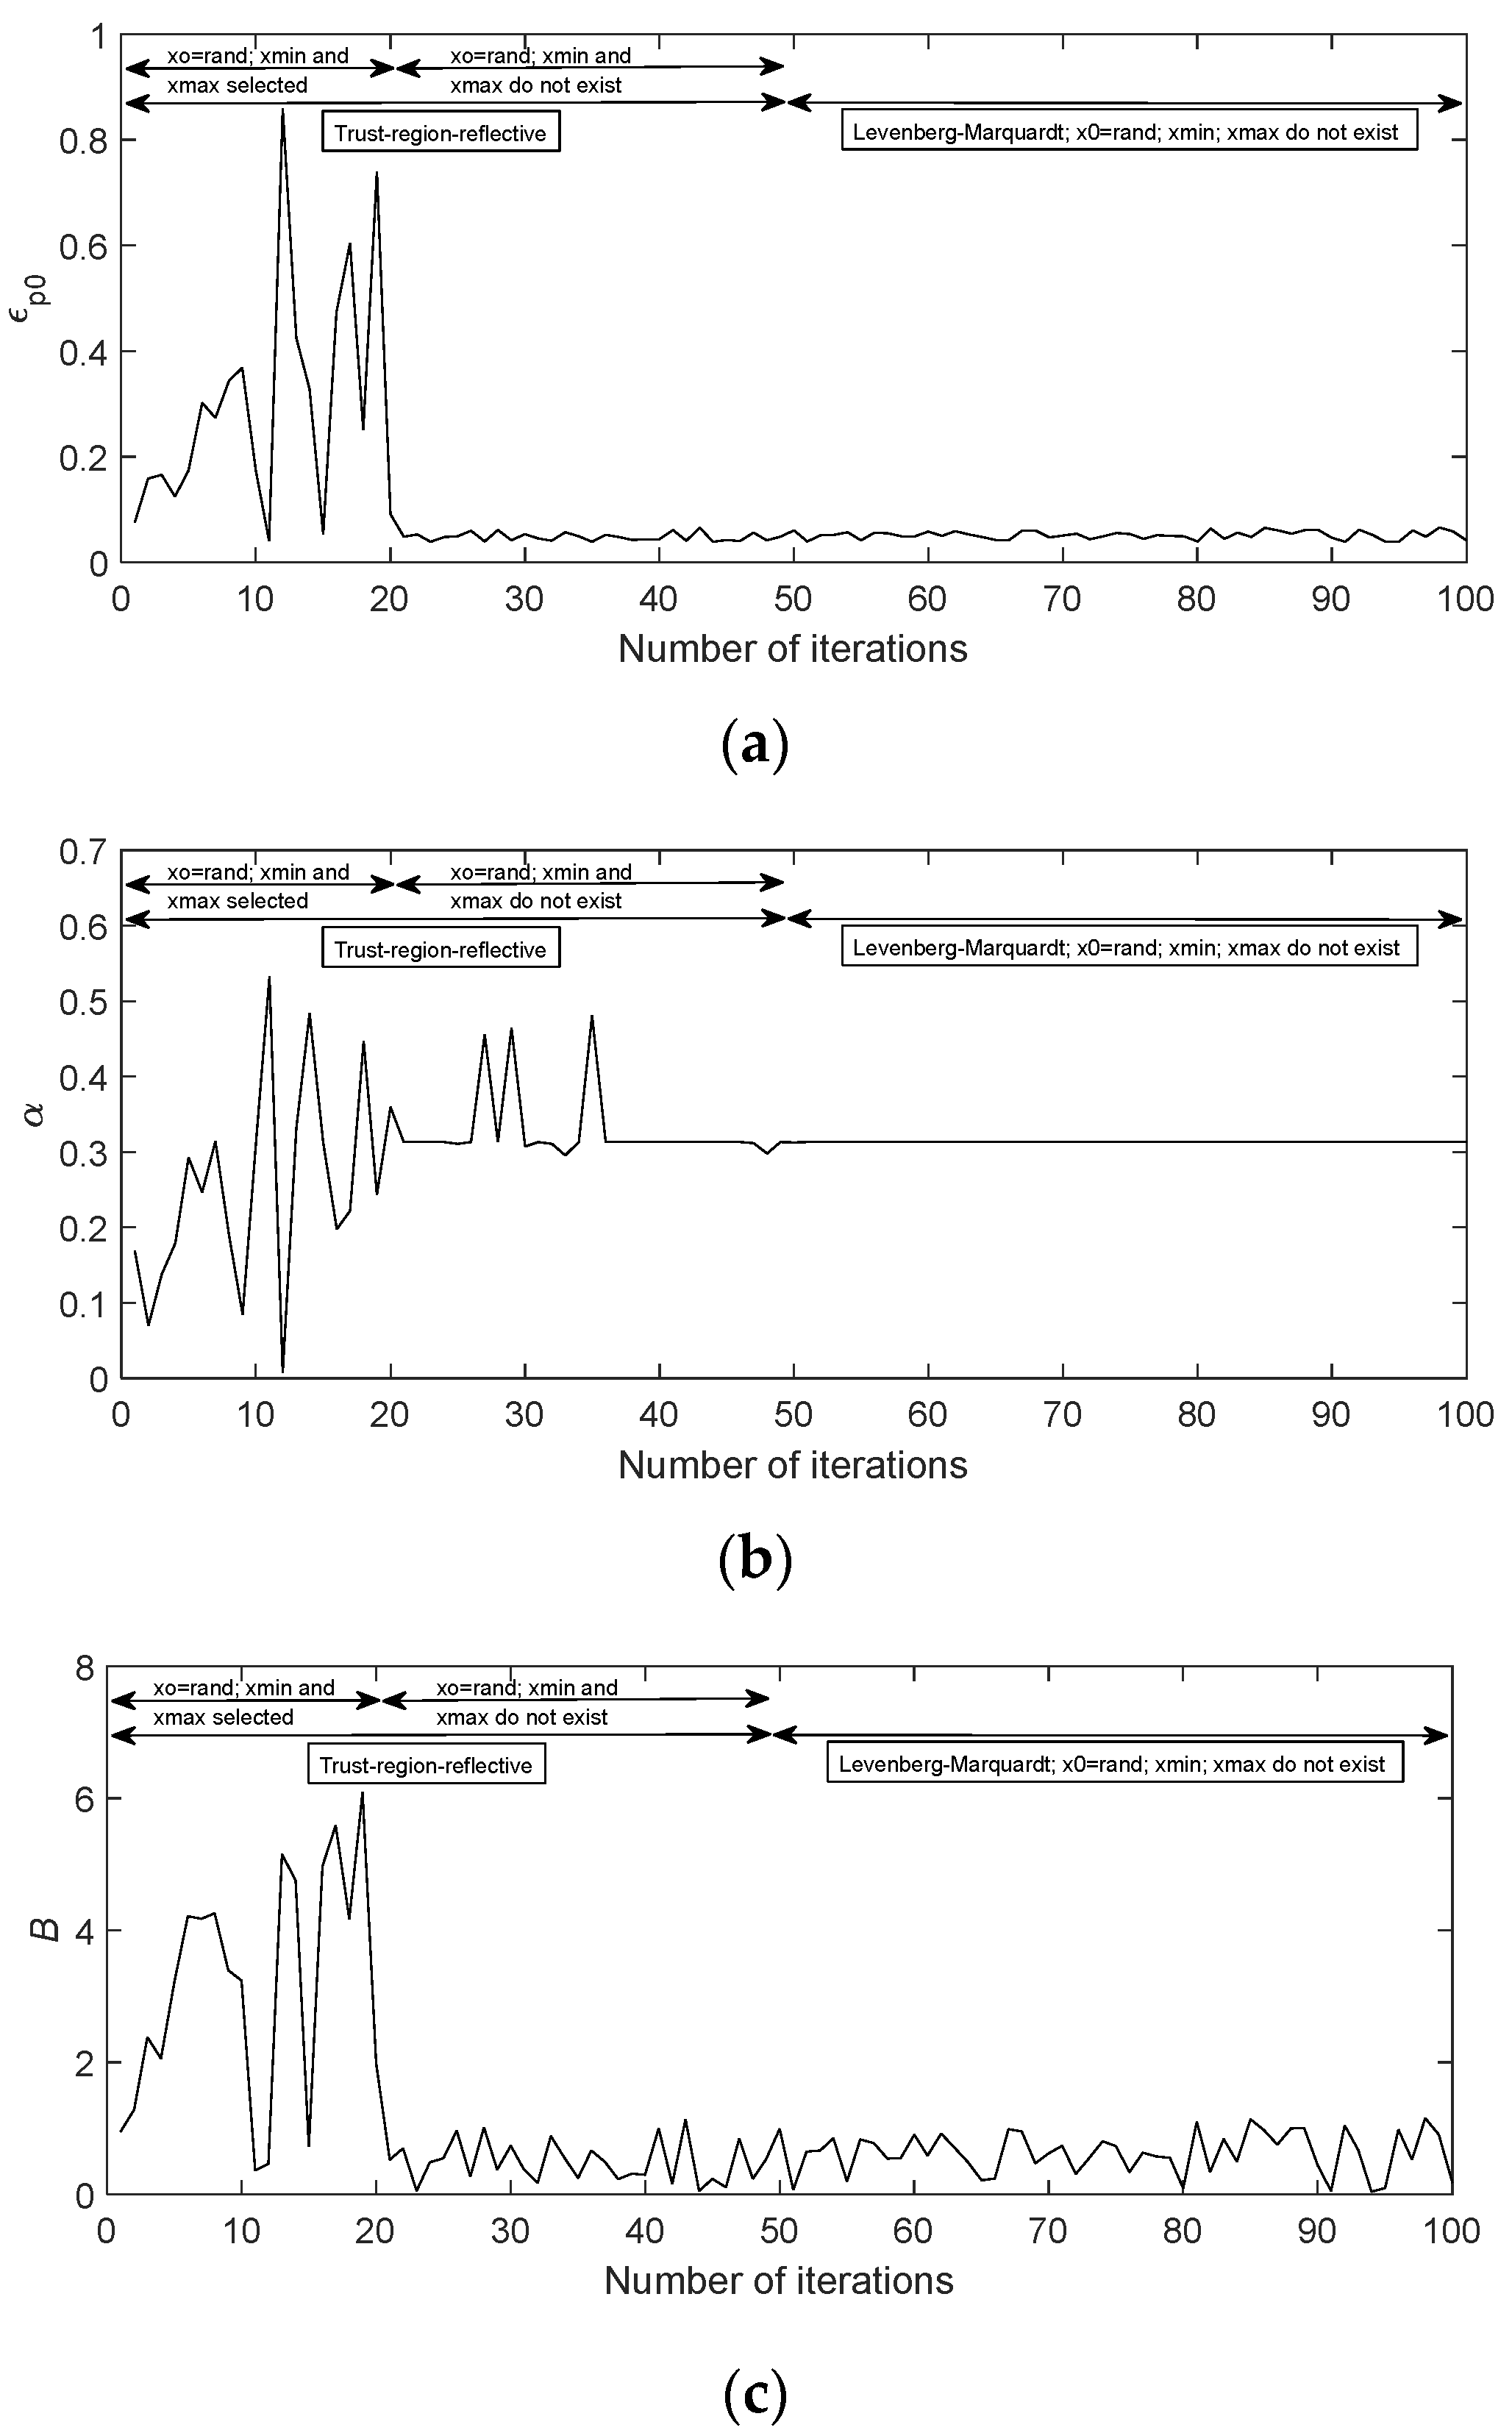
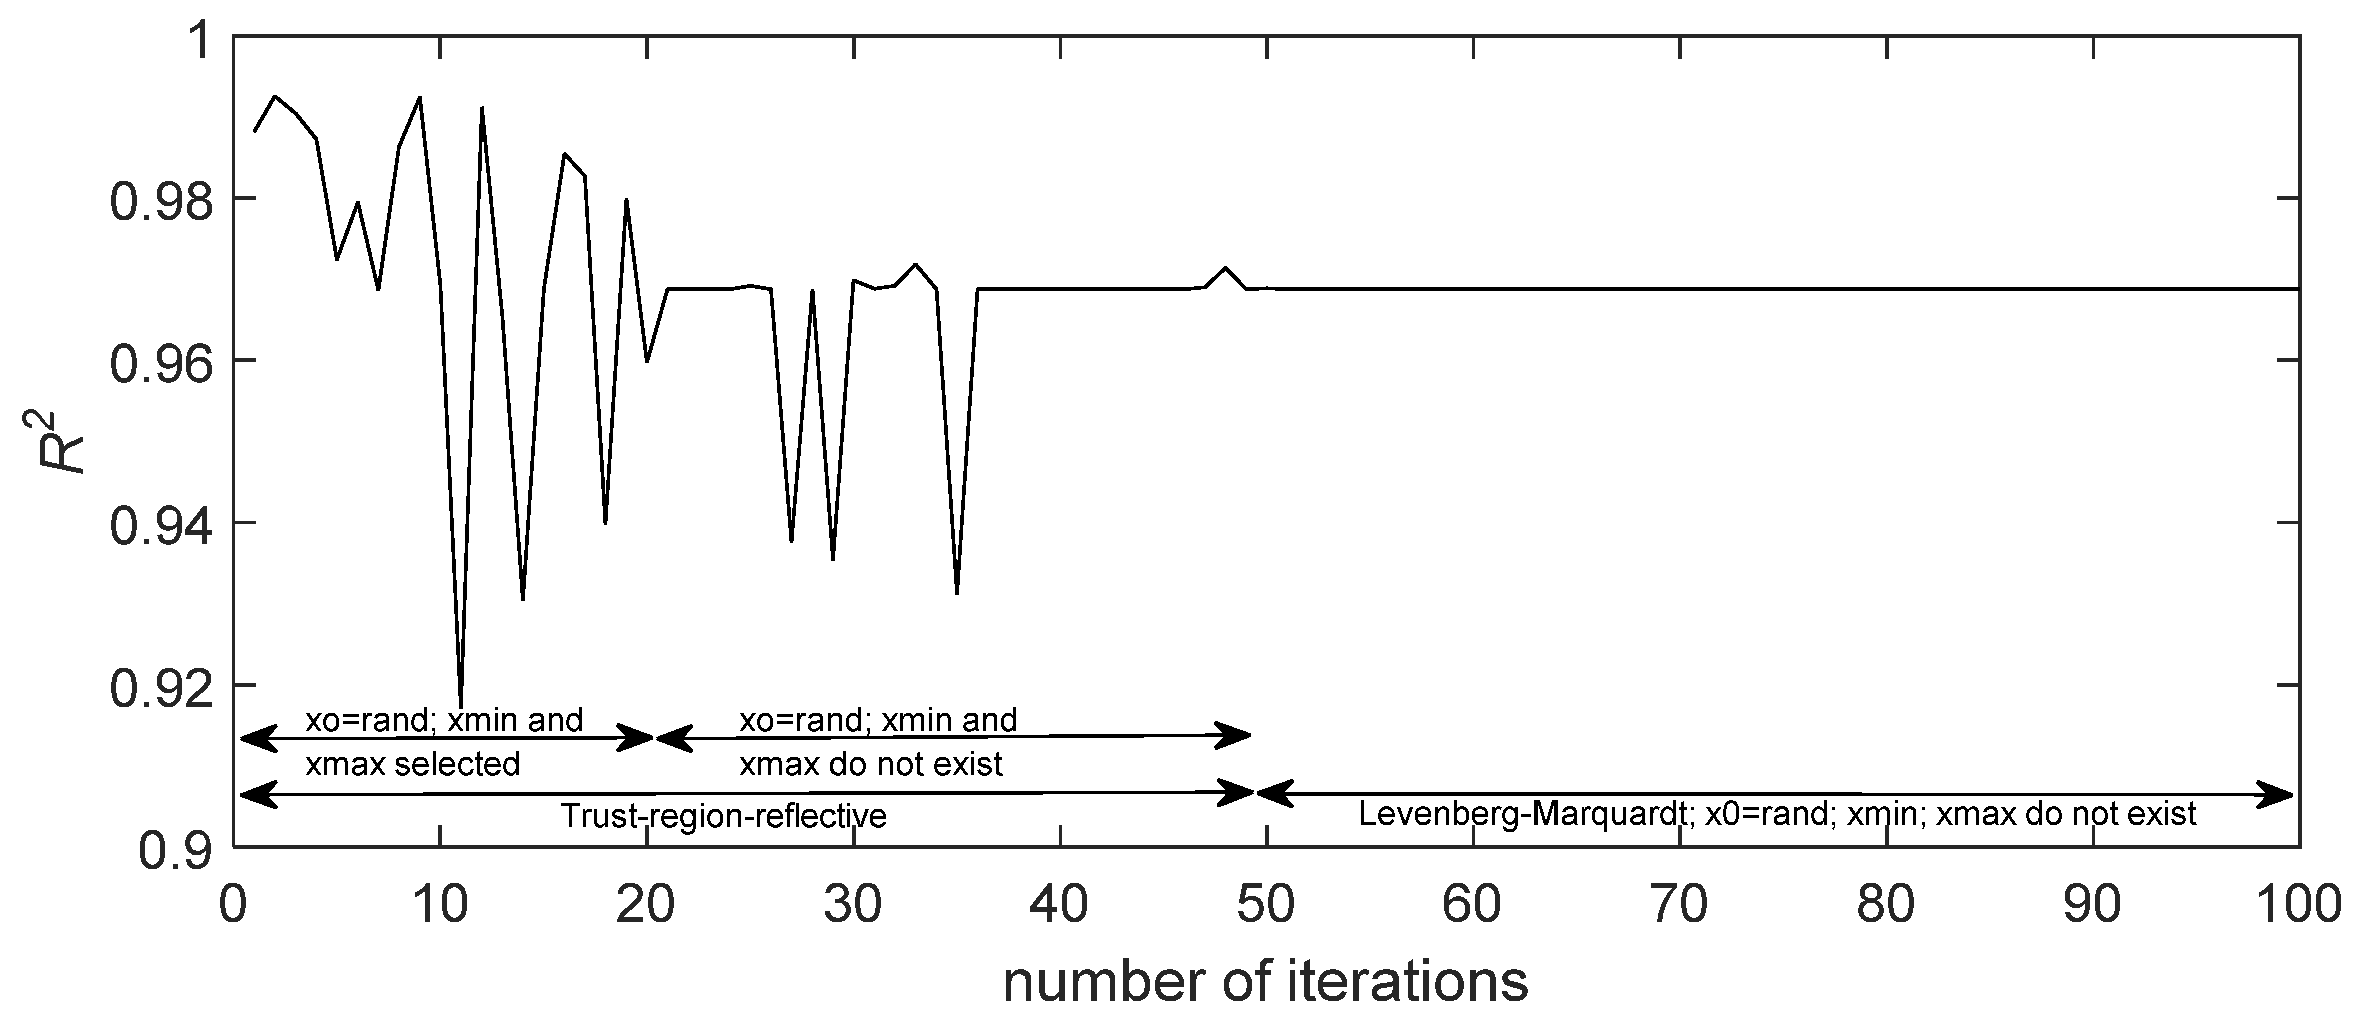
3.1. Calibration of Permanent Deformation Empirical Models

The evolution of the track’s settlements and its prediction implies a deep knowledge of the long-term behavior of the geomaterials and the selection of models that can accurately simulate the dynamic behavior of the track. Nevertheless, the incorporation of these models in complete models of the track is still a very unexplored field [37].
The geomaterials can usually be characterized by their resilience or plastic deformations when submitted to cyclic loads. The plastic/permanent deformations of the railway tracks are difficult to determine and can be predicted either by numerical simulations using the elastoplastic models, shakedown theory, or mechanistic–empirical permanent deformation models [1]. The last ones are very easy to implement and are very effective and efficient. These models describe a relationship between the number of load cycles, stress levels, and the accumulated permanent deformation and can consider the stress history and physical state of the geomaterials.
In this analysis, an empirical permanent deformation model was selected to predict the long-term performance of the ballasted track with steel slag. The model was first developed by Gidel et al. [38] and posteriorly updated by Chen et al. [39]. The model considers the effect of the number of load cycles, the elastic stress state in the soil, the influence of the initial stress state, and the strength parameters of the geomaterial, such as the cohesion and friction angle, which influence the development of the permanent deformation through the inclusion of the yielding criterion. This model has been used in previous works [1,40] with very good results.
Chen’s model is based on experimental results from a full-scale model test on a high-speed railway line under varying water levels within the subgrade:
ε 1 p ( N ) = ε 1 p 0 [ 1 e B N ] ( p a m 2 + q a m 2 p a ) α · 1 m ( 1 + p i n i p a m ) + s p a m ( q i n i + q a m ) p a m
where N is the number of load cycles;  ε 1 p 0 , B, and α are the constants of the model and vary according to the type of the material; pa is the reference stress; pam and qam are the amplitude of the mean stress and deviator stress induced by train loadings; pini and qini are the mean and deviator stresses in the initial state of the material, respectively, and m and s are defined by the yielding criterion q = s + m  ×  p, where s corresponds to the intersection of the yielding criterion with q-axis in the p–q space, and m is the slope of the yielding criterion. This empirical model can, indeed, be used to capture the permanent deformation of different materials. However, for each material, different mechanical properties as well as different empirical constants are assigned, taking into account the respective stress levels. More details about the permanent deformation models can be found in Ramos et al. [1].
This model was applied to all unbound granular materials, including the ballast, the sub-ballast made of steel slag, and the subgrade. The implemented methodology to integrate the empirical permanent deformation model in the 3D model is described below.
Yet, this analysis is not only focused on the permanent deformation but also on the cumulative, permanent displacements of the track, which can be obtained using the following expression:
c u m u l a t i v e   p e r m a n e n t   d e f o r m a t i o n = i = 1 n ε p i × h i
where εp is the permanent deformation; i is the number of elements, and hi is the thickness of the finite elements. Briefly, the cumulative, permanent deformation is the sum of the product of the permanent deformation applying Equation (1) of each element of the selected alignment, considering a certain number of load cycles and the thickness of the element.
From the cyclic triaxial tests performed at the laboratory, the empirical permanent deformation model described by the expression (1) was calibrated through the determination of the material’s constants (εp0, α, and B). The calibration was performed to find the best fit between the experimental (cyclic triaxial) tests and numerical data (obtained through the empirical permanent deformation model) by the definition of the parameters (εp0, α, and B) (corresponding to the properties of the materials). To do so, it was important to use the initial and final mean and deviatoric stresses considered in the laboratory tests. This calibration was based on the experimental long-term cyclic triaxial tests carried out during one million load cycles (see Table 2). This model is also dependent on the Mohr–Coulomb yielding criterion that depends on the parameters m and s, which are based on the cohesion (c′) and friction angle (ϕ′) of the steel slag.
The calibration process of the permanent deformation model is based on the least-square fitting method, and two approaches were applied: Trust-region-reflective; and Levenberg–Marquardt [41]. In this case, the calibration process implies the determination of three unknown parameters: εp0; α; and B. Since this is an optimization problem, it means that there may be different combinations that allow for the fitting of the experimental results. To eliminate this uncertainty, the methods were used with different initial, minimum, and maximum values. The range of cumulative permanent displacement reflects all these hypotheses tested: method; minimum value (or its absence); maximum value (or its absence); and initial value. The obtained results show the importance of the initial values to obtain the final optimized solution. Thus, one hundred simulations were considered that led to different combinations of εp0, α, and B. This means that, instead of a unique permanent cumulative displacement, a range of values is obtained, which gives more confidence in the results.
The variation in the parameters εp0, α, and B with the number of simulations is depicted in Figure 5a, Figure 5b and Figure 5c, respectively. As is possible to observe, when the trust–region–reflective method is adopted with defined boundaries (xmin and xmax), the variation in all the parameters is significantly higher. This phenomenon does not occur in the Levenberg–Marquardt method since defining boundaries is not allowed. This means that the outcomes regarding the methods adopted are similar, despite the parameter analysed.
Considering the number of iterations and the different combinations, the R2 coefficient was also determined (Figure 6) for each optimized solution. The results show that the R2 varies between 0.92 and 0.99, which is statistically significant. This means that the calibrated results show a significantly high level of confidence.
The calibrated parameters (εp0, α, and B) obtained for the steel slag are described in Table 3.
Figure 7 presents the comparison between experimental and numerical data. The results show a very good agreement, which corresponds to an R2 of 0.9688.

3.2. Numerical Analysis

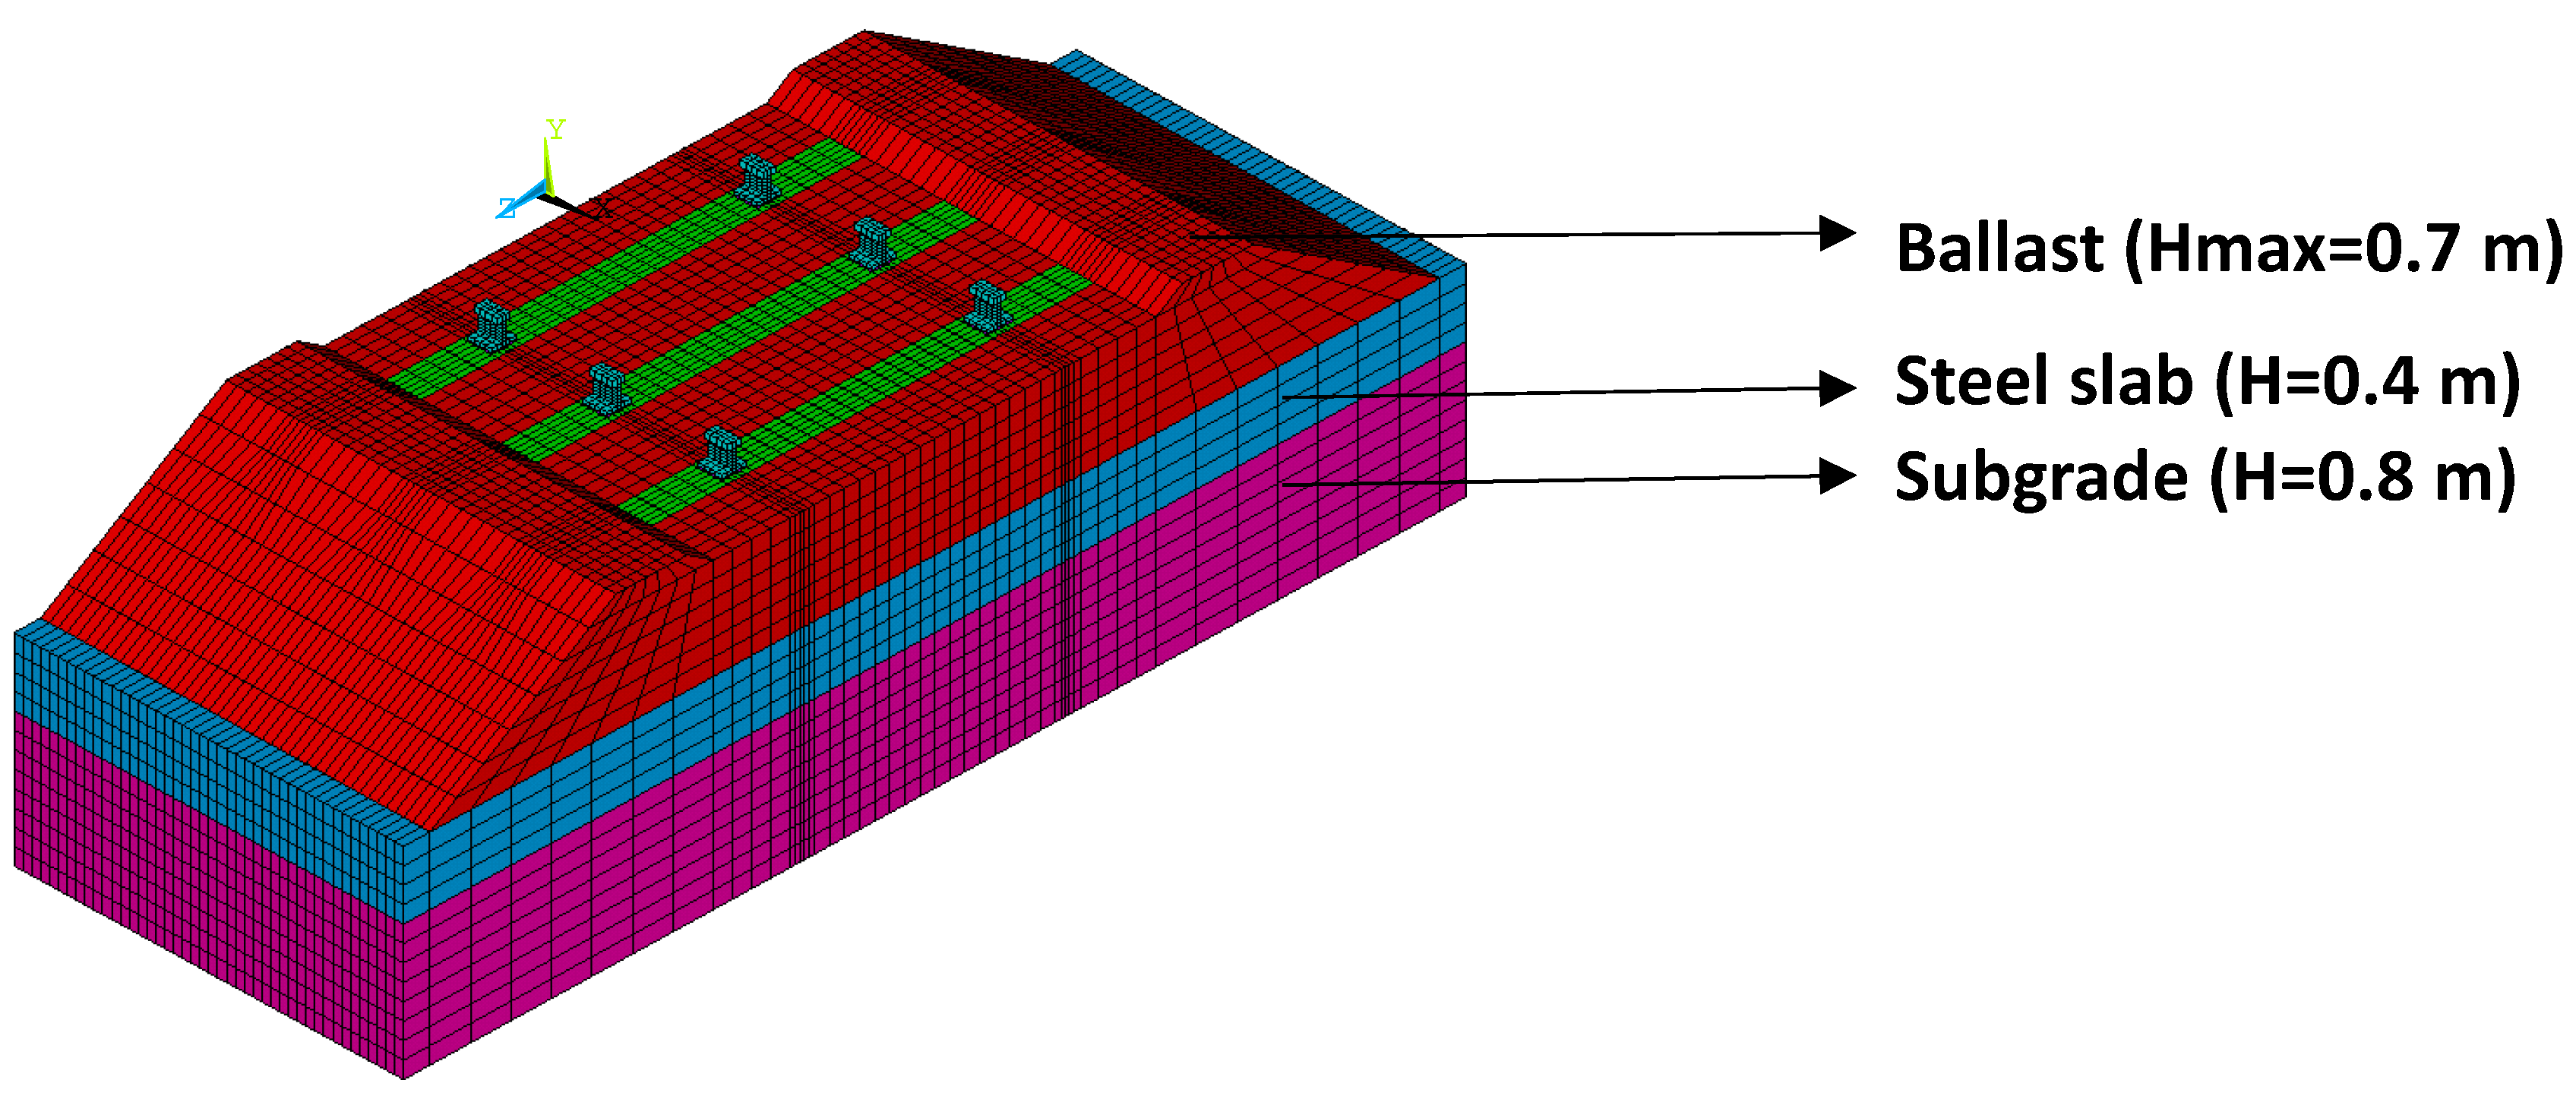
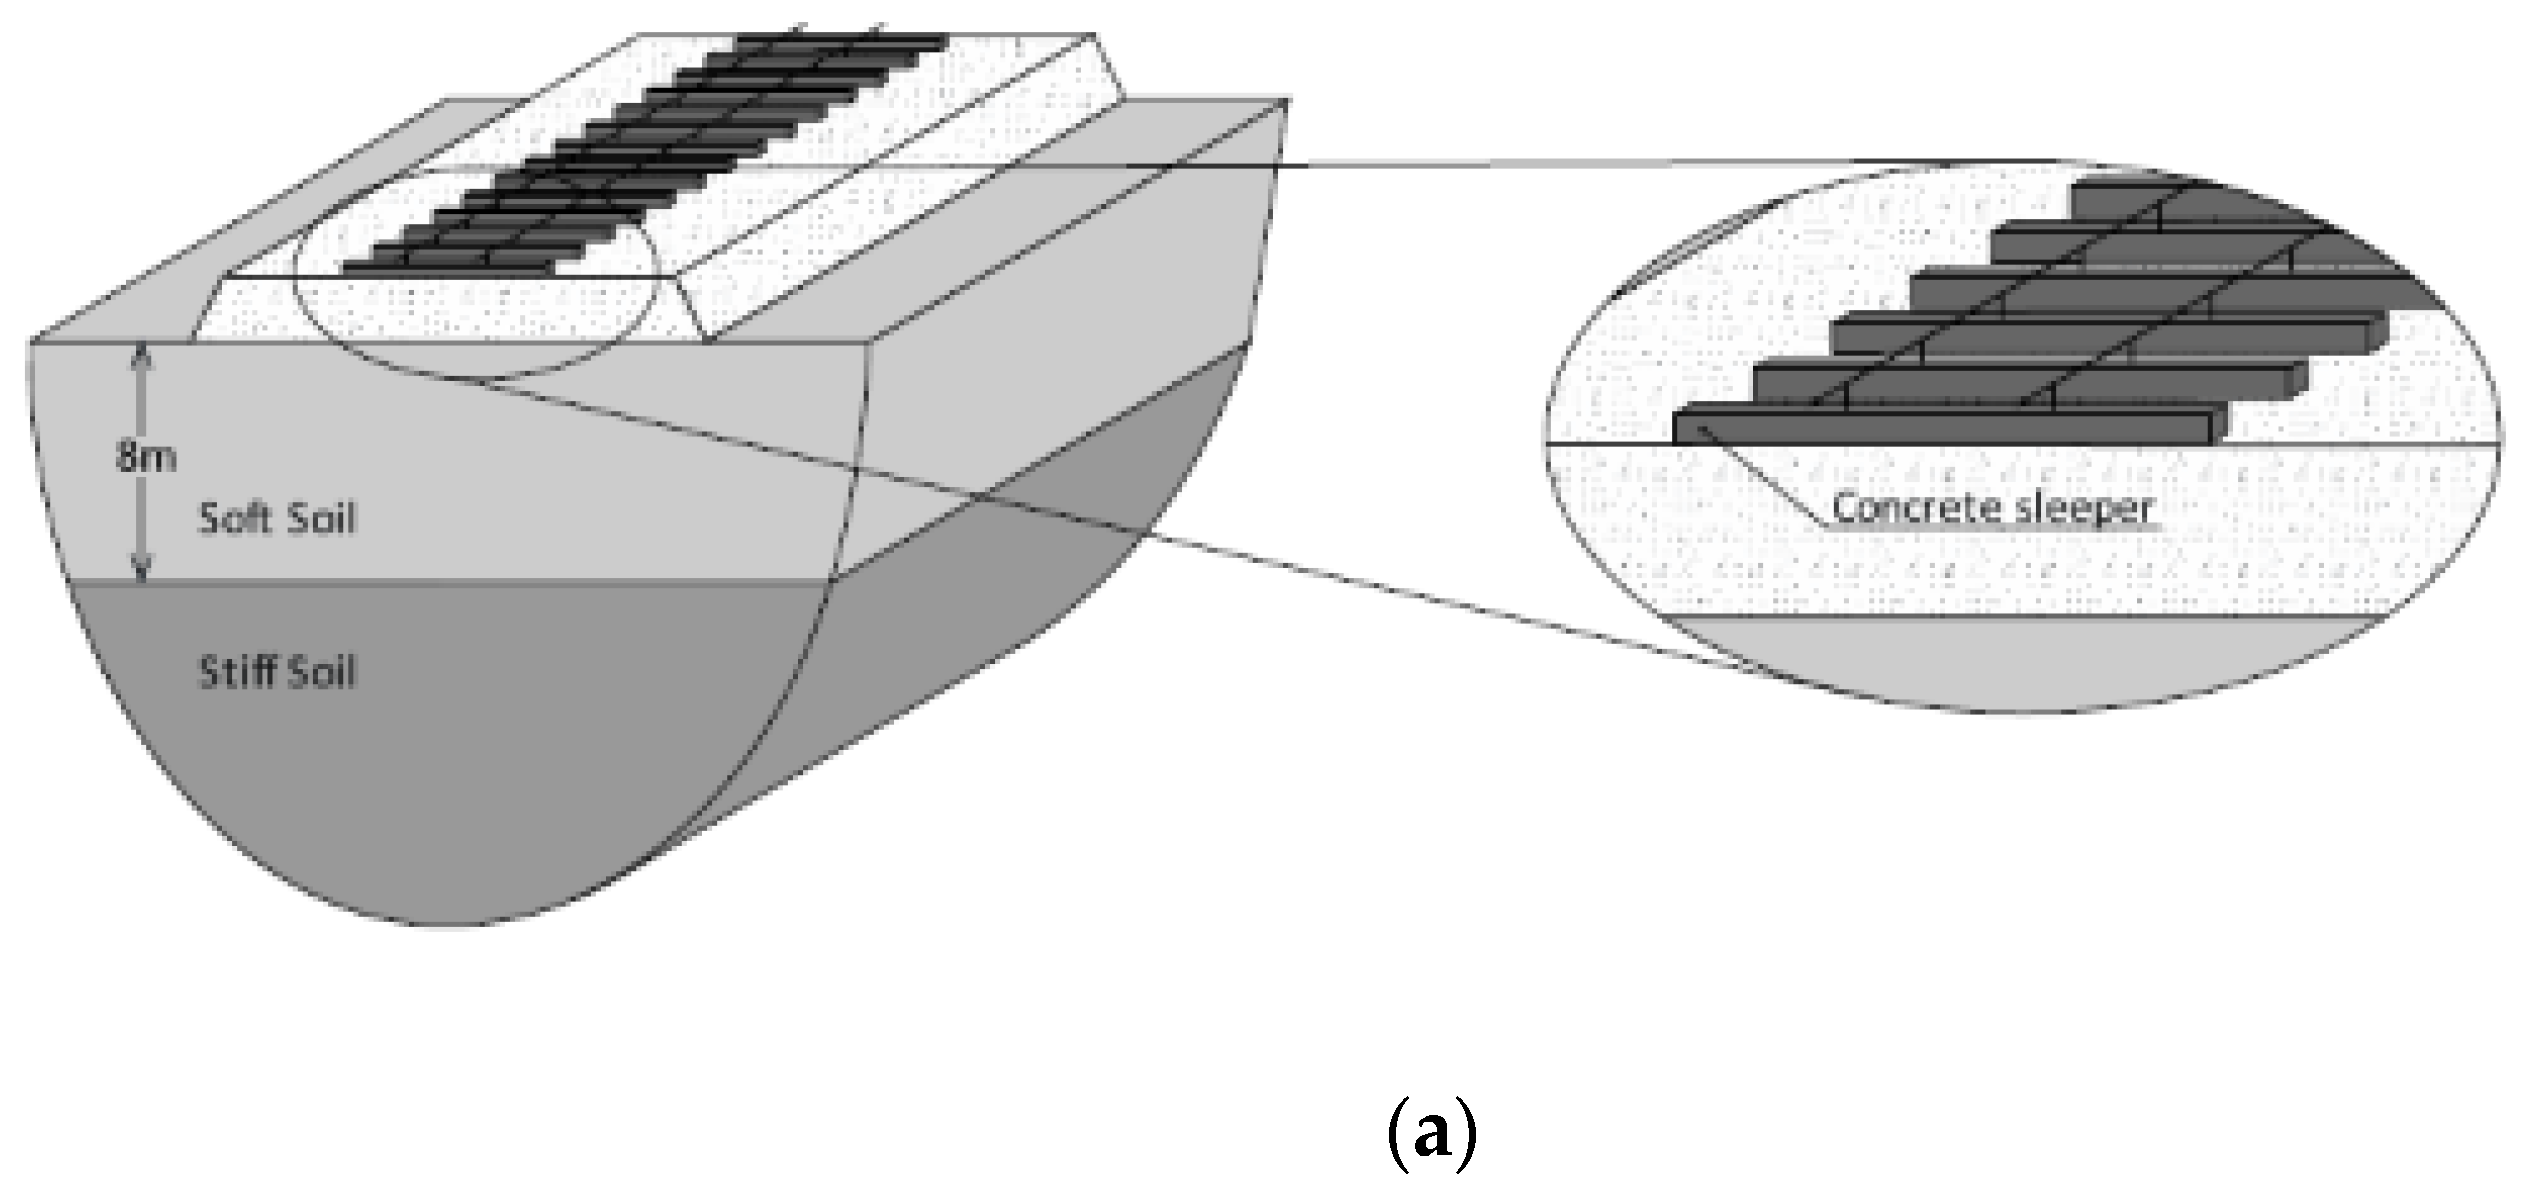
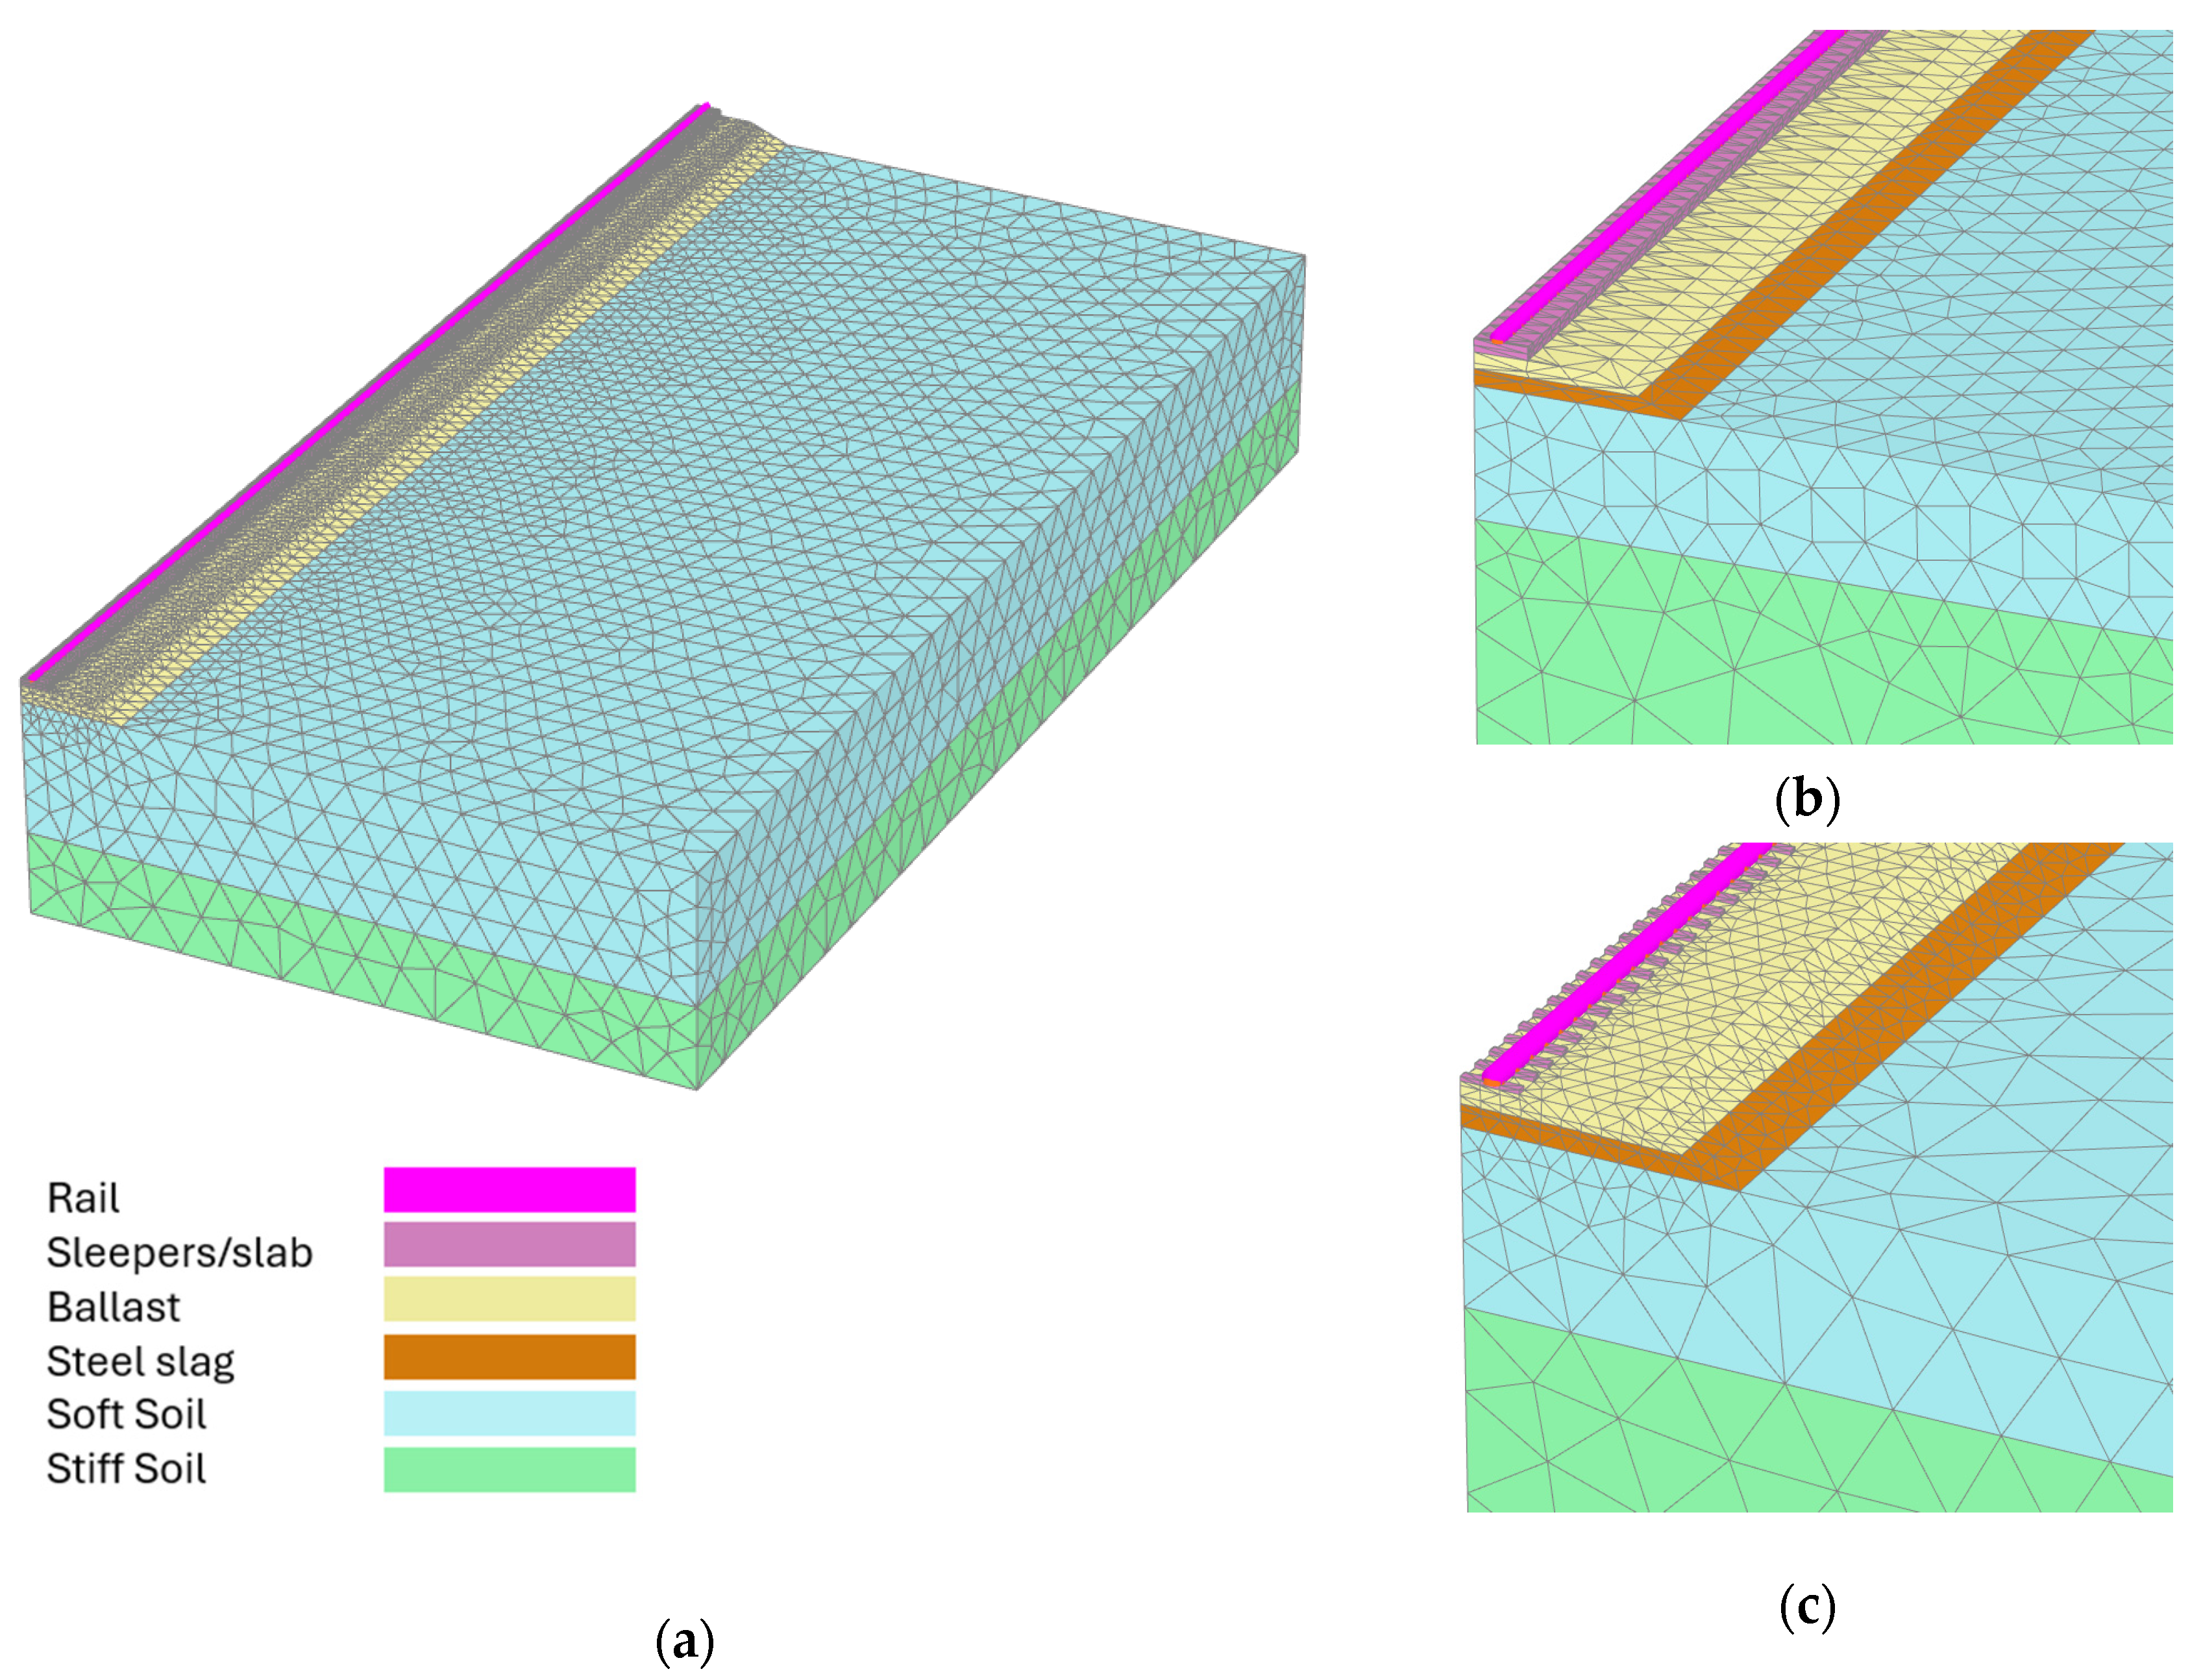
3.2.1. Numerical Model

In this case, a 3D finite element (FEM) numerical model in ANSYS software to evaluate the track performance was developed based on previous work [40].
The work presented herein takes advantage of the 3D model already calibrated to analyze the effect of replacing a natural material with a steel slag, giving more confidence in the obtained results.
The dimensions of the ballasted track model are presented in Figure 8. As depicted in Figure 8, the thickness of each finite element is 0.1 m, and the total height of the ballast, sub-ballast, and subgrade is 0.7 m, 0.4 m, and 0.8 m, respectively. The model boundaries comprise fixed supports on the ground and on the vertical boundaries, except on the ballast.
The rail was modeled considering the geometry of model BS113A (56E1), and the sleepers (embedded in the ballast) corresponded to the G44 model.

3.2.2. Material’s Properties and Loading
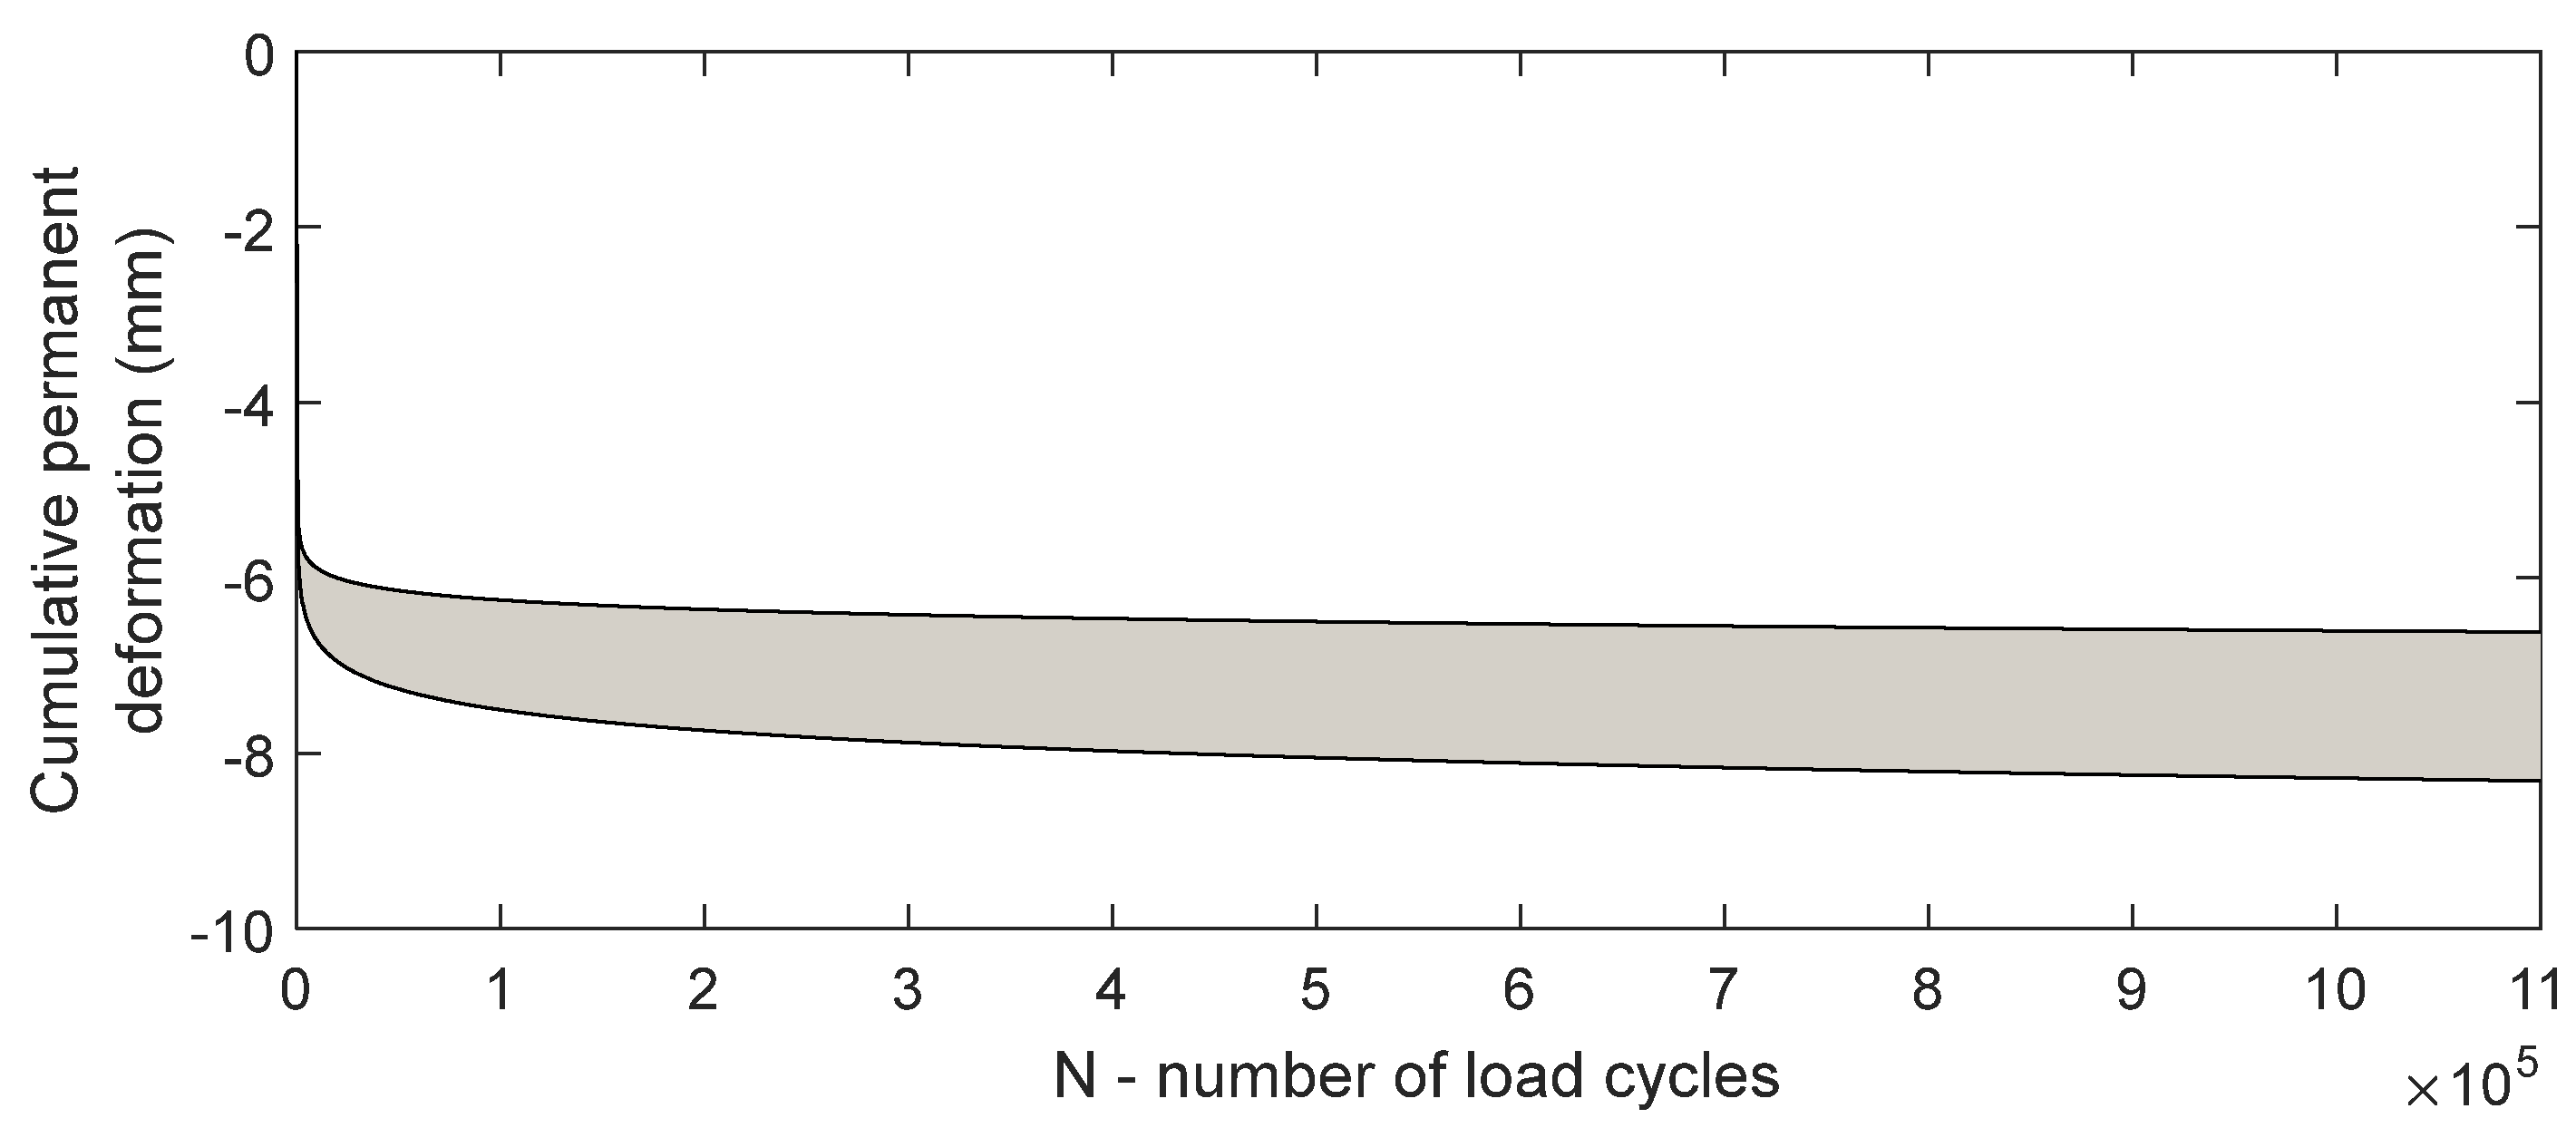
Regarding the materials’ properties, the parameters of the calibrated numerical model were used, except for the sub-ballast (steel slag), in which the parameters derived from the laboratory tests described in Section 2.4 were adopted.
For the definition of the resilient modulus of the sub-ballast, the stress level obtained in the numerical model on the top of this layer was first identified, as depicted in Figure 9. Given these values, the resilient modulus obtained in the cyclic triaxial test for this stress level was selected. The adopted properties of all materials are described in Table 4.
Regarding the long-term analysis, the strength parameters, as well as the calibrated parameters of the permanent deformation model, are summarized in Table 5 for all unbound granular materials. While the parameters for the sub-ballast layer made of steel slag were explained above, the parameters for the ballast and subgrade were obtained in the work developed by Ramos et al. [40]. Regarding the cohesion and friction angles from the ballast and subgrade, the values adopted are within the range of the values presented in the bibliography [40].
To keep the consistency reported in [40], the same loads were adopted, a frequency of 5.6 Hz was used, and a phase loading was included. This frequency corresponds to a train speed equal to 100 m/s and a distance between the bogies equal to 19 m.

3.2.3. Methodology

The main goal of this work is to obtain the long-term performance of the ballasted track with steel slag. It is important to mention that short-term performance was obtained by considering the materials in the linear elastic domain. Therefore, the assumption of a linear elastic model to represent soil behavior is a simplification to the real constitutive soil behavior, and it is only acceptable when dealing with small strains, which is the case [25,44,45,46]. The long-term settlement induced by the passage of the trains is obtained based on the stress levels from the short-term behavior. Thus, there is no limitation of the FEM in capturing the large strain/deformation in this context. The deformations are obtained through the empirical permanent deformation model presented previously based on the short-term behavior.
The adopted methodology is described in Figure 10. Thus, a ballasted track model already calibrated (designated as the original solution) was modified, and the natural aggregate layer was replaced by the steel slag with different values regarding the resilient modulus and density.
Since the properties are different below the ballast, and due to the absence of experimental results of the steel slag included in a railway track, it was necessary to develop a methodology capable of correctly updating the stress levels since this is one of the main inputs used to predict the permanent deformation. Considering the inclusion of the steel slag in the railway track model, and since the density of the steel slag is higher, it is expected to have higher initial mean and deviatoric stresses below the ballast. However, the steel slag’s resilient modulus is slightly lower. Since the properties are different, the initial stresses below the ballast (steel slag and subgrade) were updated, as well as the induced stresses. Thus, the pam and qam, pini, and qini were obtained in the 3D numerical model, assuming that the elastic properties of all the materials are already calibrated.
After the short-term performance, the long-term analysis was performed based on the calibration of the empirical constants of the steel slag using the results of the cyclic triaxial tests (Section 3.1). From the stress levels of the ballast (which remained unchanged after this modification of the model) and updated stress levels from the steel slag and subgrade, the strength properties of the geomaterials and the calibrated material constants, it is possible to determine the cumulative, permanent displacement of the ballasted track with steel slag. It is important to mention that, although it is not the focus of this work, the developed methodology, after determining the cumulative, permanent deformation, is able to update the geometry of the 3D model of the track and update the stress results.

3.2.4. Discussion of the Results

Based on the methodology described in Figure 10, the cumulative permanent displacements of the ballasted track with steel slag were determined, which are depicted in Figure 11. The cumulative, permanent deformation was obtained in the vertical alignment under the load. Since several combinations were simulated, the cumulative permanent displacement corresponds to a range of possible values. The maximum value corresponds to a permanent displacement of 8.3 mm, and the minimum displacement corresponds to 6.6 mm. Thus, these displacements are significantly below the allowable displacement for the ballasted track in high-speed lines, whose limit corresponds to 30 mm. Therefore, the results show that it is possible to include a sustainable and environmentally friendly material in a ballasted track, such as steel slag, to maintain the performance of the track.
Despite the very good numerical results regarding the short and, mostly, the long term, an experimental test of a railway structure with steel slag as a sub-ballast is still an important tool to gain even more confidence in the application of this material. Indeed, these results and the developed methodology were only possible with the experimental tests performed previously.

4. Non-Linear Critical Speed of a Ballast Track with Steel Slag

4.1. Introduction

From a geotechnical point of view, the performance of railway lines with new sustainable materials should also be validated in the presence of soft soils. In these cases, the operational train speed could be close to the track–ground critical speed, increasing the rail displacements and raising the risk of derailment. Consequently, the critical speed with steel slag was computed and compared to “classical” ballasted and slab tracks with natural aggregates as sub-ballast. The main goal is to find out if the inclusion of steel slag (replacing the sub-ballast) plays a relevant role in the critical speed.
To compute the critical speed, a non-linear soil model in Plaxis® was used because, as demonstrated by Fernández-Ruiz et al. [26], the non-linear soil behavior plays a very important role when predicting the critical speed in railway lines. Moreover, this numerical approach was experimentally validated in the well-known Ledsgard case [26]. In this scenario, a comprehensive 3D dynamic model formulated in the time domain is crucial for accurately capturing the non-linear behavior of the underlying soils, ballast, and sub-ballast (or steel slag) layers.

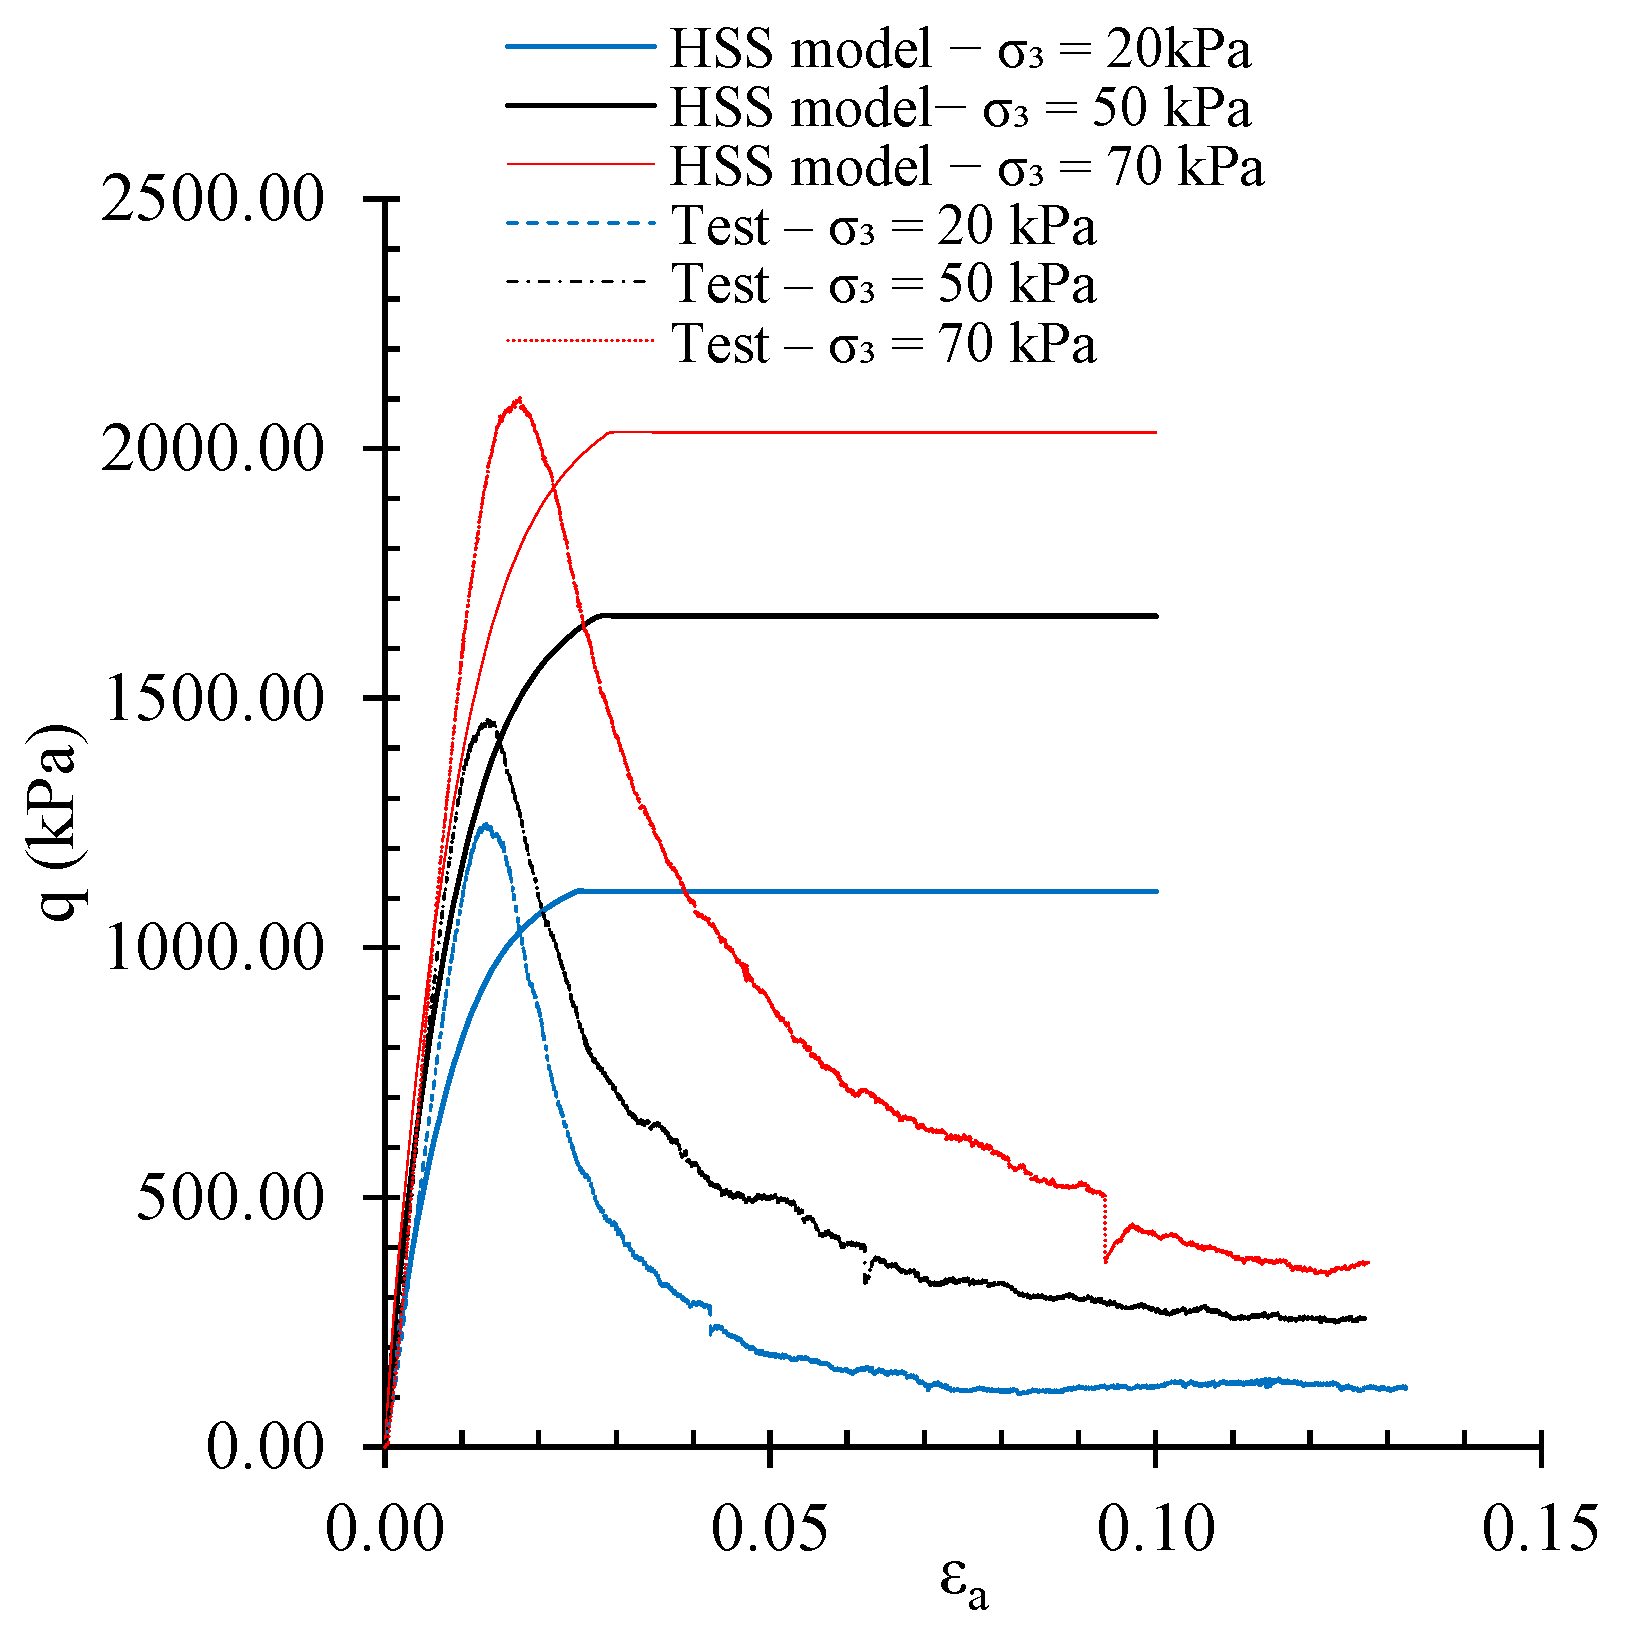
4.2. Non-Linear Soil Model Calibration

In this sub-section, the calibration of the non-linear soil model for steel slag is justified. The selected model is the Hardening Soil with small strain stiffness (HSS) [26], and its calibration involves not only the parameters derived from the monotonic triaxial tests presented above but also the evaluation of the stiffness at very small strains and the reference shear strain for 70% of stiffness degradation.
In this work, the estimation of the ratio between the secant shear modulus and the small strain shear modulus (G0) was obtained by the well-known equation from Ishibashi and Zhang [47]—Equations (3) to (5):
G s G 0 = K ( γ , I p ) σ ¯ 0 m ( γ , I P ) m 0
K ( γ , I P ) = 0.5 { 1 + tanh [ ln ( 0.000102 + n ( I P ) γ ) 0.492 ] }
m ( y , I P ) m 0 = 0.272 { 1 tanh [ ln ( 0.000556 γ ) 0.4 ] } e 0.0145 I P 1.3
where  G s  is secant shear modulus; IP is the plasticity index (considered zero for the steel slag);  σ ¯ 0  is the effective confining stress (considered 100 kPa), and γ is shear strain amplitude.
The reference shear strain for 70% of stiffness degradation can be calculated according to Equation (6):
y 0.7 1 9 G 0 [ 2 c ( 1 + cos ( 2 ϕ ) ) σ 1 ( 1 + K 0 ) sin ( 2 ϕ ) ]
where c′ and ϕ′ are the Mohr–Coulomb strength parameters indicated above, and K0 is the coefficient of earth pressure at rest.
The secant shear modulus ( G s ) was assumed as the shear resilient modulus obtained in the cyclic triaxial test. The closest stress level to the reference stress of 100 kPa was the one with 100 kPa of confining stress and a deviatoric stress of 150 kPa. For this purpose, the resilient modulus (ES) obtained from the slope of the deviatoric stress versus axial strain plot was converted to the shear modulus according to the elasticity Equation (7), assuming a Poisson ratio of 0.2.
G s = E s 2 ( 1 + v )
The other parameters required by the HSM small are  E 50 ref ,   E o e d ref ,   a nd the  E u r ref , respectively, the secant modulus at 50% of maximum deviatoric stress, the oedometer modulus, and the unload-reload modulus, all for the reference effective stress of 100 kPa.
The E50 can be obtained from the slope of the monotonic triaxial tests stress–strain curves for each confining pressure. In order to obtain the  E 50 ref  for the reference stress of 100 kPa, Equation (8) is proposed by the PLAXIS manual:
E 50 = E 50 r e f ( σ 3 + c cot ϕ 100 + c cot ϕ ) m
where m is the coefficient associated with the variation in stiffness with effective stress.
To apply this equation to the triaxial tests, a linearization procedure needs to be performed, and the tests results are plotted in Figure 12 to obtain  E 50 ref  and m, which, in this case, are 206 MPa and 0.7, respectively.
The  E u r ref  was obtained from the resilient modulus tests for the same stress level of Gs.
The  E o e d ref  assumed the same value as  E 50 ref , as recommended in the software Plaxis®.
As a result, the HSS parameters obtained with this calibration procedure are summarized in Table 6. For the dilatancy angle, the Bolton [48] equation was used as follows:
ψ = ϕ ϕ c v 0.8
The simulation of the monotonic triaxial tests presented above with the parameters indicated in Table 6 is presented in Figure 13. The fit between the test and the HSS small model is quite acceptable, up to a strain value of 1–2%. As expected, the HSS small is not able to reproduce the post-peak behavior of the material (strains higher than 2%), but this is not very important for the numerical simulation presented below as the material is subjected to strain levels far from failure.

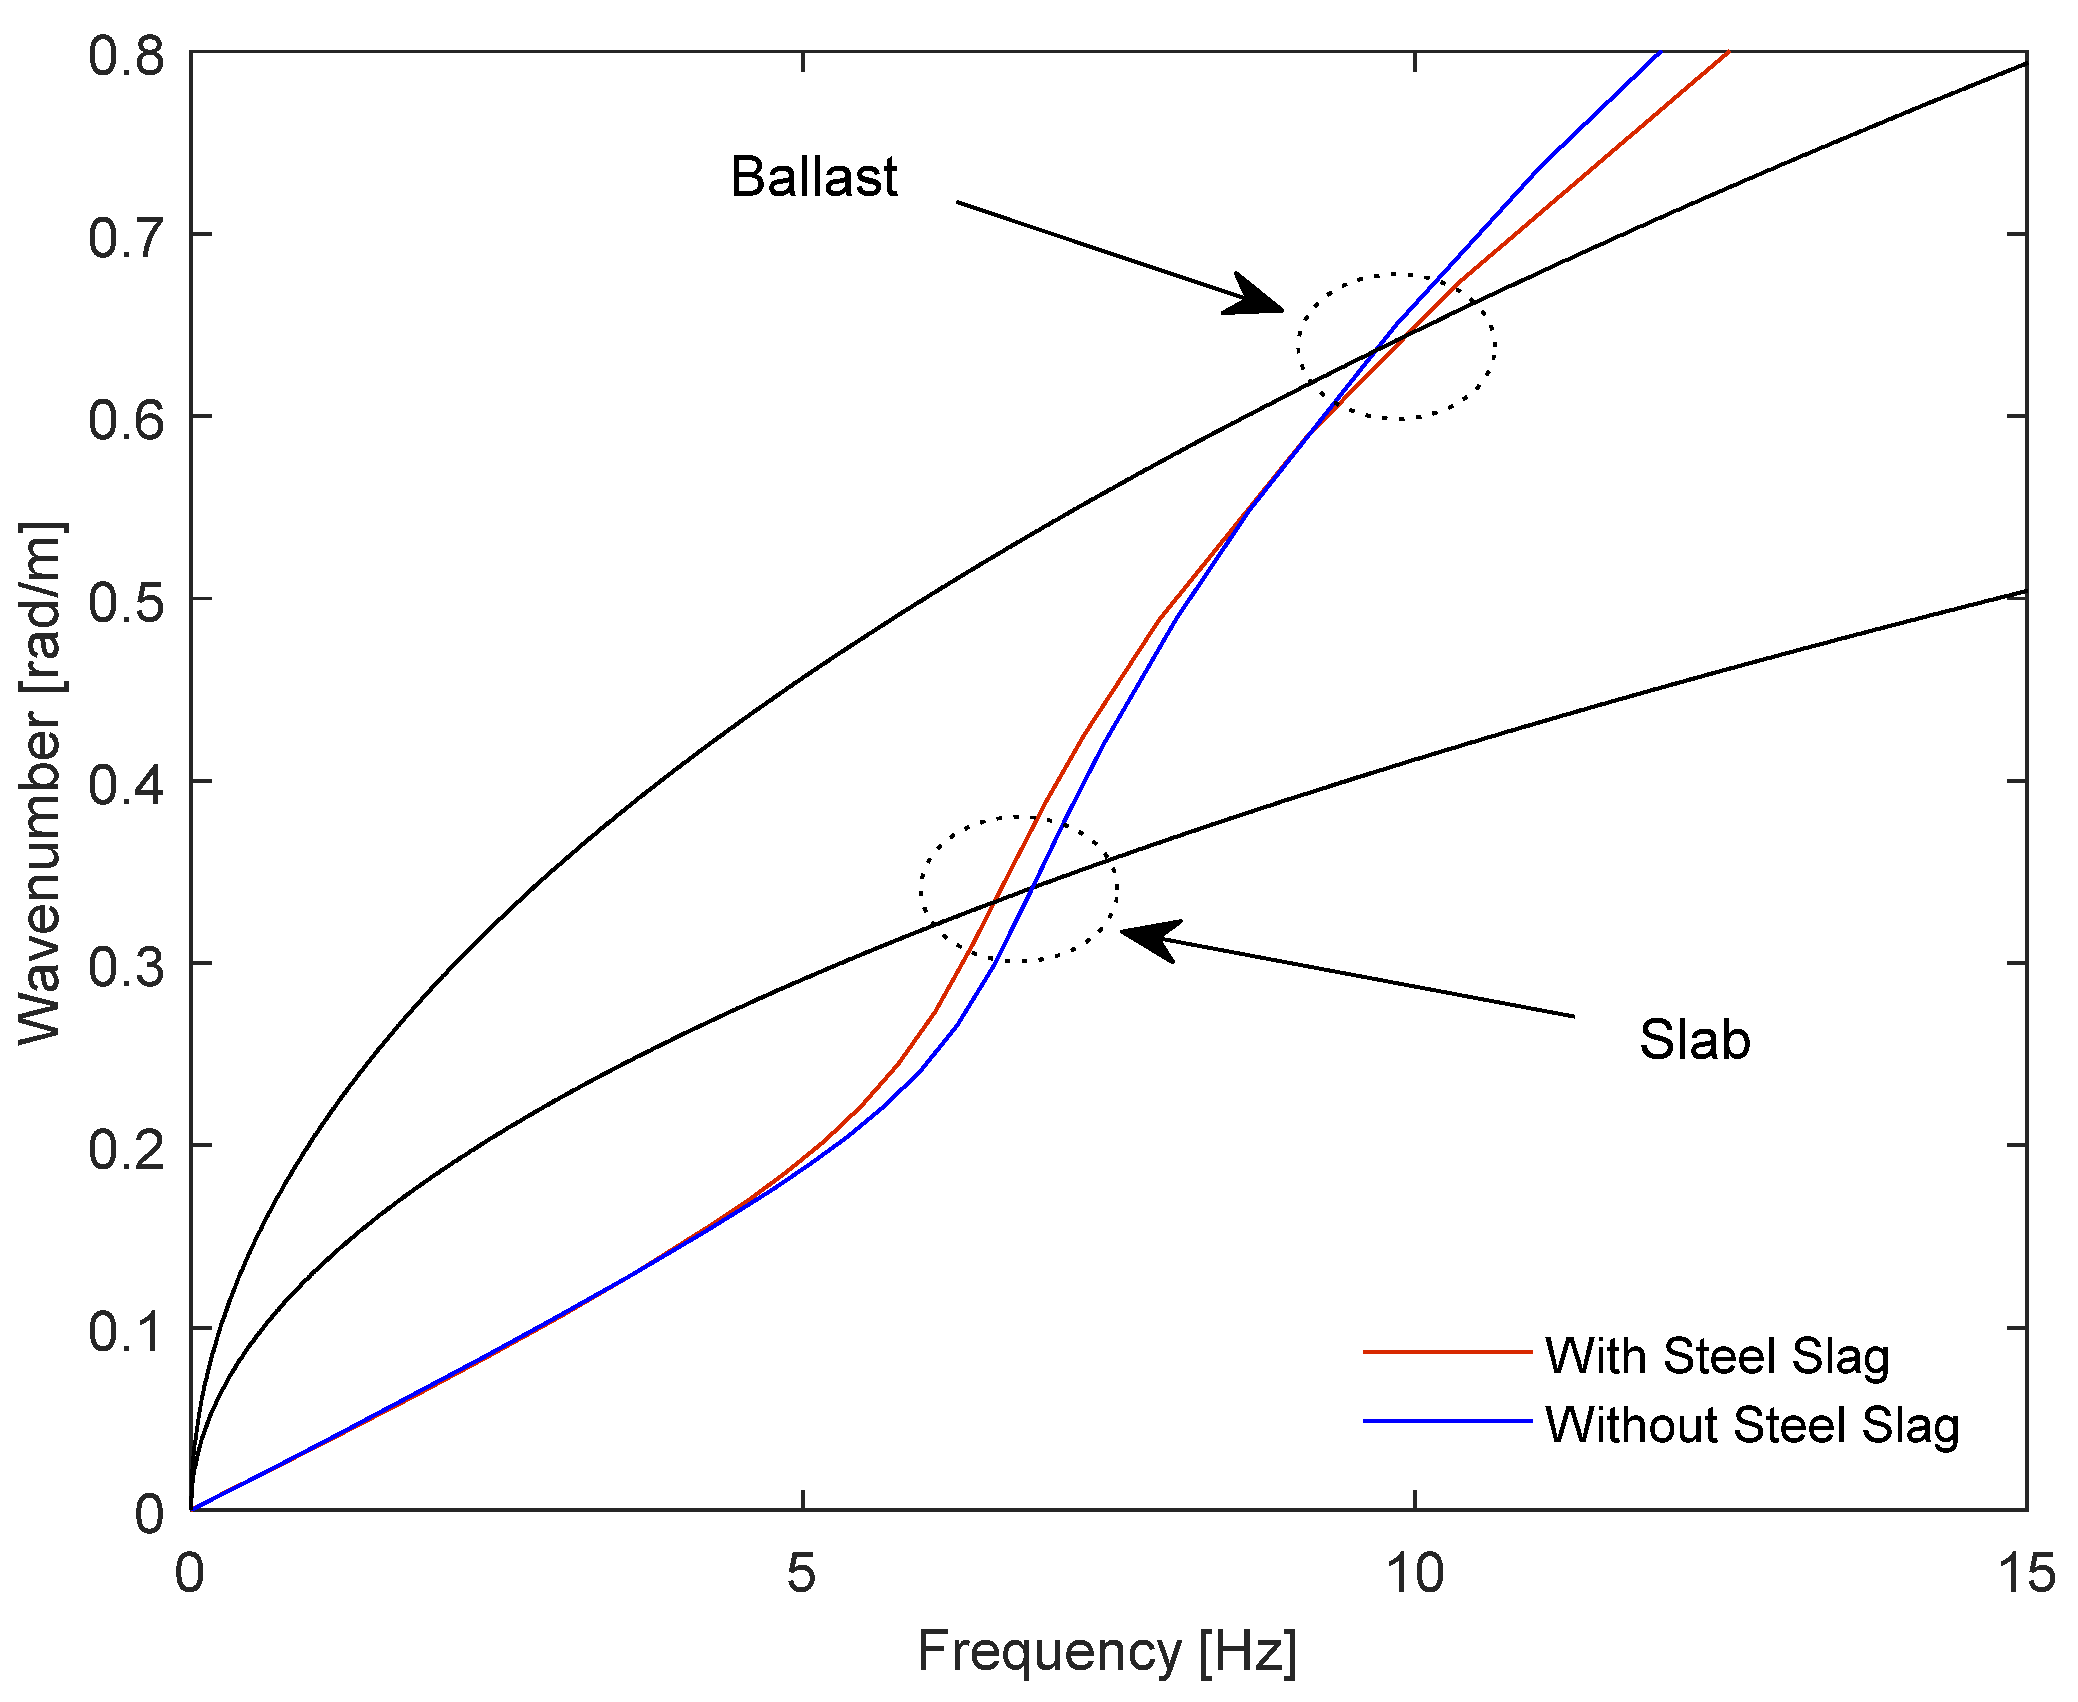
4.3. Non-Linear Numerical Model

A non-linear numerical model was used to compute the critical speed through a 3D finite element model formulated in the time domain. The examined scenarios, depicted in Figure 14, consist of two types of railway tracks: “standard” slab and ballasted tracks, both positioned over an 8 m-thick layer of soft soil. To comprehensively assess their influence on the critical speed, the scenarios were evaluated under two conditions for the sub-ballast: a layer composed of a traditional natural aggregate; or a layer composed of steel slag.
From the previously considered scenarios, a numerical model was built, with 80 m × 35 m × 15 m in the longitudinal, horizontal, and vertical directions (Figure 15). The rail was modeled as a beam, and the railpad was modeled as a linear spring, with the properties shown in Table 7. The rest of the elements (sleeper, slab, ballast, sub-ballast, and steel slag) and the ground were modeled using 3D solid elements, and their properties are shown in Table 7 (elastic properties) and Table 8 (non-linear properties). As perceived in Table 7, two values were considered for the Plasticity Index (15 and 50) to simulate the non-linear soil behavior. The axis-to-axis spacing between sleepers is 0.6 m, and their width is 0.2 m. The finite element mesh used in this research is unstructured, and the mesh size is according to Fernández-Ruiz et al. [26], where a similar mesh was experimentally validated. The boundary conditions correspond to viscous dampers. A Rayleigh damping type has been used, is very suitable, and is widely used in numerical models formulated in the time domain [26].
The equivalent nodal force method was considered to simulate the moving point load, and the time step was considered according to the criteria of Courant–Friedrichs–Lewy [49]. It should be noted that in all cases, the train is modeled as a moving 180 kN axle load; so all the results are for a single-wheel passage only.
Each railway track was evaluated with and without the presence of the steel slag layer to assess its impact on the critical speed. In this regard, Figure 16 illustrates the Dynamic Amplification Factor for the ballasted track case with the steel slag layer, displaying the critical speed value obtained for the conventional ballasted track (without the steel slag layer) for the considered PI values. Upon examining Figure 16, it becomes evident that the substitution of the sub-ballast layer with steel slag does not lead to any alteration in the critical speed of the profile.
An identical analysis was performed for the slab track scenario, presented in Figure 17, and the dynamic amplification factors were obtained for the case with the steel slag layer for both soils (PI50 and PI15). In contrast to the previous findings, substituting the conventional sub-ballast layer with steel slag leads to a reduction in the critical speed of the profile. However, it is important to note that this observed reduction, approximately around 5%, can be neglected.
Nevertheless, it is crucial to uncover the reasons behind the varying effects of the steel slag layer on different track types. To address this, an analysis of the dispersion curves for both the railway tracks and the geotechnical profiles was conducted, and the results are depicted in Figure 18. It is worth noting that the critical speed can be estimated by calculating the inverse of the slope of the line connecting the reference origin and the intersection point between the dispersion curve of the railway track and the geotechnical profile [50]. As shown in Figure 18, the dispersion curves for the soil, with and without steel slag, intersect the dispersion curve of the ballasted track nearly at the same point, resulting in similar critical speeds. However, this pattern does not hold true for the slab track, where a slight deviation leads to a minor change in the critical speed of the profile. Even so, it is essential to emphasize that the reduction in efficiency observed in the slab track is negligible compared to the overall sustainability achieved by employing the steel slag layer.

5. Conclusions

This work analyzed the short- and long-term performances of a ballasted track considering the replacement of the conventional sub-ballast with steel slag. The laboratory tests sought to simulate the conditions that are imposed on the material in the railway track, determining its physical and mechanical characteristics to analyze its behavior against different demands. The triaxial test results showed that the steel slag exhibited excellent performance against the monotonic and cyclic loads applied, displaying a high angle of friction, high resilient modulus, and low permanent deformation, being, therefore, suitable for a sub-ballast material.
Based on the laboratory results, a numerical analysis was carried out to simulate the long-term performance of a ballasted railway track incorporating steel slag as a sub-ballast material. In this process, to calibrate the selected empirical permanent deformation model, an innovative optimization procedure based on the permanent deformation experimental results was performed. The outcomes were statistically significant, indicating a high level of confidence in the calibrated results. The findings indicate that the cumulative, permanent deformation of a ballasted track with steel slag ranged from 6.6 mm to 8.3 mm, significantly below the allowable limit associated with high-speed ballasted lines, which is 30 mm. This analysis was performed in the linear elastic domain and it could be interesting to have, in future analyses, the influence of the variation in resilient modulus with the stress levels, considering a non-linear domain and even more advanced non-linear models.
Moreover, in the context of the critical speed analysis, a comprehensive study was conducted to assess the mechanical performance of both ballast and slab tracks with a sub-ballast layer made of steel slag layer instead of natural aggregate. For that purpose, a calibration process was needed to match the steel slag behavior with a non-linear soil model. It was discovered that replacing the natural aggregate with steel slag does not result in a significant variation in the critical speed achieved, with the result obtained close to the one obtained for the track with a conventional natural sub-ballast layer. To better understand the physical phenomenon produced by the material replacement, a dispersive analysis was conducted. It was observed that the material change left a lingering impact on the track–soil dispersion curve. Bearing these facts in mind, it was possible to validate the use of steel slag in the context of critical speed.
In summary, the numerical simulations based on parameters calibrated from monotonic and cyclic triaxial tests demonstrate the adequate performance of the railway structure when incorporating sustainable materials, such as steel slag. This choice offers the advantage of environmental sustainability in contrast to the conventional sub-ballast material. This is an alternative option that is particularly attractive in areas close to the steel industry benefiting from lower transportation costs.

Author Contributions

Conceptualization, R.A., A.R., A.C.-P. and S.R.; methodology, R.A., A.R. and A.C.-P.; software, R.A., A.R., A.C.-P. and J.F.-R.; validation, R.A., A.R., A.C.-P. and S.R.; formal analysis, S.R. and J.F.-R.; investigation, R.A., A.R. and A.C.-P.; resources, S.R. and J.F.-R.; data curation, S.R. and J.F.-R.; writing—original draft preparation, R.A., A.R., A.C.-P., S.R. and J.F.-R.; writing—review and editing, R.A., A.R., A.C.-P., S.R. and J.F.-R.; visualization, R.A., A.R., A.C.-P., S.R. and J.F.-R.; supervision, S.R. and J.F.-R.; project administration, S.R. and J.F.-R.; funding acquisition, S.R. All authors have read and agreed to the published version of the manuscript.

Funding

This work received funding by the Portuguese Science and Technology Foundation through the scholarships with reference [SFRH/BD/07370/2021] “https://doi.org/10.54499/2021.07370.BD (accessed on 30 June 2024)” and [CEECIND/04583/2017/CP1399/CT0003] “https://doi.org/10.54499/CEECIND/04583/2017/CP1399/CT0003 (accessed on 30 June 2024)”. It was also financially supported by the Base Funding [UIDB/04708/2020] with DOI 10.54499/UIDB/04708/2020 “https://doi.org/10.54499/UIDB/04708/2020 (accessed on 30 June 2024)” of the CONSTRUCT—Instituto de I&D em Estruturas e Construções—funded by national funds through the FCT/MCTES (PIDDAC).

Data Availability Statement

Some of the data used in this study may be available from the authors upon reasonable request.

Acknowledgments

The authors acknowledge the company MEGASA for providing the steel slags for this experimental program.

Conflicts of Interest

The authors declare no conflicts of interest.

References

  1. Ramos, A.; Gomes Correia, A.; Indraratna, B.; Ngo, T.; Calçada, R.; Costa, P.A. Mechanistic-Empirical Permanent Deformation Models: Laboratory Testing, Modelling and Ranking. Transp. Geotech. 2020, 23, 1–26. [Google Scholar] [CrossRef]
  2. Puppala, A.J.; Saride, S.; Chomtid, S. Experimental and Modeling Studies of Permanent Strains of Subgrade Soils. J. Geotech. Geoenviron. Eng. 2009, 135, 1379–1389. [Google Scholar] [CrossRef]
  3. World Steel Association WSA. Available online: https://worldsteel.org (accessed on 20 July 2023).
  4. Paixão, A.; Fortunato, E. Abrasion Evolution of Steel Furnace Slag Aggregate for Railway Ballast: 3D Morphology Analysis of Scanned Particles by Close-Range Photogrammetry. Constr. Build. Mater. 2021, 267, 121225. [Google Scholar] [CrossRef]
  5. Gomes Correia, A.; Roque, A.J.; Reis Ferreira, S.M.; Fortunato, E. Case Study to Promote the Use of Industrial Byproducts: The Relevance of Performance Tests. J. ASTM Int. 2012, 9, 1–18. [Google Scholar] [CrossRef]
  6. Arribas, I.; Santamaría, A.; Ruiz, E.; Ortega-López, V.; Manso, J.M. Electric Arc Furnace Slag and Its Use in Hydraulic Concrete. Constr. Build. Mater. 2015, 90, 68–79. [Google Scholar] [CrossRef]
  7. Shi, C. Steel Slag—Its Production, Processing, Characteristics, and Cementitious Properties. J. Mater. Civ. Eng. 2004, 16, 230–236. [Google Scholar] [CrossRef]
  8. Liu, J.; Xu, J.; Liu, Q.; Wang, S.; Yu, B. Steel Slag for Roadway Construction: A Review of Material Characteristics and Application Mechanisms. J. Mater. Civ. Eng. 2022, 34, 3122001. [Google Scholar] [CrossRef]
  9. Hussain, A.; Hussaini, S.K.K. Use of Steel Slag as Railway Ballast: A Review. Transp. Geotech. 2022, 35, 100779. [Google Scholar] [CrossRef]
  10. Alves, R.; Rios, S.; Fortunato, E.; Viana da Fonseca, A.; Guimarães Delgado, B. Mechanical Behaviour of Steel Slag–Rubber Mixtures: Laboratory Assessment. Sustainability 2023, 15, 1563. [Google Scholar] [CrossRef]
  11. EuroSlag Statistics 2018. Available online: https://www.euroslag.com/research-library-downloads/downloads/ (accessed on 8 August 2023).
  12. Delgado, B.G.; Viana da Fonseca, A.; Fortunato, E.; Maia, P. Mechanical Behavior of Inert Steel Slag Ballast for Heavy Haul Rail Track: Laboratory Evaluation. Transp. Geotech. 2019, 20, 100243. [Google Scholar] [CrossRef]
  13. Delgado, B.G.; Viana da Fonseca, A.; Fortunato, E.; Paixão, A.; Alves, R. Geomechanical Assessment of an Inert Steel Slag Aggregate as an Alternative Ballast Material for Heavy Haul Rail Tracks. Constr. Build. Mater. 2021, 279, 122438. [Google Scholar] [CrossRef]
  14. Jia, W.; Markine, V.L.; Jing, G. Analysis of Furnace Slag in Railway Sub-Ballast Based on Experimental Tests and DEM Simulations. Constr. Build. Mater. 2021, 288, 123114. [Google Scholar] [CrossRef]
  15. Castro, G.; Saico, J.; de Moura, E.; Motta, R.; Bernucci, L.; Paixão, A.; Fortunato, E.; Oliveira, L. Evaluating Different Track Sub-Ballast Solutions Considering Traffic Loads and Sustainability. Infrastructures 2024, 9, 54. [Google Scholar] [CrossRef]
  16. Jing, G.; Wang, J.; Wang, H.; Siahkouhi, M. Numerical Investigation of the Behavior of Stone Ballast Mixed by Steel Slag in Ballasted Railway Track. Constr. Build. Mater. 2020, 262, 120015. [Google Scholar] [CrossRef]
  17. Esmaeili, M.; Askari, A. Laboratory Investigation of the Cyclic Behavior of Rock Ballast Mixed with Slag Ballast for Use in Railway Tracks. Constr. Build. Mater. 2023, 365, 130136. [Google Scholar] [CrossRef]
  18. Chamling, P.K.; Haldar, S.; Patra, S. Behaviour of Steel Slag Ballast for Railway under Cyclic Loading; Latha Gali, M., P, R.R., Eds.; Springer: Singapore, 2020; pp. 709–722. ISBN 978-981-15-6086-6. [Google Scholar]
  19. Guo, Y.; Xie, J.; Fan, Z.; Markine, V.; Connolly, D.P.; Jing, G. Railway Ballast Material Selection and Evaluation: A Review. Constr. Build. Mater. 2022, 344, 128218. [Google Scholar] [CrossRef]
  20. Puppala, A.J.; Mohammad, L.N.; Allen, A. Permanent Deformation Characterization of Subgrade Soils from RLT Test. J. Mater. Civ. Eng. 1999, 11, 274–282. [Google Scholar] [CrossRef]
  21. Korkiala-Tanttu, L. A New Material Model for Permanent Deformations in Pavements. In Proceedings of the 7th International Conferences on the Bearing Capacity of Roads, Railways and Airfields, Trondheim, Norway, 27–29 June 2005; pp. 1–10. [Google Scholar]
  22. Rahman, M.S.; Erlingsson, S. Predicting Permanent Deformation Behaviour of Unbound Granular Materials. Int. J. Pavement Eng. 2014, 16, 587–601. [Google Scholar] [CrossRef]
  23. Mostaqur, R.M.; Gassman, S.L. Permanent Deformation Characteristics of Coarse Grained Subgrade Soils Using Repeated Load Triaxial Tests. Geo-Congress 2019, 2019, 599–609. [Google Scholar]
  24. Cai, Y.; Sun, Q.; Guo, L.; Juang, C.H.; Wang, J. Permanent Deformation Characteristics of Saturated Sand under Cyclic Loading. Can. Geotech. J. 2015, 52, 795–807. [Google Scholar] [CrossRef]
  25. Alves Costa, P.; Calçada, R.; Silva Cardoso, A.; Bodare, A. Influence of Soil Non-Linearity on the Dynamic Response of High-Speed Railway Tracks. Soil Dyn. Earthq. Eng. 2010, 30, 221–235. [Google Scholar] [CrossRef]
  26. Fernández-Ruiz, J.; Castanheira-Pinto, A.; Costa, P.A.; Connolly, D.P. Influence of Non-Linear Soil Properties on Railway Critical Speed. Constr. Build. Mater. 2022, 335, 127485. [Google Scholar] [CrossRef]
  27. CEN EN 1097-6:2022; Tests for Mechanical and Physical Properties of Aggregates—Part 6: Determination of Particle Density and Water Absorption. European Committee for Standardization: Brussels, Belgium, 2022.
  28. ASTM D698-12; Standard Test Methods for Laboratory Compaction Characteristics of Soil Using Standard Effort (12,400 Ft-Lbf/Ft3 (600 KN-m/m3)). ASTM Standard: West Conshohocken, PA, USA, 2021. [CrossRef]
  29. ASTM D1883-21; Standard Test Method for California Bearing Ratio (CBR) of Laboratory-Compacted Soils. ASTM International: West Conshohocken, PA, USA, 2021; pp. 1–14.
  30. REFER IT.GEO.006-Technical Characteristics of the Sub-Ballast; Technical Instruction. National Railway Network; EPE: Lisbon, Portugal, 2007.
  31. JGS. Japanese Geotechnical Society (JGS 0520-2009) Preparation of Soil Specimens for Triaxial Tests; Japanese Geotechnical Society: Tokyo, Japan, 2009; pp. 1–10. [Google Scholar]
  32. Schulz-Poblete, M.V.; Gräbe, P.J.; Jacobsz, S.W. The Influence of Soil Suctions on the Deformation Characteristics of Railway Formation Materials. Transp. Geotech. 2019, 18, 111–123. [Google Scholar] [CrossRef]
  33. CEN EN 13286-7:2004; Unbound and hydraulically bound mixtures–Part 7: Cyclic load triaxial test for unbound mixtures. European Committee for Standardization: Brussels, Belgium, 2004.
  34. Maghool, F.; Arulrajah, A.; Suksiripattanapong, C.; Horpibulsuk, S.; Mohajerani, A. Geotechnical Properties of Steel Slag Aggregates: Shear Strength and Stiffness. Soils Found. 2019, 59, 1591–1601. [Google Scholar] [CrossRef]
  35. Indraratna, B.; Ionescu, D.; Christie, H.D. Shear Behavior of Railway Ballast Based on Large-Scale Triaxial Tests. J. Geotech. Geoenviron. Eng. 1998, 124, 439–449. [Google Scholar] [CrossRef]
  36. Werkmeister, S.; Dawson, A.R.; Wellner, F. Permanent Deformation Behaviour of Granular Materials. Road Mater. Pavement Des. 2005, 6, 31–51. [Google Scholar] [CrossRef]
  37. Guo, Y.; Zhai, W. Long-Term Prediction of Track Geometry Degradation in High-Speed Vehicle–Ballastless Track System Due to Differential Subgrade Settlement. Soil Dyn. Earthq. Eng. 2018, 113, 1–11. [Google Scholar] [CrossRef]
  38. Gidel, G.; Denys, B.; Hornych, P.; Chauvin, J.-J.; Denis, A. A New Approach for Investigating the Permanent Deformation Behavior of Unbound Granular Material Using the Repeated Load Triaxial Apparatus. Bull. Lab. Ponts Chaussées 2001. [Google Scholar]
  39. Chen, R.; Chen, J.; Zhao, X.; Bian, X.; Chen, Y. Cumulative Settlement of Track Subgrade in High-Speed Railway under Varying Water Levels. Int. J. Rail Transp. 2014, 2, 205–220. [Google Scholar] [CrossRef]
  40. Ramos, A.; Gomes Correia, A.; Calçada, R.; Alves Costa, P.; Esen, A.; Woodward, P.K.; Connolly, D.P.; Laghrouche, O. Influence of Track Foundation on the Performance of Ballast and Concrete Slab Tracks under Cyclic Loading: Physical Modelling and Numerical Model Calibration. Constr. Build. Mater. 2021, 277, 122245. [Google Scholar] [CrossRef]
  41. Mathworks Least-Squares (Model Fitting) Algorithms [Online]. Available online: https://www.mathworks.com/help/optim/ug/least-squares-model-fitting-algorithms.html (accessed on 8 August 2023).
  42. Marolt Čebašek, T.; Esen, A.F.; Woodward, P.K.; Laghrouche, O.; Connolly, D.P. Full Scale Laboratory Testing of Ballast and Concrete Slab Tracks under Phased Cyclic Loading. Transp. Geotech. 2018, 17, 33–40. [Google Scholar] [CrossRef]
  43. UIC—International Union of Railways. UIC—International Union of Railways. UIC Code 719R: Earthworks and Track Bed for Railway Lines. In UIC 719 R Earthworks Track Bed Railway Lines; UIC: Paris, France, 2008; p. 117. [Google Scholar]
  44. Biarez, J.; Liu, H.; Gomes Correia, A.; Taibi, S. Stress-Strain Characteristics of Soils Interesting the Serviceability of Geotechnical Structures. In Proceedings of the Pre-Failure Deformation Characteristics of Geomaterials, Torino, Italy, 28–30 September 1999; pp. 617–624. [Google Scholar]
  45. Gomes Correia, A.; Cunha, J. Analysis of Nonlinear Soil Modelling in the Subgrade and Rail Track Responses under HST. Transp. Geotech. 2014, 1, 147–156. [Google Scholar] [CrossRef]
  46. Dong, K.; Connolly, D.P.; Laghrouche, O.; Woodward, P.K.; Alves Costa, P. Non-Linear Soil Behaviour on High Speed Rail Lines. Comput. Geotech. 2019, 112, 302–318. [Google Scholar] [CrossRef]
  47. Ishibashi, I.; Zhang, X. Unified Dynamic Shear Moduli and Damping Ratios of Sand and Clay. Soils Found. 1993, 33, 182–191. [Google Scholar] [CrossRef]
  48. Bolton, M.D. The Strength and Dilatancy of Sands. Geotechnique 1986, 36, 65–78. [Google Scholar] [CrossRef]
  49. Galavi, V.; Brinkgreve, R.B.J. Finite Element Modelling of Geotechnical Structures Subjected to Moving Loads. Numer. Methods Geotech. Eng. 2014, 235–240. [Google Scholar]
  50. Costa, P.A.; Colaço, A.; Calçada, R.; Cardoso, A.S. Critical Speed of Railway Tracks. Detailed and Simplified Approaches. Transp. Geotech. 2015, 2, 30–46. [Google Scholar] [CrossRef]
Figure 1. Steel slag particle size distribution within the Portuguese specification limits for sub-ballast [30].
Infrastructures 09 00106 g001
Figure 2. (a) Stress paths followed on the monotonic triaxial compression tests and (b) the corresponding stress–strain curves.
Infrastructures 09 00106 g002
Figure 3. Evolution of resilient modulus with mean effective stress.
Infrastructures 09 00106 g003
Figure 4. Evolution of permanent deformation with load cycles.
Infrastructures 09 00106 g004
Figure 5. Variation in the material constants along the iterations.
Infrastructures 09 00106 g005
Figure 6. Variation in the R2 with the number of iterations.
Infrastructures 09 00106 g006
Figure 7. Calibration of the model.
Infrastructures 09 00106 g007
Figure 8. Ballasted track model with steel slag.
Infrastructures 09 00106 g008
Figure 9. Stress levels on the bottom of the ballast layer.
Infrastructures 09 00106 g009
Figure 10. Developed methodology.
Infrastructures 09 00106 g010
Figure 11. Range of cumulative, permanent displacement of the ballasted track with steel slag.
Infrastructures 09 00106 g011
Figure 12. Procedure to evaluate the reference secant modulus at 50% of maximum deviatoric stress (E50ref) and the m coefficient.
Infrastructures 09 00106 g012
Figure 13. Comparison between laboratory tests and HSM small for the stress–strain curves of the monotonic triaxial tests.
Infrastructures 09 00106 g013
Figure 14. Reference scenario for (a) ballast track and (b) slab track [26].
Infrastructures 09 00106 g014aInfrastructures 09 00106 g014b
Figure 15. Finite element model: (a) global overview; (b) detailed view of slab track; (c) detailed view of the ballast track.
Infrastructures 09 00106 g015
Figure 16. Dynamic amplification factor for the ballast track case with steel slag layer: (a) IP15; (b) IP 50.
Infrastructures 09 00106 g016
Figure 17. Dynamic amplification factor for the slab track case with steel slag layer: (a) IP15; (b) IP 50.
Infrastructures 09 00106 g017
Figure 18. Dispersion curves for both railway tracks and the geotechnical profile with PI 50.
Infrastructures 09 00106 g018
Table 1. Main physical parameters of the steel slags.
ParametersValues
D505 mm
Fines content (<0.074 mm)8%
Uniformity Coefficient100
Curvature Coefficient2.25
Specific gravity3.53
Maximum dry unit weight2850 kg/m3
Optimum moisture content4%
CBR213%
Table 2. Stress levels applied in the cyclic triaxial tests.
Resilient Modulus TestsPermanent Deformation Tests
σ 3  (kPa)qmax  / σ 3 Nº cycles σ 3  (kPa)qmax  / σ 3 NO. Cycles
704.8620,000202.51,000,000
201.50; 2.50; 4.00; 5.75100/load stage
351.43; 2.29; 3.29; 4.29; 5.71100/load stage
501.60; 2.30; 3.00; 4.00; 5.60100/load stage
701.64; 2.14; 2.86; 4.00; 4.86100/load stage
1001.50; 2.00; 2.80; 3.40; 4.00100/load stage
1501.33; 1.87; 2.27; 2.67; 3.17100/load stage
Table 3. Calibrated parameters of the steel slag.
ParametersValues
εp00.052
B0.313
α0.668
Table 4. Adopted properties of the materials—ballasted track.
MaterialPropertiesObservations
Rail (BS113A)E = 200 × 109 Pa
ρ = 7850 kg/m3
ν = 0.30
BS113A (56 × 101)
EPDM/Railpadk = 40 × 106 N/m
ρ = 1200 kg/m3
ν = 0.00
E = k   ×  thickness/area
Area = 0.140 × 0.133 [m2]
Thickness = 10 × 10−3 m
[42]
Sleepers (G44–650mm spacing)E = 38 × 109 Pa
ρ = 2500 kg/m3
ν = 0.15
Sleeper G44
BallastE = 110 × 106 Pa
ρ = 1530 kg/m3
ν = 0.30
[43]
SubgradeE = 3.3 × EV2 = 3.3 × 65 × 106 Pa
ρ = 2091 kg/m3
ν = 0.35
E is based on Ev2 [42]
Sub-ballast–steel slagE = 171 × 106 Pa;
ρ = 2960 kg/m3
Ν = 0.20
Values were based on the laboratory tests described in Section 2.
Table 5. Calibration of the parameters of the materials of the ballasted tracks.
Type of TrackMaterialParametersStrength Parameters
εp0Bαc′ (kPa)ϕ
Ballasted
track
Ballast0.0141.5120.995050°
Steel slag0.038–0.850.04–6.000.007–0.538564°
Subgrade0.1190.0040.943535°
Table 6. HSS calibrated parameters for the steel slag.
ParameterValue
E 50 ref  (MPa)206
E o e d ref  (MPa)206
E u r ref (MPa)696
m0.7
υ0.2
K 0 0.25
G 0 ref  (MPa)498
γ 0.7 8.09 × 10⁻⁴
c′ (kPa)85
ϕ  (°)64
ψ  (°)24
Table 7. Material properties of the tracks and soils.
LayerYoung ModulusDensityPoisson RatioDamping CoefficientShear Wave Velocity
E (MPa)ρ (kg/m3)ν (-)ξ (-)Cs (m/s)
Slab/Sleeper25e325000.200.012236
Embankment (ballast and sub-ballast)20020000.300.03196
Soft soil30.516000.350.0380
Steel slag112328000.20.03409
Stiff soil20820000.300.03200
Rail (UIC 60)210e378500.300.015170
Rail padsKpad = 50 kN/mm and 0.6m of longitudinal spacing.
Table 8. Material properties of the embankment and soils.
ElementE50 (kPa)Eoed (kPa)Eur (kPa)ϕ′ (º)c′ (kPa)Ψ (º)γ0.7
Embankment (ballast and sub-ballast) (PI 0)35 × 10335 × 10370 × 103455107.5 × 10−5
Soft soil
(PI 50)
1.3 × 1031.3 × 1034 × 10305009.7 × 10−4
Soft soil
(PI 15)
1.3 × 1031.3 × 1034 × 10305003.6 × 10−4
Stiff soil
(PI 0)
40 × 10340 × 10380 × 103355102.4 × 10−4
Steel slag205 × 10340 × 103696 × 10364.4184.5624.268.1 × 10−4
Disclaimer/Publisher’s Note: The statements, opinions and data contained in all publications are solely those of the individual author(s) and contributor(s) and not of MDPI and/or the editor(s). MDPI and/or the editor(s) disclaim responsibility for any injury to people or property resulting from any ideas, methods, instructions or products referred to in the content.

