Article

Incremental Viscoelastic Damage Contact Models for Asphalt Mixture Fracture Assessment

1
CERIS, Department of Civil Engineering, NOVA School of Science and Technology, Universidade NOVA de Lisboa, 2829-516 Caparica, Portugal
2
National Laboratory for Civil Engineering, 1700-066 Lisbon, Portugal
3
Department of Civil Engineering, University of Minho, ISISE, 4800-058 Guimarães, Portugal
*
Author to whom correspondence should be addressed.
Infrastructures 2024, 9(7), 118; https://doi.org/10.3390/infrastructures9070118
Submission received: 7 June 2024 / Revised: 4 July 2024 / Accepted: 18 July 2024 / Published: 22 July 2024

Abstract

:
Asphalt mixtures are widely used as a surfacing material for pavements due to their several advantages. For this reason, robust numerical models still need to be developed to improve the understanding of their fracture behaviour. Recently, an incremental generalised Kelvin (GK) contact model that relates increments in contact displacements with increments in contact forces was proposed to assess the viscoelastic behaviour of asphalt mixtures within a discrete element method (DEM) framework. In this work, the contact model is extended to allow its application to asphalt mixture fracture studies. Two damage models—a brittle and a bilinear softening—coupled with the GK contact model are proposed to consider damage initiation and propagation. A parametric study is presented that assesses the impact of the GK-Damage parameters, showing a sensitivity to the loading velocity and the Maxwell elements, particularly its viscosity element, on the stress–strain response of a single contact. A reduced-size numerical mastic is initially used to speed up the calibration process of the GK-Damage contact parameters, with subsequent validation on a specimen with real experimental dimensions. It is shown that the proposed calibrated damage models can successfully reproduce the time-dependent behaviour, peak stress, and crack path observed in experimental results, highlighting the benefits of the adopted methodology. For the GK-Bilinear model, the fracture energy and maximum contact tensile stress are shown to adjust both the peak stress and softening response. Uniaxial tensile tests on asphalt mixtures indicate that the GK-Bilinear model provides a more realistic characterisation of fracture development. A higher susceptibility to damage at aggregate-to-mastic contacts compared to contacts within the mastic phase is identified.

1. Introduction

Over time, loading, ageing, and temperature fluctuations significantly impact the structural integrity of flexible pavements [1,2]. The conditions during mixing, transport, laying, and compaction also influence the quality of asphalt mixtures [3]. These conditions may contribute to the stiffening of the binder and a reduction in its relaxation capacity [4], causing damage due to the brittleness and reduced adhesive properties of the aged binder, impacting the mechanical performance of asphalt mixtures [5,6]. However, predicting damage initiation and propagation in asphalt mixtures is challenging due to their complex nature. Meso-scale numerical models, particularly the discrete element method (DEM), have emerged as a solution for their effectiveness in modelling the behaviour of these materials [7,8,9,10].
Through the DEM framework, different contact modelling approaches have been developed to describe the undamaged and fracture behaviours of asphalt materials. For instance, Wu et al. [11] adopted a linear elastic contact model combined with a brittle fracture model to simulate the milling process, optimising operations to prevent aggregate breakage and large pieces of asphalt mixtures. In a three-dimensional (3D) DEM model, Zhu et al. [12] used a similar contact model to assess the behaviour of asphalt mixtures under uniaxial compression tests, focusing on the movement of aggregate and binder particles. The results revealed that the movement of coarse aggregates is less pronounced when compared to that of the binder particles, influenced by the particle size and location. This contact approach was also adopted by Peng and Sun [13], who showed the existing correlation between aggregate distribution in horizontal cross-sections and Indirect Tensile strengths.
Although brittle models are simple and require fewer parameters, they may not adequately capture the post-peak behaviour. For this reason, researchers have applied models accounting for a softening fracture representation of these materials, such as linear softening models [14,15,16]. For example, Liang et al. [17] and Peng and Gao [18] adopted an elastic-based linear softening model to investigate the cracking evolution in asphalt mixtures under Semi-Circular Bending and Indirect Tensile tests. Nevertheless, these models have limitations in addressing the time-dependent behaviour of these materials, being suitable only for representing the elastic response and peak stress. To incorporate the viscoelastic nature into DEM models, researchers have adopted Burgers contact models [19,20,21]. Through three-dimensional and two-dimensional (2D) DEM models, Wang and Buttlar [22] and Wang et al. [23] adopted a Burgers model associated with a linear softening model for contacts between aggregates and mastic and within the mastic phase to study block cracking in asphalt pavements, aligning their findings with field observations. Adopting a Burgers model coupled with a brittle model to contacts involving the binder, Zhou and Cao [24] assessed the fatigue damage process of asphalt mixtures under repeated loading, verifying a satisfactory agreement with laboratory tests.
Burgers contact models have limitations in predicting the time-dependent behaviour across various loading conditions (loading frequency and temperature). Thus, more advanced viscoelastic contact models have been introduced to address this issue [25,26]. While generalised models offer improved predictions, studies incorporating damage commonly adopt brittle models to characterise the post-peak response of asphalt materials [27,28,29]. Using a 2D DEM model, Lu et al. [30] proposed an advanced model that combines a viscoelastic behaviour based on a generalised Maxwell chain and included a cohesive fracture constitutive model in parallel [31], providing a more accurate representation of the asphalt concrete behaviour under different loading rates. Recently, Lu et al. [32] adopted the same contact modelling approach for assessing the rutting behaviour of asphalt concrete subjected to a modified wheel tracking test. After applying the model for aggregate-to-mastic and mastic-to-mastic contacts, the 2D numerical study showed that the model was able to capture the effect of different boundary conditions and random aggregate distribution. Recently, it has been shown that, with a simple vectorial bilinear contact model [33], it is possible to predict with a 3D PM DEM-based model a macroscopic response similar to that predicted with more complex cohesive contact models [30,31] with a reduced number of contact strength parameters and lower associated computational costs.
Previous studies highlight a prevalent gap in contact models used for the DEM modelling of asphalt mixtures. Current approaches primarily use linear elastic coupled with damage models, either brittle or softening models. Most studies that employ simple or advanced viscoelastic models are also commonly integrated with brittle models. This evidence underscores the need to develop contact models that adequately represent the viscoelastic nature and damage behaviour of asphalt materials.

2. Objectives and Scope

This study adopts the 3D VirtualPM3DLab DEM model [26] to investigate the failure process of asphalt mixtures. Damage contact models, coupled with a previously devised incremental generalised Kelvin (GK) contact model [26], are proposed and implemented in the DEM model to simulate damage. The proposed models follow two distinct approaches: a simple brittle model and a bilinear softening model. A parametric study is presented to evaluate the influence of the viscoelastic-damage contact parameters on the stress–strain response of a single contact. A calibration procedure that considers experimental data from the mastic portion is devised, focusing on the pre- and post-peak material response under tensile loading, aiming to speed up the calibration of input parameters for the asphalt mixture numerical model. The proposed models are validated through uniaxial tensile tests based on experimental data.

3. Three-Dimensional Numerical Formulation

A three-dimensional particle model that directly represents the aggregates and the mastic with spherical particles following a discrete element model framework was implemented within the VirtualPM3DLab model [26]. The VirtualPM3Dlab has been implemented in C++ by the authors. An innovative 3D generalised Kelvin contact model has been incorporated to model the asphalt material’s viscoelastic behaviour.

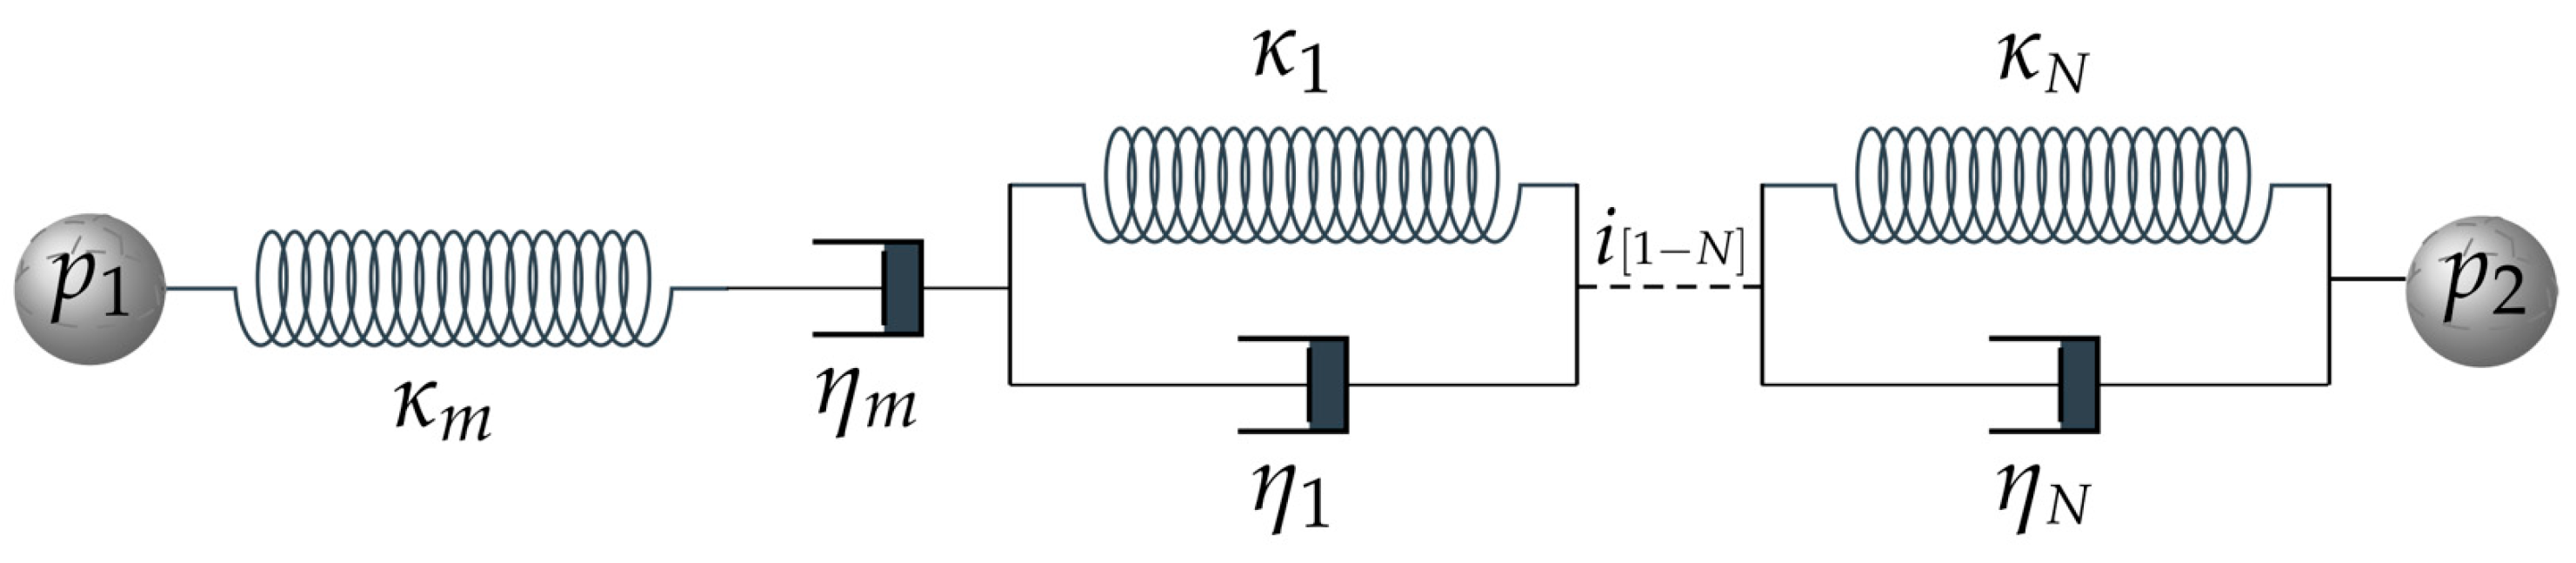
3.1. Viscoelastic Contact Model

The generalised Kelvin contact model (Figure 1) is adopted to characterise the time-dependent behaviour of asphalt materials. This contact model relies on an incremental formulation that utilises the rate of creep compliance to determine the relationships between force and displacement. Compared to the commonly used Burgers models, the adopted GK model predicts the viscoelastic response more accurately for a wider frequency range [34].
The total displacement is defined with the use of an integral hereditary formulation that admits an initial value followed by integration over time, as expressed by
u ξ t = J ξ 0 f t + 0 t d J ξ t t d t t f t d t
where subscript ξ refers to ve and vp representing the viscoelastic and dashpot elements of the contact model, respectively, and t′ is an integration variable.
In the GK contact model, the increment in the displacement of the viscoelastic (Kelvin chains) and dashpot ( η m ) elements is calculated by deriving Equation (1) and further adopted to determine the displacement at time t + Δ t . The displacement associated with the elastic portion derives from the direct relationship between the contact force and the stiffness κ m . The elastic, delayed elastic, and dashpot displacements are, respectively, given by
u e l t + Δ t = u e l t + C e l F t u v e i t + Δ t = u v e i t + u v e i t e Δ t / τ i 1 + Δ t e Δ t / 2 τ i C v e i F t + Δ F 2 u v p t + Δ t = u v p t + Δ t C v p F t + Δ F 2
where C e l , C v e i , and C v p correspond to the inverses of contact parameters κ m , η i , and η m , respectively, and τ i is the retardation times, which is defined as the relationship between viscosity and stiffness for the ith-element of the Kelvin chain.
The total displacement increment ( Δ u ) for the GK contact model is expressed as
Δ u = u e l t + Δ t u e l t + i = 1 N u v e i t + Δ t u v e i t + u v p t + Δ t u v p t
By substituting the elastic, delayed elastic, and dashpot displacements from Equation (2) into Equation (3) and reorganizing the terms, the displacement increment of the GK contact model can be computed. Further details of the governing equations defining the overall displacement and contact force are defined in the authors’ previous studies [26,34].

3.2. Damage Numerical Modelling

A brittle model and a bilinear softening model are proposed and integrated with the viscoelastic incremental contact model—GK-Brittle and GK-Bilinear. Both models have been implemented in the VirtualPM3DLab DEM framework to assess the damage initiation and propagation in asphalt materials. The proposed GK-Brittle model may offer a closer approximation of the behaviour of asphalt mixtures at low temperatures, where micro-cracks tend to form due to extreme conditions, predominantly below 0 °C [35,36,37]. On the other hand, the proposed GK-Bilinear softening model may provide a more accurate representation of conditions typical of in-service temperatures by introducing a level of ductility into the material’s response [38]. The following sections present the formulation and detailed discussion of both damage models.

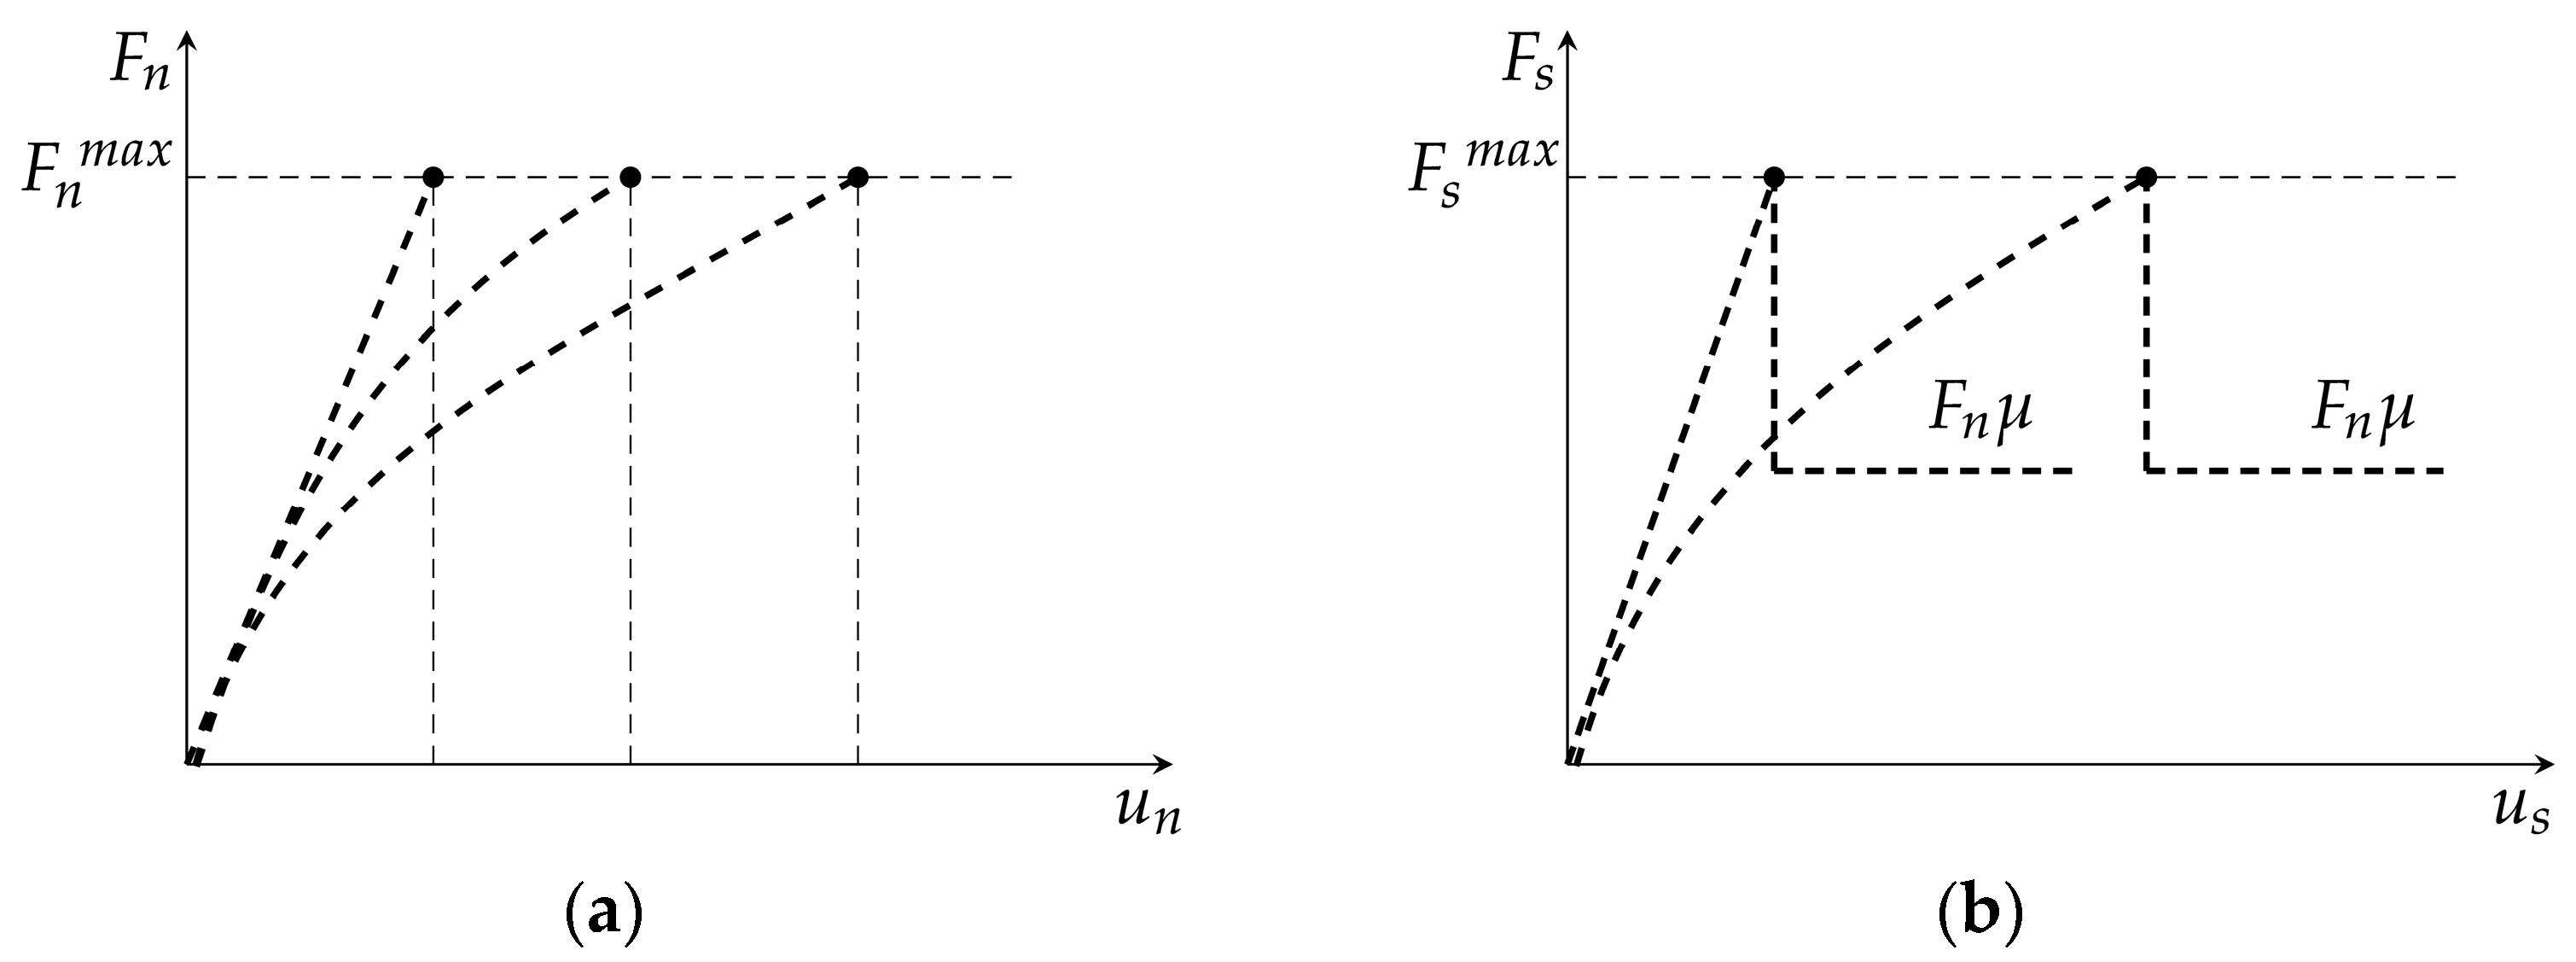
3.2.1. GK-Brittle Damage Model

Given the strength properties of the material, the GK-Brittle model adopts a failure criterion based on a predefined maximum tensile contact strength and cohesion, as illustrated in Figure 2. The contact force in the normal ( F n ) and shear ( F s ) directions hold a force–displacement relationship governed by the equations of the viscoelastic GK contact model, progressing until reaching the maximum contact tensile force ( F n m a x ) or the maximum contact shear force ( F s m a x ).
The maximum contact tensile force ( F n m a x ) and the maximum cohesion force ( C m a x ) are defined given the contact area ( A c ), the maximum contact tensile stress ( σ t ), and the maximum contact cohesion stress ( τ ), as expressed by
F n m a x = σ t A c ( normal   direction ) C m a x = τ A c ( shear   direction )
In the shear direction, the maximum contact shear force ( F s m a x ) is given by
F s m a x = C m a x + F n µ
where µ is the contact friction coefficient.
Upon reaching the maximum allowable normal or shear contact force, the contact is considered to be broken. Under tensile loading, the contact forces are promptly reset to zero. If the contact is under compression, the contact interaction occurs under pure friction conditions following the incremental GK model under compression/shear.

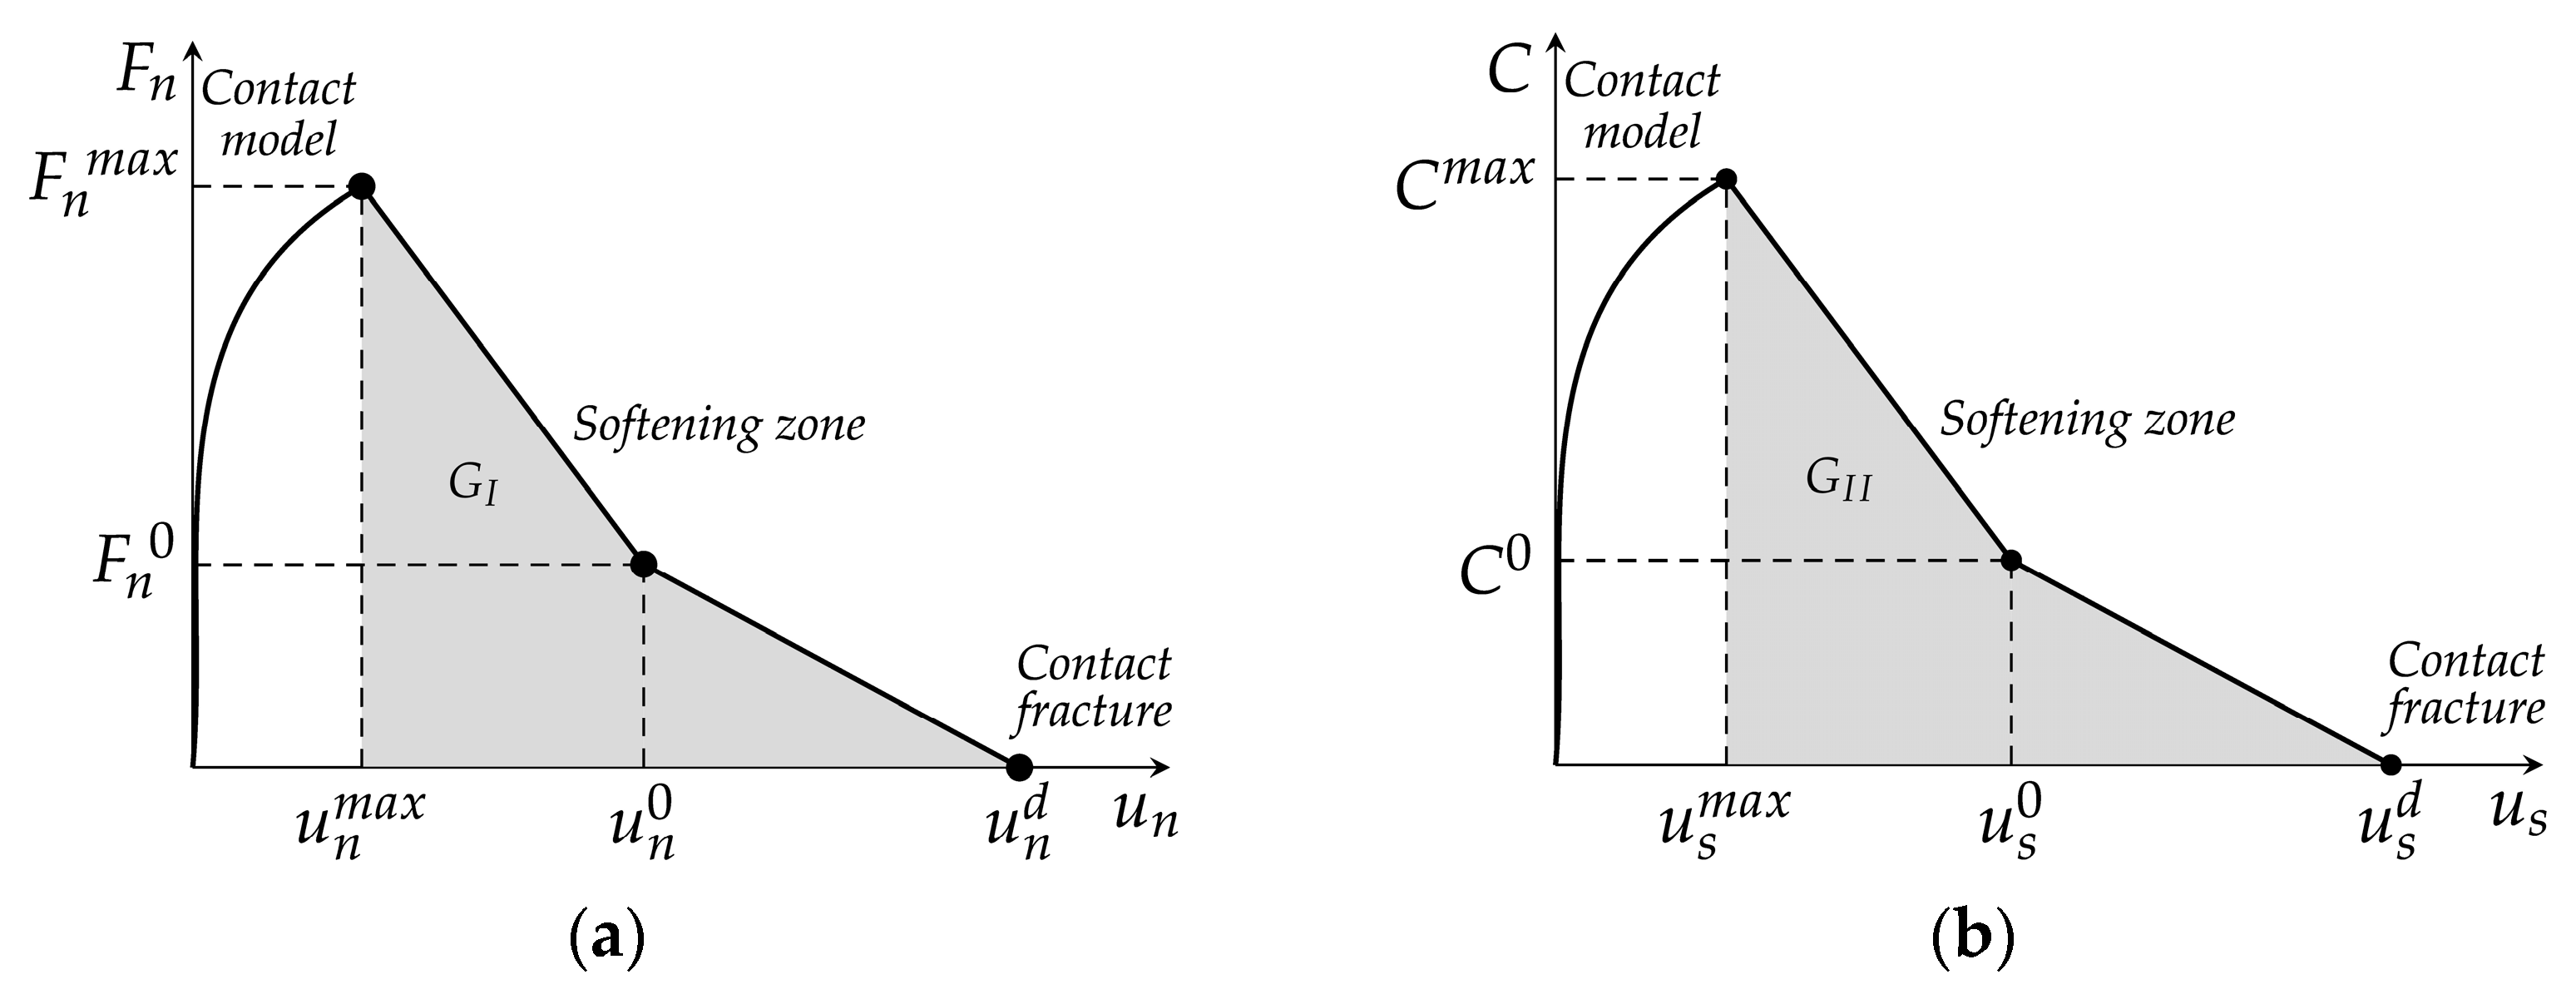
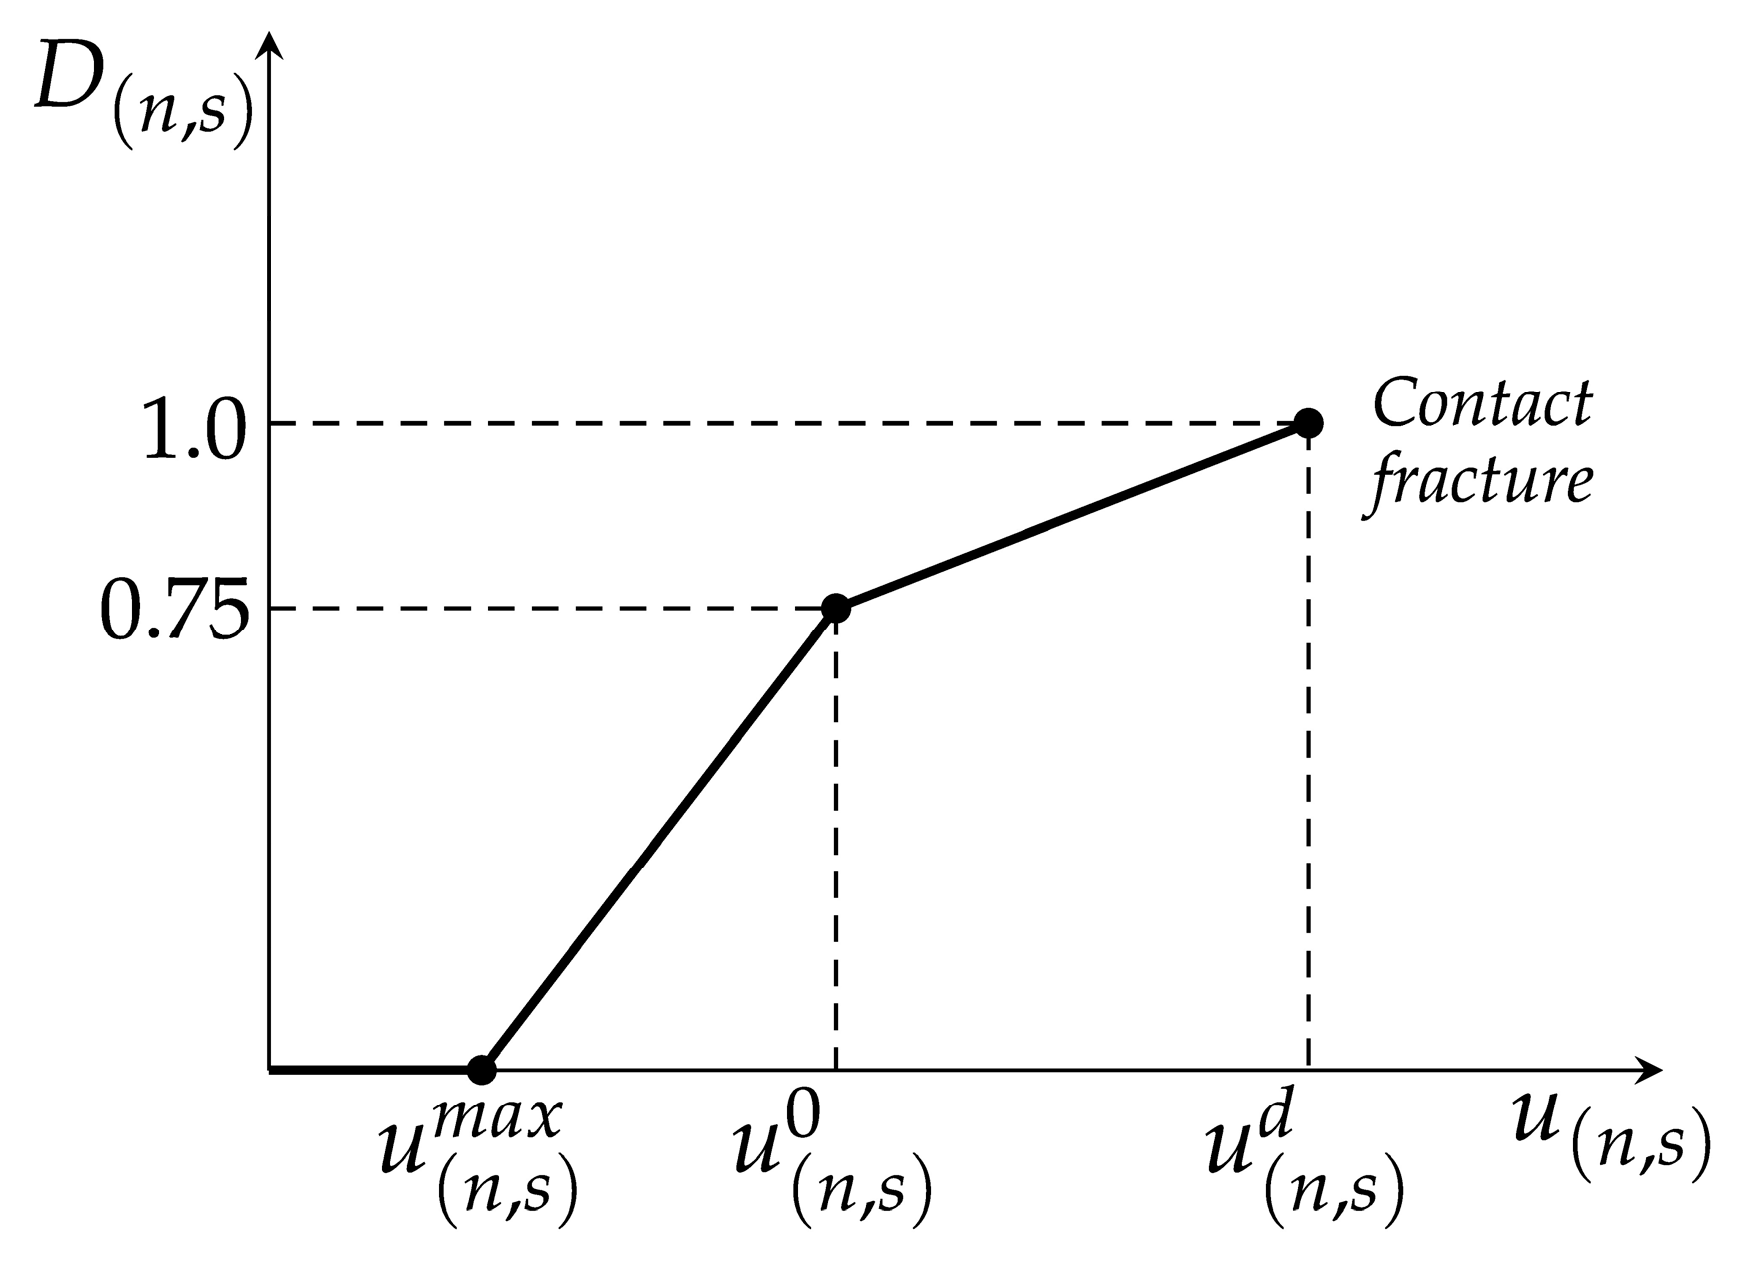
3.2.2. GK-Bilinear Softening Damage Model

In order to simulate the contact behaviour with a softening damage evolution, a bilinear model is proposed and integrated into the 3D DEM model. This contact model is based on the one proposed by Azevedo et al. [39], who evaluated the fracture behaviour in 2D reinforced concrete numerical simulations. Previous studies have shown the relevance of adopting softening-based contact models in asphalt materials damage studies within DEM simulations, such as the work conducted by Kim and Buttlar [40], who studied asphalt materials adopting an elastic linear softening model. However, compared to a linear softening law, a bilinear contact model demonstrated a better agreement with concrete and reinforced concrete experimental data, especially in improving the post-peak ductility under tensile loading [39].
The bilinear contact model is vector-based and requires the definition of five strength properties: the maximum contact tensile strength, the contact fracture energy in mode I ( G I ), the maximum contact cohesion stress, the contact friction term, and the contact fracture energy in mode II ( G I I ). The force–displacement relationships presented in Figure 3 are straightforwardly established based on the maximum contact tensile stress, the maximum cohesion stress, the contact fracture energies in mode I and mode II, and the contact stiffness of the associated generalised Kelvin model. The adopted incremental GK formulation [26,34] notably eases the process of adding a bilinear softening contact law.
The force–displacement relationships presented in Figure 3 are set based on
F ( n , s ) m a x = σ ( n , s ) m a x A c
where σ ( n , s ) m a x refers to σ t (normal direction) or τ (shear direction).
Unlike the GK-Brittle model, which adopts a contact strength failure criterion, the GK-Bilinear model adopts a total contact displacement-controlled criterion. For this reason, within the GK-Bilinear model, damage in either of the contact directions may initiate after the maximum displacement is reached ( u ( n , s ) m a x in Figure 3), depending on the specific viscoelastic contact properties and associated loading velocities.
Note that if an elastic behaviour is adopted, damage only initiates after the peak strength is reached [39]. In the bilinear contact model presented by Azevedo et al. [39], the total contact displacement has an elastic and a damage term, whereas, in the proposed GK-Bilinear contact model, the total contact displacement has a viscoelastic and a damage term.
As shown in Figure 3, the post-peak load zone exhibits three distinct regions in both tensile and shear directions. Once the maximum displacement under a given direction is reached, the maximum contact strength gradually reduces in accordance with the accumulated damage.
The first region corresponds to a displacement within the range of u ( n , s ) m a x and u ( n , s ) 0 . These parameters are computed for both the normal and shear directions, adopting the contact stiffness from the associated generalised Kelvin contact model and using the following expressions:
u n , s m a x = F n , s m a x k n , s
u n , s 0 = 0.75 G θ A c F n , s m a x + u n , s m a x
F n , s 0 = 0.25 F n , s m a x
where G ( n , s ) refers to G I (contact fracture energy in mode I) if the analysis is in the normal (n) direction or G I I (contact fracture energy in mode II) if the analysis is in the shear (s) direction. The G I and G I I terms correspond to the area of the softening region in Figure 3 (grey-painted area) for the normal and shear directions. The term k n , s is the contact stiffness of the associated Kelvin model. In this study, the contact stiffness assumes the relationship between the adopted spring stiffness of the Maxwell unit k m and the contact area and contact length of the particle-to-particle contact.
From Equations (7)–(9), it is possible to quantify the maximum contact strength and the corresponding contact damage. The parameter that defines the boundaries of the force–displacement relationship in the second zone ( u ( n , s ) d ), enabling the calculation of the current damage in a given direction, is given by
u n , s d = 5.0 G ( n , s ) A c F n , s m a x + u n , s m a x
In the proposed GK-Bilinear softening contact model, damage in each direction is quantified as a function of the maximum displacement experienced by the contact in that specific direction. The damage factor D n , s , which indicates the damage in either of the contact directions, varies from zero, meaning that the contact is intact, to 1.0, which indicates a completely cracked contact, as illustrated in Figure 4.
Based on Figure 4 the evolution of D n , s is described by the following relationships:
D n , s = 0 i f   u n , s < u n m a x 0.75 × u n , s u n , s m a x u n , s 0 u n , s m a x , i f   u n m a x u n , s < u n 0 0.75 + 0.25 × u n , s u n , s 0 u n , s d u n , s 0 , i f   u n 0 u n , s < u n d 1 , i f   x 0
where u n , s is the maximum contact displacement that has been calculated either in the normal or shear directions.
In an approximate way, the overall contact damage is determined by considering the combined effects of both tensile damage ( D n ) and shear damage ( D s ). The calculation of the damage ( D ) is expressed as
D = D n + D s
Given the current total contact damage, the maximum values for both tensile and cohesive strengths are adjusted accordingly, and the contact forces are recalculated given the updated maximum strength values. Once the current contact damage has been assessed, the current maximum values of tensile and cohesive strengths are adjusted, and the contact forces are re-evaluated according to the revised maximum strength values:
F n m a x , u p d a t e d = 1 D × F n m a x
C m a x , u p d a t e d = 1 D × C m a x
F s m a x = C m a x , u p d a t e d + F n
If the normal contact force surpasses F n m a x , u p d a t e d , the following correction is adopted:
F n = F n m a x , u p d a t e d
Based on the updated value of F n obtained from Equation (16), the maximum contact shear strength ( F s m a x ) is recalculated according to Equation (15). In a similar manner, if the shear contact force exceeds F s m a x , its value is adjusted accordingly:
F s = F s m a x F s F s
If the total contact damage reaches 1.0, the contact is considered to be broken (cracked contact). Under tensile loading, the contact forces are promptly reset to zero. If the contact is under compression, the contact interaction occurs under pure friction conditions following a viscoelastic model under compression/shear:
F s m a x = F n

4. Parametric Study of the Proposed GK-Damage Contact Models

To fully understand the performance of the proposed GK-Brittle and GK-Bilinear viscoelastic damage models, a single contact is initially evaluated for different input parameters and loading conditions. A two-particle numerical specimen (Figure 5), each with a 2.0 mm diameter, is tested. The presented sensitive study is fundamental to ease the trial-and-error calibration process that is necessary to carry out when modelling asphalt mastic or an asphalt mixture.
The particle model is subjected to a monotonic tensile test, wherein a constant velocity of 2.0 × 10 5 m/s is applied to the upper particle while the lower particle remains fixed in all directions. A time step of 5.69 × 10 7 s/step is adopted in the numerical simulations. For this analysis, three Kelvin units are adopted to represent the micro-mechanical properties of the GK contact model (Figure 1), whose values are detailed in Table 1. In addition, Table 2 presents the reference strength parameters used for the assessment of the proposed fracture models. Given that only normal contacts are involved, there is no need to set the shear-associated strength parameters. In this analysis, the results are presented in stress–strain relationships, where the stress is calculated as the ratio of contact force to contact area, and the strain is determined by the ratio of contact displacement to the distance between the centres of gravity of the particles.
This parametric study evaluates the effects of the loading velocity, the maximum contact tensile strength, the contact fracture energy in mode I, and the GK contact parameters on the stress–strain response of the proposed GK-Damage models. The values and ranges adopted have been chosen only to illustrate their influence on the numerical response of a single contact. The following subsections will detail the parameters under analysis and the specific values applied.

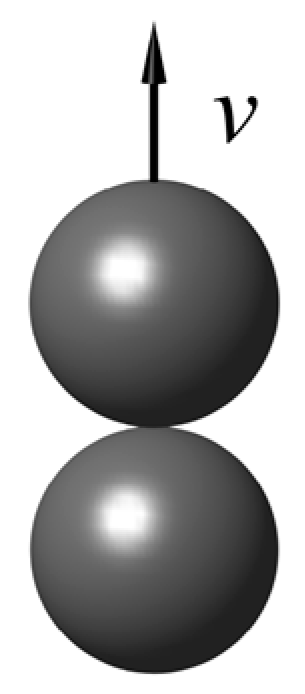
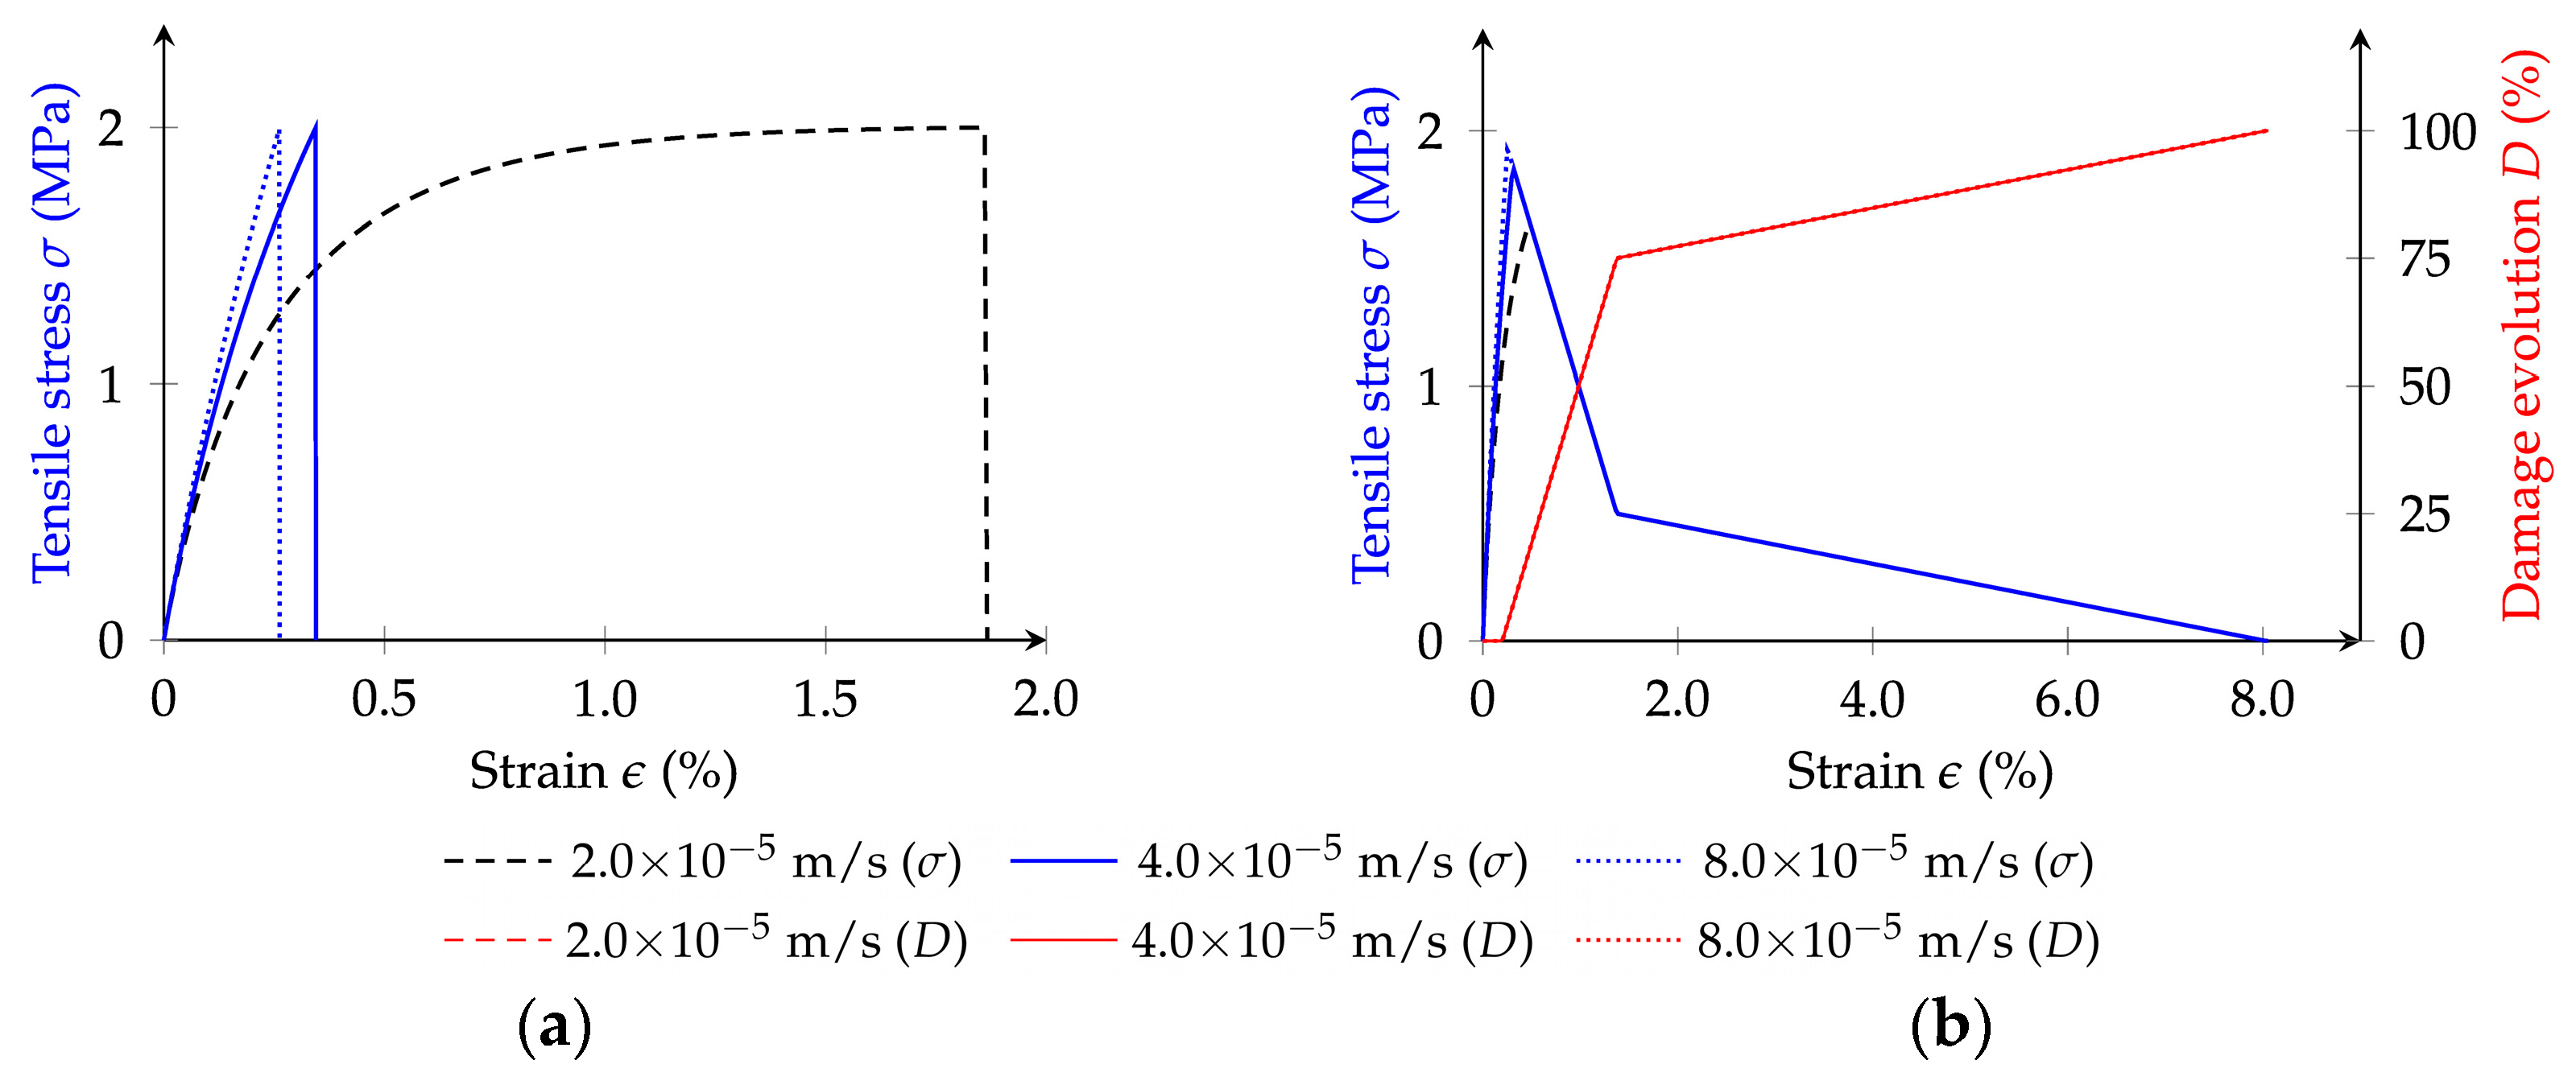
4.1. Influence of the Loading Velocity

In this section, the influence of loading velocity on the response of the particle model is assessed for the proposed GK-Damage models. The impact of three different loading velocities is evaluated specifically 2.0 × 10 5 m/s (reference), 4.0 × 10 5 m/s, and 8.0 × 10 5 m/s. The input parameters are detailed in Table 1 and Table 2, with the corresponding numerical results presented in Figure 6.
The analysis of Figure 6a reveals that the loading velocity directly influences the behaviour of the numerical model when adopting the proposed GK-Brittle model. An increase in the loading velocity results in a more brittle response of the model. As the applied velocity decreases, there is a significant increase in cumulative strain, resulting in a more viscous response. As expected, the peak stress remains unchanged because the GK-Brittle model is strength-controlled.
The loading velocity also influences the stress–strain response predicted with the GK-Bilinear model (Figure 6b). Contrary to the response observed with the GK-Brittle model, with the GK-Bilinear model, the peak stress increases with the increase in the applied loading velocity. As shown, the input tensile strength (2.0 MPa) is never reached for the range of velocities. This response is attributed to the displacement-controlled nature of the GK-Bilinear model, wherein the total contact displacement reaches the yield displacement ( u n m a x in Figure 3a) before reaching the peak load. In addition, at lower loading velocities, the viscous response of the GK-Bilinear contact model is more pronounced. Figure 6b also presents the damage evolution. As shown, the damage evolution is similar for all tested contact velocities, which was expected given that the GK-Bilinear model damage evolution is governed by the total contact displacement.
Figure 6b further shows that the GK-Bilinear-predicted contact damage evolution curve can be divided into three stages. These stages include an initial elastic region marked by an increase in the tensile stress, followed by a stage characterised by rapid damage development, and a final stage defining damage stabilisation tendency. These observations for a single contact are in close agreement with the results reported by Dan et al. [41], who assessed the loading velocity’s effects on asphalt mixtures.

4.2. Influence of the Maximum Contact Tensile Strength

This section assesses the impact of the adopted maximum contact tensile strength on the overall response of a two-particle assembly. The effects of three distinct contact strengths—1.0 MPa, 1.5 MPa, and 2.0 MPa (reference)—are evaluated. Table 1 and Table 2 show the adopted viscoelastic parameters and the contact fracture energy in mode I ( G I ), respectively. The applied velocity is 2.0 × 10 5 m/s. The numerical results are presented in Figure 7.
The analysis of Figure 7 shows the impact the adopted contact strength has on the performance predictions of the proposed GK-Damage contact models. Within the GK-Brittle model, an increase in the maximum contact tensile strength leads to an increase in the cumulative strain. As noted, in the GK-Brittle contact model, the predicted tensile strength matches the input value. Also, a lower contact strength leads to a more brittle response under the same set of viscoelastic parameters for the GK-Brittle contact model.
Regarding the GK-Bilinear contact model predictions, the adopted maximum contact tensile strength affects the peak stress and post-peak ductility of the material. Interestingly, a higher maximum tensile contact strength increases the predicted maximum tensile strength but reduces the post-peak ductility. Notably, with the lowest adopted maximum contact tensile strength ( σ t = 1.0 MPa), the particle model’s predicted maximum tensile strength is close to the set value.
The results presented show some interesting differences in the predictions of the proposed GK damage models. In the GK-Brittle, an increase in the assumed maximum contact tensile strength leads to a more ductile post-peak behaviour, whereas in the GK-Bilinear, an increase in the assumed maximum contact tensile strength leads to a more brittle post-peak behaviour for the same set of viscoelastic contact properties. If the contact fracture energy is held constant in mode I and a higher contact tensile strength are assumed, the GK damage force–displacement is much more brittle as the controlled displacement values are lower compared to the GK damage for lower tensile strength (see Figure 3 and Equations (7)–(9)).

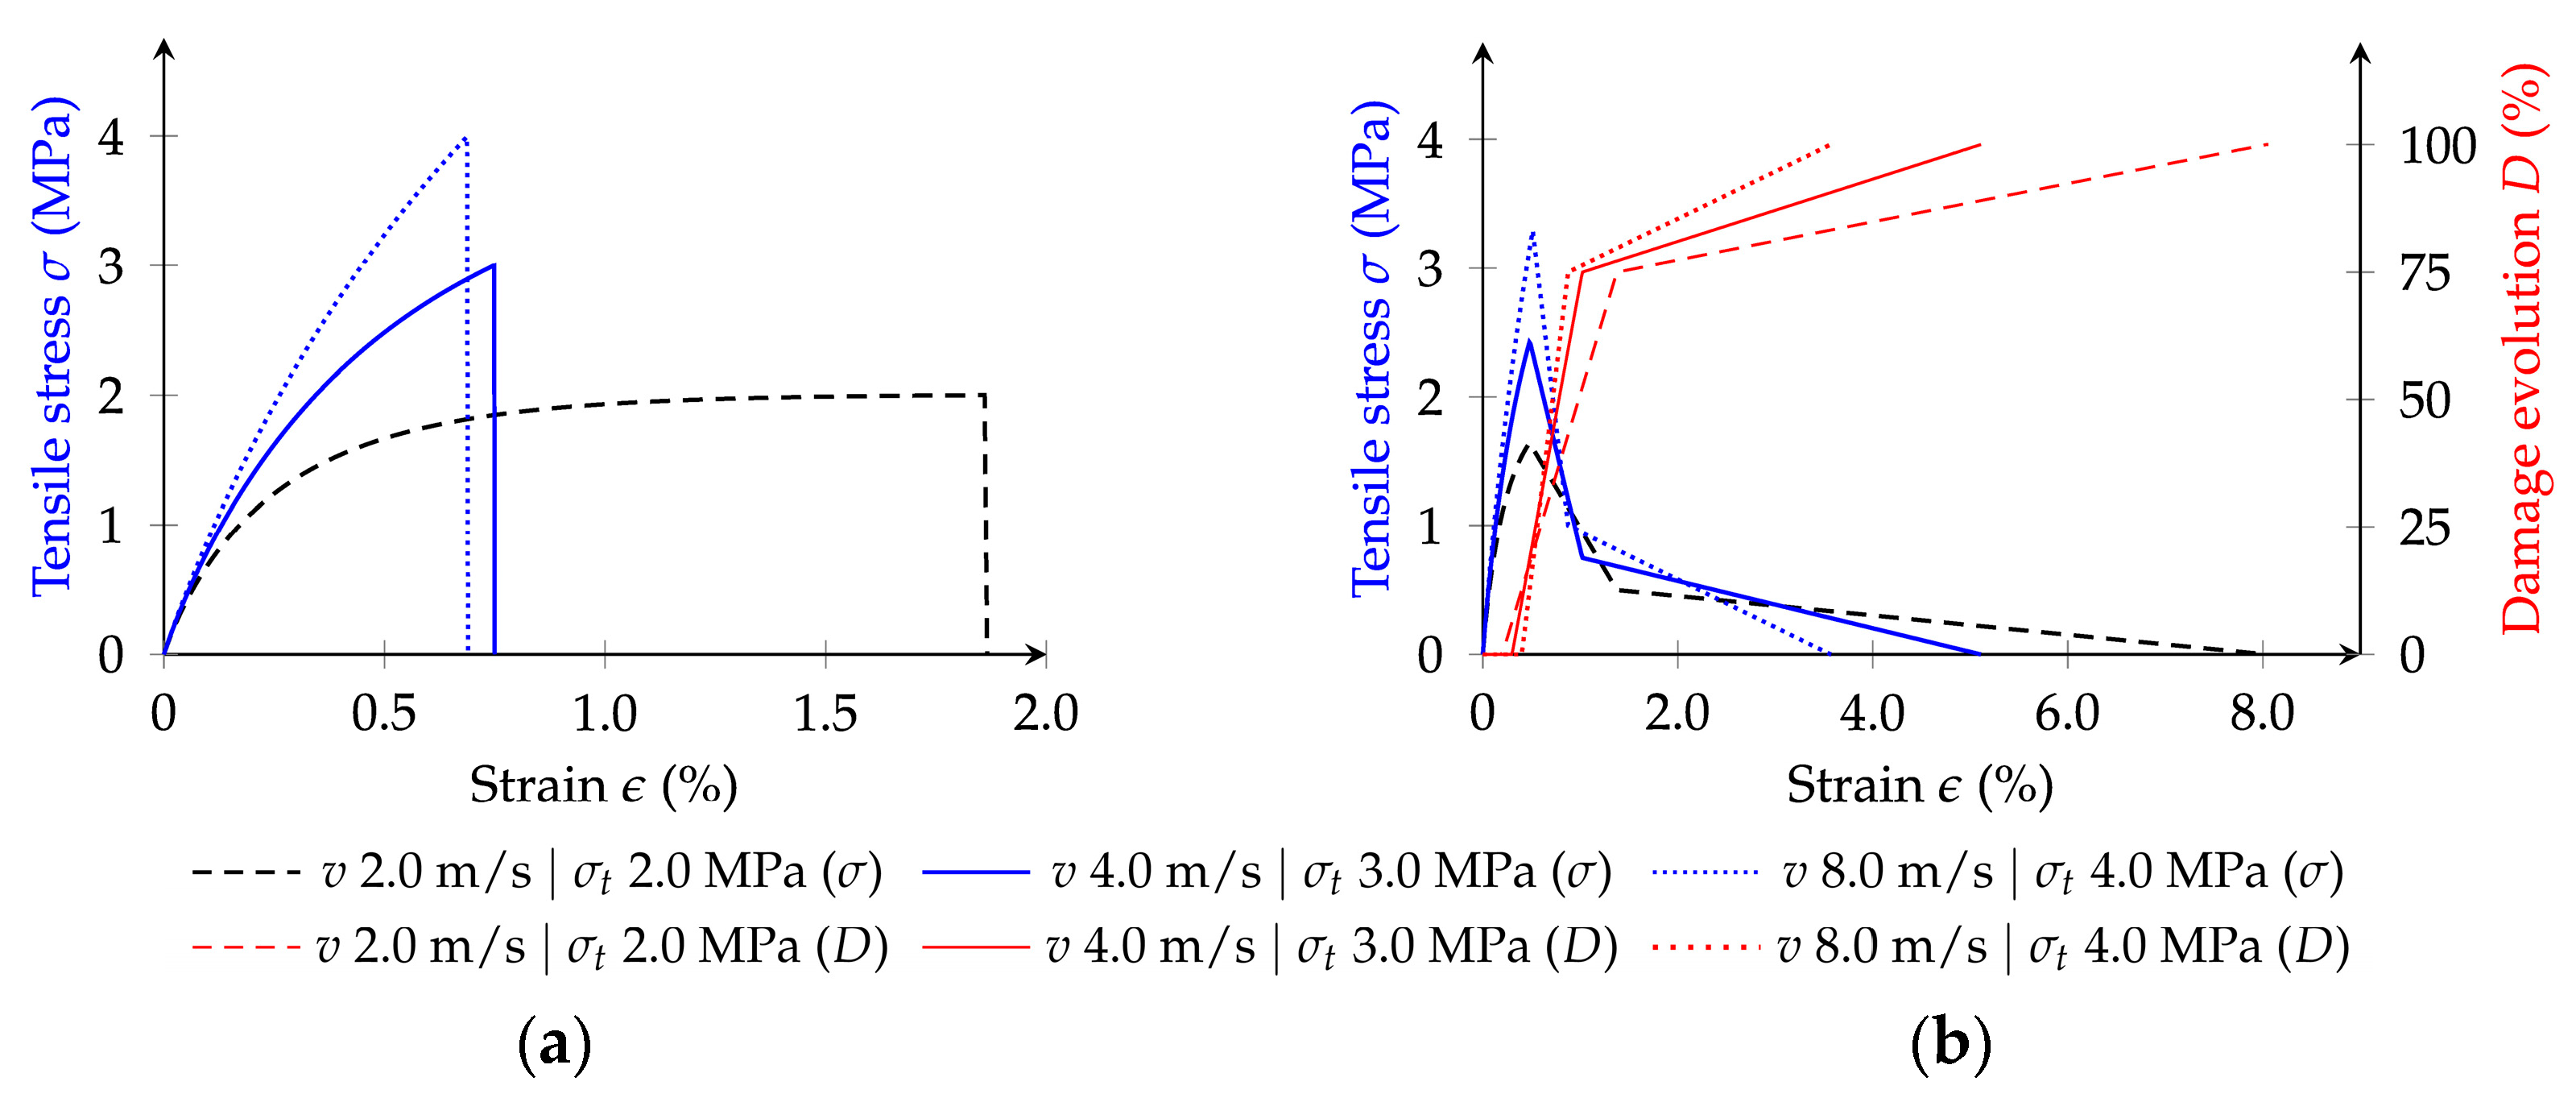
4.3. Influence of Both the Loading Velocity and Maximum Contact Tensile Strength

Previous analyses have shown the individual impacts of the loading velocity and the maximum contact tensile strength on the stress–strain response of a single contact under tensile loading. This section assesses the combined influence of these two variables. Different combinations of loading velocity and maximum contact tensile strength are explored, as detailed in Table 3. The remaining parameters are the same as those described for the reference values.
The numerical results, presented in Figure 8, show the combined impacts of loading velocity and maximum contact tensile strength on the performance of the GK-Damage models. The results indicate an increase in the post-peak brittleness response with the increase of both variables. For the GK-Brittle model, the predicted tensile stress reaches the adopted maximum contact tensile strength with a gradual increase in the pre-peak viscoelastic behaviour for lower velocities. For the GK-Bilinear model, the adopted velocity and the maximum contact tensile strength noticeably influence the post-peak ductility. Reducing the velocity and maximum contact tensile strength leads to a more ductile post-peak response for the same adopted contact fracture energy in mode I of 0.067 N/mm.

4.4. Influence of the Contact Fracture Energy in Mode I

This section assesses the influence of the contact fracture energy in mode I on the predicted stress–strain behaviour of a single contact under tensile loading. Specifically, it analyses and compares two distinct fracture energies—0.033 N/mm and 0.100 N/mm—with the response predicted with the adopted reference value (0.067 N/mm). Figure 9 illustrates the corresponding results.
As shown, an increase in the contact fracture energy in mode I leads to an increase in both the peak stress and post-peak ductility. The presented results also show that its influence on the predicted post-peak ductility is more pronounced. As expected, the contact damage evolution varies with each adopted contact fracture energy in mode I, as this parameter directly impacts the force–displacement relationship (see Figure 3).

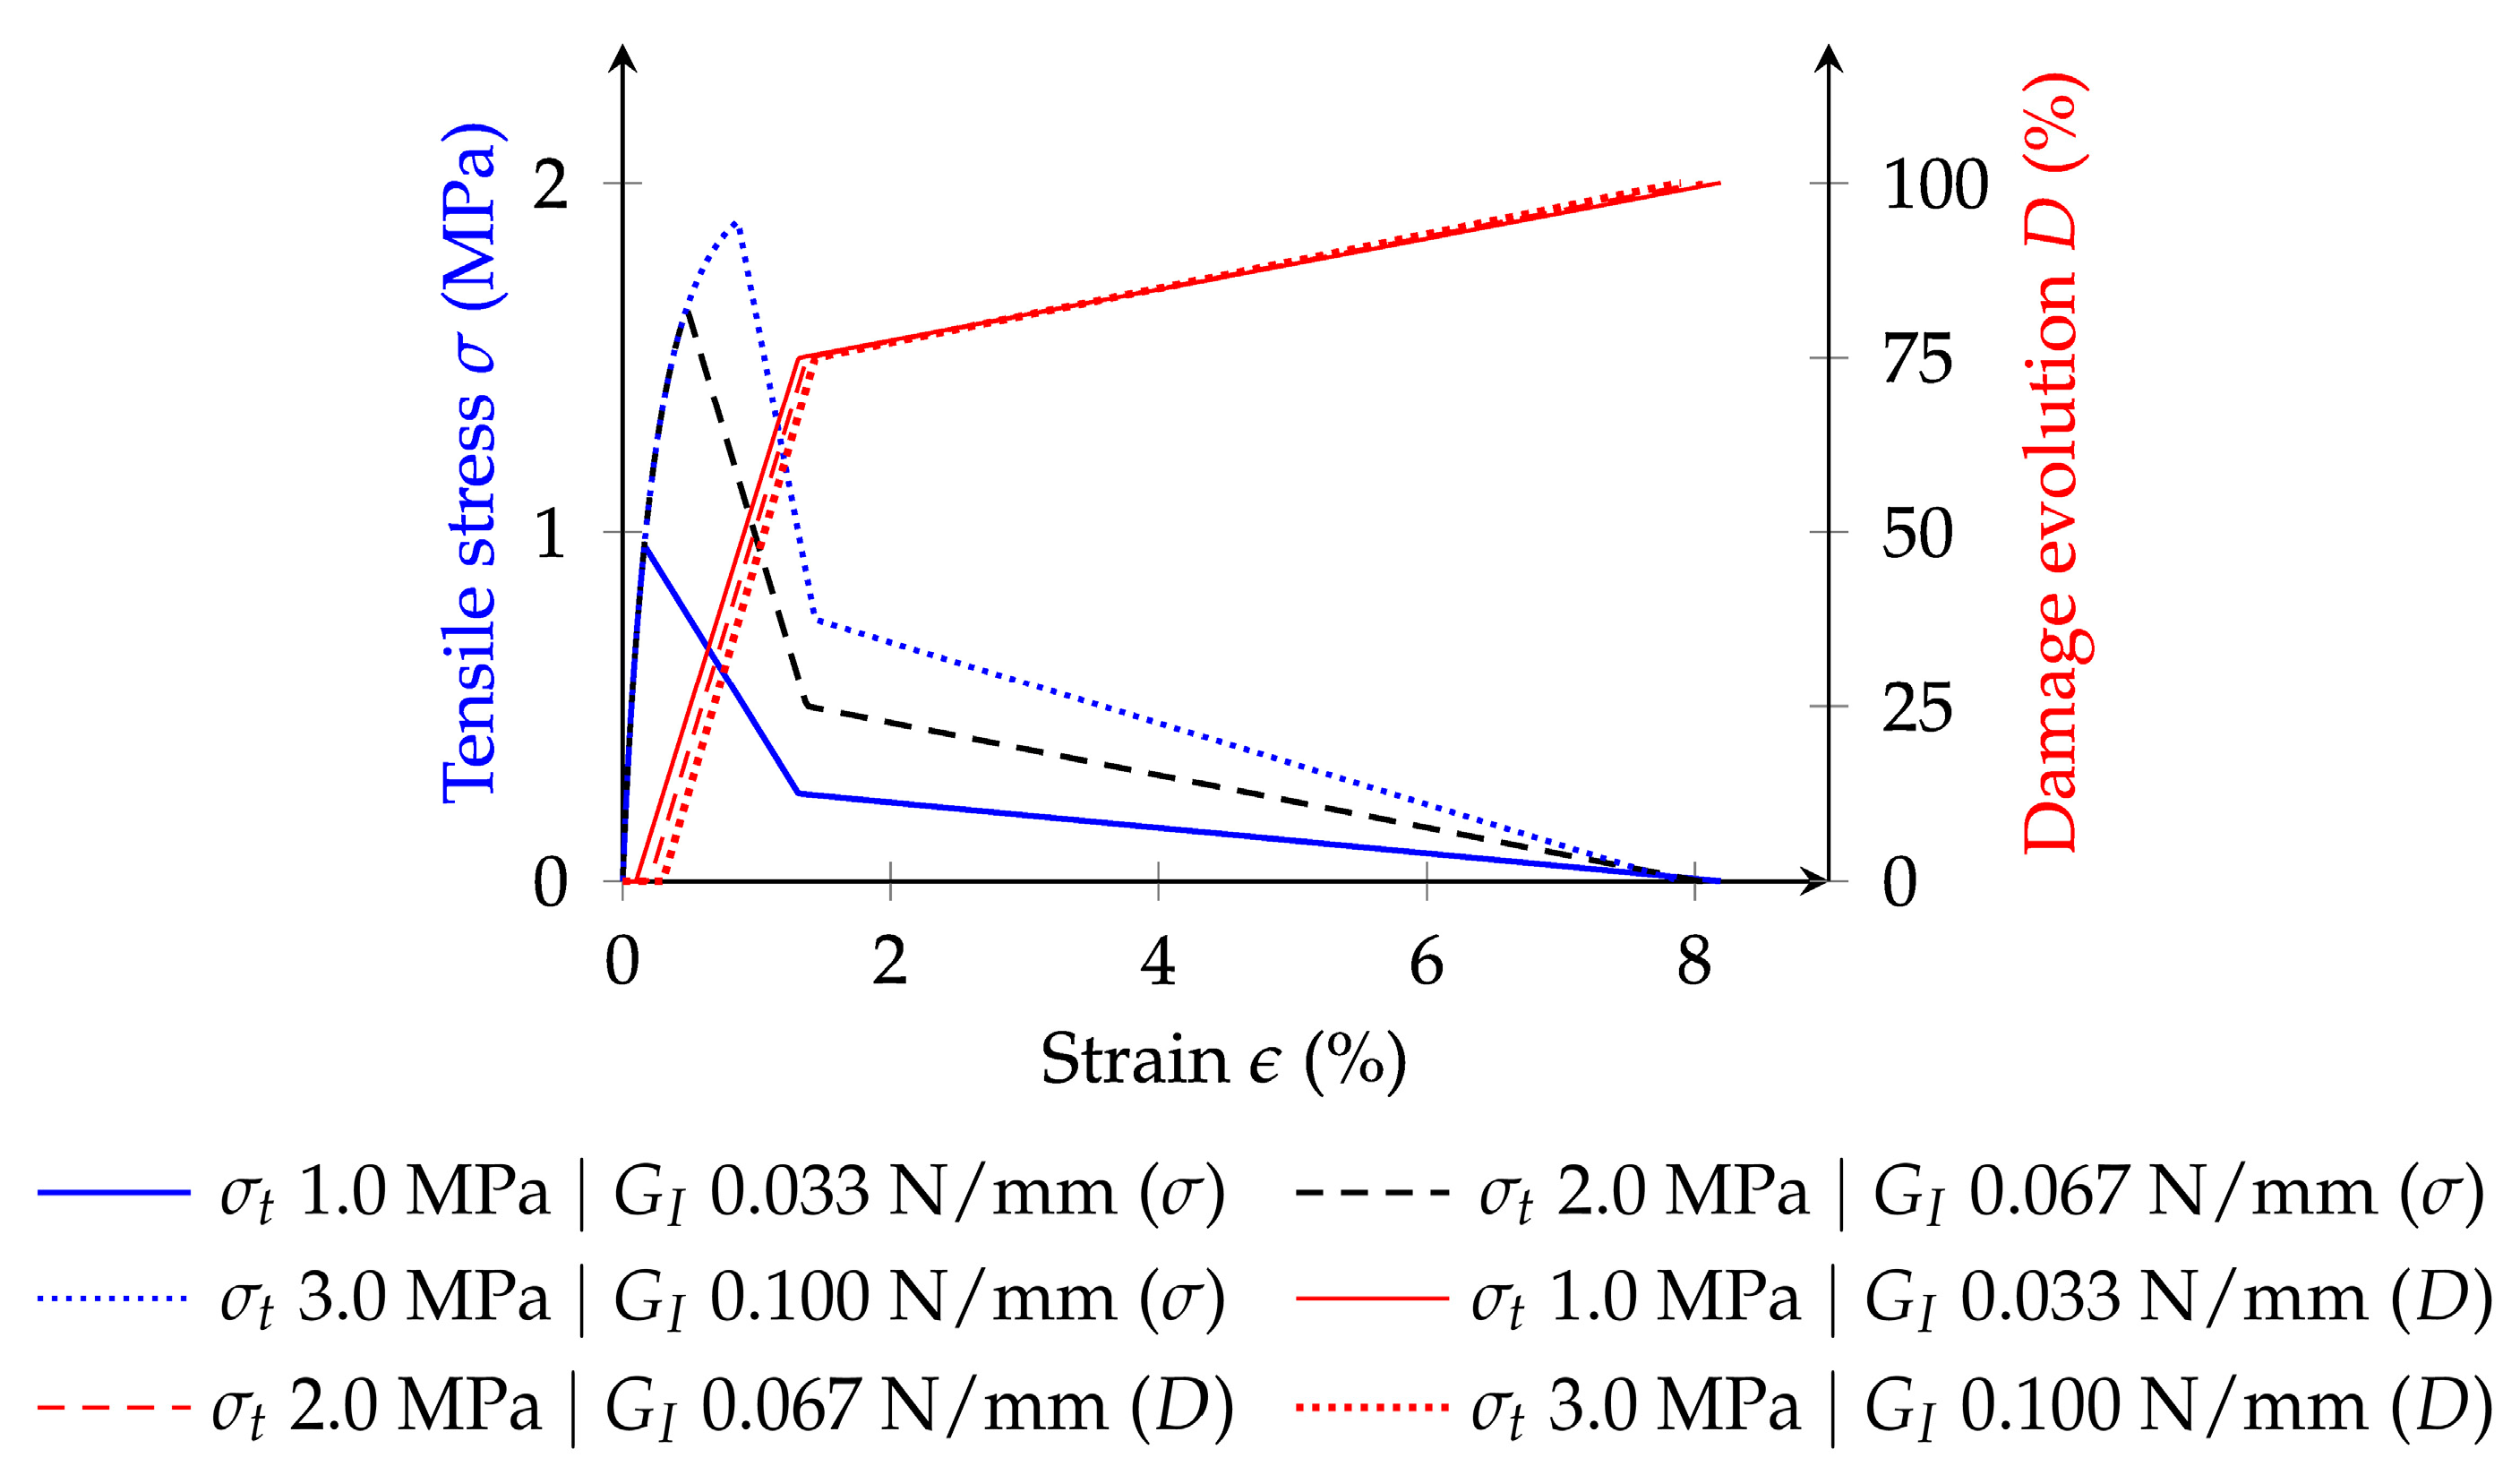
4.5. Influence of Both the Fracture Energy in Mode I and Maximum Contact Tensile Strength

The influence of both contact fracture energy in mode I and the maximum contact tensile strength is evaluated by proportionally increasing both parameters. Table 4 lists the contact strength parameters. The assessment is focused on the GK-Bilinear model.
Figure 10 presents the predicted numerical results. The proportional increase in both contact strength parameters leads to an increase in the peak stress and post-peak ductility. These results indicate that proportionally increasing both contact strength parameters offers an interesting option if it is desired to increase both the peak strength and post-ductility of a particle model under uniaxial tensile loading. For a 3.0 MPa maximum contact tensile strength, a more pronounced viscoelastic behaviour before the peak strength value is observed. The effect of a proportional variation of the maximum contact tensile strength and contact fracture energy in mode I does not significantly affect the contact damage evolution.

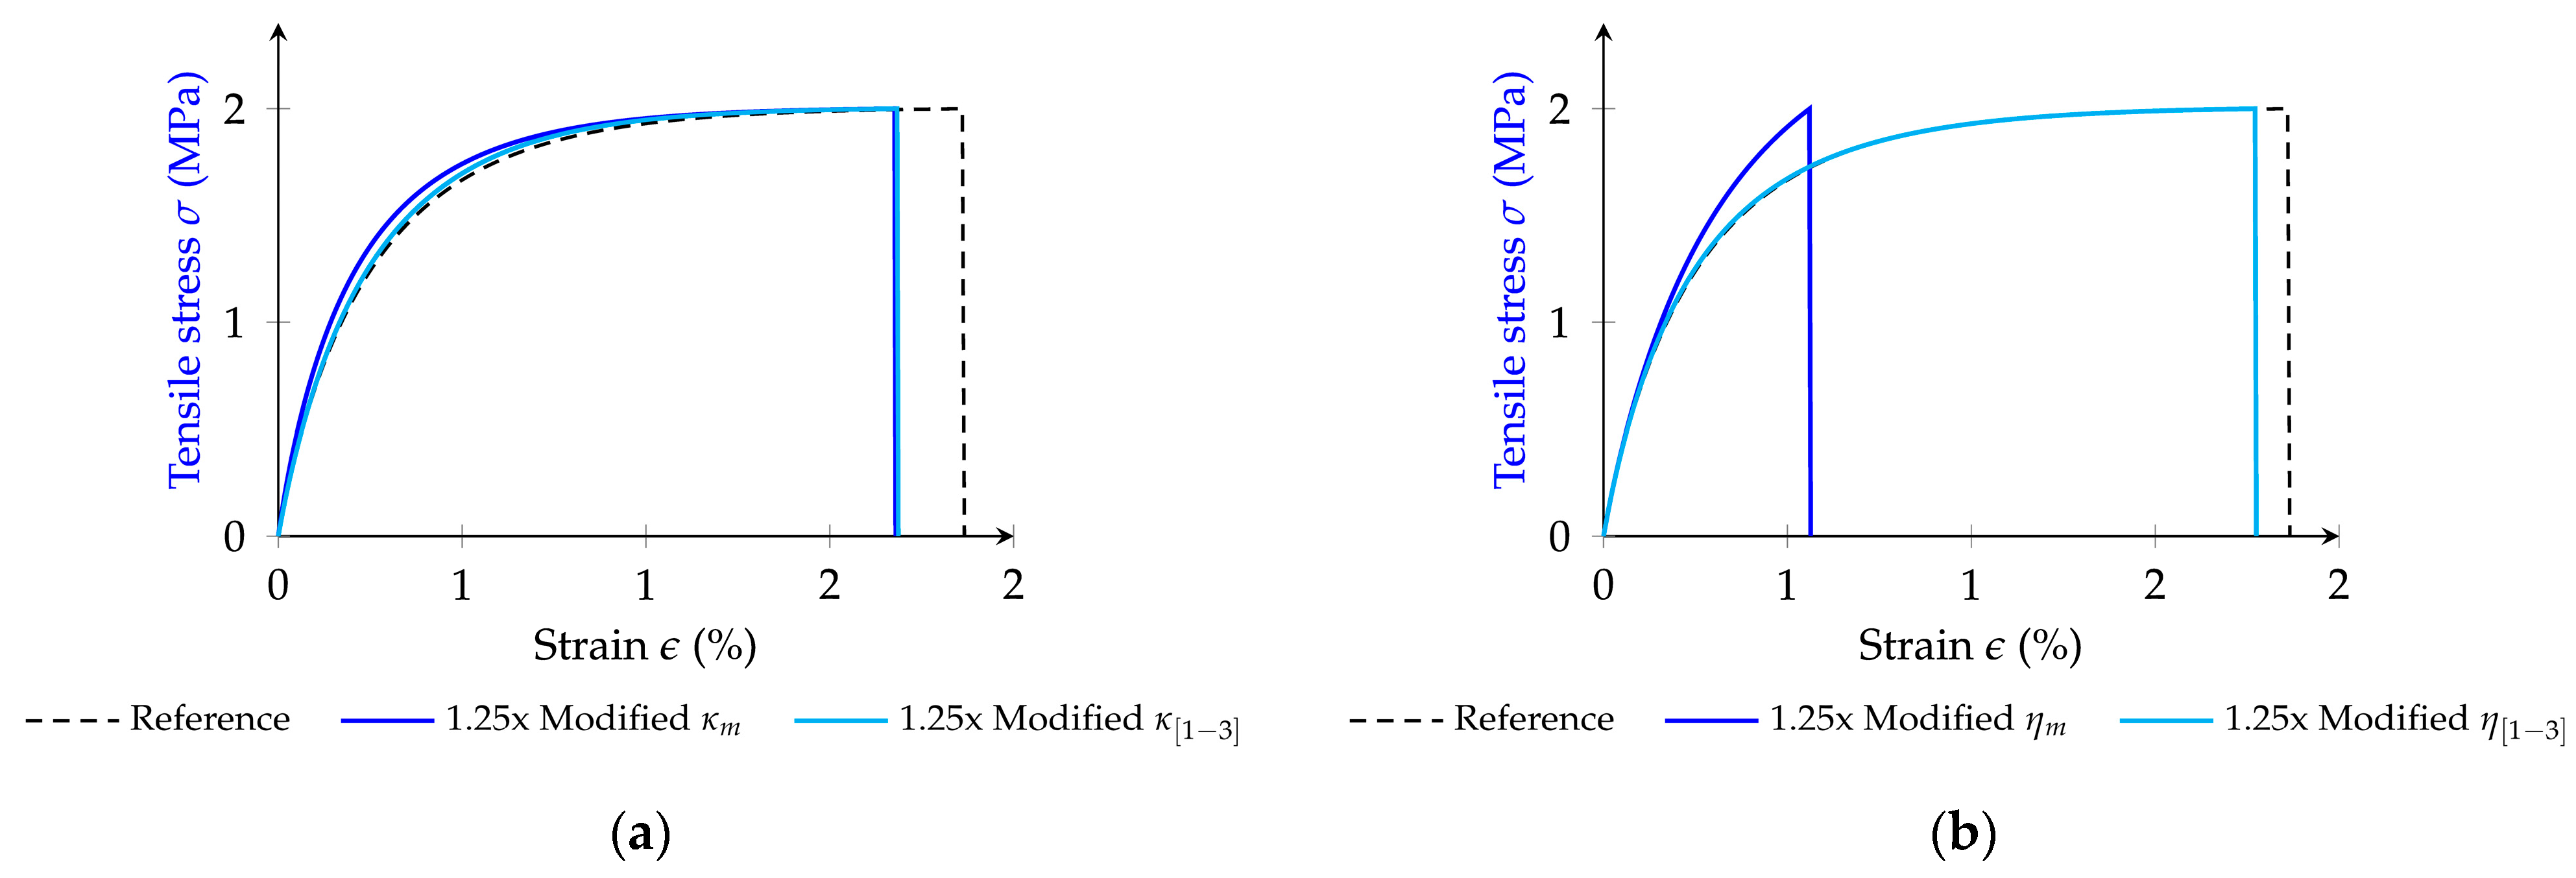
4.6. Influence of the GK Contact Viscoelastic Model Parameters

Previous analyses have focused on the influence of contact strength parameters. Therefore, this section aims to evaluate the impact of the viscoelastic parameters of the GK contact model on the responses predicted by the proposed GK-Damage models. In this analysis, the viscoelastic contact properties listed in Table 1 are individually assessed. Their values are adjusted by a 25.0% increase for the evaluation, and the predictions under tensile loading are then compared to those obtained using the reference values (Table 1). The adopted contact strength parameters are those defined in Table 2. The results for the GK-Brittle and GK-Bilinear models are presented in Figure 11 and Figure 12, respectively.
As presented in Figure 11 for the GK-Brittle model, the Maxwell elements ( κ m and η m ) and the spring elements of the Kelvin units ( κ i ) influence the predicted stress–strain results. An increase in these viscoelastic parameters increases the material’s brittleness, especially noticeable with an increase in the viscosity η m . In the GK-Brittle model, the peak stress value is independent of the adopted viscoelastic contact parameters, which primarily influence the predicted brittleness.
The single contact predictions with the GK-Bilinear model (Figure 12) show that the overall stress–strain evolution is minimally affected for the set of viscoelastic parameters that are assessed. This similar response across different examples is because the damage evolution with the total contact displacement is defined given the Maxwell spring ( κ m ), which, in most of the assessed examples, is similar. In the GK-Bilinear model, the peak value is only slightly influenced by the adopted viscoelastic contact values.

5. Numerical Simulations

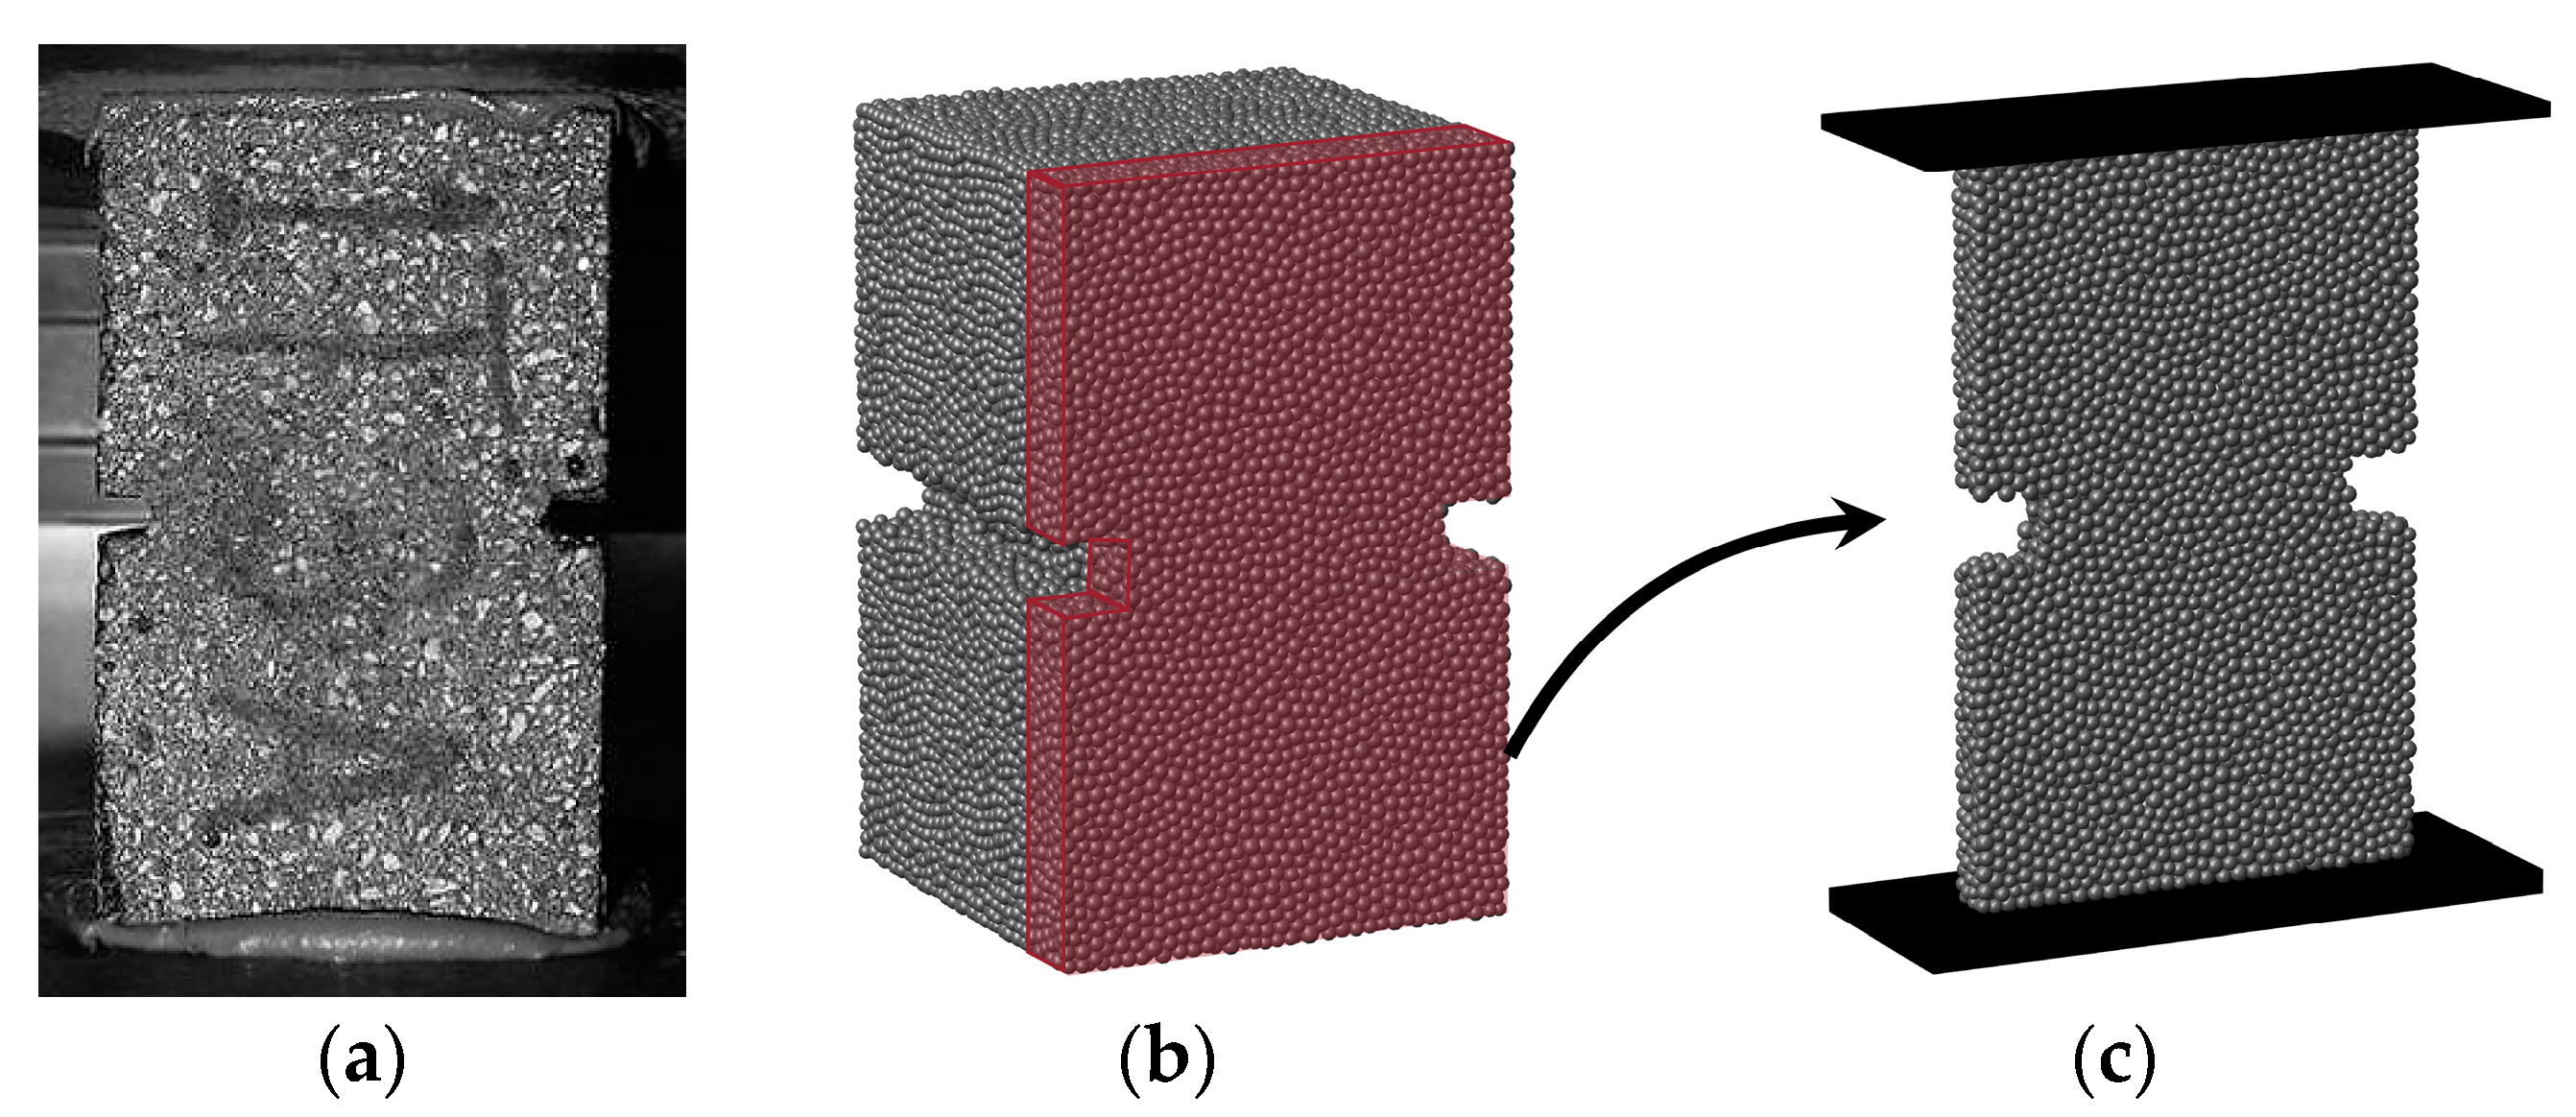
5.1. Experimental and Numerical Tests

In order to assess the possibility of predicting the behaviour of asphalt mastics and asphalt mixtures under tensile loading with the proposed GK-Damage models, the numerical studies presented take into consideration the experimental tests reported by Silva [42]. These experiments investigated the mechanical behaviour of mastics and asphalt mixtures through uniaxial tensile tests at a testing temperature of 15.0 °C. These asphalt material samples, each measuring 8.0 × 5.0 × 5.0 cm3, featured notch tips at mid-height (0.80 cm in length and height on both sides) to ease the fracture location and damage distribution. A loading velocity of 8.0 × 10 4 m/s was used in these experimental analyses.
The asphalt mixture is a dense-graded (0/14 mm) mixture produced with granite aggregates, limestone filler, and bitumen grade 35/50. The mastic specimens were prepared with a specific bitumen and fine aggregate grading (0/2 mm) composition to represent the bituminous mastic found in the asphalt mixture.
The selected experimental setups provide significant advantages due to identical test configurations and specimen geometries for both asphalt materials. The same methodology was adopted in the work by Câmara et al. [26] for calibrating the viscoelastic properties. The contact strength properties of the mastic-to-mastic contacts are calibrated following a trial-and-error procedure adopting the available experimental tests. Then, the potential to predict the asphalt mixture response given this previous calibration is assessed, which considerably eases the calibration procedure.
During the experimental tests, the prismatic samples (either mastic or asphalt mixture) were positioned upright on their smaller sides, with the bottom and top surfaces attached to the testing machine plates to allow the development of tensile stresses. Detailed information on sample preparation and experimental procedures can be found in [42].
In the numerical study, simulations are carried out for both asphalt materials subjected to uniaxial tensile tests at a loading velocity consistent with the experimental investigation. These simulations aim to characterise the materials’ fracture behaviour and validate the VirtualPM3DLab DEM model for simulations incorporating damage considerations. In the presented numerical simulations, a vertical velocity is applied to the upper wall while the bottom wall remains fixed in all directions.

5.2. Numerical Specimen Calibration

5.2.1. Asphalt Mastic Model

The present study adopts the particle generation technique previously described in [26]. In this method, spherical particles are randomly distributed within a specified domain, and the Laguerre–Voronoi method is employed to determine their contact points and respective contact areas within the three-dimensional assembly. The particle model reaches stability once the domain is filled with mastic particles, ensuring that overlaps are minimal and uniformly distributed.
Two particle assemblies are created for numerical simulations representing the asphalt mastic. These assemblies are based on the material composition of the asphalt mastic as experimentally investigated in [42], which includes detailed information on the filler, fine aggregates, and bitumen characteristics that compose the samples. Figure 13a illustrates the experimental asphalt mastic sample.
In the initial step, an asphalt mastic with dimensions equivalent to the experimental sample ( 8.0 × 5.0 × 5.0 cm3) is generated. This assembly comprises 70,596 randomly distributed particles with diameters ranging from 1.5 mm to 2.0 mm and an average diameter of 1.8 mm; they are interconnected through 447,670 interactions. These particles represent the combination of filler, aggregates (diameter size below 2.0 mm), and bitumen. Figure 13b shows this numerical assembly.
Notably, representing all fine particles in DEM simulations is challenging due to its significant impact on computational runtimes during the initial trial-and-error calibration process. Therefore, a second particle assembly approach evaluates the effectiveness of using a reduced-size structure to calibrate the GK-Damage contact model parameters. This method aims to reduce computational efforts and speed up the calibration process, considering a smaller portion to represent the whole.
The reduced-size asphalt mastic specimen, generated at one-eighth of the laboratory specimen’s dimensions, maintains the same height as the laboratory sample, resulting in a final size of 8.0 × 5.0 × 0.625 cm3. Ensuring similar heights minimises discrepancies when comparing results with the full mastic representation and applying the calibrated parameters to the asphalt mixture numerical model.
This reduced virtual specimen (Figure 13c) contains 8189 particles with diameter sizes similar to those in the full mastic version and 48,081 contacts. Both virtual specimens feature a mid-height notch of 0.80 cm in length and height along the sides, replicating the experimental conditions applied to the mastic samples.
The asphalt mastic model includes two types of interactions: mastic-to-mastic and mastic-to-wall contacts. The DEM model employs a linear elastic model for interactions between any particle element and the wall to represent these interactions. Contacts within the asphalt mastic phase are modelled using the viscoelastic GK contact model combined with a damage model. The damage models are the brittle model (GK-Brittle) and the bilinear softening model (GK-Bilinear) previously discussed.

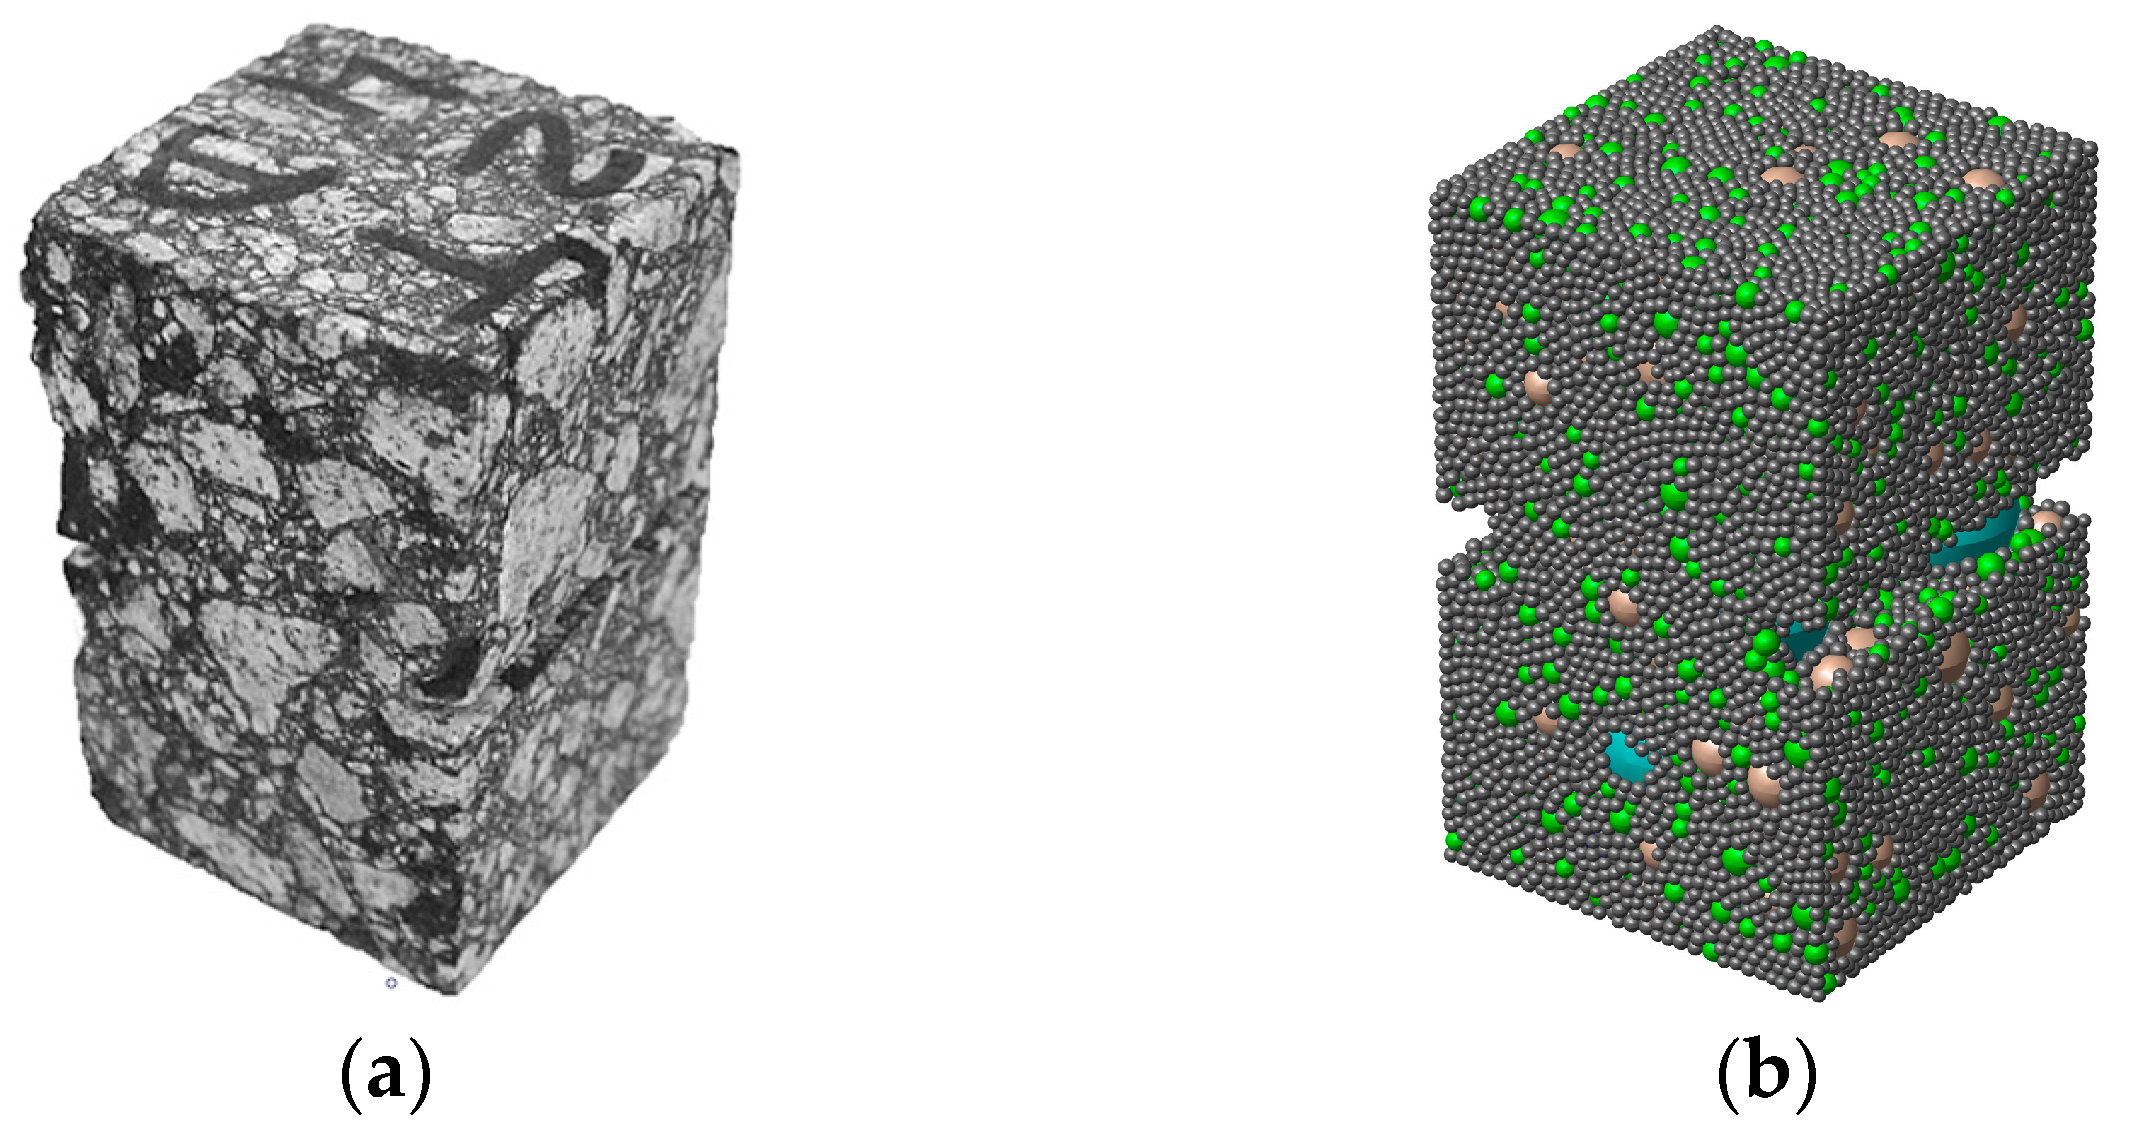
5.2.2. Asphalt Mixture Model

Similar to the methodology applied for the mastic particle generation, a virtual asphalt mixture with dimensions of 8.0 × 5.0 × 5.0 cm3 is created. This virtual specimen follows the specifications, dimensions, aggregate gradation, and mastic characteristics detailed in [42]. The particle generation method follows the same procedure described for asphalt mixtures in the authors’ previous studies [26,43], where coarse aggregates are initially introduced from the largest to the smallest particles within the domain, followed by the addition of mastic elements. In the adopted particle model, the aggregate and mastic particles have, in fact, an approximate polyhedral shape given by the associated Laguerre Cell [33]. The adopted generation approach reduces the computational costs when compared with approaches where the actual aggregate shape is adopted [44,45,46,47]. Note that the adopted GK damage models can be readily incorporated if real aggregate shapes are considered. This particle model comprises 26,203 particles, including coarse aggregates and mastic, interconnected through 149,950 interactions. The experimental and numerical asphalt mixtures incorporate notch tips that follow the specifications of the full-size mastic model. Table 5 shows the number and corresponding volume of aggregate particles at each sieve size and the mastic elements represented in the numerical model.
In the asphalt mixture model, mastic particles have diameters ranging from 1.5 mm to 2.0 mm, with an average value of 1.7 mm. Figure 14 shows both the laboratory and numerical asphalt mixture specimens.
Five distinct contact types exist within the asphalt mixture model: aggregate-to-aggregate, aggregate-to-wall, aggregate-to-mastic, mastic-to-mastic, and mastic-to-wall. Table 6 specifies the corresponding number of contacts for each type of interaction. In the particle assembly, interactions between any particle and the loading wall are described by an elastic model. A GK-Damage contact model is adopted to represent the interactions involving mastic elements—either aggregate-to-mastic or mastic-to-mastic—in which damage can exhibit either a brittle behaviour, GK-Brittle, or a bilinear softening curve, GK-Bilinear.
The aggregate-to-aggregate contacts follow a linear elastic model with a normal contact stiffness determined by
κ a n = 2 E a A c L
where L is the sum of the radii of the two adjacent aggregate particles, A c is the cross-sectional area of the spheres, and E a is the aggregate Young’s modulus, taken as 61 GPa. While some studies have assumed that the aggregate-to-aggregate contacts work only under compression in DEM simulations with asphalt mixtures [17,48], others have indicated the possibility of fracture occurring between adjacent aggregates under tensile forces. To account for this, researchers have applied contact models that define normal and shear contact strength parameters [49,50]. The present study considers three possible contact behaviours for the aggregate-to-aggregate contacts: (1) an elastic model with brittle failure (BRM), (2) an elastic model without cohesion that only works under pure friction (BRM-NT), and (3) an elastic model with a bilinear contact softening damage model (BSM) as proposed by Azevedo et al. [39]. The BRM contact model is adopted in simulations that adopt the GK-Brittle model, whereas the BSM contact model is adopted in simulations that adopt the GK-Bilinear model.
Table 7 details the different analyses evaluated in the asphalt mixture model. In Cases 1 and 2, the asphalt mixture model follows an overall brittle behaviour, with interactions involving mastic particles adopting the proposed GK-Brittle model. In Case 1, the contacts between adjacent aggregates follow the BRM contact model, while in Case 2, these contacts follow the BRM-NT contact model. For Cases 3 and 4, the asphalt mixture model adopts an overall bilinear softening behaviour, with interactions including mastic particles governed by the proposed GK-Bilinear contact model. In Case 3, the contacts between adjacent aggregates follow the BRM-NT contact model, while in Case 4, these contacts follow the BSM contact model. In all cases, a linear elastic contact model with zero shear stiffness represents the aggregate-to-wall and mastic-to-wall contacts.

5.3. GK Viscoelastic Contact Parameters for DEM Numerical Simulations

The macroscopic parameters for the generalised Kelvin model are calibrated considering the values specified for the asphalt mastic at 20.0 °C [26]. However, due to the influence of temperature on the material behaviour, especially the viscoelastic properties characteristic of asphalt materials, adjustments are necessary to ensure consistency with the current assessment temperature of 15.0 °C. To address this condition, the macroscopic properties are fine-tuned according to the impact of the contact parameters identified in the parametric study. Given the shared constituents in the mastic specimens at different temperatures, the number of Kelvin elements for the GK contact model remains constant (three units). Table 8 specifies the macro-scale parameters for the GK model.
The normal GK contact properties (aggregate-to-mastic and mastic-to-mastic) are defined based on the macroscopic parameters presented in Table 8 and on the following relationships that are commonly adopted in DEM simulations [26,34]:
κ ξ n = E ξ A c L δ η ξ n = C ξ A c L δ
where L is the sum of the radii of the two adjacent particles, A c is the cross-sectional area of the spheres, ξ assumes i for the i-th viscoelastic element in the Kelvin chain and m for the Maxwell elastic and dashpot elements, and δ is a coefficient of adjustment between the macroscopic and the DEM parameters related to the particle assembly and contact properties. Simulations adopt 1.88 and 3.15 as the coefficients of adjustment for mastic-to-mastic and aggregate-to-mastic interactions, respectively [26]. The shear GK contact parameters are determined by multiplying the contact stiffness ratio α by the normal GK contact properties. The contact stiffness ratio was set to 0.10 to approximate the macroscopic Poisson coefficient of 0.40 for the mastic and asphalt mixture samples.

5.4. Brittle and Bilinear Strength Parameters

After calibrating the GK viscoelastic contact model parameters, the parameters of the GK-Damage models are determined through a trial-and-error procedure to match the numerical predictions with the known experimental load–deformation response of the asphalt material. The single contact assessment previously carried out greatly simplified the calibration.
Table 9 presents the best-fit contact properties for the GK-Brittle and the GK-Bilinear contact models. As shown, the tensile strength is chosen to be similar in both models. In the GK-Bilinear model, the adopted contact energy in mode I allows the numerical predictions to exhibit a more ductile post-peak response, which agrees with the experimental response. The strength properties associated with the shear direction are also presented. Note that the shear contact strength properties for the range of values chosen do not have a significant influence on the predicted macroscopic response under tensile loading.
This study considers that interactions between adjacent aggregates in the asphalt mixture model adopt the tensile contact strength (BRM and BSM) as described for the viscoelastic contacts in Table 9.

6. Results

6.1. Asphalt Mastic Numerical Modelling—Reduced-Size Specimen

The initial phase of this numerical study focuses on assessing the damage performance of asphalt mastic under a tensile test, reflecting the previously described experimental conditions with a considered loading velocity of 8.0 × 10 4 m/s. Initially, the reduced-size asphalt mastic structure is adopted to validate the input parameters and verify the 3D DEM model response through a faster calibration process. This calibrated model will then be integrated into the asphalt mixture model.
The DEM simulations, adopting input parameters from Table 8 and Table 9, are conducted considering both GK-Damage contact models, using a time step of 3.77 × 10 7 s/step. Figure 15 presents the predicted stress–strain curves when assuming a GK-Brittle model and a GK-Bilinear model. These predictions are then compared with the laboratory data. Figure 15 also includes the evolution of contact damage during DEM simulations. In the GK-Brittle model, this parameter represents the ratio of the total number of cracked contacts to the total number of contacts considering damage. For the GK-Bilinear model, this factor is given by the sum of the contacts’ damage divided by the total number of contacts.
The results indicate that the proposed GK-Damage models can predict a good agreement in the pre-peak zone, effectively capturing the viscoelastic damage behaviour of the asphalt material. Both the proposed GK-Damage models predict peak stress in good agreement with the experimental values. However, when employing the GK-Brittle model, the particle model response in the post-peak behaviour is significantly brittle, contrary to what was experimentally observed.
In contrast, the proposed GK-Bilinear softening model provides a better representation of the gradual damage evolution after the peak stress is reached, in close agreement with the laboratory response. Contact damage occurs before the peak stress, with nearly 6.0% of contacts being severely cracked (considering contact damage greater than 75.0%) or completely fractured.
Figure 16 shows the damage distributions for the GK-Damage models. The failure mode observed in the experimental tests is also presented. Figure 16 highlights the evolution of the damage distributions during simulations for the specific points (1, 2, and 3) represented in Figure 15. For the GK-Bilinear model, Figure 16 represents the contacts exceeding a damage of 75.0%. The proposed GK-Brittle and the GK-Bilinear models predict a main crack/severely cracked surface located within the notch tip influential zone, which is in good agreement with the main crack observed experimentally. In Figure 16c, as expected, the damage pattern predicted with the GK-Brittle model is more localised. In contrast, a more slightly random damage pattern is predicted with the GK-Bilinear model, as shown in Figure 16f.
Compared to the GK-Brittle model, the GK-Bilinear contact predicts a much higher number of damaged contacts. Specifically, the GK-Brittle model predicts 704 completely damaged contacts, while the GK-Bilinear model predicts 2655 contacts with a damage factor greater than 75.0% (Figure 16f). The GK-Bilinear approach response results in an increase in the number of damaged contacts observed outside the notch tip zone of influence.
The GK-Damage contact deformation predictions, magnified by a factor of 30, are presented in Figure 17. The results confirm that specimen separations are located in the vicinity of the notch tips for the GK-Damage models. While the GK-Brittle model predicts a very abrupt localised failure, the GK-Bilinear model indicates that damage also occurs outside the failure localisation.
Three-dimensional particle models are typically time-consuming and computationally demanding, with the total number of particles and interactions significantly impacting the computational runtimes. The contact model also contributes to the duration of simulations [26]. In this study, simulations were carried out on an Intel [email protected] GHz multi-core processor. As expected, the computational runtimes associated with both the GK-Brittle and GK-Bilinear models were relatively similar for the same level of deformation, with the GK-Bilinear approach requiring slightly more time (difference less than 8.6%) due to the additional number of verification steps needed. By the end of their respective simulations, as presented in Figure 15, computational runtimes were approximately 2 days and 8 days.

6.2. Asphalt Mastic Numerical Modelling—Full-Size Specimen

The results presented in the previous section show that the numerical response of the reduced specimen closely aligns with the observed experimentally for a full sample, both in terms of the stress–strain curves and the predicted damage distributions. As shown, a good agreement is reached with both GK-Damage models, particularly when a GK-Bilinear model approach is adopted, which predicts a much better agreement with the post-peak behaviour verified in the experimental test.
However, to validate the effectiveness of the adopted trial-and-error procedure, which used the reduced specimen, it is necessary to validate the obtained best-fit parameters with a particle assembly that follows the dimensions of the experimental sample. Therefore, simulations incorporating the calibrated contact parameters from Table 8 and Table 9 are carried out with the particle assembly depicted in Figure 13b. A similar time step of 3.77 × 10 7 s/step is applied for simulations with both GK-Damage models. The predicted results are then compared with those obtained with the reduced-size numerical specimen and those obtained experimentally (see Figure 18).
The numerical results for both GK-Damage models obtained with the full-size specimen show a good agreement with the stress–strain response and the contact damage evolution observed in the reduced-size asphalt mastic model. A slight reduction in the peak stress is observed with the full model, with a decrease of less than 2.0% in both GK-Damage models. A slightly higher cumulative deformation is also observed in the GK-Brittle model response for the full-specimen scenario.
Figure 19 presents the damaged contacts within the central portion of the full-size virtual mastic—dimensions are the same as the reduced-size mastic model—for both the GK-Brittle and GK-Bilinear models. For the GK-Bilinear model, Figure 19b represents the contacts exceeding a damage of 75.0%. From Figure 19, it is shown that the damage propagation in the two numerical specimens follows a similar trend to that verified in the reduced-size model, as well as the main crack observed experimentally.
The simulations of the full-size mastic model, as expected, resulted in significantly higher computational runtimes than those of the reduced-size model. A factor of around eight times was obtained, meaning that the GK-Brittle and the GK-Bilinear models had computational costs of 16 days and 64 days, respectively. Note that the full-size model contains a number of particles eight times higher than the reduced-size model and a number of contacts around nine times higher than the reduced-size model.
This significant increase in the computational cost highlights the advantage of devising strategies like the one adopted that used a reduced-size numerical model for the trial-and-error procedure, especially for three-dimensional models that require a significant number of particles and contacts.

6.3. Asphalt Mixture Numerical Modelling

6.3.1. Stress–Strain Response

This study adopts a similar methodology as the one described by Câmara et al. [26] for the numerical calibration of the asphalt mixture, who showed that the calibration of asphalt mixtures can derive from the prior calibration of their constituent asphalt mastic. In addition, it was seen that incorporating time-dependent contact models to describe the aggregate-to-mastic interactions improves numerical predictions. From previous calibrations [26], the aggregate modulus ( E a ) is set at 61.0 GPa.
As previously mentioned, three possible contact behaviours are adopted for the aggregate-to-aggregate contacts, including an elastic model with brittle failure (BRM) when using the GK-Brittle model for the contacts involving mastic particles and an elastic model with a bilinear contact softening model (BSM) when the GK-Bilinear model is adopted for the contacts involving mastic particles. The strength properties of these contacts are similar to the ones considered for the viscoelastic contacts (GK-Damage models). This approach assumes that coarse aggregates in typical asphalt mixtures are usually coated with a thin asphalt binder layer. For both GK-Damage models, an additional elastic model without cohesion that only works under pure friction (BRM-NT) is tested to assess the relevance of this interaction in the predicted macroscopic response. A time step of 1.98 × 10 7 s/step is used in the simulations.
Figure 20 presents the predictions of the asphalt mixture behaviour compared with the experimental results [42]. Figure 20a shows that when a GK-Brittle model is adopted for contacts involving mastic particles (Cases 1 and 2), there are no significant differences in the predicted responses with the BRM and the BRM-NT models for the aggregate-to-aggregate contact. Numerical simulations considering the BRM and the BRM-NT models result in peak stresses of 2.41 MPa and 2.30 MPa, respectively. As expected, the model that adopts aggregate-to-aggregate without cohesion (BRM-NT) predicts a lower tensile strength. When adopting the contact properties of mastic contacts previously calibrated using a mastic experimental test, the predicted tensile strength values are 70.0% to 85.1% lower than the known asphalt mixture experimental values that vary from 5.01 MPa to 5.71 MPa.
The results with the GK-Brittle model indicate that an additional calibration of the contact properties obtained with mastic specimens is required to predict peak tensile stress values closer to the observed in the asphalt mixture. As expected, given the results presented for the mastic specimens, the behaviour predicted with a GK-Brittle model is too brittle compared to the behaviour observed experimentally in asphalt mixtures.
As shown in Figure 20b, when considering a GK-Bilinear model for the contacts involving mastic particles (Cases 3 and 4), the predicted peak macroscopic tensile strength, contrary to the response obtained with the GK-Brittle model, is closer to the experimental response. Regarding the stress–strain predicted result, as expected, a more ductile response than that observed experimentally is verified with the GK-Bilinear model. Similar to the approach considered with the GK-Brittle model, it would be possible to fine-tune the contact properties obtained with the mastic test in order to achieve a better agreement with the post-peak response. Note that the main objective of this analysis is to assess the effectiveness of the adopted two-step contact property calibration procedure. Further simulations are carried out to analyse the predictions of both the GK-Brittle and GK-Bilinear models when a fine-tuning calibration is adopted.

6.3.2. Contact Damage Evolution Assessment

Figure 21 and Figure 22 present the evolution of contact damage for the GK-Brittle and the GK-Bilinear simulations, respectively. The contact damage evolution is presented separately for three different contact types, i.e., aggregate-to-aggregate, aggregate-to-mastic, and mastic-to-mastic contacts, and all the contacts (overall sum). The contact damage evolution for the contacts located between the notch tips (notch influential volume) for a total height of 0.80 cm is also presented.
As shown in Figure 21, for Case 1, which adopts a BRM in the aggregate-to-aggregate contacts, damage starts to occur at a low strain value and increases to nearly 33.0% by the end of the simulation. With the cases that adopt a GK-Bilinear model, Figure 22, the aggregate-to-aggregate contact damage evolution in the BSM is within the predicted range of contact damage evolution for other contact types. Adopting a bilinear contact model significantly reduces the damage evolution compared to the brittle model.
In both GK-Damage models, the contact damage evolution can be divided into three different stages. Initially, in Stage I, no damage is observed in contacts involving mastic elements for all case scenarios. This stage primarily involves damage evolution localised between adjacent aggregates (when allowed) because of the rearrangement of aggregates in the virtual specimen.
In Stage II, there is an increase in the percentage of damaged contacts, especially in the aggregate-to-mastic and mastic-to-mastic contacts in the volume of influence of the notch tips of the specimen. This increase is reflected in a rise of the notch tip damage curve, surpassing the overall specimen damage, indicating a focused zone of damage within the virtual assembly and a predisposition towards fracture.
Stage III marks a rapid increase in the contact damage evolution, particularly in aggregate-to-mastic contacts, for Cases 1 and 2 (see Figure 21). For Cases 3 and 4, Figure 22 shows a damage stabilisation tendency. In both GK-Damage models (Figure 22), at this final stage, a higher percentage of damaged aggregate-to-mastic contacts is observed compared to those within the asphalt mastic phase, implying that while contact damage occurs in both aggregate-to-mastic and mastic-to-mastic contacts, the former significantly influences the numerical model final failure. These results highlight the higher susceptibility of aggregate-to-mastic contacts to failure and their role in facilitating crack propagation through the particle model. This observation suggests the importance of focusing on the aggregate-to-mastic contacts and understanding their influence on the failure mechanisms of asphalt mixtures, underscoring the importance of the adhesiveness between the aggregate and mastic for the fracture resistance of asphalt mixtures. This finding aligns with other numerical studies reporting similar findings [51], even when assigning similar contact properties to both types of interactions [12]. Sun et al. [28] also showed that the number of damaged aggregate-to-mastic contacts was more pronounced than that of mastic-to-mastic contacts in asphalt mixtures, especially when increasing temperature.
Additionally, Stage III indicates that damage is notably concentrated in the zone of influence of the notch tips, reaching levels between 20.2% and 38.4% for both GK-Damage models. When aggregates assume a BRM-NT (Case 3) and BSM (Case 4) approach, damage in this particular zone reaches nearly 27.6% and 38.4%, respectively, highlighting a difference primarily due to the additional damage in the aggregate portion. For the GK-Brittle model, at the end of simulations, the damaged contacts in the notch tip zone show similar proportions—22.5% and 20.2%—between the BRM (Case 1) and BRM-NT (Case 2) approaches, respectively, suggesting that damage among aggregates predominantly occurs outside this specific region.
Table 10 presents the number of contacts that are completely cracked (D = 100%), Cases 1 and 2, or exhibit contact damage greater than 75.0%, Cases 3 and 4, for each contact type, in the vicinity of the notch tips or in the particle assembly. In all cases, as expected, the majority of the damaged aggregate-to-mastic and mastic-to-mastic contacts occur in the vicinity of the notch tips of the specimen, showing that damage localisation occurs for both GK-Damage models. For Case 4, more than 89% of aggregate-to-mastic contacts and almost all mastic-to-mastic contacts with damage exceeding 75.0% occur in the vicinity of the notch tips.
The predicted contact damage distributions under tensile loading for Cases 1 to 4 are presented in Figure 23 and Figure 24. In contrast to Figure 14b, which differentiates aggregates by colour based on sieve size, these figures employ a uniform colour scheme to simplify the visualisation and interpretation of the damage distributions in the particle model. Three cross-sectional views of the asphalt mixture reveal the distribution of contact damage among the different types of contact present in the particle model.
As expected, the main contact damage locations in these case studies are located in the vicinity of the notch tips, confirming its higher susceptibility to damage progression in the asphalt mixture model, primarily due to damage occurring along the aggregate-to-mastic and mastic-to-mastic contacts. Gao et al. [52] also suggested that macro-cracks predominantly form at aggregate-to-mastic and mastic-to-mastic contacts in the fracture analysis of asphalt mixtures subjected to three-point bending tests. Dispersed damage occurs outside the volume of influence of the notch tips and in the mid-height of the numerical specimen; however, its impact on the overall specimen damage is minimal. Despite a significant percentage of damaged contacts among adjacent aggregates in Case 1 (using the BRM approach), as indicated in Figure 21a, these damaged contacts are more likely to occur outside the zone between the notch tips of the numerical model, indicating that these damaged contacts do not significantly contribute to the macro-crack formation of the model.

6.3.3. Contact Property Fine-Tuning

As shown in Section 6.3.1, additional calibration of the contact strength properties obtained using asphalt mastic tests is necessary to be carried out, particularly for the GK-Brittle model (see Figure 20a). Therefore, simulations were carried out for Case 1 (GK-Brittle, BRM) and Case 4 (GK-Bilinear, BSM) to further adjust the aggregate-to-mastic and the mastic-to-mastic contact properties to improve the numerical representation of the asphalt mixture behaviour.
Figure 25a shows that it is possible to calibrate the aggregate–mastic and the mastic–mastic contacts in order to predict with a GK-Brittle model a numerical asphalt mixture response closer to the experimental response than the numerical response obtained with the GK-Brittle parameters calibrated in the mastic tests. An increase in the contact strength parameter of the order of 2 and an increase in the aggregate–mastic viscoelastic properties of the order of 1.4 predicts a reasonable peak strength value (Case 1a).
With the GK-Bilinear model, it is also possible to obtain a numerical asphalt mixture response closer to the experimental response than the numerical response obtained with the GK-Bilinear parameters calibrated in the mastic tests (Case 4). As highlighted in the parametric study, the contact fracture energy in mode I and the maximum contact tensile strength are key contributors to the peak stress and post-peak ductility response of the material. An increase in the aggregate–mastic viscoelastic properties of the order of 2.5 and a reduction of 25% of the contact fracture energy in mode I predict not only the peak strength but also the post-peak behaviour until failure (Case 4a). If a reduction of 25% of the fracture energy is also adopted in the mastic-to-mastic contacts, the agreement with the post-peak response is improved (Case 4b).
Figure 26 shows, for Cases 1a and 4b, the particle model deformation field at the end of the simulation and the final failure mode observed experimentally. An amplification factor ratio of 125 (Case 1a) and 45 (Case 4b) is adopted to highlight the deformation in the particle models. The failure mode appears more localised when using a GK-Brittle model. Note that in the GK-Bilinear model, there are still working contacts that interconnect the upper and lower assembly (crack bridging).
Overall, the presented numerical simulations point out that adopting a GK-Bilinear model achieves better agreement with the known behaviour of asphalt mixtures under tensile loading. This approach results in a less localised contact damage distribution, with dispersed contact damage predicted in zones beyond the crack tip zone of influence. Additionally, the results indicate that by using a BSM contact model for aggregate-to-aggregate contacts, the predictions are in better agreement with the experimental behaviour, especially when a fine tune of the contact parameters is adopted for the interactions involving mastic particles.
Simulations showed notable differences in computational runtimes due to the distinct nature of the adopted contact models. Similarly to what was verified in the computational analysis for the mastic model case, the computational runtimes associated with both the GK-Brittle and GK-Bilinear models were relatively similar for the same level of deformation. As expected, simulations using the GK-Brittle model (Cases 1 and 2) exhibited very close computational runtimes for the same level of deformation of the numerical specimen, with a difference of approximately 4.5%. Compared to simulations adopting the GK-Brittle model (Cases 1 and 2), simulations with the GK-Bilinear model (Cases 3 and 4) required more time (difference less than 16.5%) due to the additional number of verifications needed. By the end of their respective simulations, as presented in Figure 20, simulations required nearly 2 days for Cases 1 and 2, whereas computational runtimes for Cases 3 and 4 extended to approximately 11 days. Simulations carried out to fine-tune the GK-Damage contact properties required computational runtimes of the same magnitude as those of the previous simulations from Cases 1 to 4.

7. Summary and Conclusions

In this study, two damage models coupled with a generalised Kelvin contact model are proposed, enabling the DEM-based particle model to represent the viscoelastic-damage behaviour under loading. The proposed GK-Damage models have been validated for mastic and asphalt mixture specimens. The main findings are summarised as follows:
-
The impact of the GK-Damage parameters and loading velocity was evaluated for both the proposed GK-Damage models for a single contact. For the GK-Bilinear model, adjustments in the contact fracture energy in mode I and the maximum contact tensile strength can be applied to control the predicted peak stress and post-peak ductility. The viscosity element η m affects both GK-Damage contact models, while the stiffness parameters ( κ m and κ i ) have a more significant influence on the GK-Brittle model response. The effect of the viscosity of the Kelvin chain ( η i ) is negligible on both GK-Damage models. The loading velocity directly influences the response of both GK-Damage models.
-
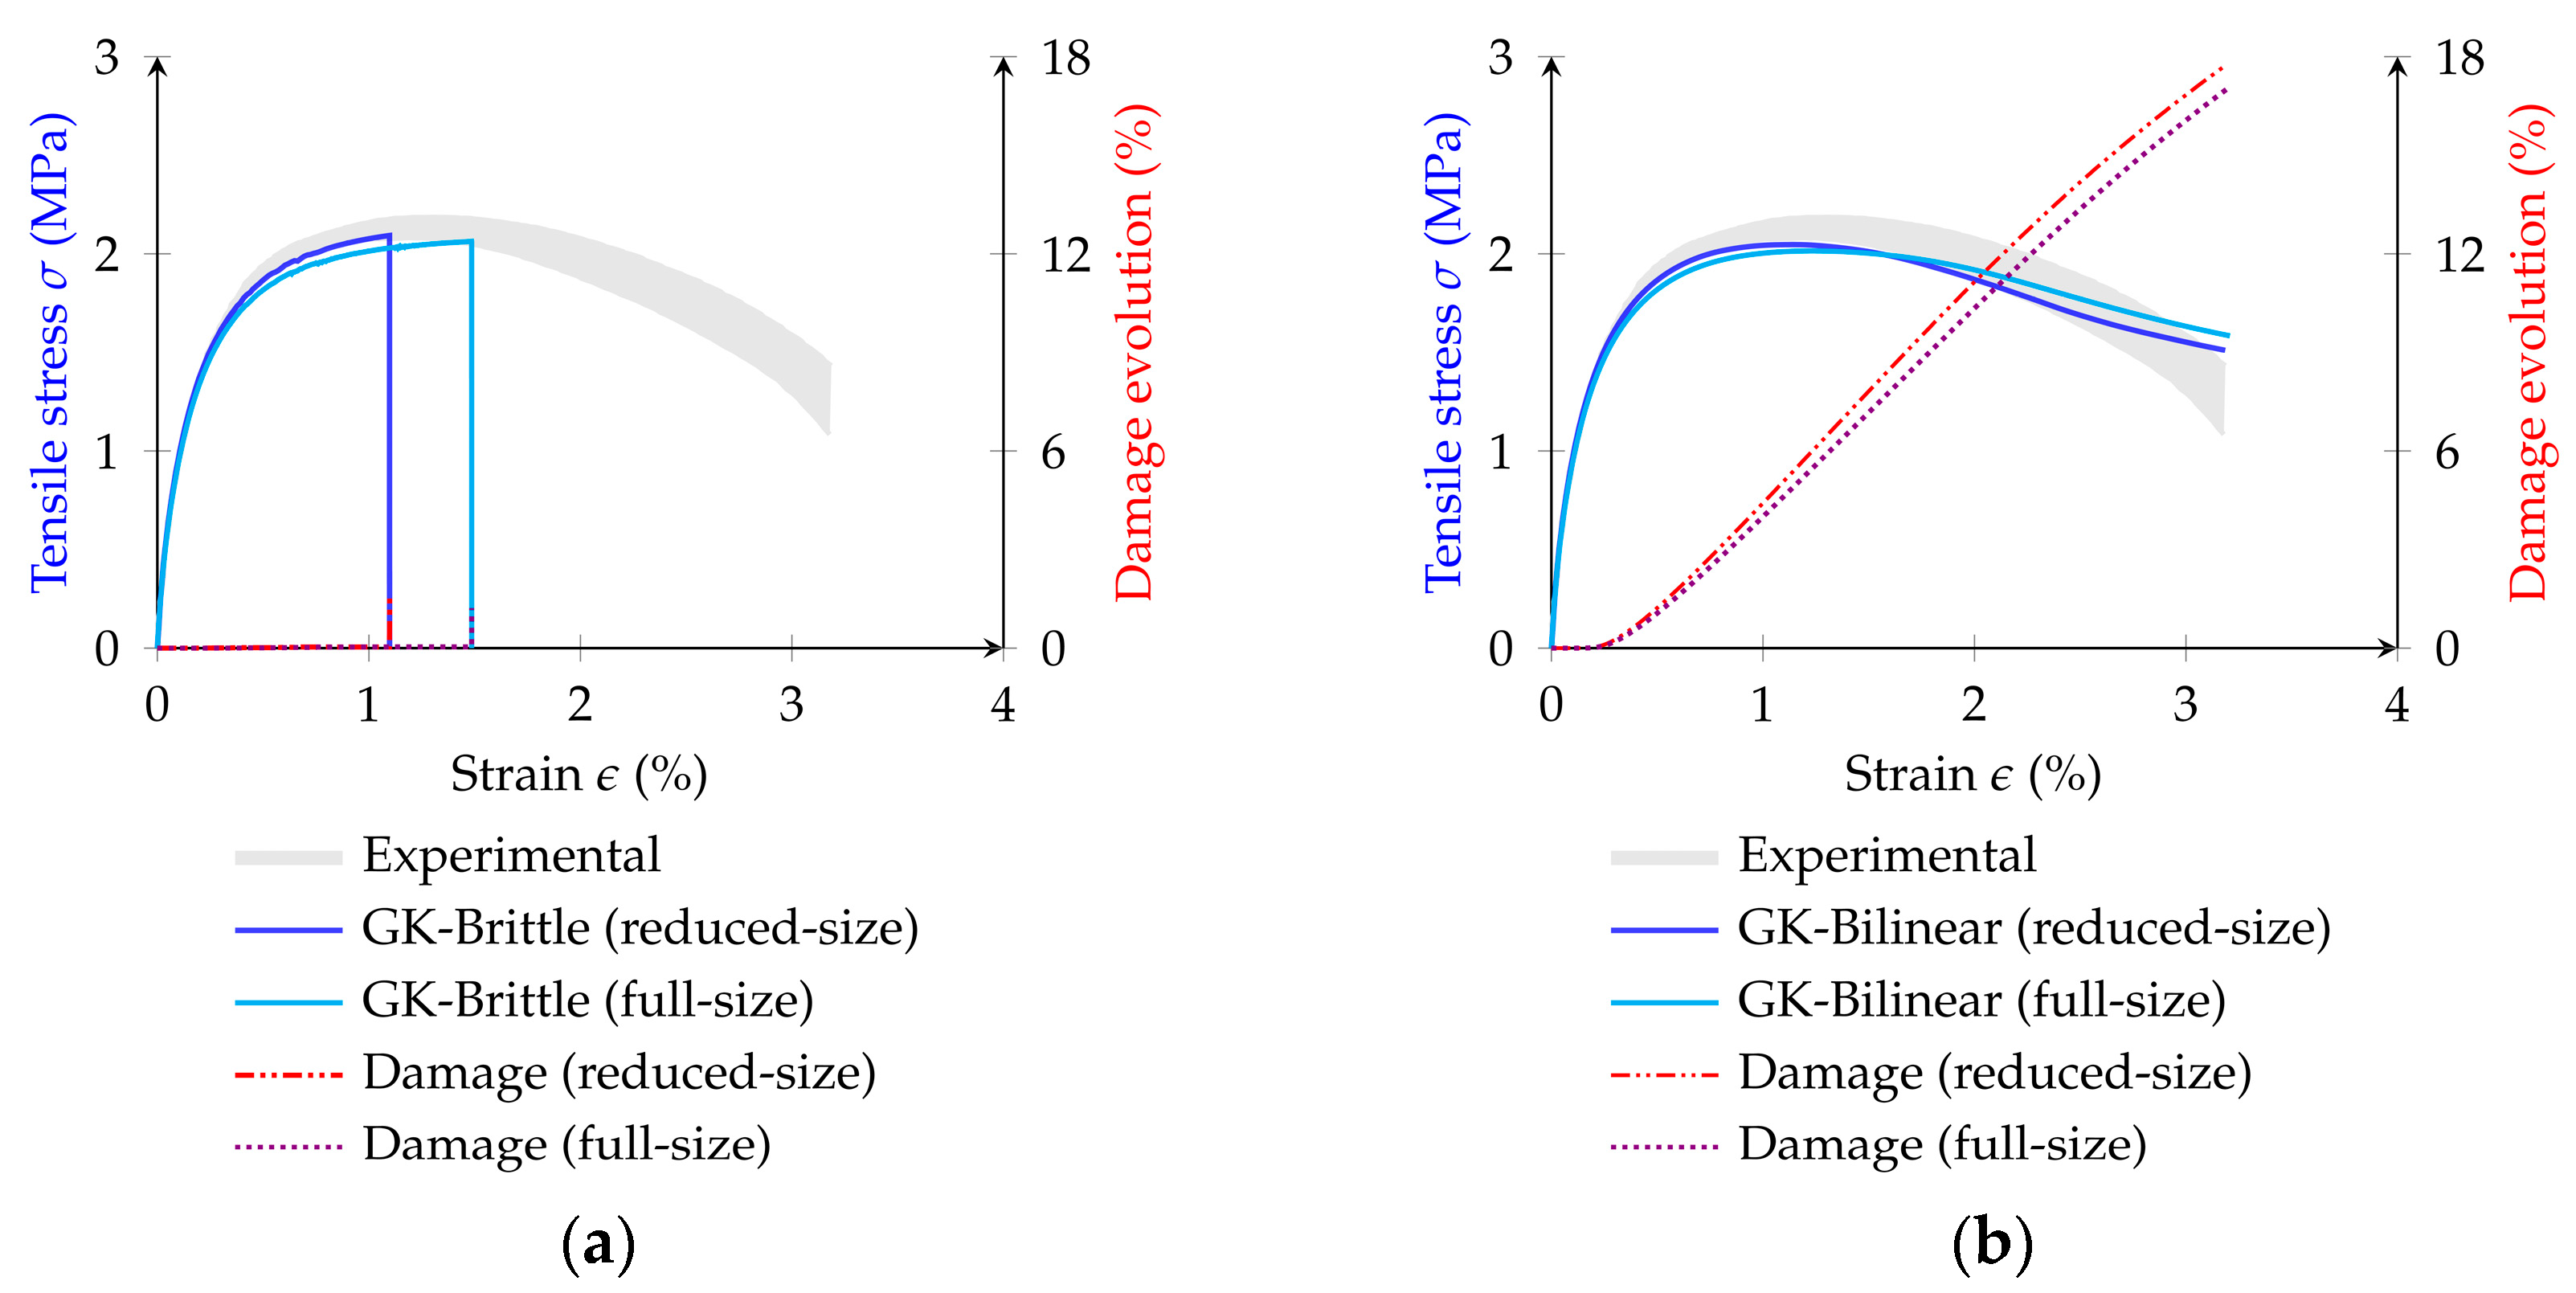
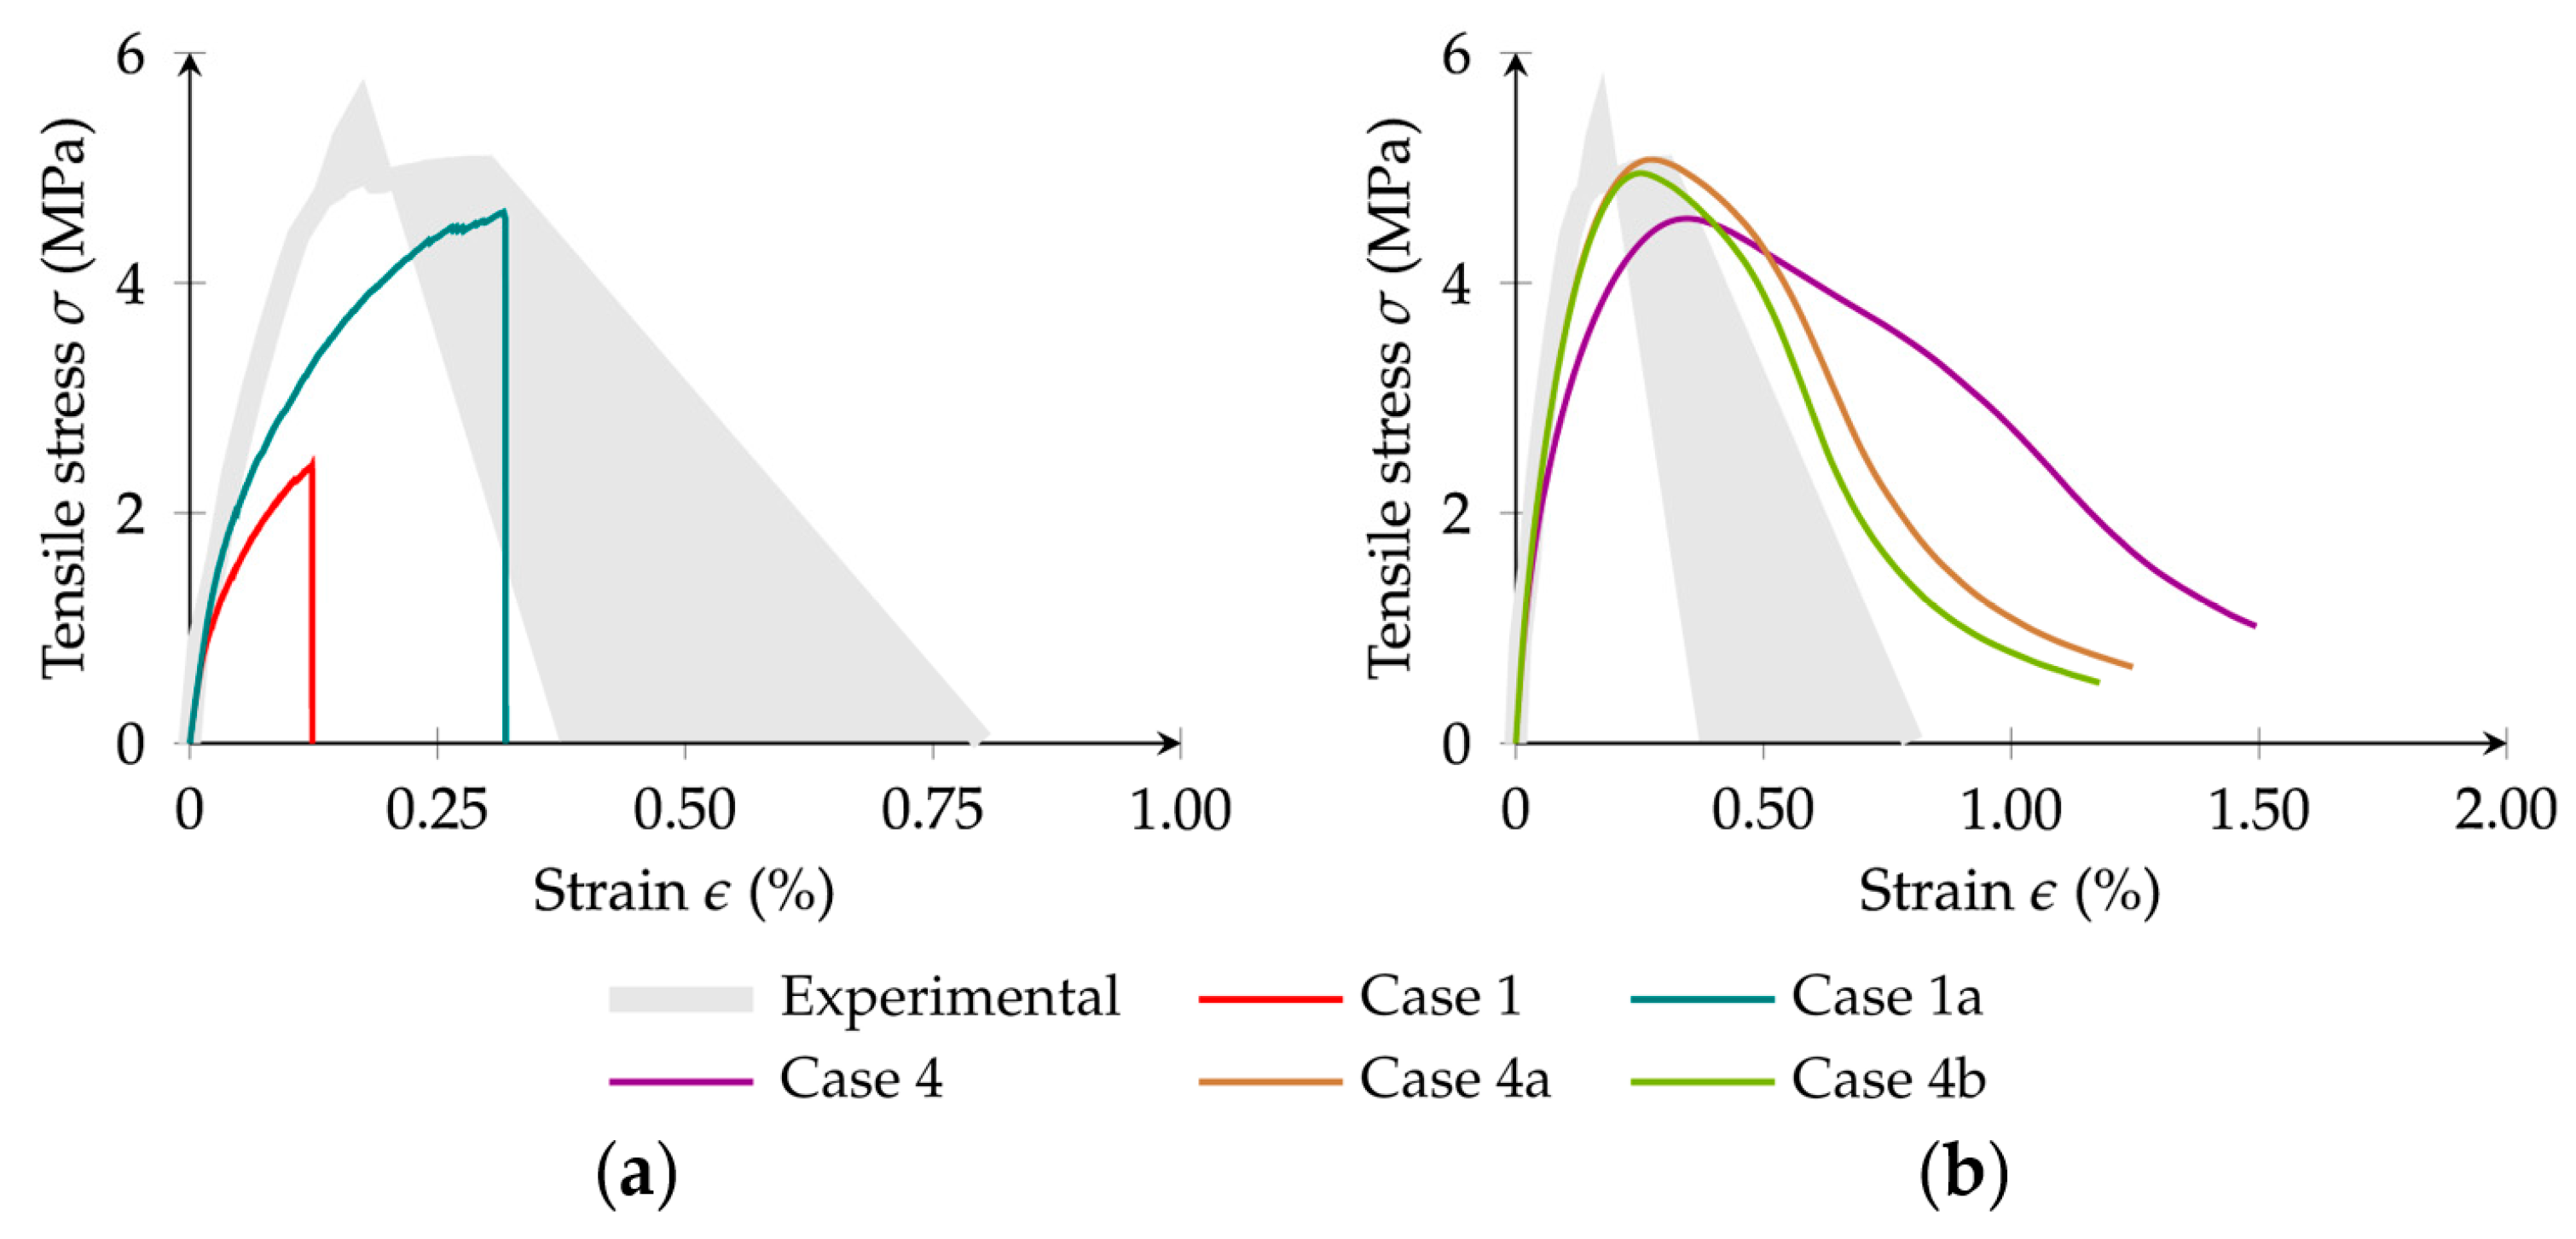
The proposed GK-Bilinear model improves the numerical representation of asphalt mixtures, especially when adopted for aggregate-to-mastic and mastic-to-mastic contacts, and aggregate-to-aggregate contacts follow a softening damage approach. A fine-tuning of the GK-Damage contact properties is shown to improve numerical predictions for both GK-Damage models.
-
Within a GK-Brittle model, the model adopted for the aggregate-to-aggregate contacts, with or without cohesion, does not significantly influence the predicted macroscopic responses. Its influence is more pronounced in particle models that adopt a GK-Bilinear model.
-
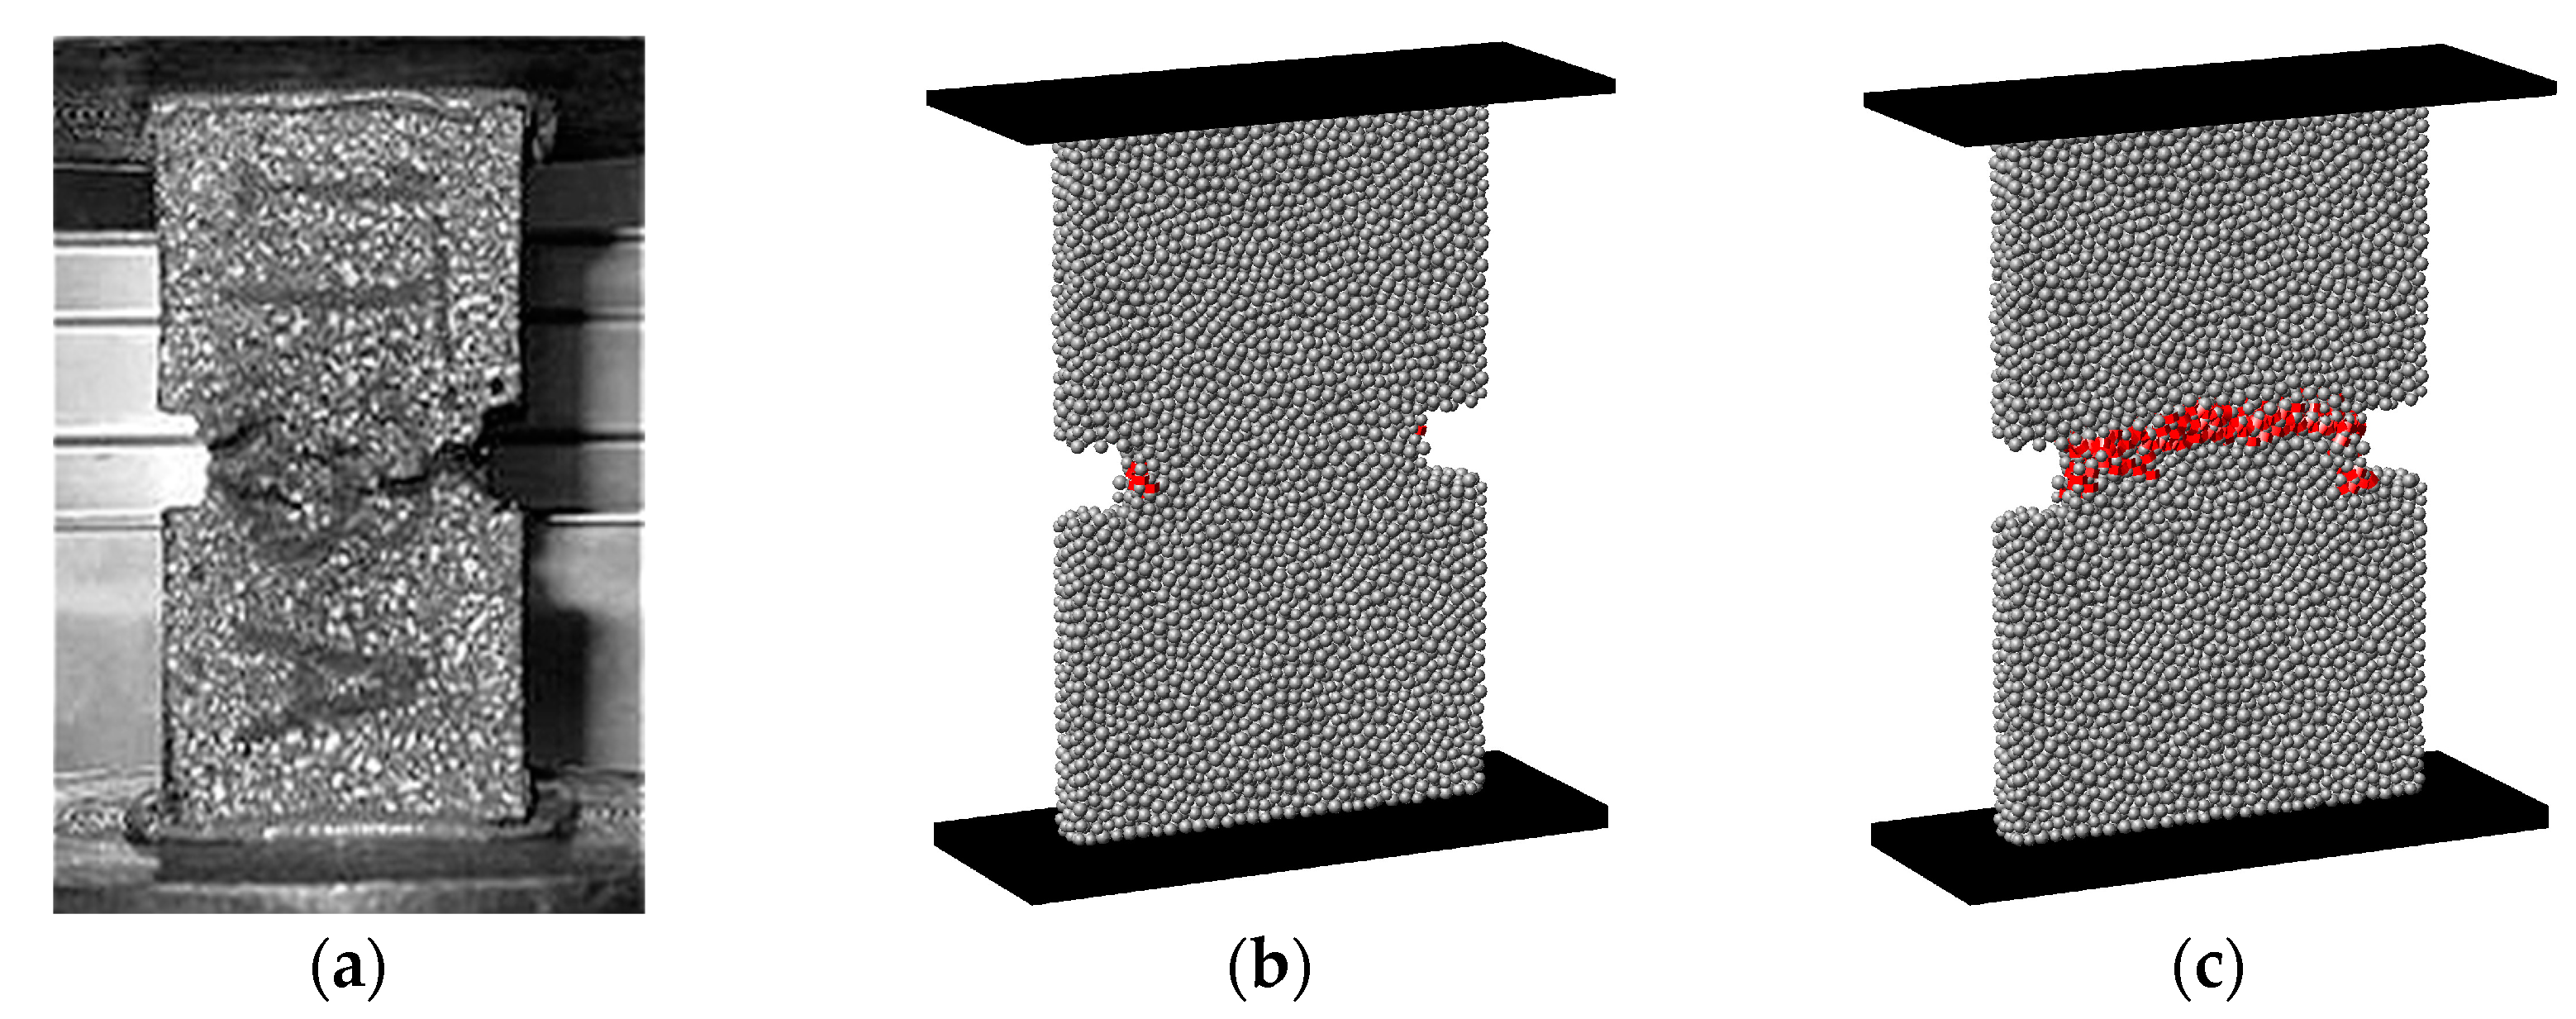
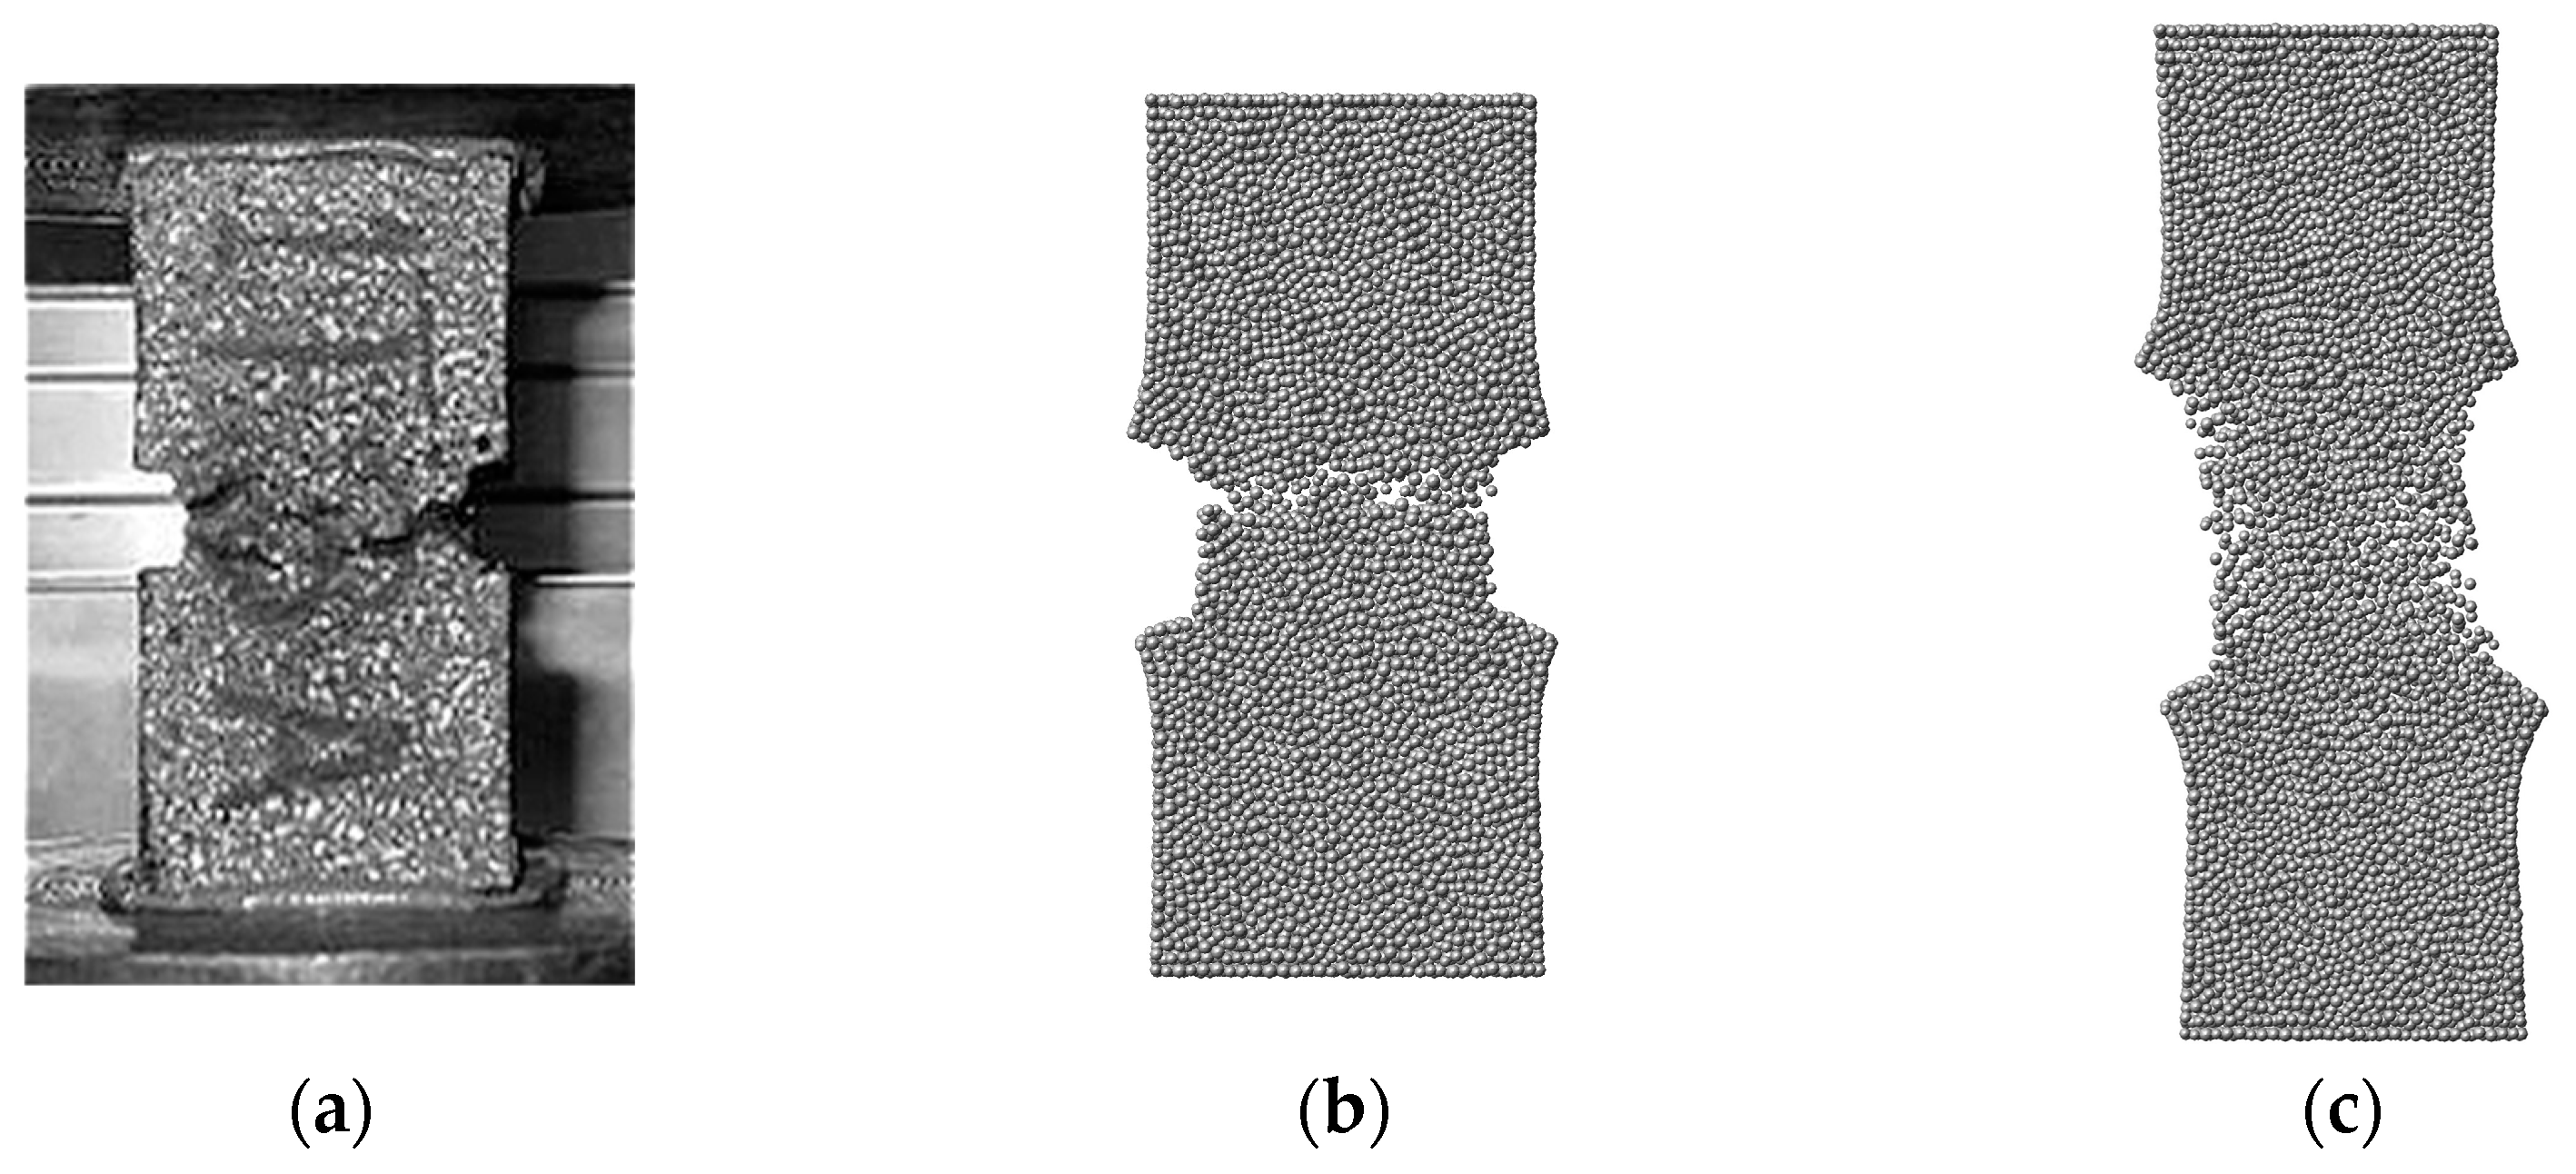
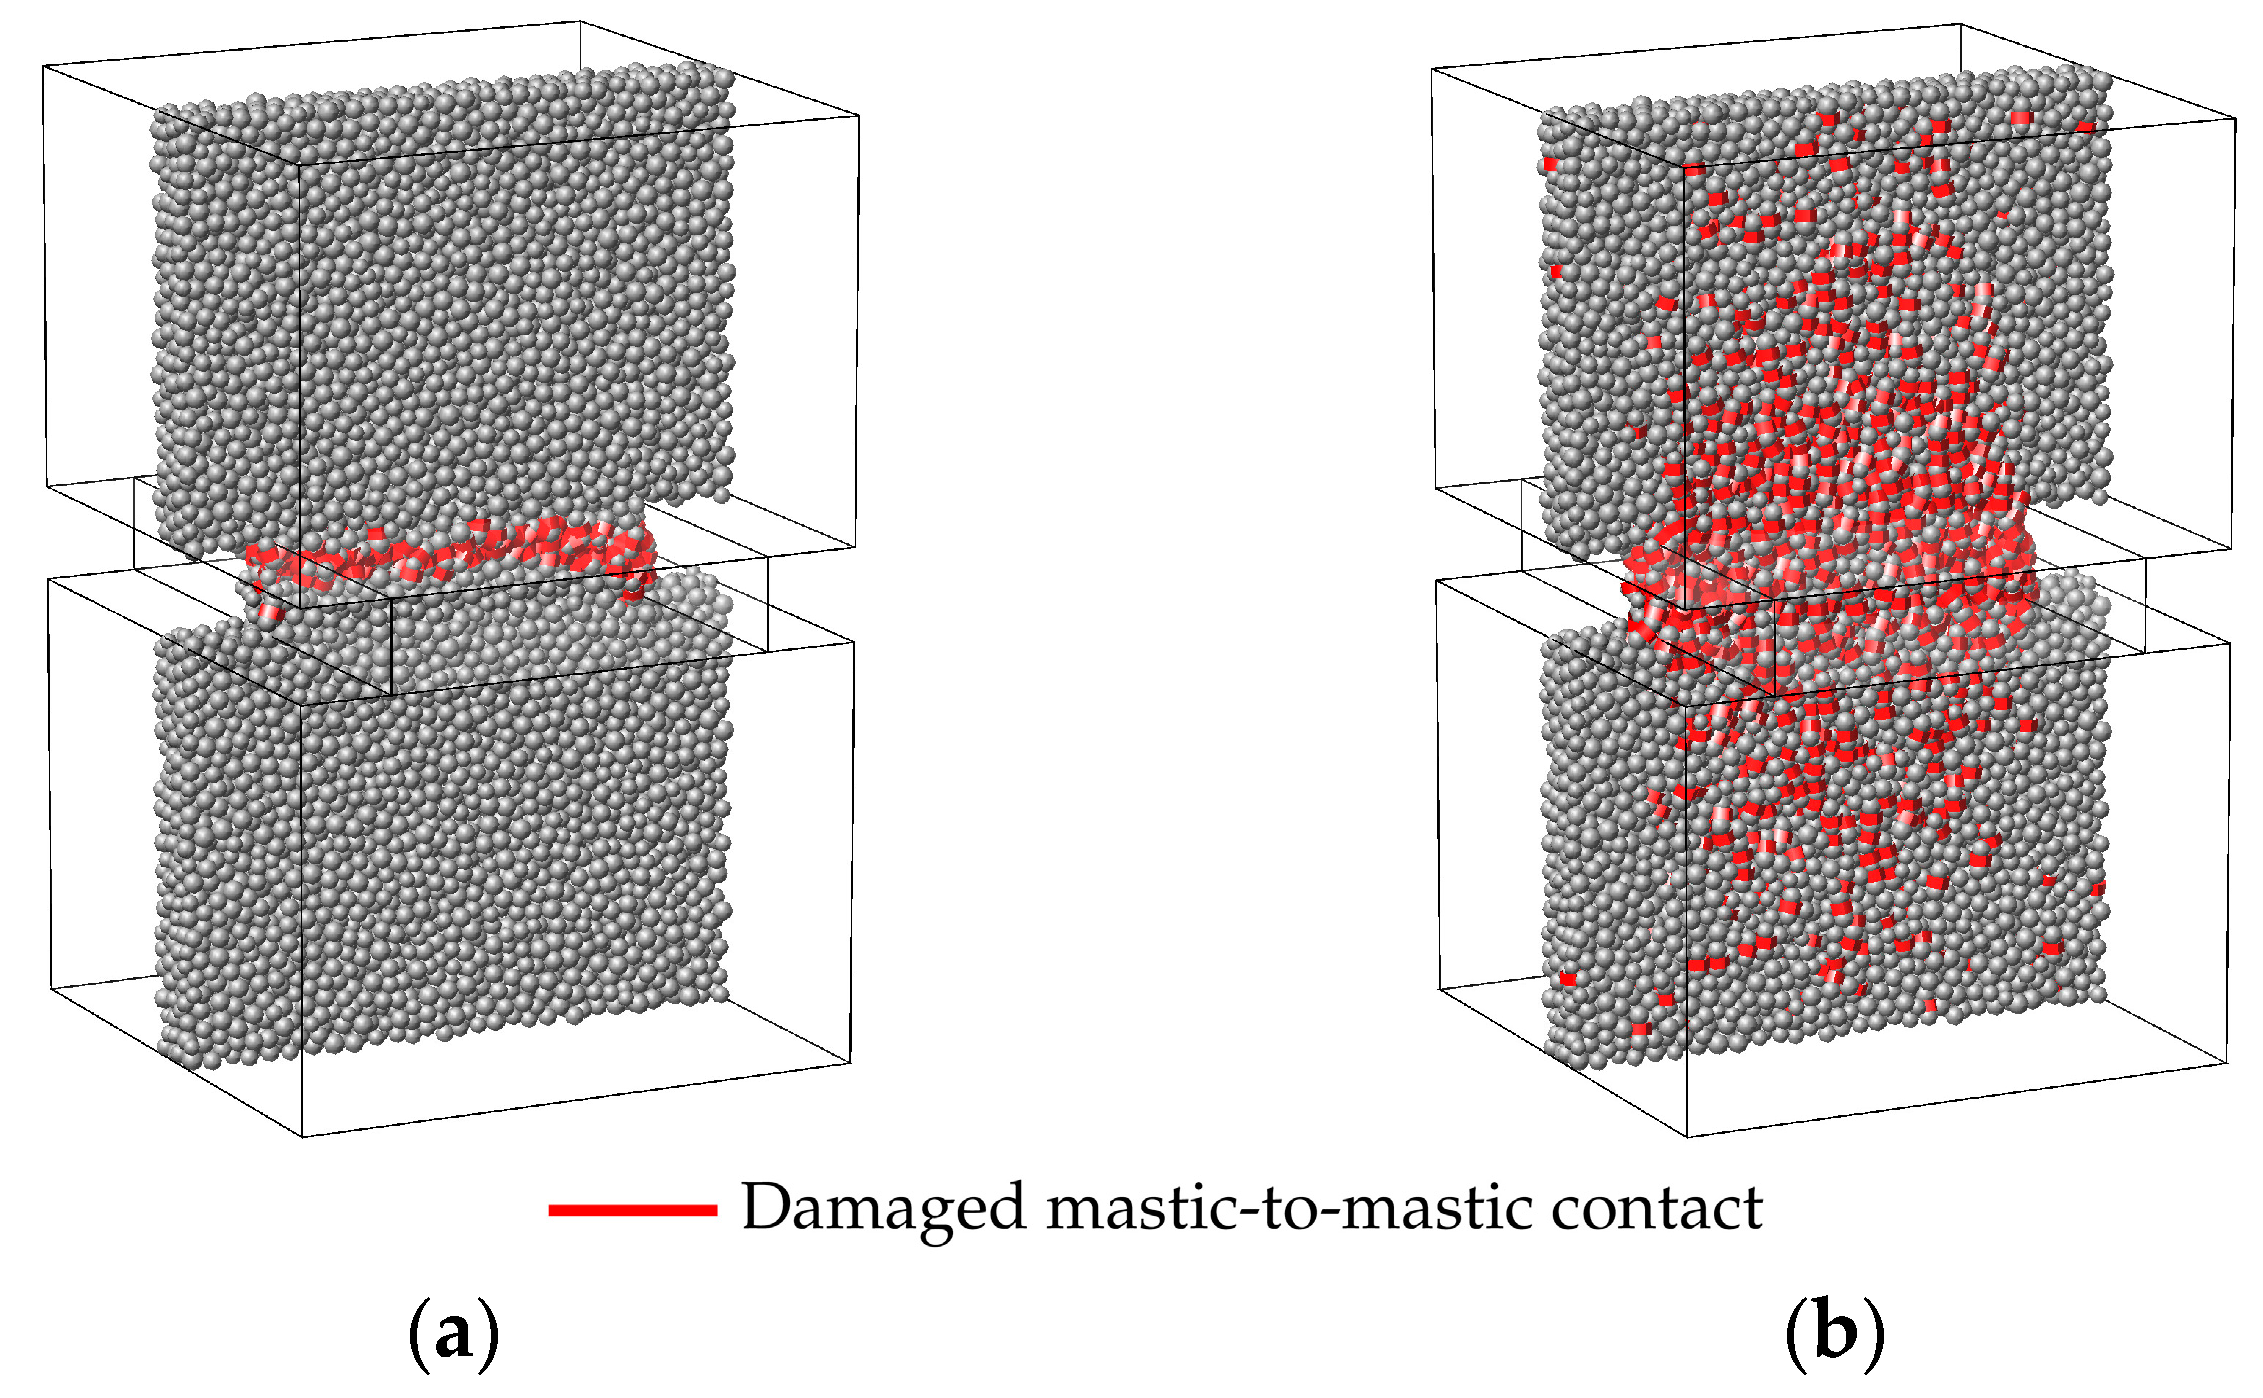
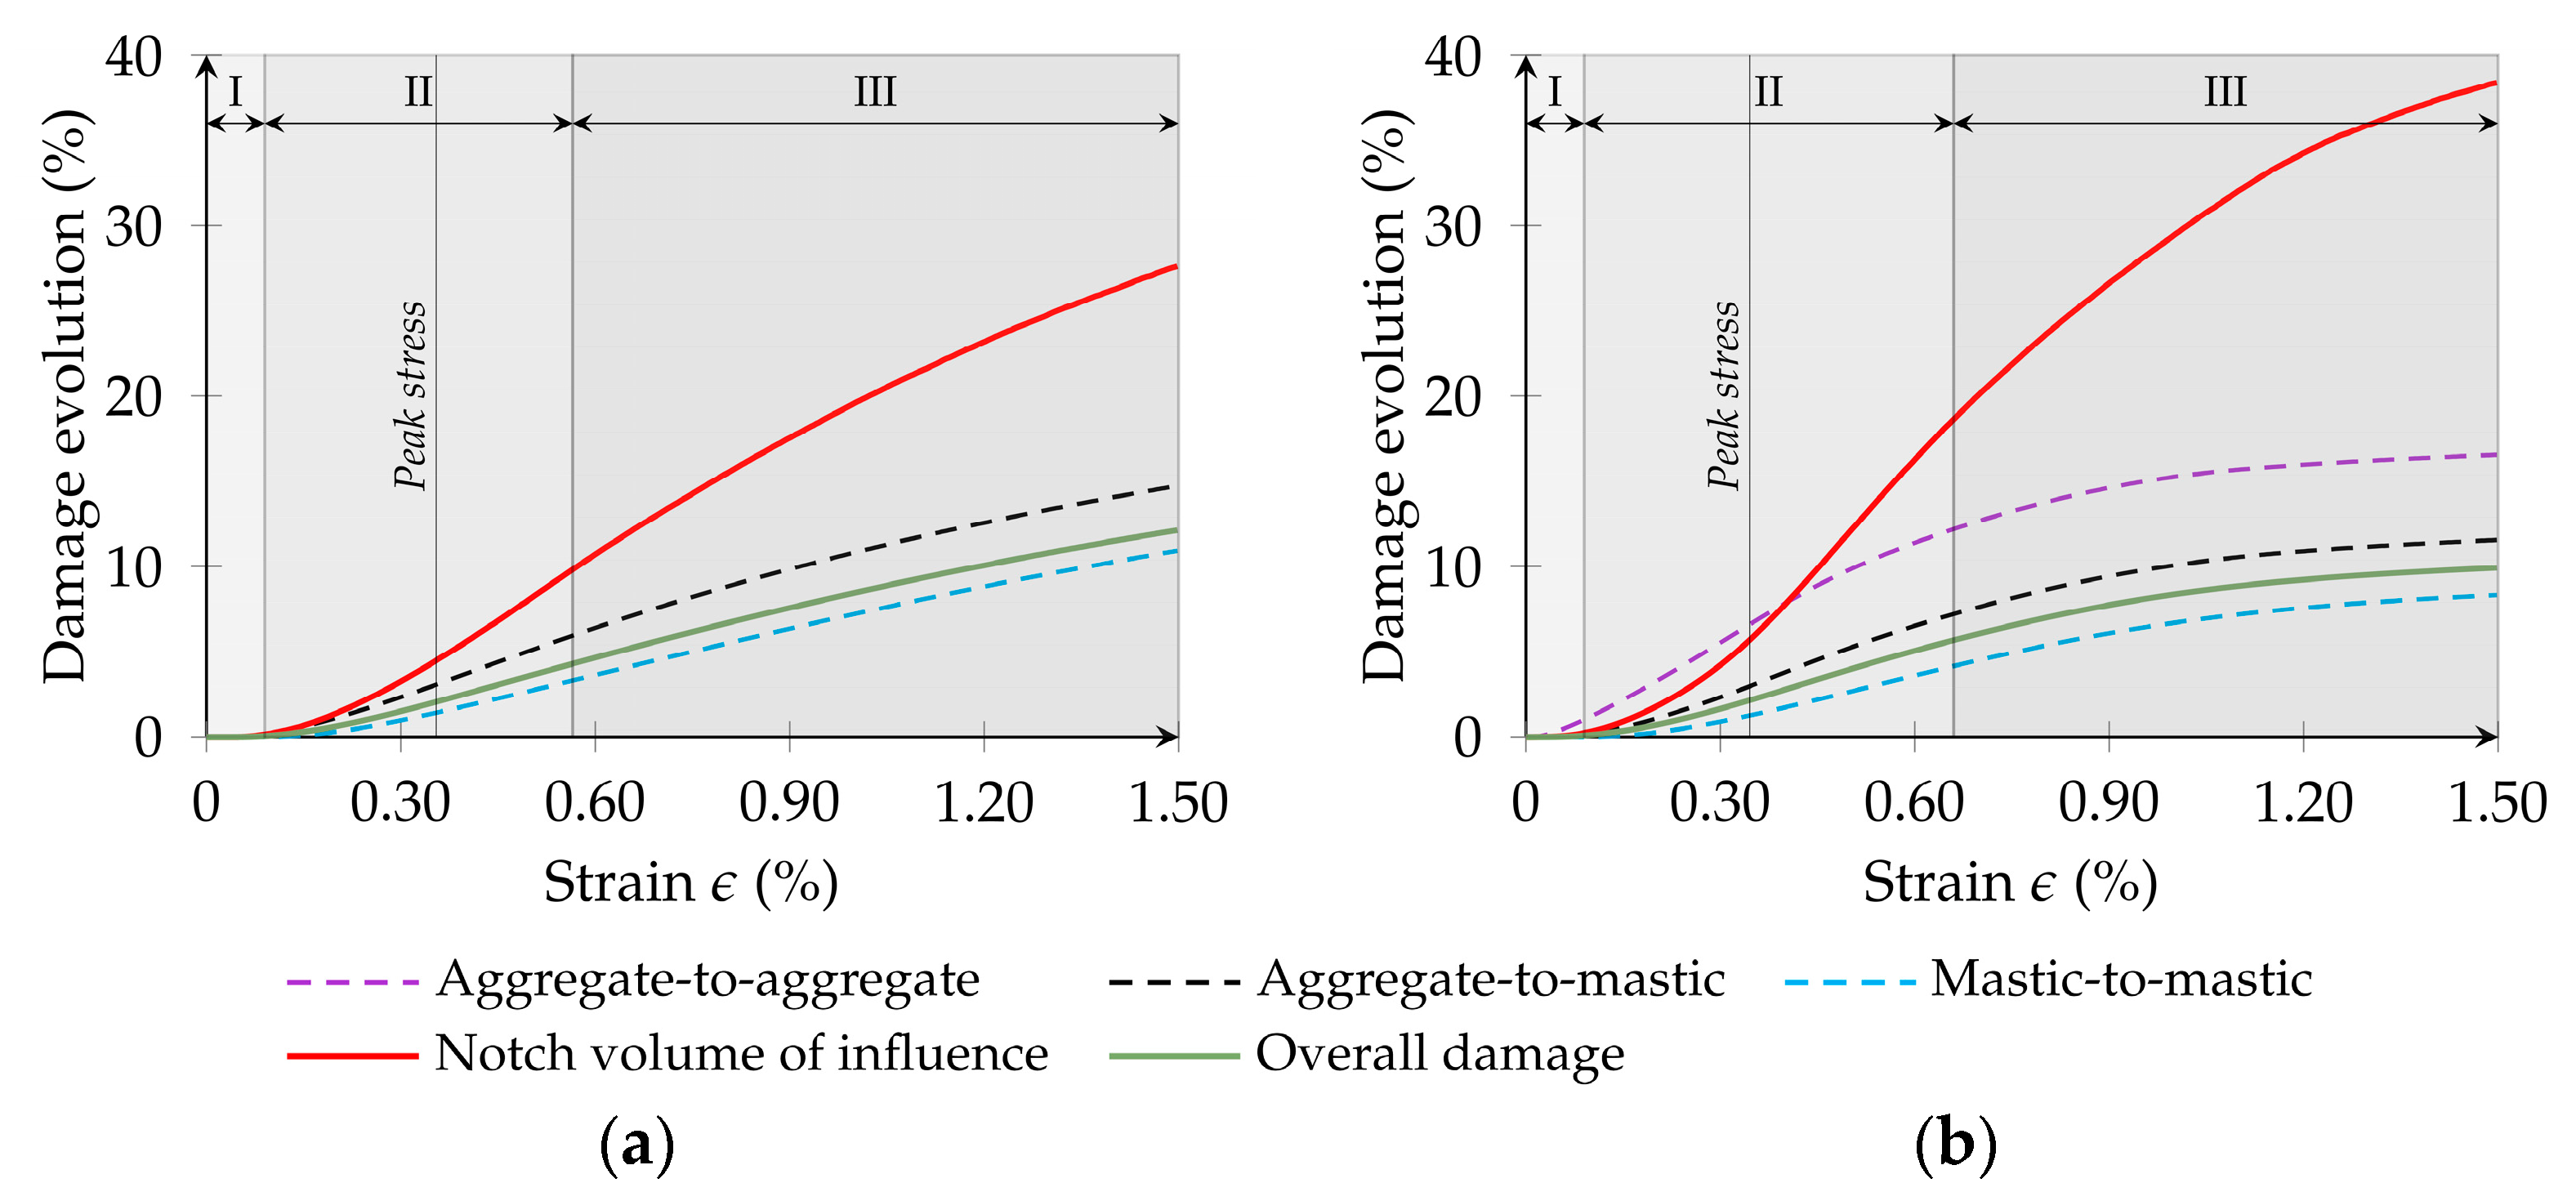
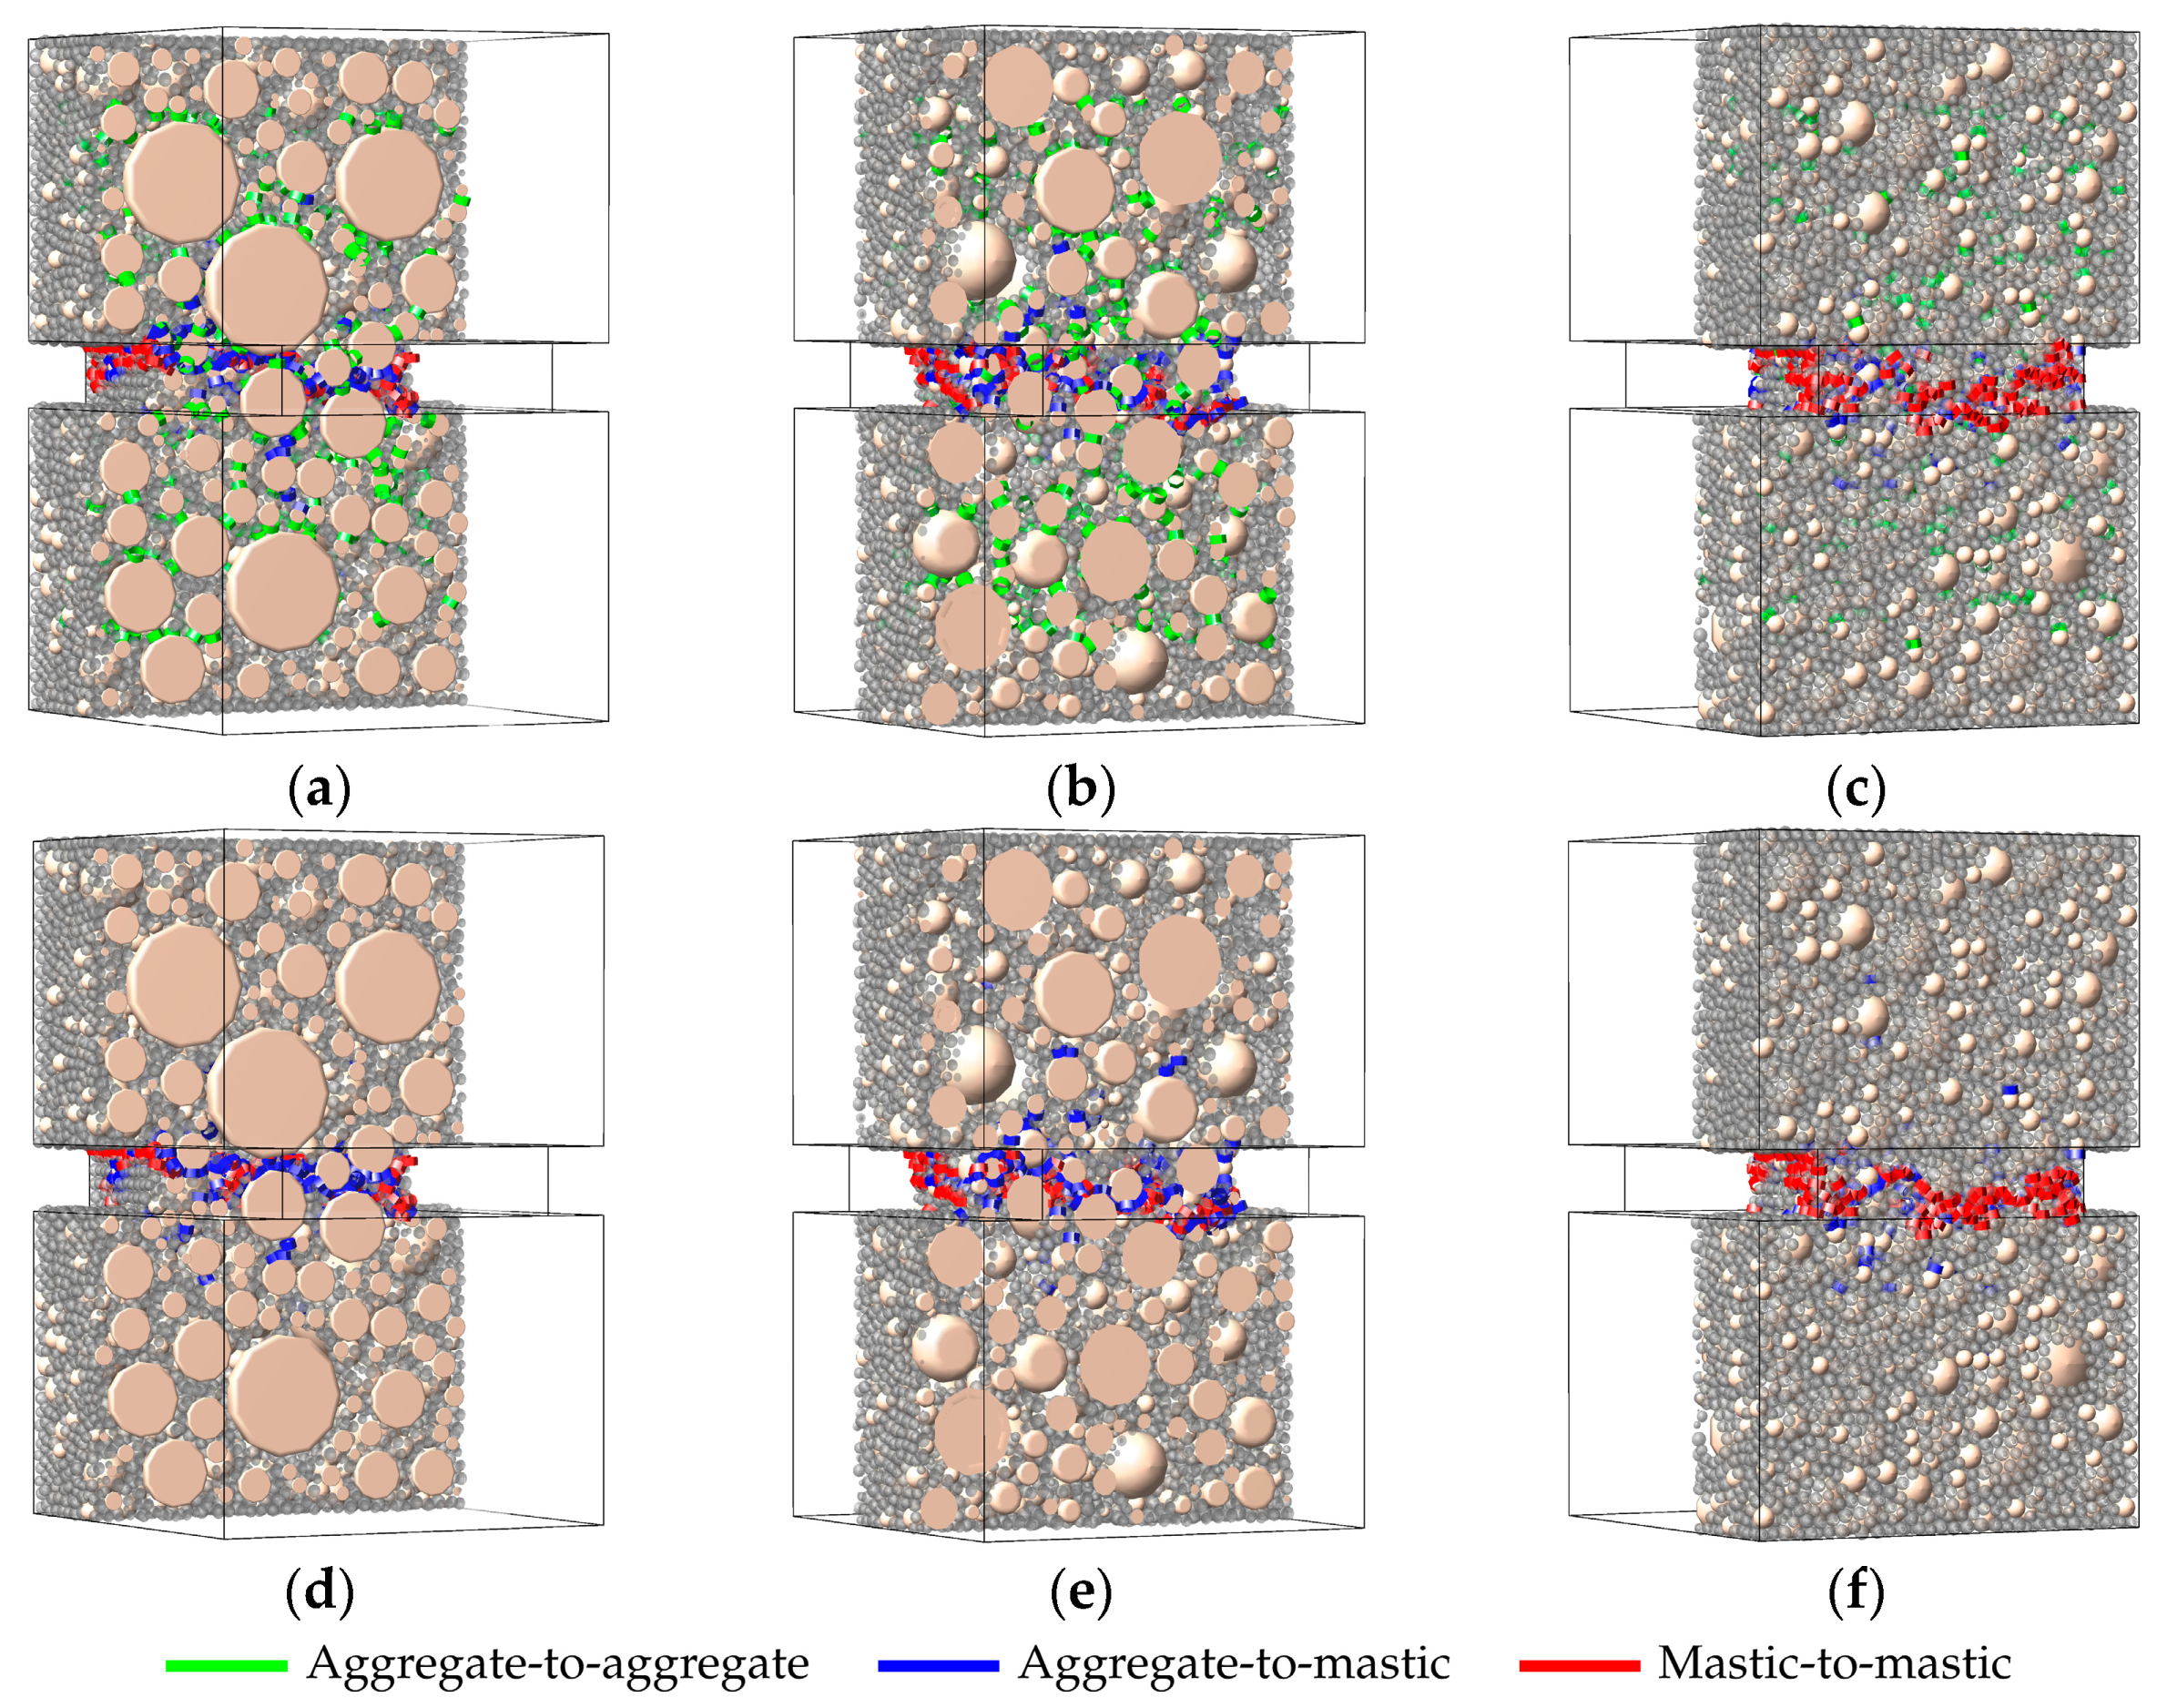
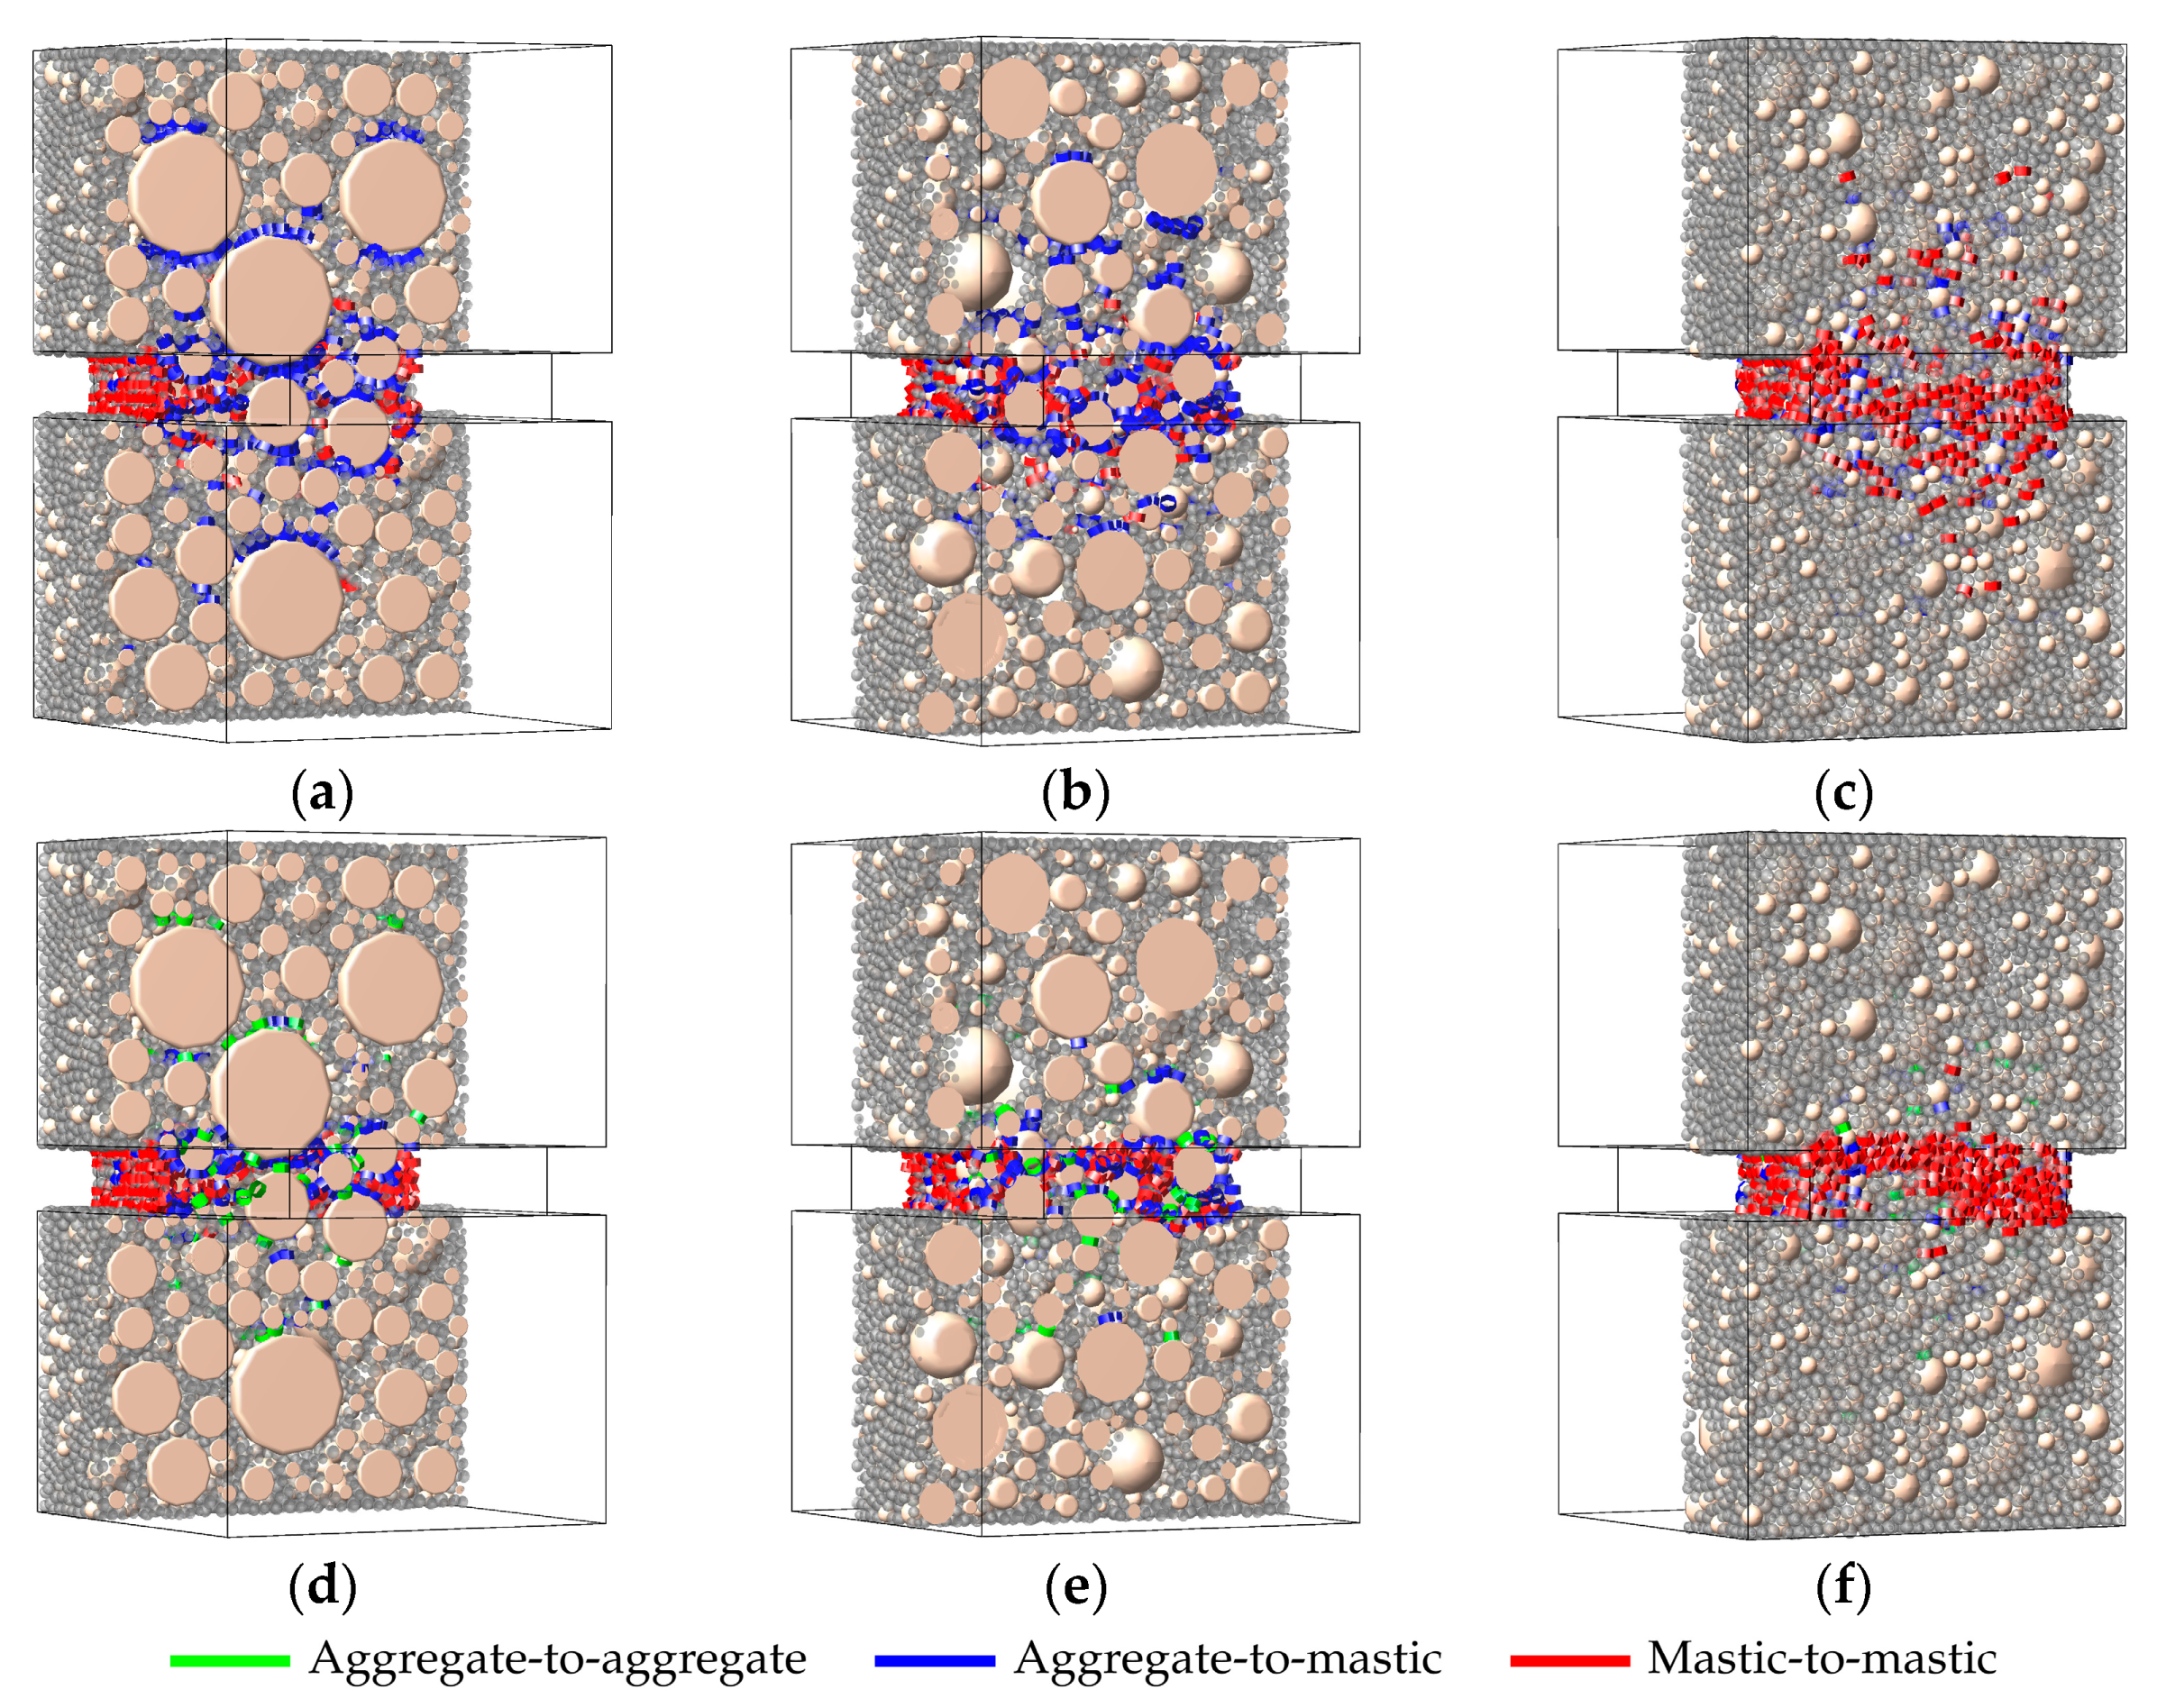
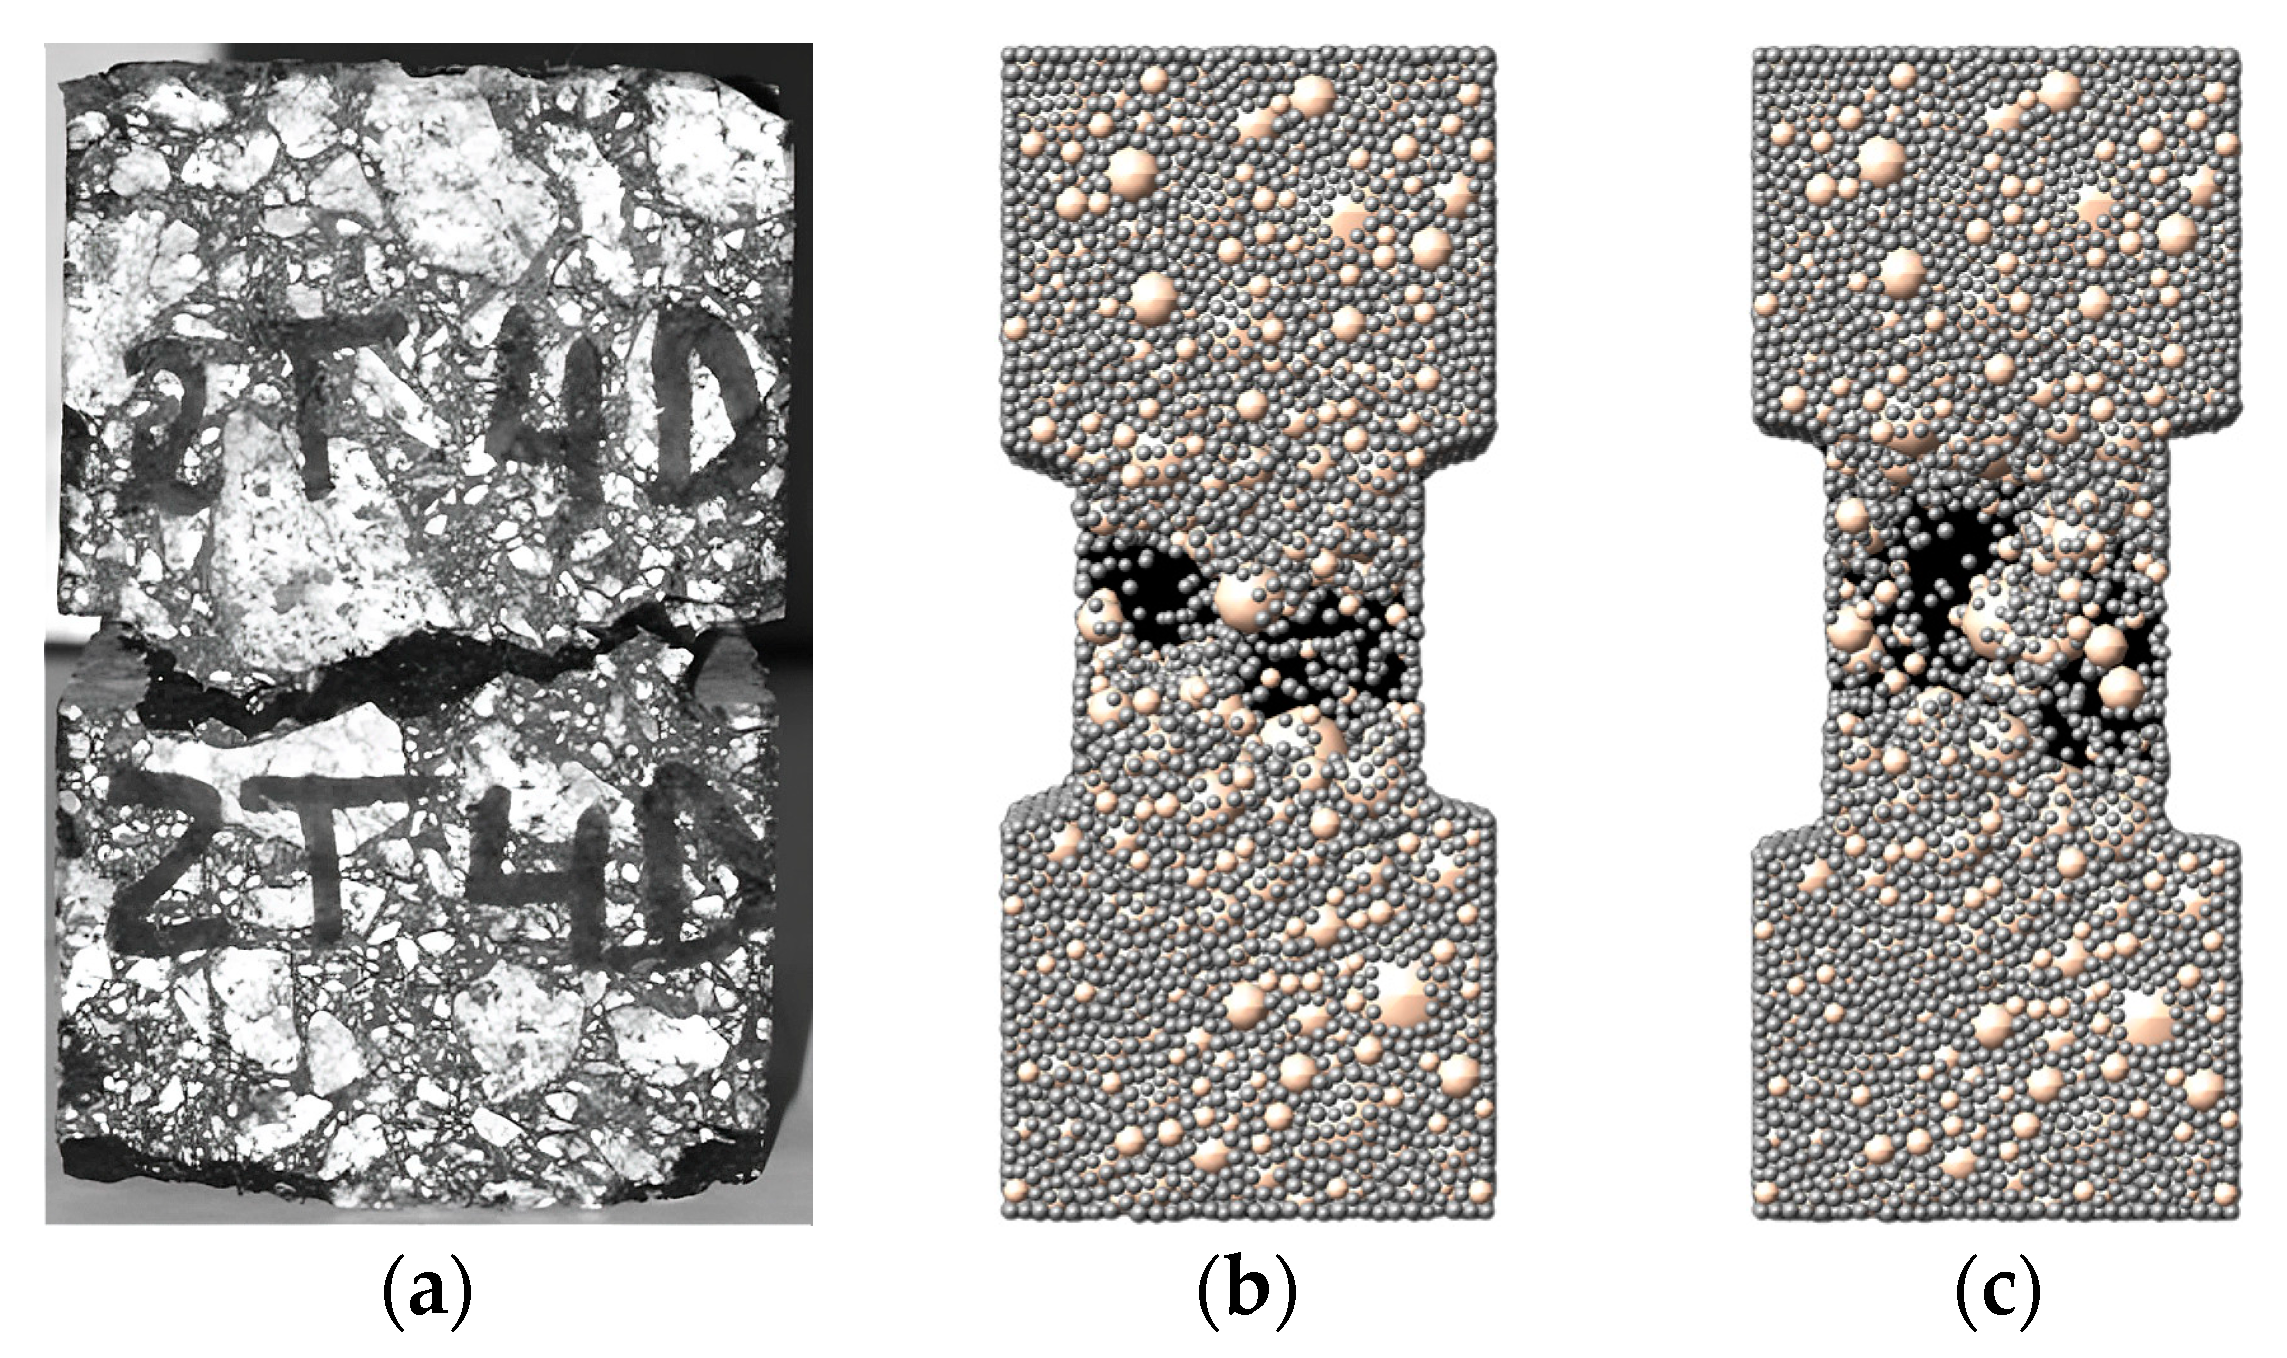
In asphalt mixtures, aggregate-to-mastic contacts are the primary points of failure. The percentage of damaged contacts at these interactions is more pronounced than that within the mastic phase. Under a tensile loading test of a notched specimen, contact damage between the notch tips is significantly higher than in other parts of the asphalt mixture, leading to the formation of a macro-crack that results in the specimen’s failure.
-
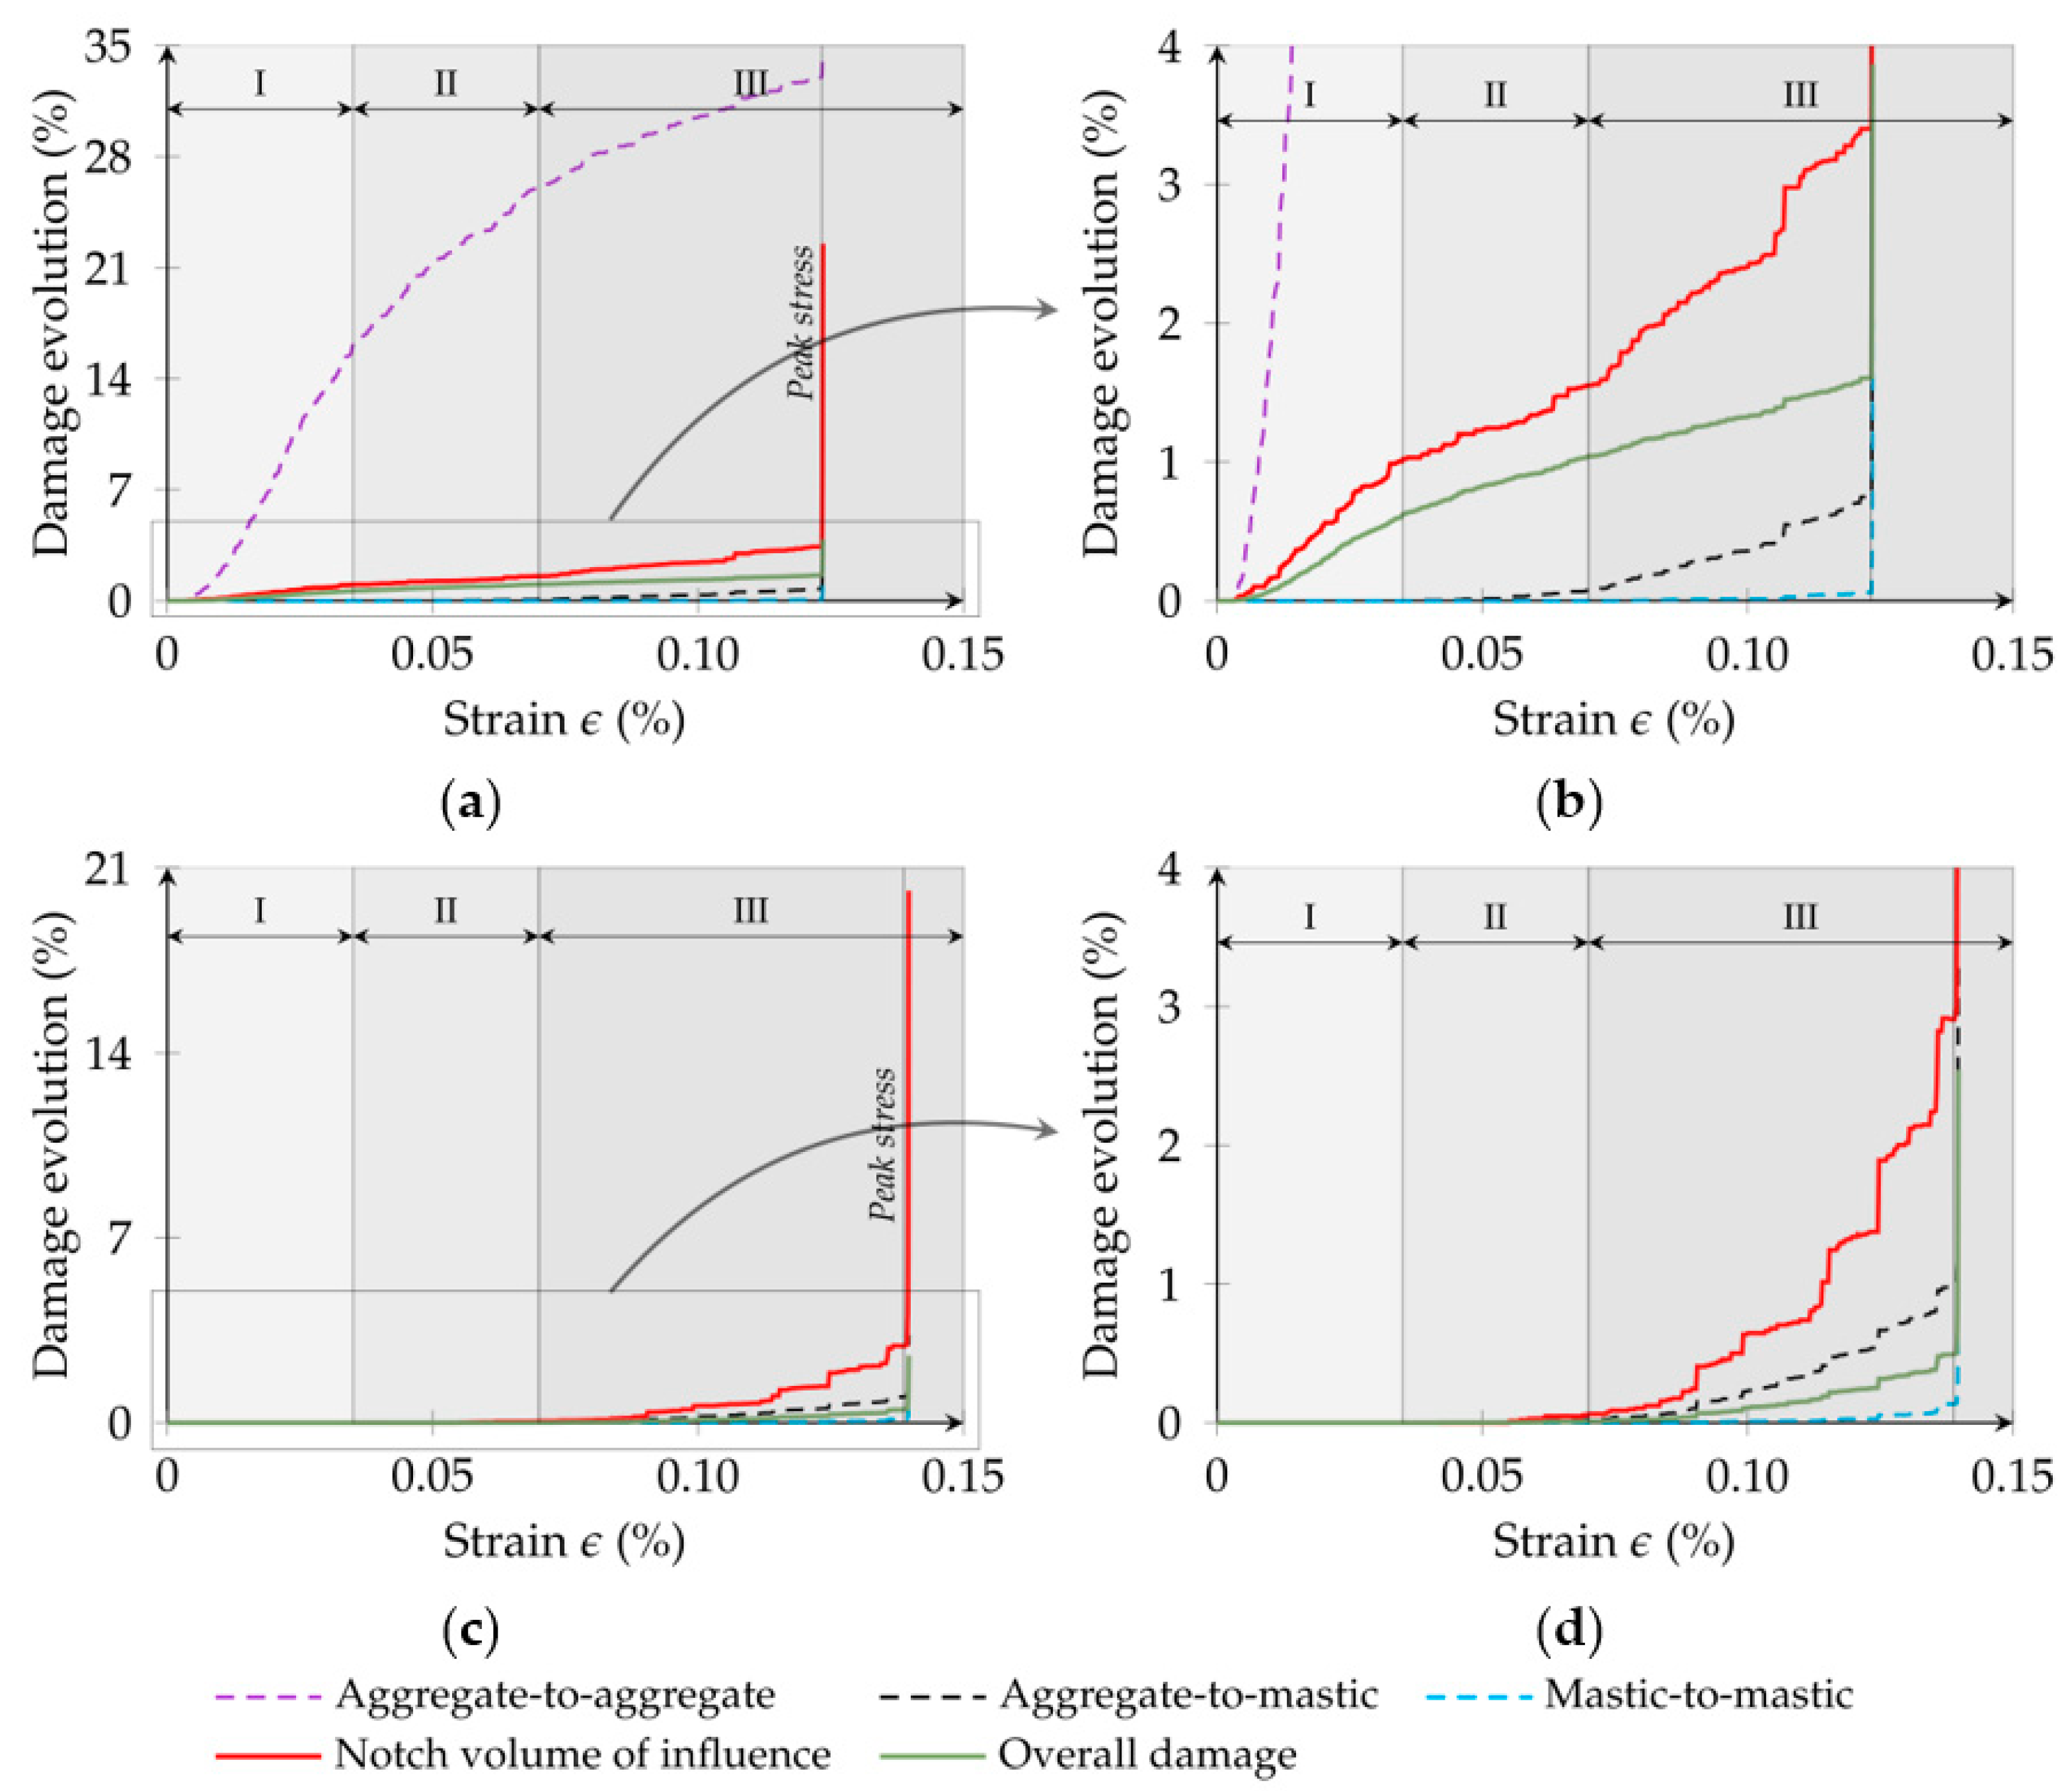
The evolution of contact damage can be divided into three different stages. Stage I involves mainly damage evolution located between adjacent aggregates (when allowed) as a result of the rearrangement of these elements in the specimen, predominantly occurring outside the notch tips. In Stage II, damage develops in the viscoelastic damage contacts as stress increases, especially around the notch tips. In Stage III, damage may follow a rapid increase (GK-Brittle) or a stabilisation tendency (GK-Bilinear).
-
The proposed GK-Damage models have close computational runtimes for the level of deformation, with an increase of nearly 10% for the GK-Bilinear model due to additional checks performed. Also, by adopting a reduced-size mastic specimen to calibrate the GK-Damage contact parameters, simulation runtimes decreased by eight times. For asphalt mixtures, simulation runtimes varied from 2 days for the GK-Brittle model to 11 days for the GK-Bilinear model.
The proposed GK-Bilinear model gives a better agreement with the known mastic and asphalt mixture behaviours under tensile loading. The responses predicted by the GK-Brittle model are brittle under tensile loading, deviating significantly from the more ductile behaviour observed experimentally for the given temperature and loading velocity. The proposed methodology that calibrates the strength properties of the GK-Damage models, which involves using experimental data from the mastic and then applying the calibrated values to predict the asphalt mixture behaviour, proves effective when a GK-Bilinear contact model is adopted for mastic interactions.

Author Contributions

Conceptualisation, N.M.A. and R.M.; methodology, G.C., N.M.A. and R.M.; software, G.C. and N.M.A.; validation, G.C.; resources, H.S.; investigation, G.C. and H.S.; writing—original draft preparation, G.C.; writing—review and editing, N.M.A., R.M. and H.S.; visualisation, G.C.; supervision, N.M.A. and R.M. All authors have read and agreed to the published version of the manuscript.

Funding

This work is part of the research activity carried out at Civil Engineering Research and Innovation for Sustainability (CERIS) and has been funded by Fundação para a Ciência e a Tecnologia (FCT) in the framework of project number [UIDB/04625/2020]. https://doi.org/10.54499/UIDB/04625/2020. This work was also financed by FCT and MCTES through national funds (PIDDAC) under the R&D Unit Institute for Sustainability and Innovation in Structural Engineering (ISISE), under reference UIDB/04029/2020 (https://doi.org/10.54499/UIDB/04029/2020), and under the Associate Laboratory Advanced Production and Intelligent Systems ARISE under reference LA/P/0112/2020.

Data Availability Statement

The original contributions presented in the study are included in the article. Further inquiries can be directed to the corresponding author.

Conflicts of Interest

The authors declared no potential conflicts of interest concerning the research, authorship, and publication of this article.

References

  1. Gómez-Meijide, B.; Ajam, H.; Garcia, A.; Vansteenkiste, S. Effect of Bitumen Properties in the Induction Healing Capacity of Asphalt Mixes. Constr. Build. Mater. 2018, 190, 131–139. [Google Scholar] [CrossRef]
  2. Norambuena-Contreras, J.; Yalcin, E.; Garcia, A.; Al-Mansoori, T.; Yilmaz, M.; Hudson-Griffiths, R. Effect of Mixing and Ageing on the Mechanical and Self-Healing Properties of Asphalt Mixtures Containing Polymeric Capsules. Constr. Build. Mater. 2018, 175, 254–266. [Google Scholar] [CrossRef]
  3. Guerrieri, M.; Parla, G.; Khanmohamadi, M.; Neduzha, L. Asphalt Pavement Damage Detection through Deep Learning Technique and Cost-Effective Equipment: A Case Study in Urban Roads Crossed by Tramway Lines. Infrastructures 2024, 9, 34. [Google Scholar] [CrossRef]
  4. Su, J.-F.; Qiu, J.; Schlangen, E.; Wang, Y.-Y. Experimental Investigation of Self-Healing Behavior of Bitumen/Microcapsule Composites by a Modified Beam on Elastic Foundation Method. Mater. Struct. 2015, 48, 4067–4076. [Google Scholar] [CrossRef]
  5. Raffaniello, A.; Bauer, M.; Safiuddin, M.; El-Hakim, M. Traffic and Climate Impacts on Rutting and Thermal Cracking in Flexible and Composite Pavements. Infrastructures 2022, 7, 100. [Google Scholar] [CrossRef]
  6. Micaelo, R.; Freire, A.C.; Pereira, G. Asphalt Self-Healing with Encapsulated Rejuvenators: Effect of Calcium-Alginate Capsules on Stiffness, Fatigue and Rutting Properties. Mater. Struct. 2020, 53, 20. [Google Scholar] [CrossRef]
  7. Gao, L.; Li, H.; Xie, J.; Yang, X. Mixed-Mode Fracture Modeling of Cold Recycled Mixture Using Discrete Element Method. Constr. Build. Mater. 2017, 151, 625–635. [Google Scholar] [CrossRef]
  8. Peng, Y.; Bao, J. Micromechanical Analysis of Asphalt-Mixture Shear Strength Using the Three-Dimensional Discrete Element Method. J. Mater. Civ. Eng. 2018, 30, 04018302. [Google Scholar] [CrossRef]
  9. Li, J.; Zhang, J.; Qian, G.; Zheng, J.; Zhang, Y. Three-Dimensional Simulation of Aggregate and Asphalt Mixture Using Parameterized Shape and Size Gradation. J. Mater. Civ. Eng. 2019, 31, 04019004. [Google Scholar] [CrossRef]
  10. Xue, B.; Pei, J.; Zhou, B.; Zhang, J.; Li, R.; Guo, F. Using Random Heterogeneous DEM Model to Simulate the SCB Fracture Behavior of Asphalt Concrete. Constr. Build. Mater. 2020, 236, 117580. [Google Scholar] [CrossRef]
  11. Wu, J.; Li, D.; Zhu, B.; Wu, C. Milling Process Simulation of Old Asphalt Mixture by Discrete Element. Constr. Build. Mater. 2018, 186, 996–1004. [Google Scholar] [CrossRef]
  12. Zhu, X.; Yu, H.; Qian, G.; Yao, D.; Dai, W.; Zhang, H.; Li, J.; Zhong, H. Evaluation of Asphalt Mixture Micromechanical Behavior Evolution in the Failure Process Based on Discrete Element Method. Case Stud. Constr. Mater. 2023, 18, e01773. [Google Scholar] [CrossRef]
  13. Peng, Y.; Sun, L. Aggregate Distribution Influence on the Indirect Tensile Test of Asphalt Mixtures Using the Discrete Element Method. Int. J. Pavement Eng. 2017, 18, 668–681. [Google Scholar] [CrossRef]
  14. Kim, H.; Wagoner, M.P.; Buttlar, W.G. Micromechanical Fracture Modeling of Asphalt Concrete Using a Single-Edge Notched Beam Test. Mater. Struct. 2009, 42, 677–689. [Google Scholar] [CrossRef]
  15. Hill, B.C.; Giraldo-Londoño, O.; Paulino, G.H.; Buttlar, W.G. Inverse Estimation of Cohesive Fracture Properties of Asphalt Mixtures Using an Optimization Approach. Exp. Mech. 2017, 57, 637–648. [Google Scholar] [CrossRef]
  16. Meza-Lopez, J.; Noreña, N.; Meza, C.; Romanel, C. Modeling of Asphalt Concrete Fracture Tests with the Discrete-Element Method. J. Mater. Civ. Eng. 2020, 32, 04020228. [Google Scholar] [CrossRef]
  17. Liang, H.; Shi, L.; Wang, D.; Xiao, X.; Deng, K. Influence of Graded Coarse Aggregate Content and Specific Surface Area on the Fracture Properties of Asphalt Mixtures Based on Discrete Element Simulations and Indoor Tests. Constr. Build. Mater. 2021, 299, 123942. [Google Scholar] [CrossRef]
  18. Peng, Y.; Gao, H. Comparative Modelling of Indirect Tensile Strength of Asphalt Mixtures with and without Considering Air Void Characteristics. Int. J. Pavement Eng. 2021, 22, 1601–1610. [Google Scholar] [CrossRef]
  19. Sheng, Y.; Jia, H.; Lv, H.; Chen, H.; Zhao, X.; Wang, R.; Meng, J. Study on Mesoscopic Mechanics of Recycled Asphalt Mixture in the Indirect Tensile Test. Math. Probl. Eng. 2020, 2020, 6621275. [Google Scholar] [CrossRef]
  20. Nian, T.; Ge, J.; Li, P.; Wang, M.; Mao, Y. Improved Discrete Element Numerical Simulation and Experiment on Low-Temperature Anti-Cracking Performance of Asphalt Mixture Based on PFC2D. Constr. Build. Mater. 2021, 283, 122792. [Google Scholar] [CrossRef]
  21. Xie, S.; Yi, J.; Wang, H.; Yang, S.-H.; Xu, M.; Feng, D. Mechanical Response Analysis of Transverse Crack Treatment of Asphalt Pavement Based on DEM. Int. J. Pavement Eng. 2022, 23, 2206–2226. [Google Scholar] [CrossRef]
  22. Wang, H.; Buttlar, W.G. Three-Dimensional Micromechanical Pavement Model Development for the Study of Block Cracking. Constr. Build. Mater. 2019, 206, 35–45. [Google Scholar] [CrossRef]
  23. Wang, H.; Behnia, B.; Buttlar, W.G.; Reis, H. Development of Two-Dimensional Micromechanical, Viscoelastic, and Heterogeneous-Based Models for the Study of Block Cracking in Asphalt Pavements. Constr. Build. Mater. 2020, 244, 118146. [Google Scholar] [CrossRef]
  24. Zhou, M.; Cao, W. Mesoscopic Analysis of Fatigue Damage Development in Asphalt Mixture Based on Modified Burgers Contact Algorithm in Discrete Element Modeling. Materials 2024, 17, 2025. [Google Scholar] [CrossRef] [PubMed]
  25. Dai, Q.; You, Z. Prediction of Creep Stiffness of Asphalt Mixture with Micromechanical Finite-Element and Discrete-Element Models. J. Eng. Mech. 2007, 133, 163–173. [Google Scholar] [CrossRef]
  26. Câmara, G.; Azevedo, N.M.; Micaelo, R.; Silva, H. Generalised Kelvin Contact Models for DEM Modelling of Asphalt Mixtures. Int. J. Pavement Eng. 2023, 24, 2179625. [Google Scholar] [CrossRef]
  27. Ren, J.; Sun, L. Characterizing Air Void Effect on Fracture of Asphalt Concrete at Low-Temperature Using Discrete Element Method. Eng. Fract. Mech. 2017, 170, 23–43. [Google Scholar] [CrossRef]
  28. Sun, L.; Ren, J.; Zhang, S. Fracture Characteristics of Asphalt Concrete in Mixed-Loading Mode at Low-Temperature Based on Discrete-Element Method. J. Mater. Civ. Eng. 2018, 30, 04018321. [Google Scholar] [CrossRef]
  29. Xu, Y.; Jiang, Y.; Xue, J.; Ren, J. Investigating the Effect of Aggregate Characteristics on the Macroscopic and Microscopic Fracture Mechanisms of Asphalt Concrete at Low-Temperature. Materials 2019, 12, 2675. [Google Scholar] [CrossRef]
  30. Lu, D.X.; Nguyen, N.H.T.; Bui, H.H. A Cohesive Viscoelastic-Elastoplastic-Damage Model for DEM and Its Applications to Predict the Rate- and Time-Dependent Behaviour of Asphalt Concretes. Int. J. Plast. 2022, 157, 103391. [Google Scholar] [CrossRef]
  31. Caballero, A.; Willam, K.J.; Carol, I. Consistent Tangent Formulation for 3D Interface Modeling of Cracking/Fracture in Quasi-Brittle Materials. Comput. Methods Appl. Mech. Eng. 2008, 197, 2804–2822. [Google Scholar] [CrossRef]
  32. Lu, D.X.; Bui, H.H.; Saleh, M. Predicting the Rutting Behaviour of Asphalt Concrete in the Modified Wheel Tracking Test Using DEM and a Cohesive Viscoelastic–Elastoplastic-Damage Contact Model. Comput. Part. Mech. 2024. [Google Scholar] [CrossRef]
  33. Azevedo, N.M.; Farinha, M.L.B.; Oliveira, S. Assessment of Contact Laws Accounting for Softening in 3D Rigid Concrete Particle Models. Buildings 2024, 14, 801. [Google Scholar] [CrossRef]
  34. Câmara, G.; Micaelo, R.; Monteiro Azevedo, N. 3D DEM Model Simulation of Asphalt Mastics with Sunflower Oil. Comput. Part. Mech. 2023, 10, 1569–1586. [Google Scholar] [CrossRef]
  35. Dan, H.-C.; Zhang, Z.; Chen, J.; Cao, W. Low-Temperature Fracture Characteristics of Asphalt Mixtures Using the Eccentric Single-Edge Notched Bend Test: A 3D Discrete Element Study. Constr. Build. Mater. 2022, 344, 128182. [Google Scholar] [CrossRef]
  36. Jin, D.; Boateng, K.A.; Chen, S.; Xin, K.; You, Z. Comparison of Rubber Asphalt with Polymer Asphalt under Long-Term Aging Conditions in Michigan. Sustainability 2022, 14, 10987. [Google Scholar] [CrossRef]
  37. Jin, D.; Yin, L.; Malburg, L.; You, Z. Laboratory Evaluation and Field Demonstration of Cold In-Place Recycling Asphalt Mixture in Michigan Low-Volume Road. Case Stud. Constr. Mater. 2024, 20, e02923. [Google Scholar] [CrossRef]
  38. Kim, H.; Wagoner, M.P.; Buttlar, W.G. Simulation of Fracture Behavior in Asphalt Concrete Using a Heterogeneous Cohesive Zone Discrete Element Model. J. Mater. Civ. Eng. 2008, 20, 552–563. [Google Scholar] [CrossRef]
  39. Monteiro Azevedo, N.; Lemos, J.V.; Almeida, J. A Discrete Particle Model for Reinforced Concrete Fracture Analysis. Struct. Eng. Mech. 2010, 36, 343–361. [Google Scholar] [CrossRef]
  40. Kim, H.; Buttlar, W.G. Discrete Fracture Modeling of Asphalt Concrete. Int. J. Solids Struct. 2009, 46, 2593–2604. [Google Scholar] [CrossRef]
  41. Dan, H.-C.; Zhang, Z.; Chen, J.-Q.; Wang, H. Numerical Simulation of an Indirect Tensile Test for Asphalt Mixtures Using Discrete Element Method Software. J. Mater. Civ. Eng. 2018, 30, 04018067. [Google Scholar] [CrossRef]
  42. Silva, H. Caracterização do Mastique Betuminoso e da Ligação Agregado-Mastique. Ph.D. Thesis, Universidade do Minho, Guimarães, Portugal, 2005. [Google Scholar]
  43. Câmara, G.; Azevedo, N.M.; Micaelo, R. Impact of Rejuvenator-Modified Mastic on Asphalt Mixture Stiffness: Meso-Scale Discrete Element Method Approach. Buildings 2023, 13, 3023. [Google Scholar] [CrossRef]
  44. Micaelo, R.; Monteiro Azevedo, N.; Câmara, G. Improving Asphalt Discrete Numerical Modelling with Realistic Particle Shapes. In Proceedings of the VIII International Conference on Particle-Based Methods PARTICLES 2023, Milan, Italy, 9–11 October 2023. [Google Scholar]
  45. Li, Y.; Jiang, W.; Xiao, J.; Zhao, F.; Zhang, S.; Xing, C.; Yuan, D. Effects of Kneading and Impact Action on the Movement of Aggregates in Asphalt Mixtures during Compaction. Constr. Build. Mater. 2023, 366, 130210. [Google Scholar] [CrossRef]
  46. Nian, T.; Ge, J.; Li, P.; Guo, R.; Li, J.; Wang, M. Improved Three-Dimensional Discrete Modeling Method and Anti-Cracking Properties of Asphalt Mixture. Constr. Build. Mater. 2022, 321, 126405. [Google Scholar] [CrossRef]
  47. Michot-Roberto, S. 3D-Simulation of Packing of Aggregates with Realistic Morphology and Size Distribution by Using a Real-Time Physic’s Engine. Ph.D. Thesis, University of Nottingham, Nottingham, UK, 2022. [Google Scholar]
  48. Ling, M.; Zhang, Y.; Kaseer, F.; Martin, A.E.; Lytton, R.L. Investigation of Fracture Behavior of Asphalt Mixture Composite Using Energy-Based Approach. Compos. Part B Eng. 2020, 181, 107324. [Google Scholar] [CrossRef]
  49. Peng, Y.; Harvey, J.T.; Sun, L. Three-Dimensional Discrete-Element Modeling of Aggregate Homogeneity Influence on Indirect Tensile Strength of Asphalt Mixtures. J. Mater. Civ. Eng. 2017, 29, 04017211. [Google Scholar] [CrossRef]
  50. Peng, Y.; Wan, L.; Sun, L.-J. Three-Dimensional Discrete Element Modelling of Influence Factors of Indirect Tensile Strength of Asphalt Mixtures. Int. J. Pavement Eng. 2019, 20, 724–733. [Google Scholar] [CrossRef]
  51. Kim, H.; Buttlar, W.G. Multi-Scale Fracture Modeling of Asphalt Composite Structures. Compos. Sci. Technol. 2009, 69, 2716–2723. [Google Scholar] [CrossRef]
  52. Gao, H.; Yang, X.; Zhang, C. Experimental and Numerical Analysis of Three-Point Bending Fracture of Pre-Notched Asphalt Mixture Beam. Constr. Build. Mater. 2015, 90, 1–10. [Google Scholar] [CrossRef]
Figure 1. Generalised Kelvin contact model representation.
Infrastructures 09 00118 g001
Figure 2. Force–displacement representation of the GK-Brittle model: (a) normal; (b) shear directions.
Infrastructures 09 00118 g002
Figure 3. Force–displacement representation of the GK-Bilinear model: (a) normal; (b) shear directions.
Infrastructures 09 00118 g003
Figure 4. Damage evolution D n , s in the GK-Bilinear softening contact model.
Infrastructures 09 00118 g004
Figure 5. Two-particle numerical assembly.
Infrastructures 09 00118 g005
Figure 6. Influence of the velocity on the proposed GK-Damage contact models response: (a) GK-Brittle; (b) GK-Bilinear.
Infrastructures 09 00118 g006
Figure 7. Influence of the maximum contact tensile strength on the GK-Damage contact models response: (a) GK-Brittle; (b) GK-Bilinear.
Infrastructures 09 00118 g007
Figure 8. Influence of the loading velocity and maximum contact tensile strength on the GK-Damage contact models response: (a) GK-Brittle; (b) GK-Bilinear.
Infrastructures 09 00118 g008
Figure 9. Influence of the contact fracture energy in mode I on the GK-Bilinear response.
Infrastructures 09 00118 g009
Figure 10. Influence of the maximum contact tensile strength and contact fracture energy in mode I on the GK-Bilinear model response.
Infrastructures 09 00118 g010
Figure 11. Influence of the GK contact viscoelastic parameters on the GK-Brittle model response: (a) stiffness; (b) viscosities.
Infrastructures 09 00118 g011
Figure 12. Influence of the GK viscoelastic parameters on the GK-Bilinear model response: (a) stiffness; (b) viscosities.
Infrastructures 09 00118 g012
Figure 13. Asphalt mastic: (a) experimental [42]; (b) full-size virtual; (c) reduced-size virtual projected from the red portion of the full model.
Infrastructures 09 00118 g013
Figure 14. Asphalt mixture: (a) experimental [42]; (b) numerical.
Infrastructures 09 00118 g014
Figure 15. Stress–strain response of a reduced-size asphalt mastic under tensile loading: (a) GK-Brittle; (b) GK-Bilinear.
Infrastructures 09 00118 g015
Figure 16. Damage distribution (D > 75.0%) within the mastic model after test: (a) experimental [42]; (b,c) points 1 and 2 from Figure 15a for GK-Brittle model; (df) points 1, 2, and 3 from Figure 15b for GK-Bilinear softening model.
Infrastructures 09 00118 g016aInfrastructures 09 00118 g016b
Figure 17. Asphalt mastic sample: (a) experimental [42]; predicted deformation field amplified of the particle model adopting (b) GK-Brittle model and (c) GK-Bilinear model.
Infrastructures 09 00118 g017
Figure 18. Stress–strain response of an asphalt mastic under tensile loading: (a) GK-Brittle; (b) GK-Bilinear.
Infrastructures 09 00118 g018
Figure 19. Damage distribution (D > 75.0%) within the central portion of the full-size virtual mastic: (a) GK-Brittle model; (b) GK-Bilinear model.
Infrastructures 09 00118 g019
Figure 20. Stress–strain response of an asphalt mixture under tensile loading: (a) GK-Brittle (Cases 1 and 2); (b) GK-Bilinear (Cases 3 and 4).
Infrastructures 09 00118 g020
Figure 21. Contact damage evolution in the particle assembly adopting a GK-Brittle model: (a) Case 1: BRM; (b) zoom-in of the BRM response; (c) Case 2: BRM-NT; (d) zoom-in of the BRM-NT response.
Infrastructures 09 00118 g021
Figure 22. Contact damage evolution in the particle assembly adopting a GK-Bilinear model: (a) Case 3: BRM-NT; (b) Case 4: BSM.
Infrastructures 09 00118 g022
Figure 23. Contact damage distributions within asphalt mixture shown across three cross-sectional layers: (ac) Case 1 (GK-Brittle, BRM); (df) Case 2 (GK-Brittle, BRM-NT).
Infrastructures 09 00118 g023
Figure 24. Contact damage distributions within asphalt mixture shown across three cross-sectional layers: (ac) Case 3 (GK-Bilinear, BRM-NT); (df) Case 4 (GK-Bilinear, BSM).
Infrastructures 09 00118 g024
Figure 25. Stress–strain response of an asphalt mixture under tensile loading: (a) GK-Brittle (Cases 1 and 1a); (b) GK-Bilinear (Cases 4, 4a, and 4b).
Infrastructures 09 00118 g025
Figure 26. Asphalt mixture specimen after tensile loading: (a) experimental [42]; (b) Case 1a: GK-Brittle, BRM; (c) Case 4b: GK-Bilinear, BRM.
Infrastructures 09 00118 g026
Table 1. Reference GK micro-mechanical model properties.
ParametersValues
κ 1 (kPa) 6.70 × 10 6
κ 2 4.30 × 10 6
κ 3 8.40 × 10 5
η 1 (kPa·s) 1.90 × 10 5
η 2 8.00 × 10 5
η 3 2.00 × 10 7
κ m (kPa) 1.00 × 10 6
η m (kPa·s) 2.02 × 10 5
Note: κ i —normal contact stiffness ( κ m —Maxwell, κ 1 κ 3 —Kelvin chains 1 to 3); η—normal contact viscosity ( η m —Maxwell, η 1 η 3 —Kelvin chains 1 to 3).
Table 2. Reference contact strength parameters.
Contact ModelMaximum Contact Tensile Strength (MPa)— σ t Contact Fracture Energy in Mode I (N/mm)— G I
GK-Brittle2.0-
GK-Bilinear0.067
Table 3. Parameters for different case studies of loading velocity and maximum contact tensile strength.
Case StudyLoading Velocity (m/s)Maximum Contact Tensile Strength (MPa)— σ t
v   2.0 m/s |   σ t 2.0 MPa (reference) 2.0 × 10 5 2.0
v   4 .0 m/s |   σ t 3.0 MPa 4.0 × 10 5 3.0
v   8.0 m/s |   σ t 4.0 MPa 8.0 × 10 5 4.0
Table 4. Contact strength values for the assessment of the contact fracture energy and maximum contact tensile strength.
Case StudyMaximum Contact Tensile Strength (MPa)— σ t Contact Fracture Energy in Mode I (N/mm)— G I
σ t   1.0 MPa |   G I 0.033 N/mm1.00.033
σ t   2.0 MPa |   G I 0.067 N/mm2.00.067
σ t   3.0 MPa |   G I 0.100 N/mm3.00.100
Table 5. Number and the corresponding volume of aggregate and mastic particles in the asphalt mixture DEM model.
Sieve Size (mm)AggregatesMastic
19.012.59.54.752.0<2.0
Number of particles-1328298231524,096
Volume (mm3)-27,432.421,033.339,397.525,786.461,305.9
Table 6. Contact type and corresponding number of interactions within the asphalt mixture model.
Contact TypeNumber of Interactions
Aggregate-to-aggregate5414
Aggregate-to-mastic57,723
Mastic-to-mastic86,813
Aggregate-to-wall97
Mastic-to-wall1794
Table 7. Contact model approaches in the asphalt mixture numerical model.
Case StudyContact TypeContact Model
Case 1Aggregate-to-aggregateBRM
Aggregate-to-masticGK-Brittle
Mastic-to-masticGK-Brittle
Aggregate-to-aggregateBRM-NT
Case 2Aggregate-to-masticGK-Brittle
Mastic-to-masticGK-Brittle
Aggregate-to-aggregateBRM-NT
Case 3Aggregate-to-masticGK-Bilinear
Mastic-to-masticGK-Bilinear
Aggregate-to-aggregateBSM
Case 4Aggregate-to-masticGK-Bilinear
Mastic-to-masticGK-Bilinear
Table 8. Macroscopic parameters of the calibrated GK model.
ParametersValues
E 1 (kPa) 1.90 × 10 5
E 2 8.00 × 10 5
E 3 2.15 × 10 7
C 1 (kPa∙s) 6.71 × 10 6
C 2 4.27 × 10 6
C 3 8.36 × 10 5
E m (kPa) 3.12 × 10 6
C m (kPa∙s) 3.14 × 10 5
Note: E—elastic modulus of spring (Em—Maxwell, E1–E3—Kelvin chains 1 to 3); C—viscosity of dashpot (Cm—Maxwell, C1C3—Kelvin chains 1 to 3).
Table 9. Contact strength parameters: brittle and bilinear models.
Contact ModelGK-BrittleGK-Bilinear
Maximum contact tensile stress (MPa)6.12
Maximum contact cohesion stress (MPa)24.48
Contact fracture energy in mode I (N/mm)-0.35
Contact fracture energy in mode II (N/mm)-56.44
Table 10. Number of contacts with damage exceeding 75.0% for each contact type in the asphalt mixture model.
Case StudyAggregate-to-Aggregate Contact ModelNumber of Damaged Contacts: Notch (Total Specimen)
Aggregate-to-AggregateAggregate-to-MasticMastic-to-Mastic
1BRM454 (1559)1422 (1534)1291 (1293)
2BRM-NT-1386 (1498)1234 (1234)
3BRM-NT-1890 (3161)1721 (2037)
4BSM265 (390)1933 (2169)2297 (2317)
Disclaimer/Publisher’s Note: The statements, opinions and data contained in all publications are solely those of the individual author(s) and contributor(s) and not of MDPI and/or the editor(s). MDPI and/or the editor(s) disclaim responsibility for any injury to people or property resulting from any ideas, methods, instructions or products referred to in the content.

