Article

Development of a Non-Structural Prefabricated Panel Based on Construction and Demolition Waste for Sustainable Construction

by
Haidee Yulady Jaramillo
1,*,
July Andrea Gómez Camperos
1 and
Nelson Afanador García
2
1
GINSTI Research Group, Department of Civil and Mechanical Engineering, Faculty of Engineering, Universidad Francisco de Paula Santander Ocaña, Ocaña 546552, Colombia
2
CERG Research Group, Department of Civil Engineering, Faculty of Engineering, Universidad Francisco de Paula Santander Ocaña, Ocaña 546552, Colombia
*
Author to whom correspondence should be addressed.
Infrastructures 2024, 9(8), 135; https://doi.org/10.3390/infrastructures9080135
Submission received: 16 April 2024 / Revised: 16 May 2024 / Accepted: 17 May 2024 / Published: 14 August 2024
(This article belongs to the Section Infrastructures Materials and Constructions)

Abstract

:
The study focuses on developing a prefabricated panel for non-structural purposes by optimizing mortar mix designs incorporating recycled microplastic (RMP) and construction demolition waste (CDW) at various ratios (0, 10, 20, 30, and 100%). Experimental procedures encompassed material characterization, mortar specimen manufacturing, compression resistance testing, and thermal/acoustic panel tests following Colombian technical standards. Results indicate that incorporating 20% CDW enhances material strength, with cylinder number 3 (20% of CDW) achieving a resistance of 31.45 MPa. Panels incorporating recyclable waste materials show improved acoustic and thermal insulation properties, with up to 39 dB reduction in sound transmission and a 21 °C decrease in thermal transmission observed (5.6% and 35% for panel and door, respectively). This research advances sustainable construction practices demonstrating the potential of prefabricated panels using recyclable materials, offering eco-friendly solutions with enhanced performance characteristics for construction applications.

1. Introduction

1.1. Overview

The need to develop alternative construction materials has contributed to the creation of mortars that include recyclable materials to replace raw materials, seeking to reduce the environmental impact in the construction industry. In recent years, the recycling of construction and demolition waste (CDW or C&D) has been promoted as an alternative to reduce the impact of the extraction of raw materials and waste; proper management is essential to produce construction materials and ecological/sustainability. Population growth and rapid urbanization have produced quantities of construction and demolition waste (CDW) worldwide, creating challenges in the final disposal of the waste and its adverse effects on the environment [1]. Greenhouse gas emissions, raw material extraction, CDW, and traditional construction procedures have led to the exploration of new environmentally friendly materials [2], giving rise to the study from various perspectives of sustainability in the industry [3] through new ideas and findings in construction, the possibility of using waste materials, the reduction of construction time, and the saving of costs in the modular and sustainable industry [4].
In recent years, recycling has been promoted as an alternative to reduce the impact of the extraction of raw materials and waste [5], with the management of CDW being essential for producing sustainable construction materials [6]. The use of CDW aggregates has been investigated not only in the production of concrete but also in the production of mortar, in the same way as research has been conducted related to the percentages of substitution of CDW aggregate for natural aggregate in concrete [7]. The extraction of waste together with raw materials typically involves a process known as selective demolition or deconstruction. In this process, structures or buildings are carefully dismantled to salvage reusable materials such as concrete, bricks, metals, wood, and other construction materials. The extraction of waste together with raw materials involves a systematic approach to deconstruction, salvaging, and recycling, aimed at minimizing waste generation and maximizing the reuse of materials in sustainable construction practices.
Over time, the plastic industry has increased and replaced different materials, making polyethylene terephthalate (PET) one of the most useful materials in everyday life [8]; its high durability, great strength-to-weight ratio, low thermal conductivity, and density make it a suitable material to be used as concrete [9]. Research into the use of PET fibers as dispersed reinforcement in concrete and mortar has been ongoing for a decade [10]. In this way, construction and demolition (C&D) waste represents a significant portion of global solid waste production, with much of it being disposed of in landfills. Concrete engineers have explored the possibility of treating and repurposing this waste as aggregate in new concrete, particularly in lower-level applications [11]. Then, different aspects of the waste issue need to be considered, including the international landscape of C&D waste generation, production of recycled aggregates (RA) from C&D waste and their incorporation into concrete, and governmental efforts to promote the recycling of C&D waste [12,13].
The need to develop alternative construction materials has contributed to the creation of different mortars that include residual materials to replace raw materials, seeking a smaller ecological footprint in the construction industry [14,15]. The selection of components and the design of mortar mixtures are essential to obtain the specific technical requirements of the standard and properties such as resistance, durability, unit weight, and appearance [16]. In recent decades, different mixture design methods have been demonstrated, classified into four categories: compressive strength method, empirical, closed aggregate packaging, and statistical factorial [17]. It is important to mention that prefabricated products involve components built in a factory in a controlled environment and transported to the site to increase construction speed and reduce costs [18,19]. Prefabrication is considered a cleaner production approach that reduces waste and increases the efficiency of natural resources and human capital, resulting in fewer environmental emissions and greater productivity [20].

1.2. Related Studies

Juan-Valdés et al. (2020) found that incorporating ceramics as secondary materials in recycled concrete yields a comparable performance to conventional concrete within 28 days. This concrete is attributed partly to its pozzolanic characteristics (derived from industrial byproducts) and a reduced effective water–cement ratio. Such behavior underscores the potential for reusing these materials and their possible contribution to the circular economy [21]. Ussa and Poveda (2015) explored the use of construction waste in concrete mixtures for paving applications. However, the authors noted that the resulting products exhibited low mechanical strength and lacked impermeability, posing challenges that could be addressed through pre-laboratory experimentation to optimize research approaches [22].
Rao et al. (2007) discussed the engineering properties of recycled aggregates and summarized their impact on fresh and hardened concrete properties. Barriers to the wider adoption of recycled aggregate concrete (RAC) are identified, including limited awareness, insufficient government support, and the absence of specifications or codes for the reuse of these aggregates in new concrete [23]. Wagih et al. (2019) investigated the RAC properties by crushing and grading concrete rubble from various demolition sites and landfills in Cairo. Aggregates were utilized, including natural sand, dolomite, and crushed concrete from diverse origins. Fifty concrete mixes were divided into eight groups to examine the influence of recycled coarse aggregate quality/content, cement dosage, superplasticizer use, and silica fume incorporation. Tests conducted encompassed compressive strength, splitting strength, and elastic modulus evaluations. Findings indicate that concrete rubble can be effectively transformed into viable recycled aggregate suitable for numerous structural concrete applications in Egypt. The results exhibited notable reductions compared to natural aggregate concrete (NAC) blends comprising 75% NAC and 25% RCA, demonstrating no significant alterations in concrete performance [24].
Similarly, Bravo-German et al. (2021) recently incorporated recyclable aggregates from pavement (RAP) waste into concrete mixtures, considering different experimental conditions. The results showed that up to 50% of the weight of the fine and coarse aggregate fractions in concrete can be replaced with recycled aggregate, which does not significantly affect its mechanical behavior [25]. Furthermore, García-León et al. (2023) developed an experimental study to improve the mechanical properties of a concrete cobble using recyclable additives (clay and ash). The results showed that adding additives to the concrete mix was possible, increasing the paving cobble’s compressive strength [26].
In the case of non-biodegradable materials, Di Marco Morales (2015) carried out research using polyethylene terephthalate (PET) plastic fibers to evaluate the mechanical behavior of biomaterials with the incorporation of this material in different lengths. The results indicated that adding PET addition to the concrete mix at 35% by volume significantly improves the mechanical strength of the concrete. Akinyele et al. (2020) explored the potential reuse of PET as an additive to clay in fired bricks. PET was blended with lateritic clay at varying concentrations (0, 5, 10, 15, and 20%), and the resulting bricks were fired in a kiln at approximately 900 °C for 48 h. Subsequent testing assessed the samples’ water absorption, firing shrinkage, density, and mechanical properties [26]. Findings revealed that bricks containing 15 and 20% PET disintegrated at high temperatures, while lower concentrations led to deformation at the edges. Samples with 0, 5, and 10% PET exhibited compressive strengths of 5.15, 2.30, and 0.85 N/mm2, respectively, with corresponding modulus of rupture values of 13.20, 11.96, and 8.53 N/mm2. Water absorption rates for these samples ranged from 6.57 to 10.29%, falling within acceptable limits. Conclusions exposed that PET content below 5% can be incorporated into fired bricks under controlled conditions.
Authors like [27,28] have also used PET to produce recyclable biomaterials in pavements. These studies have shown that this type of material has good compression behavior and is suitable for applications in civil engineering. On the other hand, Gamba (2015) used recycled rubber particles in the concrete mixture to manufacture biomaterials. However, due to the low adhesion of the particles to the concrete, a low density was obtained in the biomaterials, and values were similar to those of concrete without the addition of rubber particles [29].

1.3. Aim of This Work

This work aims to establish the mixing design of a mortar for the creation of a concrete panel with the addition of recycled microplastic and CDW under different mixing percentages to determine the correct combination of materials in compliance with the specific technical requirements for concrete panels, identifying proportions of fine aggregate, CDW, and the water/cement ratio, also considering the Colombian earthquake-resistant construction regulation NSR-10 for non-structural walls (panels) [30], the Colombian technical standard NTC-4024 precast concrete [31], and the Colombian technical standard NTC-3459 [32].

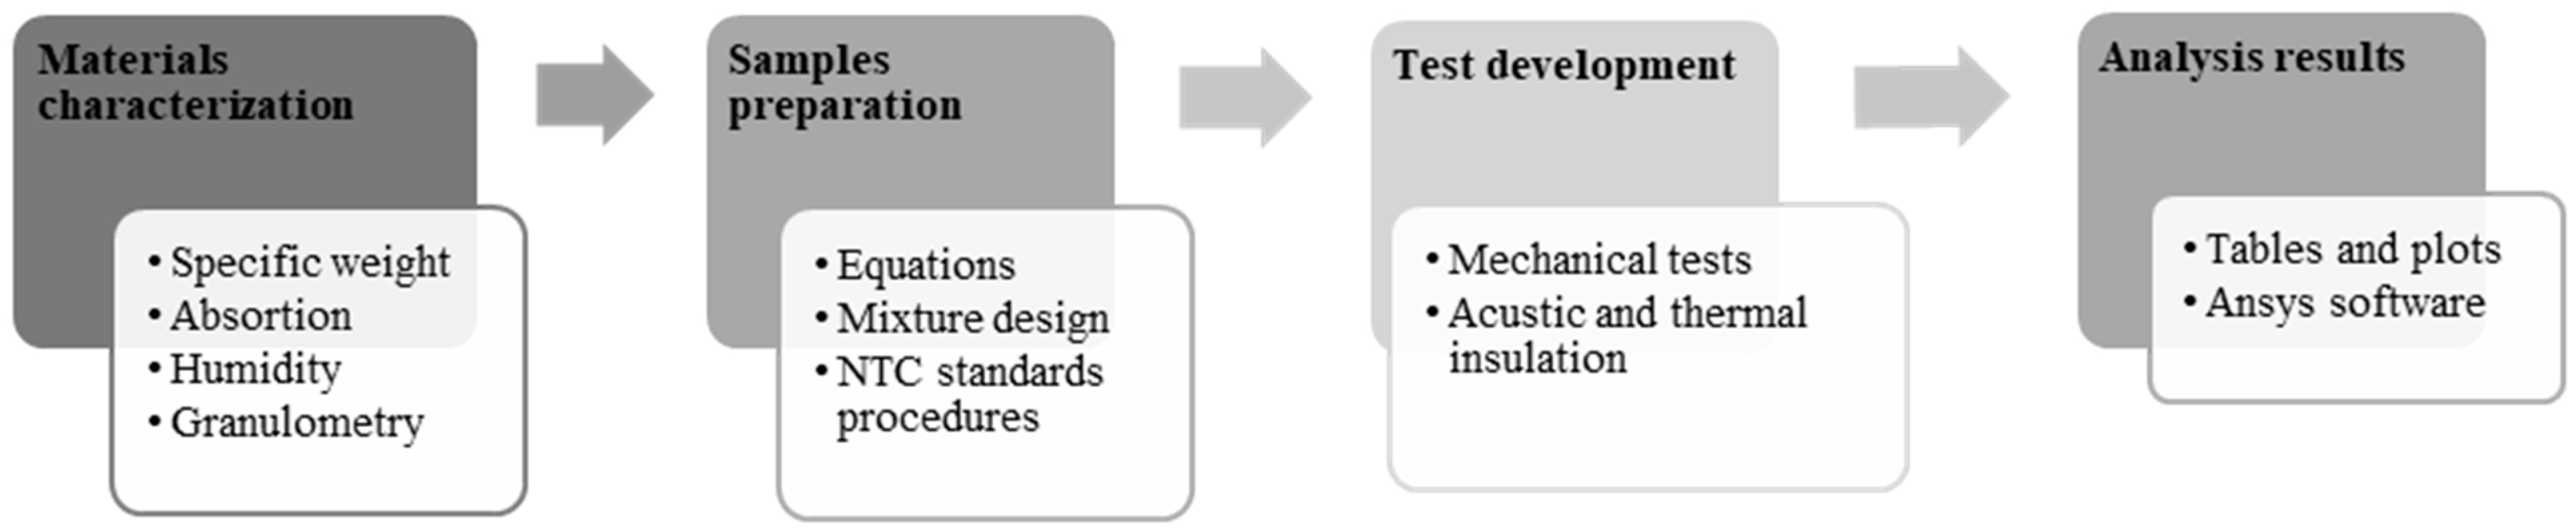
2. Materials and Methods

The materials used to determine the mix design of a mortar with CDW and PET as fine material (river sand) and CDW were obtained from the CTA plant in the municipality of Abrego, Norte de Santander, Colombia (8°04′39″ N 73°13′09″ O), and the company INDURAL S.A of Vereda Portachuelo, Girardot, Antioquia, Colombia (6°22′37″ N 75°26′46″ O).
As part of evaluating the mechanical properties of the materials (mechanical characterization), the following laboratory tests were developed considering the current standards in force and the guidelines required for correct data collection. For this purpose, Figure 1 shows a description of the experimental process carried out in this work, taking into account what was proposed by [33,34,35,36]. The experimental development consists of three stages: (1) characterization of the materials (specific weight, absorption, humidity, and granulometry), (2) manufacturing of mortar specimens, (3) carrying out resistance tests on mortar cylinders (dosage selection), and (4) analysis of results. Notice that the tests were repeated at least three times and carried out in the materials resistance laboratories, geotechnics laboratory, and mechanics laboratories of the Francisco de Paula Santander University in Ocaña Norte de Santander and the chemistry and physics laboratories of the Pontificia Bolivariana University and the university EAFIT. These tests were developed following the guidelines of the Colombian technical standard NTC-1776 [37] (test methods to determine the total moisture content of aggregates by drying), NTC-77 [38] (methods for analysis by sieving of fine aggregates), and NTC-237 [39] (methods for determining the density and absorption of fine aggregate).
The precise measurement and composition of various components are critical for achieving the desired structural integrity and performance in construction materials. The equations presented herein offer a systematic approach to calculating the volume of primary materials in mortar mixtures, mainly focusing on cement, water, air, and the innovative inclusion of recycled polyethylene terephthalate (square PET samples of 2 × 2 mm). Equations (1) to (5) delineate the volume calculations for each component, considering factors such as cement amount, water ratio, air content, and PET density and providing a comprehensive framework for understanding and quantifying the contributions of each constituent in mortar formulations. Furthermore, Equation (6) offers a practical application of these volume calculations by determining the sand-to-cement ratio, a crucial parameter influencing mortar mixes’ mechanical properties and workability. This ratio facilitates informed decision-making in material selection and mixture design by leveraging sand’s relative density and other components’ volumes [11].
V o l . C e m e n t = C e m e n t   a m o u n t   ( M o r t a r   3000   p s i ) S a n d   f i n e n e s s   m o d u l u s
V o l . W a t e r = C e m e n t   a m o u n t M o r t a r 3000 p s i × W a t e r   r a t i o   c e m e n t
V o l . A i r = 3.5 %   o f   c e m e n t   w e i g h t
V o l . P e t = 5 %   c e m e n t   w e i g h t P E T   d e n s i t y
V o l . S a n d = 1 V o l . C e m e n t + V o l . W a t e r + V o l . A i r + V o l . P E T
Considering the above, it is possible to determine the sand/cement ratio using Equation (6).
R a t i o . S a n d / C e m e n t = R e l a t i v e   d e n s i t y S a n d × V o l . S a n d C e m e n t   a m o u n t M o r t a r 3000 p s i × 1000
Notice that the characteristics of PET particle sizes and amounts play a crucial role in determining the overall physical properties, workability, density, thermal properties, and aesthetic appearance of concrete blocks. Proper selection and control of particle sizes are essential to achieve desired performance and meet specific application requirements. Finally, the homogeneous mixture composition was established after a rigorous experimental process (the larger the number of PET particles, the more the mechanical resistance decreased) was analyzed.

2.1. Cylinders for Compression Resistance Testing

Compressive strength test cylinders are devices used in the construction and civil engineering industry to evaluate the ability of a material, such as concrete or mortar, to resist compressive forces. These cylinders are molded from fresh material samples and subjected to specific curing conditions before laboratory compression testing. This test is developed to determine the proportion resistance used in the mixture design.

2.2. Mixture Preparation

The mixture was prepared according to the quantity specifications established in Table 10; then, some steps were taken into account: the state of the site where the mixture was cleaned and verified so that no external material interfered with the quantities. Each material was weighed, with the exact value obtained in each dosage. The materials were arranged at the selected site and later mixed. After that, water was added, and the mixing process continued until a homogeneous mixture was observed (see Figure 2).
Firstly, the settlement verification was carried out through slump, which consisted of depositing the mixture in the cone, dividing the amount into three equal layers, and with the help of a smooth rod, each of these was tamped 25 times to settle the mixture and eliminate air particles. Once this step was completed, the excess material was removed from the upper part of the cone, and in this way, we proceeded to measure the settlement of the sample based on the height of the cone. Afterward, the mixtures in the cylinder were divided into two layers, and each of them was tamped 25 times with the help of the rod and with a rubber mallet; each was hit 25 times to settle the mixture and eliminate air bubbles. Once this process was finished, the cylinder’s upper part was cleaned so as not to alter its shape. Finally, each of the samples was numbered to identify its dosage. Finally, after 24 h of preparing the samples, the formwork was removed, keeping in mind that the dimensions of the material should not be altered. After removing the samples from their respective mold, the cylinders were placed in a barrel for subsequent setting and curing.

2.3. Compression Resistance Test

In this test, a sample of the material, typically in the form of a cylinder or cube, is subjected to a gradually increasing compressive force until it ruptures. The compression test with mortar cubes made from construction and demolition waste (CDW) follows a standardized procedure to assess the compressive strength of the mortar, considering the following steps: (1) sample preparation by combining the CDW aggregates, cement, water, and any other additives or admixtures according to the desired mix design. (2) Molding of cubes, preparation of the cube molds by cleaning them and applying a thin layer of mold release agent to prevent sticking. Then, fill the cube molds with the freshly mixed mortar, ensuring that each mold is filled without trapping air bubbles. Compact the mortar in the molds using a mechanical compaction apparatus to achieve uniform density and eliminate voids. Strike off the excess mortar from the top of the molds using a straight edge to obtain a smooth surface. (3) Curing, immediately after molding, cover the filled molds with a plastic sheet to prevent moisture loss. This allows the mortar cubes to cure in a controlled environment at a specified temperature and humidity for the prescribed curing period, typically 24 h in water at 20 ± 2 °C. Finally, (4) Testing after the curing period, remove the mortar cubes from the molds and visually inspect them for any defects or damage, its important repeat the testing procedure for multiple cubes to obtain a representative average compressive strength value for the mortar mix.
Notice that the force applied is measured in relation to the cross-sectional area of the specimen, resulting in a stress measure, usually expressed in units of pressure. This test was carried out 28 days after the sample, verifying the height, diameter, and weight of each one because these values are necessary to calculate the resistance supported by the sample. With the mixture design, a resistance of 21 MPa is expected at 28 days.

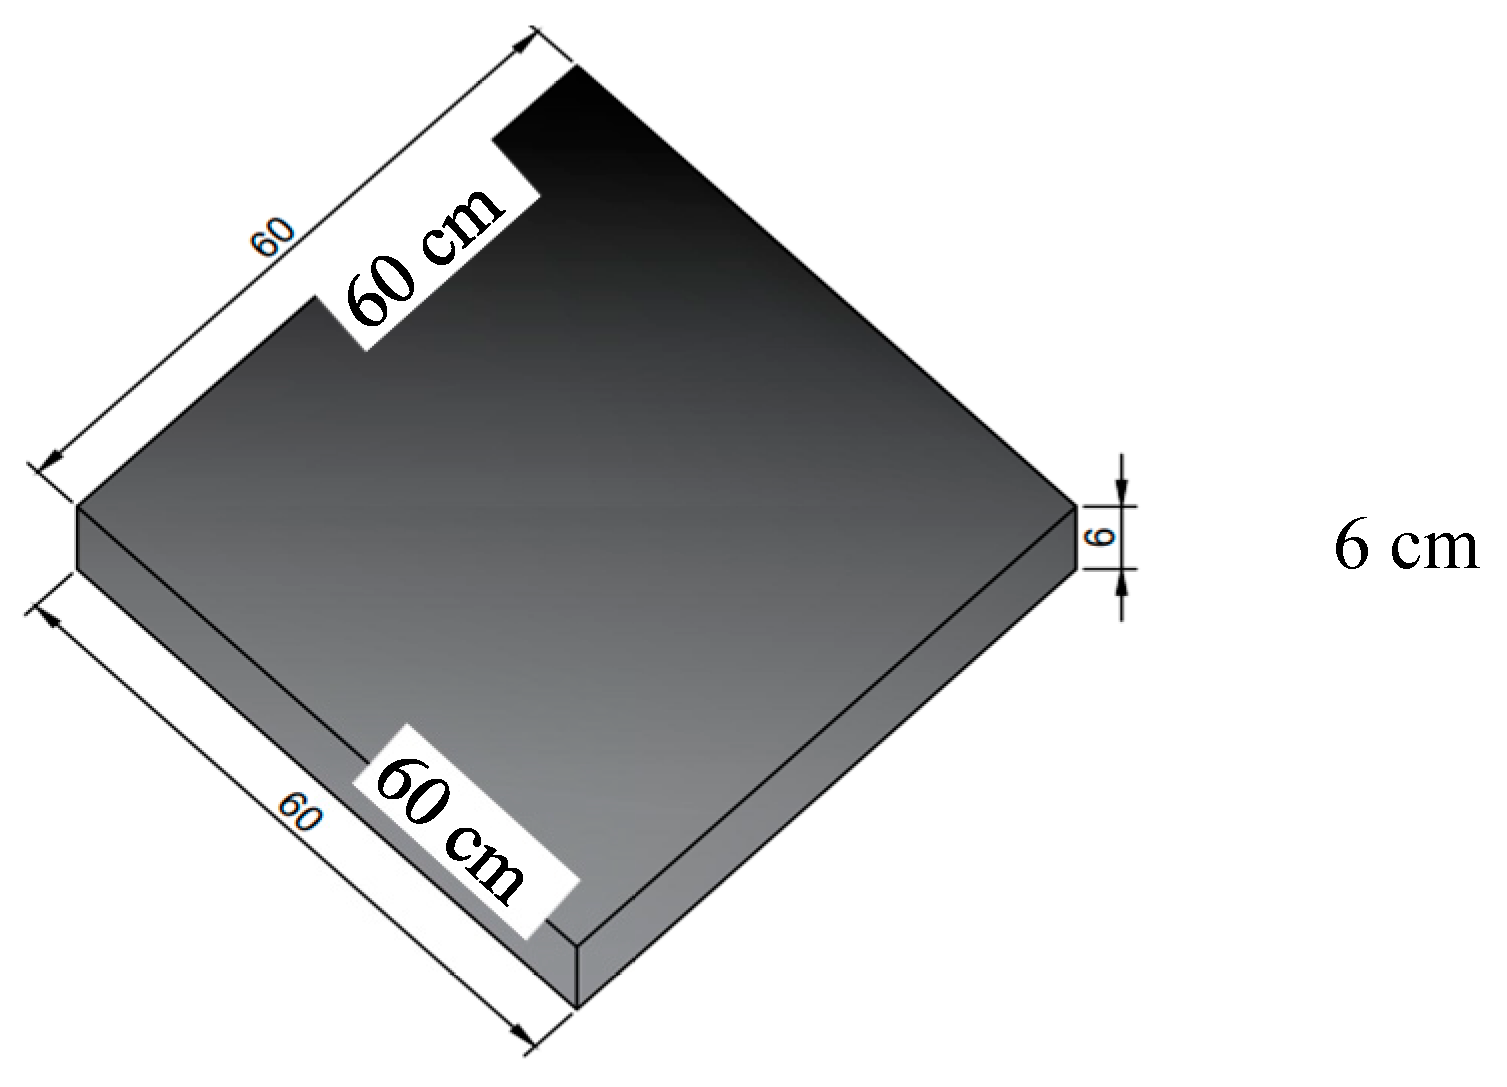
2.4. Development of the Concrete Partition Panel with the Addition of CDW and PET

The panel is designed with 20% CDW since it is the ideal mixture to achieve maximum compression resistance and better weight conditions (before a large experimental work related to the mixture homogeneity). The dimensions of the panel are determined, calculated from 15 kg of cement, 74.57 kg of sand, 0.75 kg of PET, 8.7 kg of water, 38.06 kg of washed sand, and 9.51 kg of CDW to obtain a panel of 60 × 60 × 6 cm, as is evident in Figure 3.

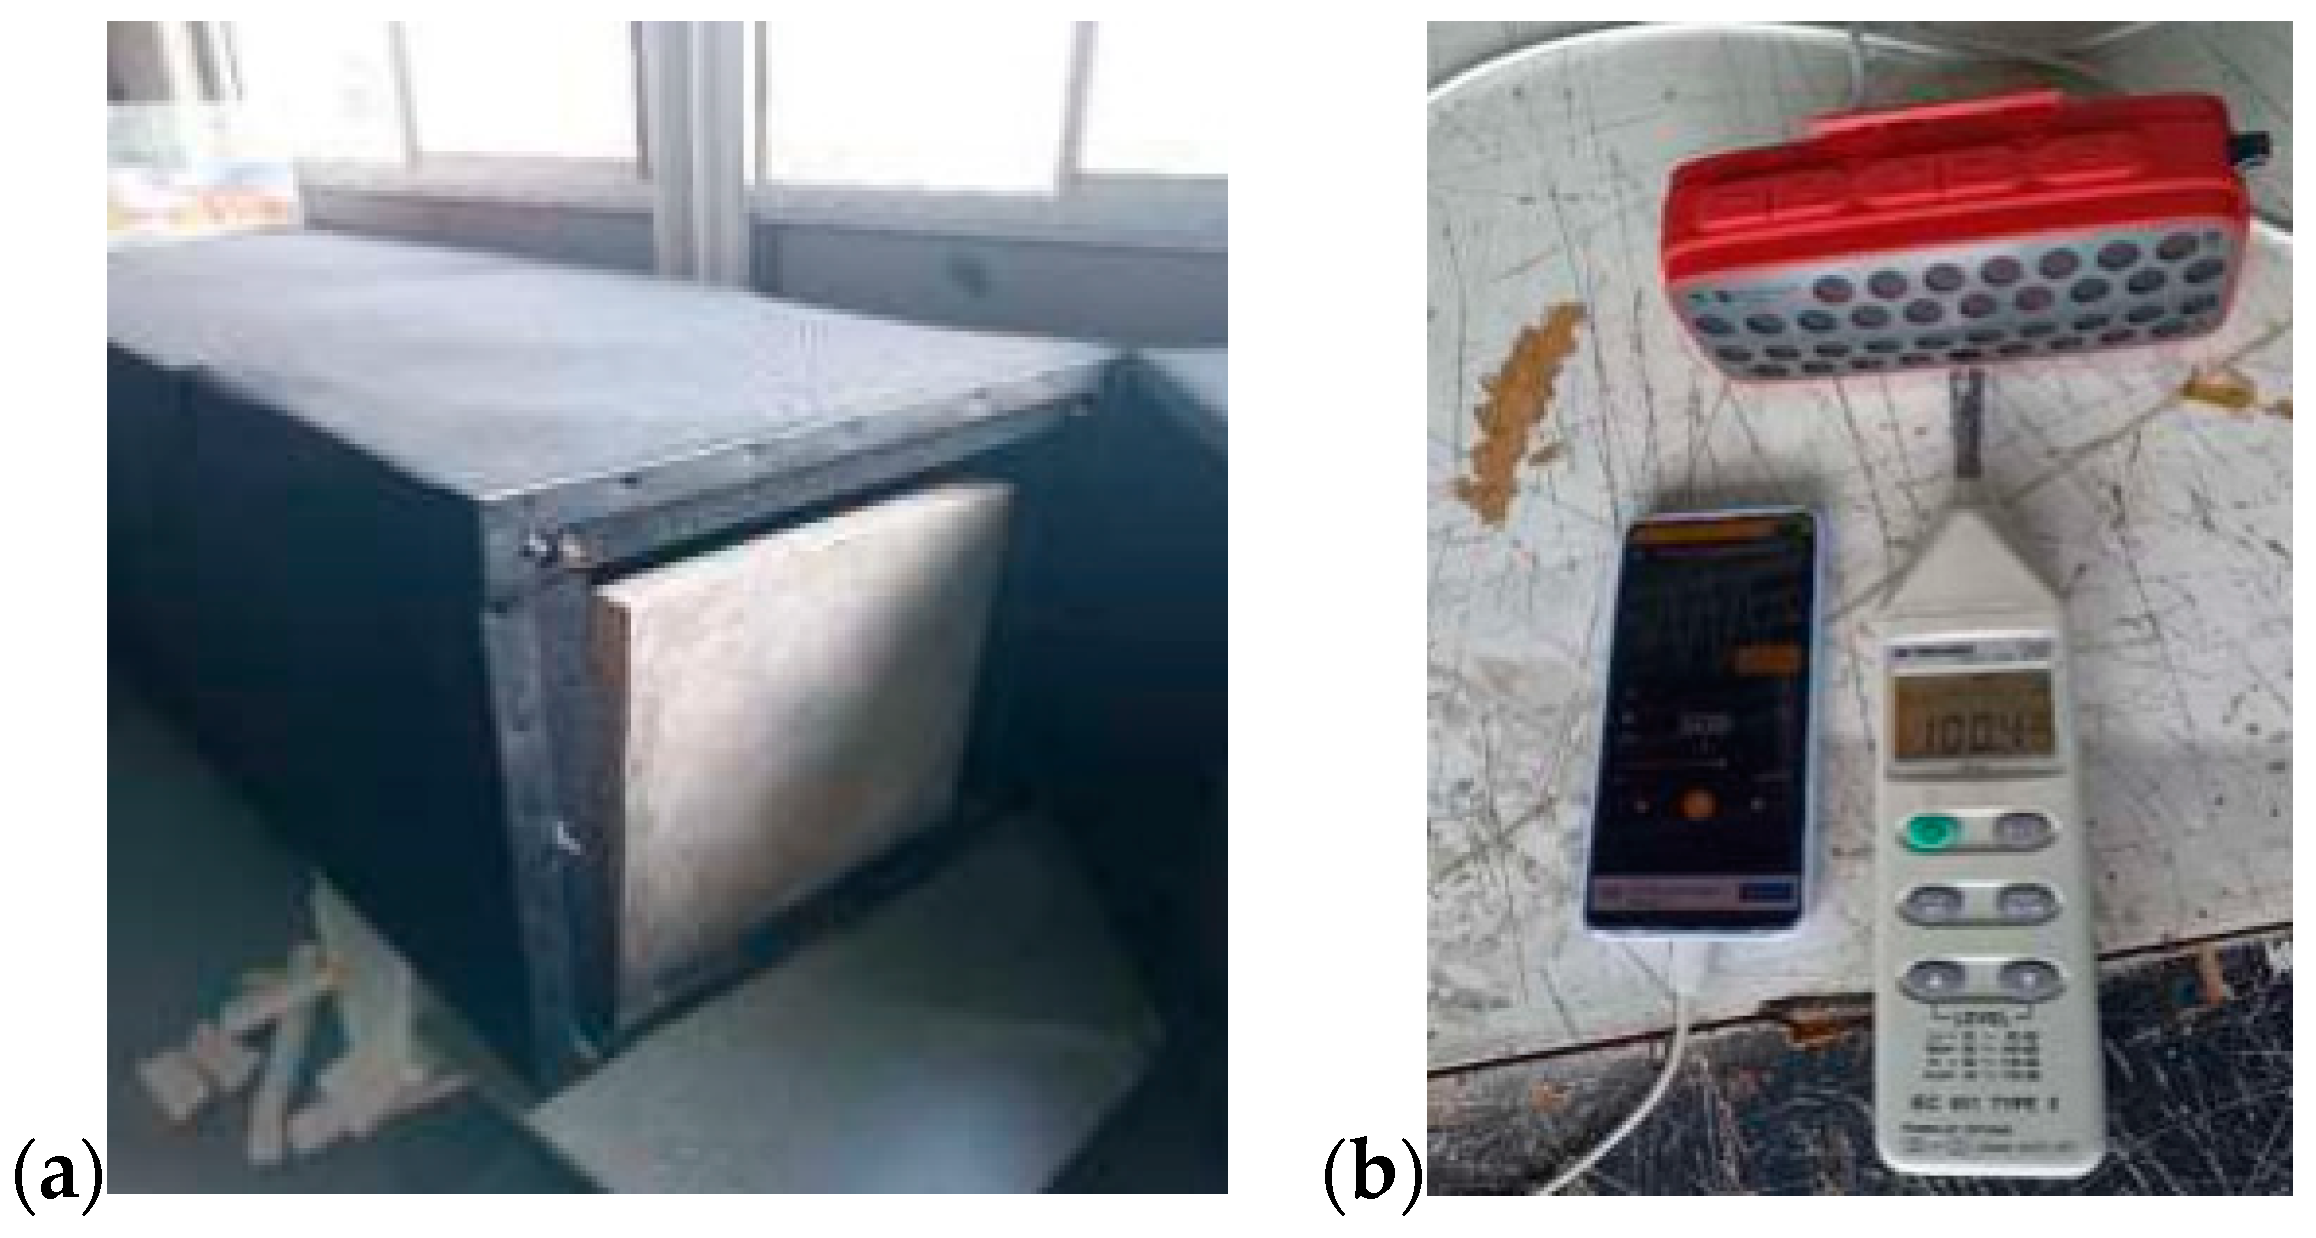
2.5. Thermal and Acoustic Tests

The thermal test allows the analysis of how the compounds react as a function of time and temperature and also establishes the panel’s contribution to reducing the temperature inside the space. A cardboard duct was made to prevent heat leaks from a Haceb brand electric stove, which increased temperature. Where Hobo-type temperature sensors were installed in the lower and upper area of the dividing panel, which allows recording measurement values that can be read through the Hoboware software, an interval of 5 min for 1 h was selected, providing results of the temperature data and relative humidity percentages in said intervals. On the other hand, the acoustic test evaluates the increase or decrease in decibels by applying various frequencies. The test was carried out in a hermetic acoustic tunnel, where sounds were emitted at various frequencies from the rear end of the duct to the panel located at the front end of it, 5 different frequencies were worked on, measured in the Hertz unit, with intervals of 500 Hz per test, the minimum value was 500 Hertz, and the maximum value was 3000 Hz.
On the other hand, the test was conducted in a hermetic acoustic tunnel (see Figure 4) constructed of wood and covered with an acoustic fabric. This fabric comprises foams that regulate and isolate the tunnel’s interior from external sound waves. The tunnel has two anechoic chambers: one in the frontal zone, which is the measurement point, and one located in the lateral zone, which allows for the sound source to be located to conduct the test. The sound source used for the test was created using a homemade amplification system, in this case, a portable speaker, and the frequency units in Hertz were controlled through the digital frequency generator application. The measurement was carried out using an IEC 651 TYPE II sound level meter, considering the guidelines of the ASTM C518 [40] and ASTM E413 [41] standard procedures.
It is important to mention that the sound level meter calibration started at 100.4 decibels. When executing each test and increasing the sound frequencies, the sound level meter should be calibrated as close as possible to that value. After performing this exercise, the sound level meter is placed in the frontal zone of the acoustic tunnel, positioned using the camera, with the sound source in order, followed by the recycled concrete dividing panel, and finally, the sound level meter, which will be the device that allows obtaining the results in decibels of the sound intensity that passes through the panel. Notice that low and high sounds were used. Also, the temperature for acoustic tests is typically maintained within a range of 20 to 25 °C. However, thermal tests were performed until 200 °C to assess performance across various conditions. For both cases, the humidity levels were between 40% and 60%, commonly recommended to prevent excessive moisture absorption or drying of materials, which could affect sound absorption or reflection properties.

3. Results and Discussions

3.1. Specific Weight and Absorption of Fine Aggregate

The results obtained from the specific weight and absorption tests carried out on the river sand samples from the CTA plant in Abrego City reveal a relative density of 2.598 and an absorption of 2.52 (Table 1).
The results of specific weight and absorption of the washed sand product of the CDW present a relative density of 2.44 and an absorption percentage of 5.88 (Table 2).

3.2. Fine Aggregate Moisture

The results of the humidity tests of the river sand and the CDW are shown in Table 3. The river sand has a humidity of 13.59 and 8.46% of the CDW, which are fundamental data to determine the mixture design.

3.3. Granulometry of Fine Aggregate

Table 4 and Table 5 contain the results of the granulometry test of the fine river sand materials and the washed CDW product sample. The data obtained in the sieving of the materials are observed, which allows for identifying the size of the particles and sediments present in the sample and the weight and percentage of material retained in each sieve. In this way, it will be determined that the material is within the parameters established in the technical specifications.
In Figure 5 and Figure 6, the particle trend sizes and sediments of the river sand and CDW materials are graphically represented, along with the percentage of particles that pass from one sieve to the other, which is evaluated to the limits established in the specifications.
In the results obtained, the differences between the particle sizes of the river sand traditionally used in construction and the CDW sand can be observed, where the particle sizes of the CDW tend to be larger due to their origin.

3.4. Mixture Design

Considering the data obtained on relative density (Table 1 and Table 2), the density and absorption of river sand and CDW sand, respectively (2.598 and 2.526%)—(2.44 and 5.88%), the percentages of these. Once these data are obtained, we vary their percentage, depending on the amount of sand from construction and demolition waste (CDW) to develop the test. The distribution was done as shown below for each condition:
Relative density (specific gravity) in saturated and superficially dry condition (SSS) (0% CDW) = 100% Relative density (specific gravity) in saturated and superficially dry condition of river sand.
Relative density (specific gravity) in saturated and superficially dry condition (SSS) (10% CDW) = 90% Relative density (specific gravity) in saturated and superficially dry condition of river sand + 10% Relative density (specific gravity) in saturated and superficially dry condition of CDW sand.
Relative density (specific gravity) in saturated and superficially dry condition (SSS) (20% CDW) = 80% Relative density (specific gravity) in saturated and superficially dry condition of river sand + 20% Relative density (specific gravity) in saturated and superficially dry condition of CDW sand.
Relative density (specific gravity) in saturated and superficially dry condition (SSS) (30% CDW) = 70% Relative density (specific gravity) in saturated and superficially dry condition of river sand + 30% Relative density (specific gravity) in saturated and superficially dry condition of CDW sand.
In Table 6, it is possible to observe the results of the CDW with a variation in the percentages according to the mixture design.
CDW percentages vary between 0 and 50%. Because the literature mentions that fine recycled concrete aggregates can be used in a percentage of no more than 50% to obtain high values of resistance and modulus of elasticity [42]. In this way, the mechanical performance of the new concrete is not compromised due to the adhesion of the aggregates, presenting mechanical properties like a reference mixture produced with natural aggregates. The data to determine the mix design, with an expected strength of 3000 PSI—21 MPa, is presented in Table 7. The sand fineness modulus is a measure of the fineness of the sand particles in a concrete mixture, which is calculated based on the cumulative percentages of sand retained on each of a specified series of sieves. Then, to obtain the sand fineness modulus for a given concrete mixture, the sand is passed through a series of sieves of different sizes, and the amount of sand retained on each sieve is measured. The cumulative percentages of sand retained on each sieve are then calculated, and these values are used in the formula to determine the fineness modulus. It is important to note that the sand fineness modulus, along with other mix design parameters such as water-cement ratio and cement density, influences the mechanical properties of the concrete, including its strength and durability. Adjusting these parameters allows for optimizing concrete mixtures to meet the desired performance criteria.
The various dosages were calculated using Equations (1) to (5), and each result was summarized in Table 8.
The density values and the volume of sand were considered to determine the sand/cement ratio for each CDW percentage using Equation (6). The results obtained in the sand/cement ratio allow the following designs of the mixture to be determined (Table 9), which are based on the amount of cement. It is necessary to highlight that we work in units of (kg) because, as there is no significant difference between the proportions of each material, this type of unit allows greater precision when incorporating them into the mixture.
Considering the previous data, the proportions were adjusted to the volume of the metal cylinder to determine the quantities to be used; as can be seen in Table 10, it’s possible to observe information on the composition of different concrete mixtures with different CDW percentages, which can be useful to evaluate the potential for using recycled materials in the construction industry and its impact on the quality and sustainability of the concrete produced. Likewise, it was observed that as the percentage of CDW in the mixture increases, the amount of sand decreases while the amount of CDW sand rises [23]. This mixture means that part of the sand used is replaced by sand from CDW. The cement amount, water, and PET remain constant in all cases. With an increase in the percentage of CDW, the proportion of washed sand in the mixture decreases significantly, which can affect the physical and mechanical properties of the resulting concrete. On the other hand, it was observed that as the percentage of CDW increases, the proportion of recycled material in the mixture (CDW sand and PET) increases, indicating greater use of recycled materials in concrete production [40]. Note that the amount of water was kept constant in the mixture despite the different absorption characteristics of river sand and Construction and Demolition Waste (CDW) because maintaining a consistent water-to-cement ratio is crucial for ensuring the desired strength, workability, and durability of the concrete. Also, the PET value constant (0.25) allows us to obtain a good mixture homogeneity.

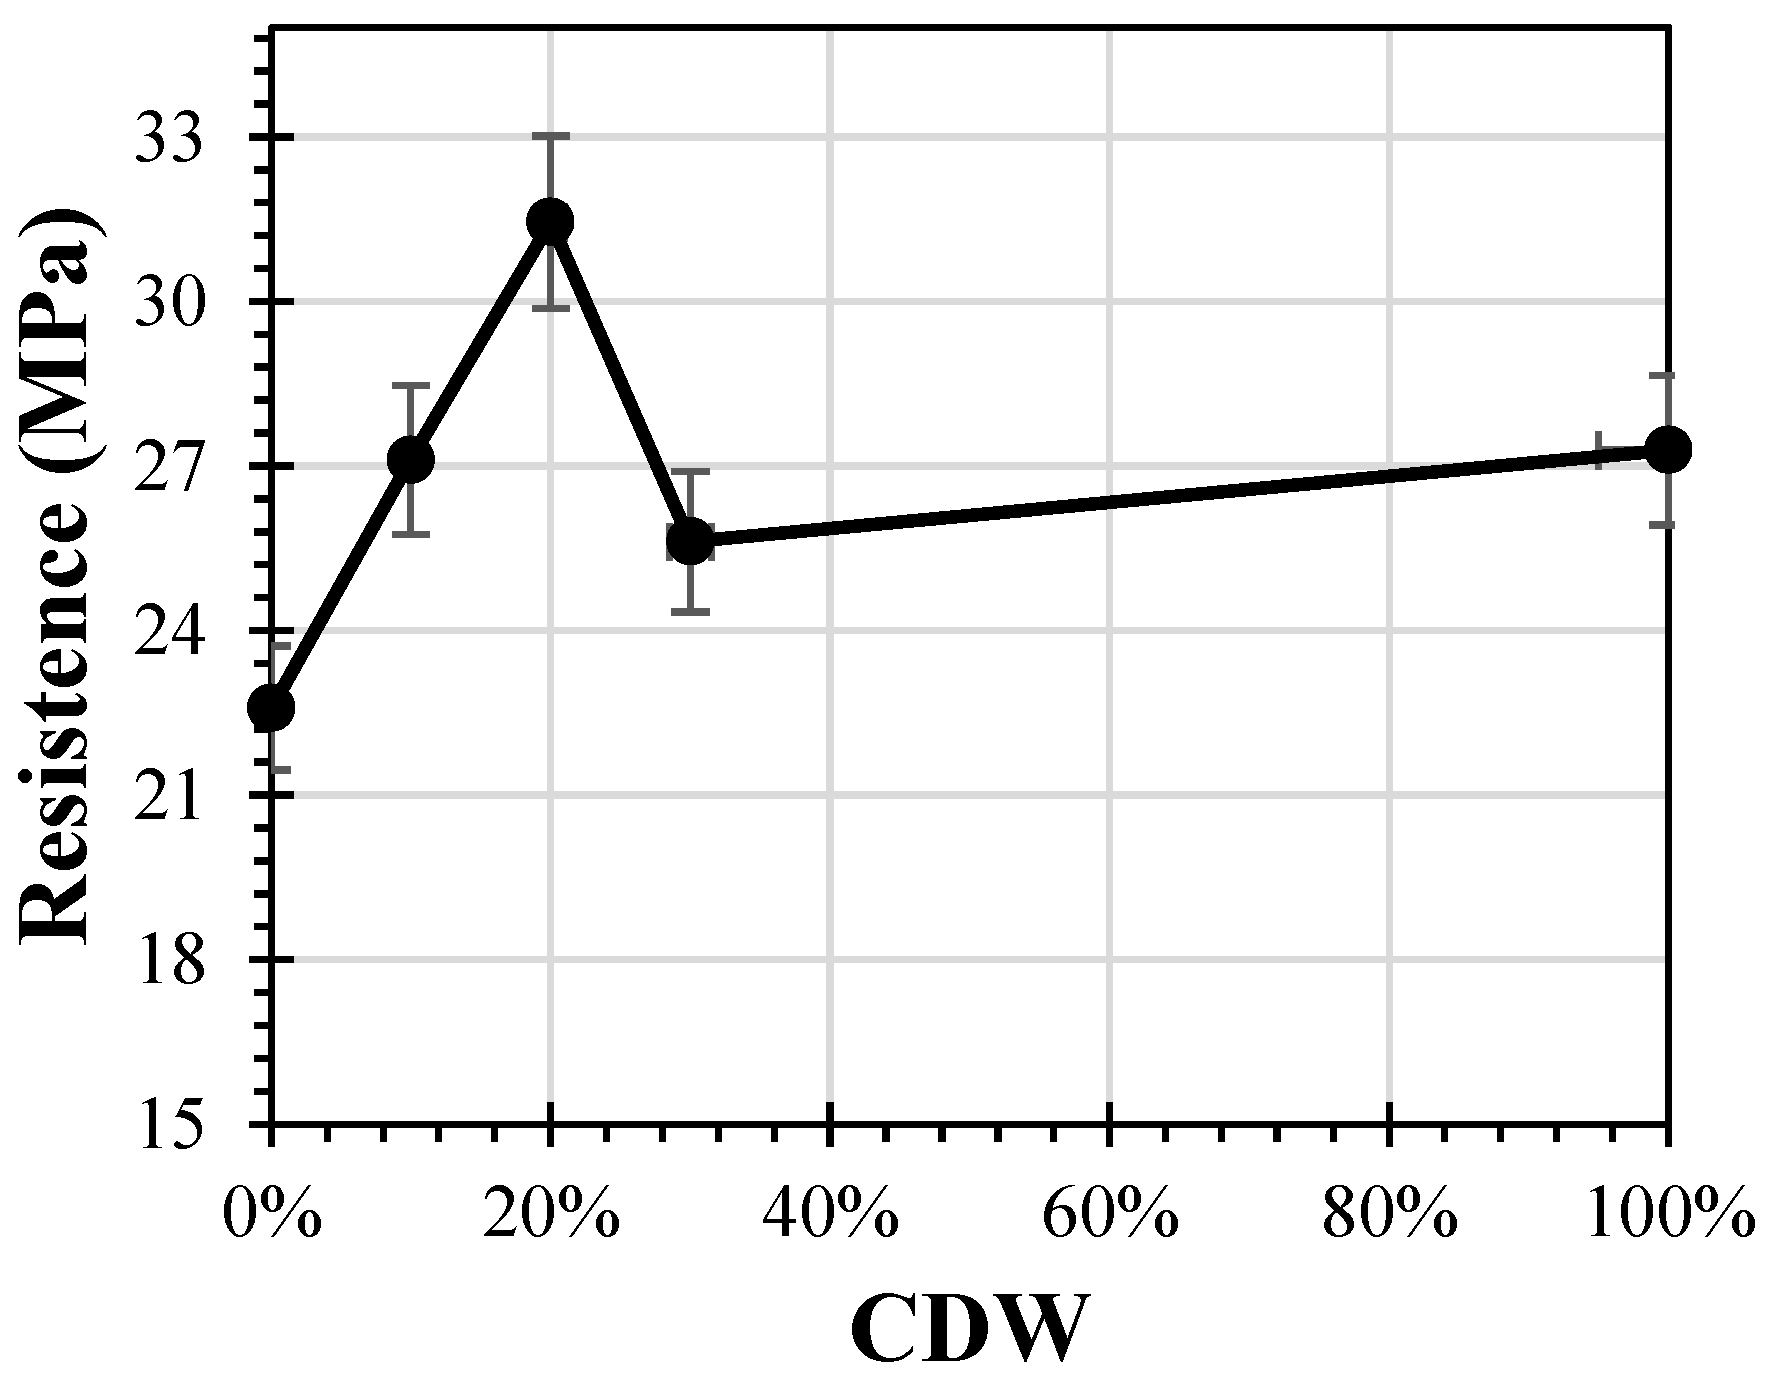
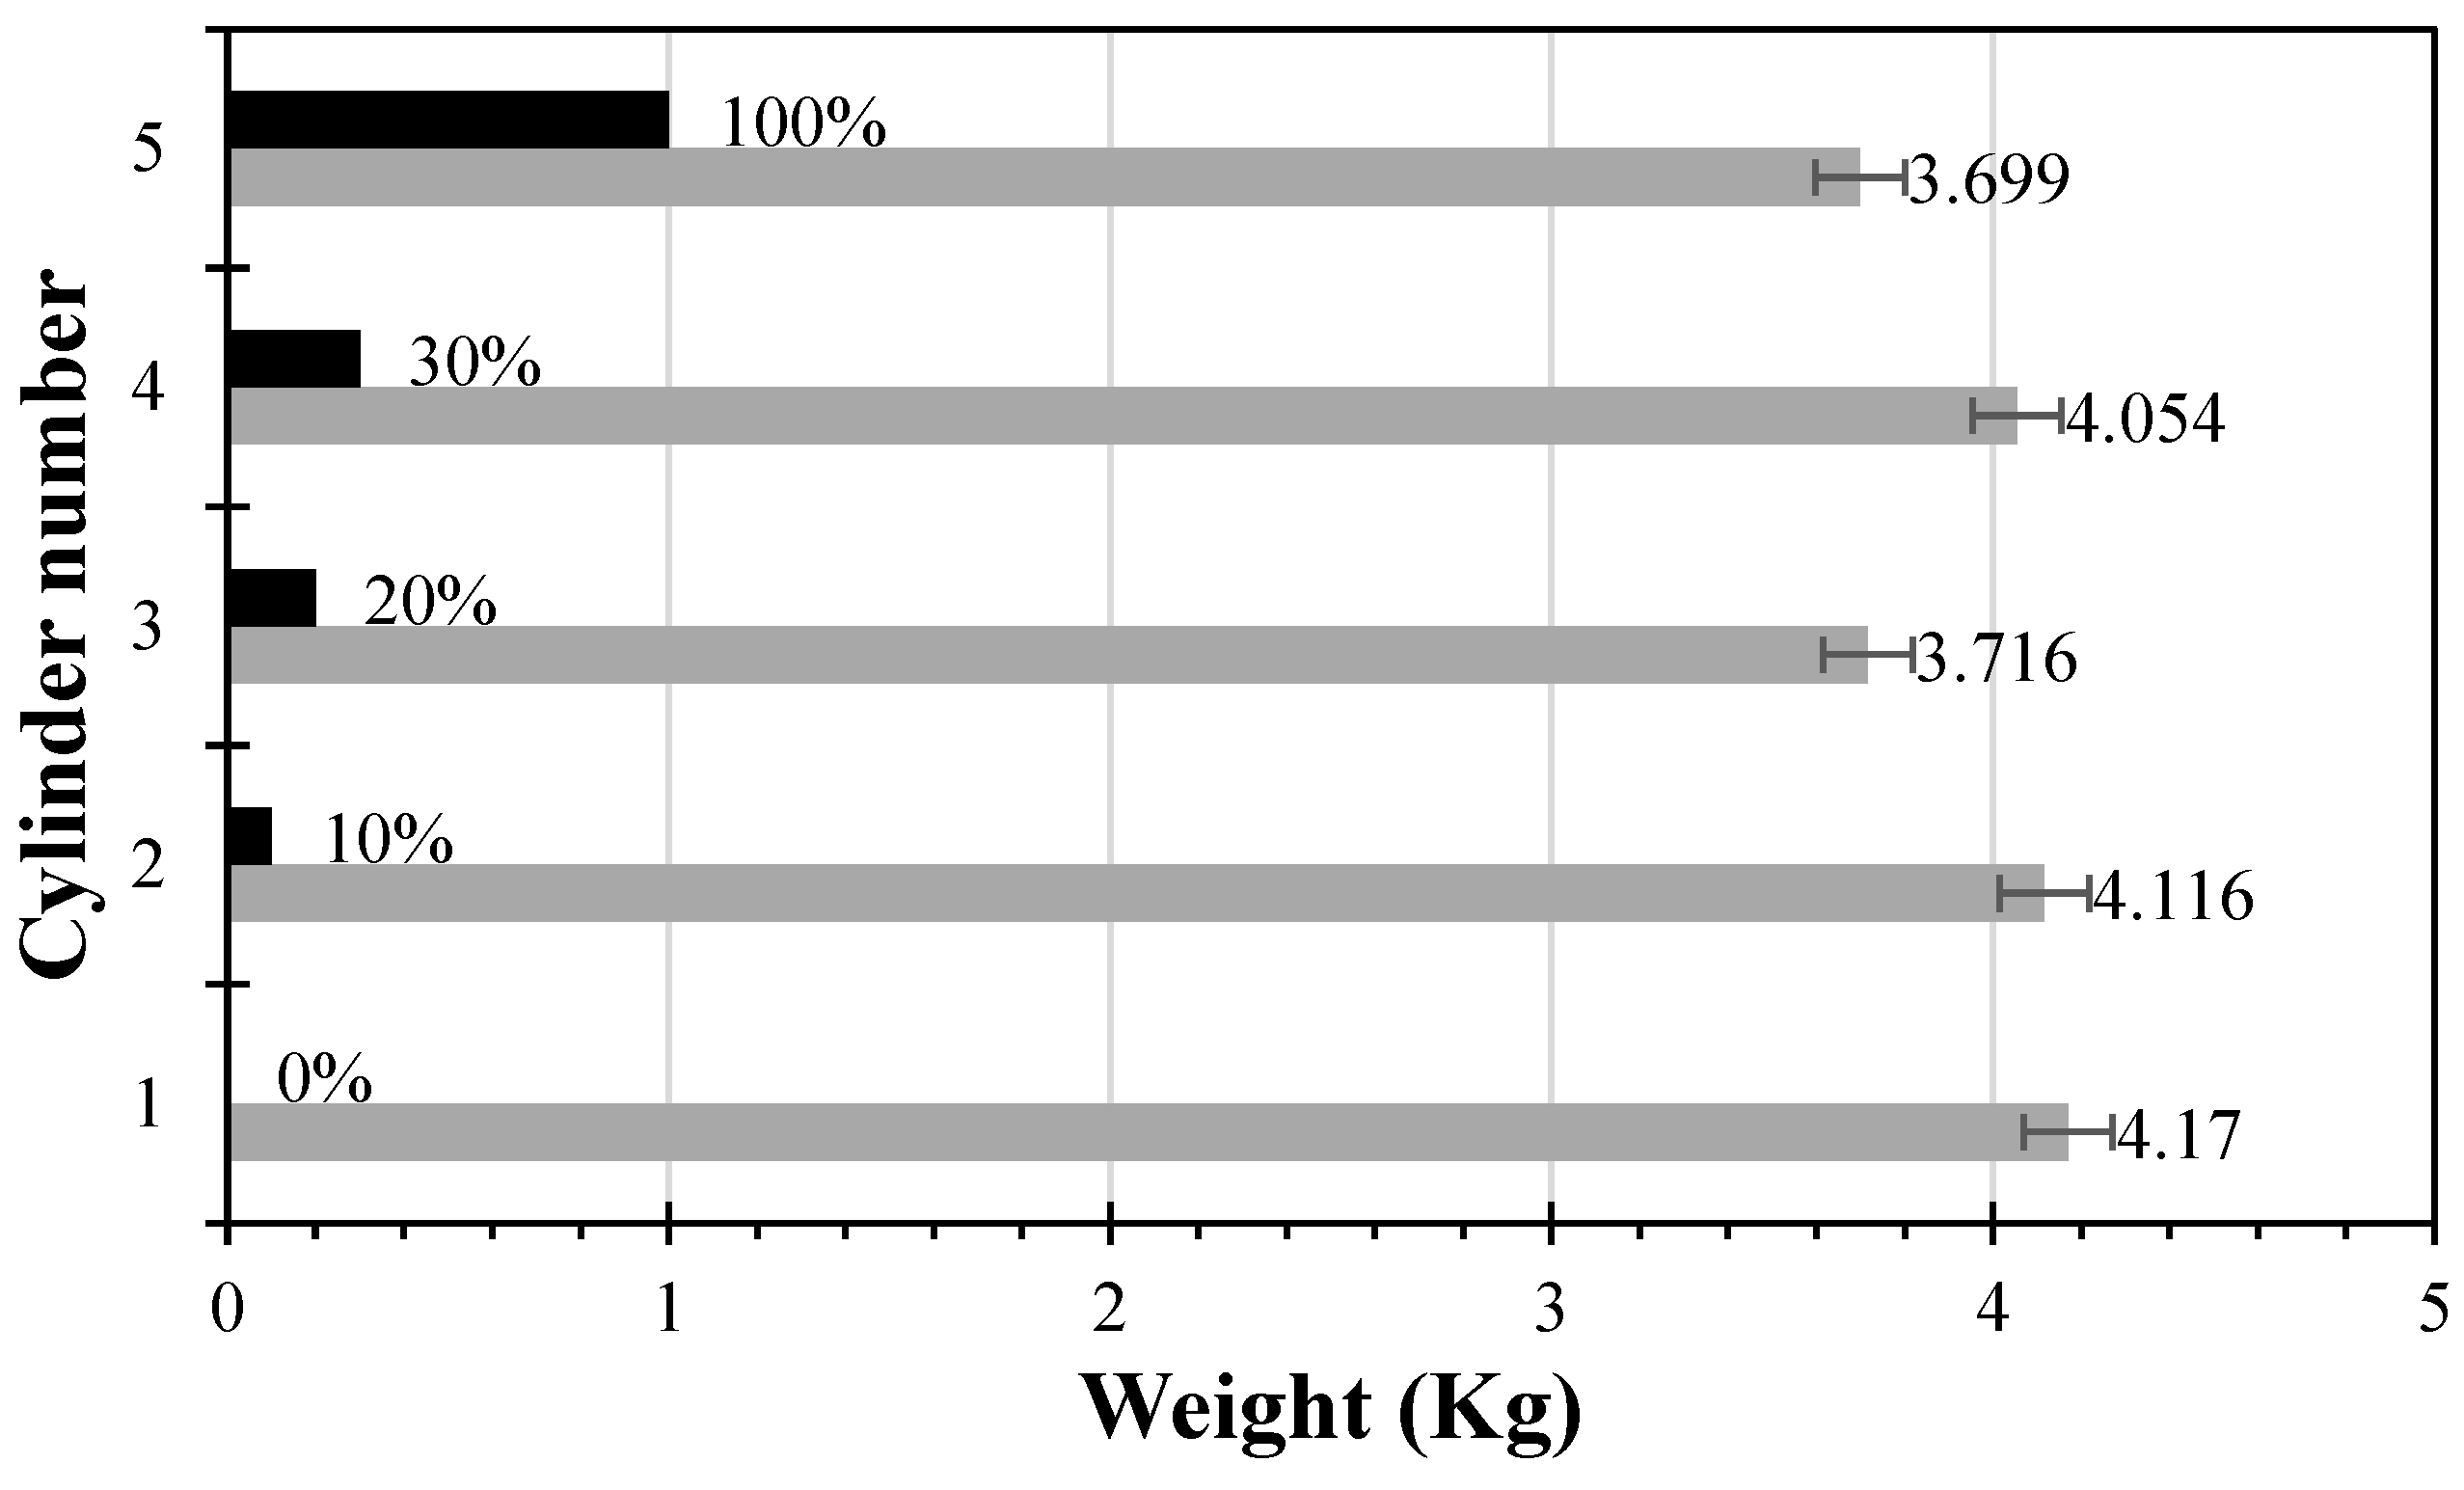
3.5. General Results of the Compression Test

Table 11 shows that resistance at 28 days may exceed the expected resistance in each sample. Likewise, cylinder number 3 has the best conditions since it has a lighter compression resistance than the others. As was observed, the resistance decreased with the inclusion of CDW.
The decrease in weight for cylinder 3 and the increase for cylinder 4 could be attributed to variations in the density of the concrete mixture or differences in the amount of water absorbed during curing. However, potential factors influencing weight variations could include variations in the water-to-cement ratio, differences in compaction during casting, or variations in the density of the aggregate materials. The weight differences observed may impact the overall experiment results, particularly concerning the density and mechanical properties of the concrete specimens. A change in weight could indicate differences in the composition or density of the concrete mixture, which may influence the compressive strength results. The smaller volume observed in cylinder 3 compared to the others may be due to differences in compaction during casting, variations in the density of the materials used, or differences in the amount of air entrapped within the concrete mixture. These factors can influence the overall volume of the cylinder and may contribute to differences in compressive strength results. Further analysis of the experimental conditions and concrete mix design would be necessary to determine the exact reasons for the smaller volume observed in cylinder 3.
The recycled concrete helps to identify the material’s resistance, as evidenced by the However, it was possible to find that the ideal mixture to achieve maximum resistance is to use 20% construction and demolition waste (CDW) (see Figure 7); similar results were obtained by [43]. Note that the microplastic films do not affect the panel’s mechanical resistance, but their thermal and acoustic properties improved significantly. Also, the results are statistically significant because the average error is less than 10%. The variation in the slab’s temperature on the inside could be influenced by several factors, including insulation effectiveness, heat generation, environmental conditions, and heating system operation, which were controlled during the test [44].
On the other hand, a difference can be observed between the %CDW applied, and the weight obtained; concluding, the recycled material reduces the element’s weight compared to a sample 100% made with river material (see Figure 8). Therefore, to guarantee weight (light) and resistance conditions, it was decided to work with the mixture design obtained with 20% CDW. Notice that the black line is the %CDW, and the grey line is the weight of each cylinder evaluated. It’s important to mention that recycled polyethylene terephthalate (PET) bricks are a sustainable alternative to concrete masonry units in construction to mitigate environmental impact while being environmentally friendly [44].

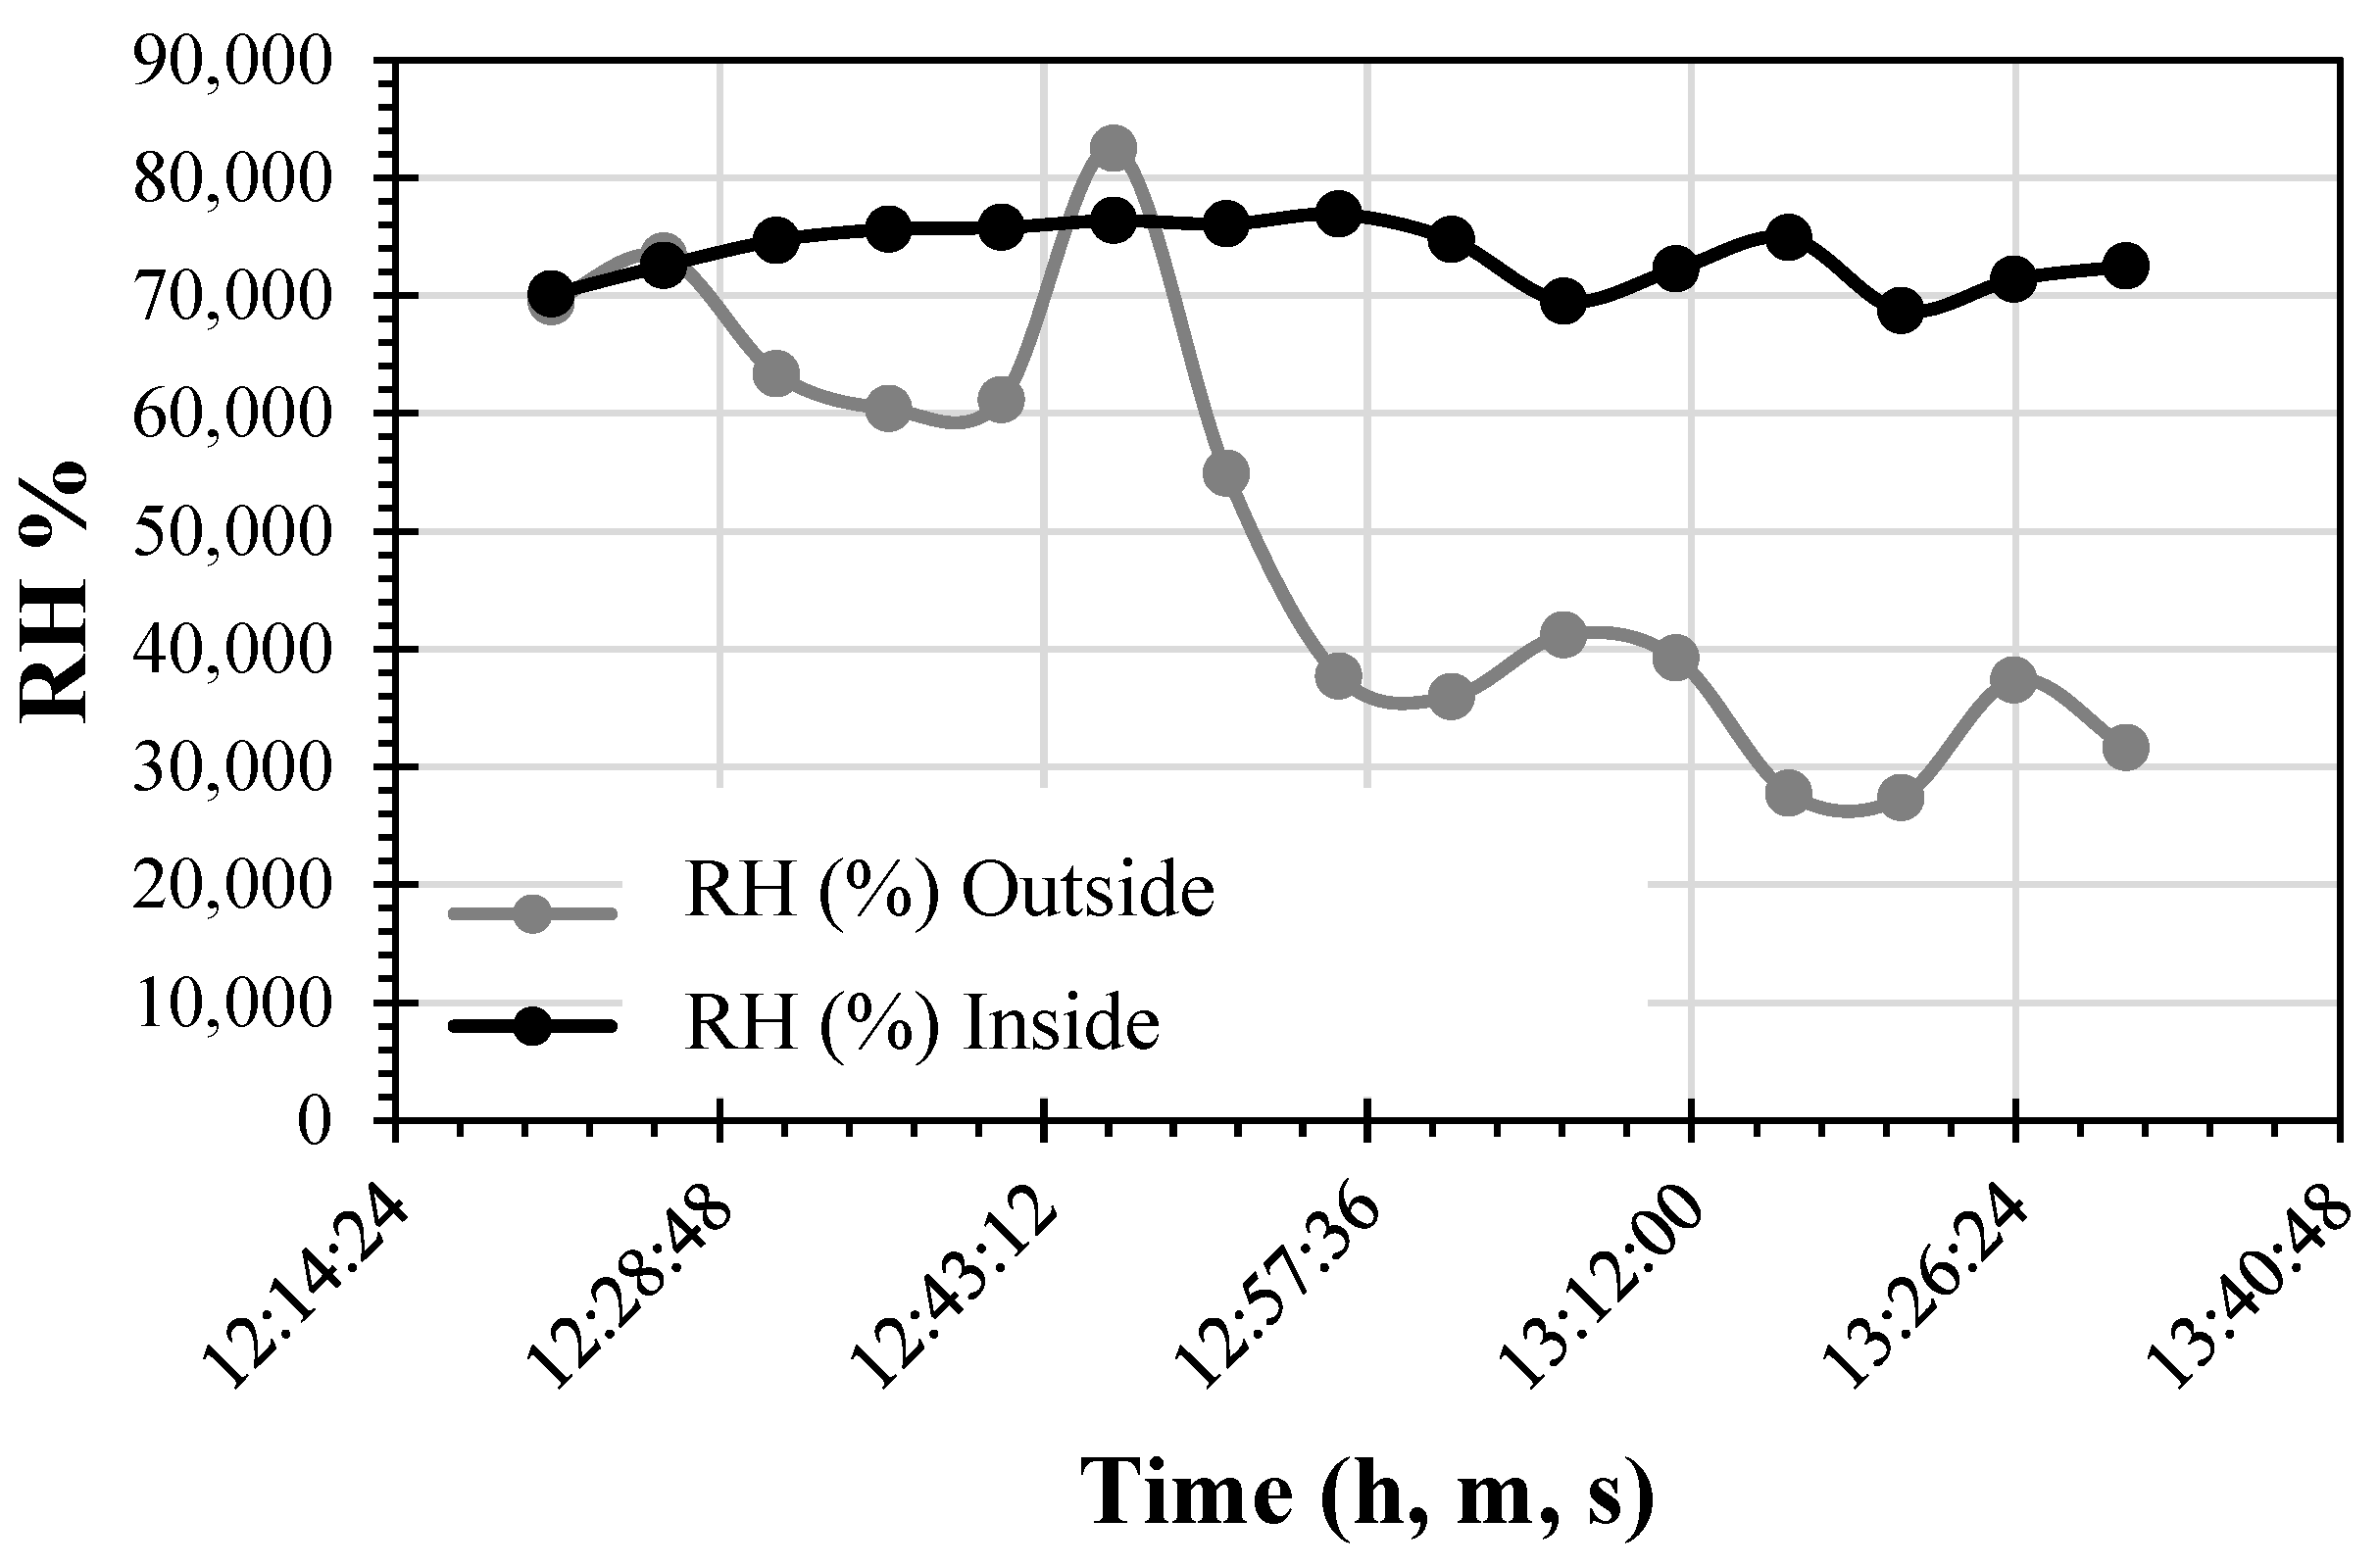
3.6. Thermal Test of the Concrete Partition Panel with the Addition of CDW and PET

Considering information from the World Meteorological Organization, the maximum temperatures to the specific partition panel with the addition of CDW and PET were subjected at around 55 °C. Figure 9 shows the temperature inside and outside; the maximum temperature point those transfers from outside to inside through the dividing panel is also defined. The values obtained are lower than those obtained with conventional panels in typical houses (until 60 °C).
Figure 10 presents data on the relative humidity of prefabricated panel materials. Therefore, the following sentence is quoted: In Figure 8, the maximum temperature point outside is observed at 55 °C, and during the test, it was noted that the maximum temperature inside reached 35 °C. Consequently, with the addition of CDW and PET, the specific panel reduces the internal temperature by up to 20 °C during elevated temperatures. Moreover, in temperature ranges between 23 and 30 °C, the panel maintains an approximate temperature of 23 °C, representing suitable thermal comfort levels for residential settings.
The relative humidity results in the area that simulates the exterior being significantly lower than the interior area. This behavior is because the water vapor in the air decreases as the temperature increases. Therefore, the panel reduces the humidity levels temperature present outside, and the relative humidity inside increases, maintaining an approximately constant value of 73% in 60 min. Notice that PET samples don’t develop a strong expansion effect during thermal analysis because natural conditions were used. A block with these characteristics can withstand a maximum temperature of 900 °C [45].

3.7. Acoustic Analysis Test of the Dividing Panel with Concrete and Recycled Plastic

In Figure 11, it is observed that the dividing panel decreases up to 39 dB at high frequencies in the human ear, such as 3000 Hz; considering low and high frequencies on average, it was obtained that the concrete and recycled plastic panel can decrease up to 27 dB < z the intensity of outside sound. Notice that a reduction around 5.6% and 35% was estimated for panel and door, respectively.
According to resolution 0627-2006, the maximum permissible noise emission level standards are between 55 and 80 dB, depending on the sector [46]. These values allow us to determine that if a sound intensity outside the construction is greater than 90 dB, which is the permissible limit for human hearing, the dividing panel would have the capacity to decrease to an acceptable value, providing acoustic comfort to the building [45]. Likewise, internal walls will allow for the absorbing and mitigating of the intensity of the sound wave, providing privacy and comfort in the noise inside the building.

3.8. Microstructural Analysis by Scanning Electron Microscopy

SEM micrographs of the block samples were obtained using Bruker equipment operating at 10 kV with an ultradry detector, whose results are summarized in Figure 12. The microstructure and the presence of homogeneous rough surfaces are observed, but no detachments are observed between the aggregates, so it is inferred that there is a good aggregate-cement interaction. However, cracks are observed in the interaction of said materials. The cracks observed vary from 2.4 µm to 19 µm. These degrees of fracturing that occur in the aggregate-cementing paste interaction can affect the decrease of the element to support loads and can be due to the dehydration of the mortar or be attributed to a material, such as recycled concrete, that subsequently had a useful life and a failure. Furthermore, in this material, it was possible to observe the remains of glass, stone materials, and various residues that contaminate said mixture and may affect its resistance alterations. Likewise, the cementitious material generally interacts correctly with the various aggregates and additives; no detachment of the microplastic is perceived. Therefore, it bonds well with the cementitious paste. However, the cause of the degree of fracture in the sample must be thoroughly analyzed to determine the recycled concrete panel’s most relevant properties, the percentage’s influence on the microcracks present, and the interaction with other aggregates and additives.

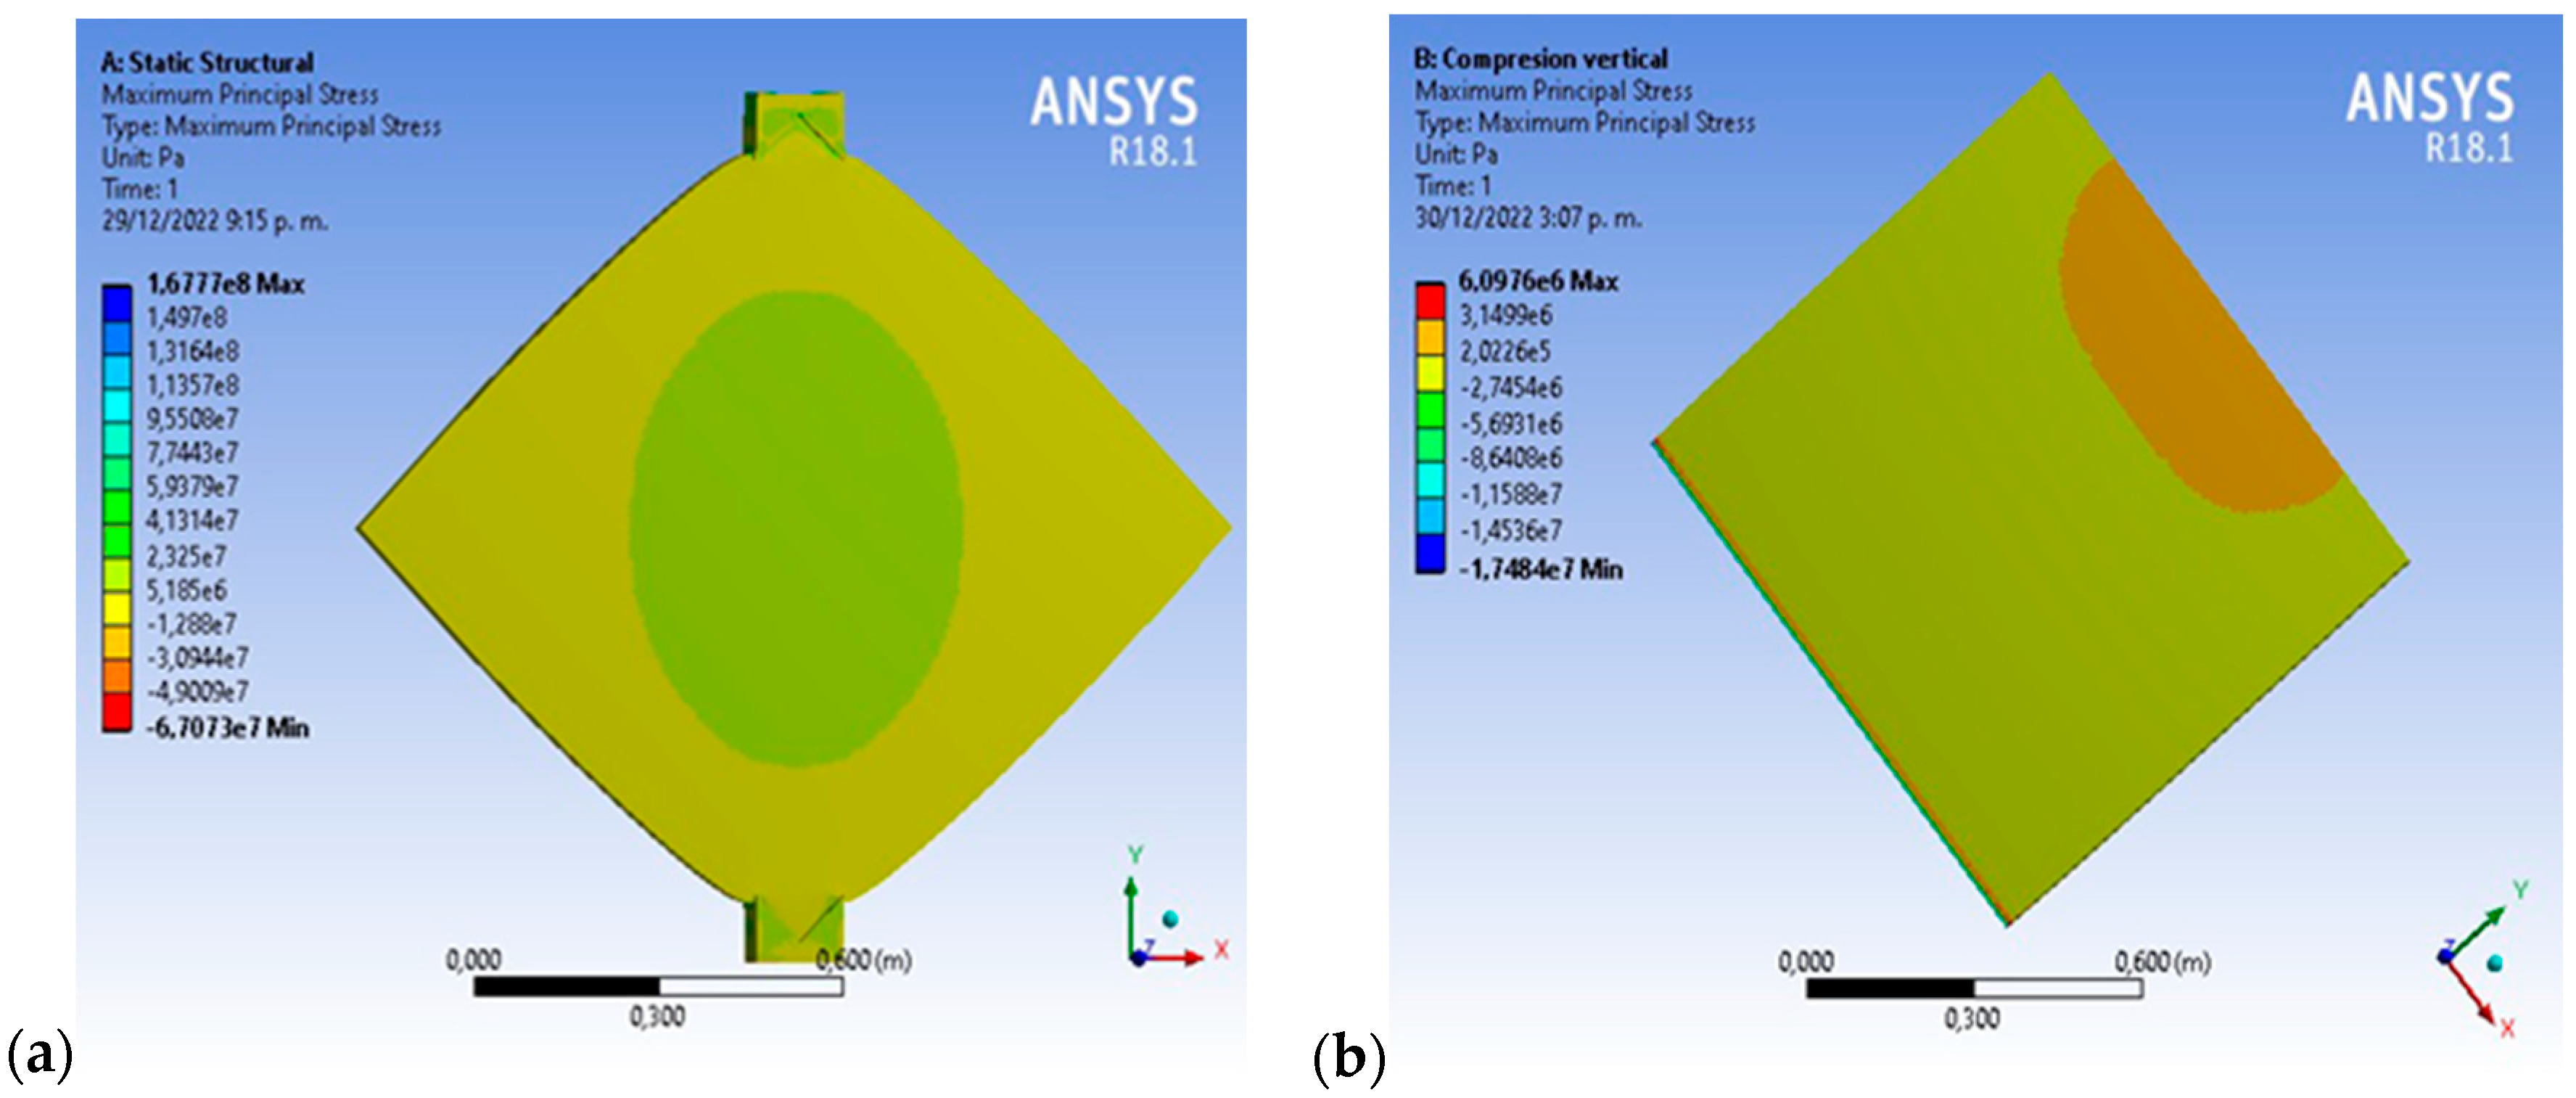
3.9. Simulation Test Using ANSYS

The CAD-3D designs of the sustainable panels were imported into the ANSYS/2022-R2 student version software, aiming to obtain a comprehensive design, analysis, and simulation of various components through finite element analysis (FEA), as illustrated in Figure 13. As part of this research, the FEA analysis tools integrated within the graphic interface processor were utilized to ensure accurate and efficient analysis of the panel system under compression loads [47]. Note that determining material parameters for numerical simulations involves a combination of experimental testing, mathematical modeling, literature review, and sensitivity analysis to represent the behavior of materials in structural simulations accurately.
This way, the applied load to the panel was estimated to resist an average effort of 31.54 MPa. This analysis achieved the resistance acquired in the cylinder by adding 20% CDW since this mixture design was used for the panel study (Figure 13). In conclusion, applying a load of 3700 kN was necessary to obtain the expected resistance result.

4. Conclusions

Utilizing construction and demolition waste (CDW) in construction is a sustainable solution, mitigating negative environmental impacts associated with improper disposal by repurposing it as raw material for concrete production. To effectively assess its viability in construction, it is imperative to establish mortar mix designs under varying CDW percentages. This pursuit aims to find the optimal combination of materials, ensuring compliance with specific technical requirements for concrete panels and identifying ideal proportions of fine aggregate, CDW, and water-cement ratio.
Humidity test results comparing river sand and CDW revealed significant insights crucial for mix design determination. River sand exhibited a humidity of 13.59%, contrasting with CDW’s 8.46% humidity. Additionally, disparities in particle sizes between river sand and CDW sand were noted, with CDW particles generally larger due to their origin.
All samples surpassed the expected compression resistance of 21 MPa at 28 days, with cylinder number 3 (20% CDW) displaying the highest resistance at 31.45 MPa and offering favorable lightweight characteristics. CDW incorporation enhanced material resistance, with the optimal mixture achieving maximum resistance at 20% CDW.
Notably, incorporating CDW decreased the weight of samples compared to river material-only samples. This finding underscores CDW’s potential to reduce panel weight while maintaining adequate strength properties. Thus, a mix design incorporating 20% CDW alongside recycled microplastic was deemed suitable for creating lightweight yet resilient concrete panels.
Integrating CDW into the construction of prefabricated partition panels holds promise for sustainable construction practices, enhancing panel properties by 20% compared to conventional counterparts. Panels demonstrated a compressive strength of 31.45 MPa and were designed with dimensions of (60 × 60 × 6) cm, facilitating on-site installation and weighing 45.72 kg. Various installation methods can be employed, offering versatility to suit project requirements.
Acoustic tests indicated a reduction of up to 39 dB in sound transmission, while thermal tests showcased a thermal transmission loss of up to 21 °C. These results signify the effectiveness of CDW and PET-incorporated panels as optimal dividing elements in construction applications.
The incorporation of prefabricated panels featuring CDW and PET presents many benefits, including a reduction in the exploitation of new raw materials and a decrease in pollution generated by the construction sector. This underscores the importance of sustainable practices in construction, architecture, and engineering.

Author Contributions

H.Y.J., Contributed to Investigation, Methodology, Formal Analysis, Funding Acquisition, Original Draft, Writing—Review and Editing. J.A.G.C. and N.A.G., Contributed to Conceptualization, Methodology, Formal Analysis, other contributions. All authors have read and agreed to the published version of the manuscript.

Funding

The APC was funded by DIE of the Universidad Francisco de Paula Santander Ocaña.

Institutional Review Board Statement

Not applicable.

Informed Consent Statement

Not applicable.

Data Availability Statement

The data presented in this study are available on request from the corresponding author.

Acknowledgments

The authors thanks to DIE to the financial sources to this work.

Conflicts of Interest

The authors declare no conflicts of interest.

References

  1. Aslam, M.S.; Huang, B.; Cui, L. Review of construction and demolition waste management in China and USA. J. Environ. Manag. 2020, 264, 110445. [Google Scholar] [CrossRef] [PubMed]
  2. Wasim, M.; Oliveira, O.; Ngo, T.D. Structural performance of prefabricated glass fibre concrete floor panel versus compressed fibre cement floor panel for an optimised volumetric module—A case study. J. Build. Eng. 2022, 48, 103819. [Google Scholar] [CrossRef]
  3. Piccarozzi, M.; Silvestri, C.; Aquilani, B.; Silvestri, L. Is this a new story of the ‘Two Giants’? A systematic literature review of the relationship between industry 4.0, sustainability and its pillars. Technol. Forecast. Soc. Chang. 2022, 177, 121511. [Google Scholar] [CrossRef]
  4. Zavadskas, E.K.; Šaparauskas, J.; Antucheviciene, J. Sustainability in construction engineering. Sustainability 2018, 10, 2236. [Google Scholar] [CrossRef]
  5. Cherene, M.G.P.; de Castro Xavier, G.; da Silva Barroso, L.; de S. M. Oliveira, J.; de Azevedo, A.R.G.; Vieira, C.M.; Alexandre, J.; Monteiro, S.N. Technological and microstructural perspective of the use of ceramic waste in cement-based mortars. Constr. Build. Mater. 2023, 367, 130256. [Google Scholar] [CrossRef]
  6. Ilcan, H.; Sahin, O.; Kul, A.; Yildirim, G.; Sahmaran, M. Rheological properties and compressive strength of construction and demolition waste-based geopolymer mortars for 3D-Printing. Constr. Build. Mater. 2022, 328, 127114. [Google Scholar] [CrossRef]
  7. Muñoz Pérez, S.P.; Díaz Sánchez, D.M.; Gamarra Capuñay, E.E.; Chaname Bustamante, J.A. La Influencia de los RCD en reemplazo de los agregados para la elaboración de concreto: Una revisión de la literatura. Ecuadorian Sci. J. 2021, 5, 107–120. [Google Scholar] [CrossRef]
  8. Luis, A.; Rendón, N.; Korody, M.E. Polyethylene Teraftalate (PET)—Cement mixture designs. Rev. Fac. Ing. Univ. Cent. Venez. 2008, 23, 77–86. [Google Scholar]
  9. Smaoui, H.; Trabelsi, A.; Kammoun, Z.; Aouicha, B. Mechanical, physical, blast waves and ballistic impact resistance properties of a concrete incorporating thermally treated PET inclusions. Constr. Build. Mater. 2023, 365, 130088. [Google Scholar] [CrossRef]
  10. Borg, R.P.; Baldacchino, O.; Ferrara, L. Early age performance and mechanical characteristics of recycled PET fibre reinforced concrete. Constr. Build. Mater. 2016, 108, 29–47. [Google Scholar] [CrossRef]
  11. Pacheco-Torgal, F.; Tam, V.; Lambrincha, A.; Ding, Y.; De Brito, J. Handbook of Recycled Concrete and Demolition Waste; Woodhead Publishing: Cambridge, UK, 2013. [Google Scholar]
  12. Bravo-German, A.M.; Bravo-Gómez, I.D.; Mesa, J.A.; Maury-Ramírez, A. Mechanical Properties of Concrete Using Recycled Aggregates Obtained from Old Paving Stones. Sustainability 2021, 13, 44. [Google Scholar] [CrossRef]
  13. Otoko, G. Review of the Use of Construction and Demolition Waste in Concrete. Int. J. Eng. Technol. Res. 2014, 2, 1–8. [Google Scholar]
  14. Betancourt, J.; Cortés, F.; Rentería, J.; Díaz, A.; Vaquera, M. Comportamiento de mezclas de mortero con residuos de mármol (polvo), cáscara de nuez y mucílago de nopal. Rev. Arquit. Ing. 2019, 13, 1–16. [Google Scholar]
  15. Acosta, A.M.; Beltran, L.F. Determinar las Propiedades Mecánicas y el Uso de Cuesco de Palma Africana Para la Fabricación de Adoquines y Bloques Estructurales; Universidad Cooperativa de Colombia: Bogota, Colombia, 2017. [Google Scholar]
  16. García-León, R.A.; Flórez-Solano, E.; Rodríguez-Castilla, M. Diseño de mezclas para la fabricación de productos de mampostería en la industria cerámica. Rev. Politécnica 2018, 14, 19–28. [Google Scholar] [CrossRef]
  17. Zhang, X.; Skitmore, M.; Peng, Y. Exploring the challenges to industrialized residential building in China. Habitat Int. 2014, 41, 176–184. [Google Scholar] [CrossRef]
  18. Li, P.; Ran, J.; An, X.; Bai, H.; Nie, D.; Zhang, J.; Shao, K. An enhanced mix-design method for self-compacting concrete based on paste rheological threshold theory and equivalent mortar film thickness theories. Constr. Build. Mater. 2022, 347, 128573. [Google Scholar] [CrossRef]
  19. García-León, R.A.; Flórez-Solano, E.; Medina-Cárdenas, Y. Caracterización física de las arcillas utilizadas en la fabricación de productos de mampostería para la construcción en Ocaña Norte de Santander. Espacios 2018, 39, 1–6. [Google Scholar]
  20. Yuan, M.; Li, Z.; Li, X.; Luo, X. Managing stakeholder-associated risks and their interactions in the life cycle of prefabricated building projects: A social network analysis approach. J. Clean. Prod. 2021, 323, 129102. [Google Scholar] [CrossRef]
  21. Juan-Valdés, A.; Rodríguez-robles, D.; García-gonzález, J.; Sánchez, M.I.; Gómez, D.R.; Guerra-romero, M.I.; De Belie, N.; Pozo, J.M.M. Mechanical and microstructural properties of recycled concretes mixed with ceramic recycled cement and secondary recycled aggregates. Constr. Build. Mater. 2020, 270, 121455. [Google Scholar] [CrossRef]
  22. Ussa, Y.R.M.; Poveda, J.E. Fabricación de Adoquín a Partir de un Sistema de Aprovechamiento de Escombros en Obra; Universidad La Gran Colombia: Bogotá, Colombia, 2015. [Google Scholar]
  23. Rao, A.; Jha, K.N.; Misra, S. Use of aggregates from recycled construction and demolition waste in concrete. Resour. Conserv. Recycl. 2007, 50, 71–81. [Google Scholar] [CrossRef]
  24. Wagih, A.M.; El-Karmoty, H.Z.; Ebid, M.; Okba, S.H. Recycled construction and demolition concrete waste as aggregate for structural concrete. HBRC J. 2013, 9, 193–200. [Google Scholar] [CrossRef]
  25. García-León, R.A.; Sanchez-Torrez, A.; Rincon-Cardenas, W.; Afanador-García, N.; Moreno-Pacheco, L.; Lanziano-Barrera, M. Experimental study about the improvement of the mechanical properties of a concrete cobble using recyclable additives. DYNA 2023, 90, 45–55. [Google Scholar] [CrossRef]
  26. Akinyele, J.O.; Igba, U.T.; Adigun, B.G. Effect of waste PET on the structural properties of burnt bricks. Sci. Afr. 2020, 7, e00301. [Google Scholar] [CrossRef]
  27. Ascencio, E.; Montoya, L.; Campo, J. Diseño y Elaboracion de un Prototipo de Pavimento Articulado “Adoplas” a Base de Plastico Residual Recuperado PET y PP; Universidad Coperativa de Colombia: Bogotá, Colombia, 2021; Volume 15. [Google Scholar]
  28. Florez, C. Propiedades Fisico-Quimicas del Concreto de 24 MPa Con el Uso de Polietileno de Tereflalato Reciclado (botella PET) y el Concreto Convencional en la Ciudad de Cucuta; Universidad Francisco de Paula Santander: Cúcuta, Colombia, 2014. [Google Scholar]
  29. Gustavo Gamba, S.P. Caracterización de las Propiedades Mecánicas de Adoquines Producto, Concreto con Adición de Residuo de Caucho Reciclado Usadas, de Llantas. Ph.D. Thesis, Universidad Distrital Francisco José de Caldas, Bogotá, Colombia, 2015. [Google Scholar]
  30. NSR-10; Titulo A—Requisitos Generales de Diseño y Construcción Sismo Resistente. Sociedad Colombiana de Geotecnia: Bogota, Colombia, 2010; pp. 1–174.
  31. NTC-4024; Prefabricados de Concreto. Muestreo y Ensayo de Prefabricados de Concreto no Reforzados, Vibrocompactados. Icontec: Bogota, Colombia, 2001.
  32. NTC-3459; Concretos. Agua para la elaboracion de concreto. Icontec: Bogota, Colombia, 2001.
  33. Jaramillo, H.Y.; Vasco-Echeverri, O.H.; Moreno-Pacheco, L.A.; García-León, R.A. Biomaterials in Concrete for Engineering Applications: A Bibliometric Review. Infrastructures 2023, 8, 161. [Google Scholar] [CrossRef]
  34. García-León, R.A.; Gomez Camperos, J.; Jaramillo, H.Y. Physical, chemical and thermal characterization of a Colombian clay. Int. J. Mech. Mechatron. Eng. 2020, 20, 225–234. [Google Scholar]
  35. García-León, R.A.; Acevedo-Peñaloza, C.; Rojas-Suarez, J.P. Metodología Para la Fabricación del Bloque H-10 Para la Industria Cerámica de Norte de Santander; ECOE Ed.: Bogota, Colombia, 2019; ISBN 978-958-8489-98-8. [Google Scholar]
  36. García-León, R.A.; Afanador-García, N.; Guerrero-Gómez, G. Physical-Mechanical properties of H-10 blocks manufactured in Norte of Santander, Colombia: A case study. DYNA 2021, 88, 181–189. [Google Scholar] [CrossRef]
  37. NTC-1776; Método de Ensayo Para Determinar el Contenido Total de Humedad Evaporada por Secado de los Agrefados. Norma Técnica Colombia. pp. 1–11, 19AD. Available online: https://tienda.icontec.org/gp-metodo-de-ensayo-para-determinar-el-contenido-total-de-humedad-evaporable-por-secado-de-los-agregados-ntc1776-2019.html (accessed on 16 May 2024).
  38. NTC-77; Concretos. Método de Ensayo Para el Análisis por Tamizado de los Agregados Finos y Gruesos. Norma Técnica Colombia. 2018; pp. 1–12. Available online: https://tienda.icontec.org/gp-concretos-metodo-de-ensayo-para-el-analisis-por-tamizado-de-los-agregados-finos-y-gruesos-ntc77-2018.html (accessed on 16 May 2024).
  39. NTC-237; Método de Ensayo Para Determinar la Densidad Relativa (Gravedad Especifica) y la Absorción del Agregado Fino. Norma Técnica Colombia. 2020; pp. 1–10. Available online: https://tienda.icontec.org/gp-metodo-de-ensayo-para-determinar-la-densidad-relativa-gravedad-especifica-y-la-absorcion-del-agregado-fino-ntc237-2020.html (accessed on 16 May 2024).
  40. ASTM-C518-21; Standard Test Method for Steady-State Thermal Transmission Properties by Means of the Heat Flow Meter Apparatus. 2021; pp. 1–34. Available online: https://www.astm.org/standards/c518 (accessed on 16 May 2024).
  41. ASTM-E413; Classification for Rating Sound Insulation. ASTM, 2022; p. 4. Available online: https://www.astm.org/e0413-22.html (accessed on 16 May 2024).
  42. Revilla-Cuesta, V.; Ortega-López, V.; Skaf, M.; Manso, J.M. Effect of fine recycled concrete aggregate on the mechanical behavior of self-compacting concrete. Constr. Build. Mater. 2020, 263, 120671. [Google Scholar] [CrossRef]
  43. de Andrade Salgado, F.; de Andrade Silva, F. Recycled aggregates from construction and demolition waste towards an application on structural concrete: A review. J. Build. Eng. 2022, 52, 104452. [Google Scholar] [CrossRef]
  44. Marsiglio, L.; Cheng, S.; Falk, E.; Fugh, A.; Mulvaney, K.; Slocum, B.; Morris, D.; Balasubramanian, G.; Mehta, K. Comparing the Properties of Polyethylene Terephthalate (PET) Plastic Bricks to Conventional Concrete Masonry Units. In Proceedings of the 2020 IEEE Global Humanitarian Technology Conference (GHTC), Seattle, WA, USA, 29 October–1 November 2020; pp. 1–6. [Google Scholar]
  45. García-León, R.A.; Flórez-Solano, E.; Rodríguez-Castilla, M. Application of the procedure of the ISO 50001:2011 standard for energy planning in a company ceramic sector. DYNA 2019, 86, 120–126. [Google Scholar] [CrossRef]
  46. Ministerio de Ambiente, Vivienda y Desarrollo Territorial. Resolución 0627 de 2006; Ministerio de Ambiente, vivienda y Desarrollo Territorial: Bogota, Colombia, 2006; pp. 1–31.
  47. García-Léon, R.A.; Jaimes-Gonzalez, W.; Becerra, L.D.; Florez-Solano, E.; Cabellos-Martinez, M.; Meneses-Torres, D. Application of the QFD method to the design of a cocoa pulping machine. Int. J. Syst. Assur. Eng. Manag. 2021, 12, 1199–1220. [Google Scholar] [CrossRef]
Figure 1. Experimental procedure. Source: the authors.
Infrastructures 09 00135 g001
Figure 2. Mixture obtention process and hand mortar mixing. Source: the authors.
Infrastructures 09 00135 g002
Figure 3. CDW panel dimensions.
Infrastructures 09 00135 g003
Figure 4. Thermal and acoustic test, (a) Equipment used, and (b) Sonometer. Source: the authors.
Infrastructures 09 00135 g004
Figure 5. River sand granulometric curve. Source: Authors.
Infrastructures 09 00135 g005
Figure 6. CDW material granulometric curve. Source: Authors.
Infrastructures 09 00135 g006
Figure 7. %CDW vs. Resistance. Source: Authors.
Infrastructures 09 00135 g007
Figure 8. %CDW vs. Weight. Source: Authors. Note: Where black is the %CDW and gray is the Weight absorption.
Infrastructures 09 00135 g008
Figure 9. CDW panel temperature test result. Source: Authors.
Infrastructures 09 00135 g009
Figure 10. Thermal test result, CDW panel to relative humidity (RH). Source: Authors.
Infrastructures 09 00135 g010
Figure 11. CDW panel acoustic test results with maximum limits. Source: Authors.
Infrastructures 09 00135 g011
Figure 12. (a) Developed panel, and (bd) Microcracks over the panel surface in different sections. Source: Authors.
Infrastructures 09 00135 g012
Figure 13. Compression test simulation of the CDW panel: (a) diagonal and (b) horizontal. Source: the authors.
Infrastructures 09 00135 g013
Table 1. Specific weight and absorption of river sand.
ItemValue
Mass in air of the oven-dried sample (g)613.5 ± 0.50
Mass of the graduated pycnometer filled with water (g)670.1 ± 0.49
Mass in air of the saturated and superficially dry sample (g)500.3 ± 0.42
Total mass of pycnometer filled with sample and filled with water (g)977.8 ± 0.91
Relative density (specific gravity) (SH)2.534 ± 0.02
Relative density (specific gravity) in saturated and superficially dry (SSS) conditions2.598 ± 0.01
Apparent relative density (apparent specific gravity)2.707 ± 0.01
% absorption2.52 ± 0.02
Table 2. Specific weight and absorption of CDW material.
ItemValue
Mass in air of the oven-dried sample (g)595.2 ± 0.47
Mass of the graduated pycnometer filled with water (g)670.1 ± 0.55
Mass in air of the saturated and superficially dry sample (g)500.3 ± 0.39
Total mass of pycnometer filled with sample and filled with water (g)965.4 ± 0.88
Relative density (specific gravity) (SH)2.305 ± 0.03
Relative density (specific gravity) in saturated and superficially dry (SSS) conditions2.44 ± 0.02
Apparent relative density (apparent specific gravity)2.666 ± 0.05
% absorption5.88 ± 0.03
Table 3. Moisture content for river sand and CDW.
ItemValue
River Sand
(g)
CDW
(g)
Container weight (g) (p1)282.5 ± 0.99290.8 ± 1.56
Weight of container + Weight of moist soil (g) (p2)433.8 ± 1.253587 ± 3.69
Weight of container + dry soil (g) (p3)415.7 ± 1.153330.00 ± 2.89
Dry soil weight (g)133.2 ± 0.893039.20 ± 2.96
Weight of water (g)18.10 ± 0.75257.00 ± 1.48
Moisture content (%)13.59 ± 0.668.46 ± 0.99
Table 4. River sand granulometry.
Initial Weight2059.2 gFineness Module3.25
SieveRetained Weight (gr)% Retained% Retained Accumulated % PassSpecification
InMmMin.Max.
3/8”9.500.000.00.0100.0100100
No 44.75205.5010.010.090.095100
No 82.36337.8016.426.473.680100
No 161.18403.6019.646.054.05085
No 300.60450.8021.967.932.12560
No 500.30309.1015.082.917.11030
No 1000.15193.009.492.37.7210
No 2000.07590.404.496.63.405
P200<0.07569.003.4100.0---------
Total2059.20 g
Table 5. CDW material granulometry.
Initial Weight2350 gFineness Module3.59
SieveRetained Weight (gr)% Retained% Retained Accumulated% PassSpecification
InmmMin.Max.
3/8″9.503.400.20.299.8100100
No 44.75254.5011.711.988.195100
No 82.36528.4024.436.363.780100
No 161.18472.4021.858.141.95085
No 300.60341.7015.873.826.22560
No 500.30245.1011.385.214.81030
No 1000.15176.408.193.36.7210
No 2000.075101.704.798.02.005
P200<0.07543.502.0100.0---------
Total2167.10 g
Table 6. Relative density to calculate the mix design.
Relative Density (Specific Gravity) in Saturated and Superficially Dry (SSS) Condition (% CDW)Value
02.598
102.58
202.57
302.55
1002.44
Table 7. Mixture design data.
VariableValue
Sand fineness modulus3.25
Water cement ratio0.58
Argos Structural cement density3.18
454 kg of cement3000 PSI
PET5%
PET plastic density1.35
Table 8. Result of volume calculations.
EquationVariableCalculationResult
1 V o l C e m e n t 454   k g 3.18 142.77 kg
2 V o l W a t e r 454   k g × 0.58 263.32 kg
3 V o l A i r 454   k g × 3.5 % 15.89 kg
4 V o l P E T 454   k g × 5.0 % 1.35 16.81 kg
5 V o l S a n d 1 ( 142.77   k g + 263.32   k g + 15.89   k g + 16.815   k g ) 1000 0.561 kg
Table 9. Mixture design.
Proportion (% CDW)CementSand
013.21
1013.19
2013.17
3013.15
10013.02
Table 10. Dosing cylinders with a diameter of 10 cm and a height of 20 cm.
%CDWCement
(kg)
Sand (kg)Water (kg)PE
(kg)
CDW
(kg)
Washed Sand (kg)
0516.052.90.250.0016.05
1015.951.6014.36
2015.863.1712.69
3015.764.7311.03
10015.0815.080.00
Table 11. General compression test results.
CylinderHigh
(mm)
Diameter (mm)Sand
(mm2)
Volume
(mm3)
Weight
(kg)
%CDWLoad (kN)Resistance (MPa)
1204.14110.289551.781,949,900.824.1700215.822.59
2204.54109.309382.771,919,152.444.11610254.427.11
3201.18104.808626.081,735,394.703.71620271.331.45
4203.51109.439405.111,914,033.134.05430241.025.62
5202.92104.958650.791,755,418.363.699100236.127.29
Disclaimer/Publisher’s Note: The statements, opinions and data contained in all publications are solely those of the individual author(s) and contributor(s) and not of MDPI and/or the editor(s). MDPI and/or the editor(s) disclaim responsibility for any injury to people or property resulting from any ideas, methods, instructions or products referred to in the content.

