
Refractory Concrete Properties—A Review

 ,
,  , ,
, ,  and
and
Abstract
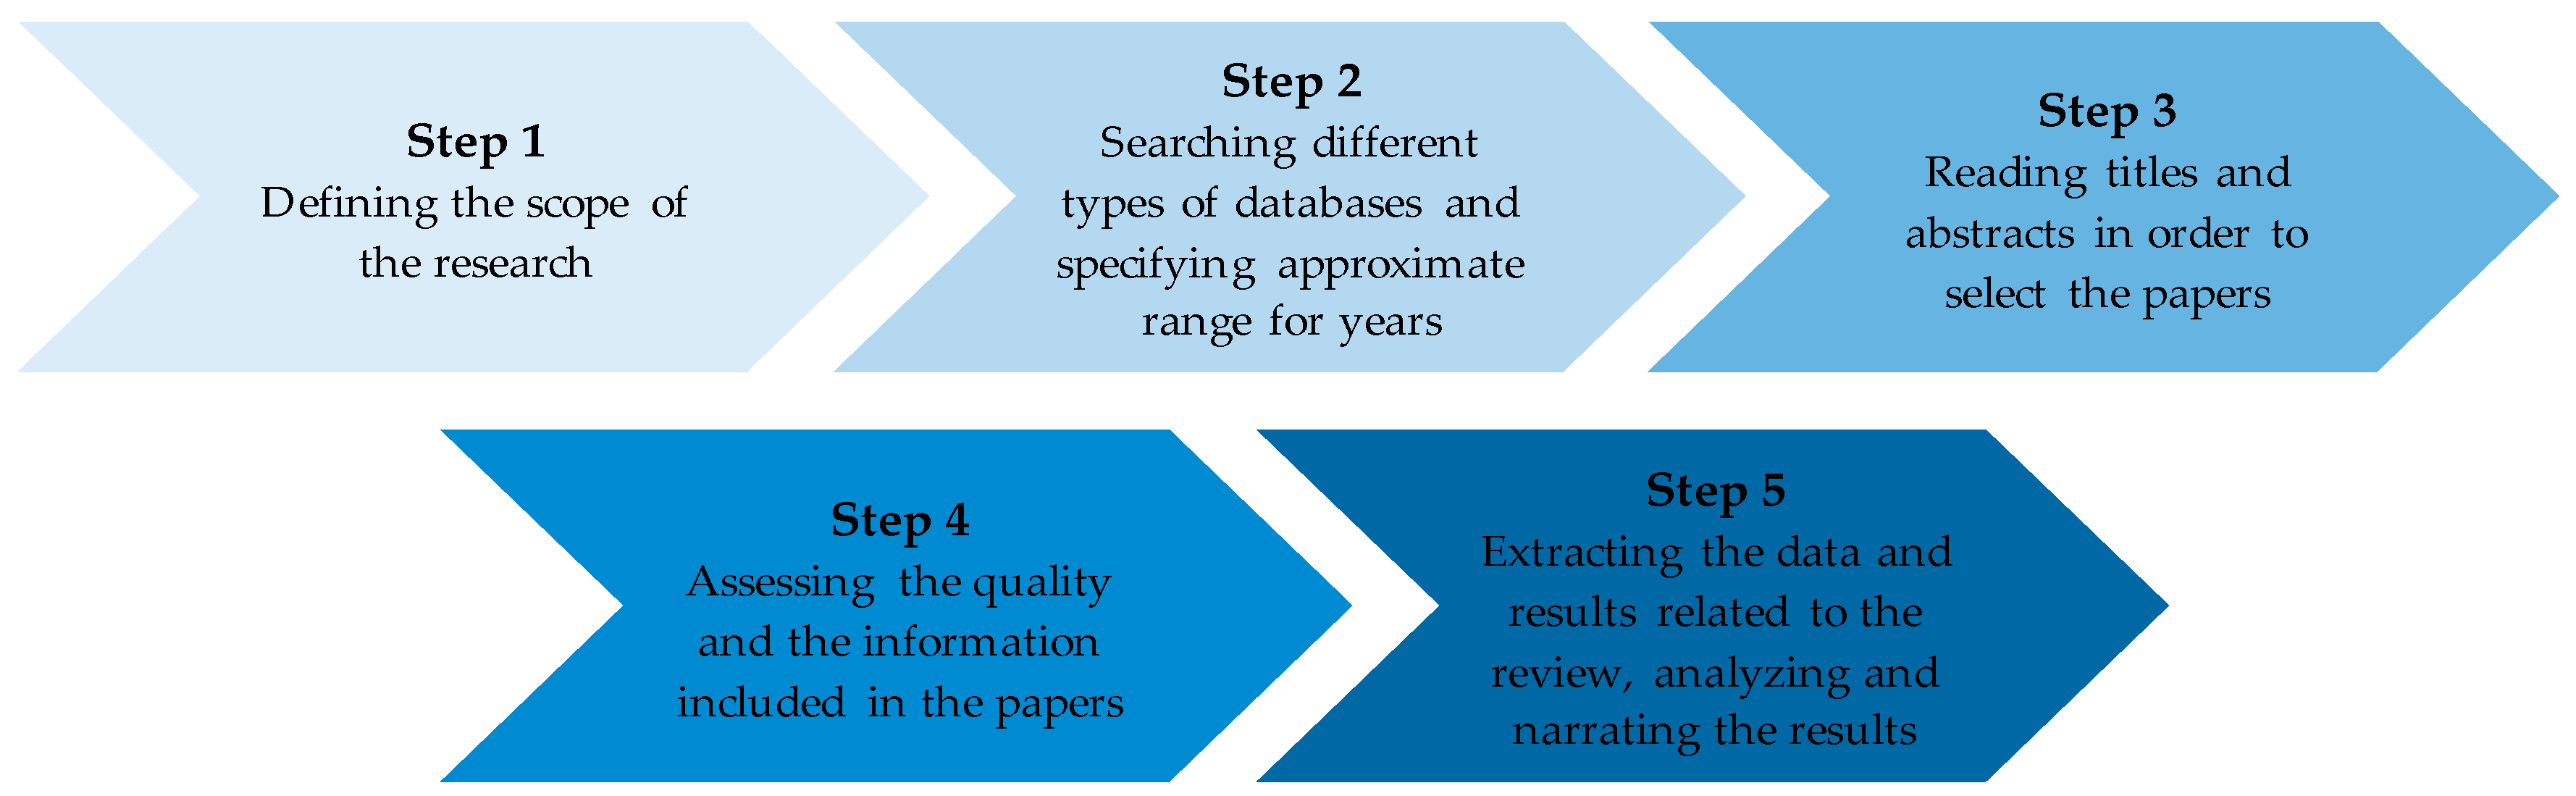
:1. Introduction
2. Materials Used in Refractory Concrete
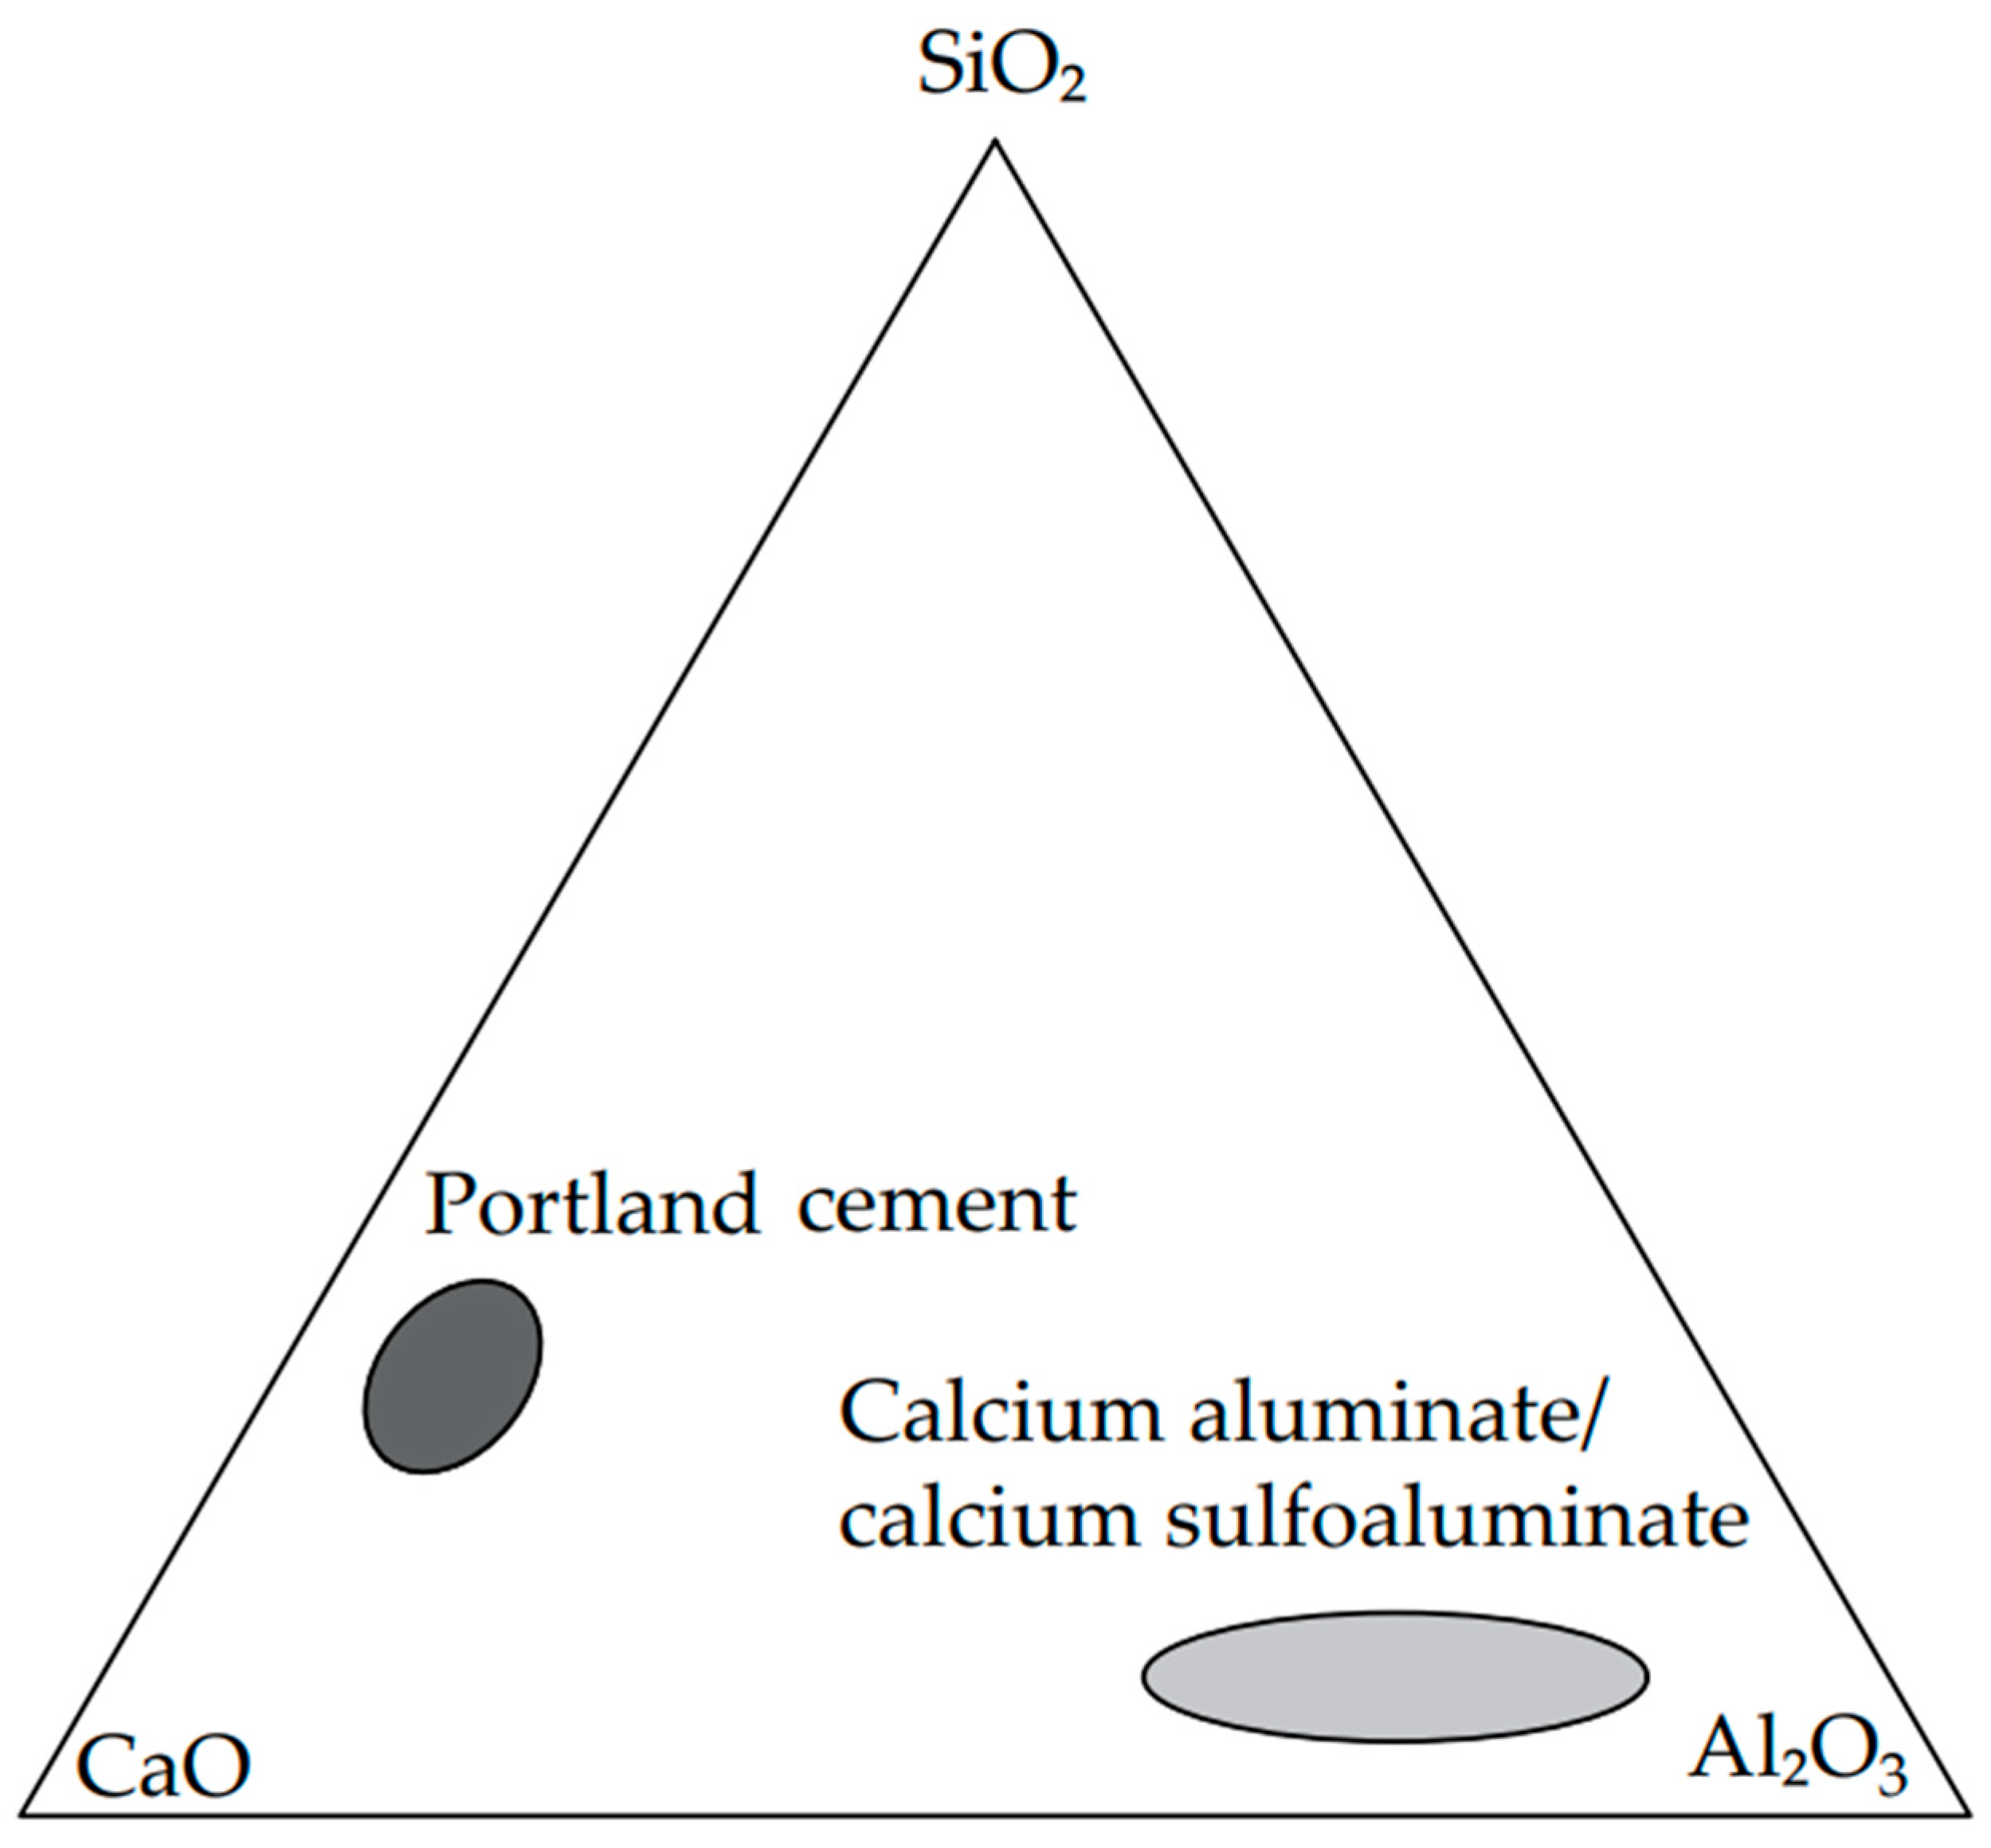
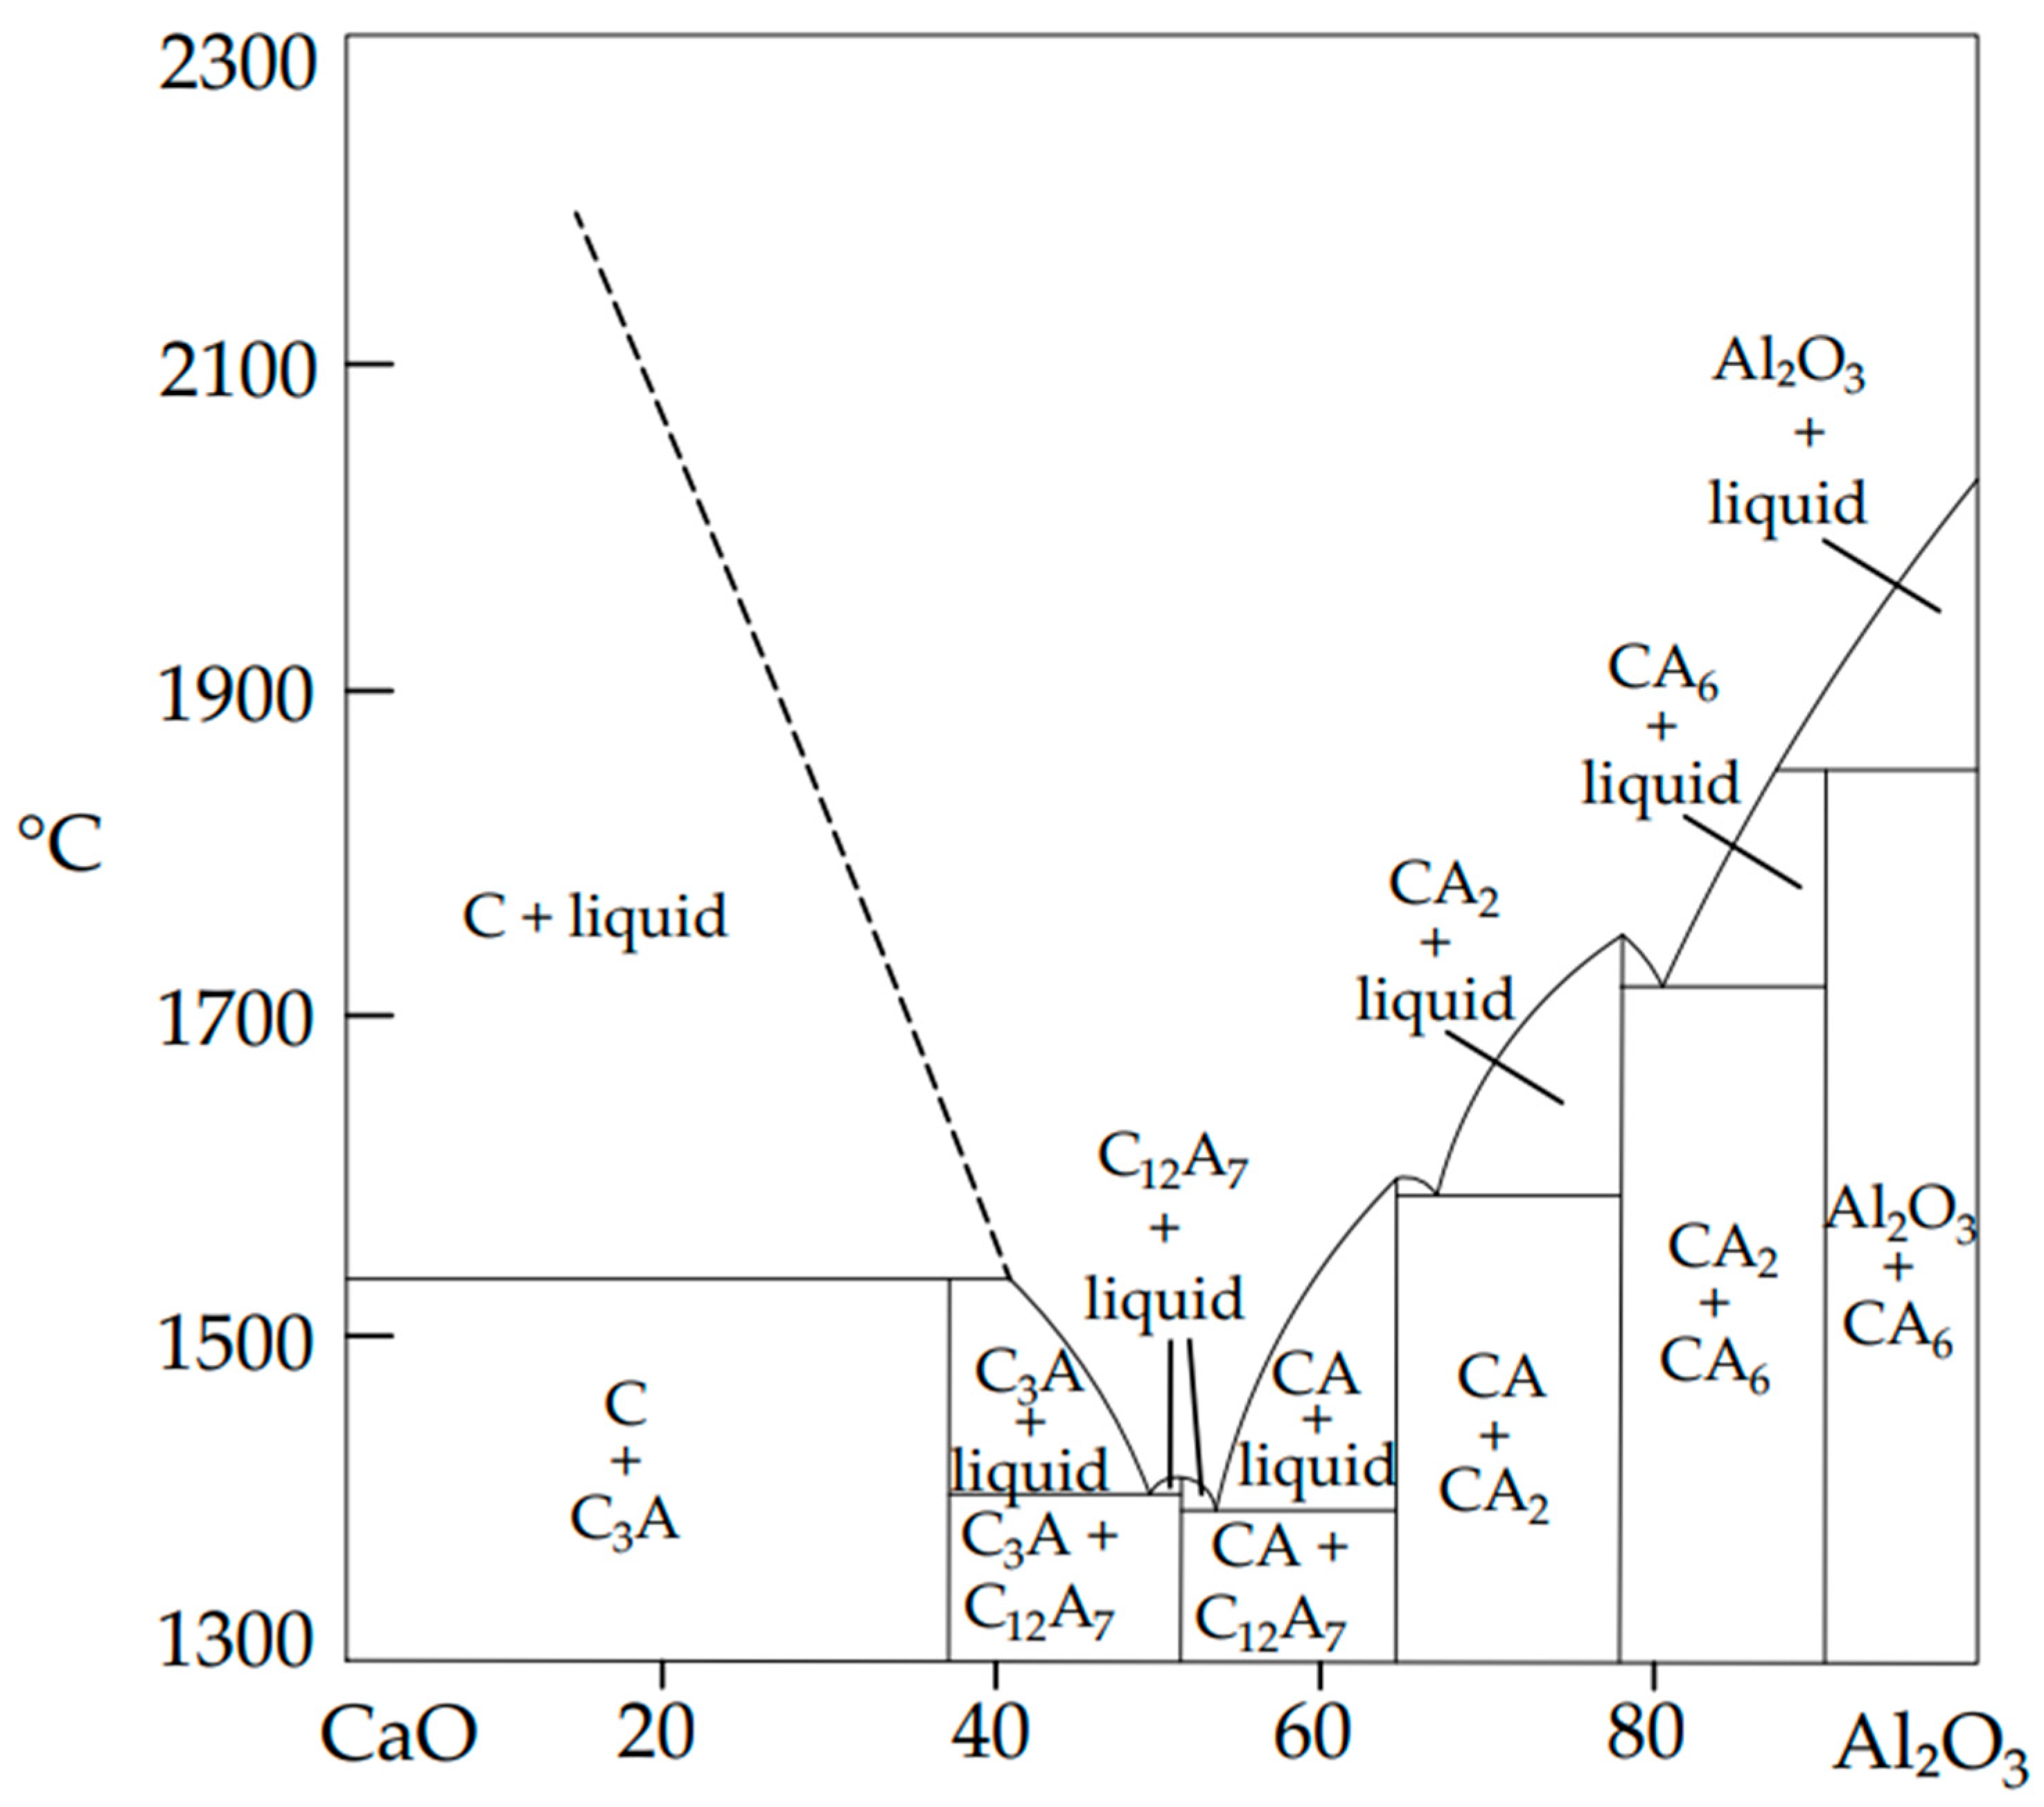
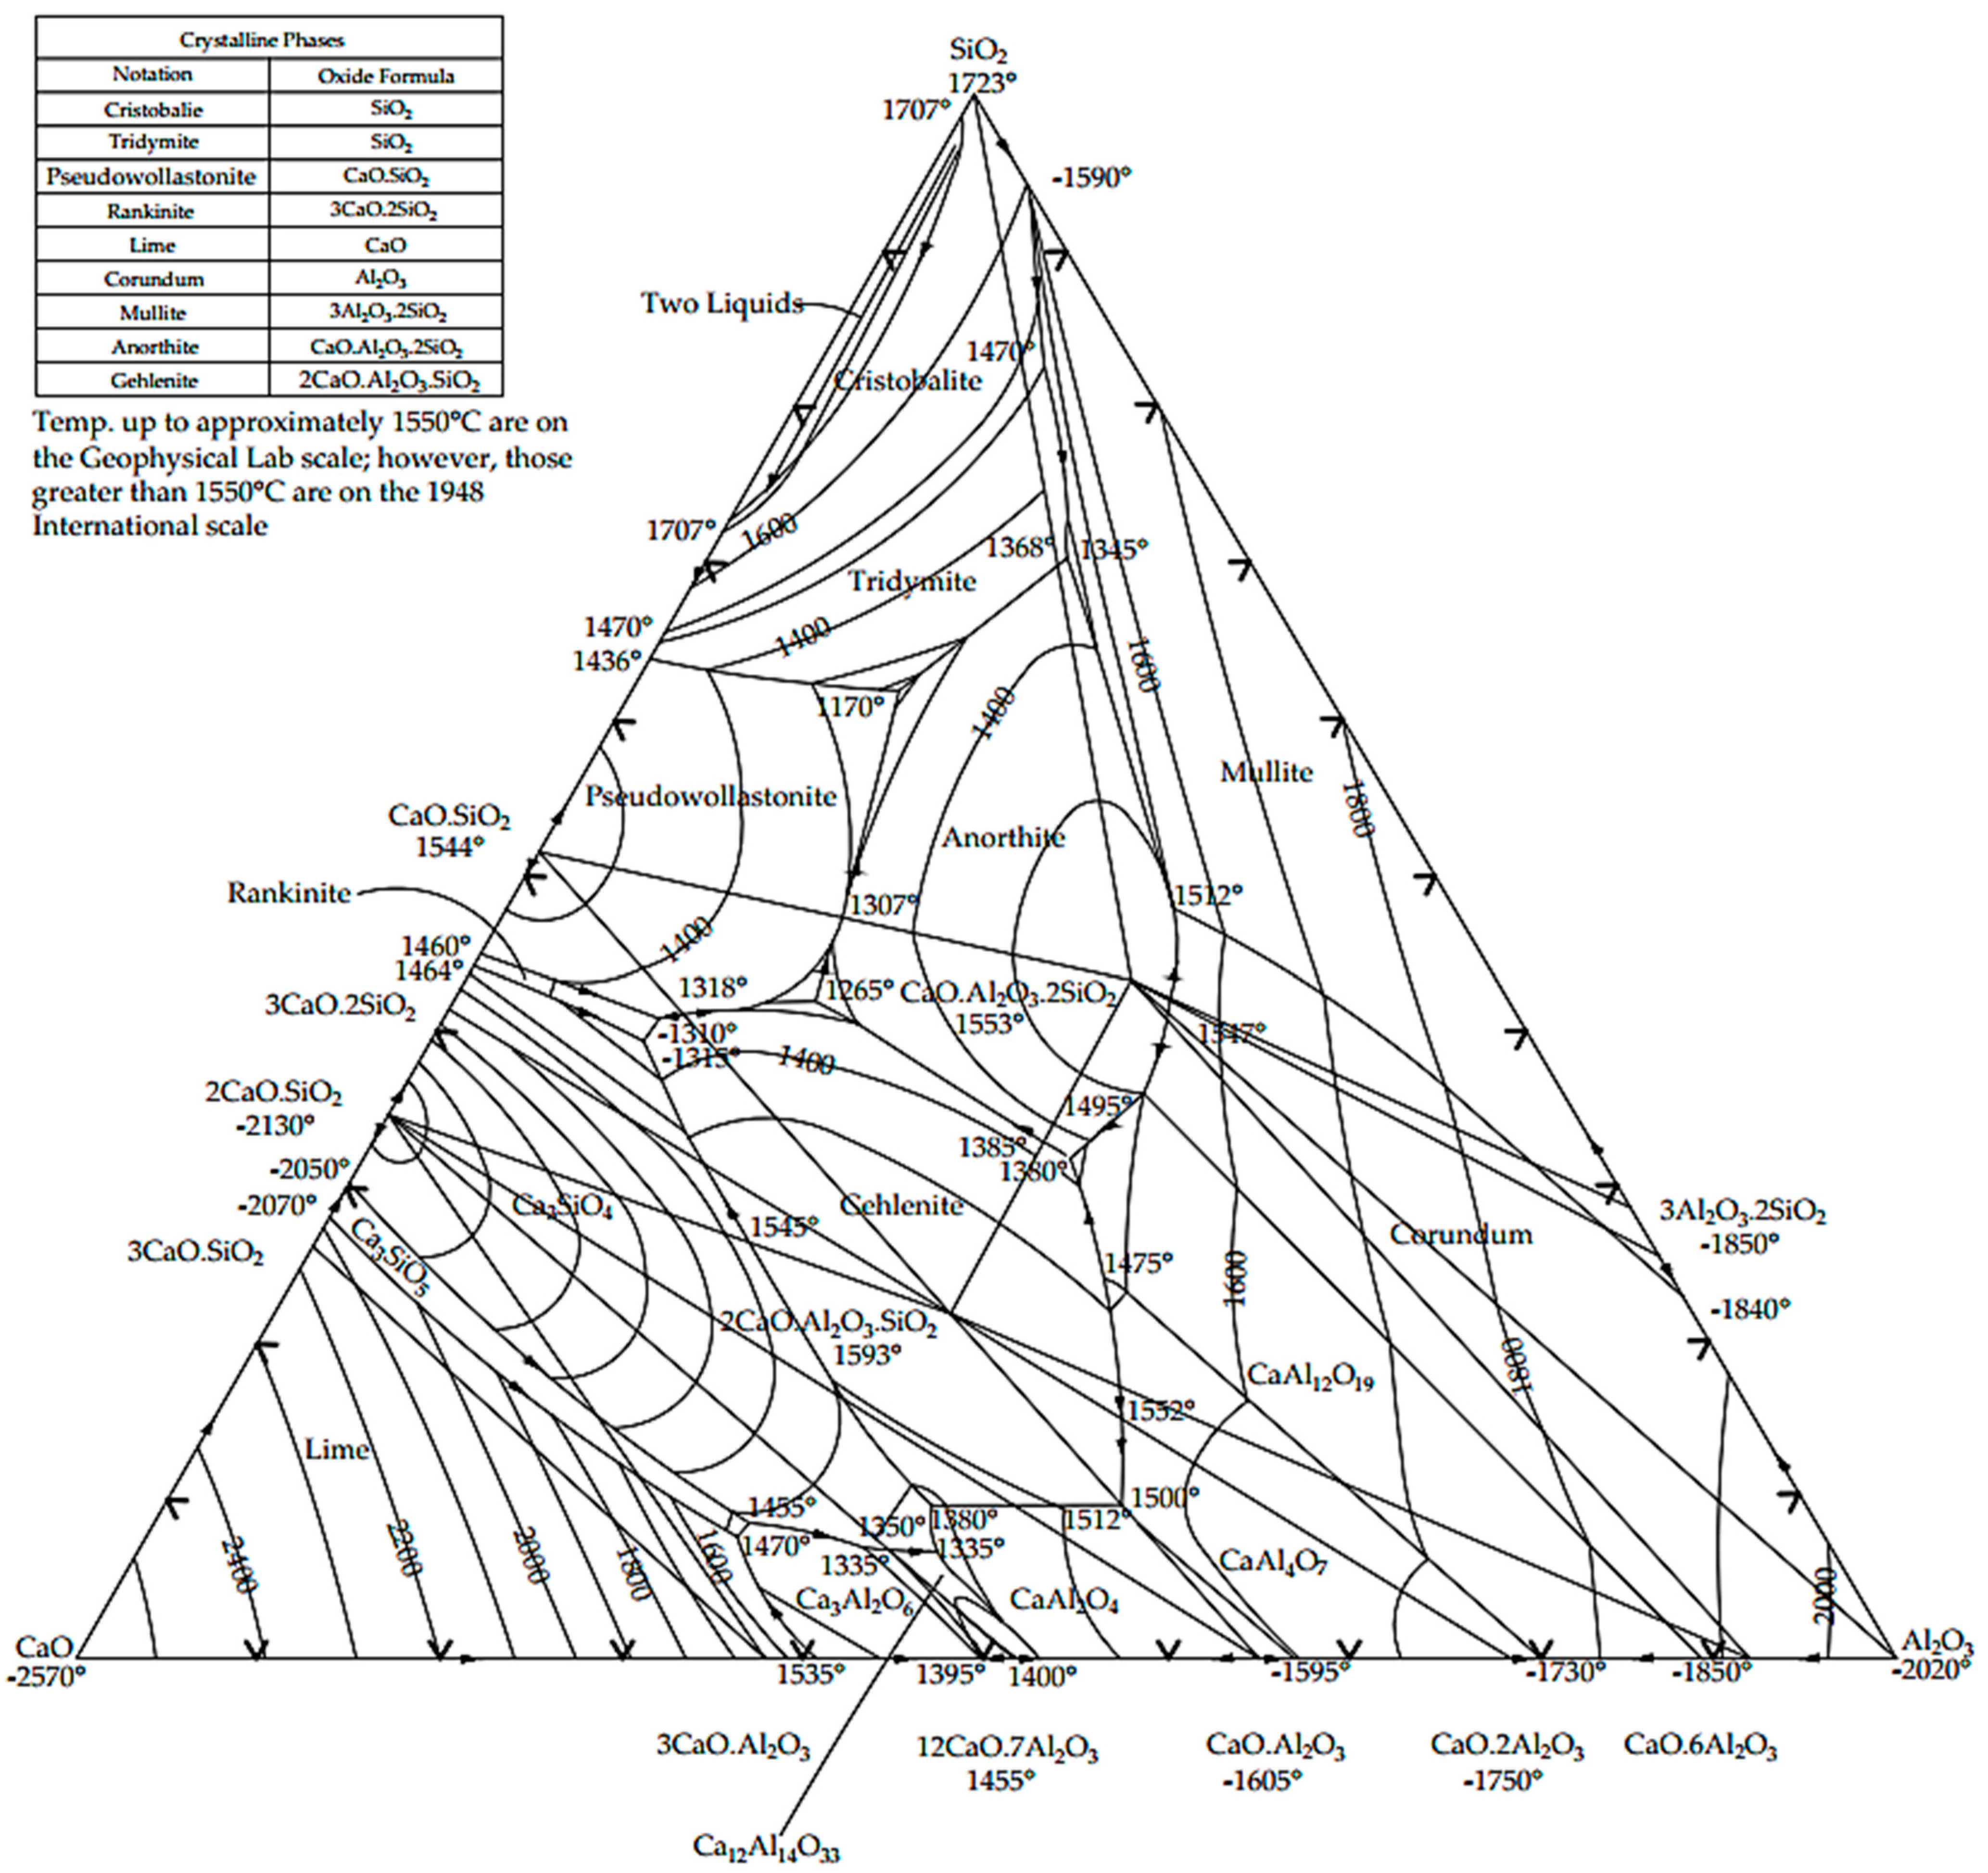
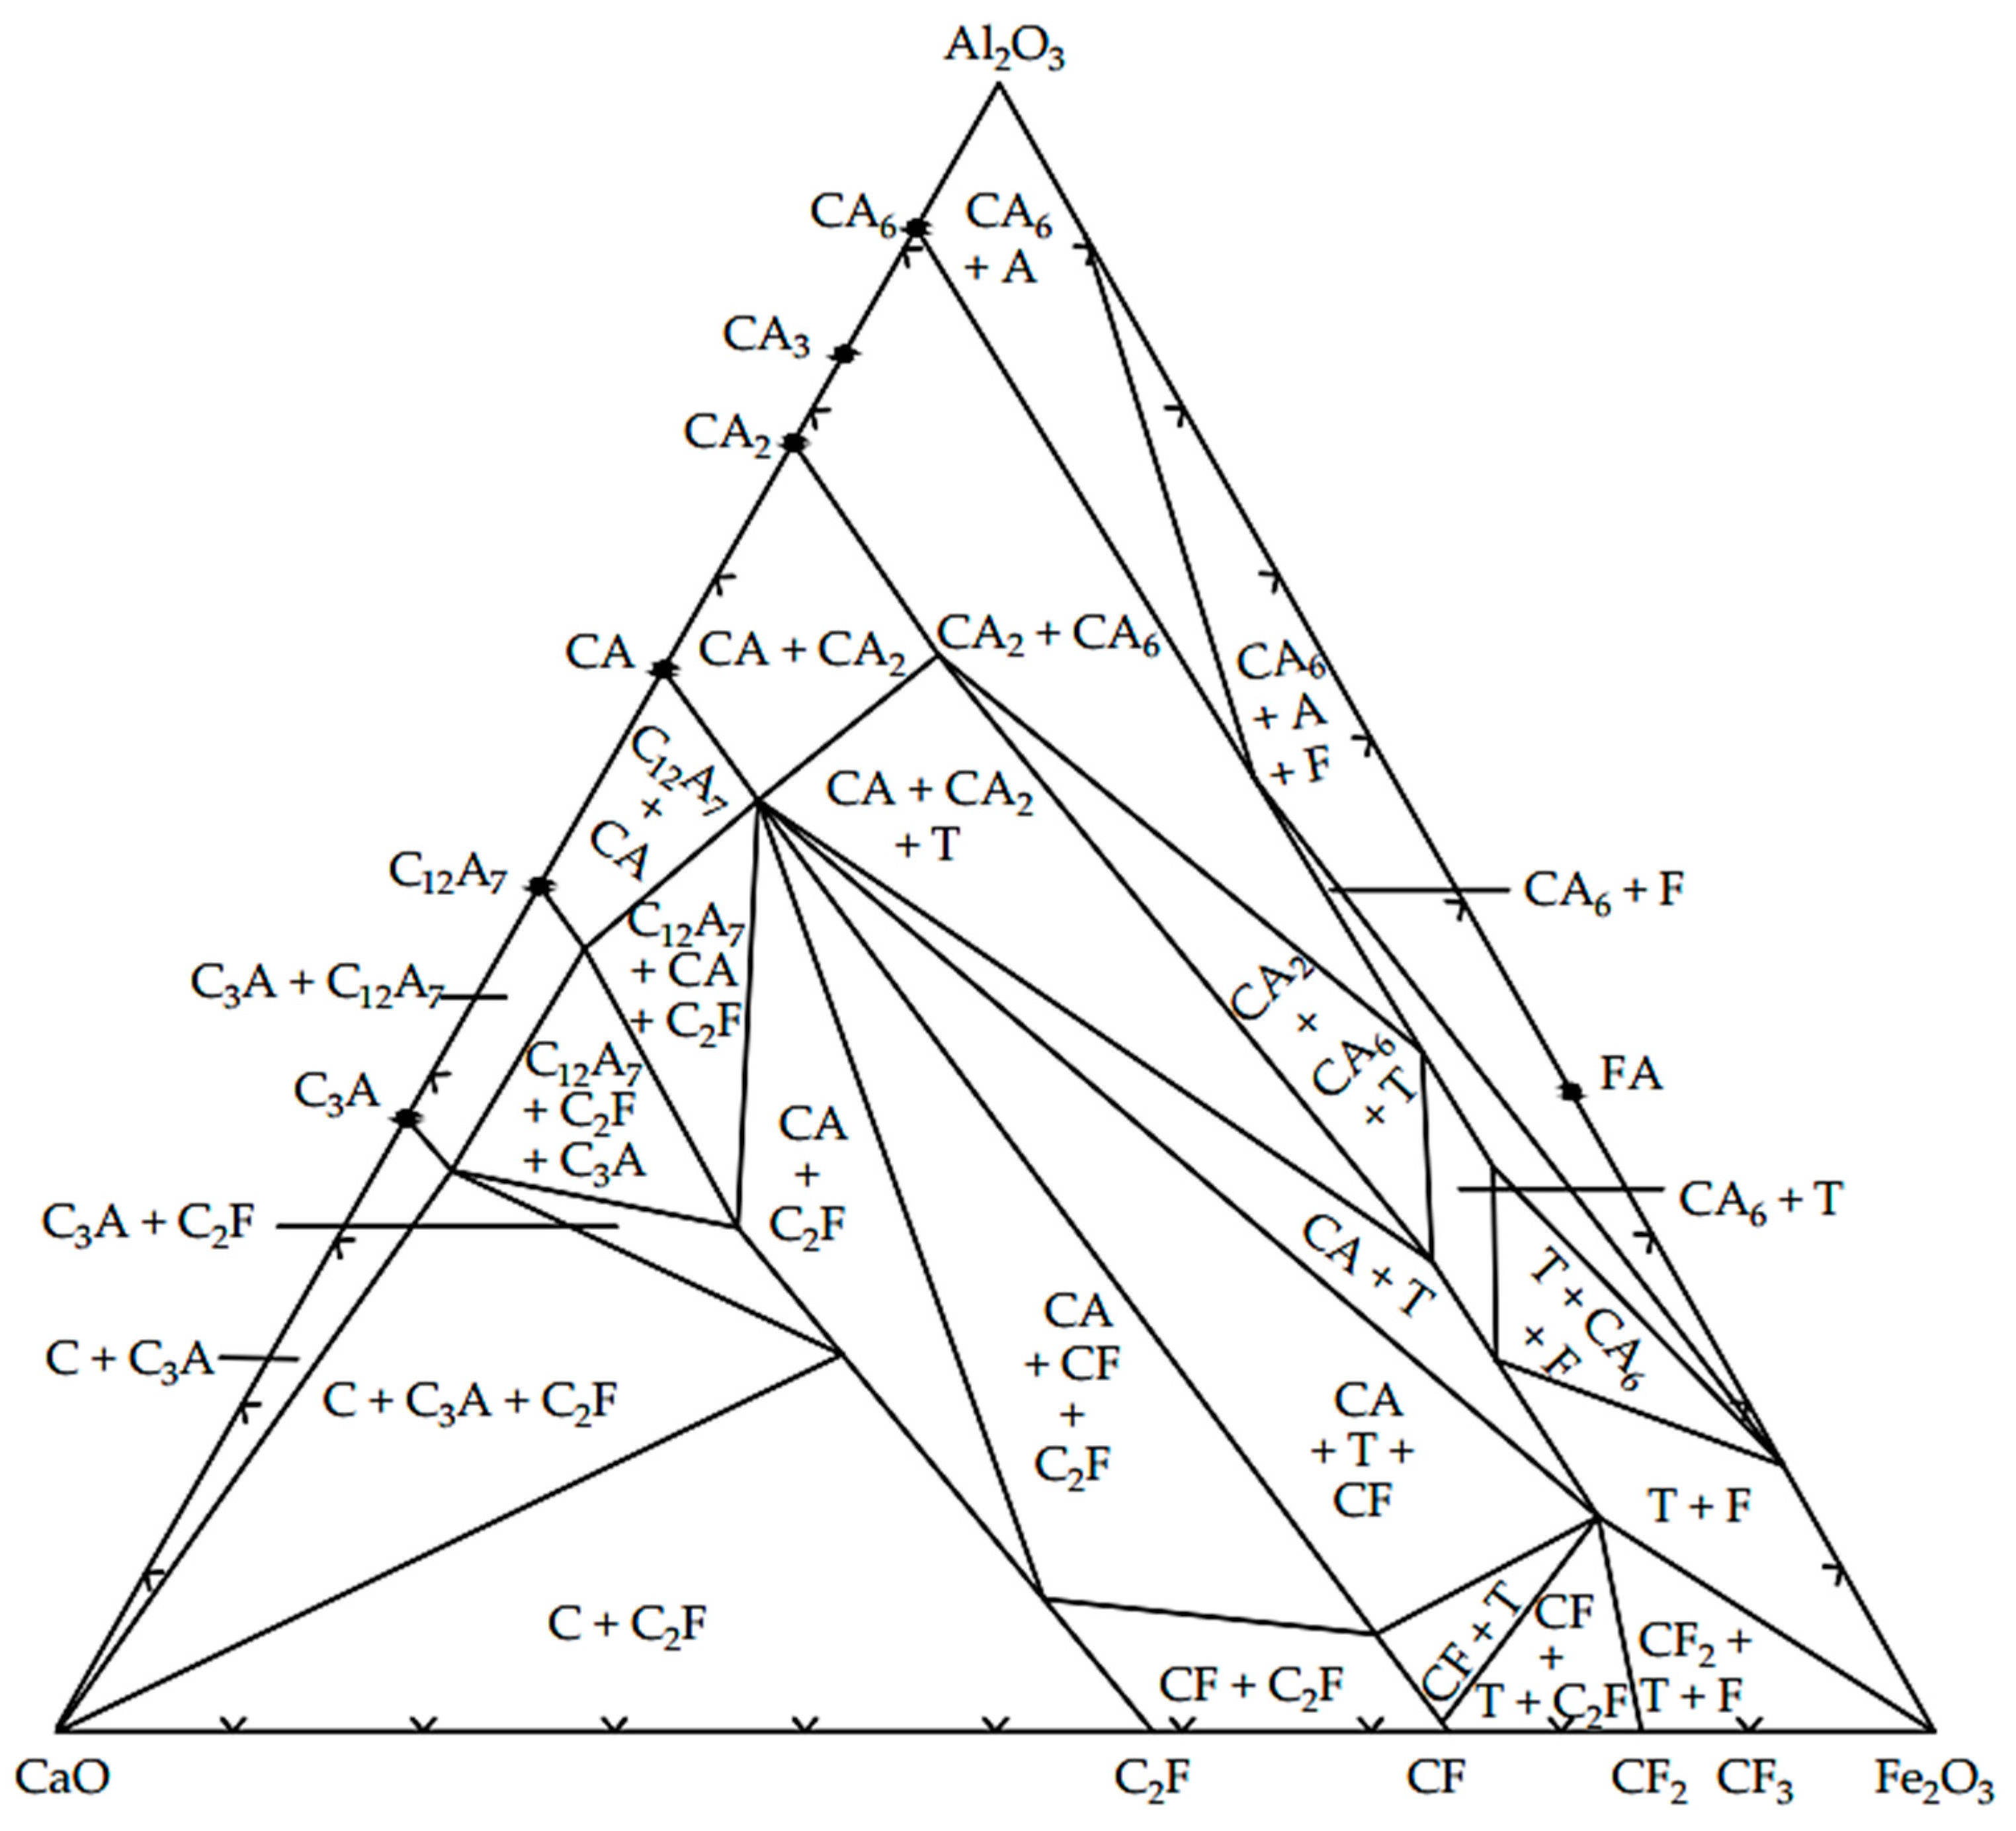
2.1. Materials, Phase Diagrams and Hydration Reactions
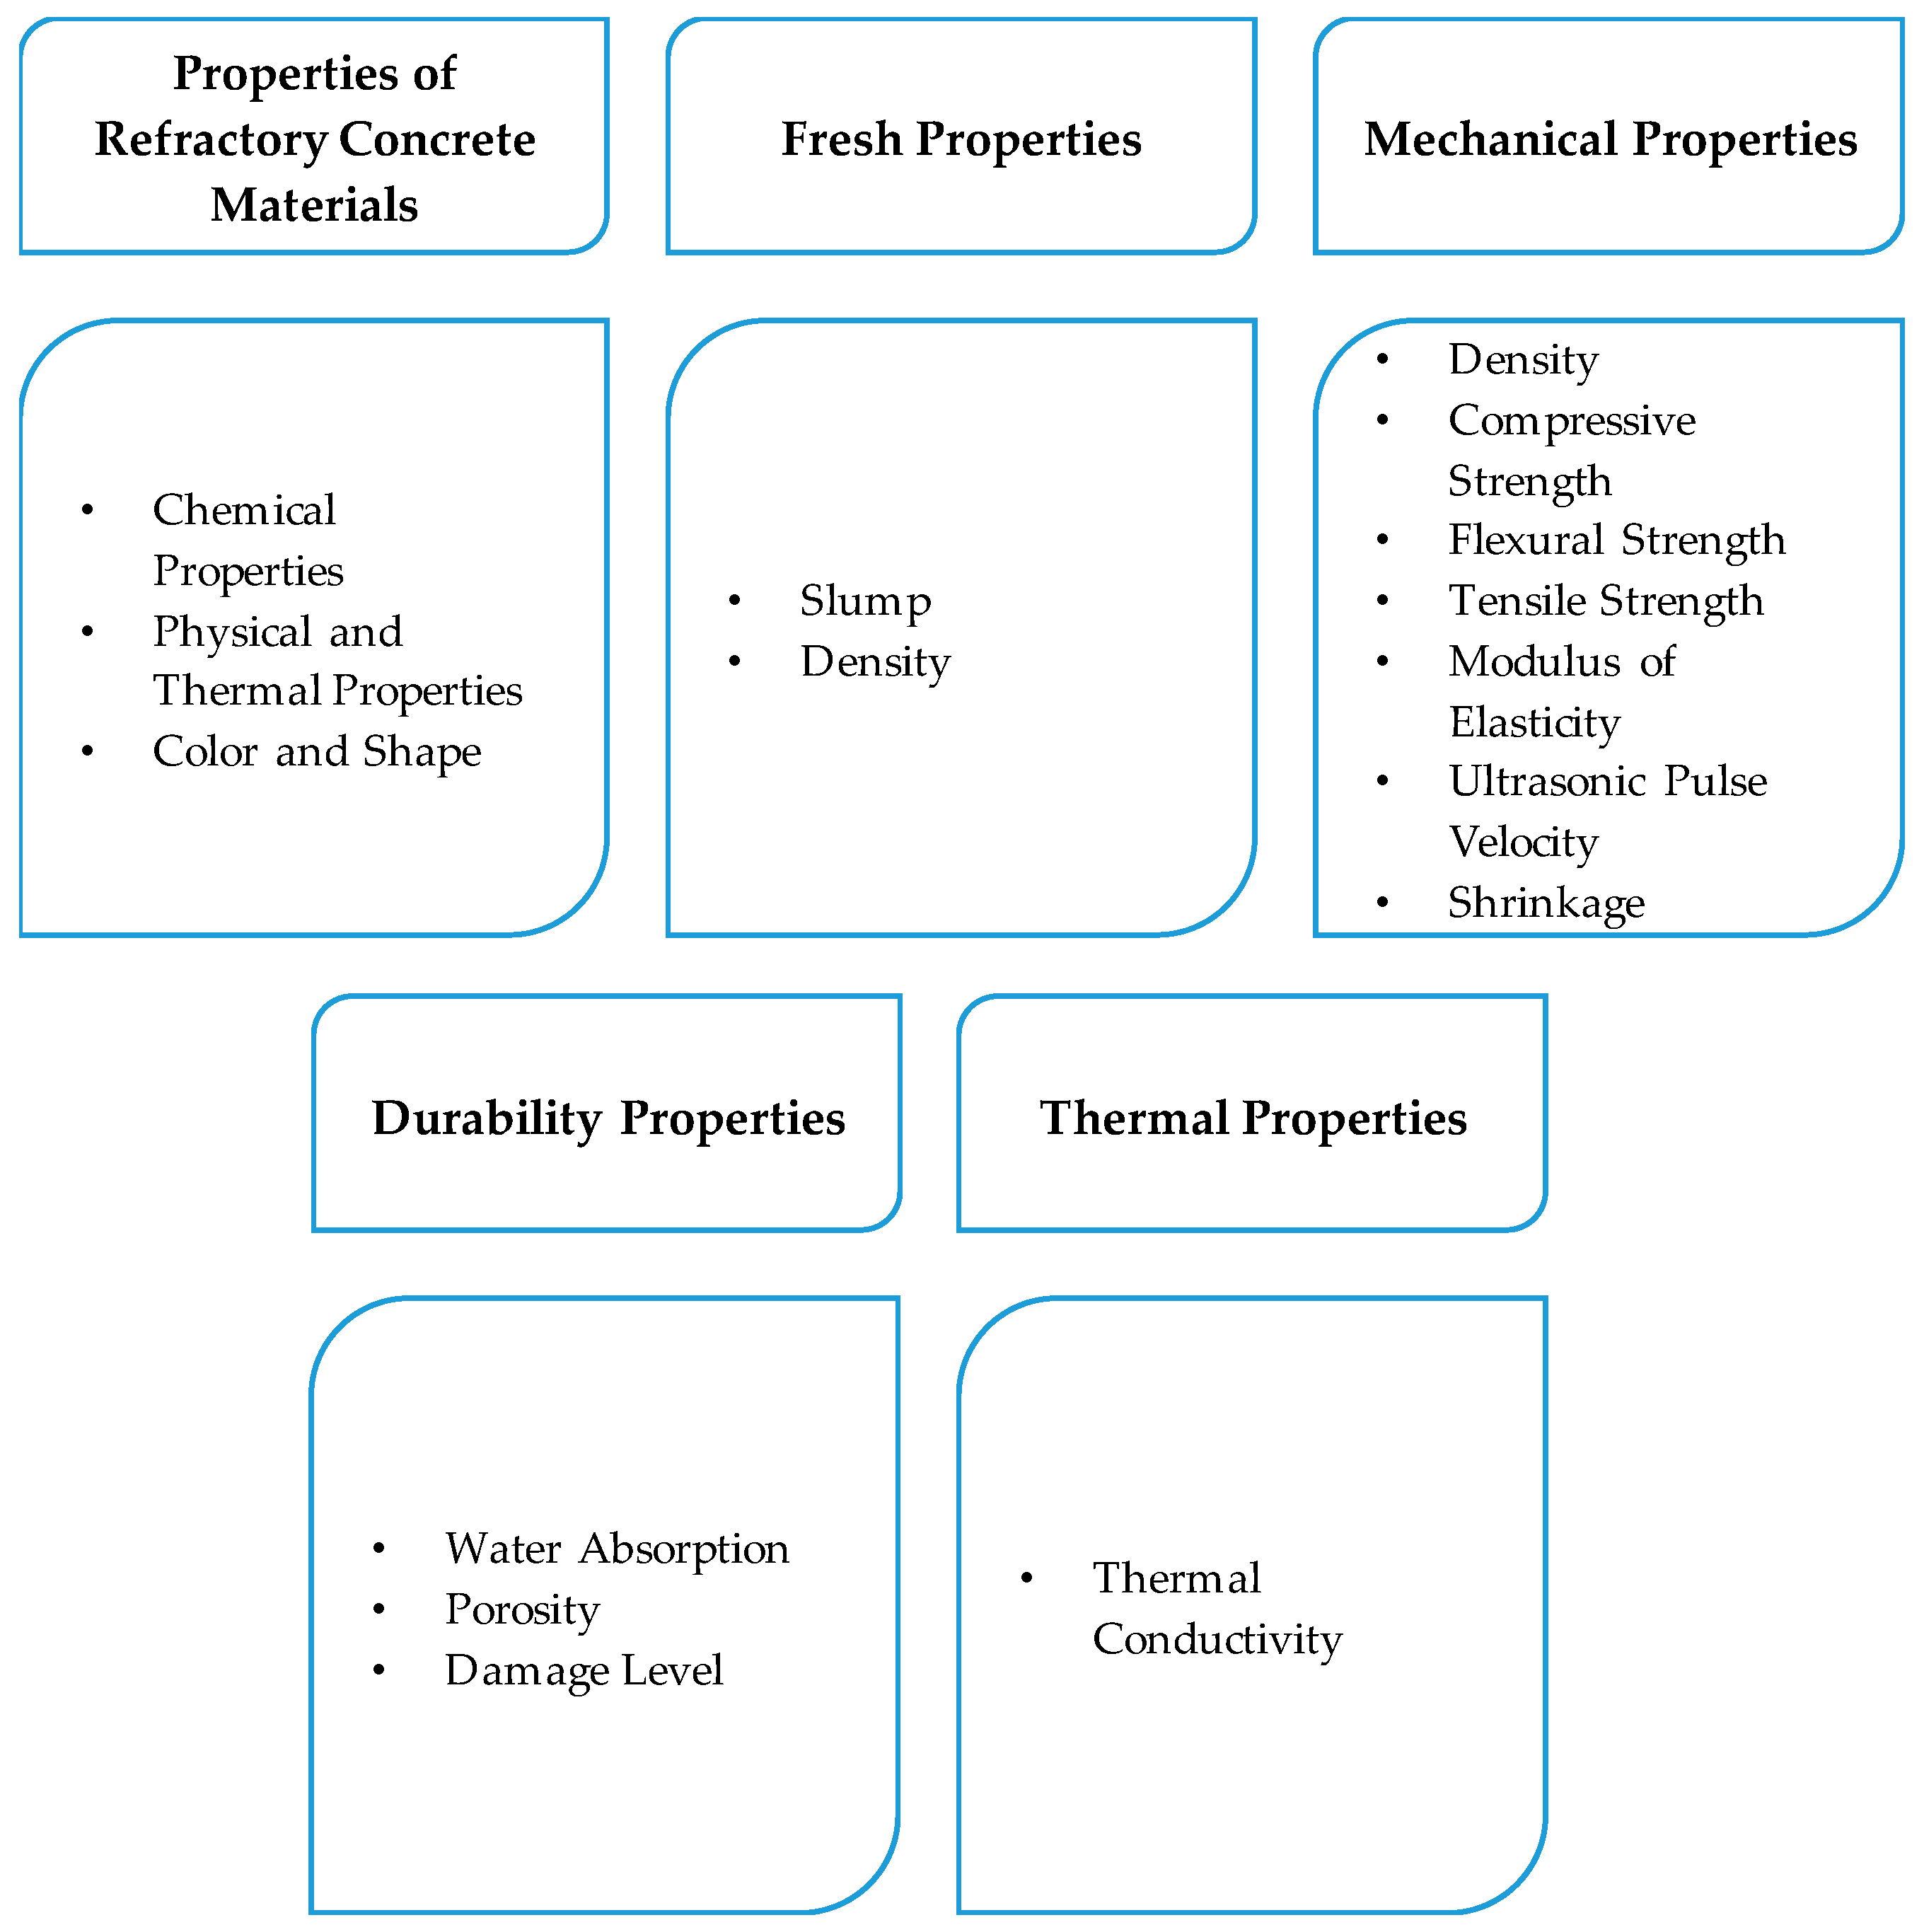
2.2. Properties of Refractory Concrete Materials
2.2.1. Chemical Properties
2.2.2. Physical and Thermal Properties
2.2.3. Color and Shape

| Quantity (%) | SiO2 | Al2O3 | Fe2O3 | CaO | MgO | TiO2 | Na2O | K2O | SO3 | Mn2O3 | P2O5 | SrO | MnO | BaSO4 | BaO | FeO | LOI 1 (%) |
|---|---|---|---|---|---|---|---|---|---|---|---|---|---|---|---|---|---|
| Standard CAC | |||||||||||||||||
| [15] | 3–8 | 36–42 | 12–20 | 36–40 | ~1 | ~2 | - | - | - | - | - | - | - | - | - | - | - |
| [16] | 3–8 | 36–42 | 12–20 | 36–42 | <1 | <3 | ~0.1 | ~0.1 | - | - | - | - | - | - | - | - | - |
| [18] | 3–8 | 36–42 | 2–3.5 | 36–40 | 1 | <0.5 | - | - | - | - | - | - | - | - | - | - | - |
| [19] | 4.40 | 40.30 | 15.20 | 37.43 | 0.47 | - | 0.16 | 0.14 | 0.06 | - | - | - | - | - | - | - | - |
| [20] | 4.98 | 38.23 | 15.4 | 37.53 | 0.71 | 1.8 | 0.03 | 0.23 | 0.06 | 0.23 | 0.13 | 0.02 | - | - | - | - | 0.65 |
| [21] | 4.72 | 36.56 | 17.10 | 36.41 | 1.26 | 2.36 | 0.24 | 0.13 | - | - | - | - | - | - | - | - | 0.14 |
| [22] | 3.23 | 39.92 | 15.44 | 34.10 | - | - | - | - | - | - | - | - | - | - | - | - | - |
| [23] | 4–5 | 37–40 | 15–18 | 37–39 | <1 | <4 | - | - | - | - | - | - | - | - | - | - | - |
| [24] | 3.85 | 40.35 | 16.28 | 37.50 | 0.96 | - | 0.08 | 0.15 | - | - | - | - | 0.2 | - | - | - | - |
| [25] | 4–5 | 37–40 | 15–18 | 37–39 | <1 | - | - | - | - | - | - | - | - | - | - | - | - |
| [26] | 4.72 | 36.56 | 17.10 | 36.41 | 1.26 | 2.36 | 0.24 | 0.13 | - | - | - | - | - | - | - | - | 0.14 |
| Range | 3–8 | 36–42 | 2–18 | 34.1–40 | 0.47–1.26 | 1.8–4 | 0.03–0.24 | 0.1–0.23 | - | - | - | - | - | - | - | - | 0.14–0.65 |
| Medium CAC | |||||||||||||||||
| [15] | 3–8 | 48–60 | 1–3 | 36–40 | ~0.1 | ~3 | - | - | - | - | - | - | - | - | - | - | - |
| [16] | 3–8 | 48–60 | 1–3 | 36–42 | <1 | <3 | ~0.1 | ~0.1 | - | - | - | - | - | - | - | - | - |
| [27] | 7.60 | 54.5 | 2.6 | 33.40 | 0.7 | - | - | - | 0.2 | - | - | - | - | - | - | - | - |
| [28] | 4.–5.5 | 50.8–54.2 | 1–2.2 | 35.9–38.9 | - | - | - | - | - | - | - | - | - | - | - | - | - |
| [29] | 4–5.5 | 50.8–54.2 | 1–2.2 | 35.9–38.9 | - | - | - | - | - | - | - | - | - | - | - | - | - |
| Range | 3–8 | 48–60 | 1–3 | 33.4–40 | - | - | - | - | - | - | - | - | - | - | - | - | - |
| High CAC 70 | |||||||||||||||||
| [8] | 0.44 | 70.2 | 0.06 | 28.50 | - | 0.2 | 0.4 | 0.2 | - | - | - | - | - | - | - | - | - |
| [15] | <0.5 | 65–75 | <0.5 | 25–30 | - | - | - | - | - | - | - | - | - | - | - | - | - |
| [16] | <0.5 | 65–75 | <0.5 | 25–35 | ~0.1 | <0.1 | <0.3 | ~0.05 | - | - | - | - | - | - | - | - | - |
| [29] | 0.2–0.6 | 68.7–70.5 | 0.1–0.3 | 28.5–30.5 | - | - | - | - | - | - | - | - | - | - | - | - | - |
| [30] | 13 | 73 | 1.3 | 9.30 | - | - | - | - | - | - | - | - | - | - | - | - | - |
| [31] | <0.5 | 69–71 | <0.3 | - | - | - | - | - | - | - | - | - | - | - | - | - | - |
| Range | 0.44–13 | 65–73 | 0.06–1.3 | 9.3–30.5 | - | - | - | - | - | - | - | - | - | - | - | - | - |
| High CAC 80 | |||||||||||||||||
| [15] | <0.2 | 80–82 | <0.2 | 15–20 | - | - | - | - | - | - | - | - | - | - | - | - | - |
| [16] | <0.5 | >79 | <0.5 | <20 | ~0.1 | <0.1 | <0.3 | ~0.05 | - | - | - | - | - | - | - | - | - |
| [29] | 0.35 | 79.5–82.0 | 0.20 | 16.2–17.8 | - | - | - | - | - | - | - | - | - | - | - | - | - |
| Range | - | 79–82 | - | 15–17.8 | - | - | - | - | - | - | - | - | - | - | - | - | - |
| Barite | |||||||||||||||||
| [32] | 1.36 | 0.32 | 0.10 | 0.15 | 0.38 | - | - | - | - | - | - | - | - | 96.12 | - | - | 1.05 |
| [33] | 3.38 | 0.61 | 0.53 | 0.42 | - | - | - | - | 32.42 | - | - | - | - | - | 62.08 | - | - |
| Range | 1.6–3.38 | 0.32–0.61 | 0.10–0.53 | 0.15–0.42 | - | - | - | - | - | - | - | - | - | - | - | - | - |
| Pumice | |||||||||||||||||
| [32] | 42.49 | 14.83 | 14.86 | 9.45 | 10.07 | - | 3.89 | 1.45 | - | - | - | - | - | - | - | - | 2.39 |
| [34] | 55.23 | 42.05 | 0.83 | 0.31 | 0.45 | - | 0.61 | 0.2 | 0.32 | - | - | - | - | - | - | - | - |
| Range | 42.49–55.23 | 14.83–42.05 | 0.83–14.86 | 0.31–9.45 | 0.45–10.07 | - | 0.61–3.89 | 0.2–1.45 | - | - | - | - | - | - | - | - | - |
| Reactive Alumina | |||||||||||||||||
| [35] | - | 99.7 | - | 0.02 | - | - | 0.098 | - | - | - | - | - | - | - | - | - | - |
| [36] | 0.03 | 99.80 | 0.02 | 0.02 | 0.09 | - | 0.08 | - | - | - | - | - | - | - | - | - | - |
| Tabular Alumina | |||||||||||||||||
| [35] | - | ≥99.4 | - | 0.02 | - | - | <0.38 | - | - | - | - | - | - | - | - | - | - |
| Basalt | |||||||||||||||||
| [32] | 42.71 | 14.18 | 4.73 | 8.82 | 8.96 | 2.97 | 3.25 | 1.21 | 0.11 | - | 0.48 | - | - | - | - | 8.56 | 2.93 |
| Quantity (%) | SiO2 | Al2O3 | Fe2O3 | CaO | MgO | SO3 | K2O | Na2O | TiO2 | P2O5 | BaO | MnO | SiC | Cr2O3 | ZrO2 | PbO | LOI 1 (%) |
|---|---|---|---|---|---|---|---|---|---|---|---|---|---|---|---|---|---|
| Vermiculite | |||||||||||||||||
| [21] | 35.40 | 17.80 | 16.70 | 6.90 | 17.30 | - | 4.68 | - | - | - | - | - | - | - | - | - | - |
| [24] | 41.20 | 14.94 | 7.20 | 3.95 | 25.50 | - | 5.10 | - | 1.40 | - | - | - | - | - | - | - | - |
| [26] | 38.76 | 15.89 | 12.06 | 2.32 | 17.69 | 0.38 | 5.50 | 0.30 | - | - | - | - | - | - | - | - | - |
| [37] | 41.80 | 14.20 | 11.70 | 5.60 | 18.40 | - | - | - | - | - | - | - | - | - | - | - | 3.20 |
| [38] | 34.10 | 17.20 | 14.70 | 6.40 | 16.30 | - | 4.52 | - | - | - | - | - | - | - | - | - | - |
| Range | 34.1–41.8 | 14.2–17.8 | 7.2–16.7 | 2.32–6.9 | 16.3–25.5 | - | 4.52–5.5 | - | - | - | - | - | - | - | - | - | - |
| Perlite | |||||||||||||||||
| [24] | 74.40 | 15.40 | 1.30 | - | 0.13 | - | 4.55 | 3.38 | - | - | - | - | - | - | - | - | - |
| [39] | 70.96 | 13.40 | 1.16 | 1.72 | 0.28 | - | 4.65 | 3.20 | - | - | - | - | - | - | - | - | - |
| [40] | 70–75 | 12–15 | 0.5–2.0 | 0.5–1.5 | 0.2–0.7 | - | 3–5 | 3–4 | - | - | - | - | - | - | - | - | - |
| [41] | 72.30 | 13.40 | 0.51 | 0.83 | 0.12 | - | 4.81 | 3.15 | 0.09 | - | - | - | - | - | - | - | - |
| Range | 70–75 | 12–15.4 | 0.5–1.3 | 0.5–1.72 | 0.12–0.7 | - | 3–5 | 3–4 | - | - | - | - | - | - | - | - | - |
| Diatomite | |||||||||||||||||
| [42] | 57.61 | 15.75 | 5.55 | 7.73 | 4.17 | 0.50 | 2.08 | 5.60 | - | - | - | - | - | - | - | - | 14.99 |
| [43] | 82.15 | 3.84 | 5.23 | 2.39 | 0.66 | 1.82 | 0.32 | 0.41 | 0.35 | 1.19 | 0.69 | - | - | - | - | - | 0.95 |
| Range | 57.61–82.15 | 3.84–15.75 | 5.23–5.55 | 2.39–7.73 | 0.66–4.17 | 1.82–0.5 | 0.32–2.08 | 0.41–5.6 | - | - | - | - | - | - | - | - | 0.95–14.99 |
| Expanded Clay | |||||||||||||||||
| [44] | 75.05 | 10.95 | 3.55 | 0.59 | 0.83 | - | 1.94 | 0.98 | 0.64 | - | - | - | - | - | - | - | 4.80 |
| [45] | 18.03 | 6.15 | 3.25 | 3.46 | 4.10 | - | 3.58 | 0.74 | 0.55 | - | - | - | - | - | - | - | 7.94 |
| Range | 18.03–75.05 | 6.15–10.95 | 3.25–3.55 | 3.46–0.59 | 4.10–0.83 | - | 3.58–1.94 | 0.74–0.98 | 0.55–0.64 | - | - | - | - | - | - | - | 7.94–4.80 |
| Alag | |||||||||||||||||
| [29] | 2.79 | 39.88 | 14.48 | 36.02 | - | - | - | - | 1.61 | - | - | - | - | - | - | - | - |
| Alumina Bubble | |||||||||||||||||
| [46] | 0.50 | 96.97 | 0.21 | - | - | - | - | - | - | - | - | - | - | - | - | - | - |
| Chamotte | |||||||||||||||||
| [25] | 52.00 | 40.00 | 1.50 | 0.50 | 0.30 | - | - | - | 5.00 | - | - | - | - | - | - | - | - |
| [29] | 19.90 | 70.80 | 1.90 | - | - | - | - | 0.50 | 6.50 | - | - | - | - | - | - | - | - |
| [31] | 49.75 | 42.80 | 1.93 | - | 0.12 | - | - | - | 1.35 | - | - | 0.04 | - | - | - | - | - |
| Range | 19.9–52 | 40–70.8 | 1.5–1.93 | - | 0.12–0.3 | - | - | - | 1.35–6.5 | - | - | 0.04 | - | - | - | - | - |
| Pumice | |||||||||||||||||
| [47] | 74.10 | 13.45 | 1.40 | 1.17 | 0.35 | - | 4.10 | 3.70 | - | - | - | - | - | - | - | - | 1.54 |
| [48] | 75.51 | 9.94 | 1.10 | 0.25 | 0.04 | - | 5.12 | 2.04 | - | - | - | - | - | - | - | - | 4.27 |
| Range | 74.1–75.51 | 9.94–13.45 | 1.1–1.4 | 0.25–1.17 | 0.04–0.35 | - | 4.1–5.12 | 2.04–3.7 | - | - | - | - | - | - | - | - | 1.54–4.27 |
| Silicon Carbide | |||||||||||||||||
| [8] | 2.10 | 1.20 | 0.30 | 0.20 | - | - | - | - | - | - | - | - | 96.20 | - | - | - | - |
| Limestone | |||||||||||||||||
| [49] | 2.69 | 0.16 | 0.57 | 53.36 | 0.21 | - | 0.41 | 0.32 | - | - | - | - | - | - | - | - | 42.20 |
| Granite | |||||||||||||||||
| [18] | 91.18 | 0.22 | 1.90 | 0.53 | 1.82 | 0.37 | 1.13 | 0.08 | 0.05 | 0.04 | - | 0.11 | - | - | - | - | 2.72 |
| [49] | 63.05 | 11.26 | 5.85 | 13.19 | 4.17 | - | 1.08 | 0.69 | - | - | - | - | - | - | - | - | 0.60 |
| Range | 63.05–91.18 | 0.22–11.26 | 1.9–5.85 | 0.53–13.19 | 1.82–4.17 | - | 1.08–1.13 | 0.08–0.69 | - | - | - | - | - | - | - | - | 0.60–2.72 |
| Quartzite | |||||||||||||||||
| [49] | 91.14 | 3.38 | 2.23 | - | - | - | 0.30 | 2.71 | - | - | - | - | - | - | - | - | 0.10 |
| Bauxite | |||||||||||||||||
| [50] | 9.26 | 81.29 | 1.82 | 0.44 | 0.37 | 0.02 | 0.17 | 0.07 | 1.45 | 0.54 | - | - | - | 0.12 | 0.27 | 1.60 | 1.81 |
| Grog | |||||||||||||||||
| [50] | 26.64 | 51.93 | 2.99 | 1.22 | 0.51 | 0.88 | 4.90 | 1.42 | 3.74 | 1.06 | - | - | - | 0.07 | 0.19 | 0.01 | - |
| Synthetic Calcium Aluminate | |||||||||||||||||
| [51] | 3–5 | 37.5–43.5 | 14–18 | 35–40 | - | - | - | - | - | - | - | - | - | - | - | - | - |
| Properties | Specific Gravity (g/cm3) | Surface Area (cm2/g) | Density (g/cm3) | Fineness (cm2/g) | Refractoriness (°C) | Fire resistance (°C) | Porosity (%) |
|---|---|---|---|---|---|---|---|
| Standard CAC | |||||||
| [21] | 3.2 | 3053 | - | - | - | - | - |
| [22] | 3.14 | 3200 | - | - | - | - | - |
| [23] | - | 3100 | 3.2 | - | - | - | - |
| [25] | 3.2 | 3000–3300 | - | - | 1280 | - | - |
| [26] | 3.2 | 3053 | - | - | - | - | - |
| Medium CAC | |||||||
| [27] | 3.34 | - | - | - | - | - | - |
| [29] | 2.95–3.05 | - | - | - | - | - | - |
| High CAC 70 | |||||||
| [8] | - | 4250 | 1.1 | - | - | 1630 | - |
| [29] | 2.90–3.05 | - | - | - | - | - | - |
| High CAC 80 | |||||||
| [29] | 3.2–3.3 | - | - | - | - | - | - |
| Pumice | |||||||
| [32] | - | - | 2.99 | 3260 | - | - | - |
| [34] | 2.54 | 167 | - | - | - | - | - |
| Barite | |||||||
| [32] | - | - | 4.24 | 3480 | - | - | - |
| Basalt | |||||||
| [32] | - | - | 3.05 | 3160 | - | - | - |
| Reactive Alumina | |||||||
| [35] | - | 30,000 | 3.9 | - | - | - | - |
| [36] | - | 30,000–70,000 | 3.91 | - | - | - | - |
| Tabular Alumina | |||||||
| [35] | - | - | 3.79 | - | - | - | ≤5 |
| Properties | Density (kg/m3) | Specific Gravity | Fineness (m2/g) | Unit Weight (kg/m3) | Particle Size (mm) | Moisture Content (%) | Apparent Porosity (%) | Water Absorption (%) | Permeability (%) | pH | Water Holding Capacity | |
|---|---|---|---|---|---|---|---|---|---|---|---|---|
| Vermiculite | ||||||||||||
| [21] | - | 1.03 | - | - | - | - | - | - | 95 | 8.1 | 240% (by weight) 28% (by volume) | |
| [37] | 140 | - | - | - | - | - | - | - | - | - | 220–325% (by weight) 20–50% (by volume) | |
| [38] | 140 | - | - | - | - | - | - | - | - | 6.1 | 240% (by weight) | |
| Perlite | ||||||||||||
| [52] | 80–160 | - | - | - | - | - | - | - | - | - | - | |
| Diatomite | ||||||||||||
| [43] | - | 2.86 | 12.245 | - | - | - | - | - | - | - | - | |
| Expanded Clay | ||||||||||||
| [53] | 440–520 | - | - | - | 2–8 | - | - | 15–25 | - | - | - | |
| Alag | ||||||||||||
| [29] | 3030 | - | - | - | - | - | - | - | - | - | - | |
| Chamotte | ||||||||||||
| [25] | 2150–2300 | - | - | - | - | - | 17–21 | - | - | - | - | |
| Pumice | ||||||||||||
| [48] | - | 2.03 | - | - | - | - | - | 6.38 | - | - | - | |
| Silicon Carbide | ||||||||||||
| [8] | 3120 | - | - | - | - | - | - | - | - | - | - | |
| Shale | ||||||||||||
| [54] | 1487 | - | - | - | - | - | - | 4.5 | - | - | - | |
| Limestone | ||||||||||||
| [43] | 2740 | - | - | - | - | - | - | - | - | - | - | |
| [49] | - | 2.42 | - | 1540.5 | 19 | 1 | - | 1.95 | - | - | - | |
| Basalt | ||||||||||||
| [55] | - | 2.88 | - | - | - | - | - | - | - | - | - | |
| Granite | ||||||||||||
| [49] | - | 2.68 | - | 1649.4 | 19 | 0.5 | - | 1.78 | - | - | - | |
| [55] | - | 2.72 | - | - | - | - | - | - | - | - | - | |
| Quartzite | ||||||||||||
| [49] | - | 2.64 | 1655.7 | - | 19 | 0.8 | - | 1.87 | - | - | - | |
| [55] | - | 2.67 | - | - | - | - | - | - | - | - | - | |
| Properties | Thermal conductivity (W/m.°C) | Thermal conductivity coefficient at 100 °C(W/m.k) | Thermal expansion coefficient at 20 to 1000 °C (K−1.10−6) | Sintering point (°C) | Melting point (°C) | Softening point (°C) | Fire resistance | Specific heat (KJ/Kg.°C) | Refractoriness (°C) | Refractoriness under load (°C) | Thermal shock at 1000 °C | Reversible thermal expansion (%) at 1000 °C |
| Vermiculite | ||||||||||||
| [21] | 0.062–0.065 | - | - | 1150–1250 | - | - | Fireproof | 0.836–1.087 | - | - | - | - |
| [37] | - | - | - | 1200–1320 | - | - | - | - | - | - | - | - |
| [38] | 0.063 | - | - | 1170 | - | - | - | 0.92 | - | - | - | - |
| Perlite | ||||||||||||
| [52] | 0.05 | - | - | - | 1260–1343 | 900–1100 | - | 0.84 | - | - | - | - |
| Chamotte | ||||||||||||
| [25] | - | - | - | - | - | - | - | - | 1700 | 1320–1340 | 15–20 | 0.6–0.7 |
| Silicon Carbide | ||||||||||||
| [8] | - | 140–200 | 3.5–4.0 | - | - | - | - | - | - | - | - | - |
| Basalt | ||||||||||||
| [19] | 1.7 | - | - | - | - | - | - | - | - | - | - | |
| Texture | Color |
|---|---|
| Standard CAC | |
| [15] | Grey |
| [16] | Grey or buff to black |
| Medium CAC | |
| [15] | Buff |
| [16] | Light buff or light grey |
| High CAC 70 | |
| [15] | White |
| [16] | White |
| High CAC 80 | |
| [15] | White |
| [16] | White |
| Texture | Color | Shape |
|---|---|---|
| Vermiculite | ||
| [21] | Gold | Accordion |
| [26] | - | Accordion |
| [37] | Brown or Gold | Accordion |
| [38] | Silver | Accordion |
| Perlite | ||
| [52] | White | - |
| [56] | White | - |
| [57] | - | Spherical |
| Diatomite | ||
| [58] | White | - |
| Expanded Clay | ||
| [53] | Black | Spherical |
| Alag | ||
| [59] | Black | Angular |
| Alumina Bubble | ||
| [46] | - | Crystals |
| [60] | - | Crystals |
| Pumice | ||
| [61] | Dark brown | Angular |
| Silicon Carbide | ||
| [8] | - | Rounded |
| Limestone | ||
| [49] | - | Angular |
| [62] | Grey | - |
| Basalt | ||
| [63] | - | Angular |
| [64] | Dark grey or black | - |
| Granite | ||
| [49] | - | Angular |
| [65] | Grey | - |
| Quartzite | ||
| [49] | - | Angular |
3. Properties of Refractory Concrete
3.1. Properties of Refractory Concrete Containing Refractory Materials as Cement Replacement
3.1.1. Slump
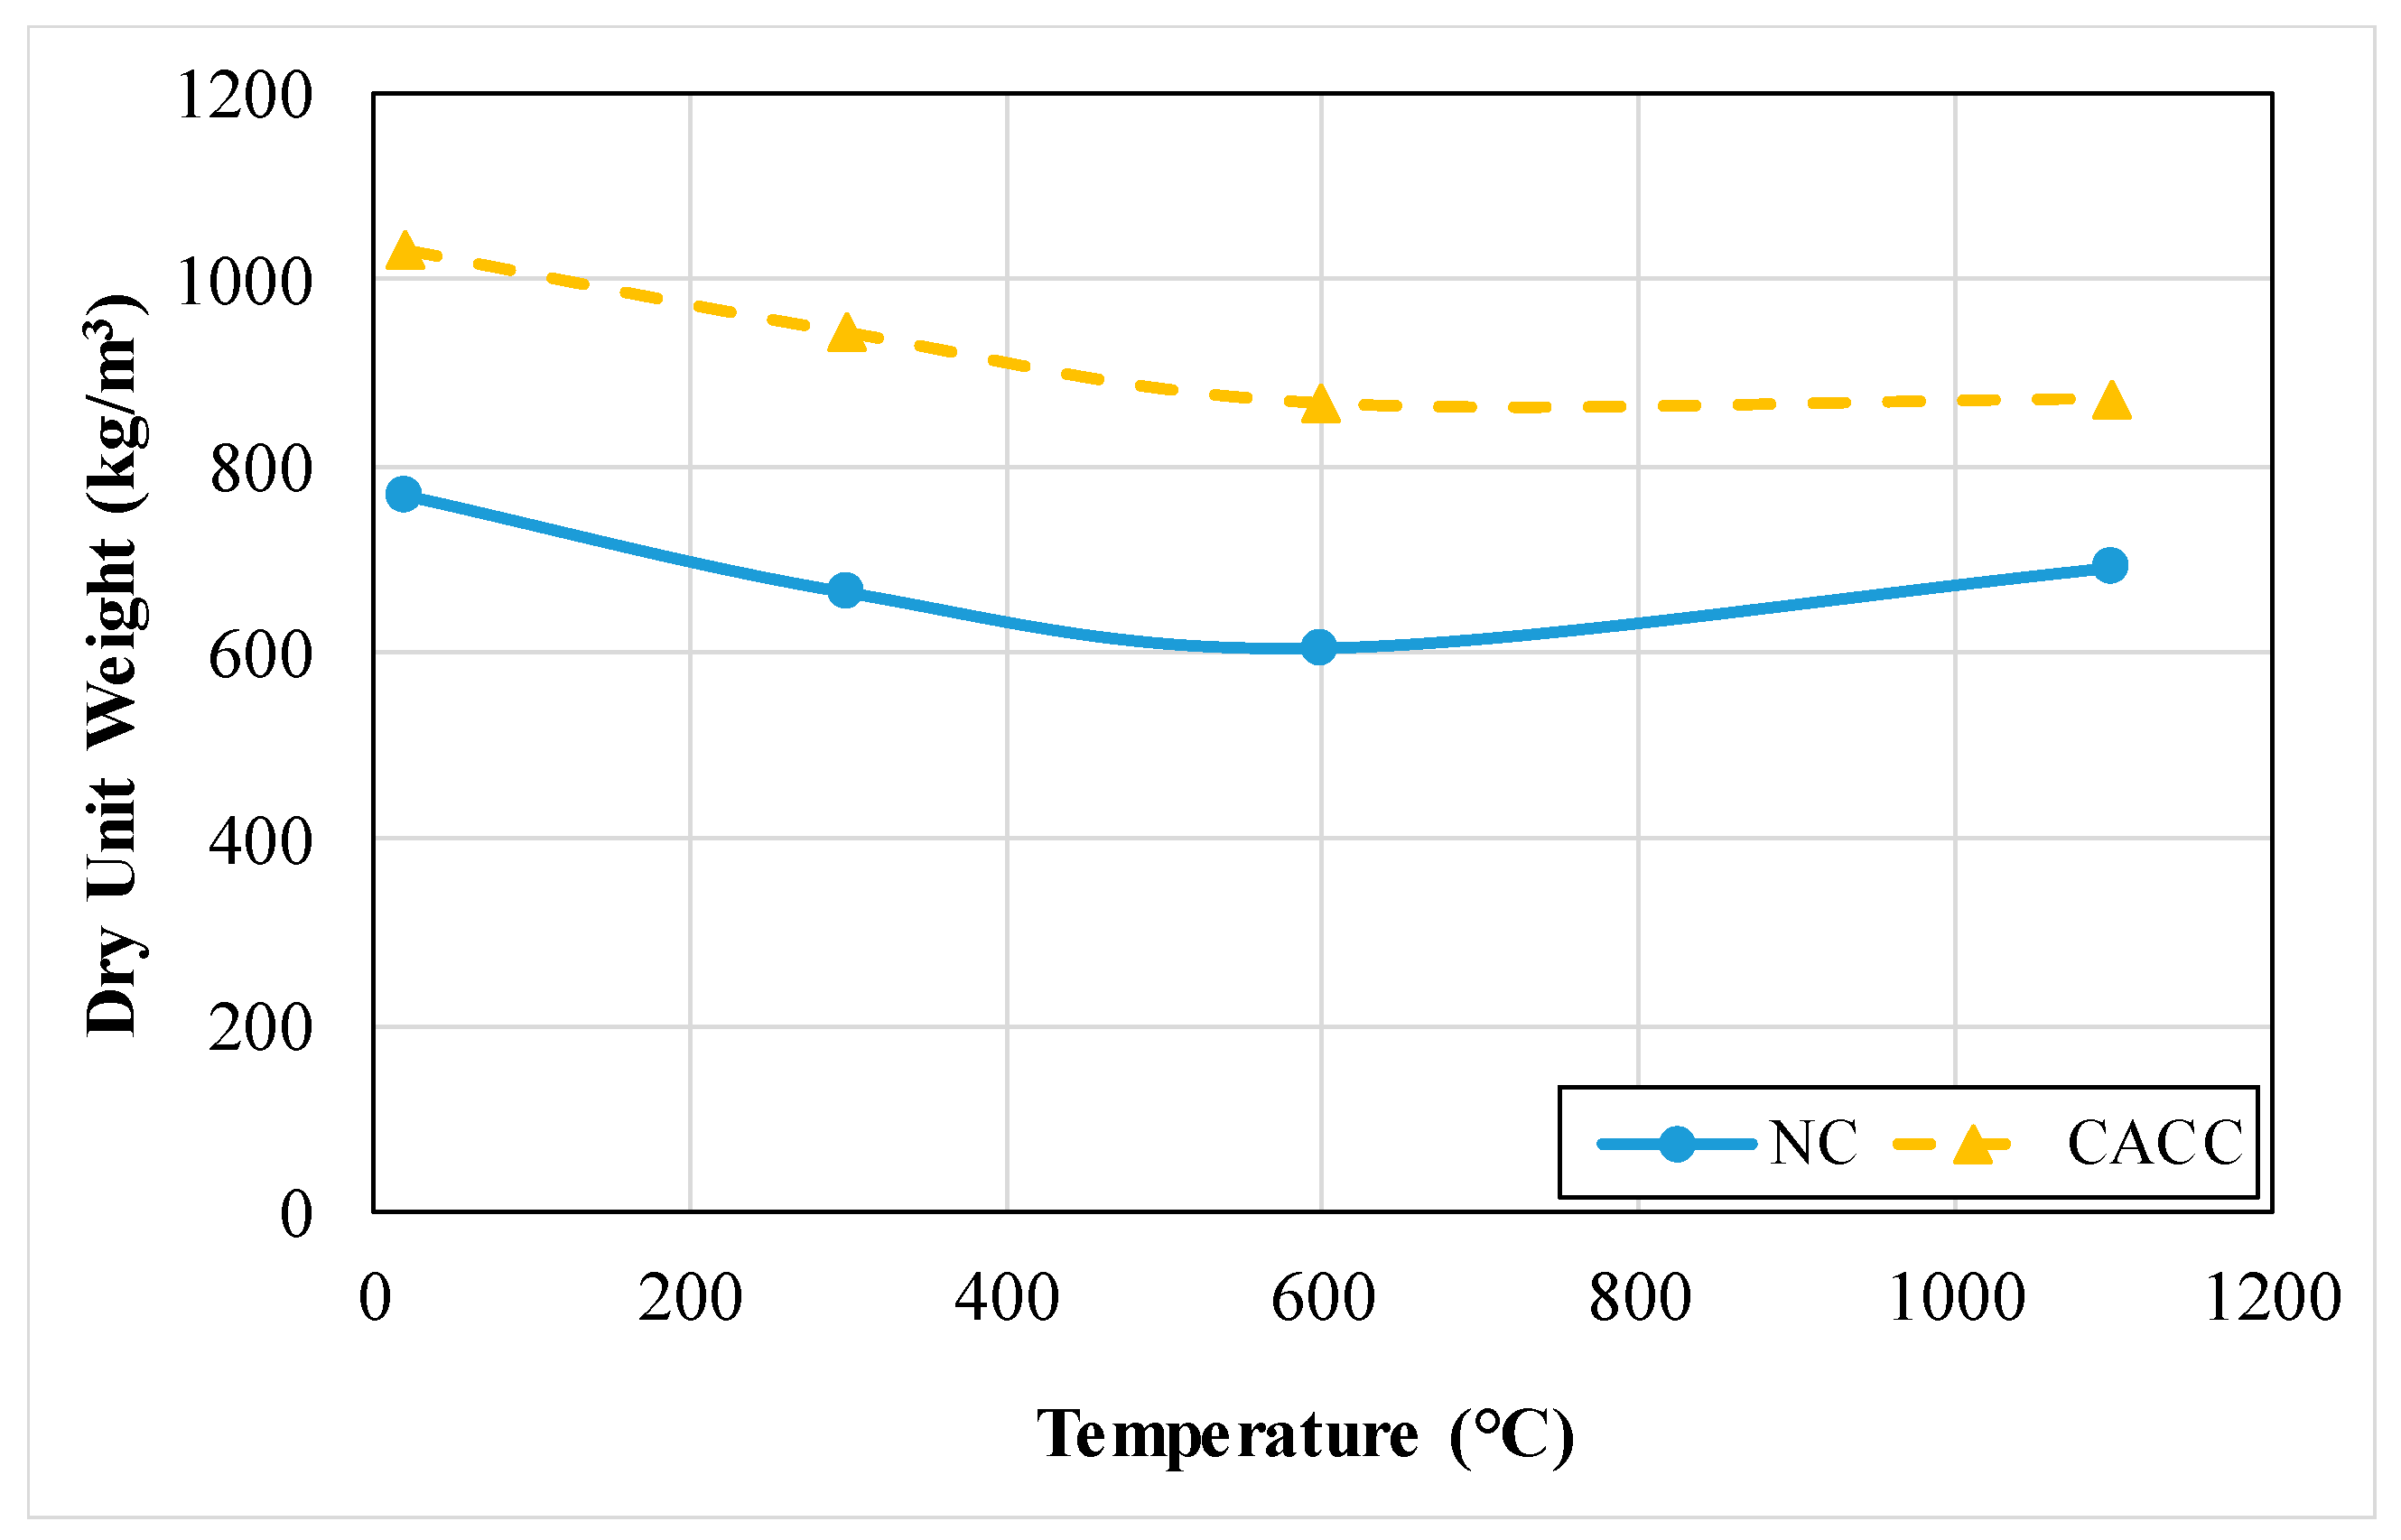
3.1.2. Density or Dry Unit Weight
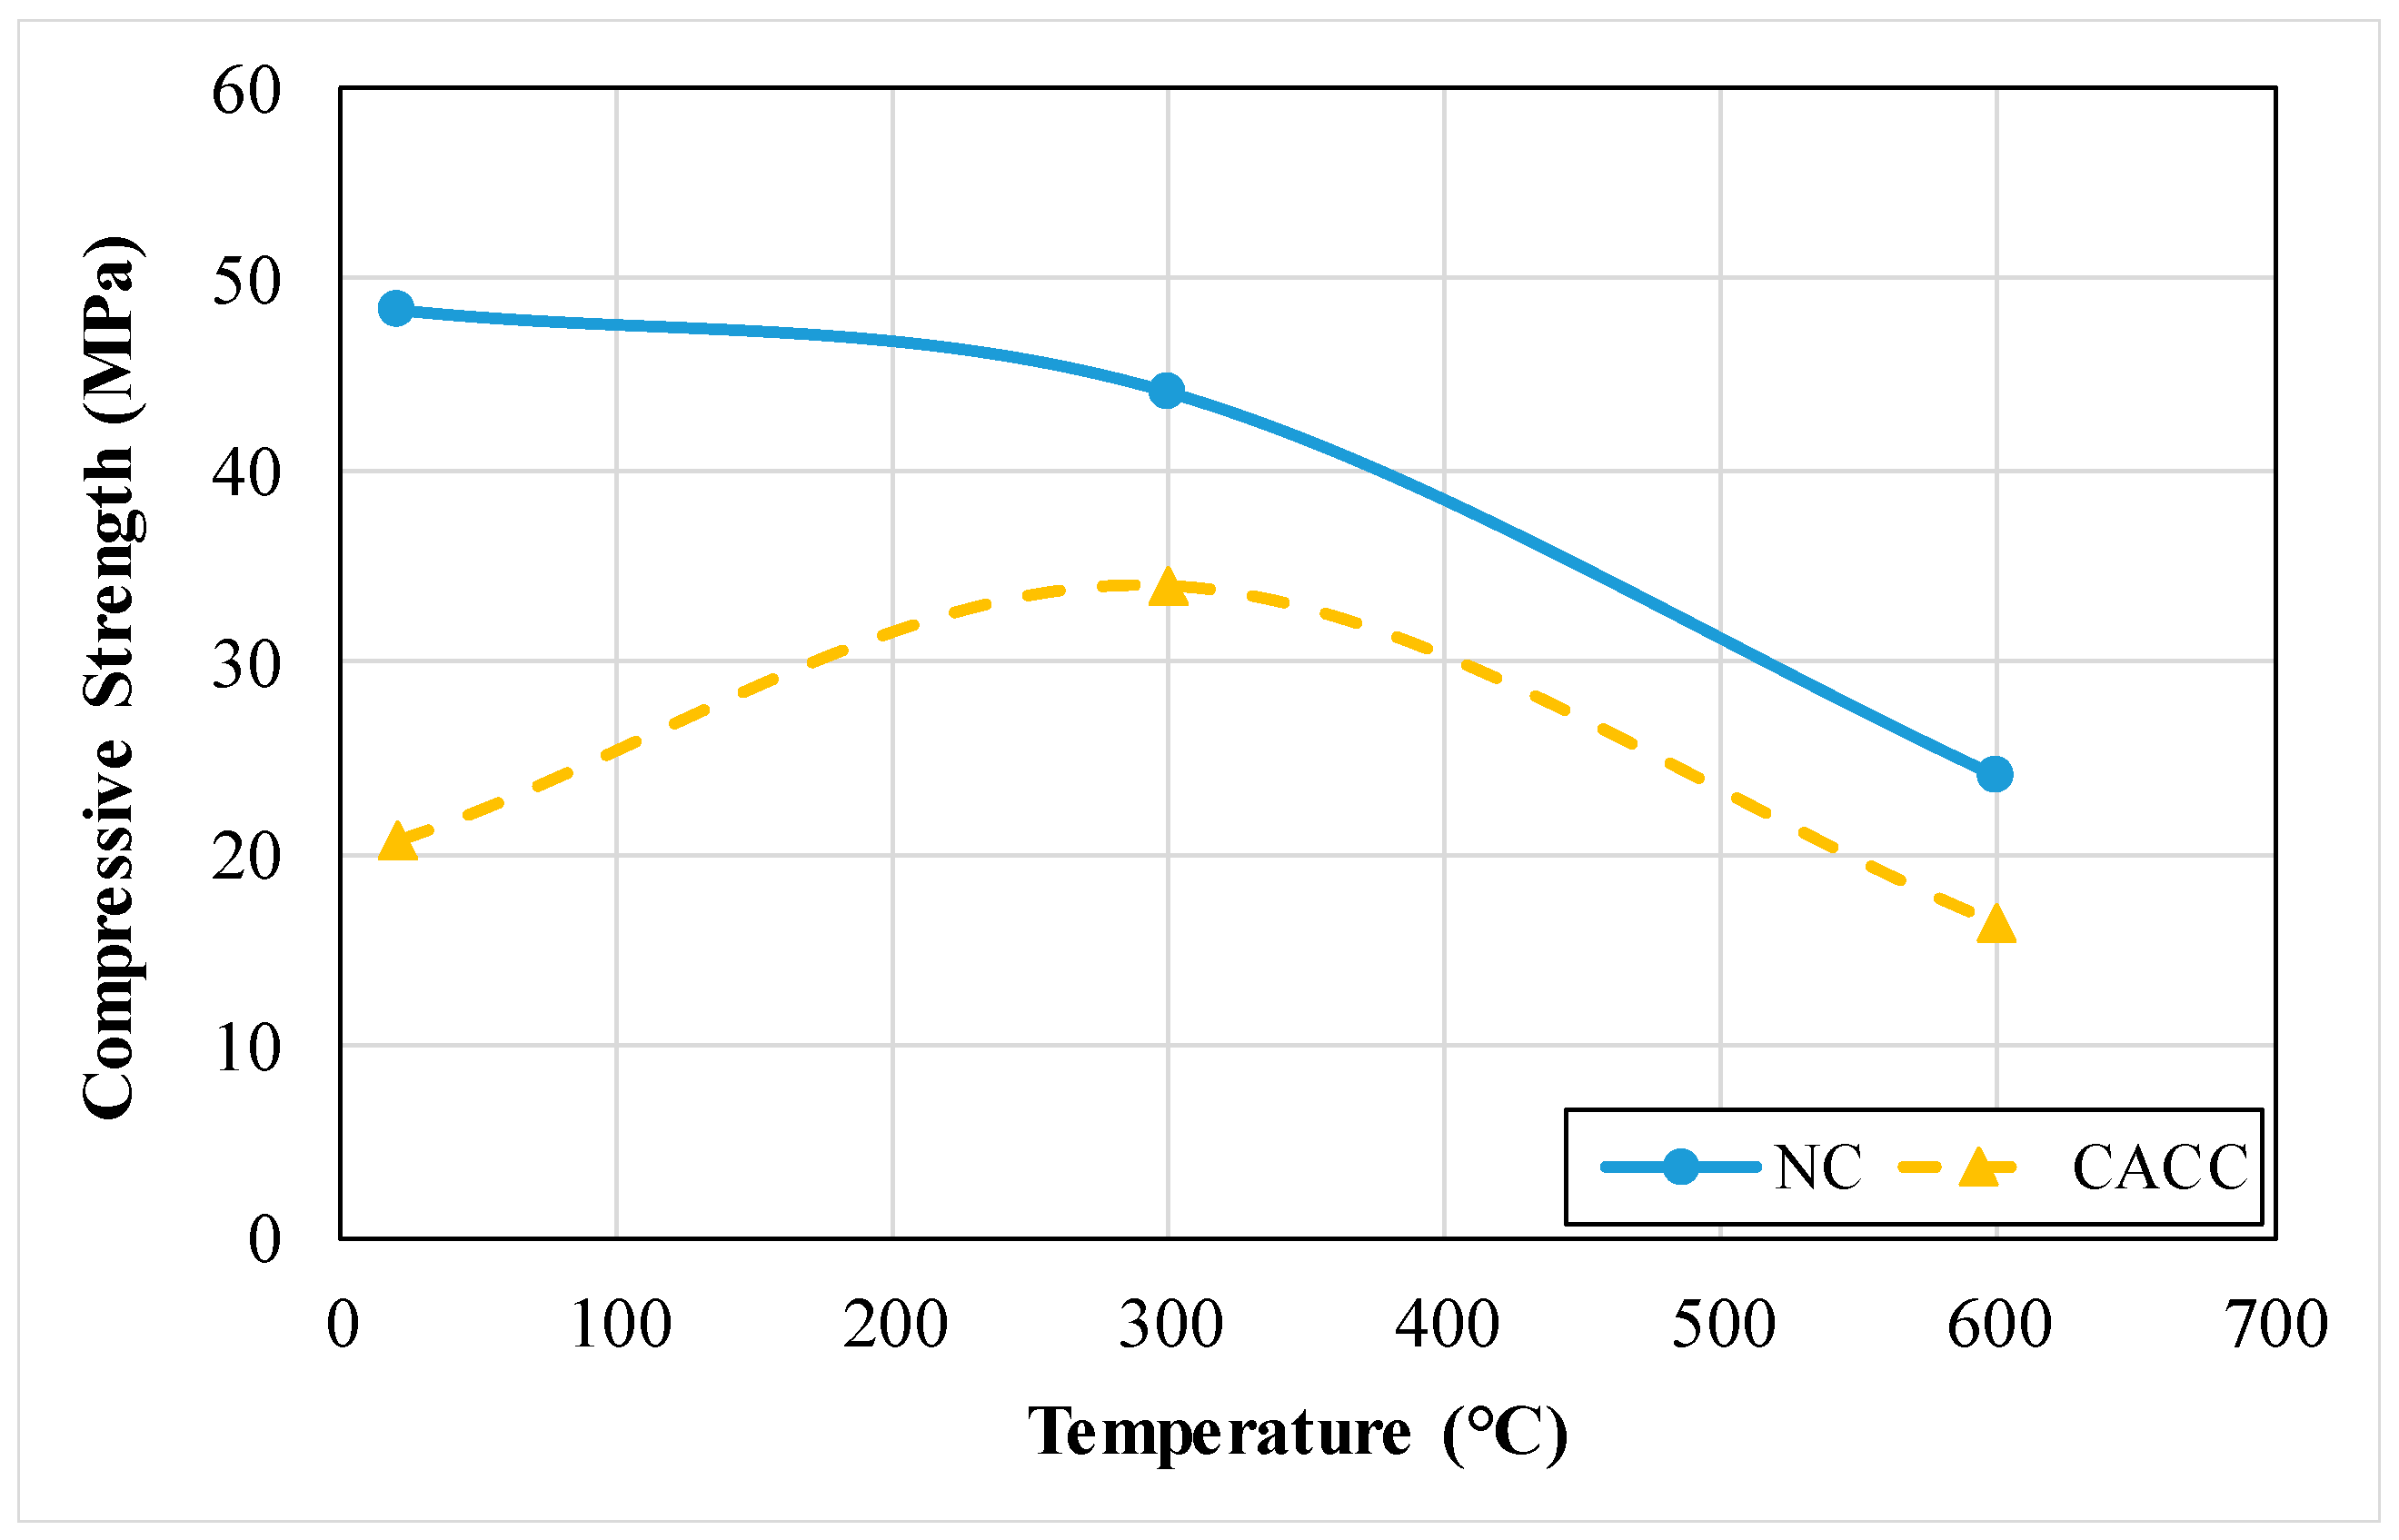
3.1.3. Compressive Strength
3.1.4. Flexural Strength
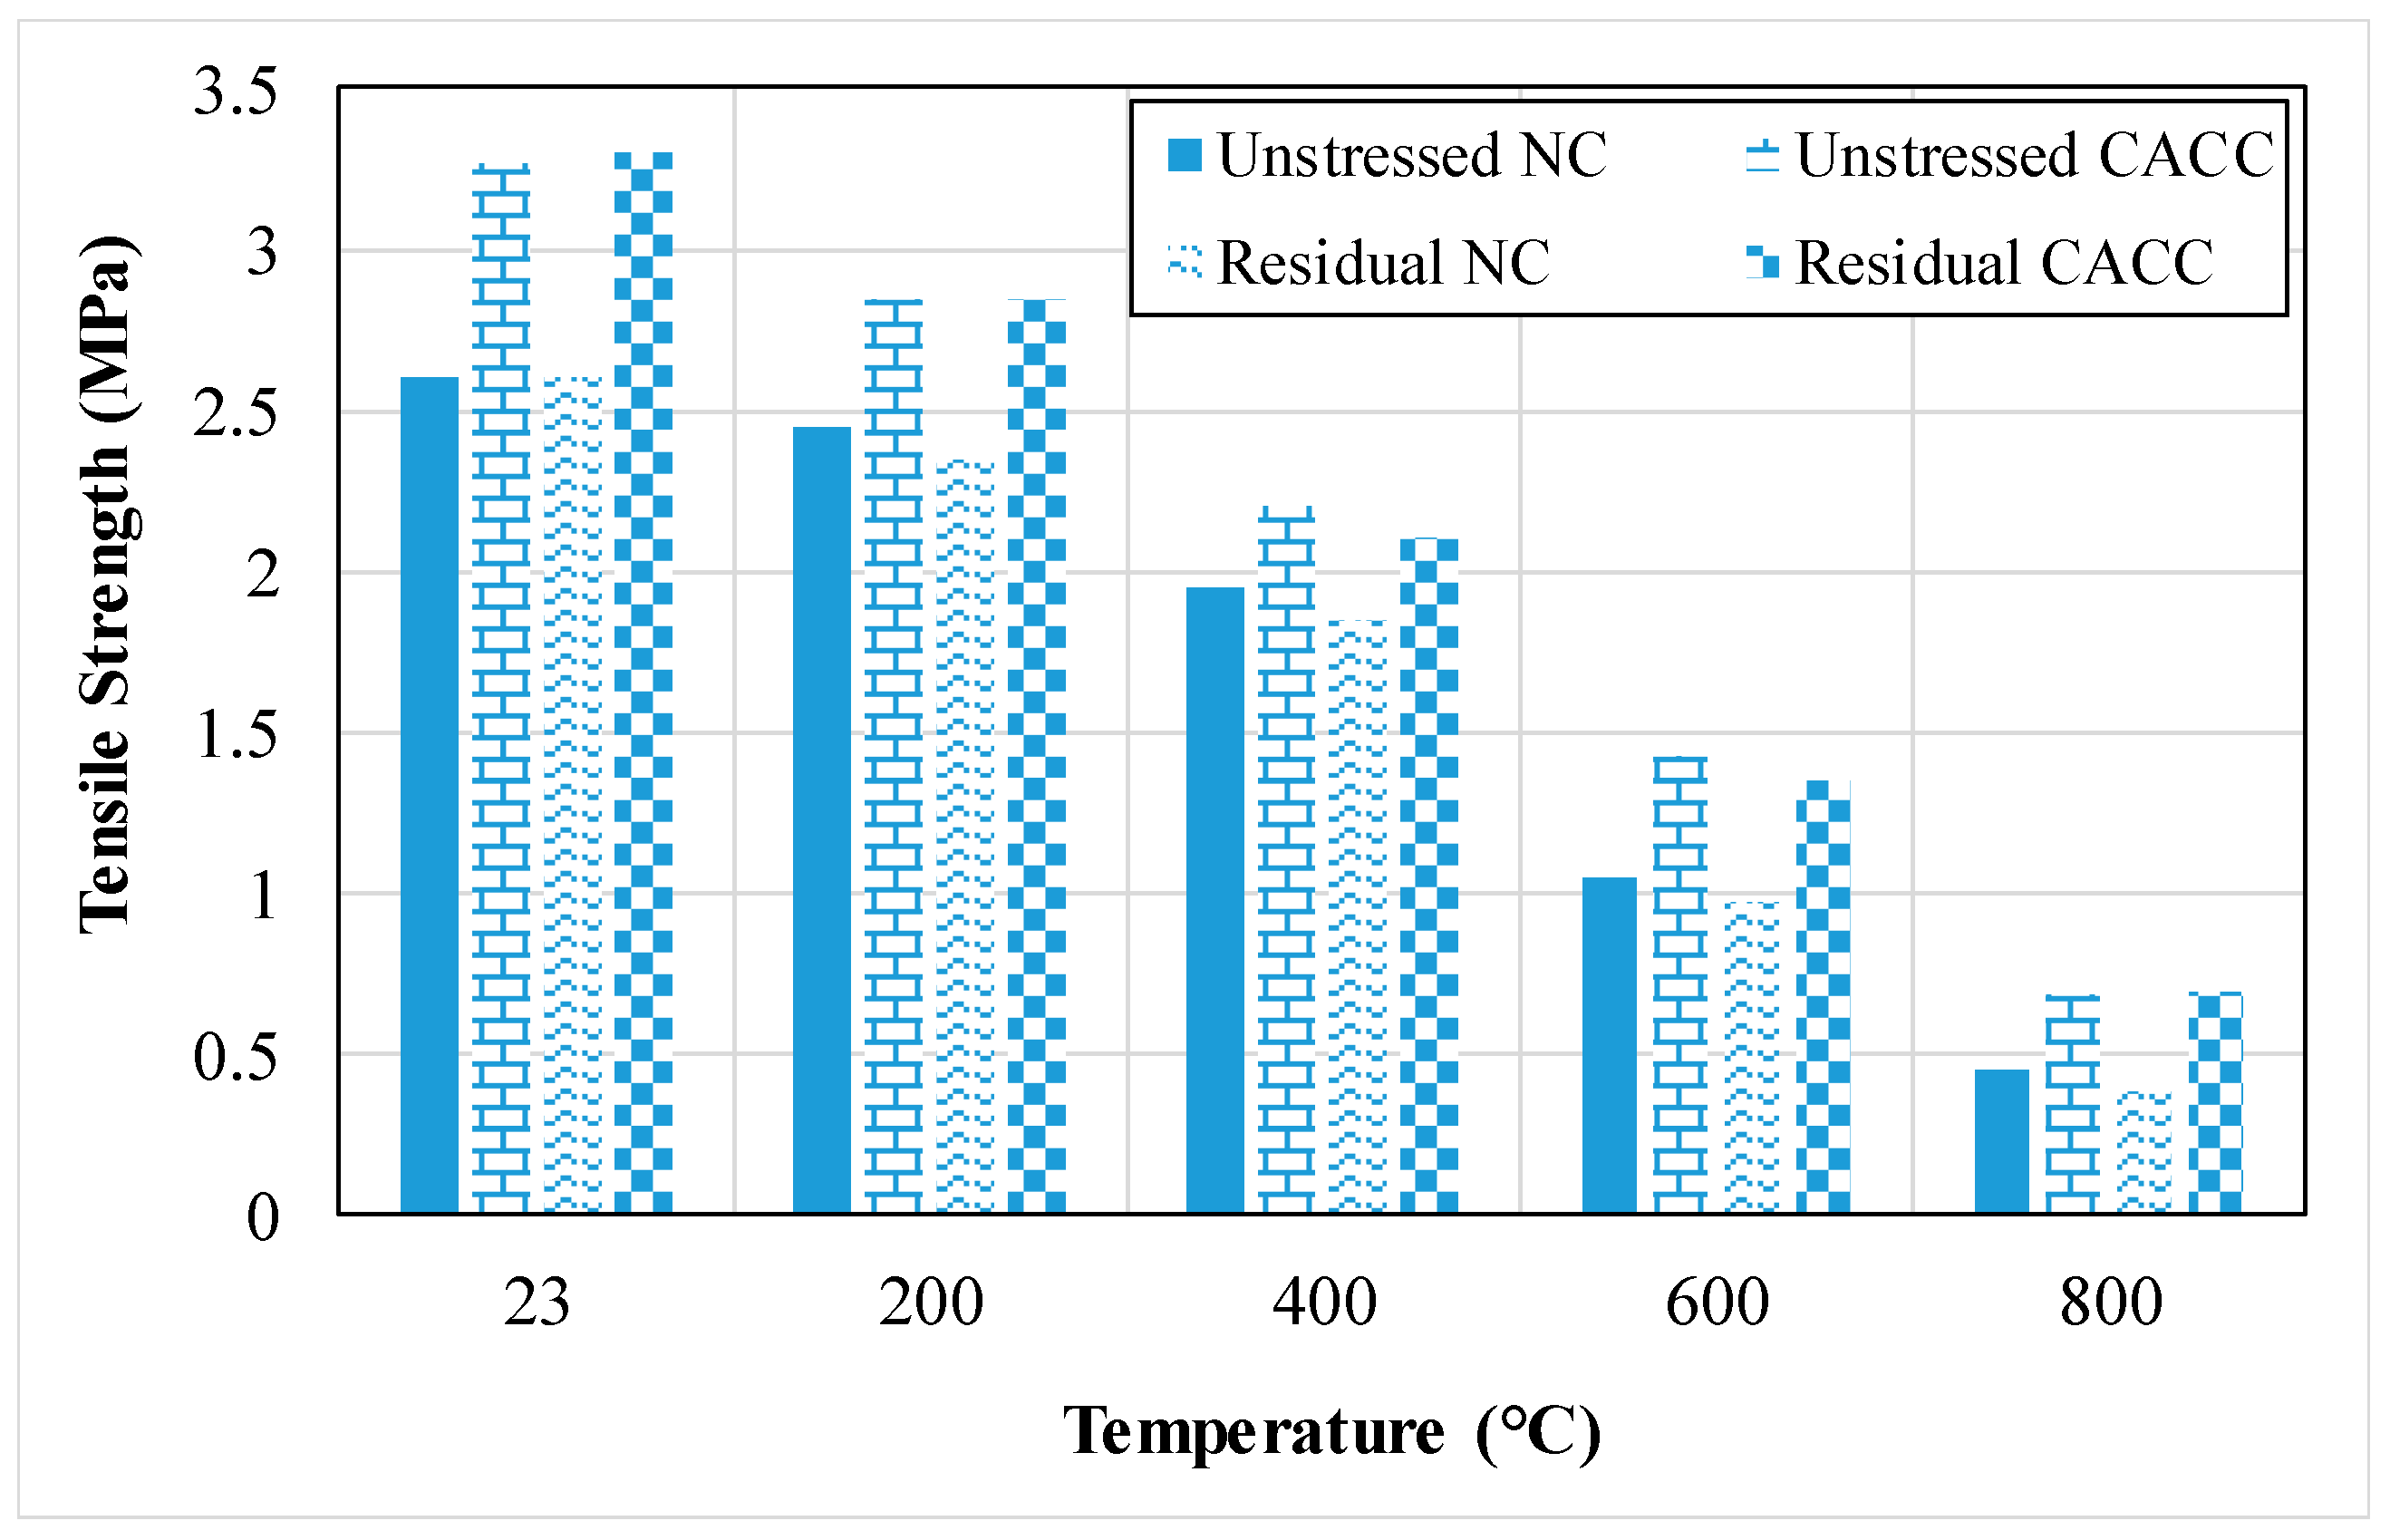
3.1.5. Tensile Strength
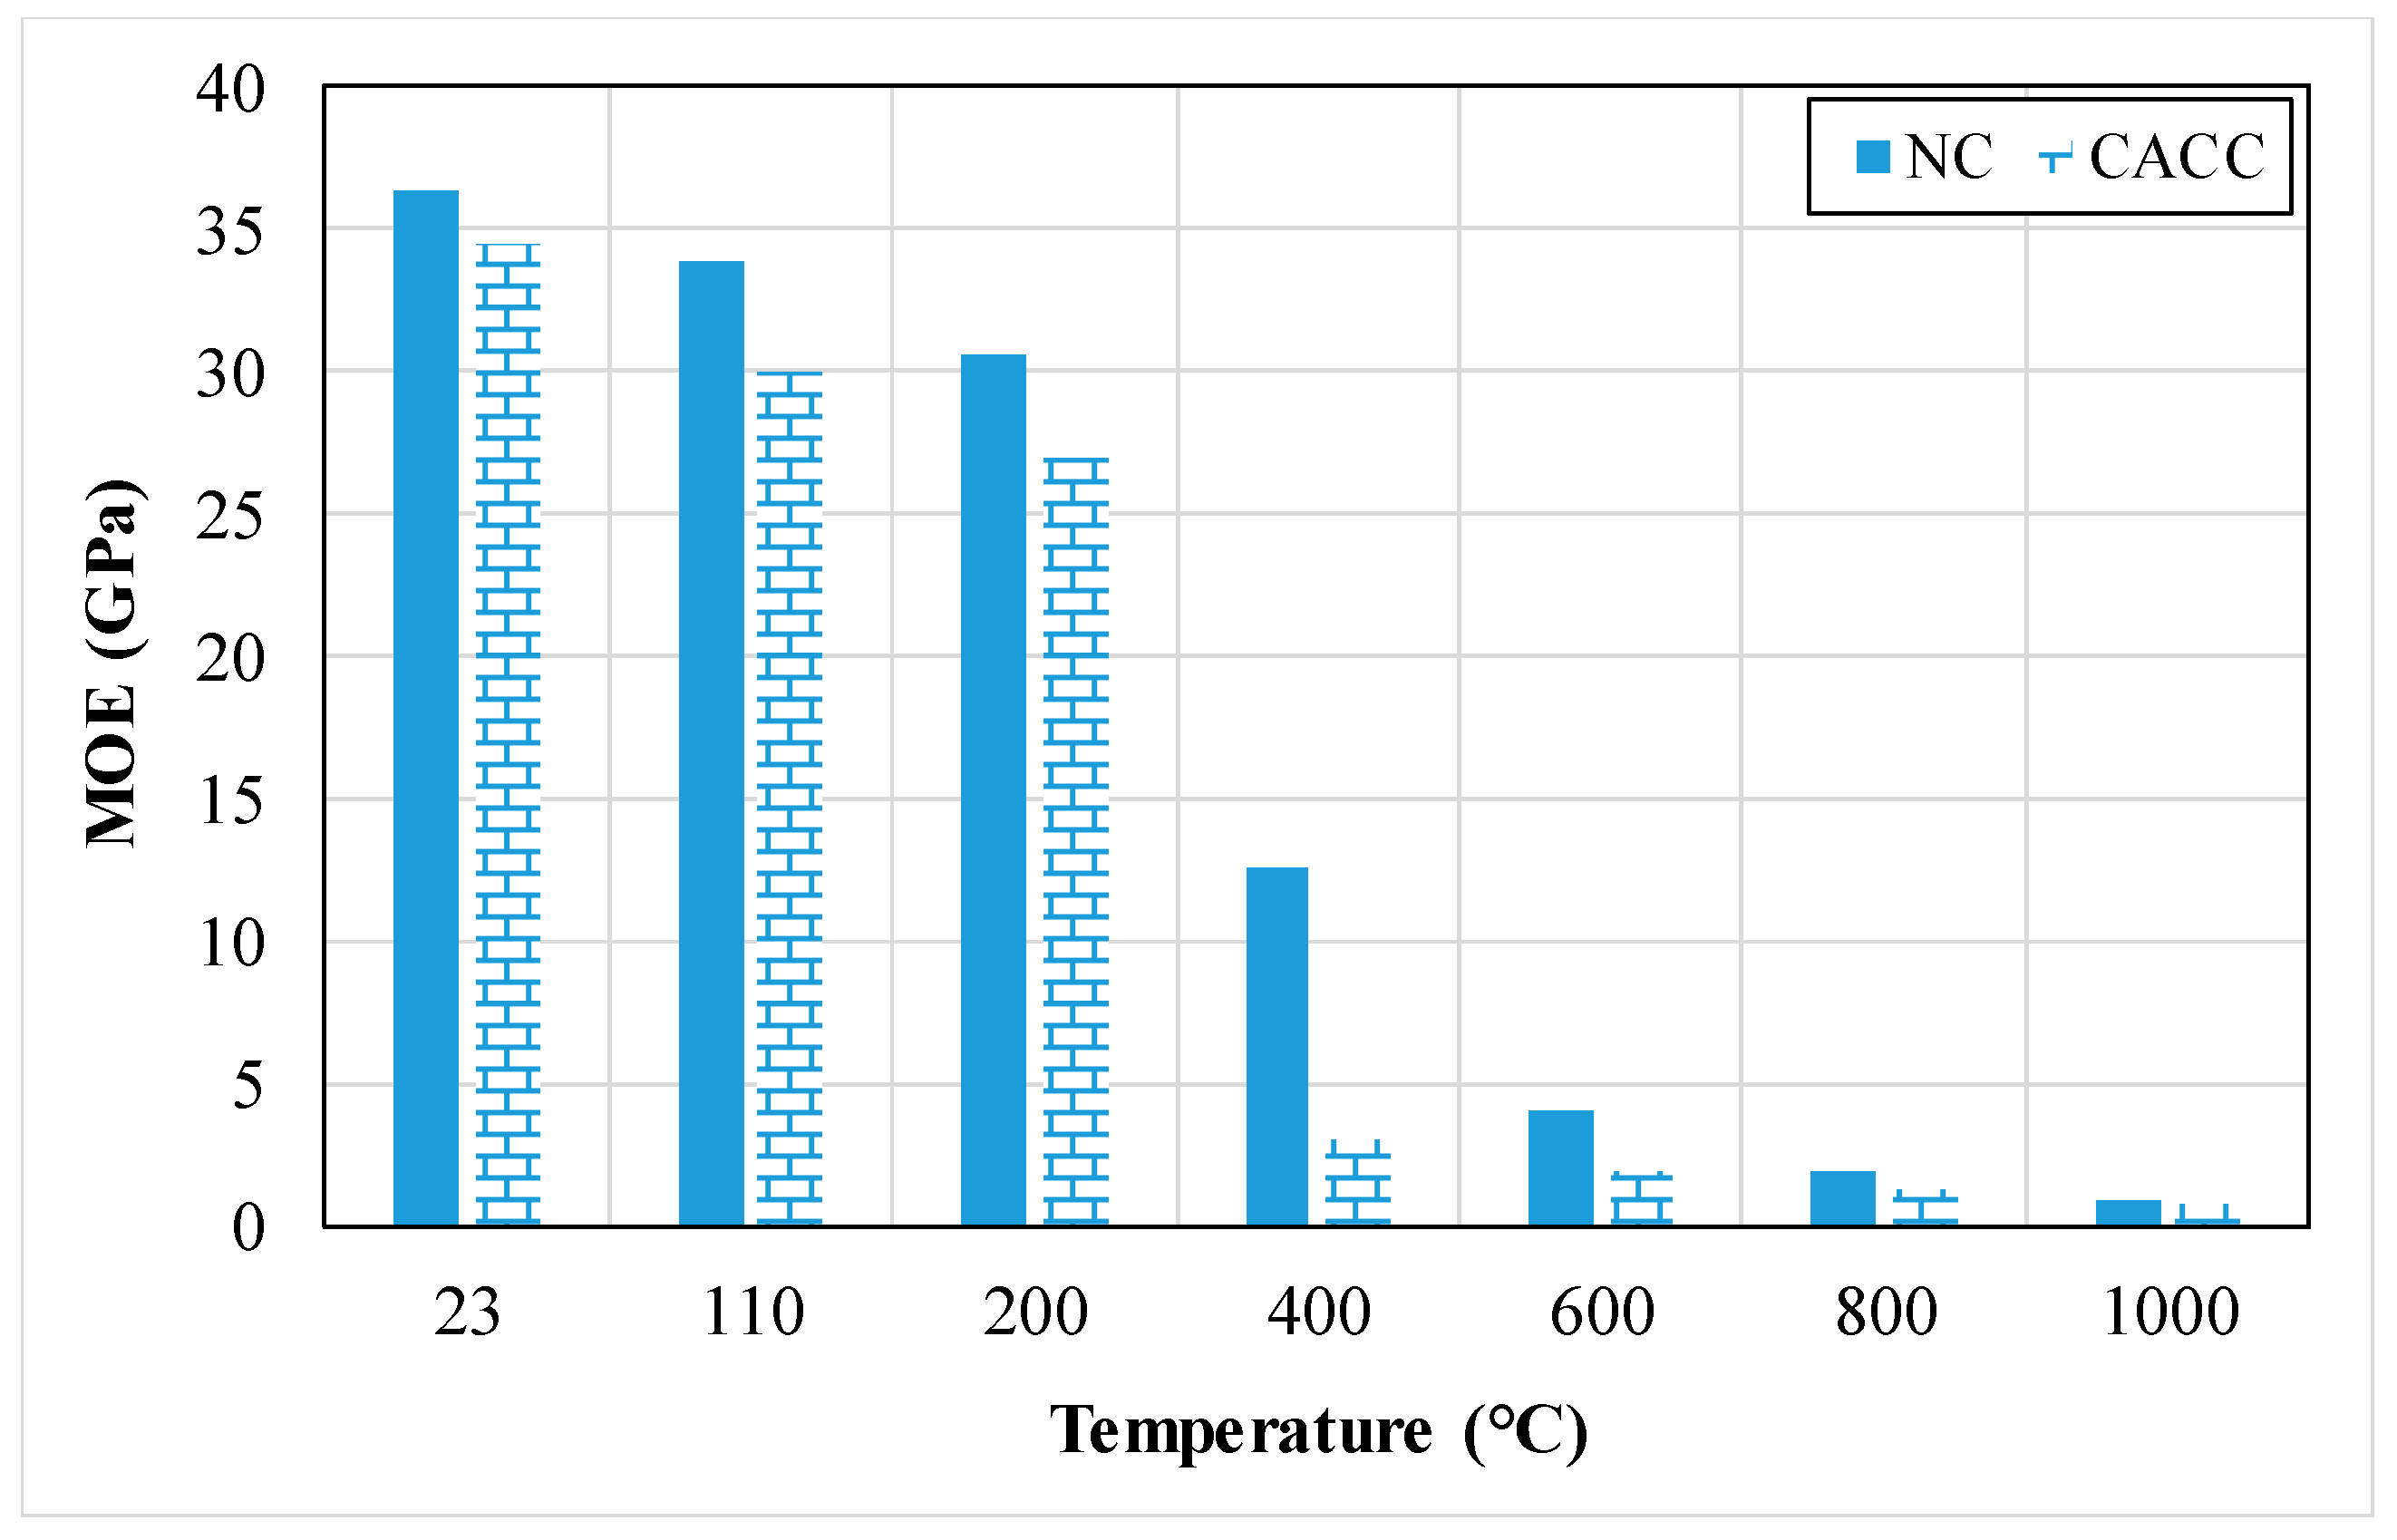
3.1.6. Modulus of Elasticity (MOE)
3.1.7. Ultrasonic Pulse Velocity (UPV)
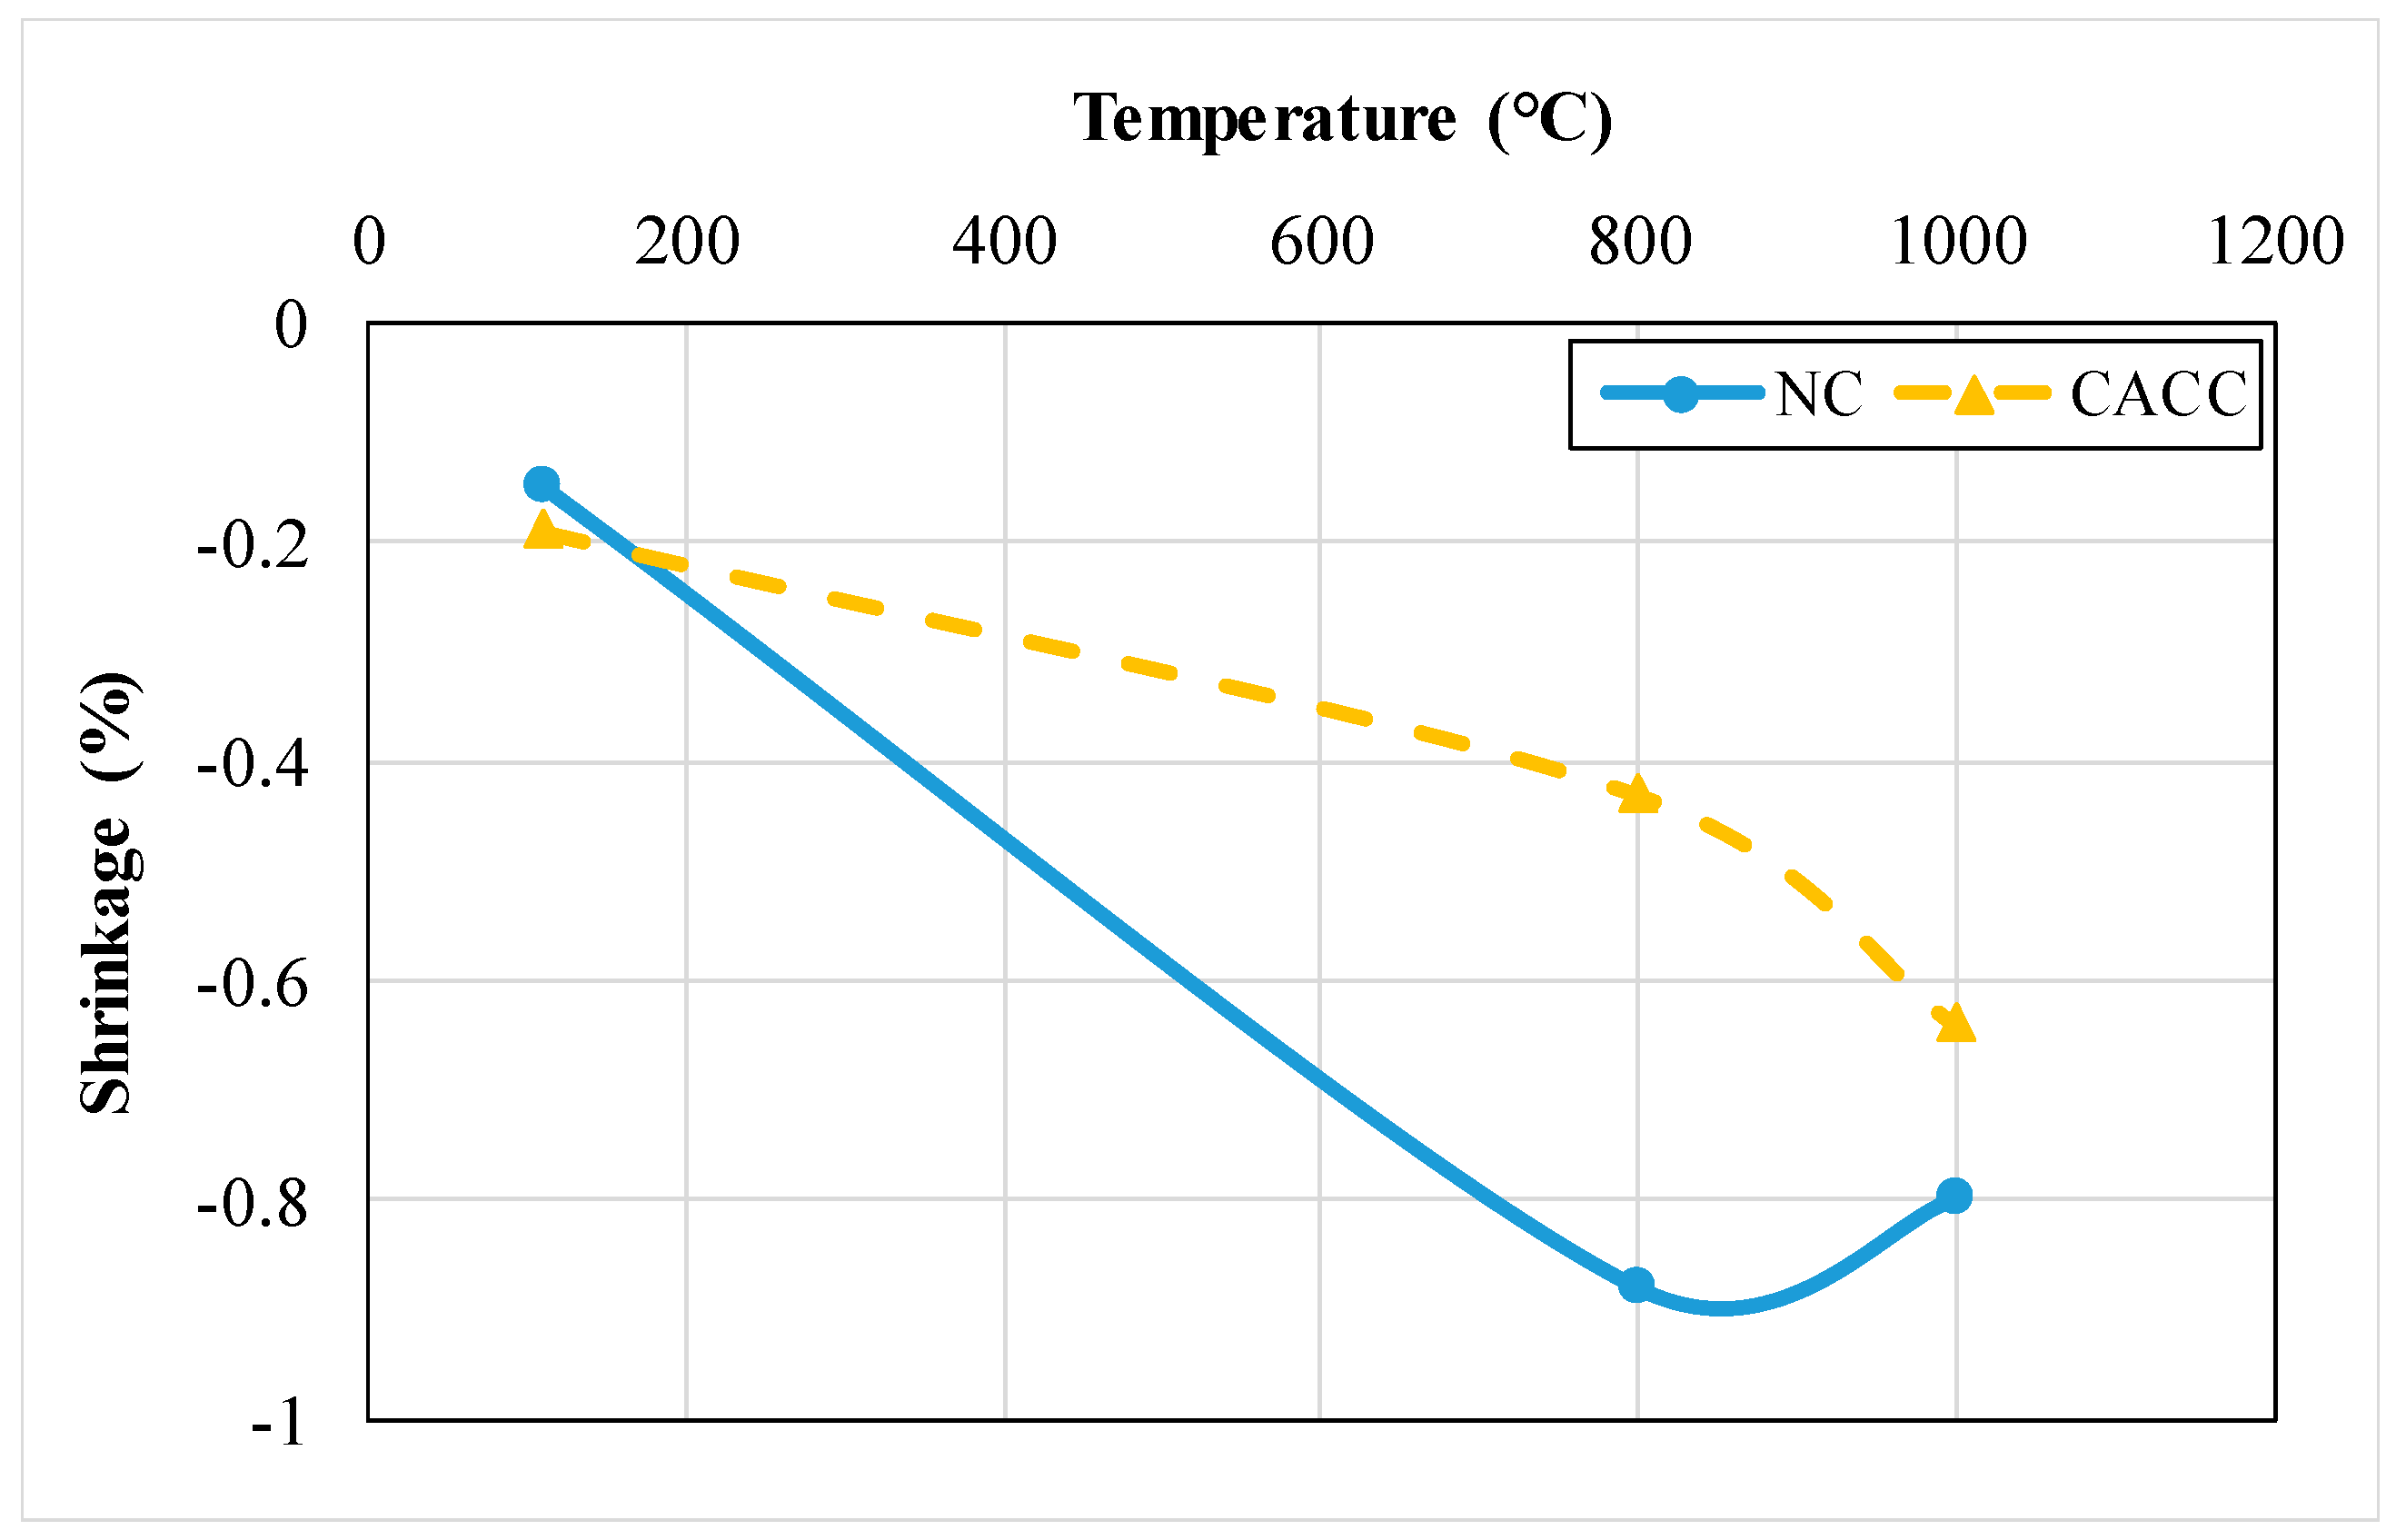
3.1.8. Shrinkage
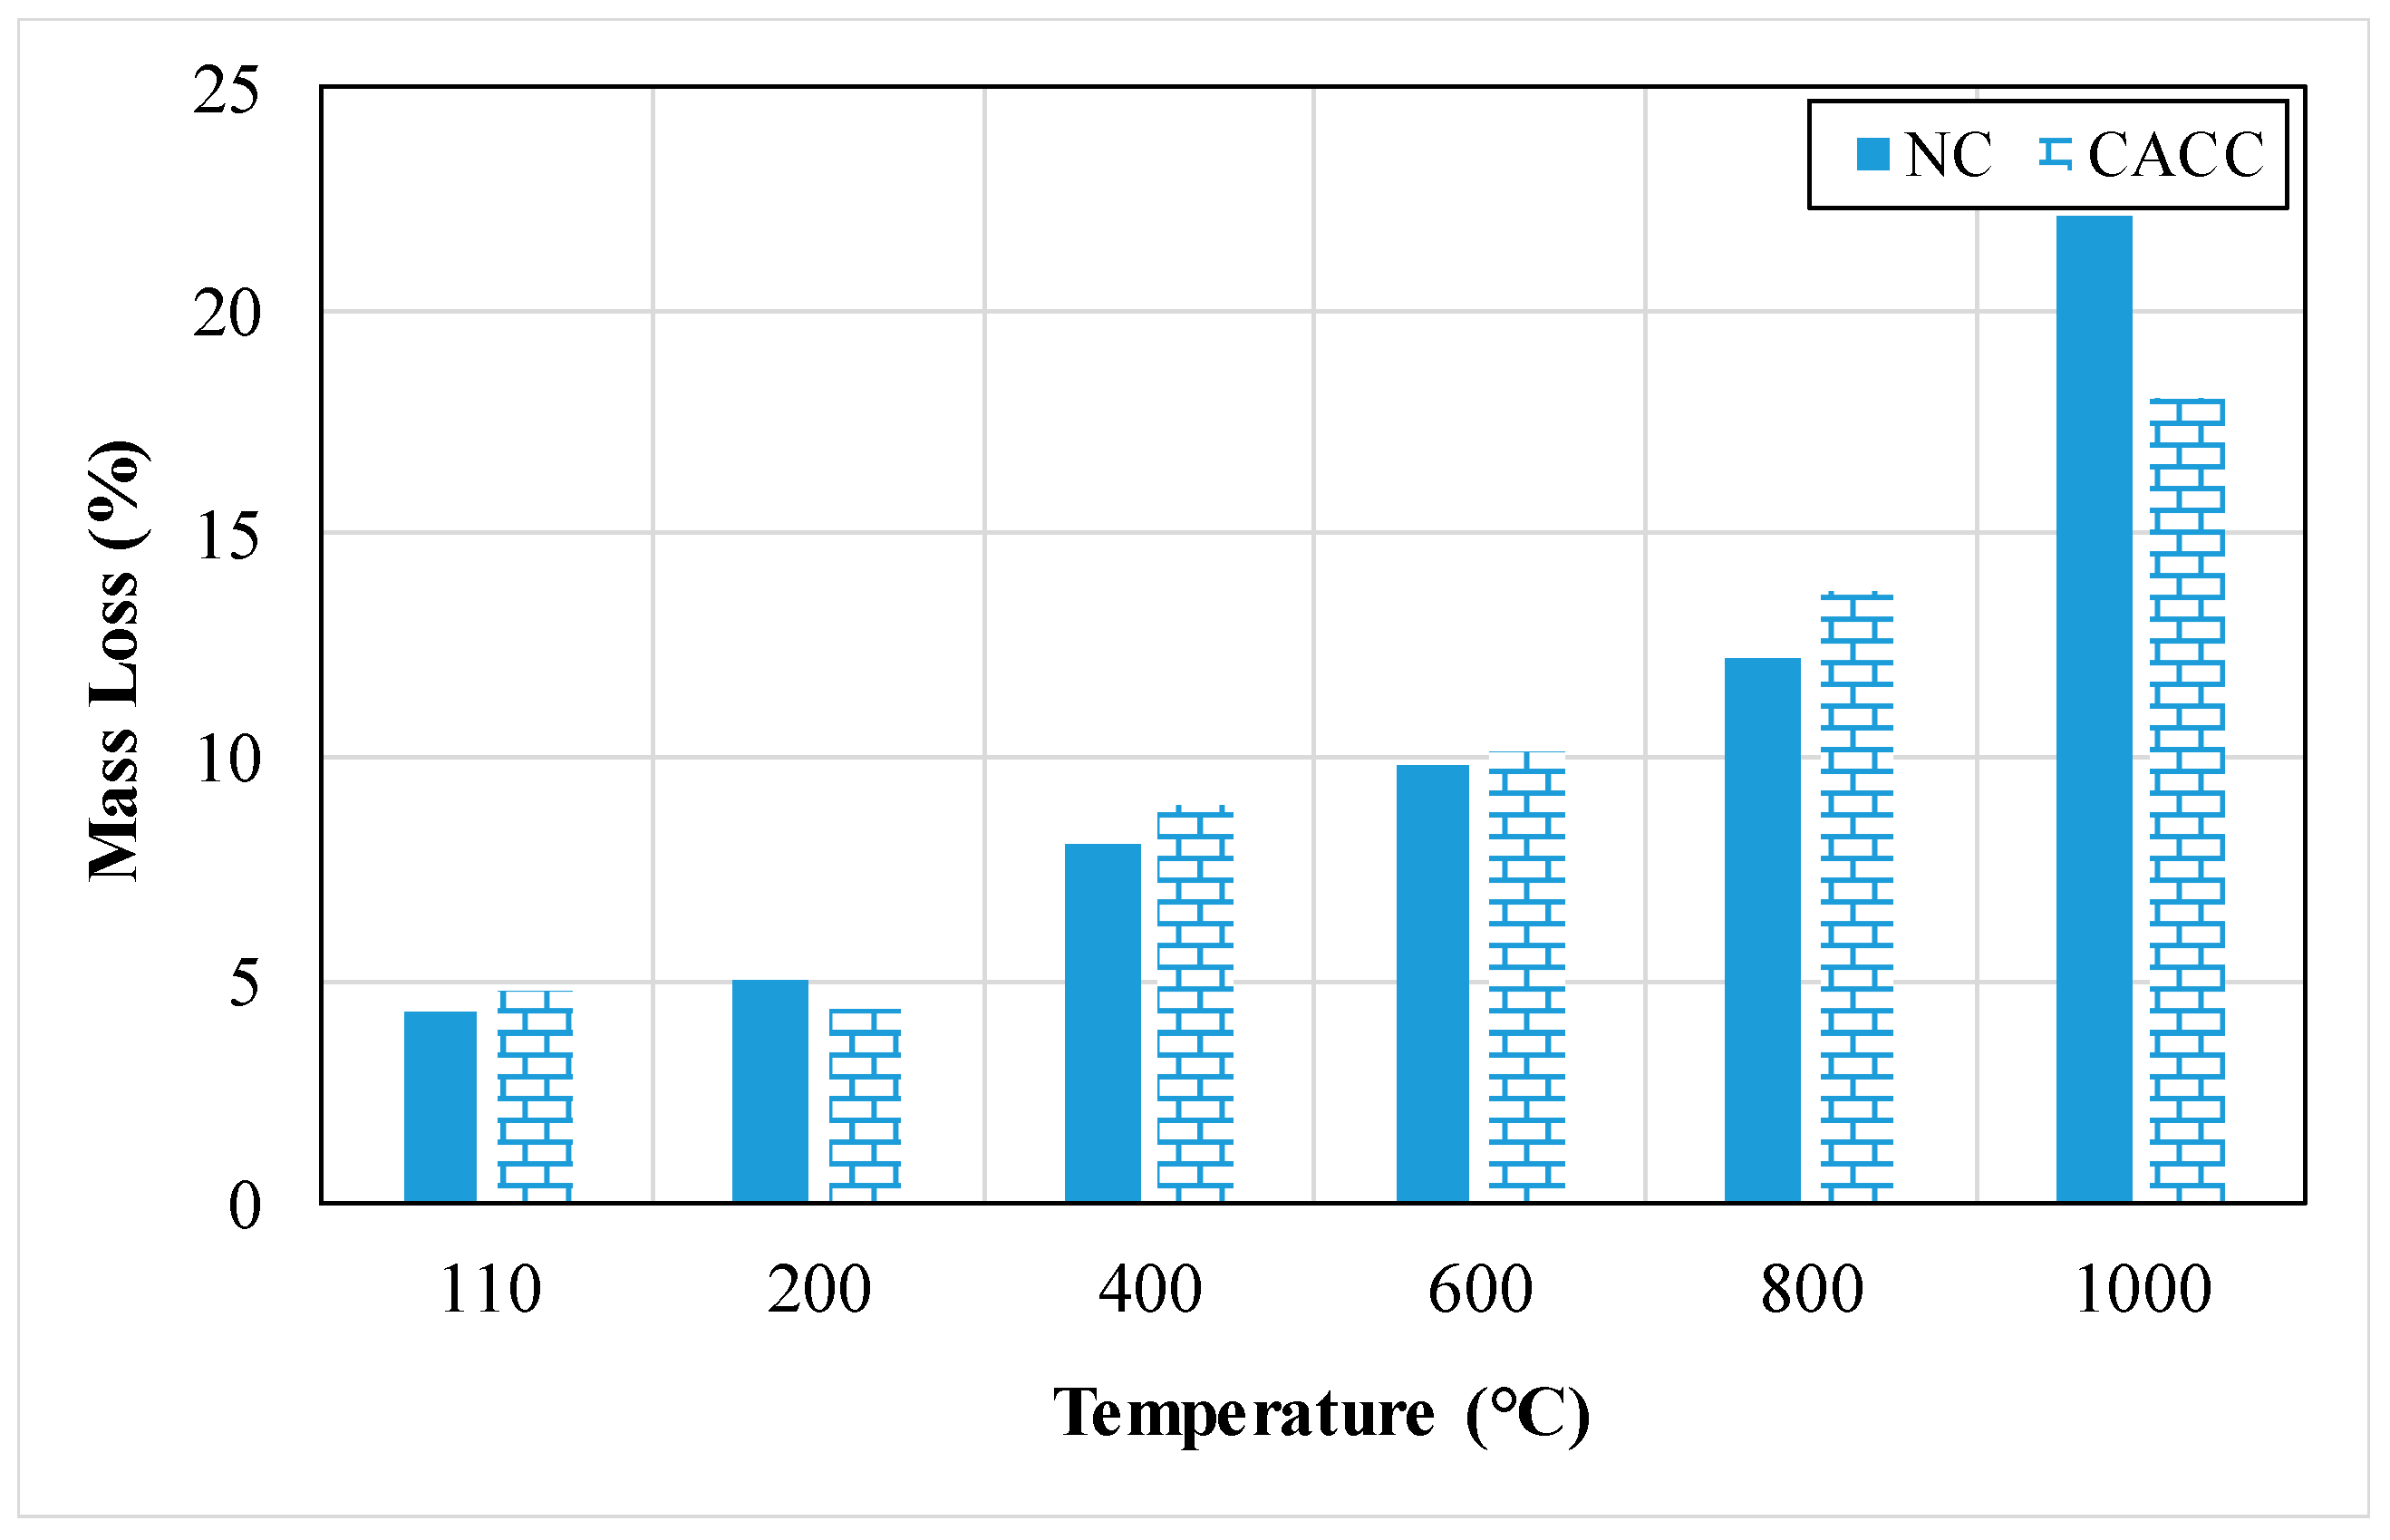
3.1.9. Variation in Weight
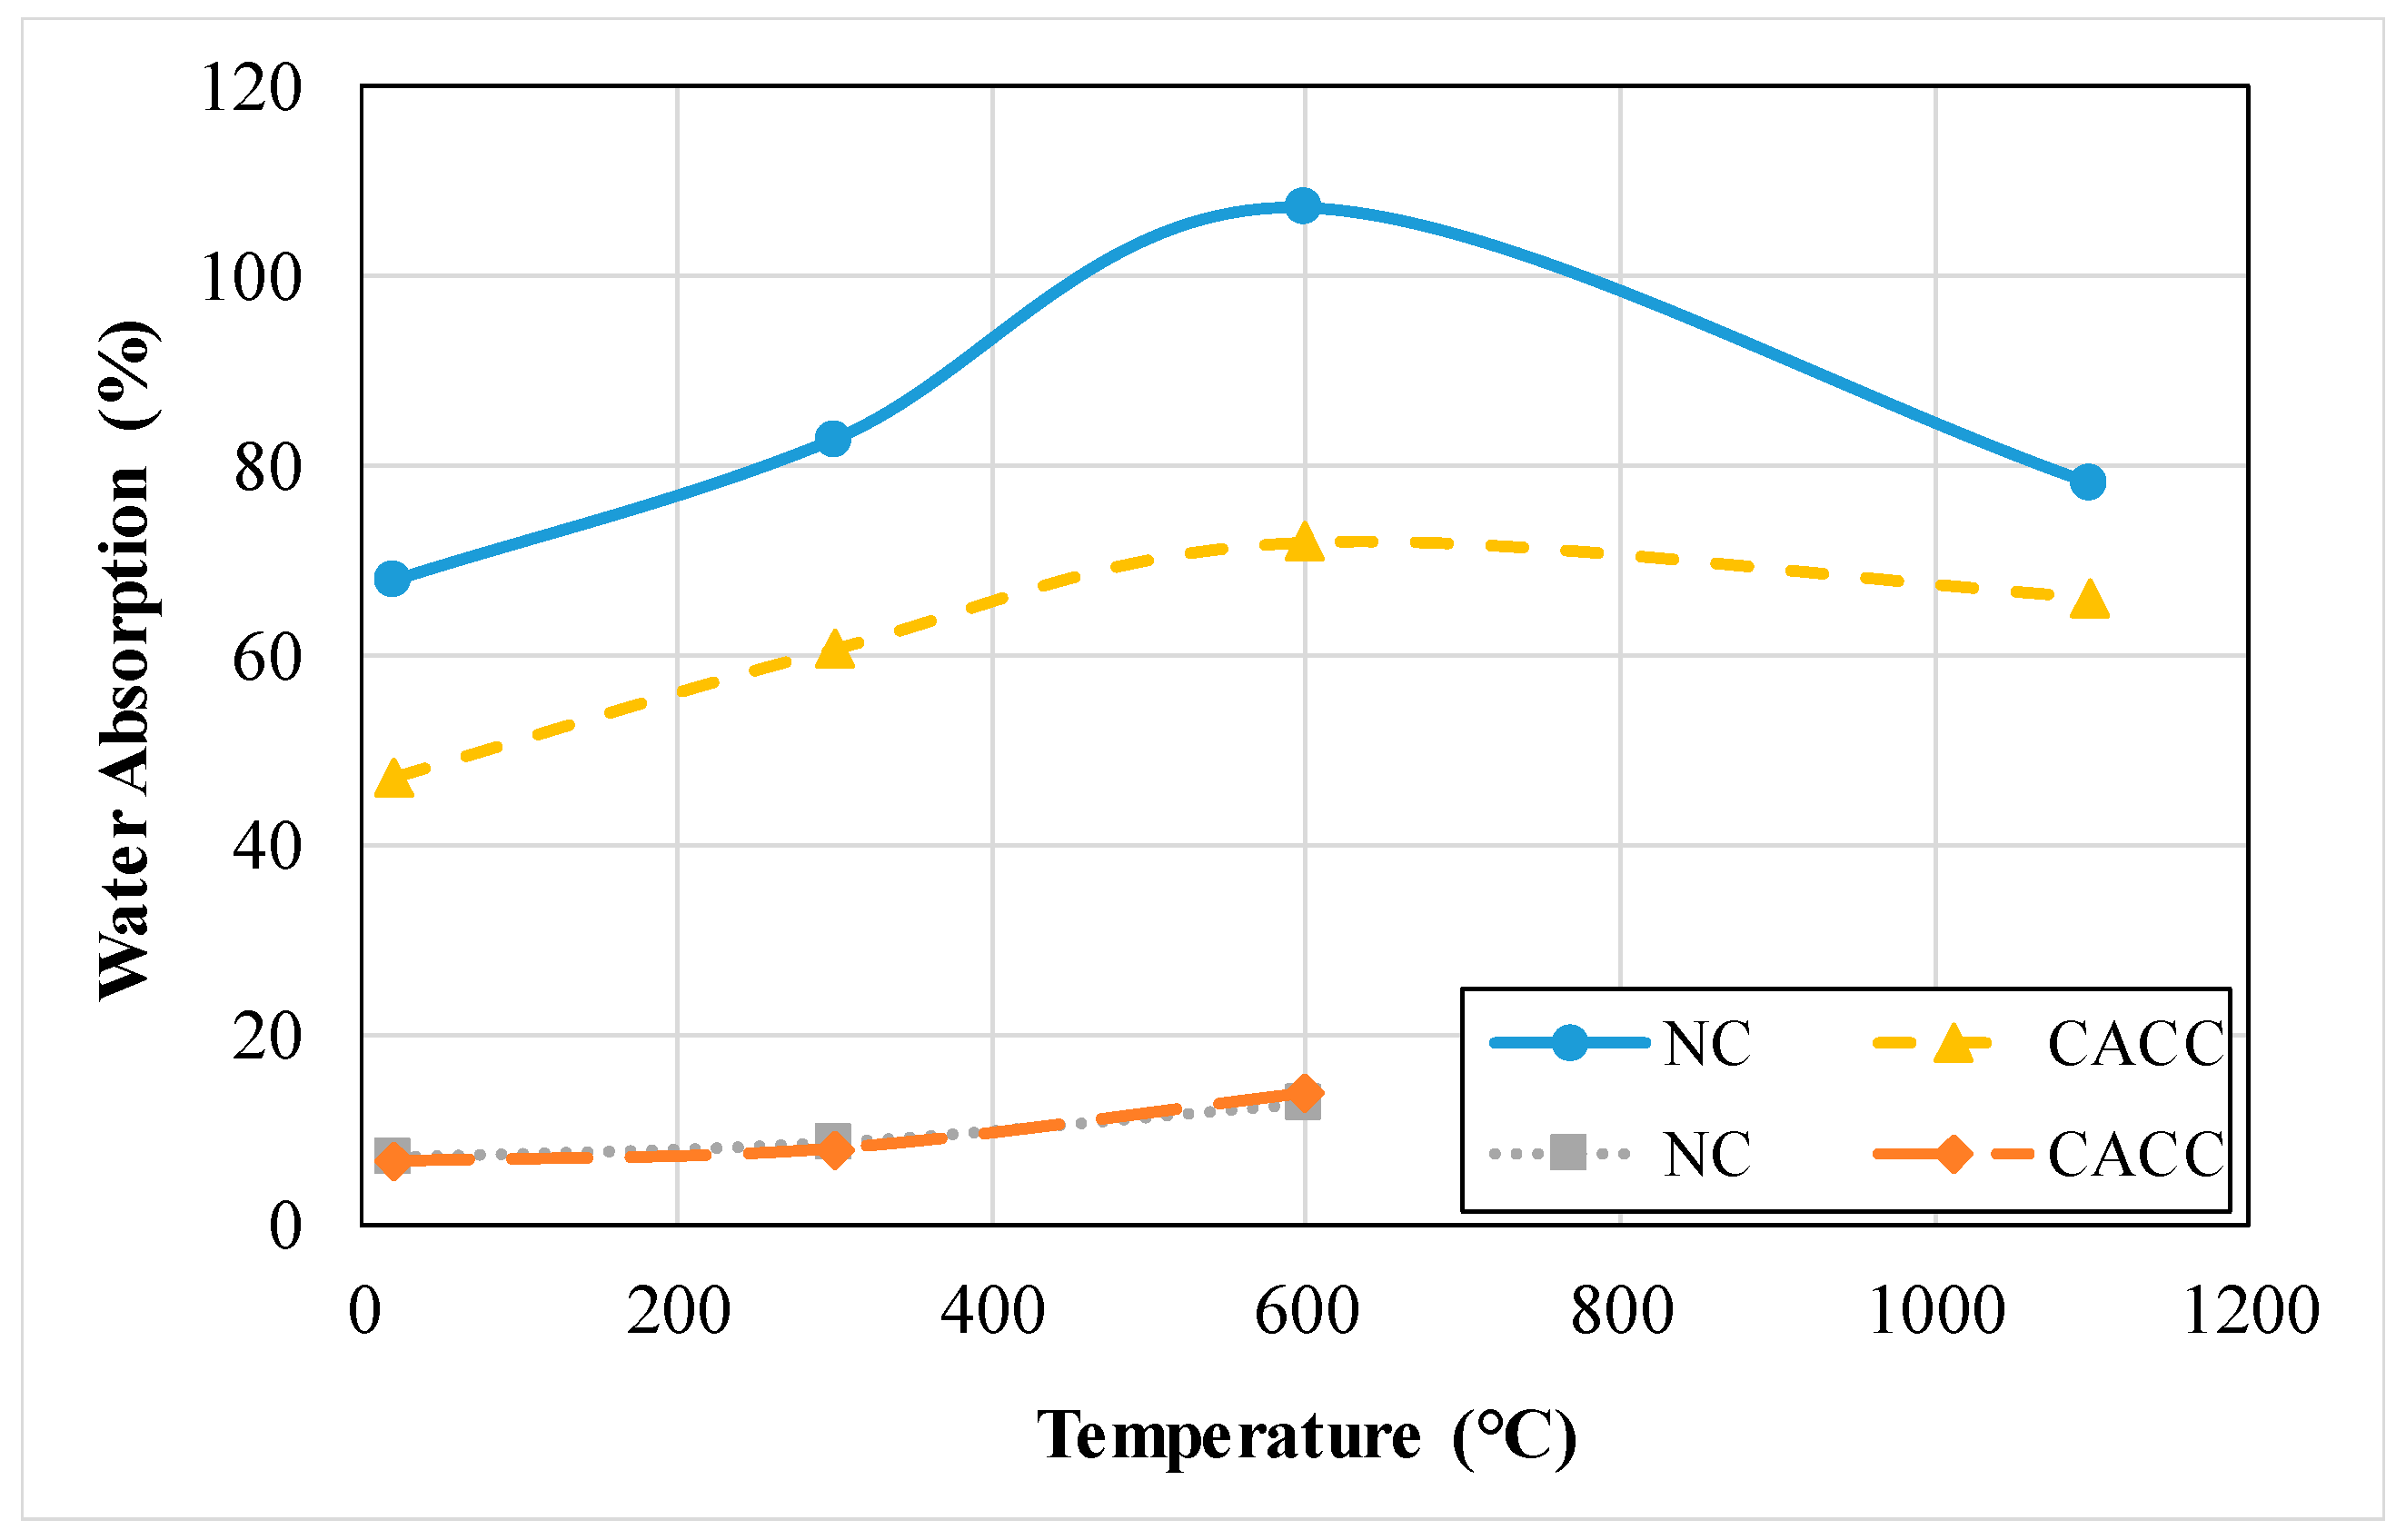
3.1.10. Water Absorption
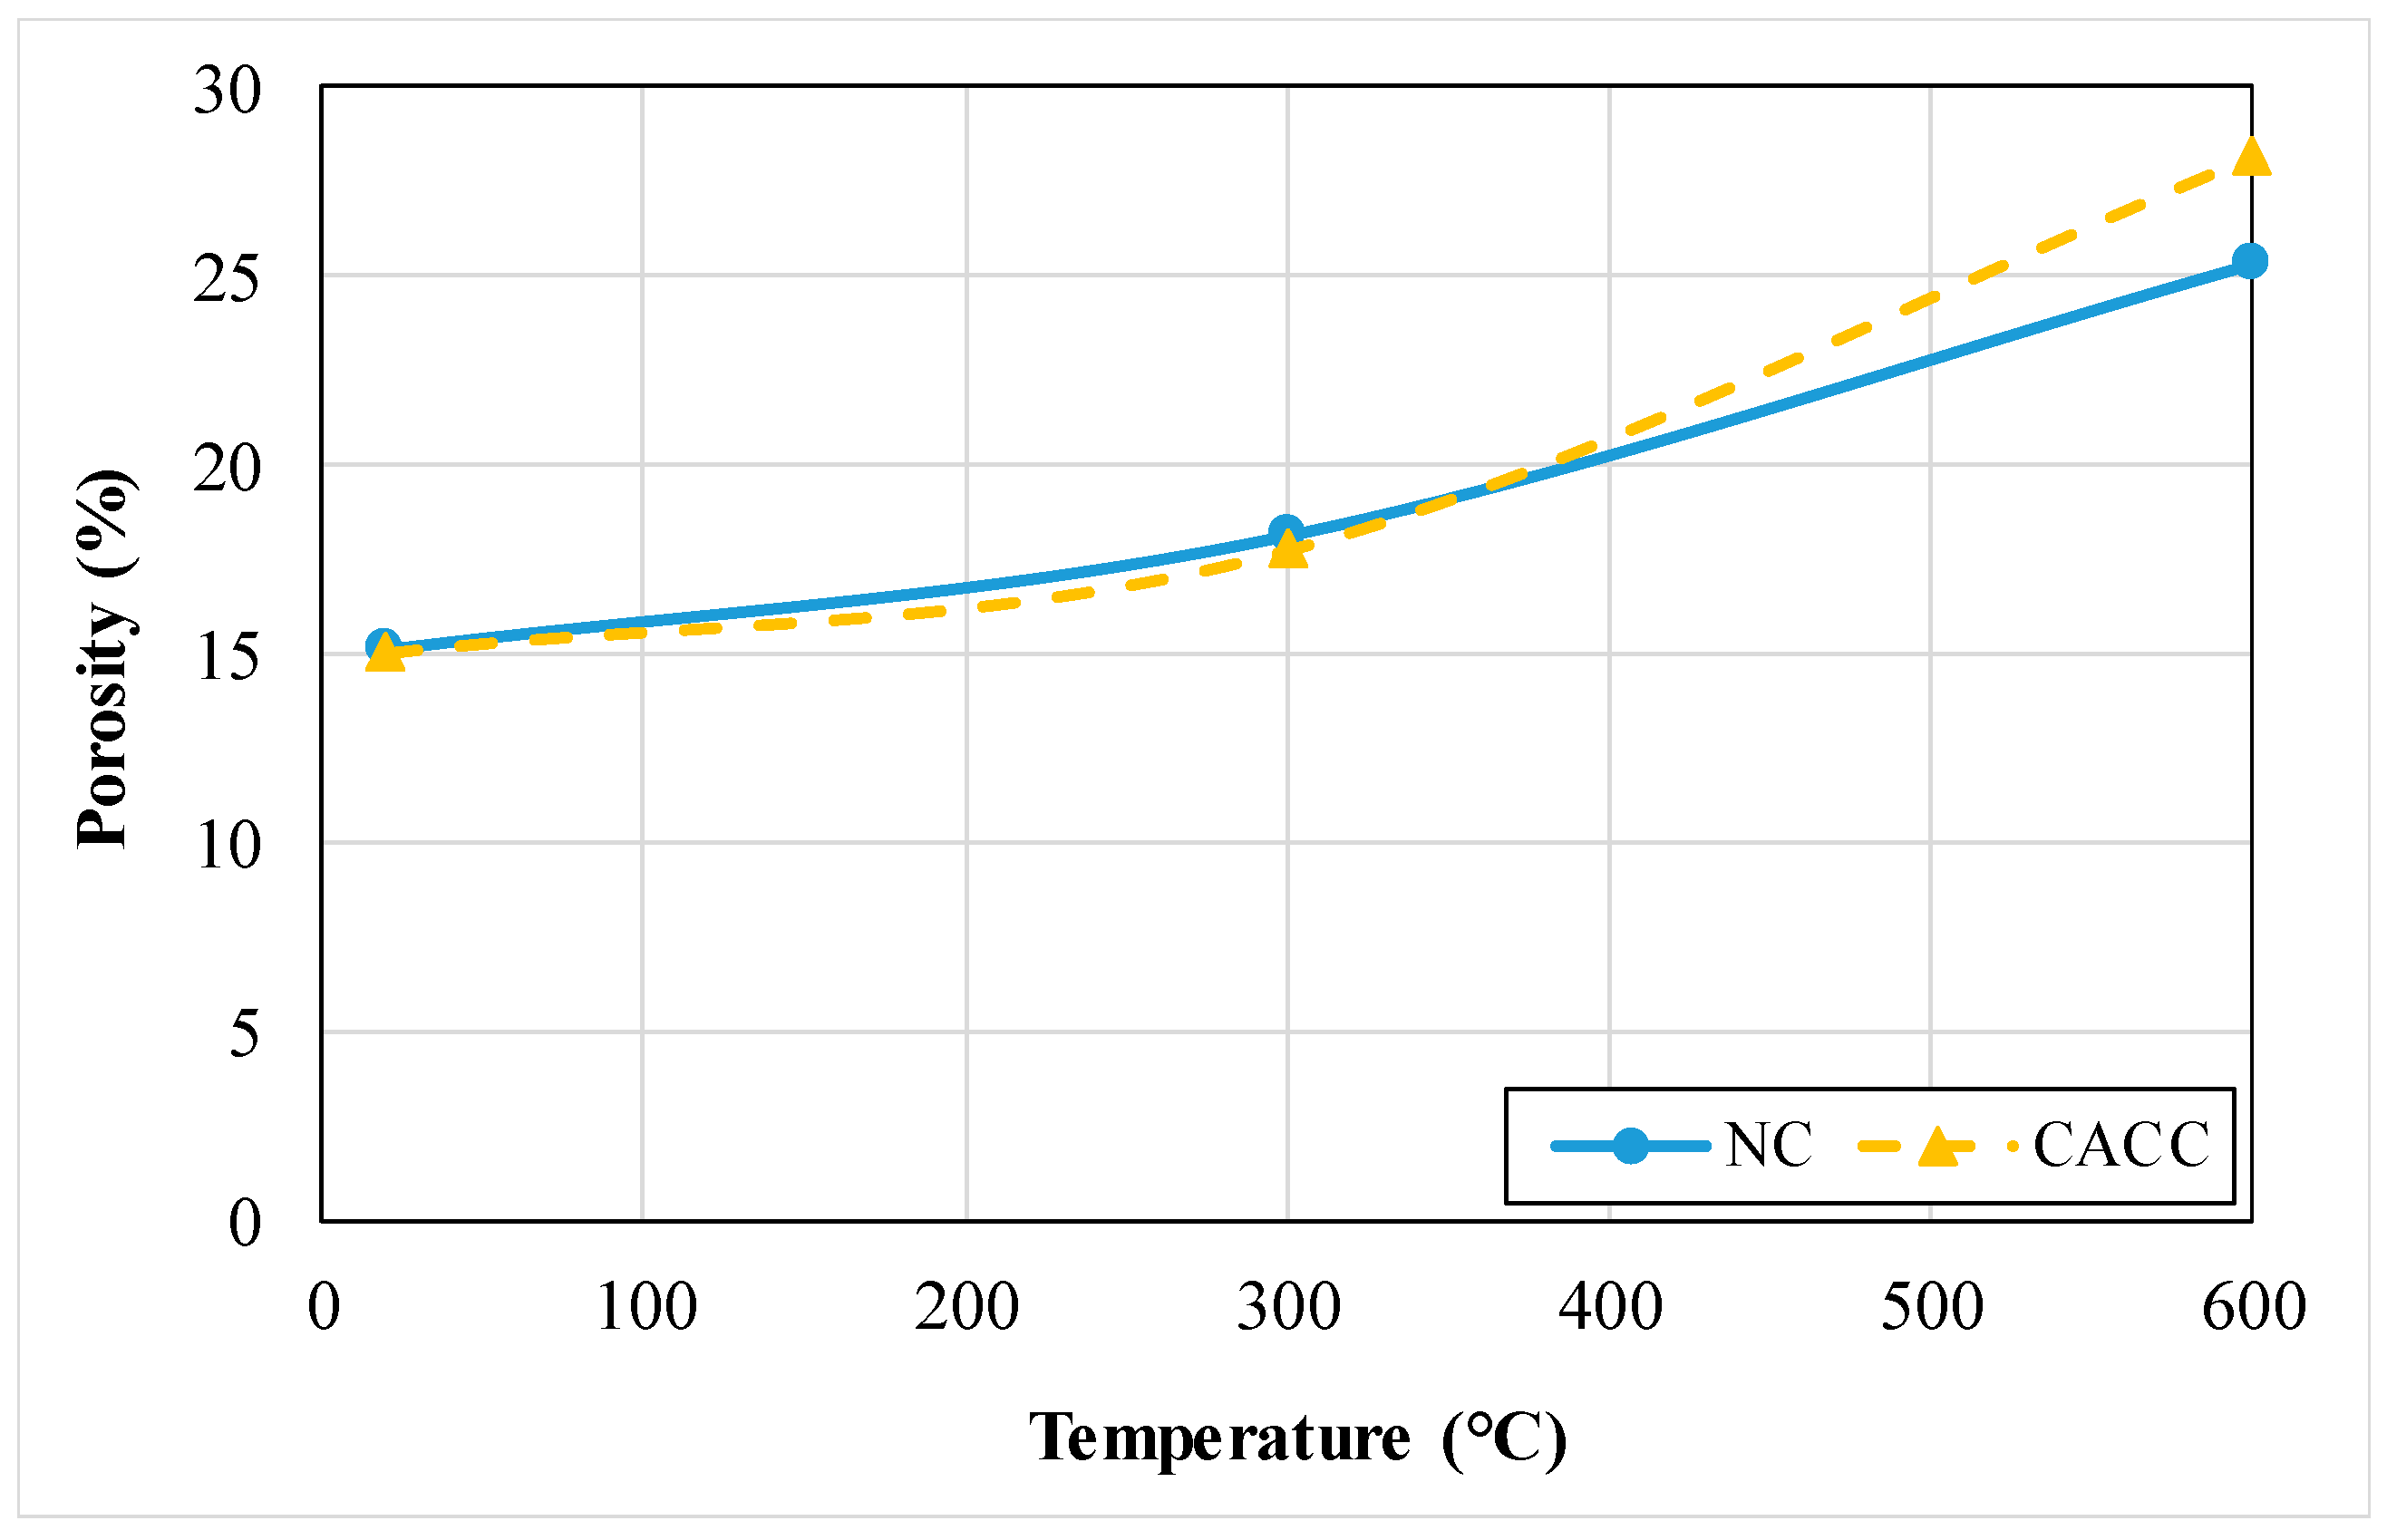
3.1.11. Porosity
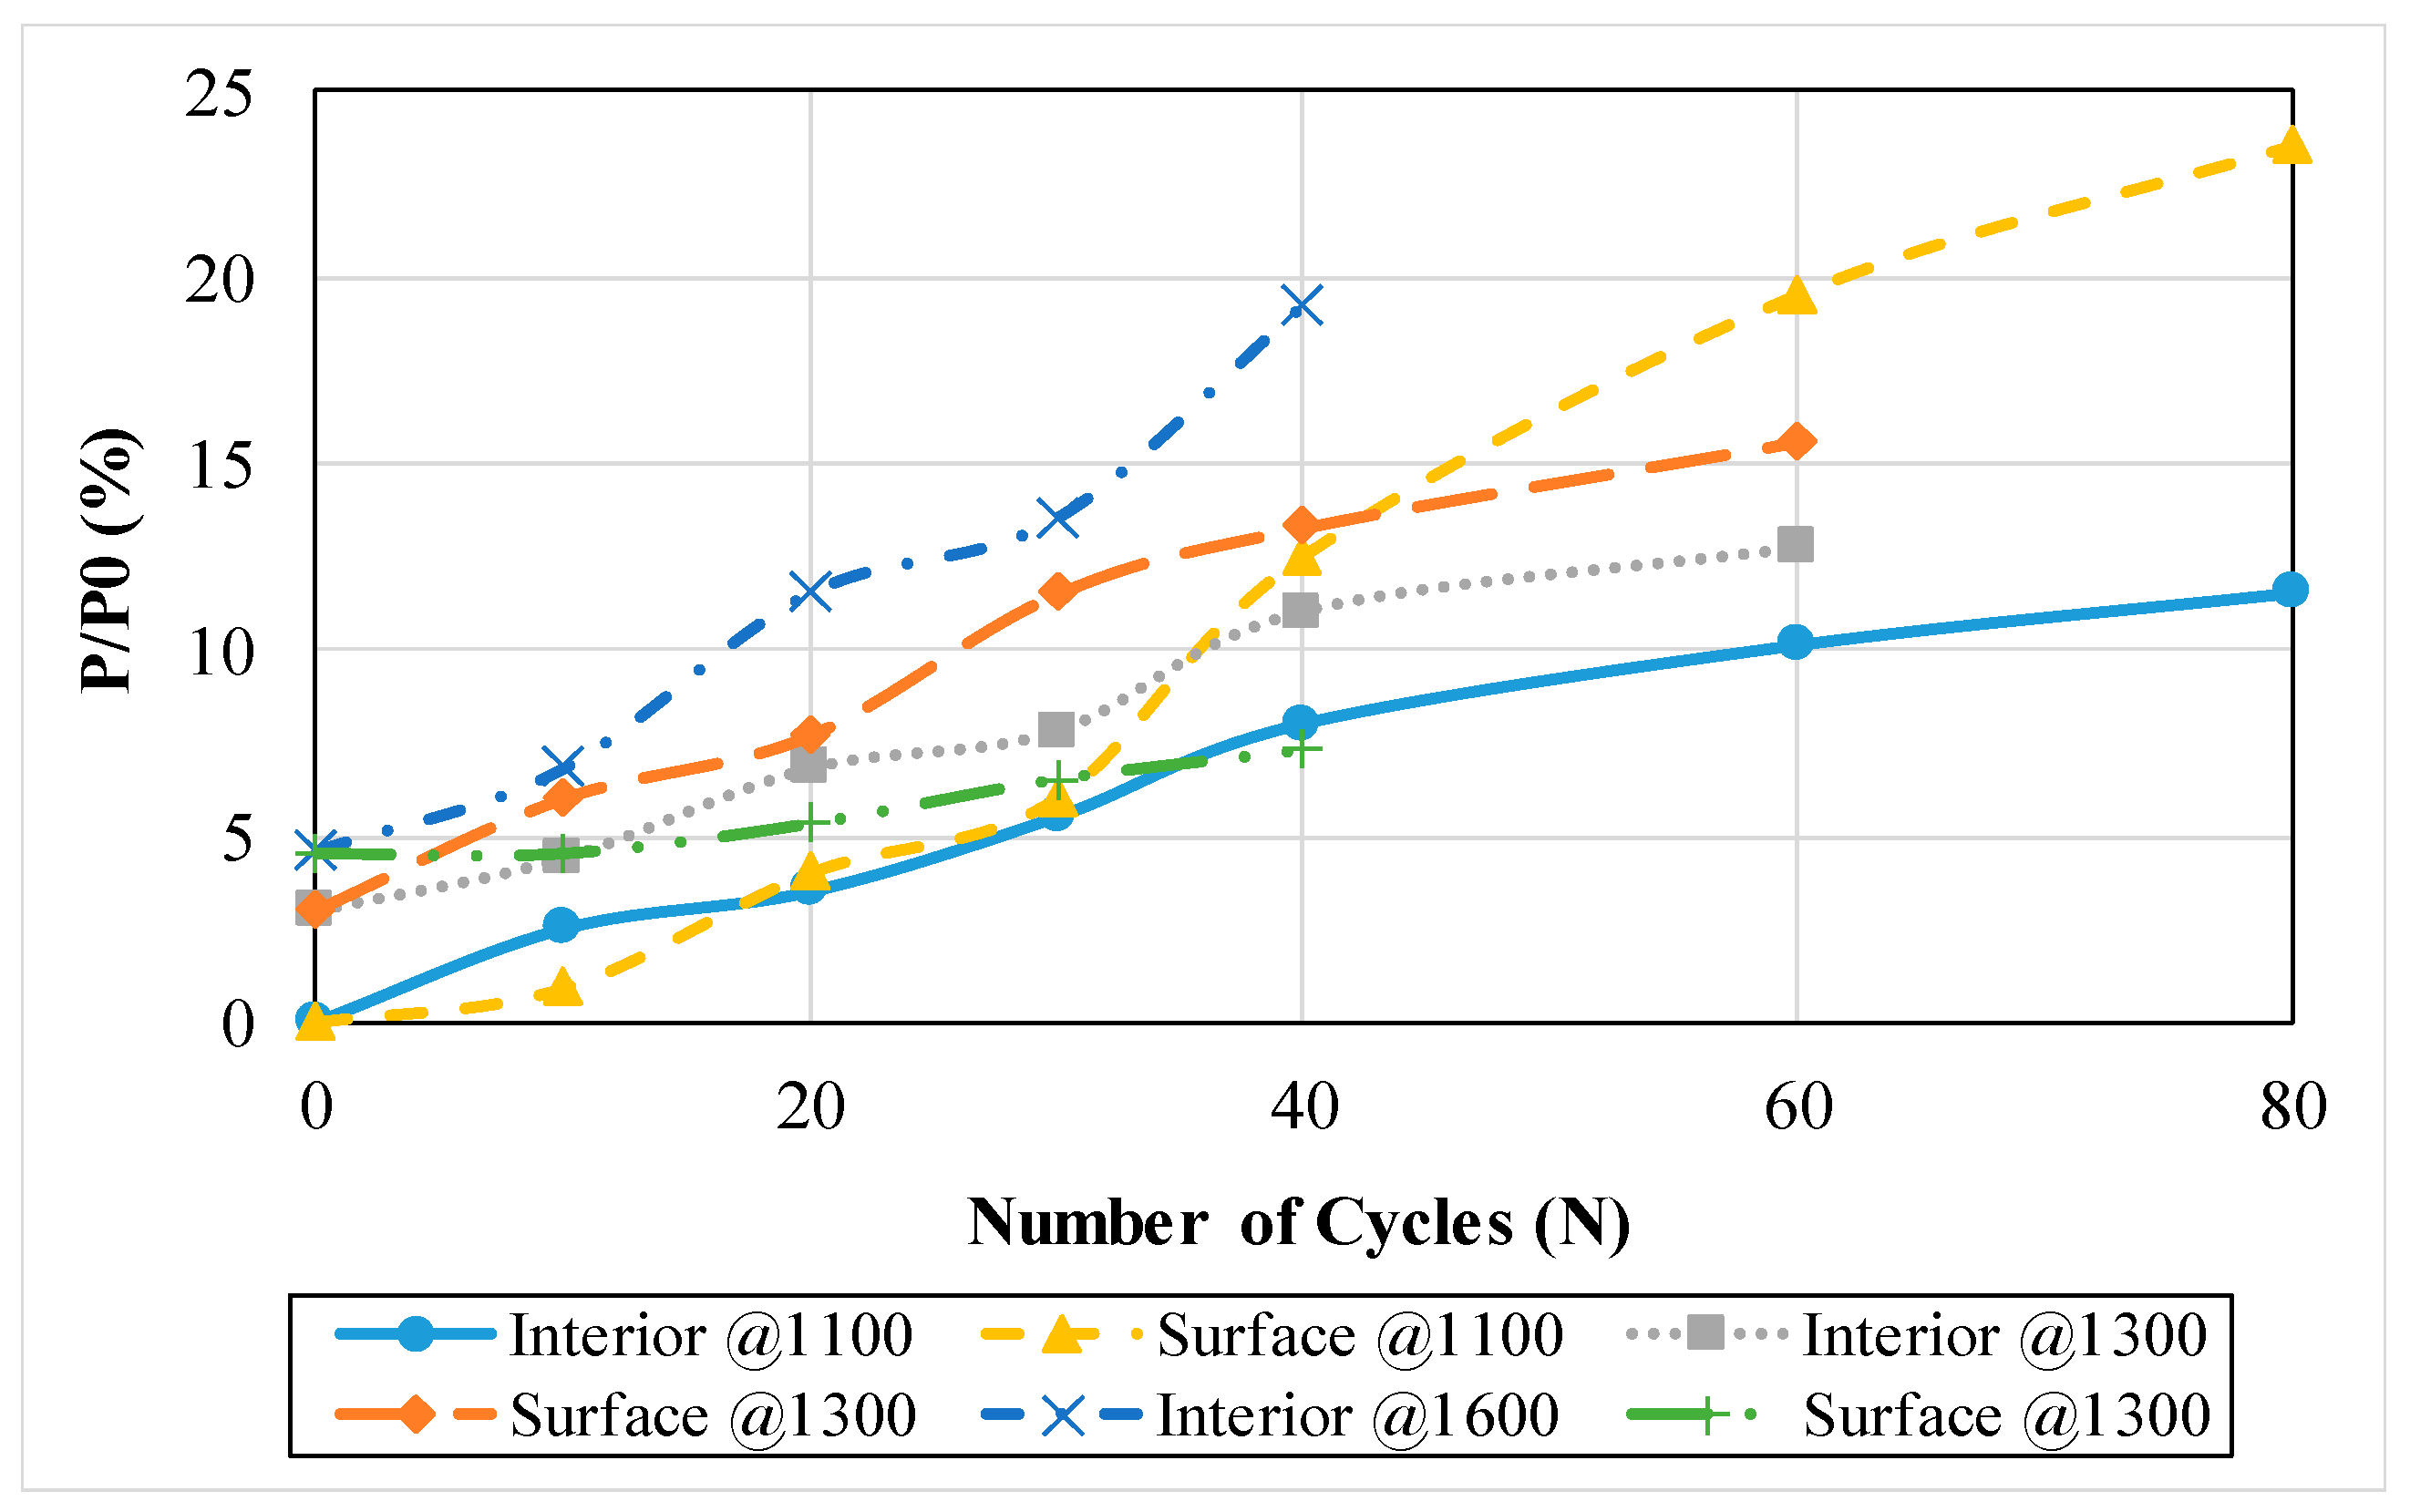
3.1.12. Damage Level
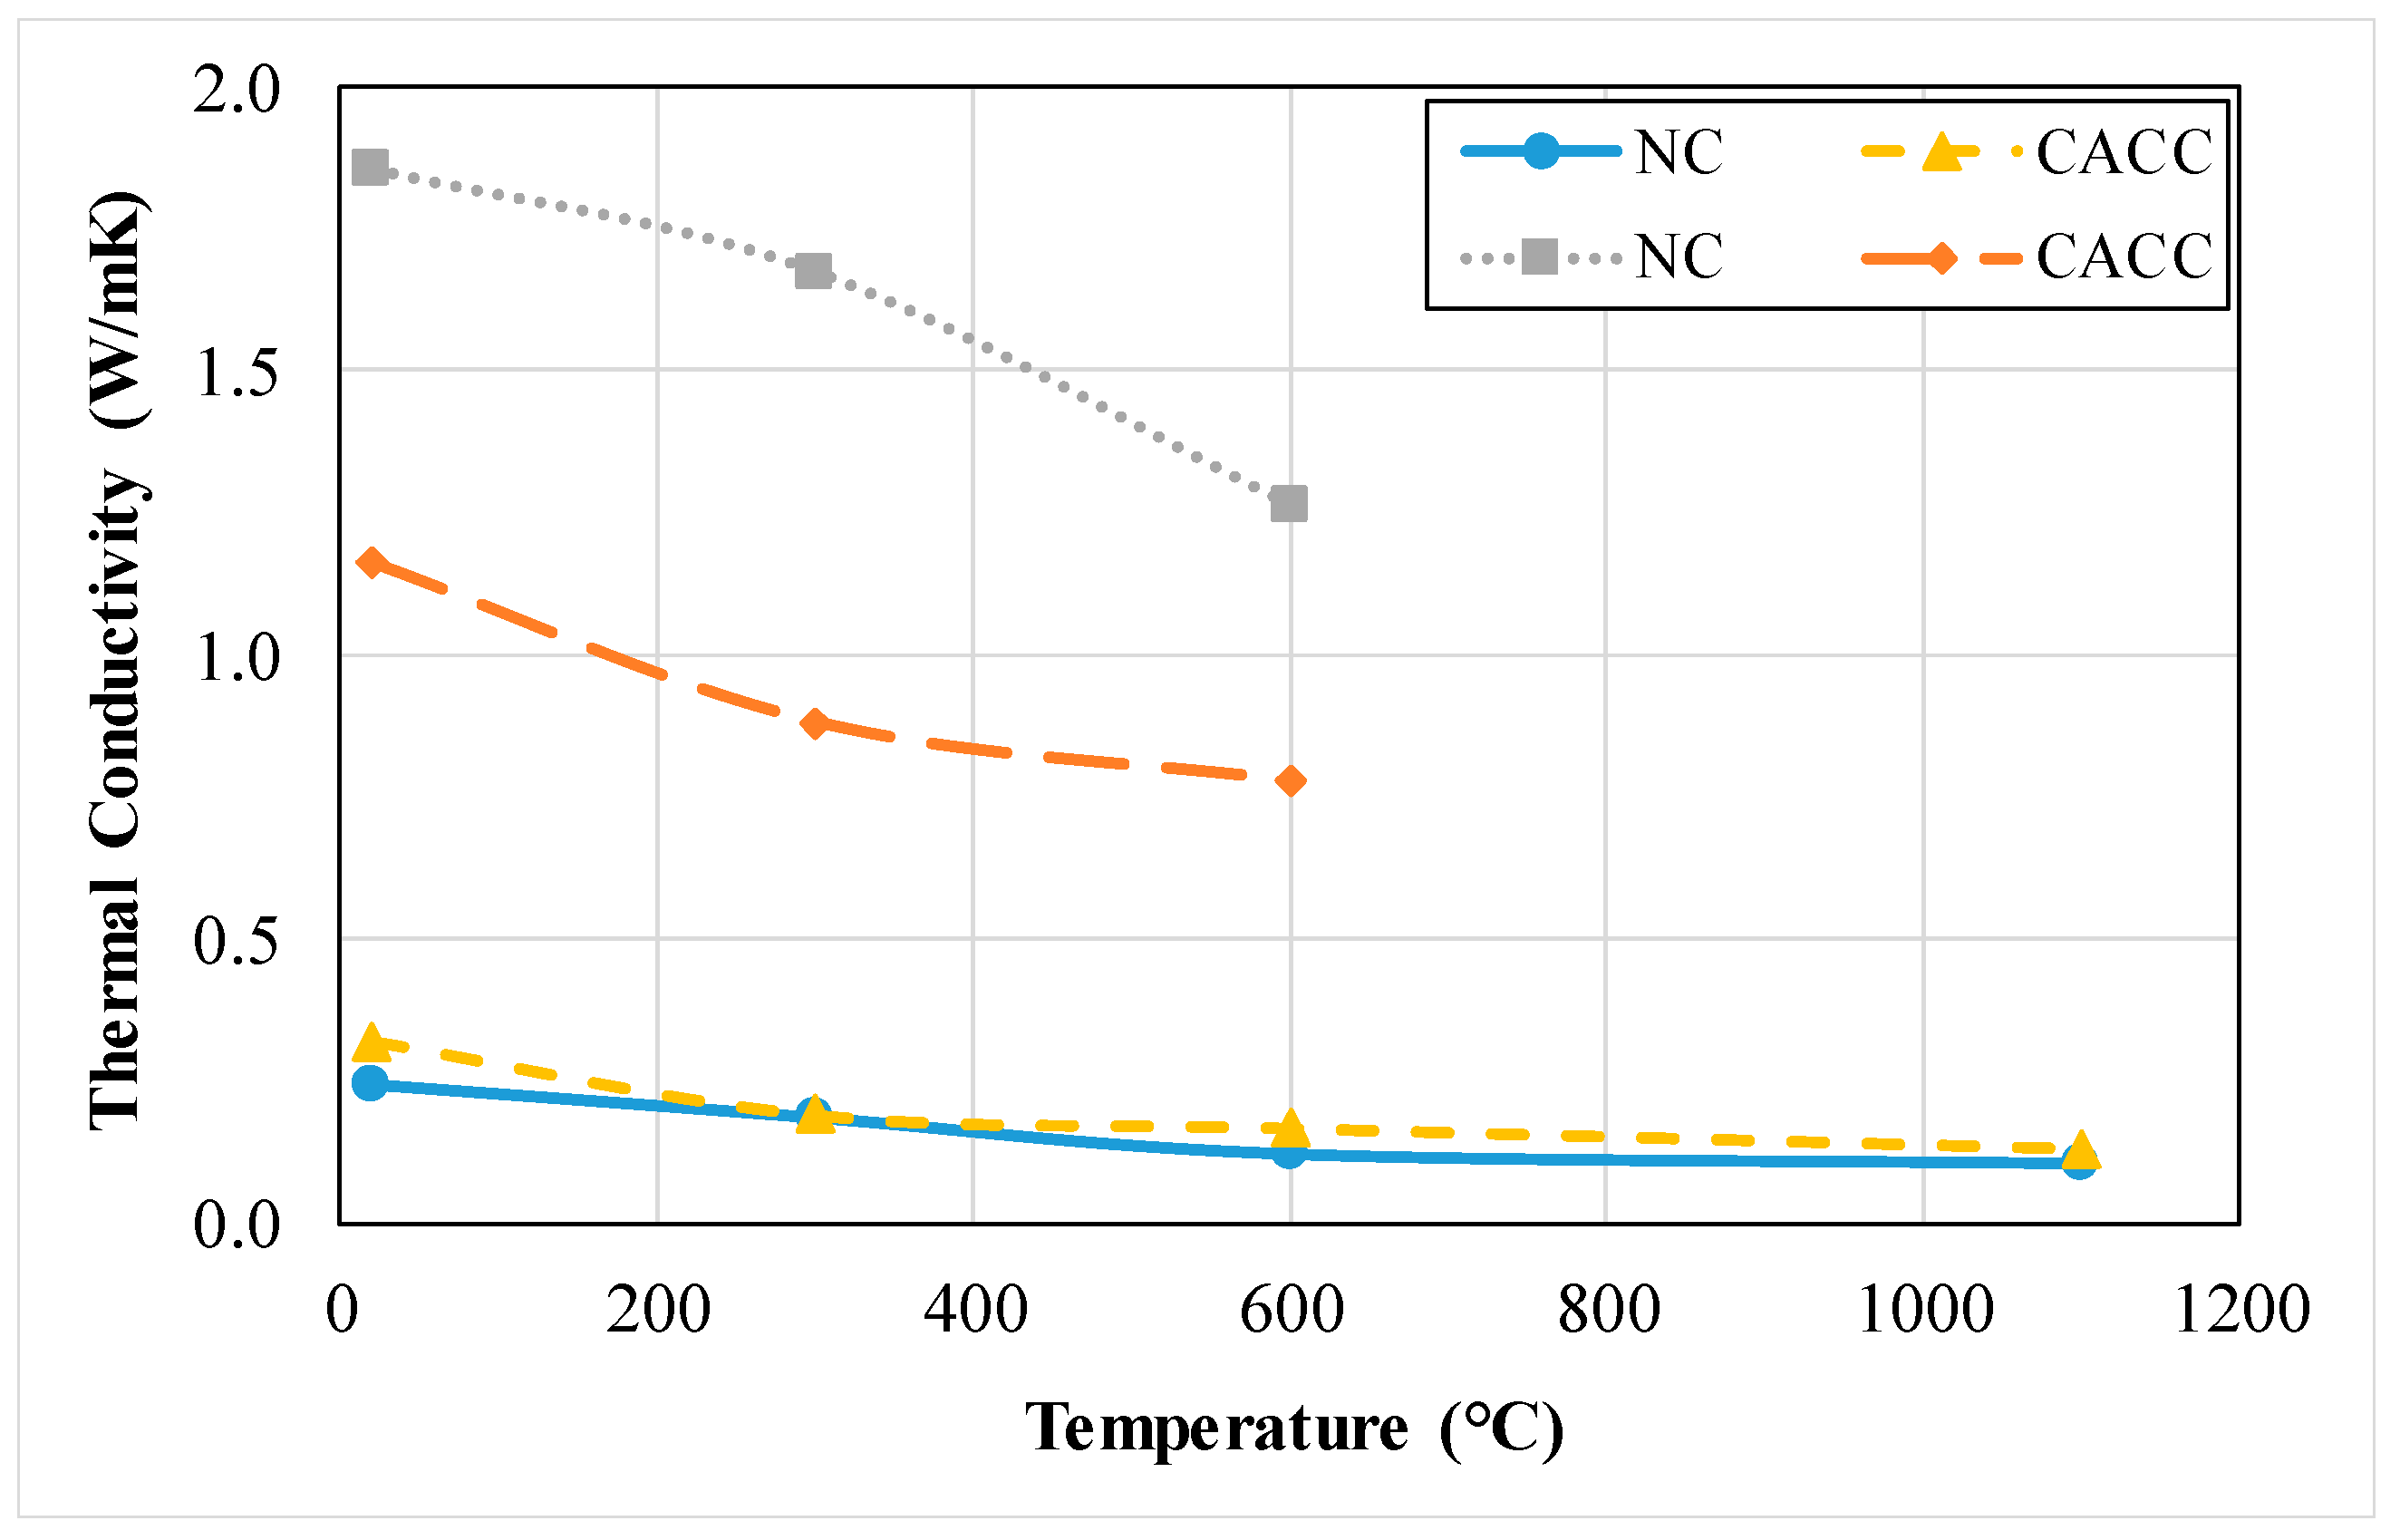
3.1.13. Thermal Conductivity
3.2. Properties of Refractory Concrete Containing Refractory Materials as Aggregate Replacement
3.2.1. Slump
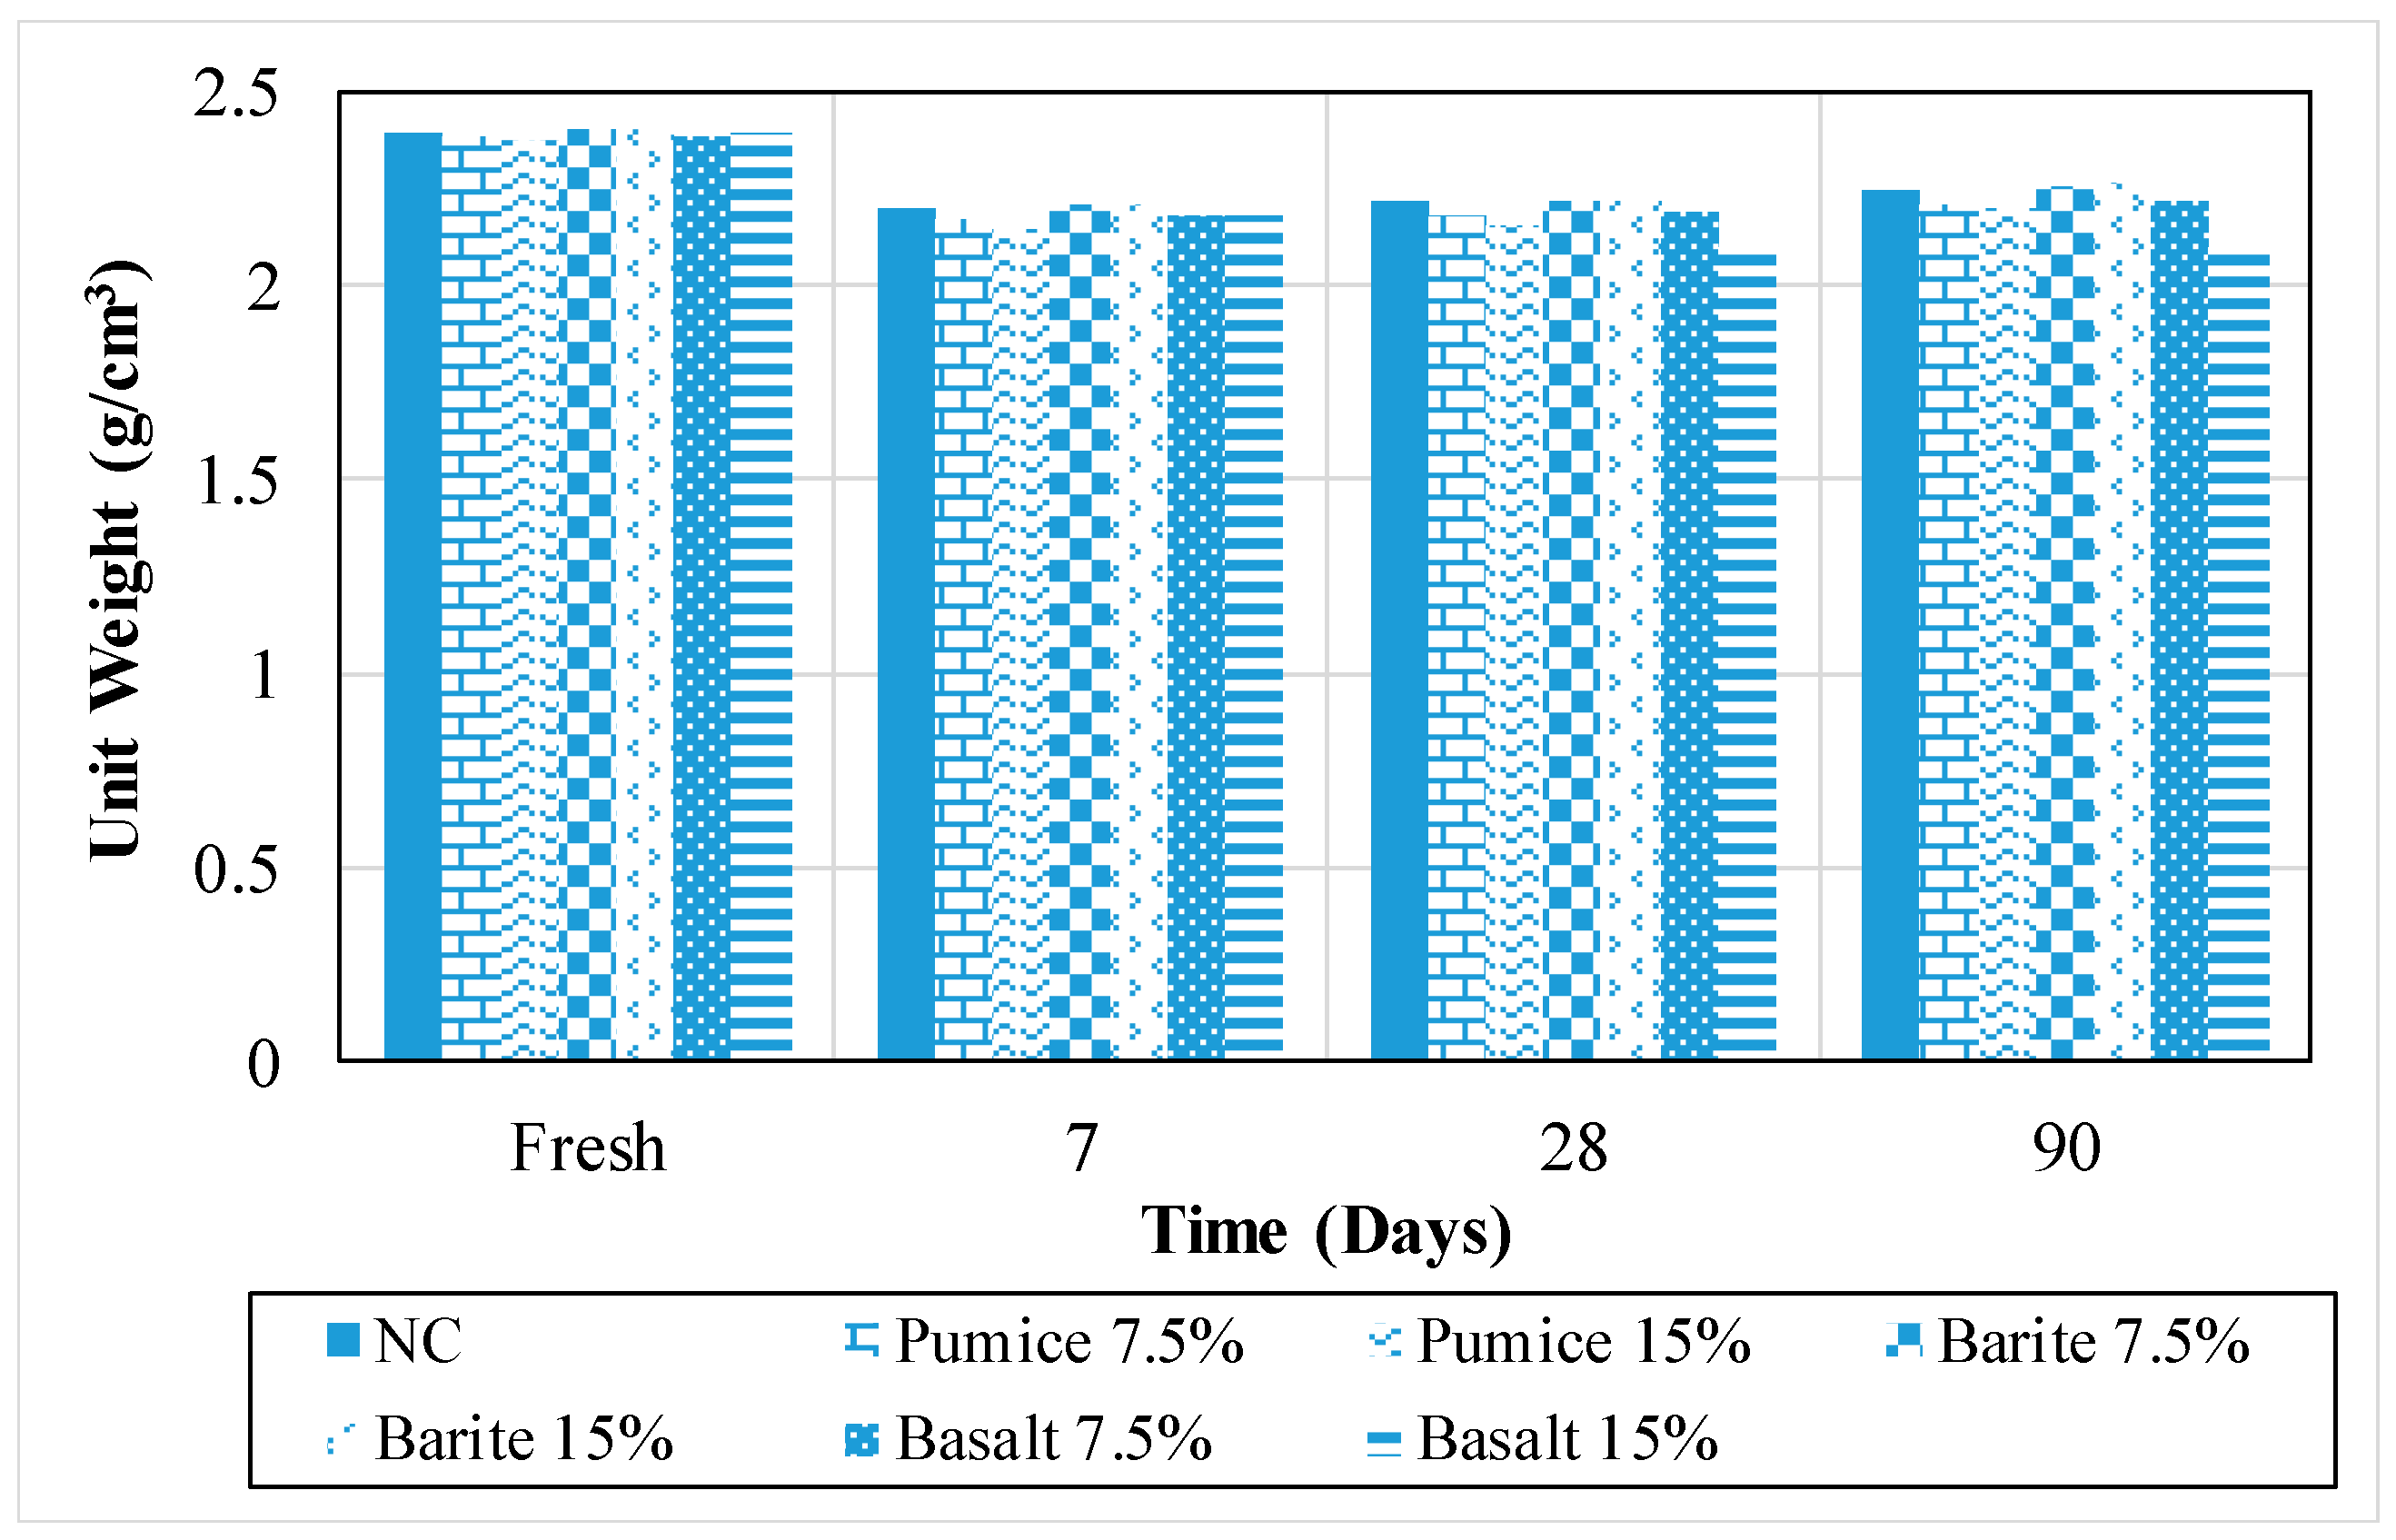
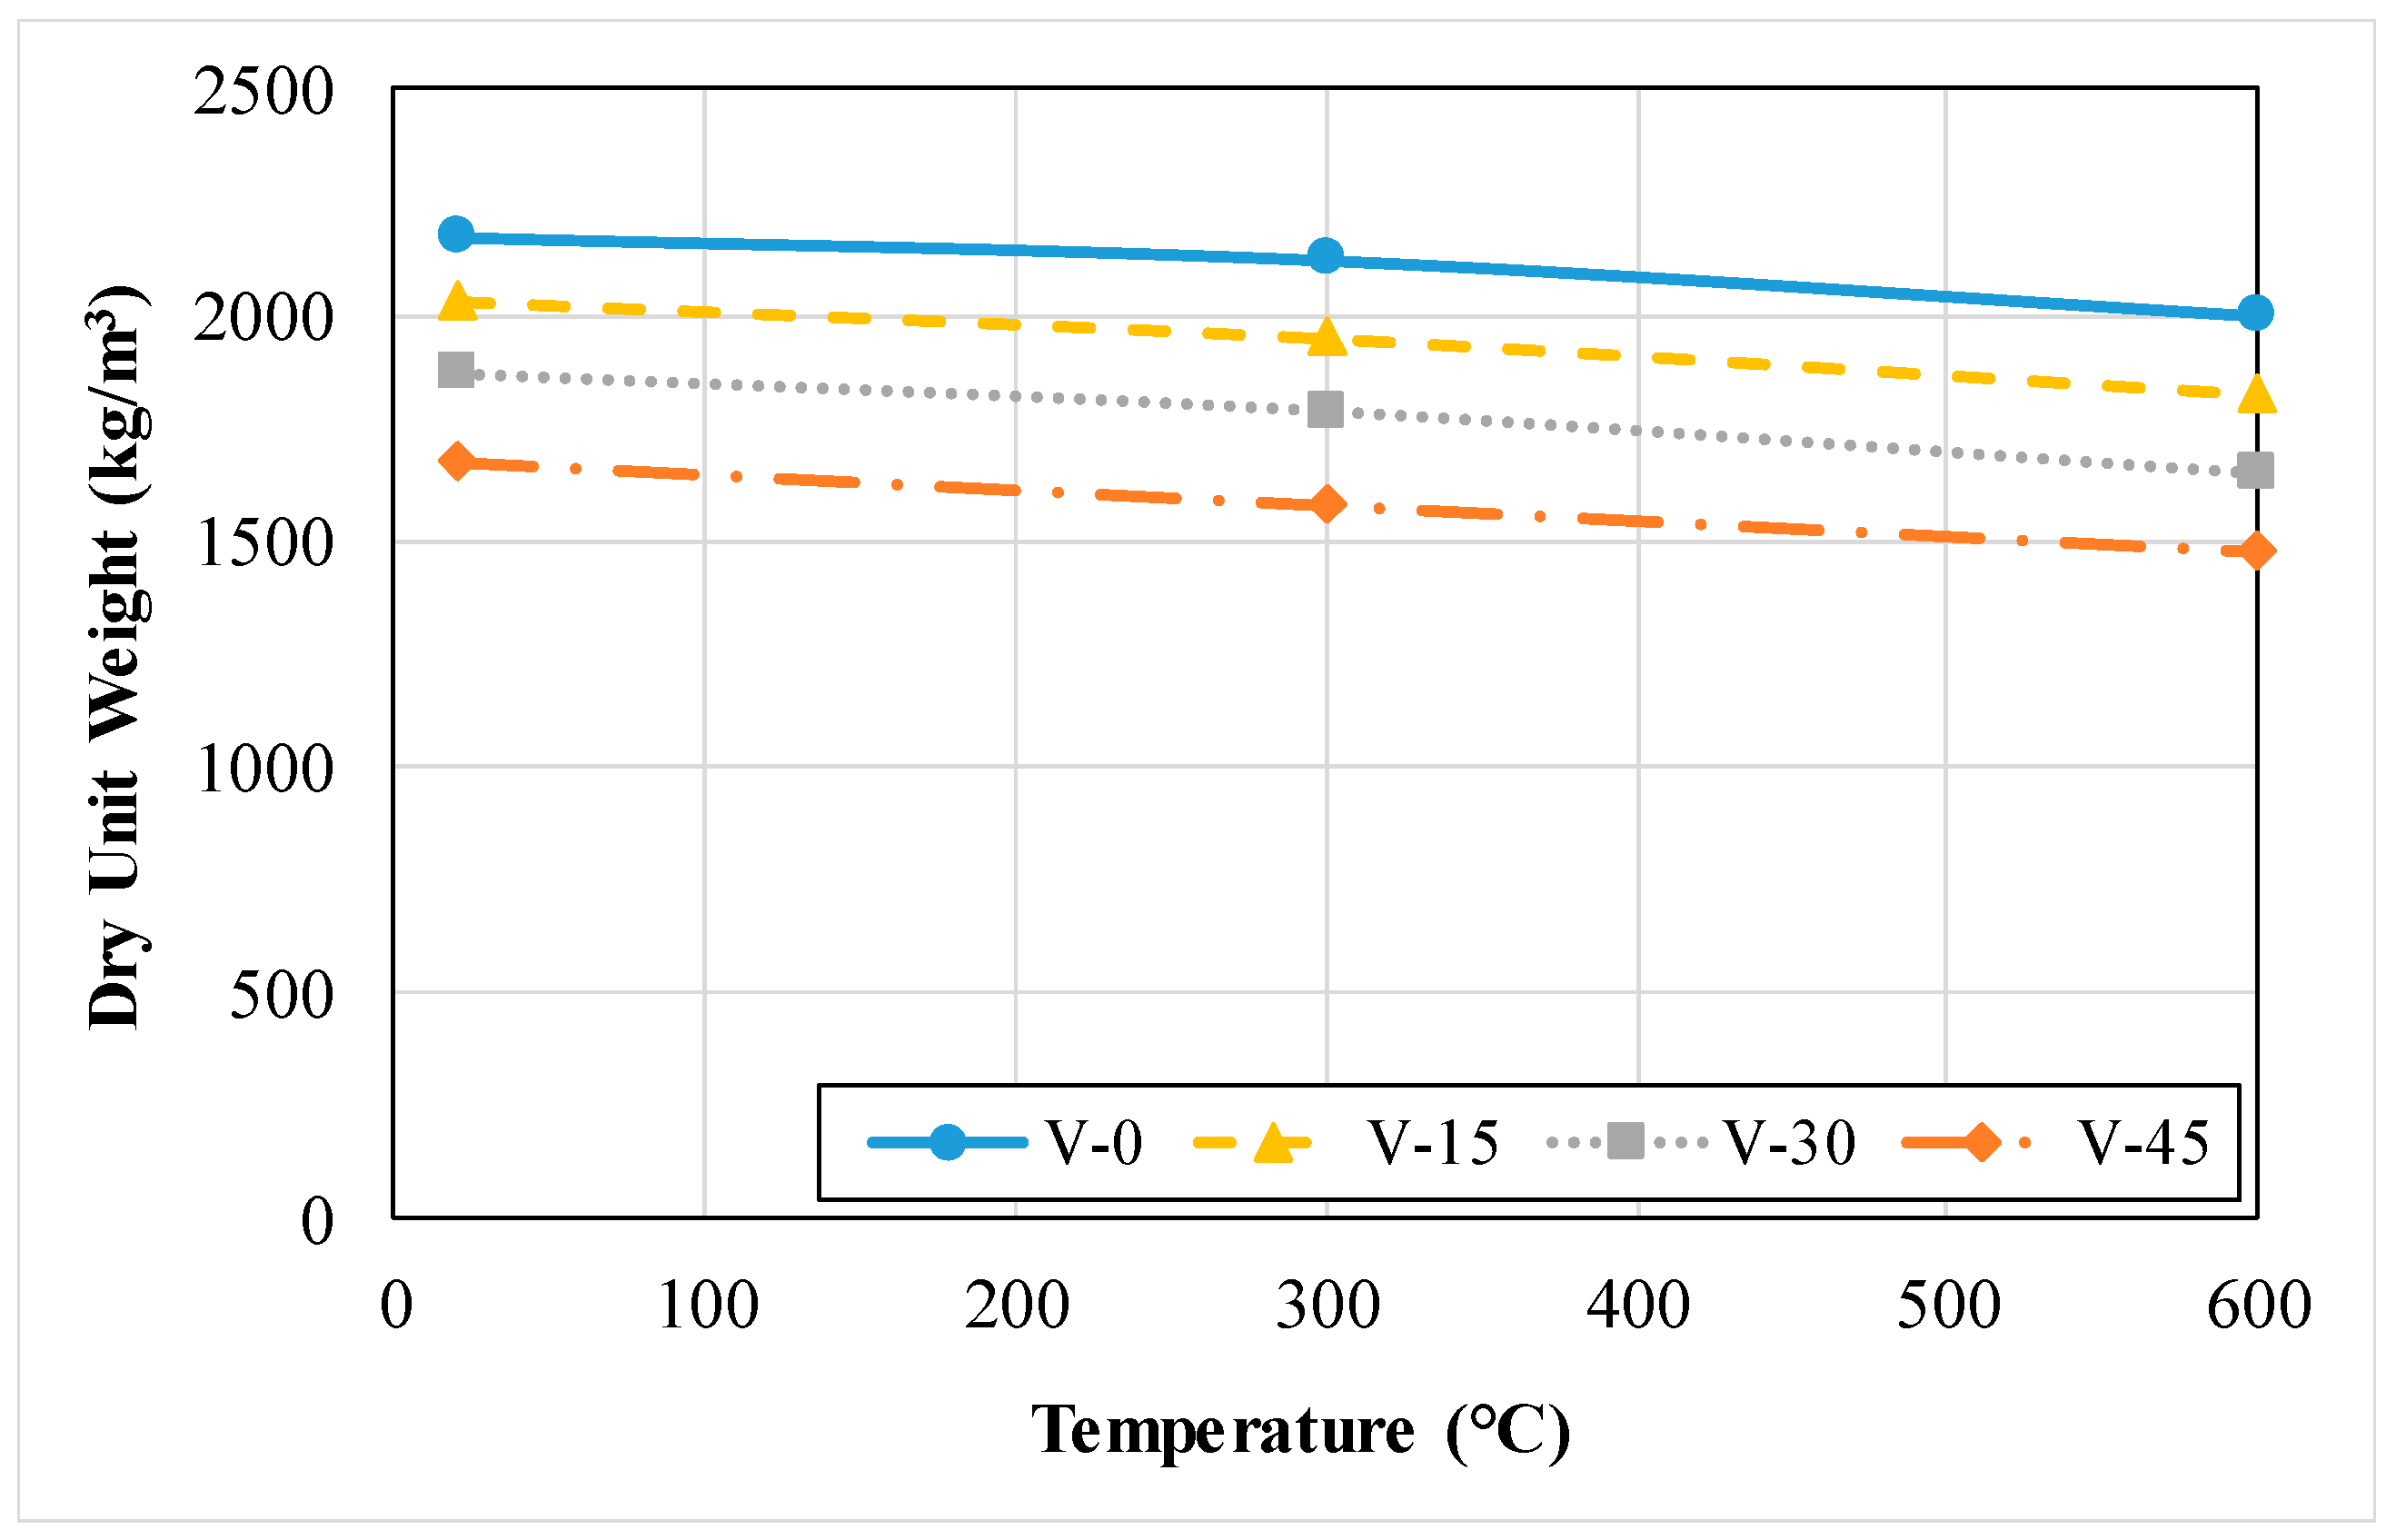
3.2.2. Dry Unit Weight or Density
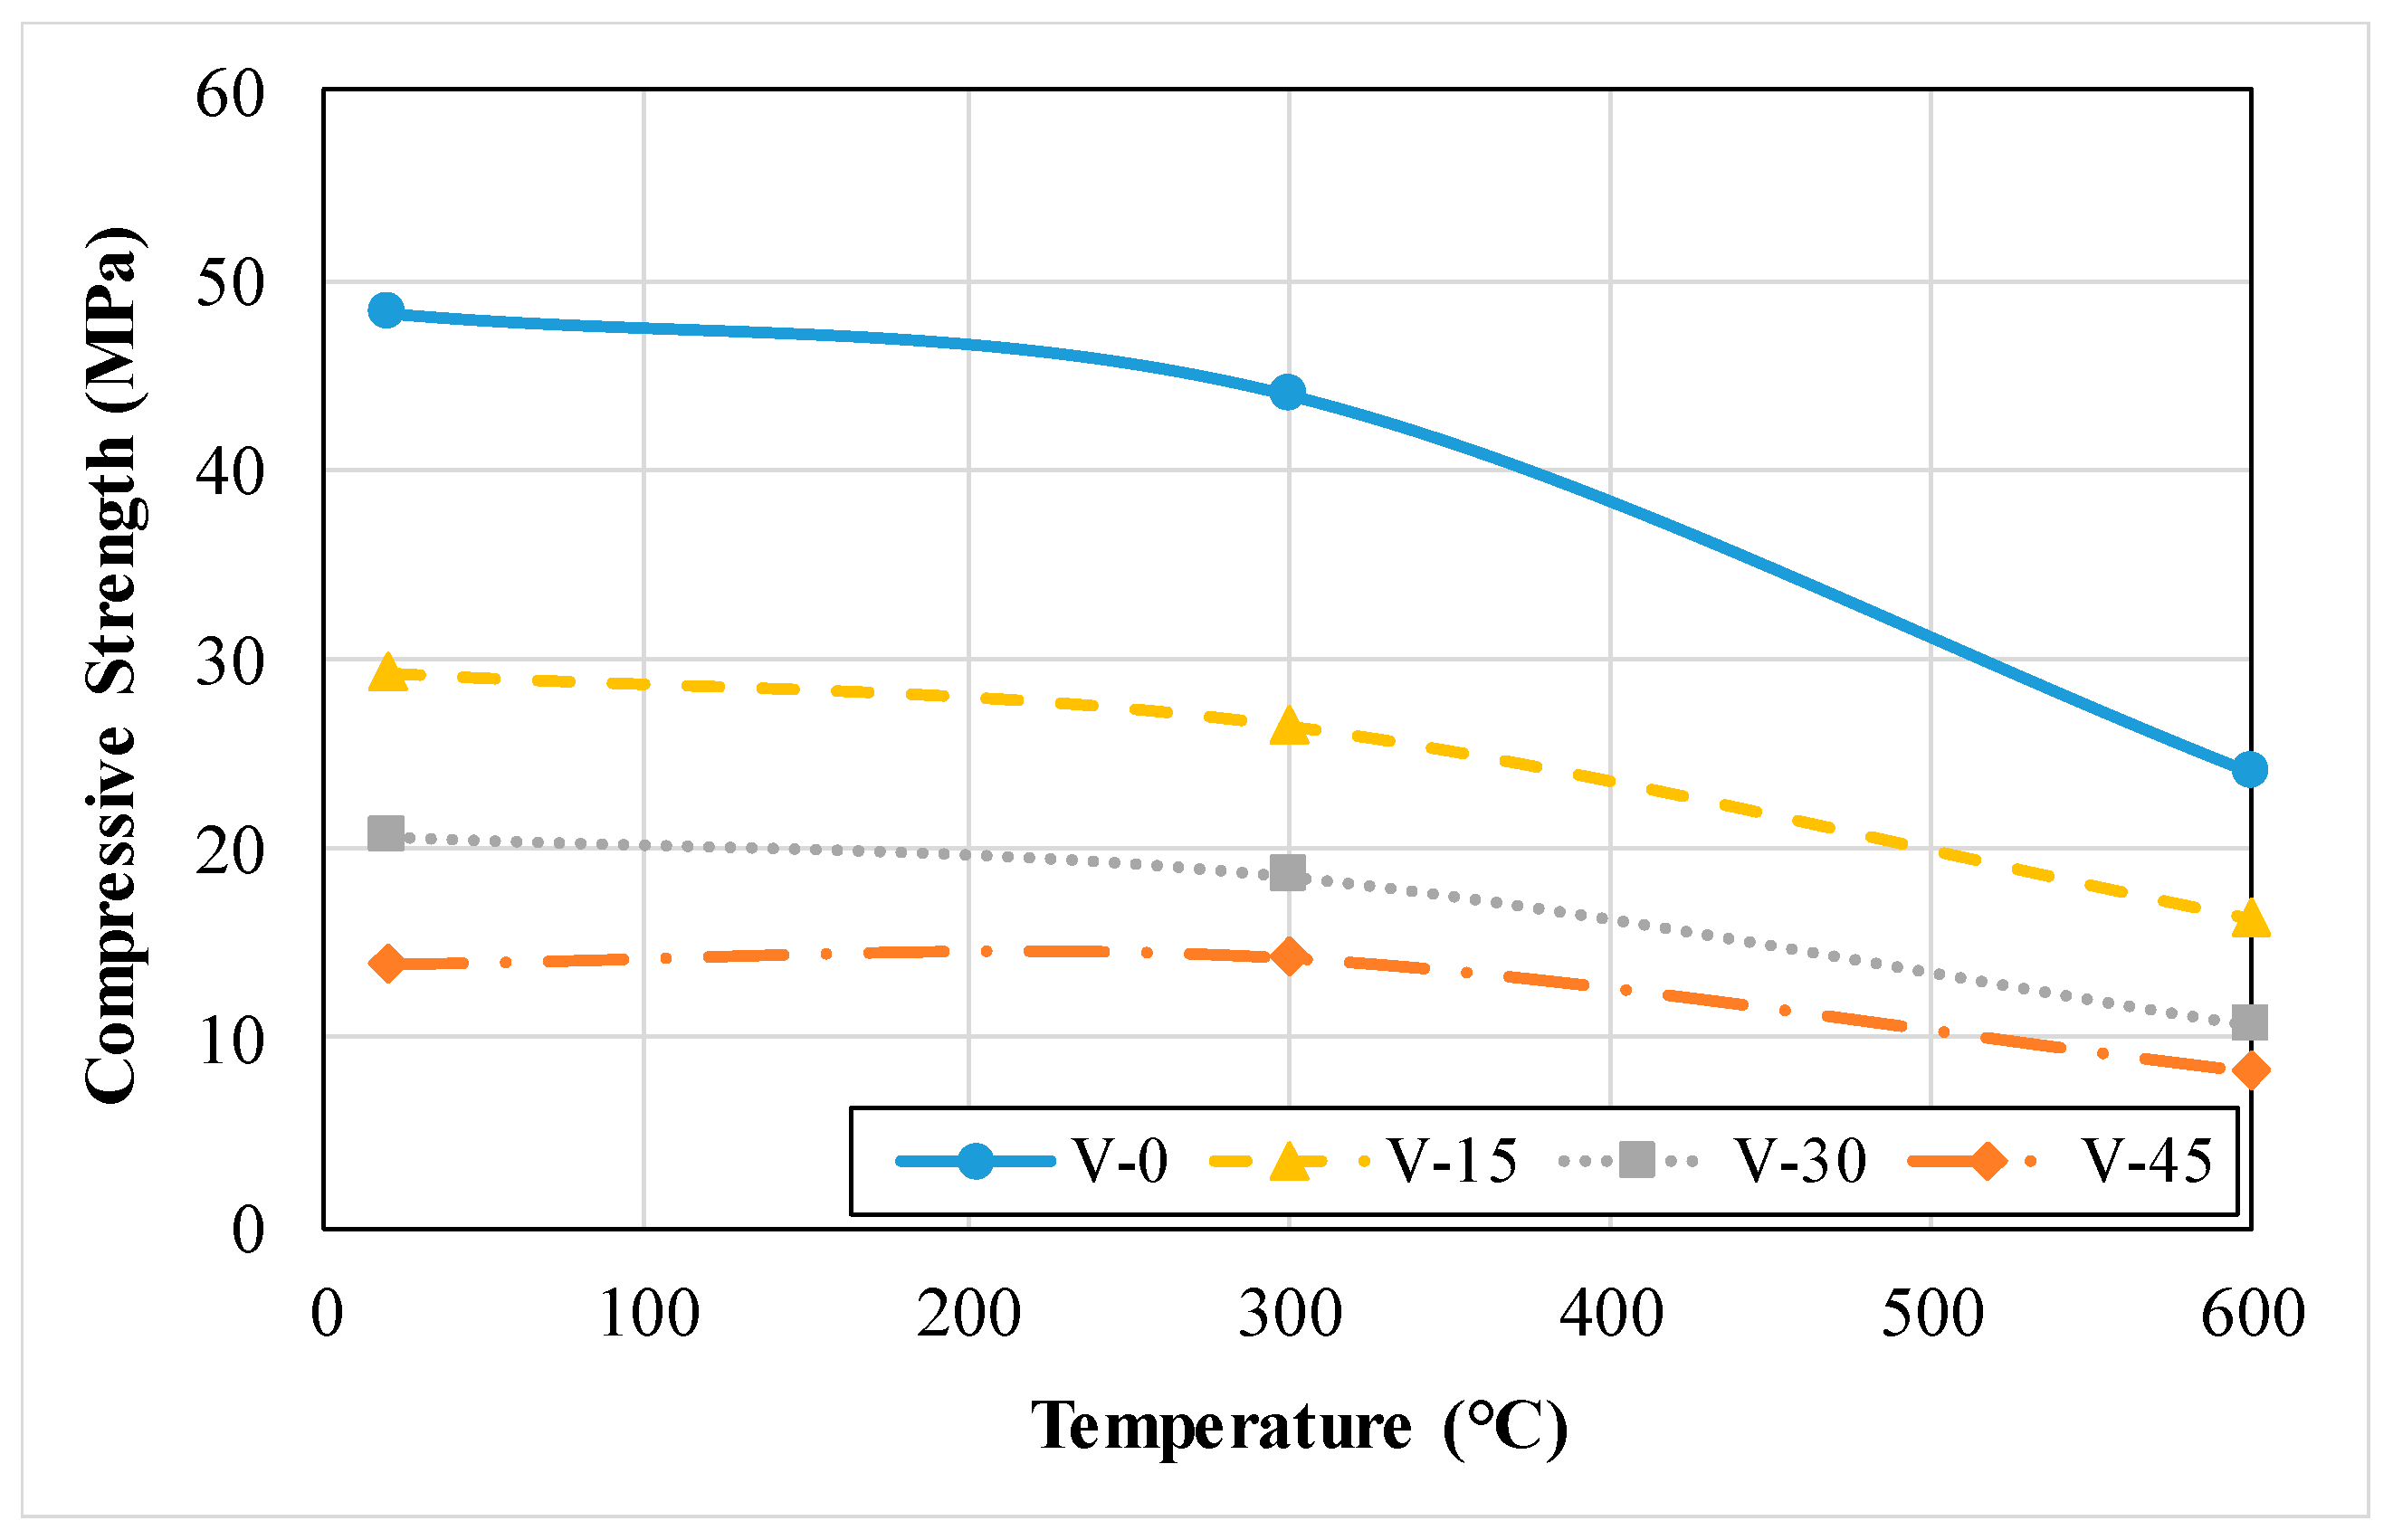
3.2.3. Compressive Strength
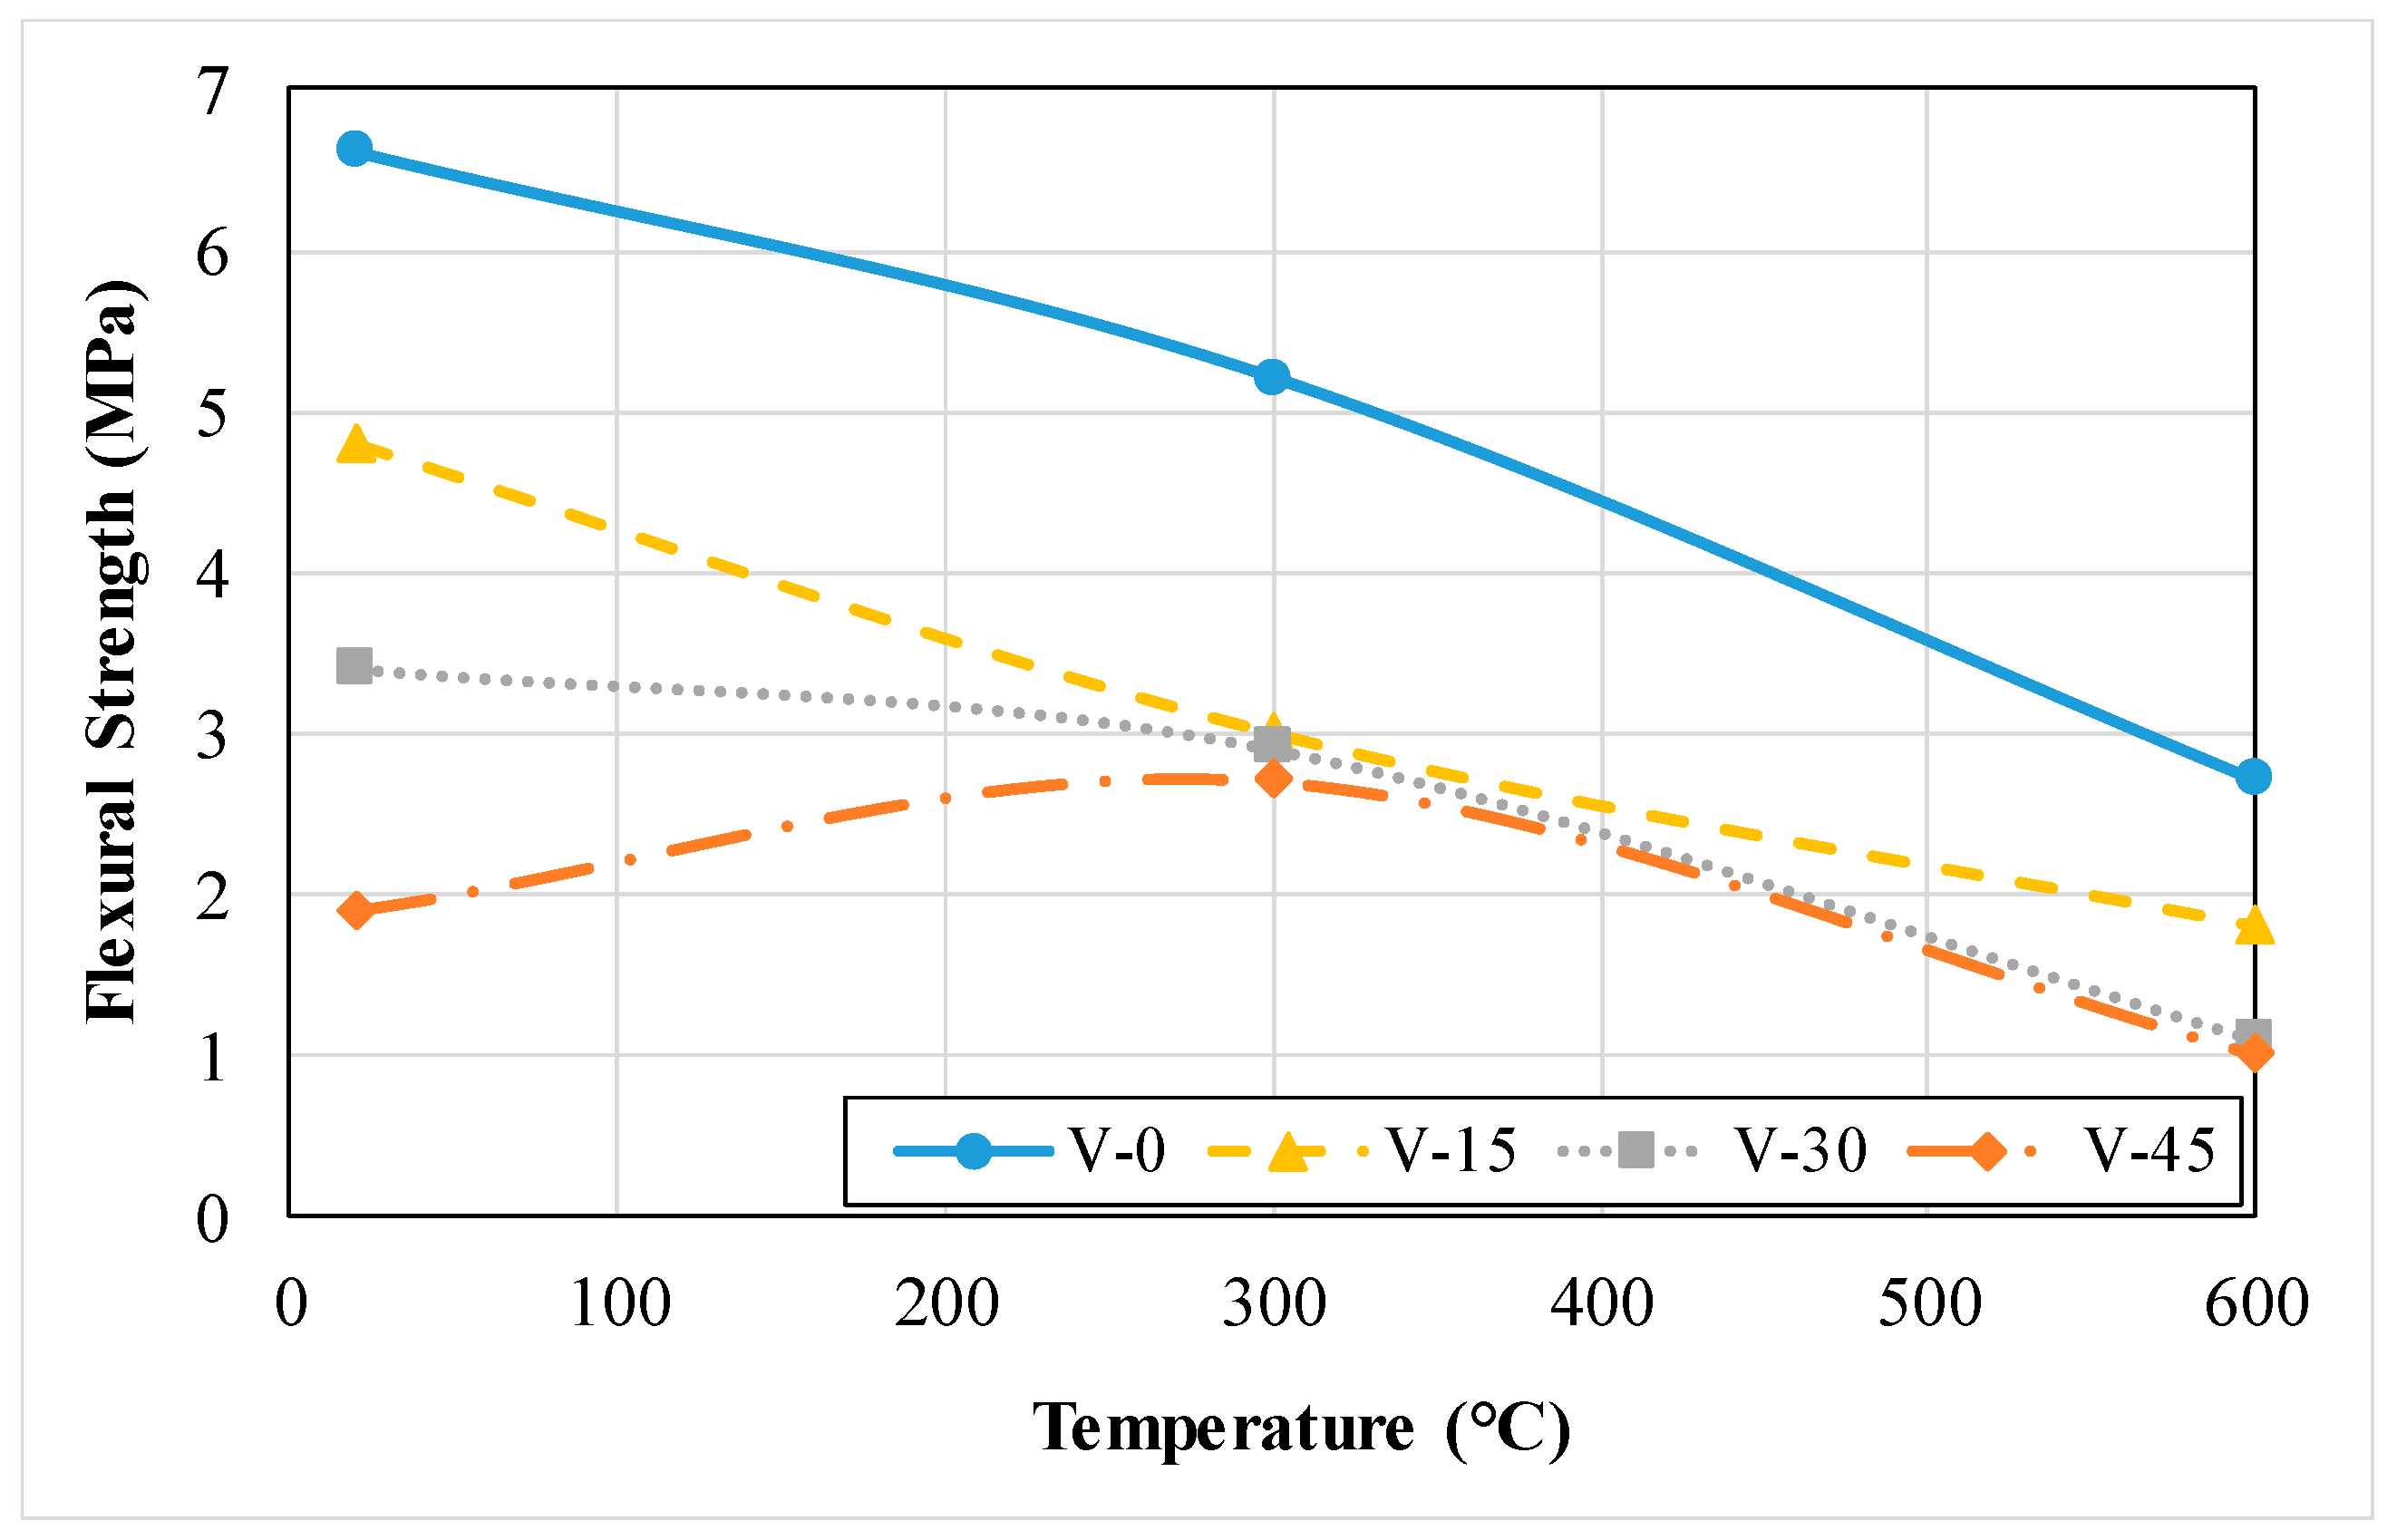
3.2.4. Flexural Strength
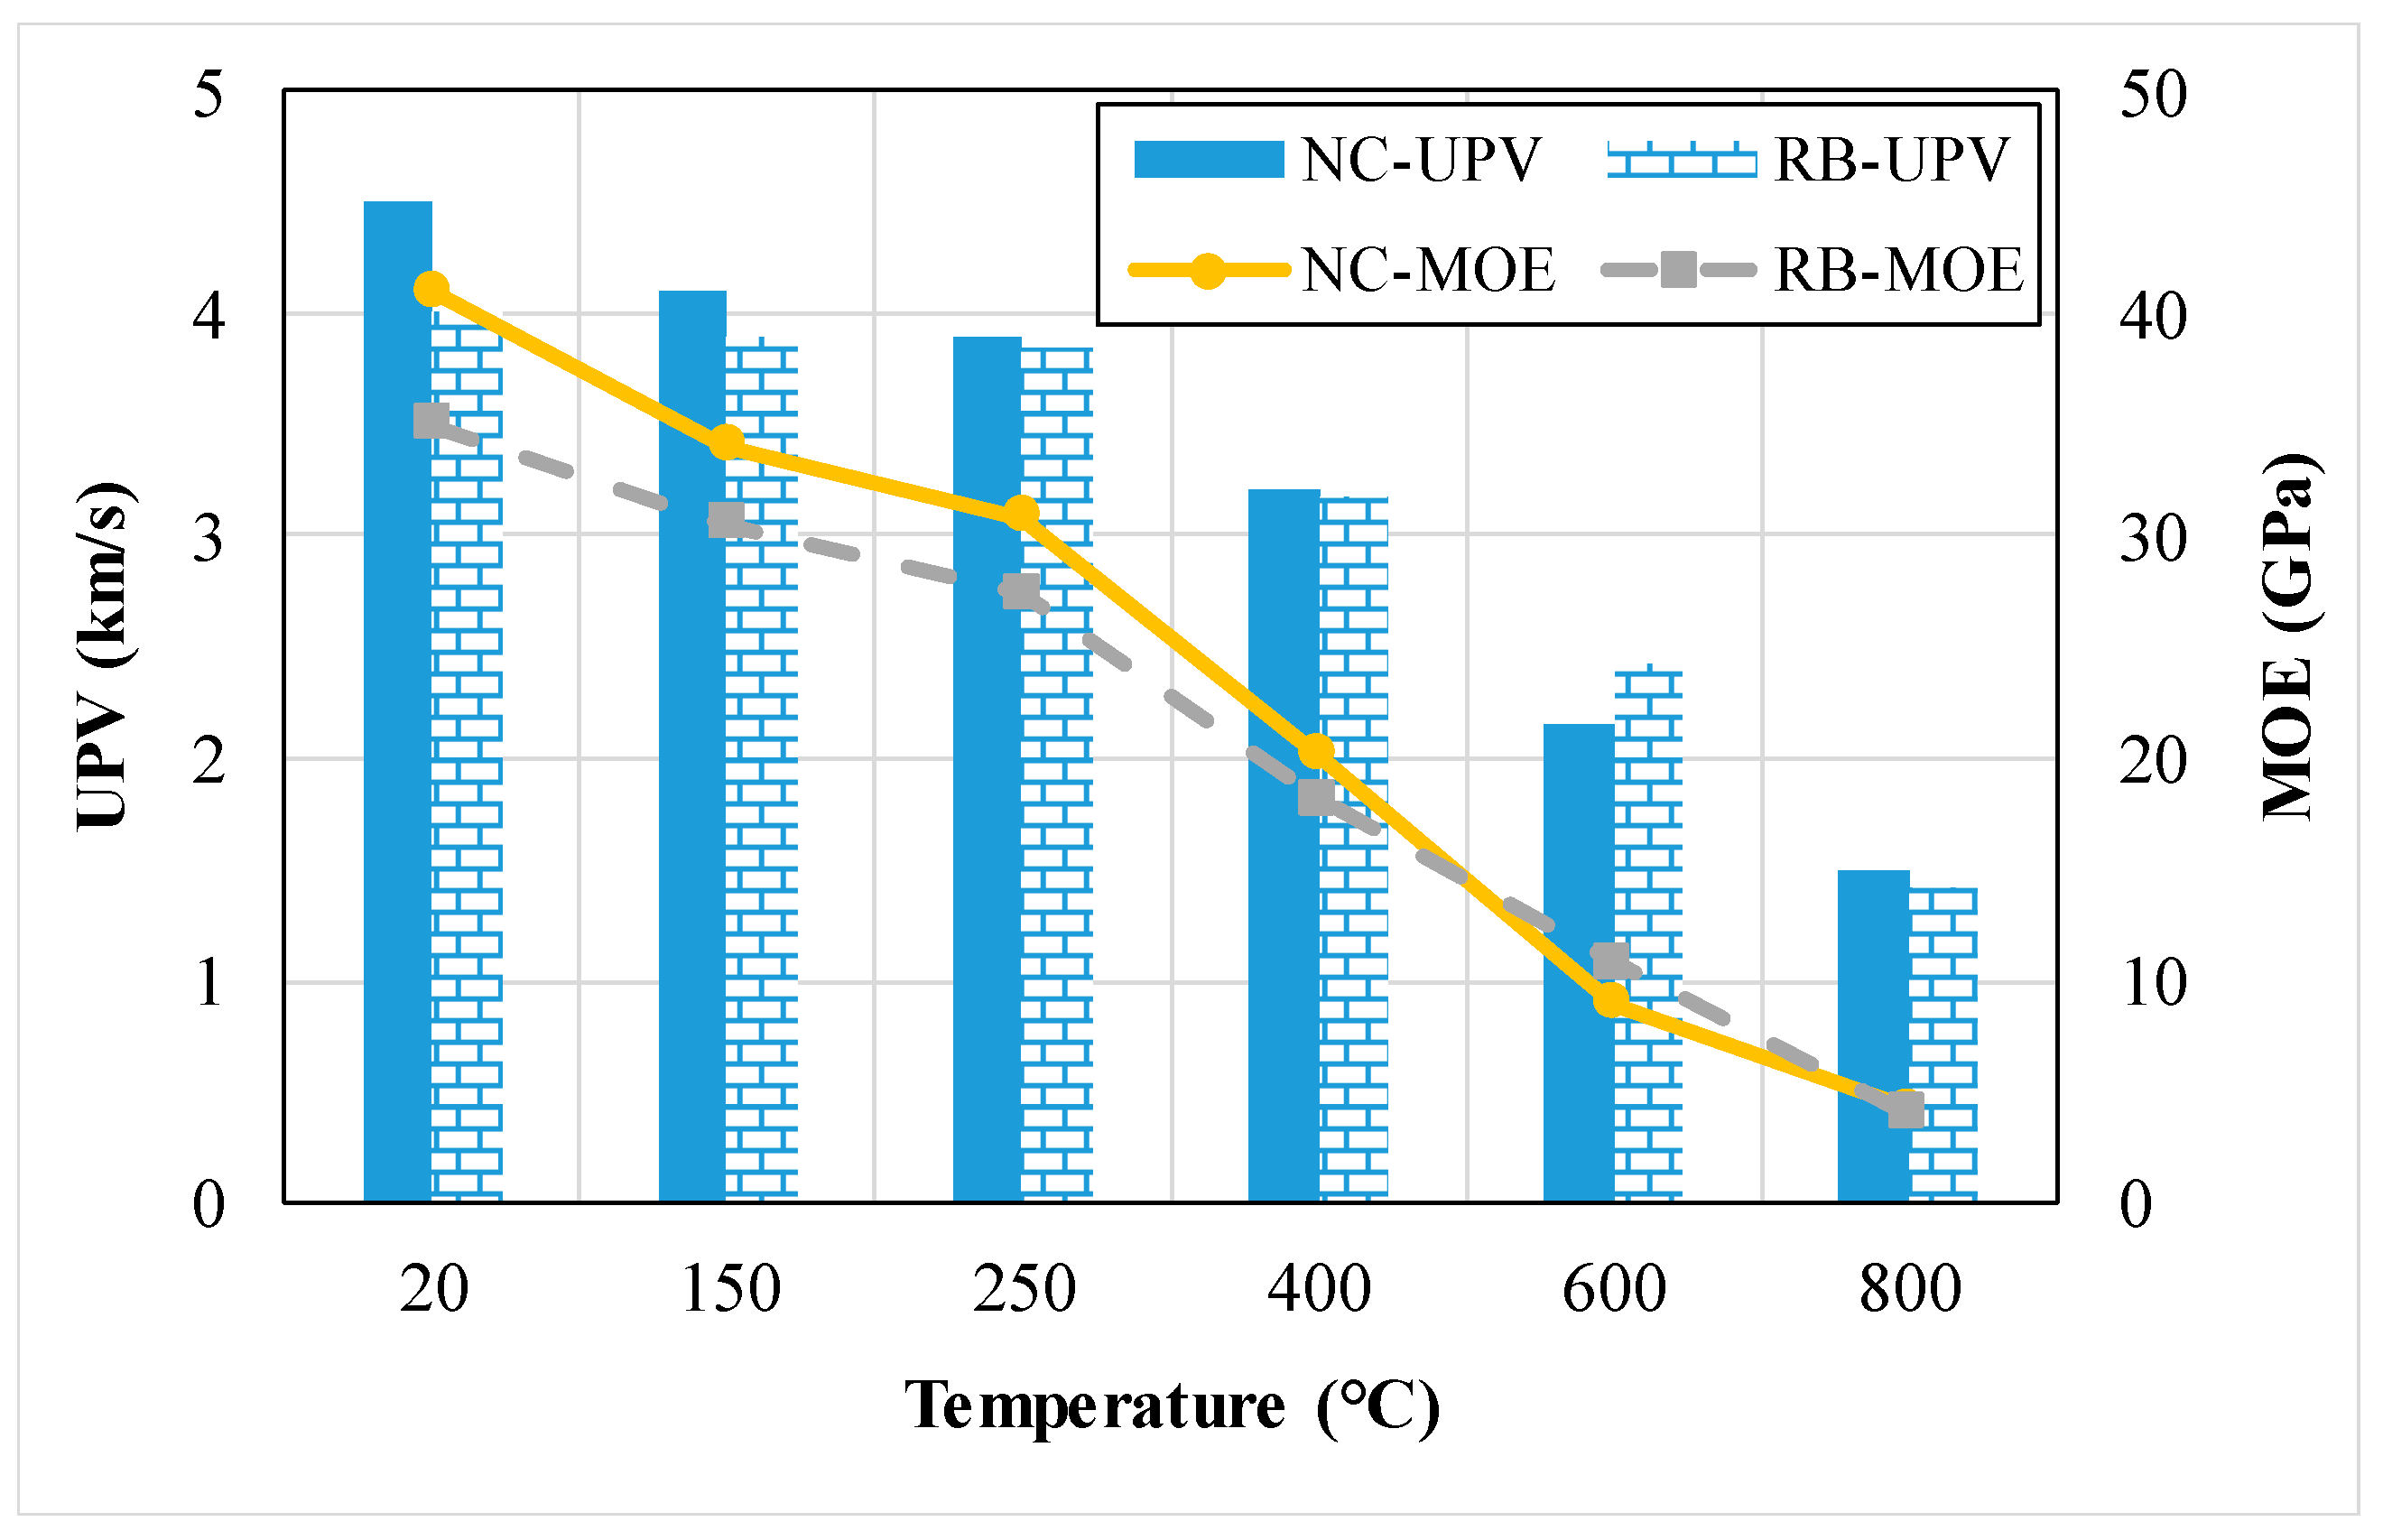
3.2.5. Ultrasonic Pulse Velocity (UPV) and Modulus of Elasticity (MOE)
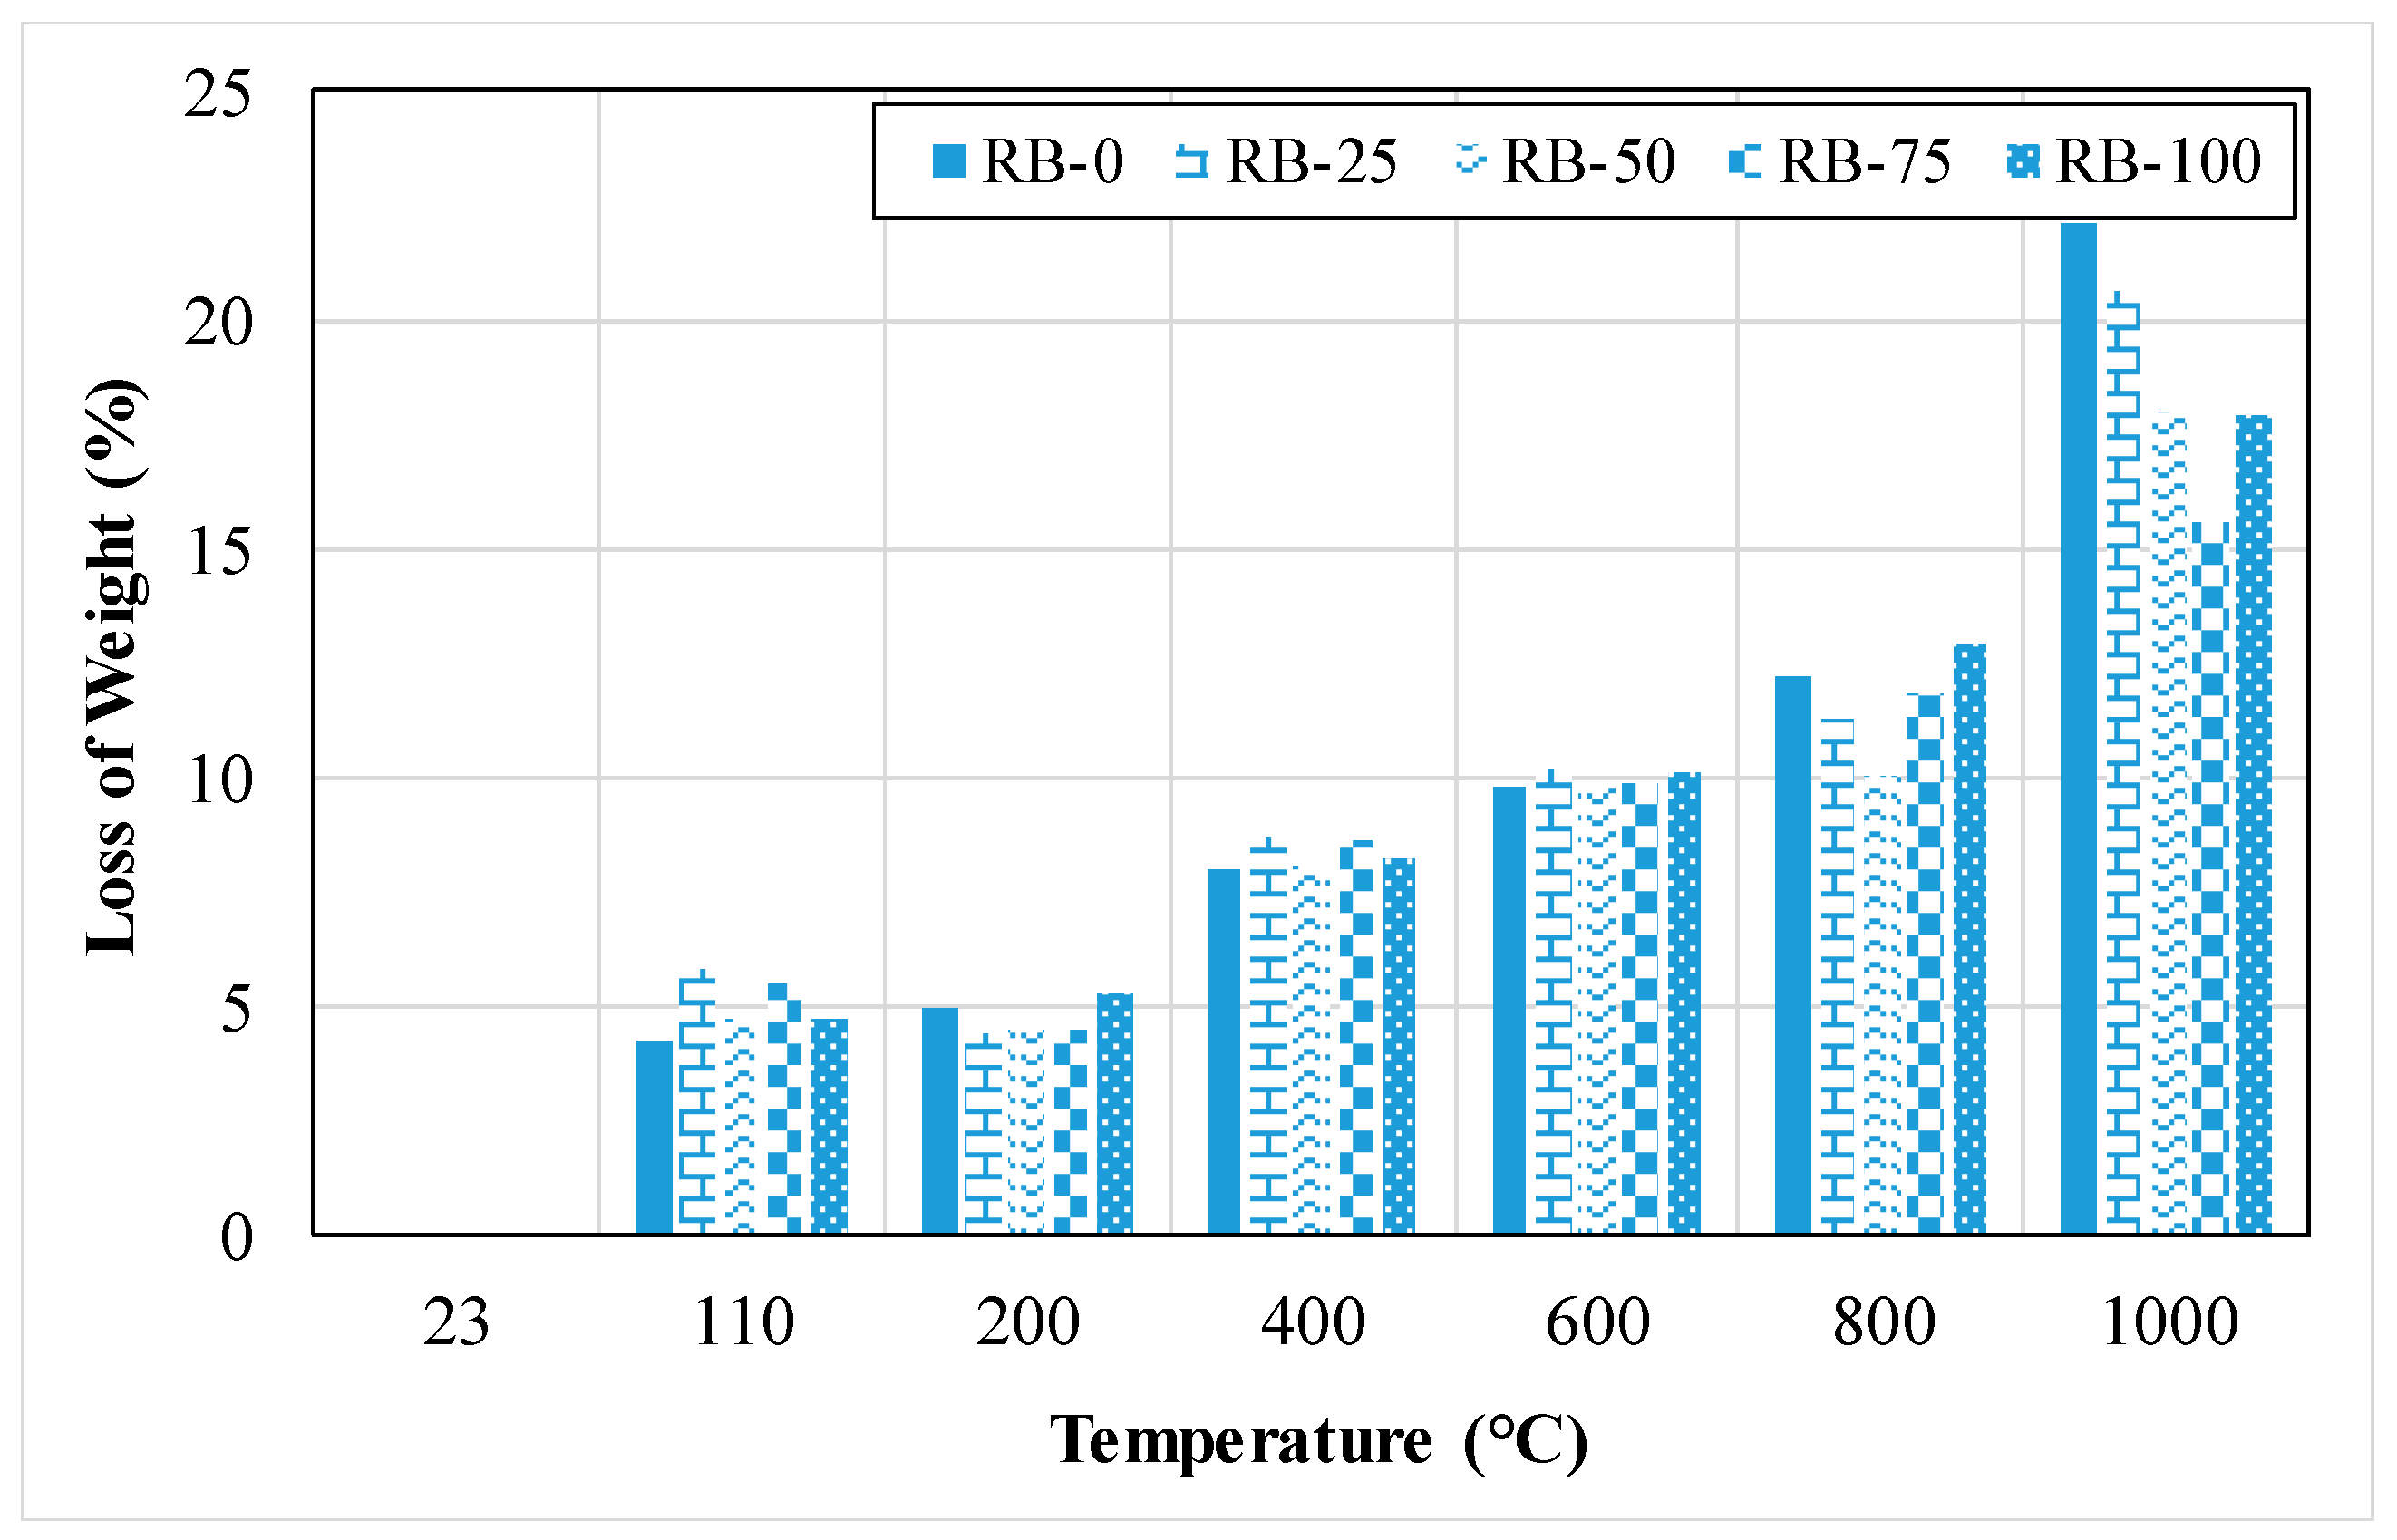
3.2.6. Variation of Weight
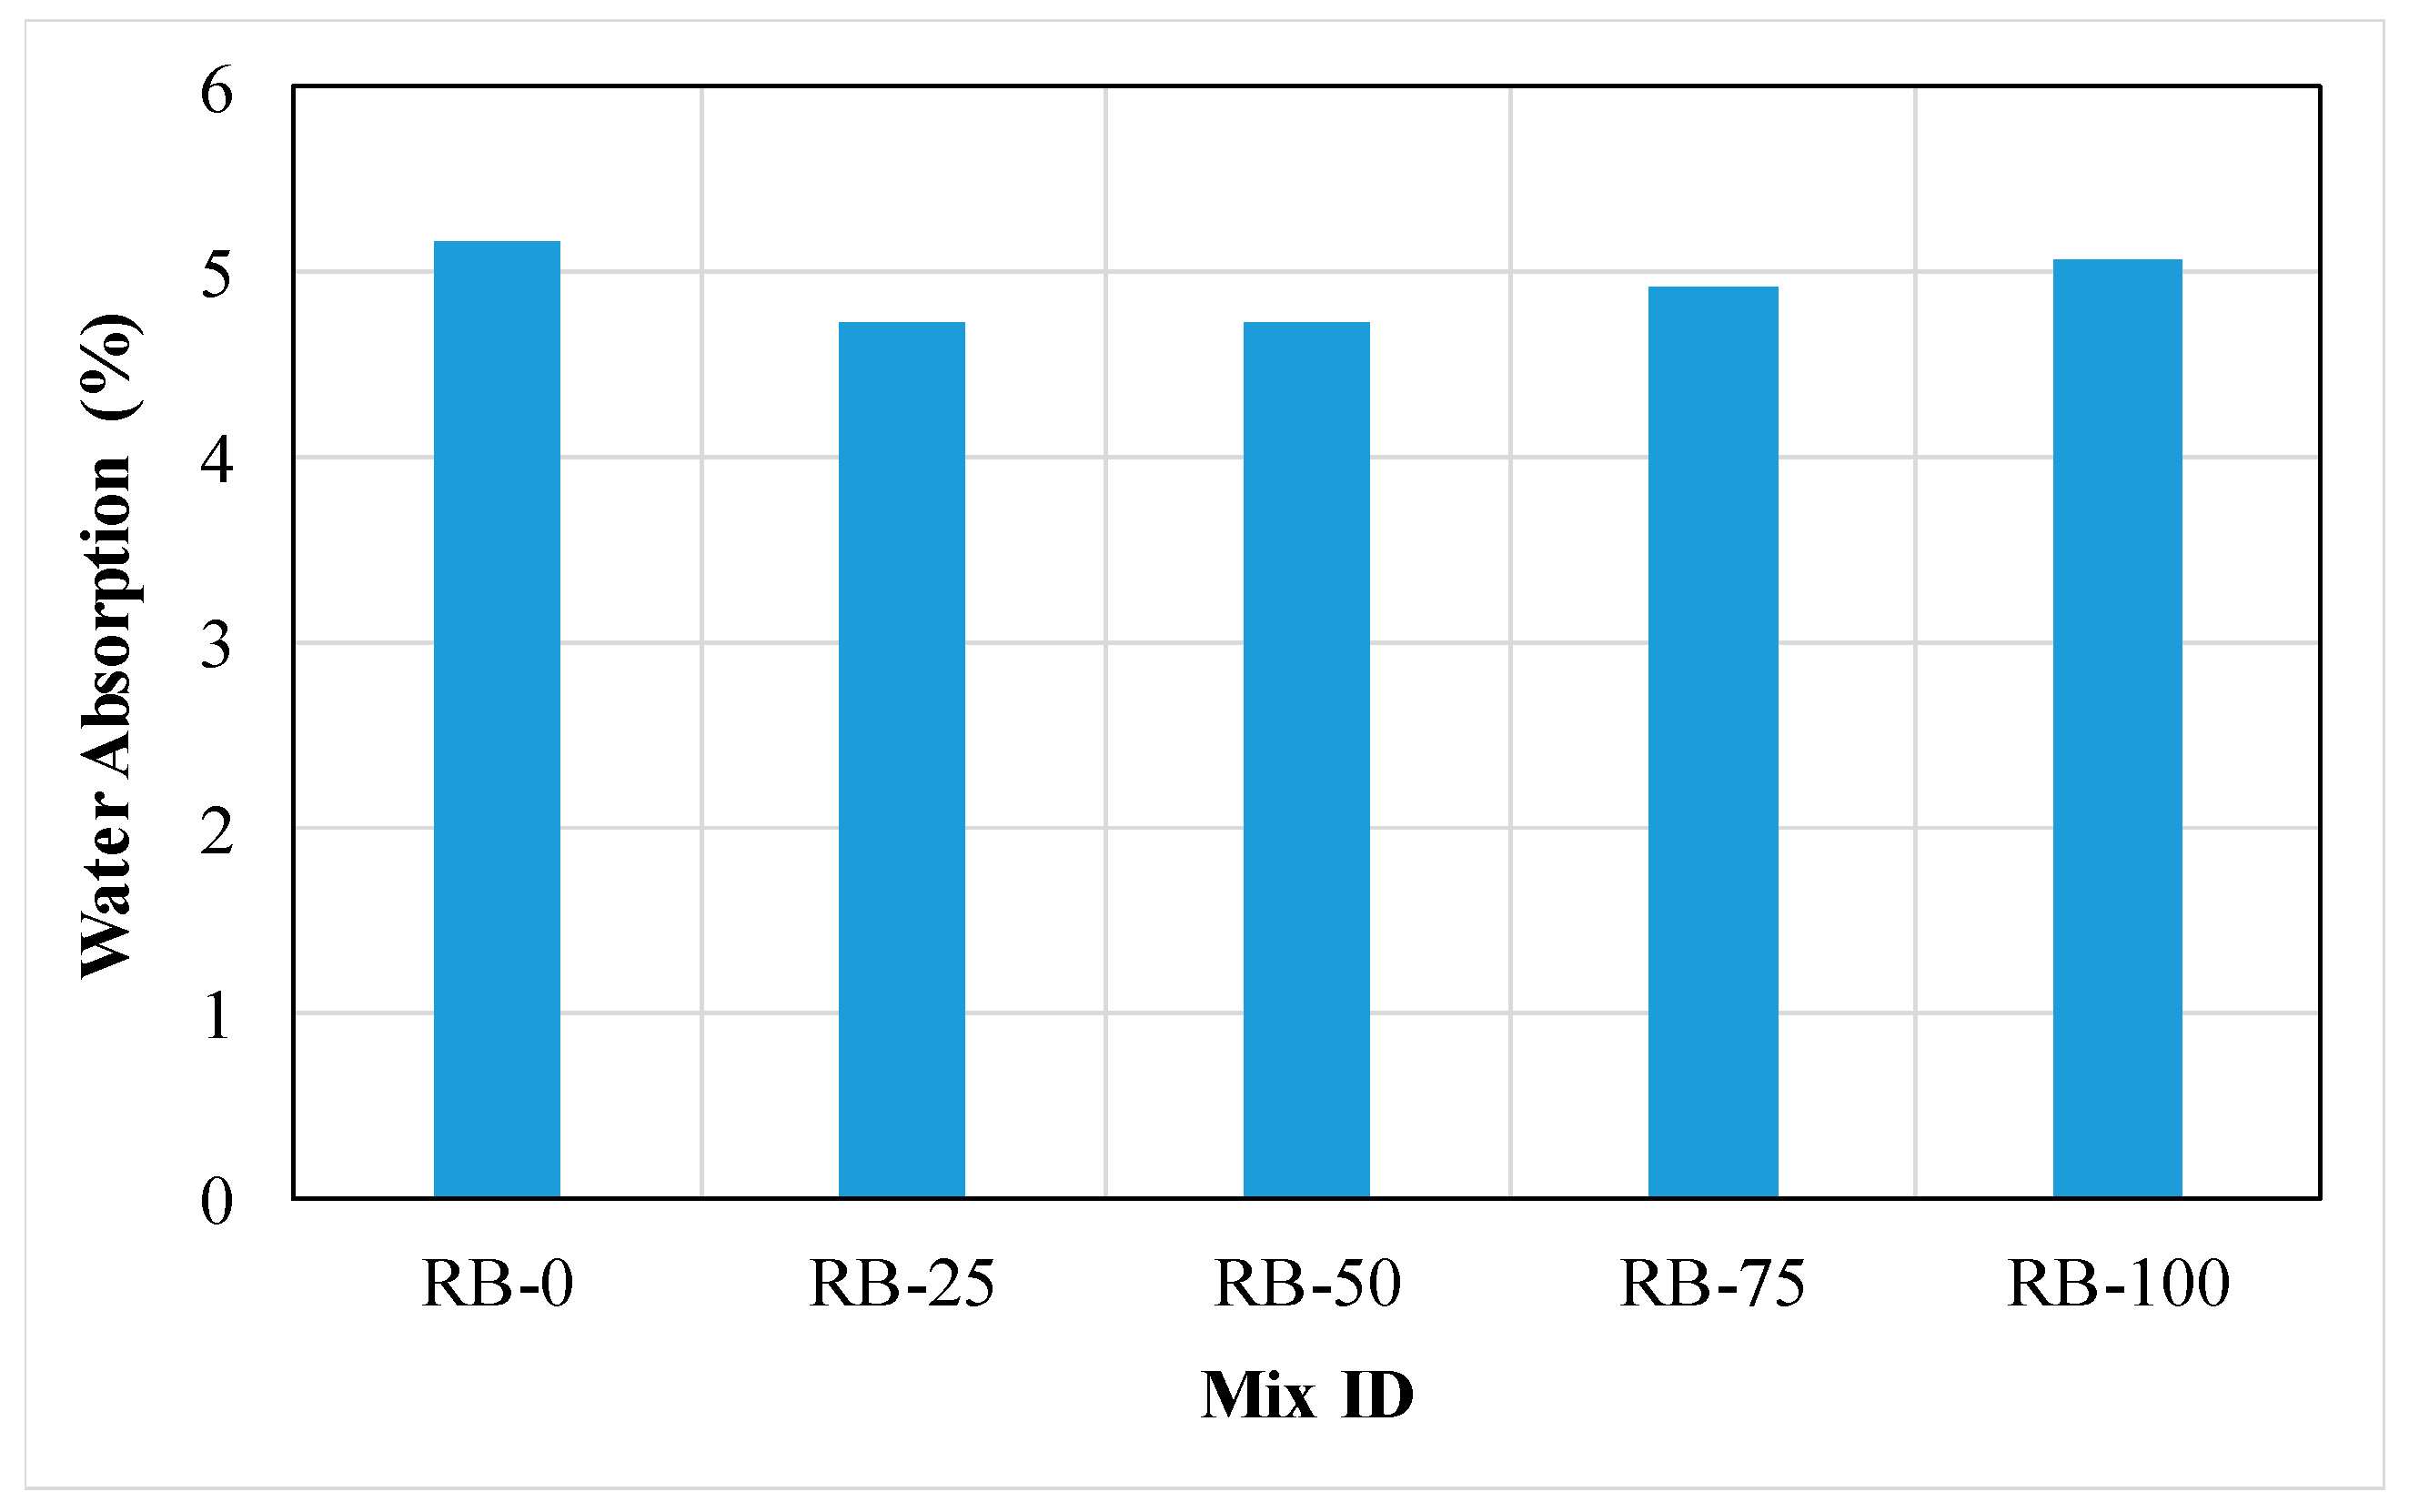
3.2.7. Water Absorption
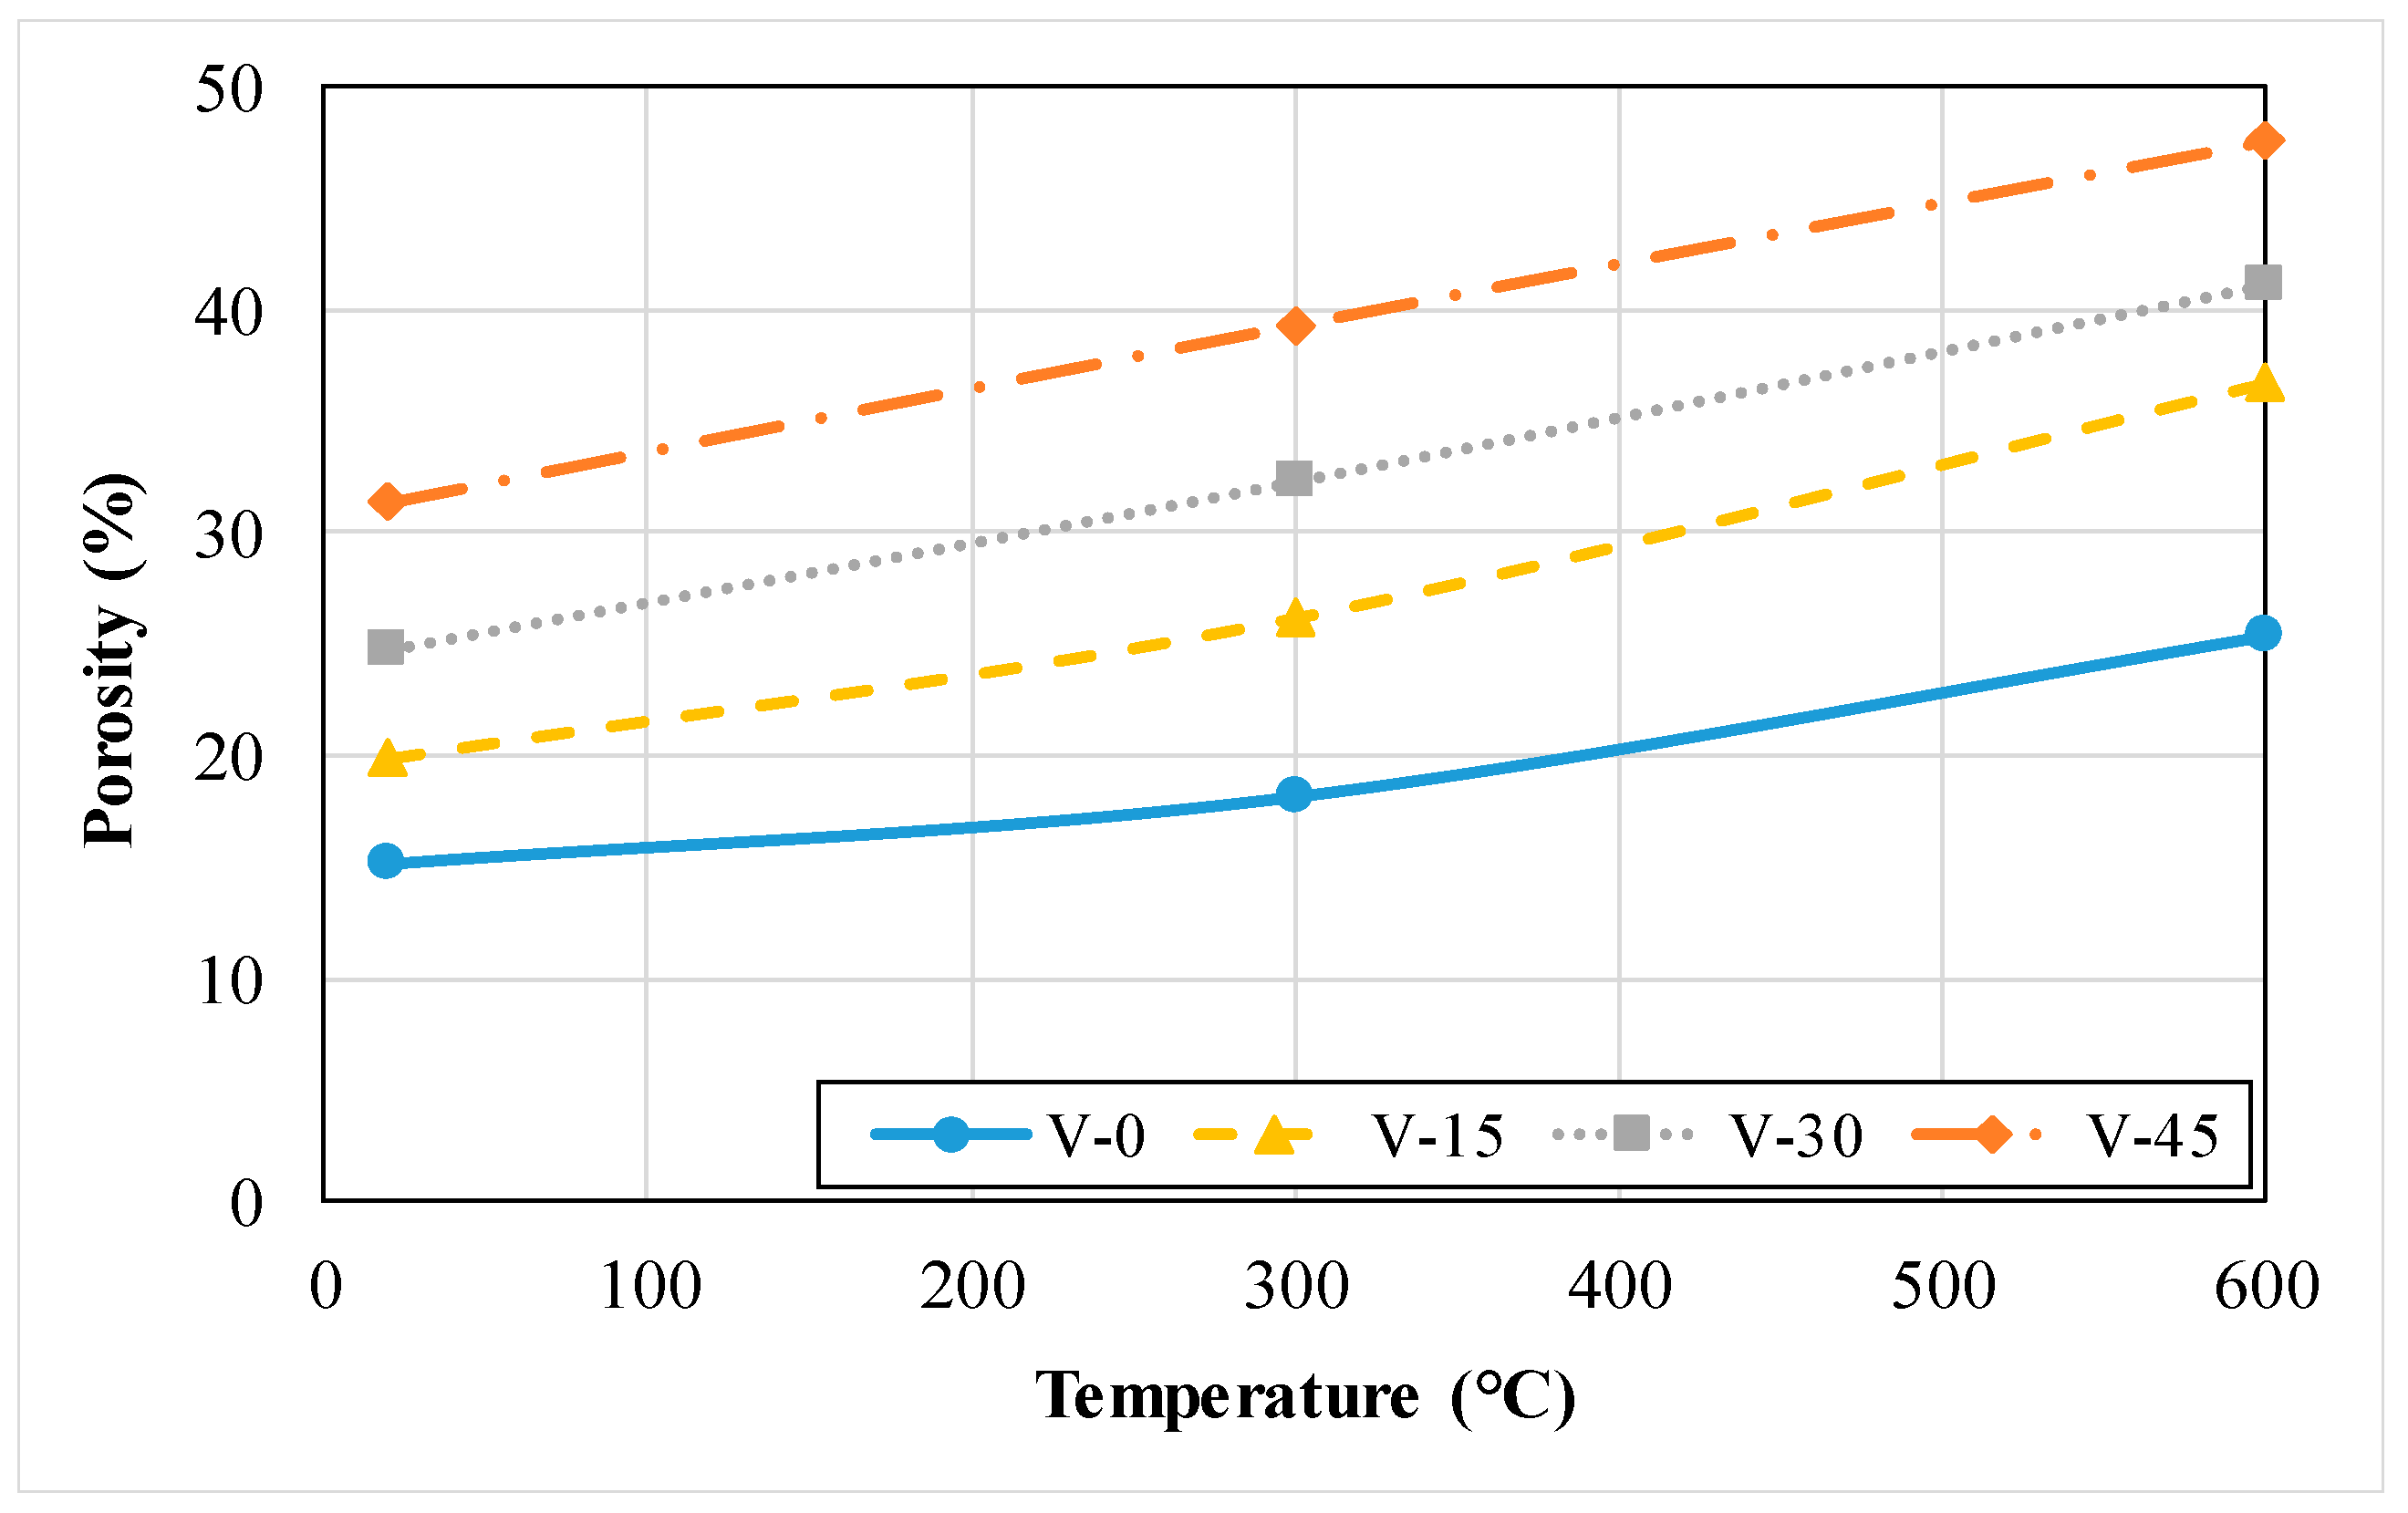
3.2.8. Porosity
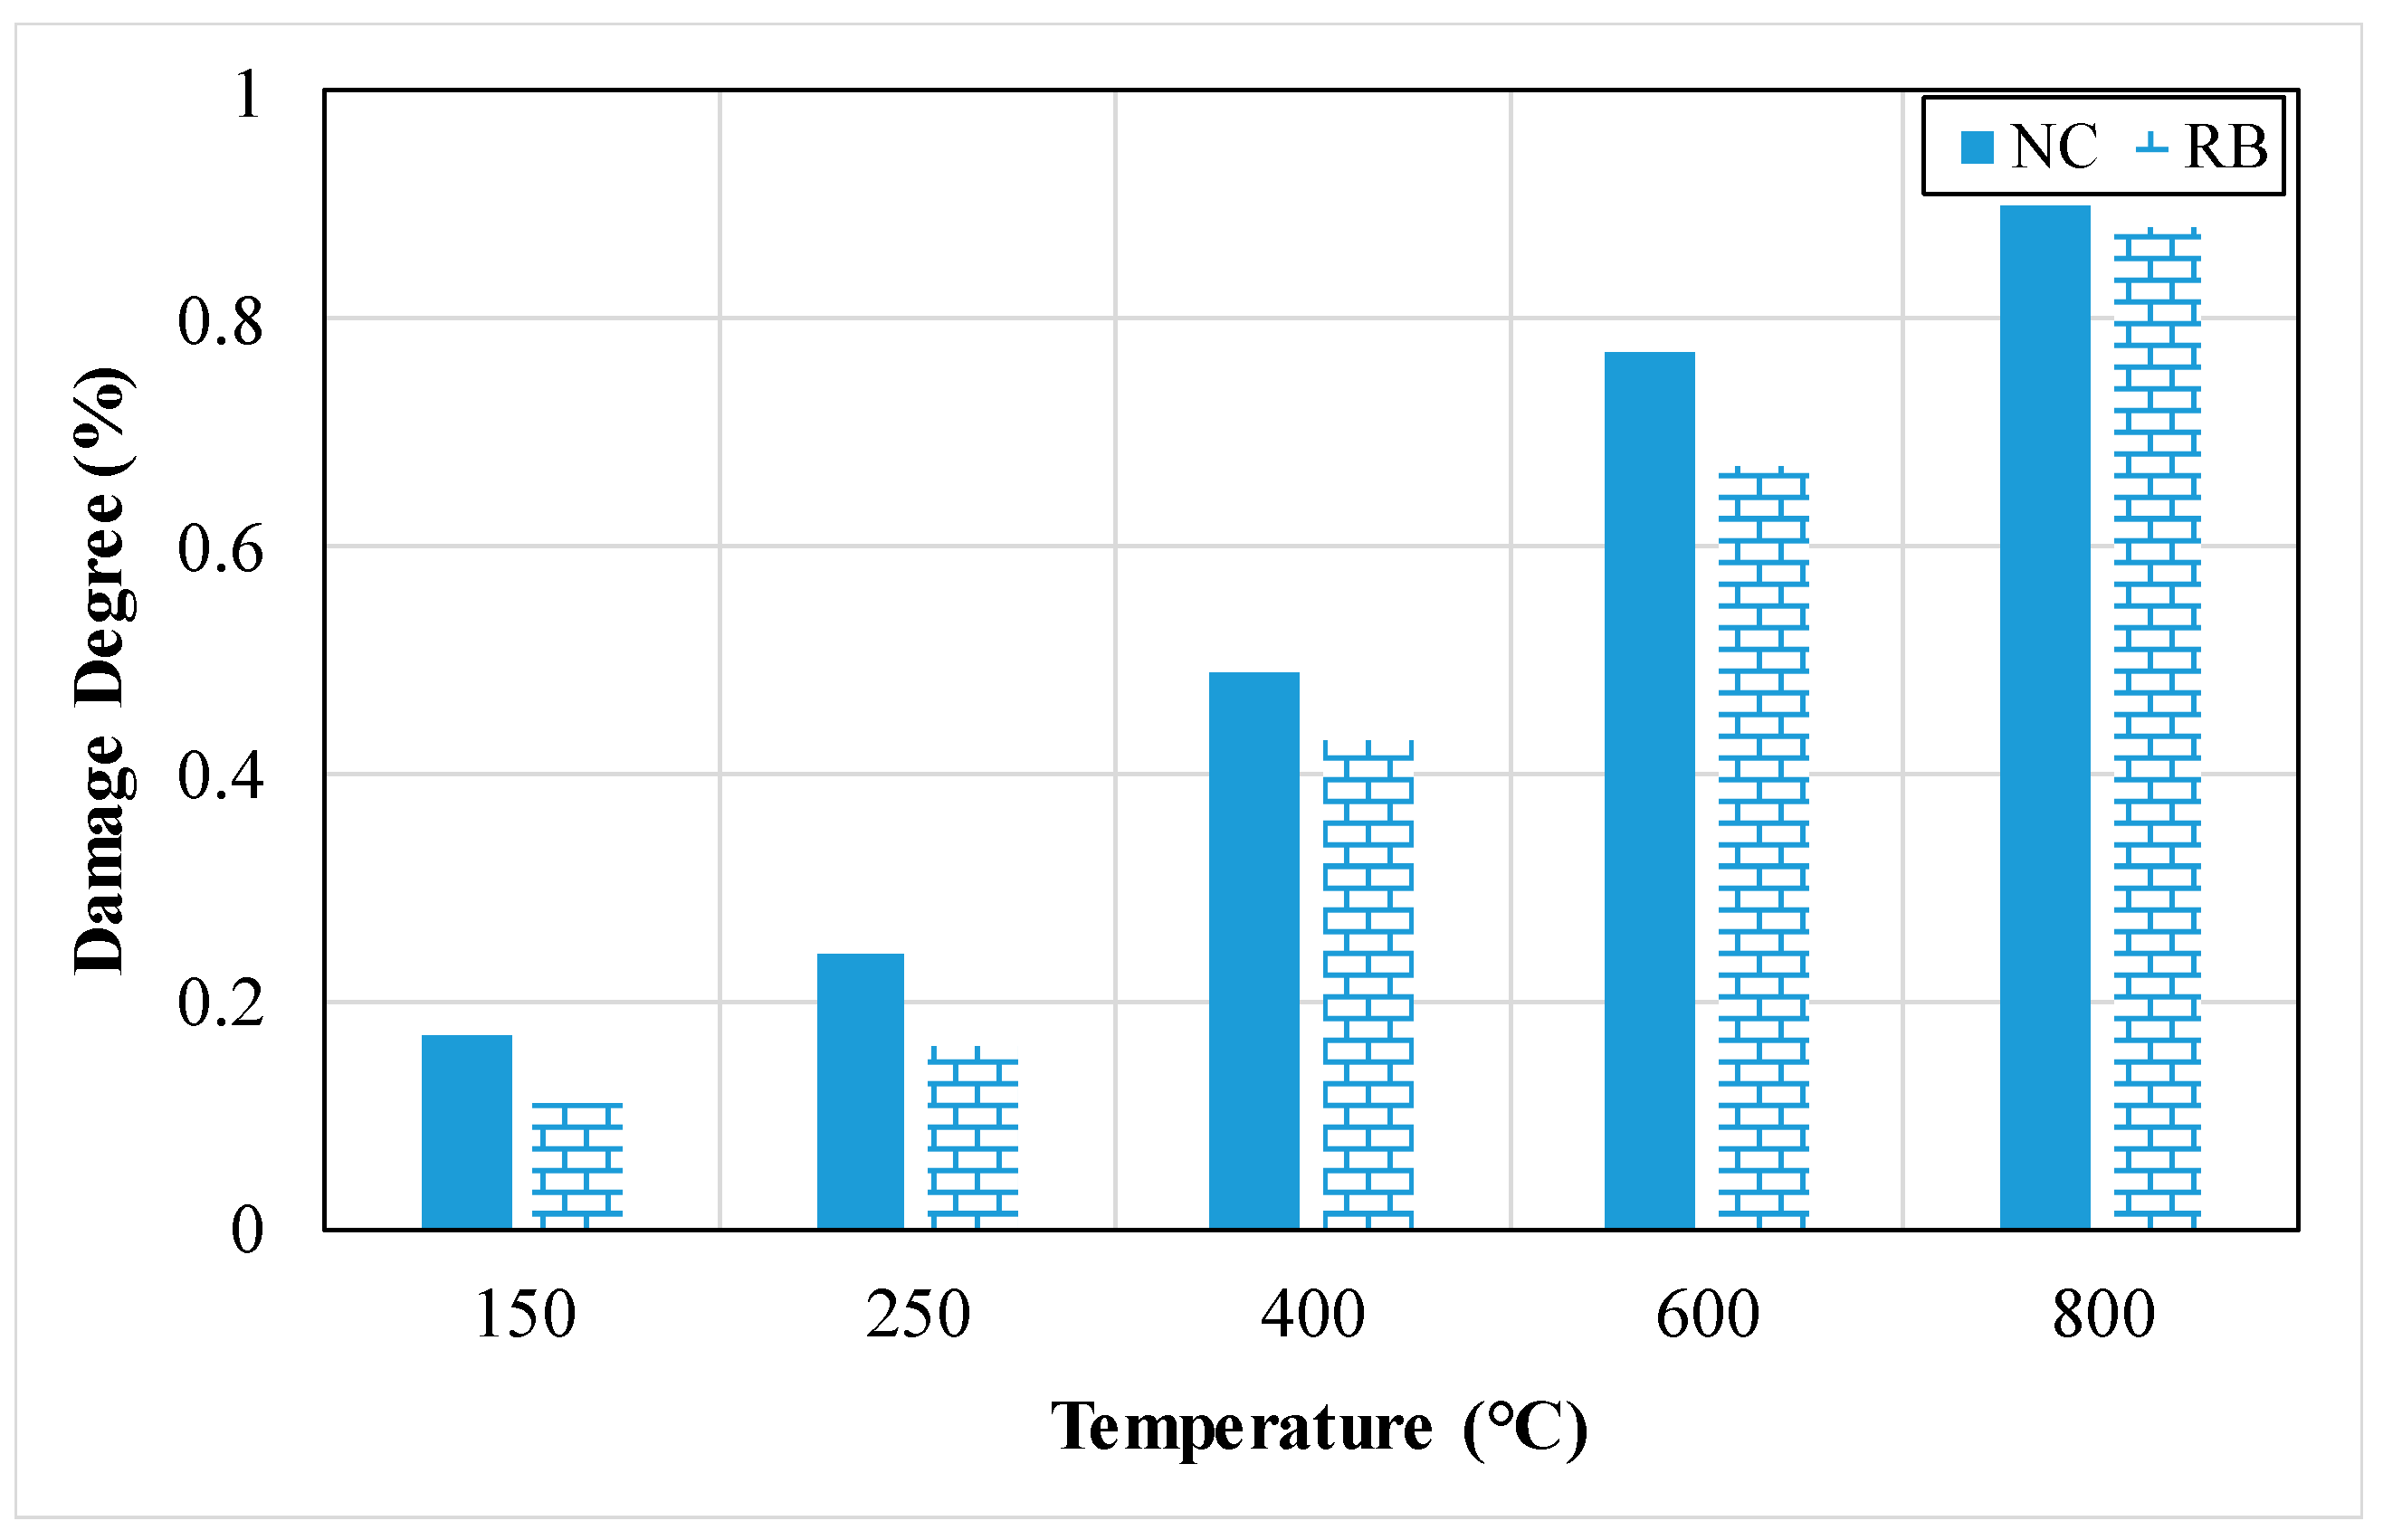
3.2.9. Damage Level
3.2.10. Thermal Conductivity
4. Discussion and Recommendations
- (a)
- Preparing refractory concrete requires skilled labors.
- (b)
- Cost of unit weight of refractory concrete is higher than that of ordinary concrete. Therefore, producing refractory concrete with lower cost can be challenging.
- (a)
- Using bio-ash materials with high alumina contents as calcium aluminate cement replacement.
- (b)
- Finding new types of aggregates that have a chemical composition suitable for elevated temperatures.
- (c)
- Using waste and demolished buildings in refractory concrete mix.
- (d)
- Replacing cement and aggregates by refractory cement and refractory aggregate and studying the effect of this use on the several properties of concrete.
- (e)
- Investigating using different binder systems such as colloidal silica and geopolymers, that can offer better thermal performance and lower environmental impact compared to traditional Portland cement.
- (f)
- Exploring the addition of nano-sized additives such as nano-silica and nano-alumina to enhance the mechanical strength, thermal conductivity, and durability of refractory concrete.
- (g)
- Looking for suitable chemical admixtures to enhance the workability, setting time, and performance of refractory concrete in high-temperature environments.
- (h)
- Exploring the feasibility of using advanced surface coatings that can be applied to refractory concrete to improve its resistance to chemical attack, abrasion, and thermal degradation.
- (i)
- Performing comprehensive lifecycle assessments to evaluate the environmental impact of refractory concrete throughout its entire lifecycle.
5. Conclusions
- Refractory concrete is capable of withstanding elevated temperatures due to the specific materials incorporated in it. These materials are known as refractory cement and refractory aggregate and are also known as high bearing temperature aggregate. These materials have specific compositions and properties that allow them to overcome high temperatures.
- The slump of refractory concrete containing refractory cement is noticeably higher than that of ordinary concrete. However, refractory concrete containing refractory aggregate yielded lower slump than that of ordinary concrete. The more the content of refractory aggregate, the lower the slump.
- The compressive and flexural strength and thermal conductivity of refractory concrete with refractory cement is lower than that of ordinary concrete. As the exposed temperature of concrete increases, the rate of reduction is relatively lower in refractory concrete compared to that of ordinary concrete.
Author Contributions
Funding
Data Availability Statement
Acknowledgments
Conflicts of Interest
References
- Monteiro, P.J.; Miller, S.A.; Horvath, A. Towards sustainable concrete. Nat. Mater. 2017, 16, 698–699. [Google Scholar] [CrossRef] [PubMed]
- Uratani, J.M.; Griffiths, S. A forward looking perspective on the cement and concrete industry: Implications of growth and development in the Global South. Energy Res. Soc. Sci. 2023, 97, 102972. [Google Scholar] [CrossRef]
- Sinha, S.; Ghosh, S.; Samanta, A.K. Influence of waste refractory brick on the destructive and non-destructive properties of sustainable eco-friendly concrete. Mater. Today Proc. 2023; in press. [Google Scholar] [CrossRef]
- Seyam, A.M.; Nemes, R. Age influence on compressive strength for concrete made with different types of aggregates after exposed to high temperatures. Mater. Today Proc. 2023; in press. [Google Scholar] [CrossRef]
- Madej, D.; Silarski, M.; Parzych, S. Design, structure, microstructure and gamma radiation shielding properties of refractory concrete materials containing Ba-and Sr-doped cements. Mater. Chem. Phys. 2021, 260, 124095. [Google Scholar] [CrossRef]
- Martinovic, S.; Vlahovic, M.; Boljanac, T.; Dojcinovic, M.; Volkov-Husovic, T. Cavitation resistance of refractory concrete: Influence of sintering temperature. J. Eur. Ceram. Soc. 2013, 33, 7–14. [Google Scholar] [CrossRef]
- Ouedraogo, E.; Roosefid, M.; Prompt, N.; Deteuf, C. Refractory concretes uniaxial compression behaviour under high temperature testing conditions. J. Eur. Ceram. Soc. 2011, 31, 2763–2774. [Google Scholar] [CrossRef]
- Pundienė, I.; Korjakins, A.; Pranckevičienė, J.; Kligys, M. Effect of silicon carbide aggregate, prepared by different methods, on the properties of refractory concrete with cenospheres. Ceram. Int. 2018, 44, 15944–15953. [Google Scholar] [CrossRef]
- Terzić, A.M.; Pavlović, L.M. Application of results of nondestructive testing methods in the investigation of microstructure of refractory concretes. J. Mater. Civ. Eng. 2010, 22, 853–857. [Google Scholar] [CrossRef]
- Bayoumi, I.M.; Ewais, E.M.; El-Amir, A.A. Rheology of refractory concrete: An article review. Boletín Soc. Española Cerámica Vidr. 2022, 61, 453–469. [Google Scholar] [CrossRef]
- Ouedraogo, E.; Prompt, N. High-temperature mechanical characterisation of an alumina refractory concrete for Blast Furnace main trough: PART II. Mater. Behav. J. Eur. Ceram. Soc. 2008, 28, 2867–2875. [Google Scholar] [CrossRef]
- Mijatović, N.; Vasić, M.; Terzić, A.; Radomirović, M.; Miličić, L. An augmented approach for the determination of the particle size effect on energy dispersive X-ray fluorescence analysis outcomes for alumina-based refractory materials. Spectrochim. Acta Part B At. Spectrosc. 2023, 209, 106796. [Google Scholar] [CrossRef]
- Lourenço, R.R.; Angélica, R.S.; Rodrigues, J.D. Preparation of refractory calcium aluminate cement using the sonochemical process. Mater. Res. 2013, 16, 731–739. [Google Scholar] [CrossRef]
- Scrivener, K. Calcium aluminate cements. Adv. Concr. Technol. 2003, 4, 713–782. [Google Scholar] [CrossRef]
- Montgomery, R. Heat-resisting and refractory concretes. Adv. Concr. Technol. 2003, 3, 1–13. [Google Scholar] [CrossRef]
- Ideker, J.H.; Scrivener, K.L.; Fryda, H.; Touzo, B. Calcium aluminate cements. Lea’s Chem. Cem. Concr. 2019, 5, 537–584. [Google Scholar] [CrossRef]
- De Bilbao, E.; Poirier, J.; Dombrowski, M. Corrosion of high alumina refractories by Al2O3-CaO slag: Thermodynamic and kinetic approaches. Metall. Res. Technol. 2015, 112, 607. [Google Scholar] [CrossRef]
- Shirani, K.; Reisi, M.; Savadkoohi, M.S. Eco-friendly high-strength refractory concrete containing calcium alumina cement by reusing granite waste as aggregate. Int. J. Concr. Struct. Mater. 2021, 15, 48. [Google Scholar] [CrossRef]
- Roig-Flores, M.; Lucio-Martin, T.; Alonso, M.C.; Guerreiro, L. Evolution of thermo-mechanical properties of concrete with calcium aluminate cement and special aggregates for energy storage. Cem. Concr. Res. 2021, 141, 106323. [Google Scholar] [CrossRef]
- Adams, M.P.; Ideker, J.H. Influence of aggregate type on conversion and strength in calcium aluminate cement concrete. Cem. Concr. Res. 2017, 100, 284–296. [Google Scholar] [CrossRef]
- Koksal, F.; Coşar, K.; Dener, M.; Benli, A.; Gencel, O. Insulating and fire-resistance performance of calcium aluminate cement based lightweight mortars. Constr. Build. Mater. 2023, 362, 129759. [Google Scholar] [CrossRef]
- Gulec, A. Investigation of the effect of different curing conditions on the mechanical performance of calcium aluminate cement concrete at elevated temperatures. Constr. Build. Mater. 2023, 409, 133920. [Google Scholar] [CrossRef]
- Nematzadeh, M.; Dashti, J.; Ganjavi, B. Optimizing compressive behavior of concrete containing fine recycled refractory brick aggregate together with calcium aluminate cement and polyvinyl alcohol fibers exposed to acidic environment. Constr. Build. Mater. 2018, 164, 837–849. [Google Scholar] [CrossRef]
- Terzić, A.; Stojanović, J.; Andrić, L.; Miličić, L.; Radojević, Z. Performances of vermiculite and perlite based thermal insulation lightweight concretes. Sci. Sinter. 2020, 52, 149–162. [Google Scholar] [CrossRef]
- Baradaran-Nasiri, A.; Nematzadeh, M. The effect of elevated temperatures on the mechanical properties of concrete with fine recycled refractory brick aggregate and aluminate cement. Constr. Build. Mater. 2017, 147, 865–875. [Google Scholar] [CrossRef]
- Koksal, F.; Nazlı, T.; Benli, A.; Gencel, O.; Kaplan, G. The effects of cement type and expanded vermiculite powder on the thermo-mechanical characteristics and durability of lightweight mortars at high temperature and RSM modelling. Case Stud. Constr. Mater. 2021, 15, e00709. [Google Scholar] [CrossRef]
- Khaliq, W.; Khan, H.A. High temperature material properties of calcium aluminate cement concrete. Constr. Build. Mater. 2015, 94, 475–487. [Google Scholar] [CrossRef]
- Bareiro, W.G.; de Andrade Silva, F.; Sotelino, E.D. Thermo-mechanical behavior of stainless steel fiber reinforced refractory concrete: Experimental and numerical analysis. Constr. Build. Mater. 2020, 240, 117881. [Google Scholar] [CrossRef]
- Bareiro, W.G.; de Andrade Silva, F.; Sotelino, E.D.; Gomes, O.D. The influence of alumina content on the chemical and mechanical behavior of refractory concretes fired at different temperatures. Constr. Build. Mater. 2018, 187, 1214–1223. [Google Scholar] [CrossRef]
- Trujillo, J.J.; Castro, J.A.; Innocentini, M.D.; Vernilli, F. Combined transient 3D simulation and experimental methods to assess a slow heat-up curve used to dry a refractory concrete. Int. J. Therm. Sci. 2023, 185, 108063. [Google Scholar] [CrossRef]
- Jovanović, M.; Mujkanović, A.; Bušatlić, N. The effects of the distribution coefficient on the properties of the refractory castables from the chamotte waste and clay “RAPAJLO”. In Proceedings of the 12th Scientific/Research Symposium with International Participation “Metallic and Nonmetallic Materials”, New York, NY, USA, 19–20 April 2018. [Google Scholar]
- Sevinç, A.H.; Durgun, M.Y. Elevated temperature performance of cementitious mortars containing pumice, barite, and basalt powder. J. Build. Eng. 2023, 78, 107552. [Google Scholar] [CrossRef]
- Khalil, N.M. Refractory concrete based on barium aluminate–barium zirconate cements for steel-making industries. Ceram. Int. 2005, 31, 937–943. [Google Scholar] [CrossRef]
- Saridemir, M.; Severcan, M.H.; Ciflikli, M.; Celikten, S.; Ozcan, F.; Atis, C.D. The influence of elevated temperature on strength and microstructure of high strength concrete containing ground pumice and metakaolin. Constr. Build. Mater. 2016, 124, 244–257. [Google Scholar] [CrossRef]
- Martinović, S.; Vlahović, M.; Boljanac, T.; Majstorović, J.; Volkov-Husović, T. Influence of sintering temperature on thermal shock behavior of low cement high alumina refractory concrete. Compos. Part B Eng. 2014, 60, 400–412. [Google Scholar] [CrossRef]
- Auvray, J.M.; Gault, C.; Huger, M. Evolution of elastic properties and microstructural changes versus temperature in bonding phases of alumina and alumina–magnesia refractory castables. J. Eur. Ceram. Soc. 2007, 27, 3489–3496. [Google Scholar] [CrossRef]
- Liu, J.; Zhuge, Y.; Ma, X.; Liu, M.; Liu, Y.; Wu, X.; Xu, H. Physical and mechanical properties of expanded vermiculite (EV) embedded foam concrete subjected to elevated temperatures. Case Stud. Constr. Mater. 2022, 16, e01038. [Google Scholar] [CrossRef]
- Koksal, F.; Gencel, O.; Brostow, W.; Lobland, H.H. Effect of high temperature on mechanical and physical properties of lightweight cement based refractory including expanded vermiculite. Mater. Res. Innov. 2012, 16, 7–13. [Google Scholar] [CrossRef]
- Tandiroglu, A. Temperature-dependent thermal conductivity of high strength lightweight raw perlite aggregate concrete. Int. J. Thermophys. 2010, 31, 1195–1211. [Google Scholar] [CrossRef]
- Pizoń, J.; Konečný, P.; Mynarz, M.; Bílek, V. Properties of Fine Graded Perlite-Based Lightweight Cement Mortars Subjected to Elevated Temperatures. Buildings 2023, 13, 2969. [Google Scholar] [CrossRef]
- Koçyiğit, F. Investigation of thermal and strength properties of a novel composite developed for insulation as building material. Int. J. Thermophys. 2020, 41, 41. [Google Scholar] [CrossRef]
- Taoukil, D.; lhassane Lahlaouti, M.; Djedjig, R. Effect of the use of diatomite as partial replacement of sand on thermal and mechanical properties of mortars. J. Build. Eng. 2021, 42, 103038. [Google Scholar] [CrossRef]
- Sarıdemir, M.; Yıldırım, A. Effect of elevated temperatures on properties of high strength mortars containing ground calcined diatomite with limestone sand. J. Build. Eng. 2022, 56, 104748. [Google Scholar] [CrossRef]
- Rodrigues, A.V.; Bragança, S.R. An evaluation of the increased expansion of clay aggregates fired at 1300 °C to maximize lightness for non-structural concrete. Boletín Soc. Española Cerámica Vidr. 2023, 62, 56–65. [Google Scholar] [CrossRef]
- Bicer, A. The effect of fly ash and pine tree resin on thermo-mechanical properties of concretes with expanded clay aggregates. Case Stud. Constr. Mater. 2021, 15, e00624. [Google Scholar] [CrossRef]
- Li, M.; Li, Y.; Ouyang, D.; Chen, R.; Li, S. The impact of alumina bubble particle size on the microstructure and physical properties of mullite castables. Ceram. Int. 2019, 45, 1928–1939. [Google Scholar] [CrossRef]
- Bideci, Ö.S. The effect of high temperature on lightweight concretes produced with colemanite coated pumice aggregates. Constr. Build. Mater. 2016, 113, 631–640. [Google Scholar] [CrossRef]
- Aydın, S. Development of a high-temperature-resistant mortar by using slag and pumice. Fire Saf. J. 2008, 43, 610–617. [Google Scholar] [CrossRef]
- Tufail, M.; Shahzada, K.; Gencturk, B.; Wei, J. Effect of elevated temperature on mechanical properties of limestone, quartzite and granite concrete. Int. J. Concr. Struct. Mater. 2017, 11, 17–28. [Google Scholar] [CrossRef]
- Ghonaim, S.A.; Ghazal, H.B.; Abadir, M.F. Effect of type of aggregate on the properties of refractory concrete. J. Am. Sci. 2010, 6, 1025–1027. [Google Scholar]
- Tran, M.T.; Vu, X.H.; Ferrier, E. Mesoscale experimental investigation of thermomechanical behaviour of the carbon textile reinforced refractory concrete under simultaneous mechanical loading and elevated temperature. Constr. Build. Mater. 2019, 217, 156–171. [Google Scholar] [CrossRef]
- Ulusu, İ.; Kurnuç Seyhan, A. Effect of Expanded Perlite Aggregate Plaster on the Behavior of High-Temperature Reinforced Concrete Structures. Buildings 2023, 13, 384. [Google Scholar] [CrossRef]
- Kanagaraj, B.; Anand, N.; Praveen, B.; Kandasami, S.; Lubloy, E.; Naser, M.Z. Physical characteristics and mechanical properties of a sustainable lightweight geopolymer based self-compacting concrete with expanded clay aggregates. Dev. Built Environ. 2023, 13, 100115. [Google Scholar] [CrossRef]
- Hu, S.G.; Wu, J.; Yang, W.; He, Y.J.; Wang, F.Z.; Ding, Q.J. Preparation and properties of geopolymer-lightweight aggregate refractory concrete. J. Cent. South Univ. Technol. 2009, 16, 914–918. [Google Scholar] [CrossRef]
- Masood, A.; Shariq, M.; Alam, M.M.; Ahmad, T.; Beg, A. Effect of elevated temperature on the residual properties of quartzite, granite and basalt aggregate concrete. J. Inst. Eng. (India) Ser. A 2018, 99, 485–494. [Google Scholar] [CrossRef]
- Topçu, İ.B.; Işıkdağ, B. Effect of expanded perlite aggregate on the properties of lightweight concrete. J. Mater. Process. Technol. 2008, 204, 34–38. [Google Scholar] [CrossRef]
- Benjeddou, O.; Ravindran, G.; Abdelzaher, M.A. Thermal and acoustic features of lightweight concrete based on marble wastes and expanded perlite aggregate. Buildings 2023, 13, 992. [Google Scholar] [CrossRef]
- Gökçe, M.V.; Koç, İ. Use of diatomite in the production of lightweight building elements with cement as binder. Sci. Res. Essays 2012, 7, 774–781. [Google Scholar]
- Horoshenkov, K.V.; Hughes, D.C.; Cwirzen, A. The sound speed and attenuation in loose and consolidated granular formulations of high alumina cements. Appl. Acoust. 2003, 64, 197–212. [Google Scholar] [CrossRef]
- Li, M.; Li, Y.; Ouyang, D.; Wang, X.; Li, S.; Chen, R. Effects of alumina bubble addition on the properties of mullite castables. J. Alloys Compd. 2018, 735, 327–337. [Google Scholar] [CrossRef]
- Al-Farttoosi, H.K.; Abdulrazzaq, O.A.; Hussain, H.K. Mechanical properties of light weight aggregate. In IOP Conference Series Materials Science and Engineering; IOP Publishing: Bristol, UK, 2021; Volume 1090, p. 012106. [Google Scholar] [CrossRef]
- Ullah, M.; Mir, J.; Husain, S.S.; Shahid, M.L.; Ahmad, A. Concrete forensic analysis using deep learning-based coarse aggregate segmentation. Autom. Constr. 2024, 162, 105372. [Google Scholar] [CrossRef]
- Kamani, M.; Ajalloeian, R. The effect of rock crusher and rock type on the aggregate shape. Constr. Build. Mater. 2020, 230, 117016. [Google Scholar] [CrossRef]
- Karasin, A.; Hadzima-Nyarko, M.; Işık, E.; Doğruyol, M.; Karasin, I.B.; Czarnecki, S. The effect of basalt aggregates and mineral admixtures on the mechanical properties of concrete exposed to sulphate attacks. Materials 2022, 15, 1581. [Google Scholar] [CrossRef] [PubMed]
- Torgal, F.P.; Castro-Gomes, J.P. Influence of physical and geometrical properties of granite and limestone aggregates on the durability of a C20/25 strength class concrete. Constr. Build. Mater. 2006, 20, 1079–1088. [Google Scholar] [CrossRef]
- Khan, M.; Lao, J.; Ahmad, M.R.; Kai, M.F.; Dai, J.G. The role of calcium aluminate cement in developing an efficient ultra-high performance concrete resistant to explosive spalling under high temperatures. Constr. Build. Mater. 2023, 384, 131469. [Google Scholar] [CrossRef]
- Kudžma, A.; Antonovič, V.; Stonys, R.; Škamat, J. The investigation of properties of insulating refractory concrete with portland cement binder. In IOP Conference Series: Materials Science and Engineering; IOP Publishing: Bristol, UK, 2015; Volume 96, p. 012015. [Google Scholar] [CrossRef]
- Khattab, M.; Hachemi, S.; Al Ajlouni, M.F. Evaluating the physical and mechanical properties of concrete prepared with recycled refractory brick aggregates after elevated temperatures’ exposure. Constr. Build. Mater. 2021, 311, 125351. [Google Scholar] [CrossRef]

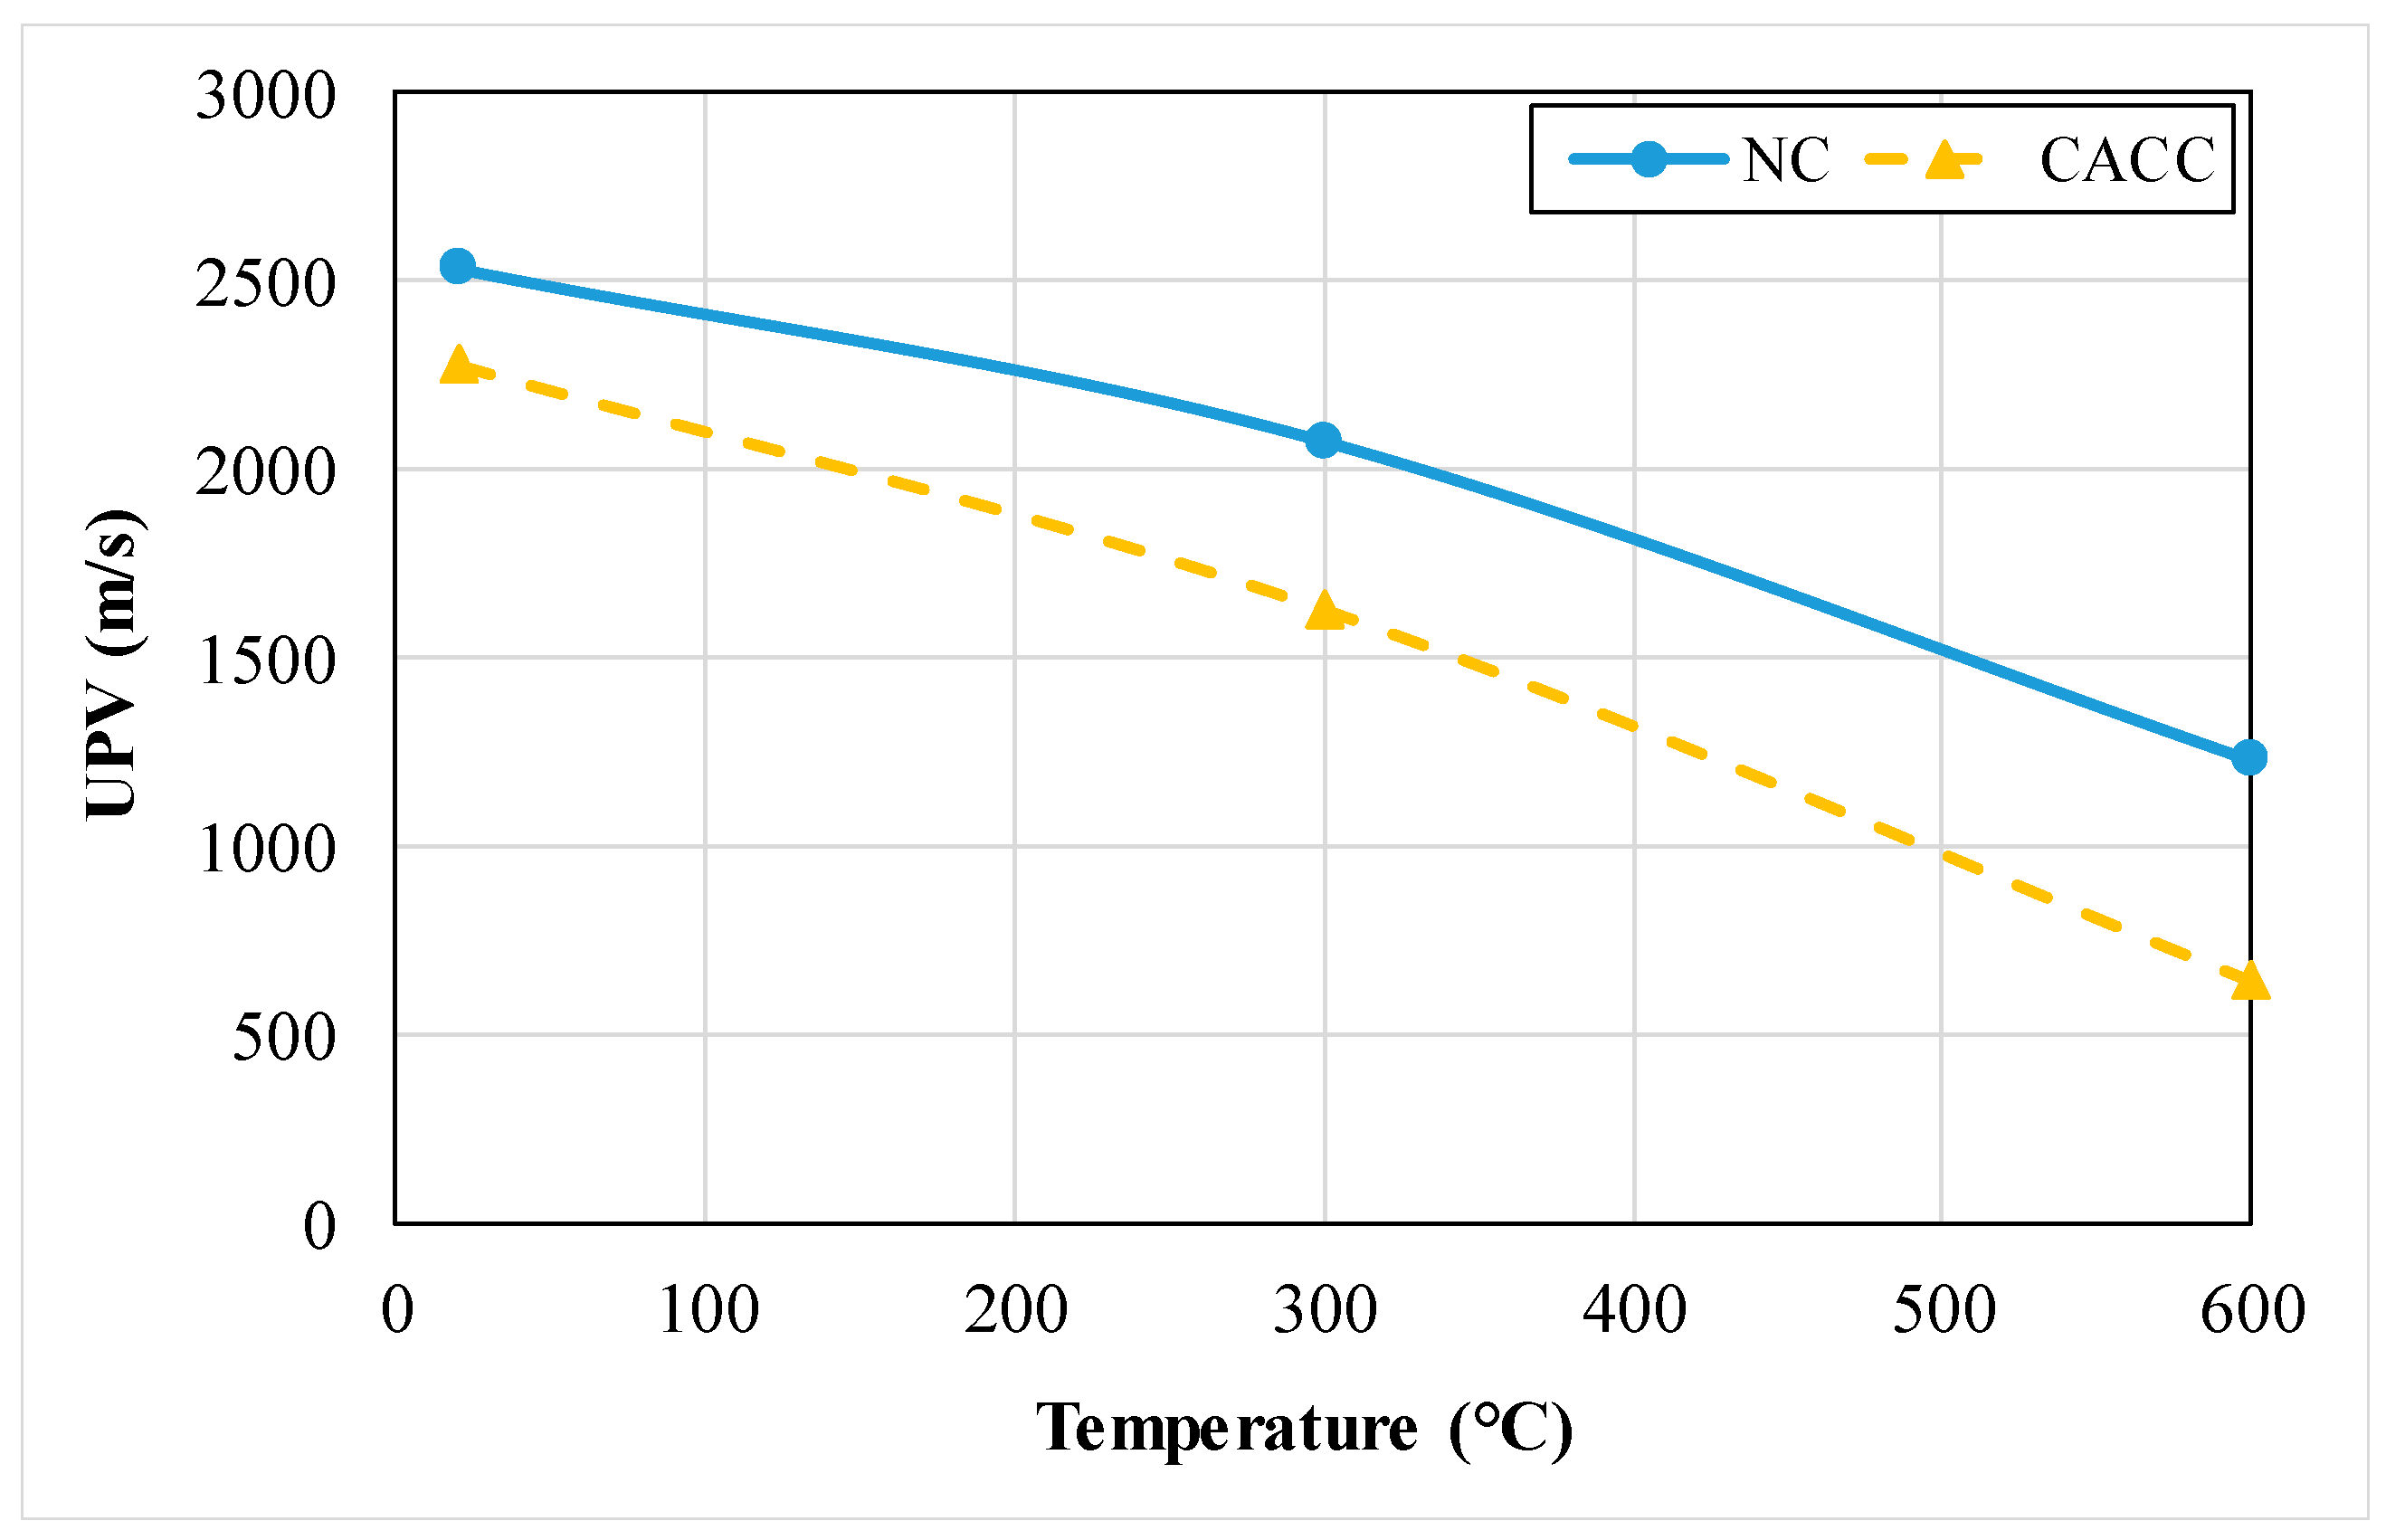
| Properties | Density (kg/m3) | Compressive Strength (MPa) | Flexural Strength (MPa) | Split Tensile Strength (MPa) | MOE (GPa) | UPV (m/s) | Variation of Weight (%) | Water Absorption (%) | Porosity (%) | Thermal Conductivity (W/mK) |
|---|---|---|---|---|---|---|---|---|---|---|
| References | [21] | [26] | [21] | [27] | [25] | [26] | [25] | [21] | [26] | [21] |
| w/c | 1.05 | 0.5 | 1.05 | 0.5 | 0.38 | 0.5 | 0.38 | 1.05 | 0.5 | 1.05 |
| NC | 605.100 | 24.000 | 0.930 | 1.050 | 4.000 | 1226.000 | 9.800 | 107.200 | 25.350 | 0.122 |
| CACC | 866.800 | 16.400 | 1.150 | 1.430 | 1.900 | 644.000 | 10.100 | 71.800 | 28.110 | 0.167 |
| Mix ID | Compressive Strength (MPa) | |||
|---|---|---|---|---|
| Immersion in Sulfuric Acid Solution (Days) | 0 | 7 | 21 | 63 |
| NC | 68 | 66.2 | 61.3 | 57.4 |
| CACC | 66.7 | 62.6 | 54.2 | 52.1 |
| Mix ID | Compressive Strength (MPa) | ||||
|---|---|---|---|---|---|
| Temperature (°C) | RT | 250 | 500 | 750 | 1000 |
| NC | 123.8 | 137.5 | Spalling | Spalling | Spalling |
| CACC | 122.1 | 153.8 | 99.5 | 71.6 | 31.6 |
| Mix ID | Flexural Strength (MPa) | ||
|---|---|---|---|
| 23 °C | 300 °C | 600 °C | |
| NC | 5.98 | 5.21 | 4.89 |
| CACC-S | 4.05 | 4.27 | 2.14 |
| CACC-H | 5.53 | 2.93 | 1.50 |
| Mix ID | Normalized Splitting Tensile Strength (MPa) | |||
|---|---|---|---|---|
| Temperature (°C) | 25 | 250 | 500 | 750 |
| NC | 1.00 | 0.91 | 0.77 | 0.33 |
| GP 5% | 1.00 | 0.89 | 0.77 | 0.33 |
| GP 10% | 1.00 | 0.91 | 0.76 | 0.34 |
| GP 15% | 1.00 | 0.92 | 0.77 | 0.33 |
| GP 20% | 1.00 | 0.90 | 0.75 | 0.29 |
| Mix ID | MOE (MPa) | ||
|---|---|---|---|
| 23 °C | 300 °C | 600 °C | |
| NC | 30,117 | 24,142 | 9399 |
| CACC-S | 30,412 | 11,532 | 4630 |
| CACC-H | 26,149 | 11,482 | 3387 |
| Mix ID | UPV (km/s) | |||
|---|---|---|---|---|
| Immersion in Sulfuric Acid Solution (Days) | 0 | 7 | 21 | 63 |
| NC | 4.422 | 4.376 | 4.271 | 4.187 |
| CACC | 4.383 | 4.281 | 4.145 | 4.118 |
| Mix ID | Weight (g) | |||
| Immersion in Sulfuric Acid Solution (Days) | 0 | 7 | 21 | 63 |
| NC | 2281.3 | 2289.7 | 2278 | 2256.3 |
| CACC | 2258.3 | 2278.0 | 2263.3 | 2226.3 |
| Mix ID | NC | CACC |
|---|---|---|
| Porosity (%) | 11.93 | 11.35 |
| Mix ID | RB-0 | RB-25 | RB-50 | RB-75 | RB-100 |
|---|---|---|---|---|---|
| Slump (mm) | 85 | 70 | 65 | 60 | 55 |
| Mix ID | NC | NC-P | NC-V |
|---|---|---|---|
| Slump (mm) | 194 | 160 | 143 |
Disclaimer/Publisher’s Note: The statements, opinions and data contained in all publications are solely those of the individual author(s) and contributor(s) and not of MDPI and/or the editor(s). MDPI and/or the editor(s) disclaim responsibility for any injury to people or property resulting from any ideas, methods, instructions or products referred to in the content. |
© 2024 by the authors. Licensee MDPI, Basel, Switzerland. This article is an open access article distributed under the terms and conditions of the Creative Commons Attribution (CC BY) license (https://creativecommons.org/licenses/by/4.0/).
Share and Cite
ElKhatib, L.W.; Khatib, J.; Assaad, J.J.; Elkordi, A.; Ghanem, H. Refractory Concrete Properties—A Review. Infrastructures 2024, 9, 137. https://doi.org/10.3390/infrastructures9080137
ElKhatib LW, Khatib J, Assaad JJ, Elkordi A, Ghanem H. Refractory Concrete Properties—A Review. Infrastructures. 2024; 9(8):137. https://doi.org/10.3390/infrastructures9080137
Chicago/Turabian StyleElKhatib, Lelian W., Jamal Khatib, Joseph J. Assaad, Adel Elkordi, and Hassan Ghanem. 2024. "Refractory Concrete Properties—A Review" Infrastructures 9, no. 8: 137. https://doi.org/10.3390/infrastructures9080137