Abstract
Estimating lung volume capacity is crucial in clinical medicine, especially in disease diagnostics. However, the existing estimation methods are complex and expensive, which require experts to handle and consequently are more error-prone and time-consuming. Thus, developing an automatic measurement system without a human operator that is less prone to human error and, thus, more accurate has always been a prerequisite. The limitation of radiation dose and various medical conditions in technologies like computed tomography was also the primary concern in the past. Although qualitative prediction of lung volume may be a trivial task, designing clinically relevant and automated methods that effectively incorporate imaging data is a challenging problem. This paper proposes a novel multi-tasking-based automatic lung volume estimation method using deep learning that jointly learns segmentation and regression of volume estimation. The two networks, namely, segmentation and regression networks, are sequentially operated with some shared layers. The segmentation network segments the X-ray images, whose output is regressed by the regression network to determine the final lung volume. Besides, the dataset used in the proposed method is collected from three different secondary sources. The experimental results show that the proposed multi-tasking approach performs better than the individual networks. Further analysis of the multi-tasking approach with two different networks, namely, UNet and HRNet, shows that the network with HRNet performs better than the network with UNet with less volume estimation mean square error of 0.0010.
1. Introduction
Anatomical lung volume information is valuable in various medical conditions, including chronic obstructive pulmonary disease (COPD), lung volume reduction surgery, and lung transplantation. This measurement is used to evaluate lung conditions that include alterations in lung volume [1], e.g., emphysema or chronic allergic asthma can increase lung size, whereas cystic fibrosis or scleroderma can decrease lung size. In these medical conditions, lung volume and time are appropriate indicators of disease activity or development [2].
Typical methods of lung volume estimation include plethysmography [3], helium dilution [4], spirometry [5], computed tomography (CT) [6], and chest radiography (CXR). The plethysmography technique determines the contained gas volume, whereas the helium dilution is based on the equilibration of gas in the lung with a known volume of gas containing helium. In the spirometry method, the patient is asked to inhale and exhale air into the spirometer for a certain time with some effort. These methods cannot be performed with people having recent abdominal or thoracic surgery, viral infection, vomiting, acute illness, or unstable cardiovascular status [7]. CT can have practical limits and challenges due to medical conditions, radiation dose, and economic limits. Meanwhile, CXR is a simple, inexpensive, and more accessible imaging technique than CT. Most of the approaches using CXR are based on measuring the cross-sectional area of the left, right, and lateral lungs of CXR.
Some of the manual approaches to estimating lung volume using CXR include (i) multiplication of the lungs’ area on posteroanterior (PA) chest radiographs by the posteroanterior diameter of the chest, (ii) measuring the chest area by planimeter and multiplying it with the anteroposterior diameter of the thorax [8], (iii) dividing posteroanterior and lateral radiographs into slices and summing the volume of each slices [9], and (iv) using the regression equation derived from planimeter measurement. Note that the manual approaches for estimating volume from CXR require experts, which may only be available in some areas. Moreover, manual assessment is operator-dependent; hence, the result could have high variability and be potentially inconsistent.
Automatic methods for estimating lung volume from CXR are less dependent on operators, hence more consistent and more feasible. For approximating lung volume using automatic methods, the CXR must be first segmented, i.e., detecting lung region. Here, automatic lung field segmentation can be (i) rule-based; (ii) pixel-based; (iii) deformable-based; and (iv) registration-based methods [10]. The rule-based methods use predefined anatomical rules to segment lung radiography, which has less success owing to the heterogeneity of lung field shapes. Similarly, the pixel-based segmentation labels each pixel as either lung or non-lung, and the deformable approaches use both image shape and image appearance for the segmentation. The registration-based approaches use a segmented lung database to match and enhance lung fields on a given image. Deep convolution neural networks are recently widely used and are effective methods for object detection and image segmentation. After recent progress in the graphic processing unit and impressive results in the ’ImageNet Large Scale Visual Recognition Competition’ in 2012 [11], deep convolutional neural networks (DCNNs) have increased much attention.
This research explores deep convolution neural networks in two directions: semantic segmentation to segment lung CXR and directly regressing the lung volume employing CXR. We claim the following contributions in this paper.
- A new multi-tasking-based automatic lung volume estimation method using deep learning is proposed to learn segmentation and regression of volume estimation jointly.
- The two networks, namely, segmentation and regression networks, are sequentially operated with some shared layers wherein the segmentation network segments the X-ray images, whose output is regressed by the regression network to approximate the final lung volume.
- The proposed lung volume estimation approach is a low-cost and automated solution wherein X-ray images are utilized as input data.
2. Literature Review
Historically, there have been numerous efforts to measure lung volume from chest radiographs. Hurtado and Fray [8] in 1933 used chest radiographs to measure lung volume capacity. Here, the lung volume was estimated by multiplying the anteroposterior diameter of the thorax and the chest area, estimated with a planimeter. Barnhard et al. [12] described the ellipse method for the lung volume capacity. Their study revealed that each lung is elliptical, excluding the section of the heart. The long dimension is anteroposterior, and the short dimension is transverse. They divided chest radiographs into an infinitely large number of thin elliptical cross-sections, and volume was calculated using integration. Cobb et al. [13] used a posteroanterior radiograph to measure the area of lung fields. They determined total lung volume capacity by volumetric measurement of routine posteroanterior and lateral chest radiographs. The regression equation was derived by correlating the volume to total lung capacity determined by spirometry and open circuit method. Spence et al. [9] aligned the posteroanterior and lateral radiographs using the arch of the aorta as a common reference point. Then the computer program divides the resulting shape into 200 slices. The sum of the volume of each slice was used to calculate the total lung volume capacity. The volume of the heart, great vessels, subdiaphragmatic region, and spine were subtracted to determine the volume of the lung. Harris et al. [14] described a more straightforward planimetric method for total lung capacity. The resulting equation was: 8.5 × S − 1200, where S is the total surface area of the left lung, right lung, and lateral lung of CXR.
Chul Hwan Park et al. [15] generated the chest radiographs, i.e., posterior-anterior (P-A) and lateral views from the axial CT images using the thick multiplanar technique. An electronic caliper was used to measure the lung area of the virtual chest radiograph. The right lung area of the virtual chest posterior-anterior view (P), left lung area of the virtual chest P-A view(Q), and lateral lung area on the virtual chest lateral view(R) were measured. The total sum was calculated, i.e., S = P + Q + R. They used the total area to find the equation by linear regression analysis that predicts the lung volume, and the equation was simple (9.6 × S − 1367).
All the above methods estimate the volume from CXR manually. To automate the volume estimation, CXR must be segmented first. Refs. [16,17] presented segmentation methods for CXR using deep learning. The method in [16] exploits a semantic pixel-wise segmentation approach called SegNet, which consists of an encoder network, and a corresponding decoder network followed by a pixel-wise classification layer.
The deep convolutional neural network (CNN) framework for the segmentation of lung fields is used in [10], where it is compared with the results of the state-of-the-art registration-based method.
In [18], a segmentation method based on VGG-16 and dilated convolution is put forward. The convolutional layers of VGG-16 were changed to dilated convolutions, which yielded a better result.
The lung segmentation and bone shadow techniques using deep learning to identify lesions and nodules in lung cancer patients are analyzed in [17].
Ref. [19] used HRNet for feature extraction with the UNet for segmentation. Ref. [20] uses U-Net architecture for lung nodule segmentation for lung cancer detection. In [21], different deep learning models were used for segmenting COVID-19 lung tissues, out of which HRNet achieved high accuracy and dice score. The aforementioned previous methods [10,16,17,18,19,20,21] are used to segment the X-ray chest images using Deep learning, primarily focused on segmenting the image instead of finding lung volume to diagnose the disease.
Moreover, some deep learning techniques are used for calculating lung volume capacity. Ecem Sogancioglu et al. [22] proposed an automated method for estimating total lung volume using CXR and deep learning. They used posteroanterior and lateral view CXR with five different deep learning architectures: DenseNet121, ResNet34, ResNet50, VGG-Net19, and six layers CNN. The lowest error was achieved on six layers of CNN with MAPE of 2.2%. Nozomi Ishihara et al. [23] used CNN, where frontal views ( right or left-half) and lateral views were separately added to input layers. The correlation between estimated volume and ground truth volume was 0.79 and 0.60 for the left and right lungs, respectively.
Kim H et al. [24] also used deep learning methods for calculating total lung capacity for predicting survival in idiopathic pulmonary fibrosis. The mean absolute difference and within-subject SD between ground truth and estimated lung volume were 0.69 L and 0.73 L, respectively. Here, the abovementioned deep learning methods are single-task networks; however, the multi-tasking-based method can have better results for estimating volume.
Thus, in this study, automatic volume estimation is developed using DCNN. For this, a novel multi-tasking-based method is implemented to learn segmentation and regression of volume estimation jointly.
3. Research Methodology
In order to evaluate methods that estimate lung volume from CXRs, we require validation data, i.e., Ground Truth(GT) CXR images where actual volume is known. Since the GT volume is unavailable in the CXR dataset, and the lung volume capacity is measured from CT images, the proposed method utilizes CT images to learn the volume. The overall block diagram of the proposed research work is shown in Figure 1. The process starts with the data collection, followed by other steps. At first, CT images are converted to X-ray images (DRR), implementing open-source code ITK [25,26]. Then, the X-ray images are trained on standard deep network architecture for image segmentation. Standard U-Net architecture and HRNet architecture are used for segmentation. Since the CT image dataset contains the ground truth volume data, segmented DRR images from the previous step are then used to train the deep learning regression network to find the lung volume. The learning of the segmentation network formed from training X-ray images and DRR images is transferred to test X-ray images. In addition, a novel multi-tasking-based approach is implemented to learn segmentation and regression of volume estimation jointly. For the evaluation of the proposed method, a dice score is used to calculate the segmentation performance, and mean square error is used for volume estimation.
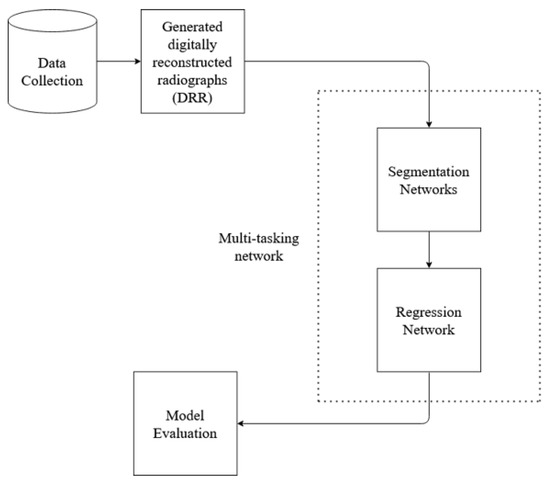
Figure 1.
Basic block diagram of the proposed method work flow.
3.1. Data Preparation
Data utilized in this research were collected from various secondary sources. The chest radiograph was collected from the Department of Health and Human Services, Montgomery County, MD, USA [27]. This dataset consists of 138 frontal chest X-ray images, out of which 80 are normal cases and 58 are cases with manifestations of TB. Moreover, the images are in Portable Network Graphics (PNG) format as 12-bit gray-level images, and the size of each X-ray image is either 4020 × 4892 or 4892 × 4020 pixels. The sample image, along with its GT segmented image from the chest radiograph dataset, is shown in Figure 2 and Figure 3. Further, 23 CT images with segmented CT from VESSELS12 Challenge and 42 CT images with segmented CT from LUNA16 Challenge were downloaded to form a CT dataset. Then X-ray images (DRR) were simulated from CT images. This simulation generated both posterior-anterior (P-A) chest radiographs and lateral chest radiographs. Besides, the lung volume ground truth is available in this dataset, which includes lung statistics such as lung area and lung volumes. Table 1 shows the data used in our study with data source and type. In this research, the number of training samples is small, so data augmentation is performed by rotating, flipping, and scaling the intensity.
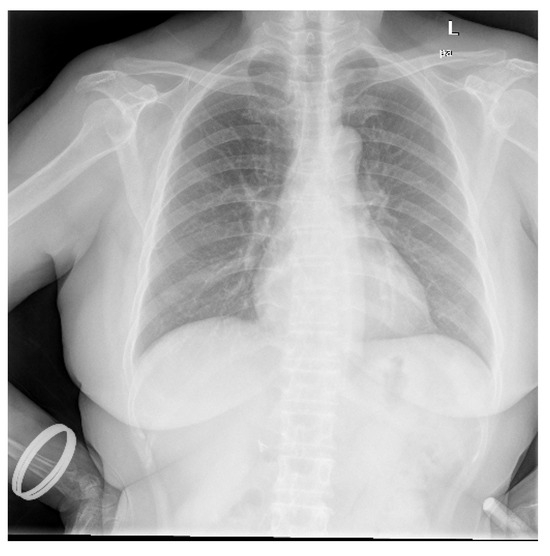
Figure 2.
Sample chest radiograph from CXR dataset.
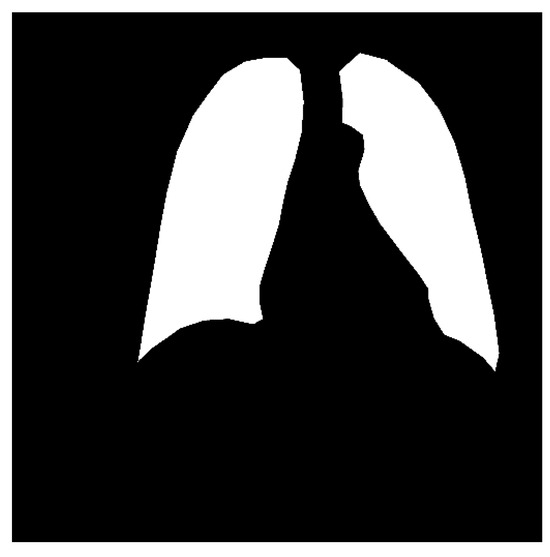
Figure 3.
Ground truth segmented image of CXR.

Table 1.
Numbers of data used in proposed research with data source and type.
3.1.1. Generation of DRR
The DRR is the 2D image generated from the 3D CT image. Ray casting method was implemented using open source code from ITK [25,26] for DRR generation. In this study, real CXR does not have GT volume. However, DRR enables us to produce 2D CXR-like images from CT scans [28,29,30] with a known volume.
DRR generation methods are similar to the physical process of producing CXR. In this process, a CT image is used as a patient model. In a CT image, each pixel is assigned to the number called CT number or Hounsfield unit, which is mean attenuation of the tissue [31,32]. The CT number ranges from the most attenuating value of +3071 to the least attenuating value of −1024 on the Hounsfield scale. Thus, in the ray-casting method, each CT number is converted to its linear attenuation coefficient (LAC) so that outgoing photon intensity can be calculated from the knowledge of the incoming photon intensity. Here, the attenuation coefficient is calculated for the 50 keV spectrum. At the beginning of the process, the camera parameters are defined, i.e., rotation along different axes. Then, rays are traced through the patient model (CT) from a virtual X-ray source to a point on the virtual film for DRR generation. When the ray passes through each voxel, the linear attenuation coefficient is calculated for every eight corners of the voxel by using the relationship between Hounsfield unit and linear attenuation coefficient [33] as in (1) and (2). Then, trilinear interpolation around each corner is computed to get a smooth result.
where HU is the Hounsfield unit, is linear attenuation coefficient of voxel and is linear attenuation coefficient of water.
Thus, DRR is calculated by averaging the CT linear attenuation coefficient of the voxel along a ray from the virtual X-ray source to each pixel in the resultant image. DRR generation process is shown in Figure 4. However, in the segmented CT, the lung section’s CT number is 1, and 0 for the other section. Thus, averaging the intensity gives no effective result. For this, maximum intensity is considered along the ray. The Figure 5 and Figure 6 denote the PA and lateral view of the CT image respectively, and Figure 7 and Figure 8 denote corresponding segmented DRR.
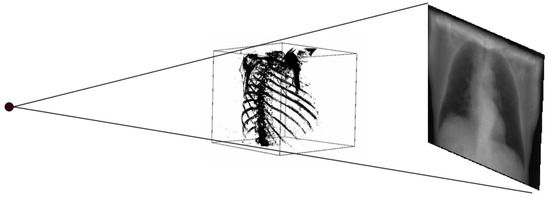
Figure 4.
DRR generation process.
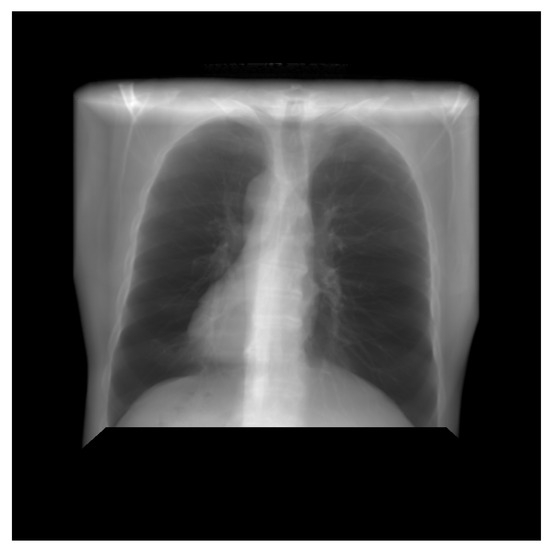
Figure 5.
PA view of the DRR image.
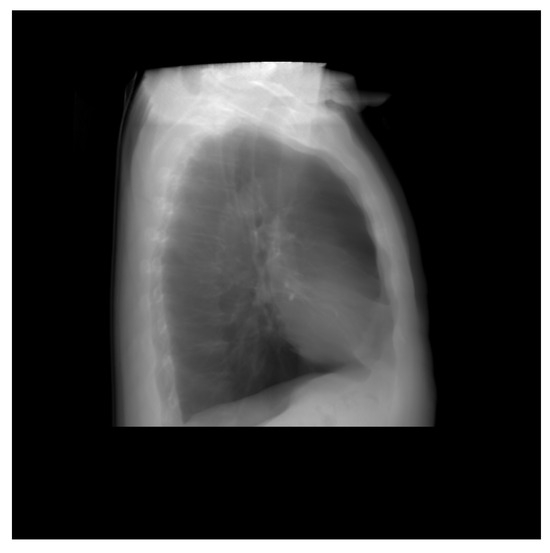
Figure 6.
Lateral view of the DRR image.
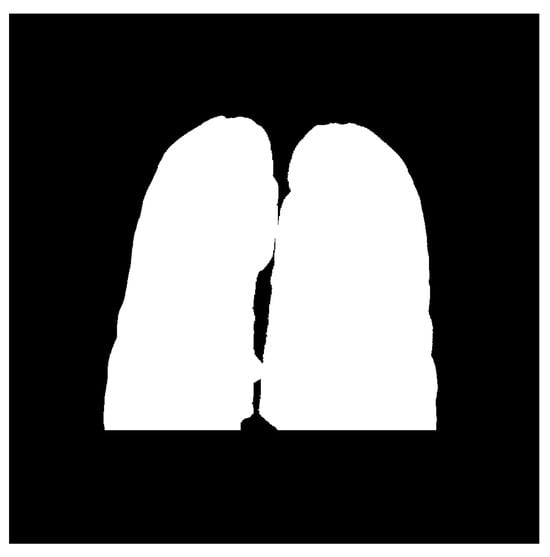
Figure 7.
Posteroanterior(PA) view of the segmented DRR image.
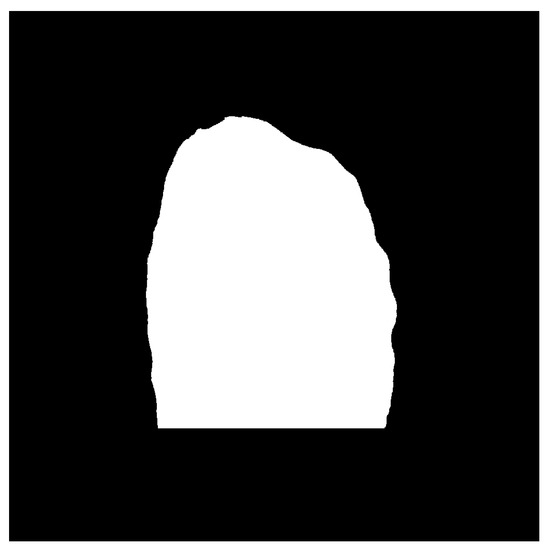
Figure 8.
Lateral view of the segmented DRR image.
3.1.2. Data Augmentation
Data augmentation is an important technique in deep learning, especially when the training sample is small. It increases the training sample as well as exposes the model to different varieties of data. Thus, we utilized the following techniques in our research for data augmentation:
- Rotation: The images were rotated by 90 degrees and 180 degrees.
- Flipping: Horizontal flipping was applied to the images.
- Intensity Scaling: Intensity range adjusted from 0 to 255.
3.2. Segmentation
The segmentation of an image predicts a class for each pixel of what it represents, and since it predicts every pixel in an image, it is commonly known as a dense prediction. Besides, the output from the segmentation process is a high-resolution image typically of the same size as the input image. Thus, the segmentation of chest radiographs helps to detect the boundaries of the lungs. This research uses the CNN with standard architecture: U-Net and HRNet for the segmentation.
3.2.1. U-Net Architecture
The U-Net architecture is an end-to-end fully convolutional neural network (FCN), which contains only convolutional layers (without any dense layers). Generally, CNN is used in classification, localizing areas, and distinguishing borders in images. Thus, the U-Net architecture designed with CNN can segment biomedical images [34]. The U-Net architecture, as shown in Figure 9, contains two paths: the contracting path, also known as an encoder, captures the context information in the image, and the expanding path, known as a decoder, enables precise localization. The encoder contains stacks of convolutional layers and max-pooling layers, and the decoder contains transposed convolutional layers. Here, two consecutive convolutional layers with ReLU activations are applied to each process, after which the max-pooling is done, which halves the size of the image. The process is replicated four times. Then two consecutive convolutional layers are applied without max pooling. Finally, the image will regain its original size in the expanding section. This section uses transposed convolutional layers, which enables precise localization. Furthermore, the skip connection is adopted between the convolutional and deconvolutional layers of the network. The connection passes the details of the hierarchical features from convolutional layers to the corresponding deconvolutional layers to be fused, making it more beneficial in generating the segmented image with better precise locations. Besides, the problem of convergence issues in the deeper network is prevented by this skip connection. As the skip connection allows the backpropagation directly to the bottom layer, the vanishing gradient problem in the deeper network is also resolved. The contracting path is composed of 4 blocks. Each block is composed of:
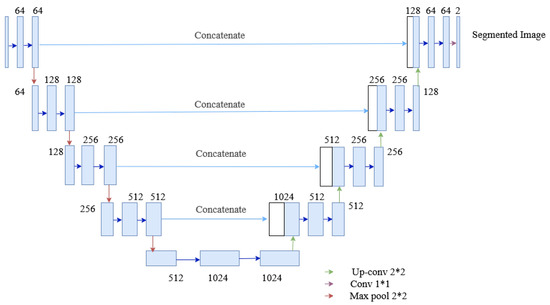
Figure 9.
The architecture of the U-Net used in the segmentation process of the proposed method.
- 3 × 3 Convolution Layer + activation function + batch normalization
- 3 × 3 Convolution Layer + activation function + batch normalization
- 2 × 2 Max Pooling
The expanding path is also composed of 4 blocks. Each of these blocks is composed of
- Transposed convolutional layers
- Concatenation with the corresponding cropped feature map from the contracting path
- 3 × 3 Convolution layer + activation function + batch normalization
- 3 × 3 Convolution layer + activation function + batch normalization
3.2.2. HRNet Architecture
High-to-low convolution streams are connected parallelly in the HRNet network. High-resolution representations are preserved throughout the whole process, and reliable high-resolution representations are generated by fusing the representations repeatedly from parallel multi-resolution streams [35,36]. It has four parallel convolution streams with resolutions 1/4, 1/8, 1/16, and 1/32. In the first stage, four residual units are formed by a bottleneck with a width of 64. Each unit is then followed by one convolution changing the width of feature maps to the number of channels (C). Furthermore, it consists of four residual units in each branch of the multi-resolution parallel convolution of the modularized block. Two convolutions for each unit’s resolution are utilized, followed by batch normalization and the ReLU activation function. The numbers of channels of the convolutions of the four resolutions are C, 2C, 4C, and 8C, respectively. The modularized block is divided into multi-resolution parallel convolutions and multi-resolution fusion. In parallel convolution, group convolution is performed. Input channels are divided into several streams of channels, and each stream is convoluted over different spatial resolutions. However, in multi-resolution fusion, multiple convolution streams are fused, i.e., each high to low-resolution stream gets the information from other streams. In each stream, the output after fusion is the summation of the outputs from convolutions over each stream. In addition, while fusing resolution, change should also be handled. The architecture of HRNet used for segmentation is shown in Figure 10.
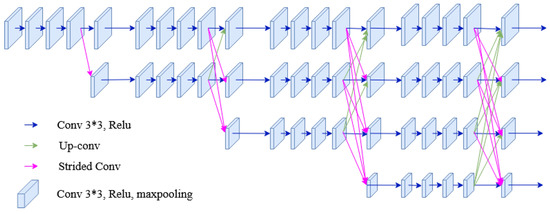
Figure 10.
The architecture of the HRNet used in the segmentation process of the proposed method.
3.3. Regression Network/Lung Volume Estimation
Estimation of the continuous value is obtained by employing regression techniques. Various computer vision applications have implemented regression to estimate the required output, such as facial landmark detection, head pose estimation, age estimation, human pose estimation, or image registration. With the explosive computational growth in resources in the early 2000s, deep learning (DL) has overwhelmingly outperformed the traditional machine learning-based methods [37]. Moreover, deep learning architecture consists of several convolutional layers, fully-connected layers, and a softmax layer with a loss function. This architecture, also known as a convolutional neural network (ConvNet), is typically used in classification problems. However, after replacing softmax layers with fully connected regression layers (with sigmoid or linear activations), this network can be used in regression problems. Thus, to estimate the lung volume in the proposed approach, the regression network is employed. The architecture of the proposed regression network is shown in Figure 11, where the segmented images are trained to give a final lung volume. The network consists of several convolutional layers with activation functions, pooling, and fully connected layers. The final layer of the fully connected layer has a single output dense layer that gives the required volume of the lung. The model is trained with DRR images with ground truth volume data. The mean squared error (MSE) was used between the predicted volume and the ground truth for the error calculation, optimizing the network. Thus, if the segmented output from the segmentation network is and the output from the k-th layer of the segmentation network is , which is given as an input to the regression network, then the output from the regression network is expressed as:
where f represents the function of the regression network.
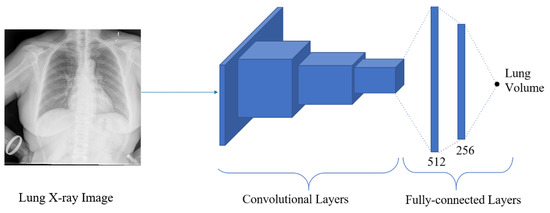
Figure 11.
The architecture of the regression network, where the segmented image is regressed to give the final volume of the lung.
3.4. Multi-Task Network
Multitask Learning is a method that improves learning for one task by using the knowledge from the training of other related tasks [38]. In multitask model, learning is performed in parallel utilizing a shared representation, and learning from one task helps other tasks’ performance. Due to layer sharing, the redundancy of calculating the same features is reduced for every task, which increases training speed and memory footprint [39]. This research uses two multitask models: (a) HRNet with convolution layers and fully connected layers and (b) U-Net with convolution layers and fully connected layers are used, and the performance is analyzed.
3.4.1. Multitask Network with HRNet
In this network, two tasks: segmentation and volume estimation are performed. Several convolutions and fully connected layers are added to HRNet architecture to extract lung volume information from lateral and posterior-anterior chest radiographs. The network is formed by connecting the convolution unit before the fusion unit of the low-resolution stream of the fourth stage of HRNet architecture to the convolution layers. The convolution layer consists of convolution, ReLu activation function, and max pooling. The output from max pooling is then flattened and fed to the fully connected layer. The final layer of the fully connected layer has a single output dense layer that gives the required volume of the lung. Two loss functions were used for error calculation: dice loss for image segmentation and MSE loss for volume calculation. The architecture of the multitasking network with HRNet used in this research is shown in Figure 12.
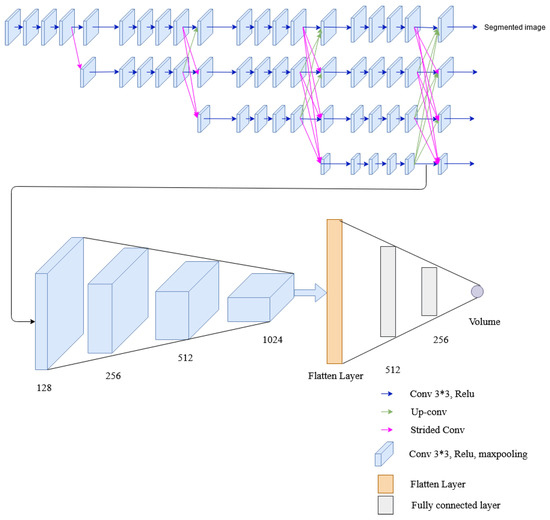
Figure 12.
The architecture of the multitask network containing HRNet, convolutional layers and fully connected layers.
3.4.2. Multitask Network with U-Net
This network employs four convolution layers and two fully connected layers to the U-Net architecture to extract lung volume information from lateral and posterior-anterior chest radiographs. Two tasks, i.e., segmentation and volume calculation, share the encoder and the same layers of the decoder of U-Net, and then the convolution layer is added for volume estimation. Besides, the rest of the decoder layer of U-Net architecture is also utilized for segmentation. The convolutional layer (of the regression network) comprises a convolution followed by a ReLU activation function and max pooling similar to the multitask network of HRNet. The resultant output from max pooling is flattened and passed to a fully connected layer, whose final layer provides the desired lung volume. To evaluate the segmented and predicted output, each network have their own loss functions, the dice loss for image segmentation and the mean squared error (MSE) loss for volume calculation. The architecture of the multitasking network with U-Net used in this research is shown in Figure 13.
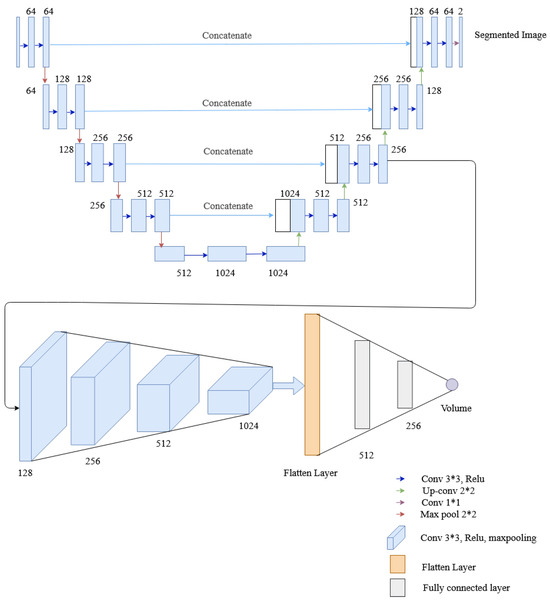
Figure 13.
The architecture of the multitask network containing U-Net, convolutional layers and fully connected layers.
3.5. Model Evaluation
The proposed method has two major tasks: segmentation and volume estimation, whose performances were evaluated separately. The segmentation’s performance was assessed based on the dice coefficient; however, the mean square was used as a performance metric for volume estimation.
3.5.1. Dice Coefficient
The Dice coefficient is the spatial overlap index used in validating image segmentation [40,41]. The spatial overlap is evaluated when a ground truth image is available. The dice score ranges from 0 to 1; 0 indicates no overlap between the segmented image and ground truth, and 1 indicates complete overlap. Moreover, it is calculated by multiplying the overlap area by two and dividing the result by the total number of pixels in both images [42] as given by (4).
where is predicted image, is ground truth image, TP is true positive, FP is false positive and FN is false negative. Dice coefficient is also equivalent to F1 score. F1 score is harmonic mean between precision and recall. i.e.,
3.5.2. Mean Square Error
Mean square error (MSE) is a regression loss function that is equal to the sum of all the squared differences between the target value (ground truth) and the predicted value [43].
where is ground truth value, is the predicted value.
4. Experimental Results and Discussion
This study employs two networks for segmentation, namely U-Net and HRNet, wherein the networks were trained using Adam-optimizer with a learning rate of 0.0001, 600 epochs, and a batch size of four. The segmentation result is shown in Table 2. Testing on two segmentation networks with real X-ray images and DRR images show that both networks performed well with high accuracy. Out of the two networks, HRNet performed better, with an accuracy of about 0.962 with DRR images and 0.9747 with real X-ray images. On the other hand, U-Net has an accuracy of 0.96 with real X-ray images and 0.9171 with DRR images. The graphical representation of training and validation dice score while training on HRNet is shown in Figure 14. As illustrated in the figure, the accuracy increases (or loss decreases) with each epoch up to a certain number and started saturating with higher dice metric and lower dice loss value, indicating the valid model’s performance. Similarly, the test output images from the HRNet network in Figure 15 and Figure 16 show that both segmented images are similar to respective ground truth images.
Table 2.
Segmentation testing dice and loss on different networks and data.
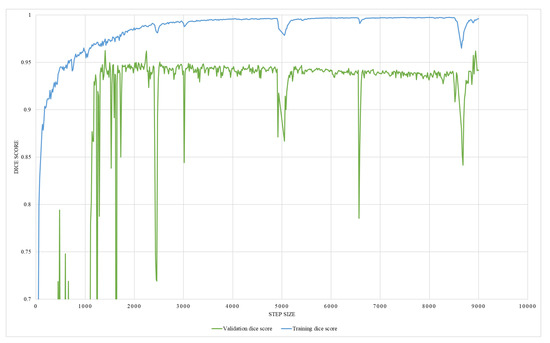
Figure 14.
An illustration of HRNet segmentation training and validation dice score.
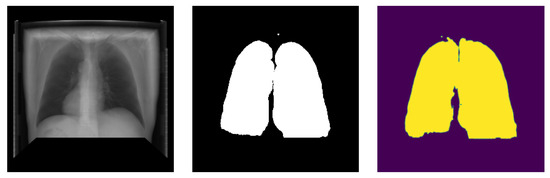
Figure 15.
Posteroanterior image segmentation generated from testing data.
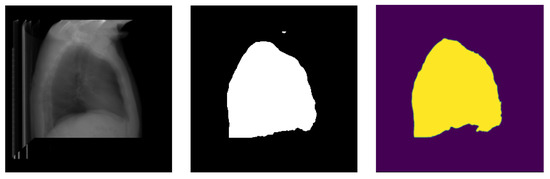
Figure 16.
Lateral image segmentation generated from testing data.
The regression network consists of several convolutional layers, followed by a fully-connected layer and a softmax layer with a loss function. Adam-optimizer with a learning rate of 0.0001, 300 epochs, and a batch size of four was used for the training, utilizing MSE as the loss function. Thus, 58 posteroanterior and lateral images were used as training data, and seven were used as testing data. The network’s performance was analyzed by training it with two different ground truths, one with the lung volume and the other with the ratio between lung volume and the total volume, while ensuring the effectiveness of the network. The graphical representation of training MSE and validation MSE, trained with the lung volume as ground truth, is illustrated in Figure 17, which shows that the resultant MSE by the regression network is 0.013. However, on the contrary, the network trained with the volume ratio as a ground truth shows better performance with a reduced MSE of 0.0016, which is shown in Figure 18. Thus, the latter approach is adopted to train the model.
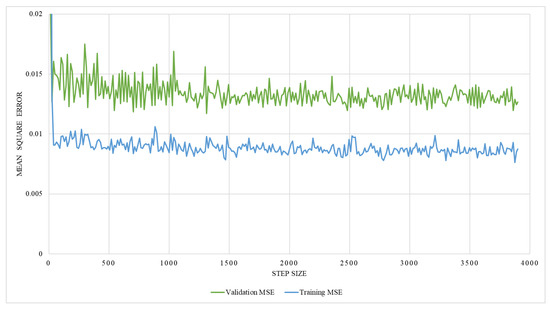
Figure 17.
An illustration of training and validation mean square error on network trained with the lung volume.
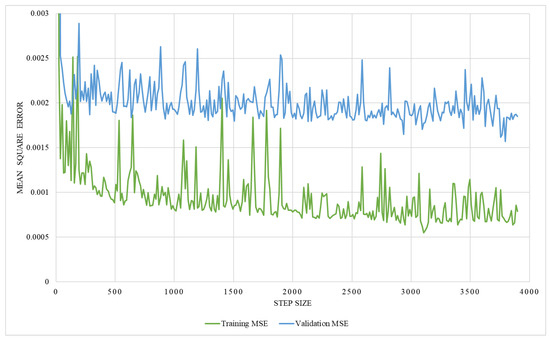
Figure 18.
An illustration of training and validation mean square error on network trained with the volume ratio.
Two multitasking networks: (a) U-Net with convolution layers and fully connected layers and (b) HRNet with convolution and fully connected layers, were trained for volume estimation. Both networks result in two outputs: segmented image and volume information. On both networks, 65 posterior-anterior and 65 lateral images were used. These data were divided into training and testing data on two ratios: 90:10 and 80:20. From each training dataset, 10 percent of data were used as validation. Posterior-anterior and lateral images are combined to get one image by adding their channels to feed it as an input to the network. Besides, an optimizer with a learning rate of 0.0001, 300 epochs, and a batch size of four was used for the training, utilizing MSE as the loss function for volume estimation and dice metric as accuracy for segmentation.
The result of the multitasking network is shown in Table 3. Multitasks network with U-Net and HRNet were trained with two different ground truths, one with the lung volume and the other with the ratio between lung volume and the total volume. The training was performed with two different training and testing data ratios, i.e., 90:10 and 80:20. The result in Table 3 shows that the multitask network has a better performance in terms of MSE than on individual networks ( regression). Out of two datasets with two different training and testing dataset ratios, the dataset having a ratio of 90:10 performed better than the dataset having a ratio of 80:20. Besides, the multitask network with HRNet performed better than that with the U-Net network. The graphical representation of validation mean square error for volume estimation while training on multitasking with HRNet and U-Net is shown in Figure 19. As illustrated in the figures, the error decreased with each epoch to a certain number and started saturating with a lower MSE value, indicating the valid model’s performance.
Table 3.
Multi-task segmentation accuracy (Dice metric) and volume loss (MSE) on different network, data ratios and ground truth.
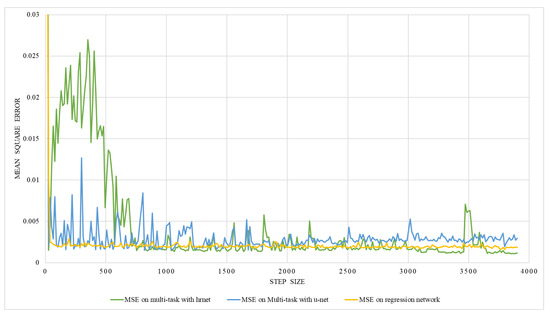
Figure 19.
An illustration of validation mean square error on multi-task network with hrnet and U-Net.
From Table 3, it can be learned that the multitasking model with HRNet performed better with the lowest mean square error on volume estimation. However, to further signify the model’s performance, the model’s validation and evaluation are required. Thus, a 10-fold cross-validation method was utilized to validate the multitasking network with the HRNet. The dataset was divided into ten training and testing datasets with a 90:10 ratio each. Then in the first model, the first set was used as a testing set and the remaining nine as a training dataset. Similarly, for the second model, the second set is used as a testing set, the remaining 9 (first and third to tenth) as a training dataset, and so on. The results from 10-fold cross-validation are shown in Table 4, which shows that the mean square error ranges from 0.0006 to 0.0014 and is comparable to each other. Also, the average value of the result is 0.00108 looks similar to the MSE obtained from multitasking with the HRNet network, as shown in Table 3. In addition, the standard deviation of 10-fold cross-validation results is 0.00027. Thus, the model’s generalization capability to each independent dataset, comprehended from the result, verifies that the model can accurately estimate the lung volume in real practice.
Table 4.
10-fold cross validation on multitask with HRNet.
Moreover, the proposed method is economically advantageous compared to traditional techniques like CT, spirometry, and plethysmography as this method utilizes commonly available X-rays for lung volume estimation. X-ray imaging is a widely available modality in medical settings. By using existing X-ray equipment, the need for expensive specialized techniques is eliminated. This significantly reduces the overall cost associated with lung volume estimation.
5. Conclusions
This study proposes a new method for estimating lung volume capacity using inexpensive, more accessible chest radiographs. In this research, posterior-anterior and lateral chest radiographs were segmented using a segmentation network, and output then fed into a regression network for volume estimation. U-Net architecture and HRNet architecture were used for segmentation, and regression networks with convolution and fully connected layers were used for volume estimation. Two multitasking networks were implemented, consisting of a segmentation network (both U-Net and HRNet) with convolution, flattened, and fully connected layers. The experimental results from implementing different networks show that a multitasking network with HRNet performs better with less volume estimation loss.
In this research work, due to the lack of ground truth volume data and segmented lateral view image (i.e., ground truth), the X-ray image was simulated from a CT image. Thus, it is worth testing the network performance on real X-ray images as training data to estimate lung volume and compare its performance with other automatic method (which use public datasets) for future work.
Author Contributions
Conceptualization, S.G. and S.S.; methodology, S.G.; software, S.G.; validation, S.G. and S.S.; formal analysis, S.G.; investigation, S.G. and S.S.; resources, S.G.; data curation, S.G.; writing—original draft preparation, S.G.; writing—review and editing, S.S.; visualization, S.G.; supervision, S.S.; project administration, S.S.; funding acquisition, S.S. All authors have read and agreed to the published version of the manuscript.
Funding
This research received no external funding.
Data Availability Statement
The data presented in this study are available on request to the corresponding author.
Conflicts of Interest
The authors declare no conflict of interest.
References
- De Jong, P.A.; Lindblad, A.; Rubin, L.; Hop, W.C.; de Jongste, J.C.; Brink, M.; Tiddens, H.A. Progression of lung disease on computed tomography and pulmonary function tests in children and adults with cystic fibrosis. Thorax 2006, 61, 80–85. [Google Scholar] [CrossRef] [PubMed]
- Jones, P.; Agusti, A. Outcomes and markers in the assessment of chronic obstructive pulmonary disease. Eur. Respir. J. 2006, 27, 822–832. [Google Scholar] [CrossRef] [PubMed]
- Pierce, R.; Brown, D.; Holmes, M.; Cumming, G.; Denison, D. Estimation of lung volumes from chest radiographs using shape information. Thorax 1979, 34, 726–734. [Google Scholar] [CrossRef] [PubMed]
- O’Donnell, C.R.; Bankier, A.A.; Stiebellehner, L.; Reilly, J.J.; Brown, R.; Loring, S.H. Comparison of plethysmographic and helium dilution lung volumes: Which is best for COPD? Chest 2010, 137, 1108–1115. [Google Scholar] [CrossRef]
- Graham, B.L.; Steenbruggen, I.; Miller, M.R.; Barjaktarevic, I.Z.; Cooper, B.G.; Hall, G.L.; Hallstrand, T.S.; Kaminsky, D.A.; McCarthy, K.; McCormack, M.C.; et al. Standardization of spirometry 2019 update. An official American thoracic society and European respiratory society technical statement. Am. J. Respir. Crit. Care Med. 2019, 200, e70–e88. [Google Scholar] [CrossRef] [PubMed]
- Wanger, J.; Clausen, J.; Coates, A.; Pedersen, O.; Brusasco, V.; Burgos, F.; Casaburi, R.; Crapo, R.; Enright, P.; Van Der Grinten, C.; et al. Standardisation of the measurement of lung volumes. Eur. Respir. J. 2005, 26, 511–522. [Google Scholar] [CrossRef] [PubMed]
- Clark, M.V. Asthma: A Clinician’s Guide; Jones & Bartlett Learning: Burlington, MA, USA, 2010. [Google Scholar]
- Hurtado, A.; Fray, W.W. Studies of total pulmonary capacity and its sub-divisions. II. Correlation with physical and radiological measurements. J. Clin. Investig. 1933, 12, 807–823. [Google Scholar] [CrossRef] [PubMed][Green Version]
- Spence, D.; Kelly, Y.; Ahmed, J.; Calverley, P.; Pearson, M. Critical evaluation of computerised X ray planimetry for the measurement of lung volumes. Thorax 1995, 50, 383–386. [Google Scholar] [CrossRef] [PubMed][Green Version]
- Arbabshirani, M.R.; Dallal, A.H.; Agarwal, C.; Patel, A.; Moore, G. Accurate segmentation of lung fields on chest radiographs using deep convolutional networks. In Proceedings of the Medical Imaging 2017: Image Processing, Orlando, FL, USA, 12–14 February 2017; Volume 10133, p. 1013305. [Google Scholar]
- Russakovsky, O.; Deng, J.; Su, H.; Krause, J.; Satheesh, S.; Ma, S.; Huang, Z.; Karpathy, A.; Khosla, A.; Bernstein, M.; et al. Imagenet large scale visual recognition challenge. Int. J. Comput. Vis. 2015, 115, 211–252. [Google Scholar] [CrossRef]
- Barnhard, H.J.; Pierce, J.A.; Joyce, J.W.; Bates, J.H. Roentgenographic determination of total lung capacity: A new method evaluated in health, emphysema and congestive heart failure. Am. J. Med. 1960, 28, 51–60. [Google Scholar] [CrossRef]
- Cobb, S.; Blodgett, D.J.; Olson, K.B.; Stranahan, A. Determination of total lung capacity in disease from routine chest roentgenograms. Am. J. Med. 1954, 16, 39–54. [Google Scholar] [CrossRef] [PubMed]
- Harris, T.R.; Pratt, P.C.; Kilburn, K.H. Total lung capacity measured by roentgenograms. Am. J. Med. 1971, 50, 756–763. [Google Scholar] [CrossRef] [PubMed]
- Park, C.H.; Haam, S.J.; Lee, S.; Han, K.H.; Kim, T.H. Prediction of anatomical lung volume using planimetric measurements on chest radiographs. Acta Radiol. 2015, 57, 1066–1071. [Google Scholar] [CrossRef] [PubMed]
- Kalinovsky, A.; Kovalev, V. Lung Image Segmentation Using Deep Learning Methods and Convolutional Neural Networks; Publishing Center of BSU: Minsk, Belarus, 2016. [Google Scholar]
- Geng, L.; Zhang, S.; Tong, J.; Xiao, Z. Lung segmentation method with dilated convolution based on VGG-16 network. Comput. Assist. Surg. 2019, 24, 27–33. [Google Scholar] [CrossRef] [PubMed]
- Gordienko, Y.; Gang, P.; Hui, J.; Zeng, W.; Kochura, Y.; Alienin, O.; Rokovyi, O.; Stirenko, S. Deep learning with lung segmentation and bone shadow exclusion techniques for chest X-ray analysis of lung cancer. In Proceedings of the International Conference on Computer Science, Engineering and Education Applications, Kiev, Ukraine, 18–20 January 2018; Springer: Cham, Switzerland, 2018; pp. 638–647. [Google Scholar]
- Ahmed, S.; Hossain, T.; Hoque, O.B.; Sarker, S.; Rahman, S.; Shah, F.M. Automated COVID-19 detection from chest X-ray images: A high-resolution network (hrnet) approach. SN Comput. Sci. 2021, 2, 294. [Google Scholar] [CrossRef] [PubMed]
- Kumar, S.N.; Bruntha, P.M.; Daniel, S.I.; Kirubakar, J.A.; Kiruba, R.E.; Sam, S.; Pandian, S.I.A. Lung nodule segmentation using unet. In Proceedings of the 2021 7th International Conference on Advanced Computing and Communication Systems (ICACCS), Coimbatore, India, 19–20 March 2021; Volume 1, pp. 420–424. [Google Scholar]
- Iyer, T.J.; Raj, A.N.J.; Ghildiyal, S.; Nersisson, R. Performance analysis of lightweight CNN models to segment infectious lung tissues of COVID-19 cases from tomographic images. PeerJ Comput. Sci. 2021, 7, e368. [Google Scholar] [CrossRef] [PubMed]
- Sogancioglu, E.; Murphy, K.; Th. Scholten, E.; Boulogne, L.H.; Prokop, M.; van Ginneken, B. Automated estimation of total lung volume using chest radiographs and deep learning. Med. Phys. 2022, 49, 4466–4477. [Google Scholar] [CrossRef] [PubMed]
- Ishihara, N.; Tanaka, R.; Segars, W.P.; Abadi, E.; Samei, E. Estimation of lung volume changes from frontal and lateral views of dynamic chest radiography using a convolutional neural network model: A computational phantom study. In Proceedings of the Medical Imaging 2021: Physics of Medical Imaging, Online, 15–19 February 2021; Volume 11595, pp. 888–893. [Google Scholar]
- Kim, H.; Jin, K.N.; Yoo, S.J.; Lee, C.H.; Lee, S.M.; Hong, H.; Witanto, J.N.; Yoon, S.H. Deep learning for estimating lung capacity on chest radiographs predicts survival in idiopathic pulmonary fibrosis. Radiology 2022, 306, e220292. [Google Scholar] [CrossRef]
- McCormick, M.M.; Liu, X.; Ibanez, L.; Jomier, J.; Marion, C. ITK: Enabling reproducible research and open science. Front. Neuroinform. 2014, 8, 13. [Google Scholar] [CrossRef]
- Yoo, T.S.; Ackerman, M.J.; Lorensen, W.E.; Schroeder, W.; Chalana, V.; Aylward, S.; Metaxas, D.; Whitaker, R. Engineering and algorithm design for an image processing API: A technical report on ITK-the insight toolkit. In Studies in Health Technology and Informatics; IOS Press: Amsterdam, The Netherlands, 2002; pp. 586–592. [Google Scholar]
- Jaeger, S.; Candemir, S.; Antani, S.; Wáng, Y.X.J.; Lu, P.X.; Thoma, G. Two public chest X-ray datasets for computer-aided screening of pulmonary diseases. Quant. Imaging Med. Surg. 2014, 4, 475. [Google Scholar]
- Moore, C.; Liney, G.; Beavis, A.; Saunderson, J. A method to produce and validate a digitally reconstructed radiograph-based computer simulation for optimisation of chest radiographs acquired with a computed radiography imaging system. Br. J. Radiol. 2011, 84, 890–902. [Google Scholar] [CrossRef] [PubMed]
- Killoran, J.H.; Baldini, E.H.; Beard, C.J.; Chin, L. A technique for optimization of digitally reconstructed radiographs of the chest in virtual simulation. Int. J. Radiat. Oncol. Biol. Phys. 2001, 49, 231–239. [Google Scholar] [CrossRef] [PubMed]
- Zhao, H.; Reader, A.J. Fast ray-tracing technique to calculate line integral paths in voxel arrays. In Proceedings of the 2003 IEEE Nuclear Science Symposium. Conference Record (IEEE Cat. No. 03CH37515), Portland, OR, USA, 19–25 October 2003; Volume 4, pp. 2808–2812. [Google Scholar]
- Mull, R.T. Mass estimates by computed tomography: Physical density from CT numbers. Am. J. Roentgenol. 1984, 143, 1101–1104. [Google Scholar] [CrossRef] [PubMed]
- Lamba, R.; McGahan, J.P.; Corwin, M.T.; Li, C.S.; Tran, T.; Seibert, J.A.; Boone, J.M. CT Hounsfield numbers of soft tissues on unenhanced abdominal CT scans: Variability between two different manufacturers’ MDCT scanners. Am. J. Roentgenol. 2014, 203, 1013–1020. [Google Scholar] [CrossRef] [PubMed]
- Kim, K.J.; Kim, D.H.; Lee, J.I.; Choi, B.K.; Han, I.H.; Nam, K.H. Hounsfield units on lumbar computed tomography for predicting regional bone mineral density. Open Med. 2019, 14, 545–551. [Google Scholar] [CrossRef] [PubMed]
- Ronneberger, O.; Fischer, P.; Brox, T. U-net: Convolutional networks for biomedical image segmentation. In Proceedings of the International Conference on Medical Image Computing and Computer-Assisted Intervention, Munich, Germany, 5–9 October 2015; Springer: Cham, Switzerland, 2015; pp. 234–241. [Google Scholar]
- Sun, K.; Xiao, B.; Liu, D.; Wang, J. Deep High-Resolution Representation Learning for Human Pose Estimation. In Proceedings of the CVPR, Long Beach, CA, USA, 15–20 June 2019. [Google Scholar]
- Wang, J.; Sun, K.; Cheng, T.; Jiang, B.; Deng, C.; Zhao, Y.; Liu, D.; Mu, Y.; Tan, M.; Wang, X.; et al. Deep high-resolution representation learning for visual recognition. IEEE Trans. Pattern Anal. Mach. Intell. 2020, 43, 3349–3364. [Google Scholar] [CrossRef] [PubMed]
- Ghimire, S.; Ghimire, S.; Subedi, S. A Study on Deep Learning Architecture and Their Applications. In Proceedings of the 2019 International Conference on Power Electronics, Control and Automation (ICPECA), New Delhi, India, 16–17 November 2019; pp. 1–6. [Google Scholar]
- Zhang, Y.; Yang, Q. A survey on multi-task learning. arXiv 2017, arXiv:1707.08114. [Google Scholar] [CrossRef]
- Vandenhende, S.; Georgoulis, S.; Proesmans, M.; Dai, D.; Van Gool, L. Revisiting Multi-Task Learning in the Deep Learning Era. arXiv 2020, arXiv:2004.13379. [Google Scholar]
- Taha, A.A.; Hanbury, A. Metrics for evaluating 3D medical image segmentation: Analysis, selection, and tool. BMC Med. Imaging 2015, 15, 29. [Google Scholar] [CrossRef]
- Zou, K.H.; Warfield, S.K.; Bharatha, A.; Tempany, C.M.; Kaus, M.R.; Haker, S.J.; Wells, W.M., III; Jolesz, F.A.; Kikinis, R. Statistical validation of image segmentation quality based on a spatial overlap index1: Scientific reports. Acad. Radiol. 2004, 11, 178–189. [Google Scholar] [CrossRef]
- Eelbode, T.; Bertels, J.; Berman, M.; Vandermeulen, D.; Maes, F.; Bisschops, R.; Blaschko, M.B. Optimization for medical image segmentation: Theory and practice when evaluating with Dice score or Jaccard index. IEEE Trans. Med. Imaging 2020, 39, 3679–3690. [Google Scholar] [CrossRef] [PubMed]
- Rougier, J. Ensemble averaging and mean squared error. J. Clim. 2016, 29, 8865–8870. [Google Scholar] [CrossRef]
Disclaimer/Publisher’s Note: The statements, opinions and data contained in all publications are solely those of the individual author(s) and contributor(s) and not of MDPI and/or the editor(s). MDPI and/or the editor(s) disclaim responsibility for any injury to people or property resulting from any ideas, methods, instructions or products referred to in the content. |
© 2024 by the authors. Licensee MDPI, Basel, Switzerland. This article is an open access article distributed under the terms and conditions of the Creative Commons Attribution (CC BY) license (https://creativecommons.org/licenses/by/4.0/).