
Capacity Allocation in Cancer Centers Considering Demand Uncertainty

1
Department of Industrial and Systems Engineering, Shiley-Marcos School of Engineering, University of San Diego, San Diego, CA 92110, USA
2
Department of Industrial, Manufacturing, and Systems Engineering, Texas Tech University, Lubbock, TX 79409, USA
*
Author to whom correspondence should be addressed.
Sci 2024, 6(2), 22; https://doi.org/10.3390/sci6020022
Submission received: 24 January 2024
/
Revised: 16 March 2024
/
Accepted: 28 March 2024
/
Published: 7 April 2024
Abstract
:This paper introduces a model to aid decision-makers in answering many of the important questions regarding how best to operate a cancer center. This study aims to allocate the available cancer center capacity to different cancer types to minimize the deviation in patient demand satisfied from desired supply targets across multiple cancer types. A stochastic chance-constrained model is proposed to consider uncertainties in new and returning patient demand. The proposed model determines the optimal specialization mix for oncologists based on the distribution of demand by cancer type, preventing potential mismatches. Additionally, it aims to balance workloads among oncologists and individual clinics and indirectly reduce support service costs by limiting their clinic days. Numerical results are presented using historical data collected from our collaborating cancer center to demonstrate the usefulness of the model. The results confirm that the ability to satisfy patient demand increases as oncologists become more flexible. In addition, the results show that even having a small number of highly flexible oncologists is sufficient to achieve strong patient demand satisfaction. Moreover, restricting the allowable workload difference among oncologists achieves an acceptable trade-off between workload balance and satisfying patient demand.
1. Introduction
Capacity planning is a vital aspect of offering the best clinical care possible to cancer patients. However, due to the increasing number of new cancer patients and their subsequent return visits, capacity planning has been a challenge for cancer centers and, therefore, a field of interest to many researchers [1]. Capacity planning problems are categorized into capacity design and capacity allocation. Capacity design problems focus on determining the optimal level of resources required to meet the target patient wait time. Resource allocation, on the other hand, attempts to allocate the limited available capacity to patient demand to optimize performance measurements such as oncologist utilization and patient wait time. This study addresses a resource allocation problem, where the objective is to allocate the existing capacity to patients with different cancer types such that the deviation in patient demand satisfied from the desired supply target is minimized.
In cancer clinics, patients with different cancer types and wait time tolerances request to see oncologists. Providing cancer patients with timely access is crucial for achieving better outcomes and reducing patient anxiety [2,3]. Once new patients complete their first visits, they become returning patients and return to cancer centers at regular time intervals depending on their treatment protocols. Returning patient treatment plans must be followed as prescribed, and a lack of capacity leads to either long wait times for new patients or noncompliance with the treatment for returning patients.
Studies show that long wait times for diagnosis and treatment initiation are among the main concerns in healthcare systems [4,5]. One of the primary causes of long patient wait times to see oncologists is the mismatch between patient demand and available oncologist capacity. Although hiring additional physicians might seem to be the obvious solution, it is not a viable option for many healthcare organizations because of the limited availability of oncologists and financial constraints in today’s healthcare sector. Thus, clinics need to find solutions to make better use of the capacity of their existing oncologists. Oncologists specialize in treating specific cancer types based on their academic background and professional development. Therefore, clinic capacity may not necessarily match with new and returning patient demand for different cancer types. The mismatch between oncologist specialization and patient demand results in treatment delays for patients and underutilized capacity for some oncologists. This implies that there are opportunities to efficiently manage the available capacity at both the tactical level (capacity planning and resource allocation) and the strategic level (hiring an oncologist) to provide cancer patients with timely access.
Oncologists’ specialization mixes differ depending on specialty, subspecialty, and clinical interests. Some oncologists are more flexible regarding the variety of cancer patients they can treat, while some specialize in one cancer type. Also, based on our cancer center collaborators, some oncologists choose to see one or a limited number of cancer types even though they are capable of serving multiple cancer diseases, which negatively impacts resource utilization and patient access. This study aims to determine oncologists’ optimal specialization mixes considering their preferences and academic backgrounds in order to respond to demand uncertainty. Moreover, we define several flexibility levels and study how the oncologist specialization mix affects meeting patient demand. In the context of this study, flexibility refers to the ability of oncologists to treat multiple cancer types. To the best of our knowledge, this is the first study investigating the impacts of the flexibility level on resource utilization and demand satisfaction in cancer centers.
We determine the optimal specialization mix of oncologists, considering oncologists’ preferences and academic backgrounds to meet new and returning patient demands and guarantee patient care continuity. We also investigate the impact of oncologists’ flexibility (specialization mix) on capacity allocation.
Moreover, in this study, we seek to balance the workload across oncologists as well as their clinic sessions simultaneously. Oncologist workload optimization is one of the main performance metrics in healthcare organizations. If clinic capacity is not appropriately allocated, some oncologists may end up treating more patients than others, which leads to dissatisfaction among oncologists. Therefore, outpatient clinics such as cancer centers try to allocate the available capacity such that the workload across oncologists is balanced.
Furthermore, some cancer patients require support services such as speech therapists, dietitians, and care managers as a part of their treatments. However, because providing these support services is costly, cancer centers seek ways to reduce the operational costs of these support services [6]. One way to decrease costs is to limit the number of days the support services are required to be available. Therefore, in this study, we also attempt to allocate the clinic capacity to different cancer types such that the cost of support services is reduced.
The remainder of this paper is organized as follows. A comprehensive literature review is provided in Section 2. In Section 3, the problem is described in more detail, and a chance-constrained stochastic model is developed. The usefulness of the model is demonstrated by showing numerical results and evaluating the effect of changing different operational parameters in Section 4. Conclusions and opportunities for future research are discussed in Section 5.
2. Literature Review
2.1. Capacity Allocation in Outpatient Clinics
In a healthcare system, capacity allocation is an important but challenging problem due to high variability in patient demand and requirements. Reference [7] present a method to dynamically allocate incoming patient demand to available capacity such that a wait time target is achieved cost-effectively. They model the problem as a Markov Decision Process (MDP) and solve the equivalent linear program through approximate dynamic programming. Reference [8] propose a dynamic model to allocate oncologist capacity in a primary care clinic to maximize clinic revenue. They consider variations in patient choices to have same-day and future appointments. They propose several metaheuristic algorithms to solve the problem and show that having more variability in same-day demand can deteriorate clinic performance. Reference [9] investigate resource allocation optimization by proposing analytic approaches to determine the optimal number of open-access appointment slots to match demand and capacity. The objective is to maximize the expected number of patients seen while reducing variability in the number of patients consulted by each physician in each clinic session. Reference [10] expand the [7] model and formulate an MDP and its equivalent linear programming model to allocate patient arrivals to available capacity in a cancer agency in British Columbia. They aim to minimize the cost of patient wait time and oncologist overtime as well as postpone some of the booking decisions over a finite planning horizon. Reference [11] propose a model to assign a set of predefined time slots to different classes of patients to minimize the total expected weighted waiting time. They use a bulk service queuing model to obtain the expected wait time of patients and use that as the input of the proposed optimization model. They develop a step-wise heuristic to solve large-size problems. Reference [12] propose a finite-horizon MDP model to optimize the walk-in patient admission policy in clinics with high no-show and/or high late cancellation rates. They suggest several heuristic admission policies and compare their performance under different clinic settings. Reference [13] develop a capacity allocation model for integrated care, where multiple oncologists serve multiple types of patients. The objective is to smooth workloads and guarantee access delay targets for new and returning patients with different urgency levels. They formulate the problem as queuing network optimization and transform the model into a deterministic mixed-integer model for tractable optimization. Reference [14] study two decision levels in appointment scheduling, including the number of slots to assign to walk-in and scheduled patients and how to assign scheduled patients to appointment slots to minimize lead time. They consider seasonal demand for both walk-in and scheduled patients and use discrete event simulation to test the combination of different access and scheduling rules. As discussed, most of the studies in the outpatient capacity allocation literature focus on minimizing the cost of waiting time, idle time, and overtime, minimizing the number of unused slots, and maximizing the revenue from patients seen. However, to the best of our knowledge, this is the first study that addresses minimizing the maximum deviation in the patient demand satisfied versus the supply target. This formulation leads to minimizing the variability in the portion of lost patients in each group (cancer type).
2.2. Deterministic and Stochastic Optimization in Outpatient Clinics
Operational Research (OR) methods play a crucial role in addressing complex healthcare issues. Reference [15] provide a comprehensive review of OR studies that focus on decision-making in various aspects of healthcare, specifically in cancer centers. They highlight that successful OR modeling has led to notable improvements in cancer care services.
Deterministic optimization techniques are widely used in healthcare across various areas such as capacity allocation, treatment planning, and supply chain management. Specifically, in resource allocation, deterministic models help with tasks such as scheduling operating rooms [16,17,18], patient appointments [19,20], and staff shifts [21,22,23]. This methodology has also been applied in cancer centers. For example, reference [24] address the Master Chemotherapy Planning problem in a shared cancer center, focusing on scheduling patient appointments with oncologists before drug infusion. They formulate the problem as a lexicographic multiobjective optimization problem and solve it using a sequence of MIP models. Moreover, they propose a rolling horizon approach to tackle a long planning horizon of up to one year, aiming to keep the changes in weekly plans from one month to the other as small as possible. Reference [25] propose a multi-criterion mixed integer programming (MCMIP) model for scheduling drug administration appointments in outpatient chemotherapy, where nurses serve multiple patients simultaneously. It integrates task scheduling with appointment scheduling in offline scheduling to adjust nurse FTEs based on appointment requests and performance criteria, ensuring high nurse utilization and workload control despite variations. The model focuses on appointment and task scheduling for drug administration, considering strict time requirements and objective criteria for patients, nurses, and the clinic. Because of the problem’s size, a three-stage heuristic is developed to find criterion points with the minimum weighted average deferring time of appointments for a chosen number of nurse FTEs.
Although deterministic methods have been widely used in the literature, they do not account for uncertainties such as changes in patient demand or resource availability. Stochastic optimization is commonly used to address issues faced by outpatient clinics, such as capacity planning, appointment scheduling, determining panel sizes, and setting access policies. This method is essential for addressing uncertainties in the healthcare system, like variations in patient demand, preferences, and appointment lengths [26,27,28,29,30]. Single-stage and two-stage stochastic programming are two of the most common stochastic modeling methods used for addressing these problems in outpatient settings. Reference [31] address the patient scheduling problem in outpatient clinics, assuming that the appointment duration probability distributions are unknown. They aim to determine the planned starting time of each appointment such that the expected total underage and overage costs due to the mismatch between allocated and realized durations are minimized. They propose a single-stage stochastic model and develop a sampling-based approach to solve the problem. Reference [32] develop a two-stage stochastic integer program to minimize the trade-off between expected patient wait times and expected total time required to treat patients. They show that solving this problem requires excessive computational time, and they find approximate solutions by developing a heuristic algorithm.
Some other studies use stochastic dynamic programming to allocate patients to servers/resources, decide patient acceptance/rejection, and determine appointment day/time. For example, Markov Decision Processes and simulation have been used in determining appointment days [33,34], scheduling chemotherapy and proton therapy appointments [35,36], selecting patients from a waiting list in each period [37,38], and capacity allocation [39,40].
Moreover, some studies utilize stochastic modeling to develop and improve patient scheduling and planning in outpatient chemotherapy centers. For example, reference [41] developed three mean-risk stochastic integer programming (SIP) models, referred to as SIP-CHEMO, to specify patient and resource schedules. They consider the risks of deviation from physicians’ recommended chemotherapy starting dates as well as the risks associated with treatment duration, acuity levels, and nurse availability. The results show that SIP models generate more efficient schedules in terms of patient wait time, nurse overtime, and patient throughput. Reference [42] formulate a two-stage stochastic mixed-integer programming (TSMIP) model for the daily scheduling of chemotherapy patients and nurse assignments based on patient acuity levels. They consider uncertainties related to infusion duration and aim to minimize the mean weighted sum of excess acuity, waiting time, and nurse overtime. They also propose a novel algorithm called scenario bundling-based decomposition (SBBD) to solve the model and evaluate the effectiveness of their proposed approach. Some of the other studies that develop stochastic models to schedule chemotherapy patients in cancer centers include [43,44,45,46].
A chance-constrained methodology has been used in other industry settings [47,48]. However, the application of chance-constrained methods in outpatient capacity planning problems has not been thoroughly investigated. Reference [49] develop a bilevel fuzzy chance-constrained model to solve the hospital outpatient appointment scheduling problem based on revenue management. Reference [50] are one of the first to use chance constraints in healthcare capacity planning problems. They propose a stochastic linear optimization model to determine the maximum required capacity for a re-entry system with uncertain arrivals. While reference [50] address a capacity design problem, our research is one of the very few studies that use a chance-constrained method in a capacity allocation problem in cancer centers.
2.3. Other Factors Considered in Patient Scheduling in Cancer Centers
When scheduling patients in cancer centers, it is essential to consider oncologists’ specialization mixes and their current panel sizes. Specialization mix, which is one of the critical tactical decisions in cancer centers, refers to the cancer types that an oncologist can treat. Patient/specialization mix optimization in oncology centers is a relatively new research area in the literature [35]. To the best of our knowledge, there is only one paper that studies capacity allocation in cancer centers considering oncologists’ preferences. Reference [51] propose a deterministic mixed-integer programming model to find a specialization mix to meet new patient demand. However, their study does not account for returning patients or uncertainty in patient demand. In contrast, our model incorporates returning patients into the analysis.
Resource workload significantly impacts the quality of healthcare services, prompting the healthcare system to seek balanced workloads for nurses and physicians [52,53]. Several studies address this issue. For example, reference [54] proposed a two-phase approach to design a weekly scheduling template in a women’s clinic, aiming to balance oncologists’ workload and minimize patient waiting time, oncologist idle time, and overtime. Reference [55] focused on improving productivity and efficiency in a cancer clinic by incorporating mental workload as a constraint in the mathematical model for patient scheduling, resulting in successful optimization despite a potential 50% increase in patient demand. Additionally, reference [56] formulate a mixed-integer programming model to balance workload across physicians in a hospital. While these papers focus on balancing the workload among providers, our proposed model enhances the literature by allocating clinic capacity to ensure the simultaneous balance of workload among oncologists and across oncologists’ clinics.
In summary, this study provides insights into capacity planning in cancer centers and makes significant contributions to the literature in the following key areas.
- This study innovatively aims to minimize the maximum deviation between patient demand and supply targets, thereby reducing variability in lost patients, including both new and returning patients.
- The proposed model ensures a balanced workload among oncologists and across clinics simultaneously, thereby improving efficiency.
- The proposed model seeks to decrease the cost of the support services that are required for treating cancer patients by limiting the number of cancer types assigned to each clinic session.
- The proposed model can also be used to help a cancer center choose among different oncology candidates to be able to provide timely access to patients if they are expanding.
3. Model Formulation
In this section, we present a stochastic chance-constrained model to allocate oncologists’ capacities to new and returning patients with different cancer types. We then develop the deterministic equivalent of the model and solve the resulting mixed-integer linear program. While the primary objective of the proposed model is to minimize the deviation in the satisfied patient demand from the supply target, we also consider additional goals such as finding the optimal specialization mix of oncologists, balancing workload, and reducing the cost of support services.
Since oncologists are expensive resources to hire and there is a limited supply of them, cancer centers cannot guarantee to satisfy all patient demands. Instead, cancer centers try to utilize their existing resources effectively by determining a supply target and then attempting to hit that goal to provide timely patient access. Therefore, capacity allocation plays a crucial role in accomplishing cancer care delivery goals. Moreover, a mismatch between oncologists’ specialization mixes and patient demand distribution by cancer type results in failure to evenly meet patient demand for different cancer types. This implies the importance of creating an optimal specialization mix to meet patient demand.
Cancer patients follow various treatment regimens that require different numbers of visits. Some cancer types require more treatment visits than others. Therefore, assigning the same number of new patients to each oncologist does not necessarily lead to equal workloads. Unbalanced oncologist workloads create several difficulties, including dissatisfaction among the oncologists, and can impact the patient treatment process and patient safety. This highlights that workload balance across oncologists considering treatment requirements is a crucial factor in capacity planning [57]. Our proposed model considers this factor, which is achieved by restricting the utilization difference across oncologists as well as their clinic sessions.
Furthermore, the proposed model decreases the cost of support services by limiting the number of cancer types assigned to each clinic. Some support services such as pain management and diet counseling are common among cancer types. However, certain cancer types may require additional care depending on the nature of the cancer. For example, head and neck patients may need speech therapy. Having such cancer-dependent support services available in all clinics is costly. Therefore, our proposed model restricts the number of cancer types assigned to each half-day clinic to reduce the cost of support services while the deviation in the patient demand satisfied versus the supply target is still minimized and oncologists have high utilization.
The oncologists’ patient mixes can change due to different reasons such as hiring a new oncologist, changes in the preferences of the oncologists in terms of cancer types they would like to treat, changes in supply (i.e., adding/dropping clinics), patient demand, etc. Therefore, the planning horizon of the proposed model is flexible to give cancer centers the ability to update the specialization mix of oncologists in response to potential changes. A one-week planning horizon was used for our computational tests because our collaborating cancer center focused on developing scheduling templates that were used each week.
The sets, parameters, and variables used in the proposed mathematical model are as follows:
- Sets
- P: Set of oncologists (P = 1,2,…, p).
- C: Set of cancer types (C = 1,2,…, c).
- T: Set of half-day clinics (T = 1,2,…, t).
- Parameters
- : Current specialization mix of oncologist .
- : Random demand of new patients with cancer type .
- : Random demand of returning patients with cancer type .
- : Target quantile of new patient demand satisfaction for cancer type .
- : Target quantile of returning patient demand satisfaction for cancer type .
- : Maximum number of specializations assigned to oncologist
- : Minimum number of specializations assigned to oncologist .
- : Minimum number of oncologists assigned to cancer type .
- : Number of available slots in clinic of oncologist .
- : Binary input having a value of 1 if oncologist is holding clinic and , and 0 otherwise.
- : Maximum number of new patients oncologist can see in each clinic.
- : Maximum number of cancer types assigned to clinics across all oncologists.
- : Workload difference among the clinics of individual oncologists.
- : Workload difference across oncologists.
- : Returning to new demand ratio for cancer type .
- : a big number.
- Variables
- : Binary variable taking a value of 1 if cancer type is assigned to oncologist , and 0 otherwise.
- : Binary variable taking a value of 1 if cancer type is assigned to clinic , and 0 otherwise.
- : Integer variable for the number of slots assigned to new patients with cancer type in clinic of oncologist .
- : Integer variable for the number of slots assigned to returning patients with cancer type in clinic of oncologist .
- : Utilization of oncologist and oncologist across all clinics.
- : Utilization of oncologist and oncologist in clinic .
- : Deviation ratio from supply target for cancer type for new patients.
- : Deviation ratio from supply target for cancer type for returning patients.
- : Maximum deviation from supply target across new patients.
- : Maximum deviation from supply target across returning patients.
The model is formulated as follows:
Subject to:
Throughout the detailed model description N and R are used to denote variables and parameters associated with new and returning patients, respectively. The objective function (1) minimizes the deviation in the maximum satisfied new () and returning patient demand () from the supply target that is pre-defined by the decision-makers. The demand deviation for each cancer type is defined as the percentage of potentially unsatisfied demand. Because providing care for treating all cancer types is considered equally important, the objective function guarantees that the rate of unsatisfied patient demand for new and returning patients is balanced across cancer types. Constraints (2) and (3) define the supply target for meeting new and returning patient demand, respectively. Constraint (4) ensures that the capacity of each clinic is not exceeded. This constraint assumes that new patients require two slots for their first visit. Constraint (5) guarantees that adequate capacity is assigned for the returning patients of each oncologist to maintain care continuity, i.e., make sure patients can see the same oncologist every time they return to the cancer center. In this study, we collected three years of data from our collaborating cancer center to obtain the average ratio of the number of returning patients to the number of new patients for each cancer type (). Constraint (6) ensures that returning patient slots for cancer type are assigned to oncologist only if new patient slots for that cancer type are already assigned to that oncologist. Constraint (7) specifies a maximum number of new patients that can be assigned to the oncologists’ clinic sessions. The oncologists’ overall and individual clinic utilizations are calculated in constraints (8) and (9), respectively; the terms that are multiplied by 2 represent the new patient slot required capacity as new patients require two slots. Constraints (10) and (11) link the specialization and slot assignments and establish that can have a positive value only if cancer type is assigned to oncologist . The oncologist’s current specialization mix is considered in constraint (12), which ensures that only those cancer types that oncologists are specialized in can be assigned to oncologists. Constraint (13) relates the and variables. Constraint (14) reduces the cost of support services by specifying the maximum number of cancer types that can be assigned to clinic . Demand deviations from the desired supply targets are calculated in constraints (15) and (16), respectively. This deviation cannot be negative as the supply target is set equal to the -quantile of demand defined in constraints (29) and (32) later in this section. Constraints (17) and (18), respectively, specify a lower bound and an upper bound for the number of specializations (cancer types) assigned to each oncologist. The minimum number of oncologists assigned to cancer type is set in constraint (19). Constraint (20) calculates the workload difference between all pairs of an oncologist’s clinics and sets an upper bound () for this difference to provide a balanced workload across the clinics of an oncologist. Similarly, the overall workload between different oncologists is balanced in constraint (21). Constraint (22) ensures that when cancer type is assigned to more than one clinic session, the assigned clinics cannot be in one day. The reason for this constraint is that new patient access will be adversely impacted if clinics assigned to cancer type are not spread across the different days of the week. Constraints (23) and (24) define the maximum satisfied demand deviation from the supply target (unsatisfied demand to supply target ratio) for new and returning patients across all of the cancer types, respectively. Constraints (25)–(28) are integer restrictions and non-negativity constraints. Since new and returning patient demand is random, we replace constraints (2) and (3) with the following individual chance constraints, which place restrictions so that constraint violations, i.e., deviation from the supply target, are not too frequent:
Our selection of a stochastic chance-constrained model is based on the risk management perspective inherent in healthcare operations. Utilizing the chance-constrained approach, which is characterized by its risk-averse nature, enables us to impose probabilistic constraints individually on each demand point. By adopting a risk-averse approach, the chance-constrained method empowers decision-makers to account for demand uncertainty and mitigate risk by excluding more precarious scenarios based on their aversion level [58,59,60]. Constraints (29) and (30), respectively, imply that the slots assigned for new and returning patients with cancer type should be at most the amount needed to satisfy the -quantile of demand. Since these constraints are computationally intractable, a natural course of action is to replace these constraints with a tractable approximation using the method proposed by [61] to construct the deterministic equivalent constraints of (29) and (30). Since the probability distribution of patient demand is known, constraints (29) and (30) can be transformed into linear constraints by using the inverse of the cumulative distribution function as noted below:
where and are the -quantile of the new and returning patient demand for cancer type , respectively, which can be obtained from the corresponding demand probability distribution functions. Replacing constraints (2) and (3) with their deterministic equivalent constraints results in a mixed-integer linear programming model.
4. Numerical Experiments
This section illustrates many of the important cancer center operating questions that can be answered using the proposed model. To demonstrate the significance and usefulness of the model, we solve the model using data from a cancer center that we have collaborated with during the last several years. For model validation purposes, the proposed model was reviewed by our collaborating cancer center to ensure that the model accurately represents the system and achieves the intended objectives.
4.1. Cancer Center Background and Parameter Setting
We collected three years of data (2017–2019) from our collaborating cancer center for this study. Table 1 shows the new and returning patient demand distribution for each cancer type ( and ). The current specialization mixes of the seven oncologists ( in the cancer center is considered as an input to find the optimal specialization mix (see Table 2). Depending on the oncologists’ full-time equivalence status for clinical duty, the number of clinics for each oncologist varies from three to five clinic sessions per week, and the number of planned slots for each clinic varies between 8 and 12 slots. The oncologists’ current weekly schedules and capacities are shown in Table 3. The numbers in this table show the number of available slots in each clinic (.
Based on discussions with the decision-makers in the collaborating cancer center, the values of and (maximum workload variability among the clinics of individual oncologists and across oncologists, respectively) are both set to be 0.1 and is set to be 4. Also, the cancer center desires to satisfy patient demand for both new and returning patients at the 95th percentile (). Moreover, the minimum and maximum number of specializations assigned to each oncologist varies between one and three to reflect the collaborating cancer center’s preferences (see Table 4). Since the cancer center does not have any requirements regarding the minimum number of cancer types assigned to each oncologist, is set equal to 1 for all the oncologists. Furthermore, the maximum number of new patients that each oncologist is supposed to see in each clinic ( is set to two patients.
The model is solved in GUROBI on an Intel® Core i7 processor with 4.2 GHz CPU and 32 GB of RAM.
4.2. Sample Results from Model Application in the Cancer Center Context
This section presents the solution of the proposed resource allocation problem for the inputs described in Section 4.1. The proposed model offers an optimal weekly template for oncologists, which contains the number of slots assigned to each cancer type for new and returning patients across the oncologists’ weekly clinic sessions. The results are presented in Table 3, Table 4, Table 5 and Table 6.
Because all cancer types are considered to be equally important, the model minimizes the maximum deviation ratio (loss ratio) to decrease the variability in the loss ratio across cancer types for new and returning patients separately. The loss ratio is defined as the number of unserved patients divided by the amount of the -quantile of the demand. The objective function value obtained for the cancer center under study is 0.37, which is the sum of the maximum deviation from the supply target for new (0.33) and returning (0.04) patients, as presented in Table 5. One reason for the larger variation in new () versus returning () patients is the integrality of . Since the number of new patients each week is relatively small, even a deviation of one patient represents a percentage difference of 14 to 33 percentage points. The same argument holds for returning patients, but because the demand for returning patients is higher, the integrality of does not impact the value of () as much since a deviation of one patient only represents about 3 to 4 percentage points. Overall, the results suggest that the cancer center requires more capacity to meet the desired levels of new and returning patient demand.
Table 6 presents the optimal specialization mix for each oncologist. The results suggest that although oncologists may be able to serve patients from multiple cancer types, it might not be optimal to see patients within all their possible specialties. For example, oncologist 6 is specialized in seven cancer types, but the results suggest that to minimize patient loss and balance workload across the oncologists, this oncologist is only required to see patients within four of the cancer types that he is specialized in.
Table 7 presents the utilization among the oncologists as well as across the clinics of individual oncologists. The results show that the proposed model creates a balanced workload across the oncologists. Similar to demand deviation, the small variation in the oncologists’ utilization is due to the integrality of . Based on the results, one of the oncologists experiences equal workload across his clinics, and the variability across the clinics is 8–9% for the other oncologists. However, this variability among the oncologists’ clinics is modest and, combined with the more important overall utilization balance, represents an effective workload balance. Moreover, the overall clinic capacity utilization is 0.89. However, capacity utilization increases when different factors such as the desired workload balance, the current specialization mix of the oncologists, and care continuity are relaxed. However, care continuity has the greatest impact on utilization because the model ensures that new patients can be scheduled with an oncologist only if the oncologist has enough capacity to accommodate the subsequent returning visits. This means that there may appear to be additional capacity to schedule more new patients, but because there is not enough capacity for the following returning visits, more new patients cannot actually be scheduled.
An additional benefit of the proposed model is that it can help cancer centers when they are hiring new oncologists to identify the primary specializations that a new hire should be able to treat in order to better meet patient demand. To use the model to find the required specialization mix for a new oncologist for this new hire scenario, the model is solved in two stages. We first solve the model to obtain the optimal specialization mixes of the existing oncologists and then use the obtained optimal specialization mix as input and solve the model to find the specialization mix for any new oncologist(s). Table 8 shows the specialization mixes obtained by the model for five different cases that are defined by a minimum and maximum number of cancer types that a new oncologist should see (represented by [L, U]). This allows the cancer center to evaluate the patient service impacts of hiring different new oncologists from a group of candidate oncologists based on the number and type of specialties the different oncology candidates can treat.
4.3. Evaluation of Cancer Center Parameters
This section provides an evaluation of changing three key cancer center operating parameters considered in the model as follows: the total number of cancer types assigned to each clinic session (), the flexibility levels of the oncologists (), and workload balance across the oncologists (). Quantitative analyses are performed to show the impacts of each of these operating parameters and how the results can drive cancer center operating strategies and practices.
4.3.1. Impact of the Total Number of Cancer Types Assigned to Each Clinic Session
Some cancer types require support services such as lung navigators, pulmonologists, breast navigators, dietitians, speech therapists, etc., as a part of the patient treatment plan. However, due to the significant cost of these support services, cancer centers try to reduce the number of clinics requiring these services, i.e., the number of cancer types assigned to each clinic session, to decrease operational costs. In this study, we investigate the impact of the maximum number of cancer types that are assigned to each clinic session () on the objective function value (the sum of the deviation in the maximum satisfied new and returning patient demand from the supply target) and capacity utilization (see Figure 1). If we desire to maintain a tight workload balance among the clinics of individual oncologists (), the problem becomes infeasible when and . The reason is that because of the number of cancer types, new and returning patient demand, and the distribution of oncologists’ clinics throughout the week in the collaborating cancer center, it is not feasible to assign one or two cancer types to each clinic session and simultaneously balance the workload among the clinics of individual oncologists. Therefore, we relax constraint (20) of the model for the results presented in this section.
The results show that as increases, clinic capacity is more utilized, and the maximum demand deviation from the supply target is reduced for both new and returning patients because more patients (with different cancer types) can be scheduled in clinic sessions. The improvements are most significant when changes from 1 to 2; the sum of the maximum demand deviation decreases by 63%, and the capacity utilization increases by more than 50%. When rises to 3, the maximum deviations from the 95th percentile demand decrease by 37%, and capacity utilization improves by almost 5%. When , the system performs only slightly better than the case where ; capacity utilization increases by less than 1%, and demand deviation for new patients of only one cancer type halves. In both cases, all returning patient demand is satisfied, which leads to higher patient satisfaction, and clinic capacity is highly utilized. However, results in a reduction in the operational cost of support services because at most three cancer types can be treated in each clinic session. Therefore, for the cancer center under study, provides a better capacity allocation. Detailed results for the deviation from the supply target across the cancer types for different values of are provided in Table 9. The results confirm that fewer demand types deviate from their supply targets as increases.
4.3.2. Impact of Specialization Mix Flexibility
Specialization mix refers to the cancer types that each oncologist can treat. In this study, we investigate the impact of multiple specialization flexibility levels, as defined in Table 10. Flexibility levels 1–6 are based on the current specialization mix of the oncologists. For flexibility level 7, the current specialization mix is relaxed, and oncologists can treat any cancer type.
The results in this section and the next section are obtained by setting based on the results presented in Section 4.3.1. Furthermore, similar to the argument made in Section 4.3.1, constraint (20) is relaxed to avoid potential infeasibility issues. The results presented in Figure 2 confirm that the more oncologists are flexible in their specialization mixes, the smaller the maximum deviation from the supply target. Moreover, as expected, the clinic capacity is more utilized at higher levels of flexibility. When oncologists are in the lower flexibility levels (levels 1–4), there is a mismatch between supply and demand, impacting patient access and overall capacity utilization. For example, in the cancer center under study, only one oncologist, who happens to be the most flexible one, sees patients with head and neck cancer (see Table 6). Since the demand for head and neck patients is relatively low, the oncologist’s capacity is not efficiently utilized at lower flexibility levels resulting in more cancer patients experiencing high wait times to see an oncologist. Interestingly, the results show that the oncologists’ current specialization mix is relatively flexible, as the satisfied demand deviations from the supply target are the same in levels 6 and 7 for both new and returning patients and the clinic capacity utilization is roughly equal. In the collaborating cancer center, there are only two oncologists who are highly flexible in the cancer types they can treat, while other oncologists treat two to three cancer types. This suggests that cancer centers do not need all of their oncologists to be highly flexible in terms of the cancer types that they can treat; even having a small number of highly flexible oncologists is sufficient to provide the flexibility needed to meet patient demand. This is an important finding because many oncologists prefer to focus on treating a limited number of cancer types. This result shows that a cancer center can provide high service levels by having most of their oncologists able to focus on serving two to four cancer types and only having one or two oncologists that can see many different cancer types.
Table 11 provides detailed results for the demand deviation for new and returning patients of each cancer type for different levels of specialization flexibility.
4.3.3. Simultaneous Impact of Workload Balance and Specialization Flexibility Level
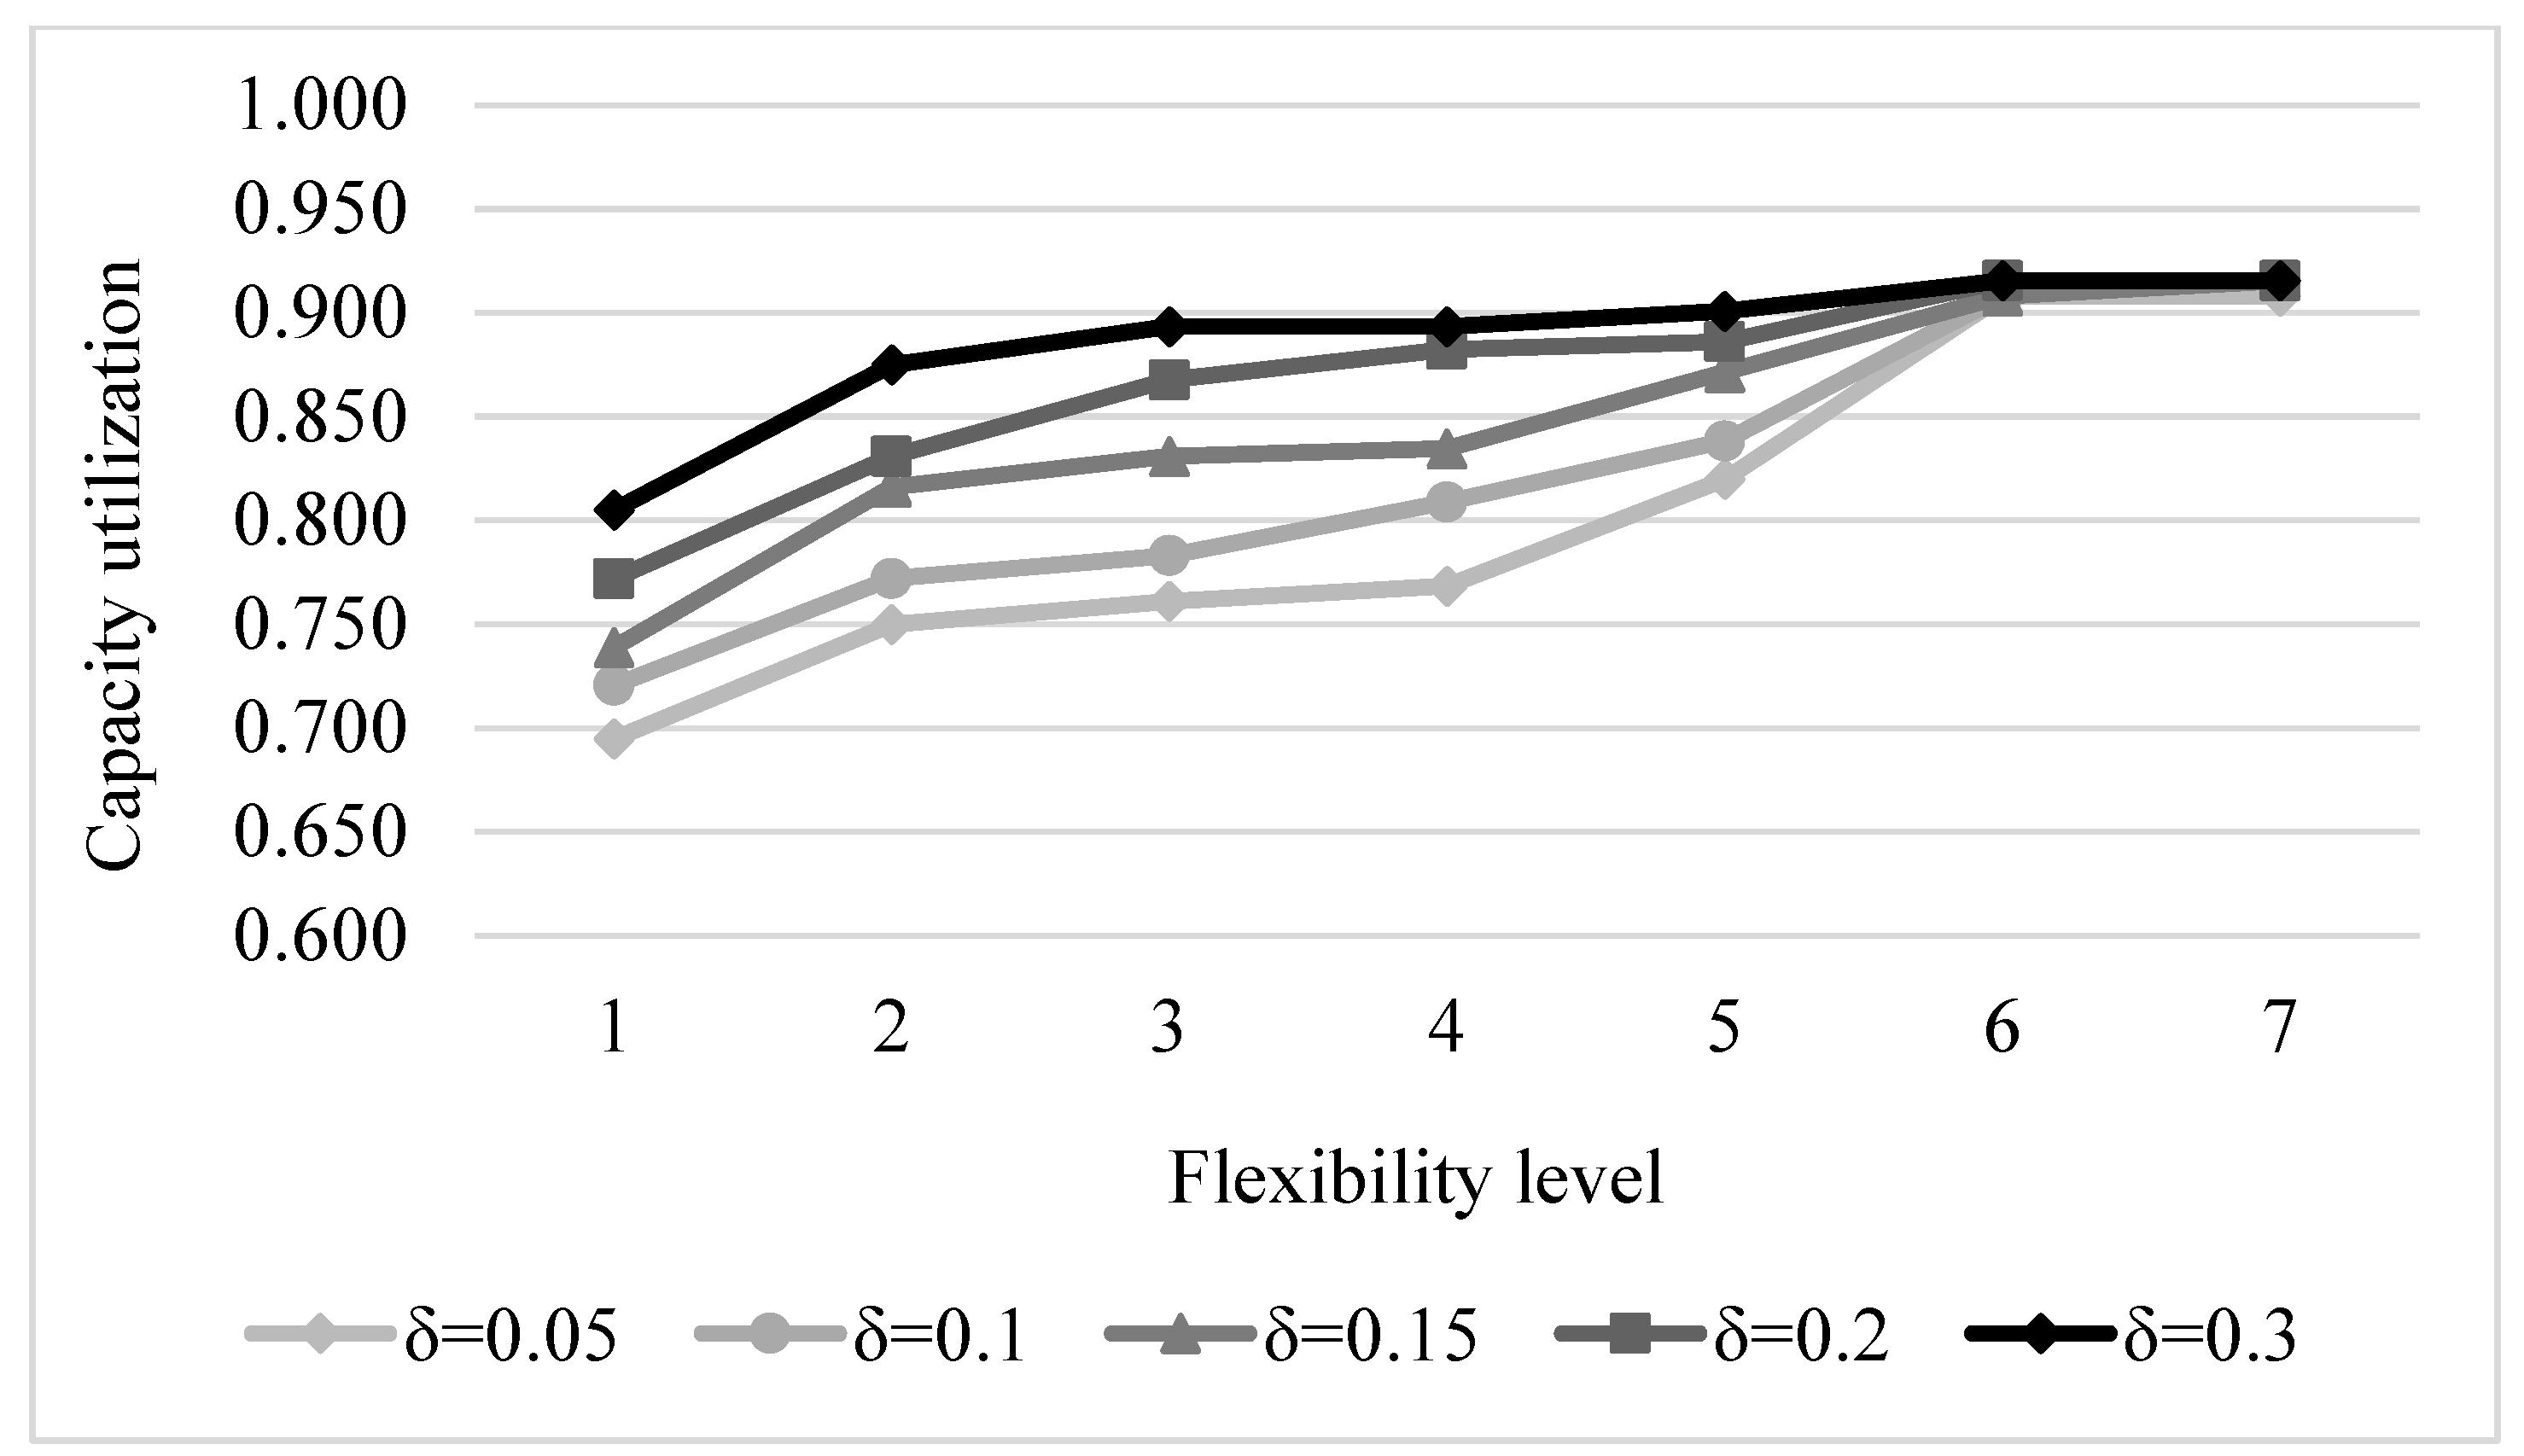
Specialty care clinics try to balance the workload across resources to avoid workload dissatisfaction among oncologists. In most cancer clinics, oncologists are specialized in more than one cancer type. Therefore, adjusting the patient mix of oncologists can create a more balanced workload across oncologists. In this study, we consider five values for (workload difference across oncologists) to analyze its impact on demand deviation from the supply target and capacity utilization. Figure 3 and Figure 4 represent the simultaneous impact of workload balance and specialization mix flexibility level on deviation from the supply target and overall capacity utilization, respectively. The results confirm that, as concluded in Section 4.3.2, for each workload difference across oncologists (), as oncologists become more flexible in terms of the cancer types they treat, deviation from the supply target and capacity utilization improves. Moreover, the results reveal that there is a correlation between the workload difference across oncologists and deviation from the supply target as well as capacity utilization; the more balanced the oncologists’ workloads are, the higher the demand deviation and the lower the overall capacity utilization. However, the results for both demand deviation and capacity utilization converge at higher levels of flexibility. The results also highlight that the impact of clinic flexibility on deviation from the supply target is greater than the impact of the allowable workload difference.
5. Conclusions
This study contributes to the sparse literature on capacity allocation in cancer centers. Oncology centers are trying to enhance their strategic, tactical, and operational policies to cope with the increasing number of cancer cases. Effective capacity allocation is one critical tactical decision that can help provide timely and high-quality care for patients. We propose a chance-constrained stochastic optimization model to allocate clinic capacity to patients with different cancer types considering uncertainties in new and returning patient demand. The objective of the model is to minimize the deviation in the patient demand satisfied versus the desired supply target. We develop the deterministic equivalent of the model and solve the resulting mixed-integer linear program to meet patient demand at a pre-defined quantile. The ability to use this model to answer important questions regarding how best to operate a cancer center is demonstrated by solving the model using data from our collaborating cancer center, which represents a medium-sized problem based on the data from [62], which show that 90% of oncology clinics have 12 or fewer oncologists. It is important to note that we applied our proposed model to a relatively small-scale cancer center. This allows us to solve the model using exact methods with a relatively small computational time (10.4 s on average). However, considering larger cancer centers, the application of heuristic algorithms to reduce computational complexity becomes more crucial. In addition, while our current approach emphasizes equitable treatment and resource allocation across all patient types, it is essential to recognize that certain cancer centers may prioritize one patient category over another. Therefore, future improvements to our methodology could benefit from considering different weightings for new and returning patient types to better align with the varying priorities of healthcare centers.
One goal of the proposed model is to find how much oncologist specialization flexibility is required to respond to patient demand uncertainty effectively. This could help a cancer center determine the optimal specialization configuration of oncologists based on their academic background and professional development. It could also help cancer center decision-makers identify the required specialization mix of a new hire to both reduce hiring costs and provide timely care for cancer patients. We investigate the impact of multiple specialization flexibility levels on demand deviation and capacity utilization. The results confirm that the ability to satisfy patient demand increases as oncologists become more flexible, and it is highest when all of the oncologists can treat any cancer type (an idealized context). A key insight related to this is that we show that not all oncologists need to be able to see a broad range of cancer types. Even having a small number of highly flexible oncologists is sufficient to achieve strong patient demand satisfaction. This is an important finding because, in practice, most oncologists prefer to treat only two to four cancer types, and these results confirm that most oncologists can do that and still result in high clinical efficiencies.
A second goal is to determine the effect of limiting the number of cancer types assigned to each clinic session as a way to reduce the costs of support services. A key insight that the results highlight is that the satisfied patient demand deviates less from the target level as more cancer types are assigned to clinic sessions. More specifically, the results show that assigning only one cancer type to each clinic hinders the ability to effectively meet care delivery goals. Therefore, assigning at least two and likely three cancer types to each clinic session is essential to meet patient demand at high levels. The benefit accrued from increasing from an upper limit of two to permitting three cancer types per clinic session would vary by cancer center setting, but for our collaborating cancer center, the benefits warrant shifting to three. Future research could develop a model primarily focused on minimizing the cost of support services that are required for treating each cancer type.
A third goal is to balance the workload across oncologists and their clinic sessions and see how balancing the workload interacts with providing good patient access. The proposed model balances the workload across oncologists and their clinic sessions by setting hard constraints on the maximum utilization differences across oncologists as well as among their clinics. Although it is important to balance the workload among oncologists, providing care for patients cannot be sacrificed significantly. The evaluation of workload differences among oncologists shows that there is a trade-off between workload balance and the patient demand that is satisfied. Cancer centers risk losing more patients as they try to create a more balanced workload. Thus, a key insight that the results highlight is that restricting the allowable workload difference among oncologists can achieve an acceptable trade-off between the two aforementioned factors; cancer centers can provide a satisfactory workload balance without compromising demand satisfaction very much. However, the number of unserved patients also depends on the flexibility level of the oncologists. A second key insight is that the results show that oncologist specialization flexibility plays a more important role than workload balance in the ability to satisfy patient demand targets. Thus, if we have a modest level of oncologist specialization flexibility, then it is easier to achieve better workload balance among the oncologists and achieve good patient access.
One main motivation of this study is to address the patient access issue that cancer centers are facing considering increasing patient demand. Cancer centers are constantly trying to improve resource utilization and modify their capacity to respond to demand uncertainties. In this study, we consider uncertainties in new and returning patient demand categorized by cancer types. However, we did not consider uncertainties related to no-shows and cancellations. Therefore, to improve the applicability of the model further, a future extension of the proposed model could be to consider no-show and cancellation uncertainties. Another limitation of the proposed model is that it does not include new patients’ oncologist choices. Some patients may request to see a particular oncologist for different reasons, such as the oncologist’s reputation and skills. Therefore, the proposed model can be further developed in the future to account for patients’ preferences. Another extension to the proposed model may include incorporating overbooking strategies. Moreover, future work can be performed to develop a model that considers the cost of having oncologists with different specialization mixes as well as the cost of specialized support services for specific cancer types.
As another future work, process mining could be applied to uncover patterns and bottlenecks in the scheduling processes. By analyzing event logs related to scheduling activities such as appointment requests, booking confirmations, rescheduling, and cancellations, healthcare systems could benefit from improved resource allocation and capacity planning. This could ultimately lead to more timely treatments for cancer patients.
Author Contributions
All authors have contributed to the conceptualization, methodology, validation, formal analysis, data curation, visualization, project administration, writing the original draft, and reviewing and editing. All authors have read and agreed to the published version of the manuscript.
Funding
This research received no external funding.
Institutional Review Board Statement
This study did not require IRB approval as it was a process improvement study and only used deidentified data in the analysis.
Informed Consent Statement
Patient consent was waived because this was a process improvement study and only deidentified data was needed to conduct the analysis.
Data Availability Statement
The datasets presented in this article are not readily available because our collaborating cancer center prefers that we not share the data. Requests to access the datasets should be directed to Maryam Keshtzari and the data will be provided if our collaborating cancer center grants permission.
Conflicts of Interest
The authors declare no conflict of interest.
References
- Ahmadi-Javid, A.; Jalali, Z.; Klassen, K.J. Outpatient appointment systems in healthcare: A review of optimization studies. Eur. J. Oper. Res. 2017, 258, 3–34. [Google Scholar] [CrossRef]
- Cantor, T.J. Waiting times for patients with cancer: Waiting lists are putting patients’ lives in jeopardy. BMJ Br. Med. J. 2000, 321, 236. [Google Scholar] [CrossRef]
- Elit, L.M.; O’Leary, E.M.; Pond, G.R.; Seow, H.Y. Impact of wait times on survival for women with uterine cancer. Obstet. Gynecol. Surv. 2014, 69, 143–144. [Google Scholar] [CrossRef]
- Bilimoria, K.Y.; Ko, C.Y.; Tomlinson, J.S.; Stewart, A.K.; Talamonti, M.S.; Hynes, D.L.; Winchester, D.P.; Bentrem, D.J. Wait times for cancer surgery in the United States: Trends and predictors of delays. Ann. Surg. 2011, 253, 779–785. [Google Scholar] [CrossRef] [PubMed]
- Elit, L. Wait times from diagnosis to treatment in cancer. J. Gynecol. Oncol. 2015, 26, 246. [Google Scholar] [CrossRef]
- Apte, S.M.; Patel, K. Payment reform: Unprecedented and evolving impact on gynecologic oncology. Front. Oncol. 2016, 6, 84. [Google Scholar] [CrossRef] [PubMed]
- Patrick, J.; Puterman, M.L.; Queyranne, M. Dynamic multipriority patient scheduling for a diagnostic resource. Oper. Res. 2008, 56, 1507–1525. [Google Scholar] [CrossRef]
- Gupta, D.; Wang, L. Revenue management for a primary-care clinic in the presence of patient choice. Oper. Res. 2008, 56, 576–592. [Google Scholar] [CrossRef]
- Qu, X.; Rardin, R.L.; Williams, J.A.S. Single versus hybrid time horizons for open access scheduling. Comput. Ind. Eng. 2011, 60, 56–65. [Google Scholar] [CrossRef]
- Saure, A.; Patrick, J.; Tyldesley, S.; Puterman, M.L. Dynamic multi-appointment patient scheduling for radiation therapy. Eur. J. Oper. Res. 2012, 223, 573–584. [Google Scholar] [CrossRef]
- Creemers, S.; Beliën, J.; Lambrecht, M. The optimal allocation of server time slots over different classes of patients. Eur. J. Oper. Res. 2012, 219, 508–521. [Google Scholar] [CrossRef]
- Qu, X.; Peng, Y.; Shi, J.; LaGanga, L. An MDP model for walk-in patient admission management in primary care clinics. Int. J. Prod. Econ. 2015, 168, 303–320. [Google Scholar] [CrossRef]
- Deglise-Hawkinson, J.; Helm, J.E.; Huschka, T.; Kaufman, D.L.; Van Oyen, M.P. A capacity allocation planning model for integrated care and access management. Prod. Oper. Manag. 2018, 27, 2270–2290. [Google Scholar] [CrossRef] [PubMed]
- Cayirli, T.; Dursun, P.; Gunes, E.D. An integrated analysis of capacity allocation and patient scheduling in presence of seasonal walk-ins. Flex. Serv. Manuf. J. 2019, 31, 524–561. [Google Scholar] [CrossRef]
- Saville, C.E.; Smith, H.K.; Bijak, K. Operational research techniques applied throughout cancer care services: A review. Health Syst. 2019, 8, 52–73. [Google Scholar] [CrossRef] [PubMed]
- Zhang, B.; Murali, P.; Dessouky, M.M.; Belson, D. A mixed integer programming approach for allocating operating room capacity. J. Oper. Res. Soc. 2009, 60, 663–673. [Google Scholar] [CrossRef]
- Ghazalbash, S.; Sepehri, M.M.; Shadpour, P.; Atighehchian, A. Operating room scheduling in teaching hospitals. Adv. Oper. Res. 2012, 2012, 548493. [Google Scholar] [CrossRef]
- Kayvanfar, V.; Akbari Jokar, M.R.; Rafiee, M.; Sheikh, S.; Iranzad, R. A new model for operating room scheduling with elective patient strategy. INFOR Inf. Syst. Oper. Res. 2021, 59, 309–332. [Google Scholar] [CrossRef]
- Leaven, L.; Qu, X. Improving appointment scheduling systems in outpatient clinics using a deterministic modeling approach (MILP). In IIE Annual Conference. Proceedings; Institute of Industrial and Systems Engineers (IISE): Reno, NV, USA, 2011; p. 1. [Google Scholar]
- Issabakhsh, M.; Lee, S.; Kang, H. Scheduling patient appointment in an infusion center: A mixed integer robust optimization approach. Health Care Manag. Sci. 2021, 24, 117–139. [Google Scholar] [CrossRef]
- Cuevas, R.; Ferrer, J.C.; Klapp, M.; Muñoz, J.C. A mixed integer programming approach to multi-skilled workforce scheduling. J. Sched. 2016, 19, 91–106. [Google Scholar] [CrossRef]
- Ang, S.Y.; Razali, M.; Asyikin, S.N.; Kek, S.L. Optimized preference of security staff scheduling using integer linear programming approach. Int. J. Adv. Comput. Technol. 2019, 8, 3103–3111. [Google Scholar]
- Nobil, A.H.; Sharifnia, S.M.E.; Cárdenas-Barrón, L.E. Mixed integer linear programming problem for personnel multi-day shift scheduling: A case study in an Iran hospital. Alex. Eng. J. 2022, 61, 419–426. [Google Scholar] [CrossRef]
- Carello, G.; Landa, P.; Tànfani, E.; Testi, A. Master chemotherapy planning and clinicians rostering in a hospital outpatient cancer centre. Cent. Eur. J. Oper. Res. 2022, 30, 159–187. [Google Scholar] [CrossRef]
- Hesaraki, A.F.; Dellaert, N.P.; de Kok, T. Integrating nurse assignment in outpatient chemotherapy appointment scheduling. OR Spectr. 2020, 42, 935–963. [Google Scholar] [CrossRef]
- Begen, M.A.; Queyranne, M. Appointment scheduling with discrete random durations. Math. Oper. Res. 2011, 36, 240–257. [Google Scholar] [CrossRef]
- Luo, J.; Kulkarni, V.G.; Ziya, S. Appointment scheduling under patient no-shows and service interruptions. Manuf. Serv. Oper. Manag. 2012, 14, 670–684. [Google Scholar] [CrossRef]
- Parizi, M.S.; Ghate, A. Multi-class, multi-resource advance scheduling with no-shows, cancellations and overbooking. Comput. Oper. Res. 2016, 67, 90–101. [Google Scholar] [CrossRef]
- Truong, V.A. Optimal advance scheduling. Manag. Sci. 2015, 61, 1584–1597. [Google Scholar] [CrossRef]
- Wang, S.; Liu, N.; Wan, G. Managing appointment-based services in the presence of walk-in customers. Manag. Sci. 2020, 66, 667–686. [Google Scholar] [CrossRef]
- Begen, M.A.; Levi, R.; Queyranne, M. A sampling-based approach to appointment scheduling. Oper. Res. 2012, 60, 675–681. [Google Scholar] [CrossRef]
- Castaing, J.; Cohn, A.; Denton, B.T.; Weizer, A. A stochastic programming approach to reduce patient wait times and overtime in an outpatient infusion center. IIE Trans. Healthc. Syst. Eng. 2016, 6, 111–125. [Google Scholar] [CrossRef]
- Feldman, J.; Liu, N.; Topaloglu, H.; Ziya, S. Appointment scheduling under patient preference and no-show behavior. Oper. Res. 2014, 62, 794–811. [Google Scholar] [CrossRef]
- Liu, N.; Ziya, S.; Kulkarni, V.G. Dynamic scheduling of outpatient appointments under patient no-shows and cancellations. Manuf. Serv. Oper. Manag. 2010, 12, 347–364. [Google Scholar] [CrossRef]
- Gedik, R.; Zhang, S.; Rainwater, C. Strategic level proton therapy patient admission planning: A Markov decision process modeling approach. Health Care Manag. Sci. 2017, 20, 286–302. [Google Scholar] [CrossRef] [PubMed]
- Gocgun, Y.; Puterman, M.L. Dynamic scheduling with due dates and time windows: An application to chemotherapy patient appointment booking. Health Care Manag. Sci. 2014, 17, 60–76. [Google Scholar] [CrossRef] [PubMed]
- Kolisch, R.; Sickinger, S. Providing radiology health care services to stochastic demand of different customer classes. OR Spectr. 2008, 30, 375–395. [Google Scholar] [CrossRef]
- Min, D.; Yih, Y. Managing a patient waiting list with time-dependent priority and adverse events. RAIRO-Oper. Res. 2014, 48, 53–74. [Google Scholar] [CrossRef]
- Pan, X.; Song, J.; Zhang, B. Dynamic resource allocation in a hierarchical appointment system: Optimal structure and heuristics. IEEE Trans. Autom. Sci. Eng. 2020, 17, 1501–1515. [Google Scholar] [CrossRef]
- Keshtzari, M.; Norman, B.A. Improving patient access in oncology clinics using simulation. J. Ind. Eng. Manag. 2022, 15, 455–469. [Google Scholar] [CrossRef]
- Alvarado, M.; Ntaimo, L. Chemotherapy appointment scheduling under uncertainty using mean-risk stochastic integer programming. Health Care Manag. Sci. 2018, 21, 87–104. [Google Scholar] [CrossRef]
- Karakaya, S.; Gul, S.; Çelik, M. Stochastic scheduling of chemotherapy appointments considering patient acuity levels. Eur. J. Oper. Res. 2023, 305, 902–916. [Google Scholar] [CrossRef]
- Heshmat, M.; Nakata, K.; Eltawil, A. Solving the patient appointment scheduling problem in outpatient chemotherapy clinics using clustering and mathematical programming. Comput. Ind. Eng. 2018, 124, 347–358. [Google Scholar] [CrossRef]
- Corsini, R.R.; Costa, A.; Fichera, S.; Parrinello, V. Hybrid harmony search for stochastic scheduling of chemotherapy outpatient appointments. Algorithms. 2022, 15, 424. [Google Scholar] [CrossRef]
- Mendoza-Gómez, R.; Ríos-Mercado, R.Z. Location of primary health care centers for demand coverage of complementary services. Comput. Ind. Eng. 2022, 169, 108237. [Google Scholar] [CrossRef]
- Huang, J.; Mandelbaum, A.; Momčilović, P. Appointment-driven service systems with many servers. Queueing Syst. 2022, 100, 529–531. [Google Scholar] [CrossRef]
- Wang, Z.; Shen, C.; Liu, F.; Wang, J.; Wu, X. An adjustable chance-constrained approach for flexible ramping capacity allocation. IEEE Trans. Sustain. Energy 2018, 9, 1798–1811. [Google Scholar] [CrossRef]
- Li, X.; Wang, X.; Guo, H.; Ma, W. Multi-water resources optimal allocation based on multi-objective uncertain chance-constrained programming model. Water Resour. Manag. 2020, 34, 4881–4899. [Google Scholar] [CrossRef]
- Zhou, X.; Luo, R.; Zhao, C.; Xia, X.; Lev, B.; Chai, J.; Li, R. Bilevel fuzzy chance constrained hospital outpatient appointment scheduling model. Sci. Program. 2016, 2016, 4795101. [Google Scholar] [CrossRef]
- Nguyen, T.B.T.; Sivakumar, A.I.; Graves, S.C. Capacity planning with demand uncertainty for outpatient clinics. Eur. J. Oper. Res. 2018, 267, 338–348. [Google Scholar] [CrossRef]
- Ma, X.; Sauré, A.; Puterman, M.L.; Taylor, M.; Tyldesley, S. Capacity planning and appointment scheduling for new patient oncology consults. Health Care Manag. Sci. 2016, 19, 347–361. [Google Scholar] [CrossRef]
- Ernst, A.T.; Jiang, H.; Krishnamoorthy, M.; Owens, B.; Sier, D. An annotated bibliography of personnel scheduling and rostering. Ann. Oper. Res. 2004, 127, 21–144. [Google Scholar] [CrossRef]
- Burke, E.K.; De Causmaecker, P.; Berghe, G.V.; Van Landeghem, H. The state of the art of nurse rostering. J. Sched. 2004, 7, 441–499. [Google Scholar] [CrossRef]
- Qu, X.; Peng, Y.; Kong, N.; Shi, J. A two-phase approach to scheduling multi-category outpatient appointments–a case study of a women’s clinic. Health Care Manag. Sci. 2013, 16, 197–216. [Google Scholar] [CrossRef] [PubMed]
- Huggins, A.; Claudio, D. A mental workload based patient scheduling model for a Cancer Clinic. Oper. Res. Health Care 2019, 20, 56–65. [Google Scholar] [CrossRef]
- Adams, T.; O’Sullivan, M.; Walker, C. Physician rostering for workload balance. Oper. Res. Health Care 2019, 20, 1–10. [Google Scholar] [CrossRef]
- Levit, L.; Smith, A.P.; Benz, E.J., Jr.; Ferrell, B. Ensuring quality cancer care through the oncology workforce. J. Oncol. Pract. 2010, 6, 7. [Google Scholar] [CrossRef]
- Franz, L.S.; Rakes, T.R.; Wynne, A.J. A chance-constrained multiobjective model for mental health services planning. Socio-Econ. Plan. Sci. 1984, 18, 89–95. [Google Scholar] [CrossRef]
- Beraldi, P.; Bruni, M.E.; Conforti, D. Designing robust emergency medical service via stochastic programming. Eur. J. Oper. Res. 2004, 158, 183–193. [Google Scholar] [CrossRef]
- Khodaparasti, S.; Bruni, M.E.; Beraldi, P.; Maleki, H.R.; Jahedi, S. A multi-period location-allocation model for nursing home network planning under uncertainty. Oper. Res. Health Care 2018, 18, 4–15. [Google Scholar] [CrossRef]
- Birge, J.R.; Louveaux, F. Introduction to Stochastic Programming; Springer Science Business Media: Berlin, Germany, 2011. [Google Scholar]
- Kirkwood, M.K.; Hanley, A.; Bruinooge, S.S.; Garrett-Mayer, E.; Levit, L.A.; Schenkel, C.; Seid, J.E.; Polite, B.N.; Schilsky, R.L. The state of oncology practice in America, 2018: Results of the ASCO practice census survey. J. Oncol. Pract. 2018, 14, e412–e420. [Google Scholar] [CrossRef]
Figure 1.
Impact of .
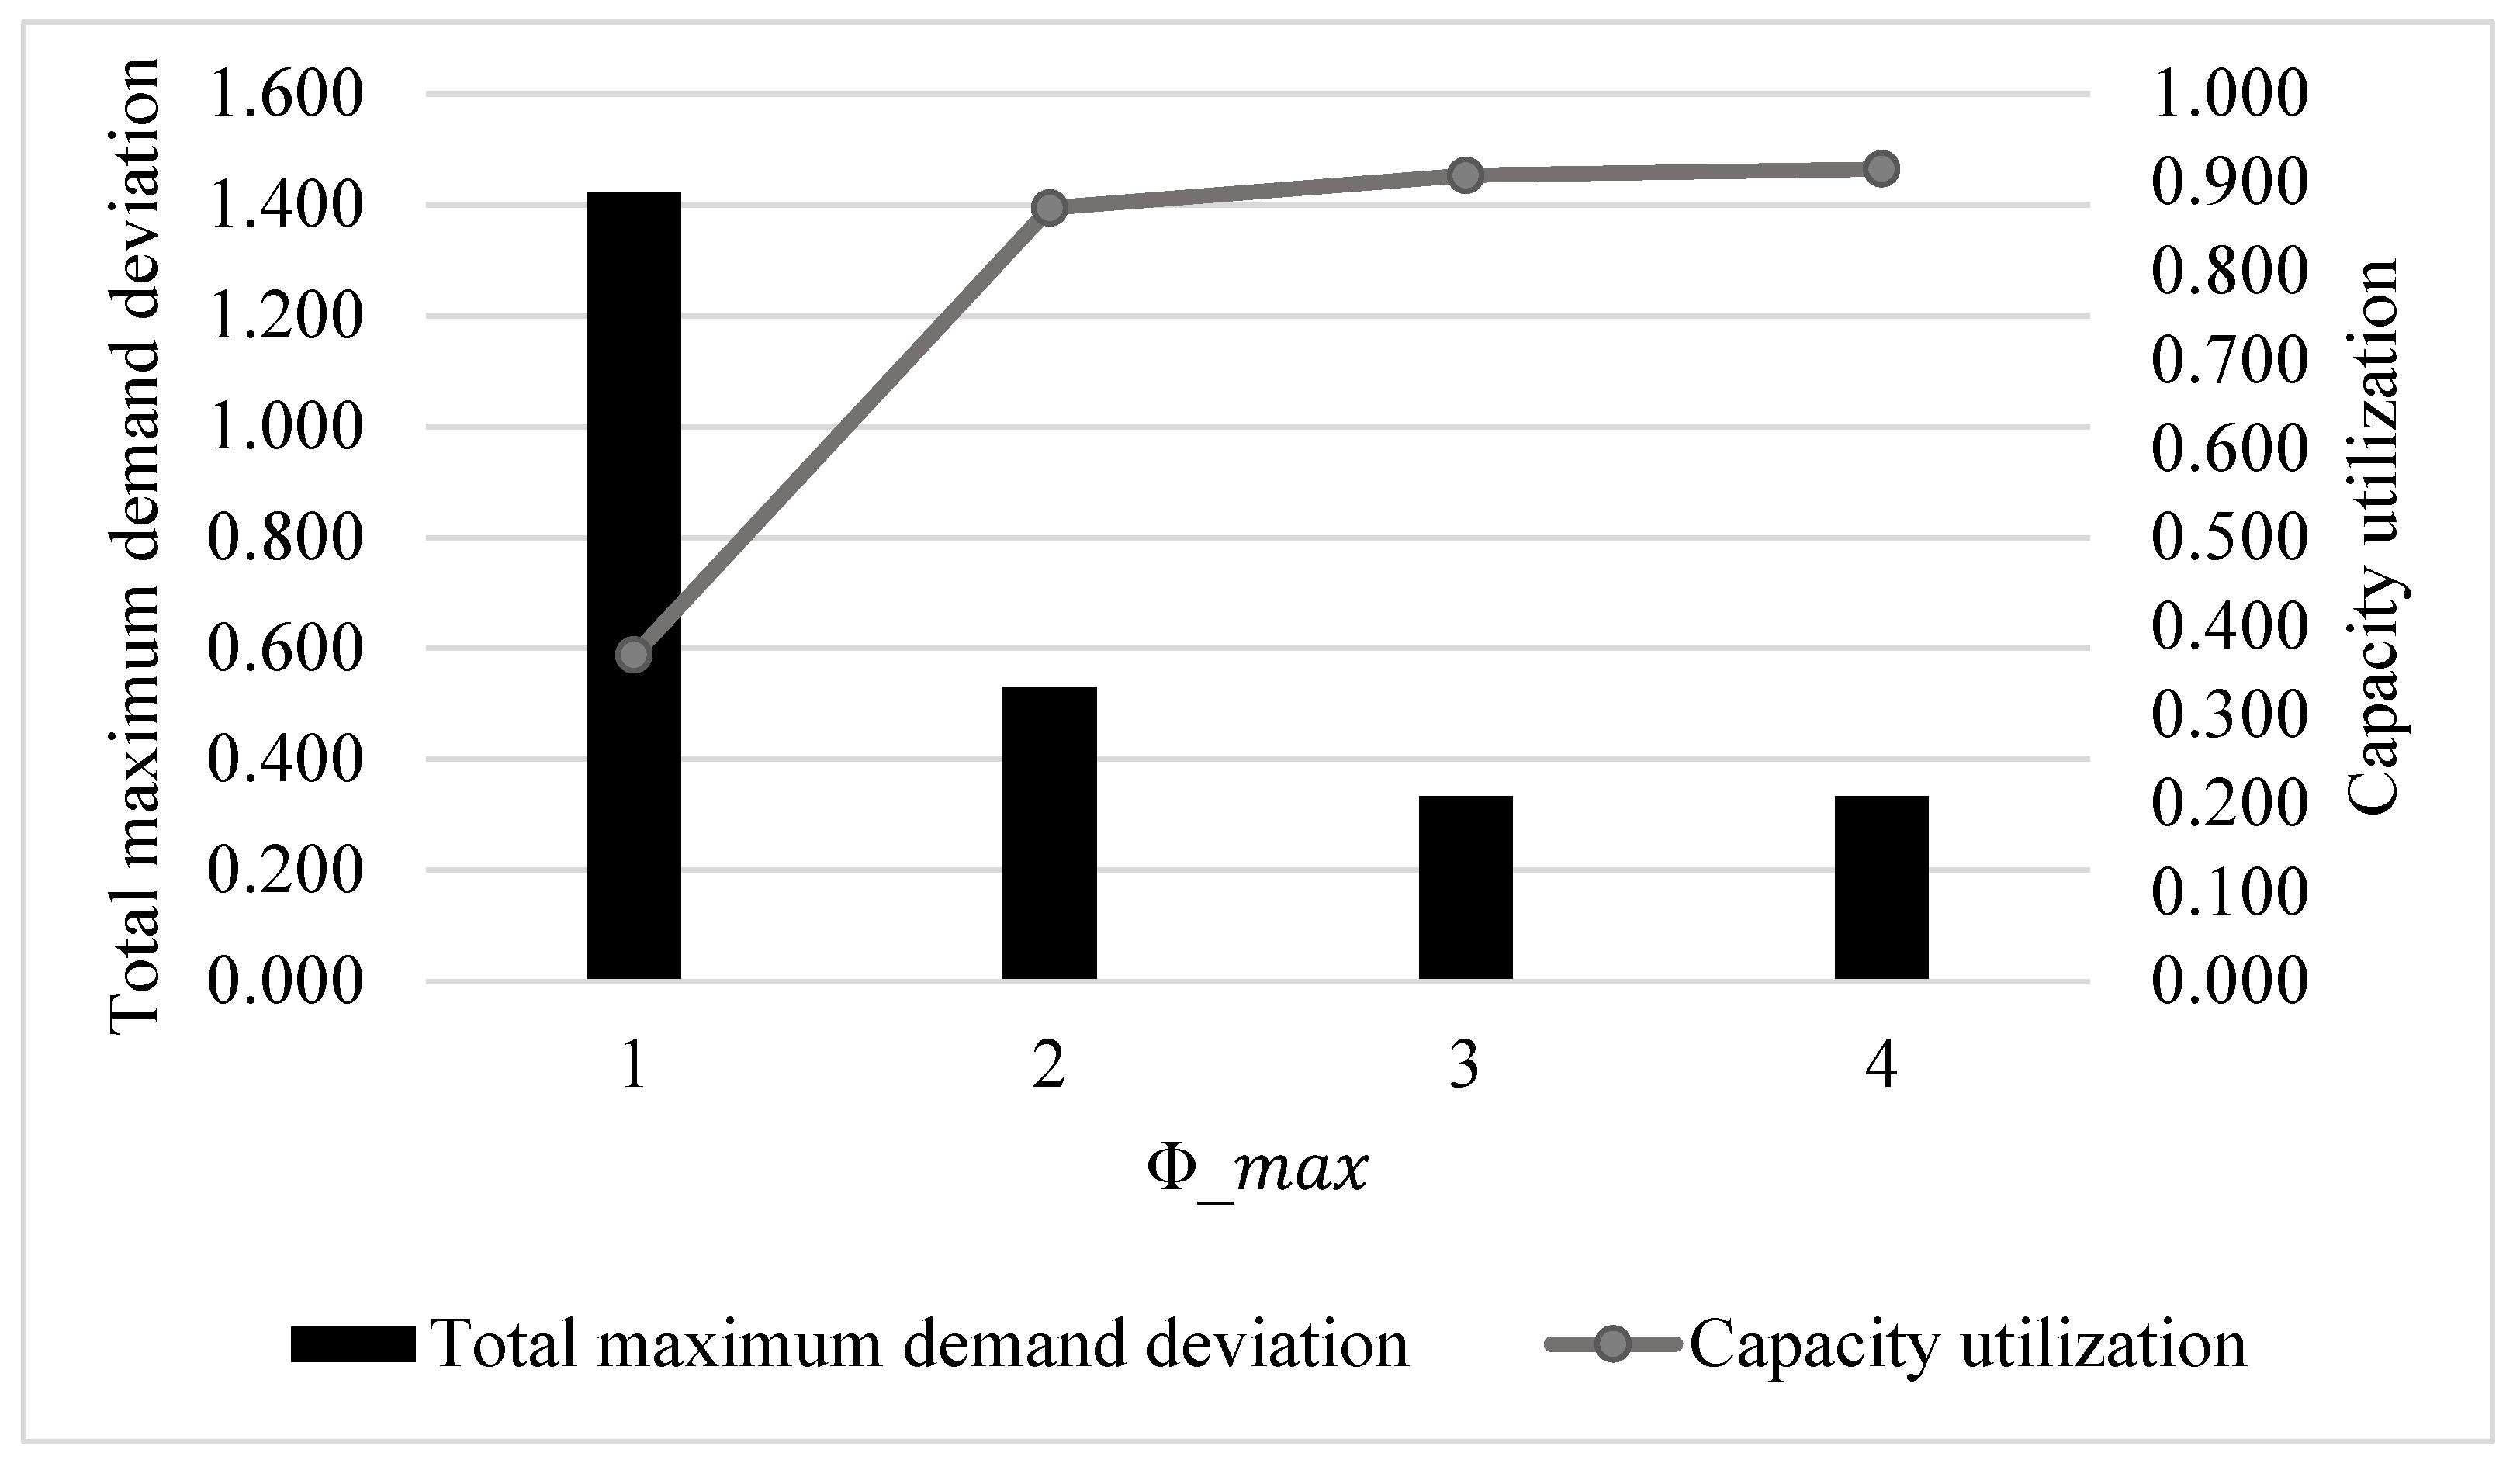
Figure 2.
Impact of flexibility level.
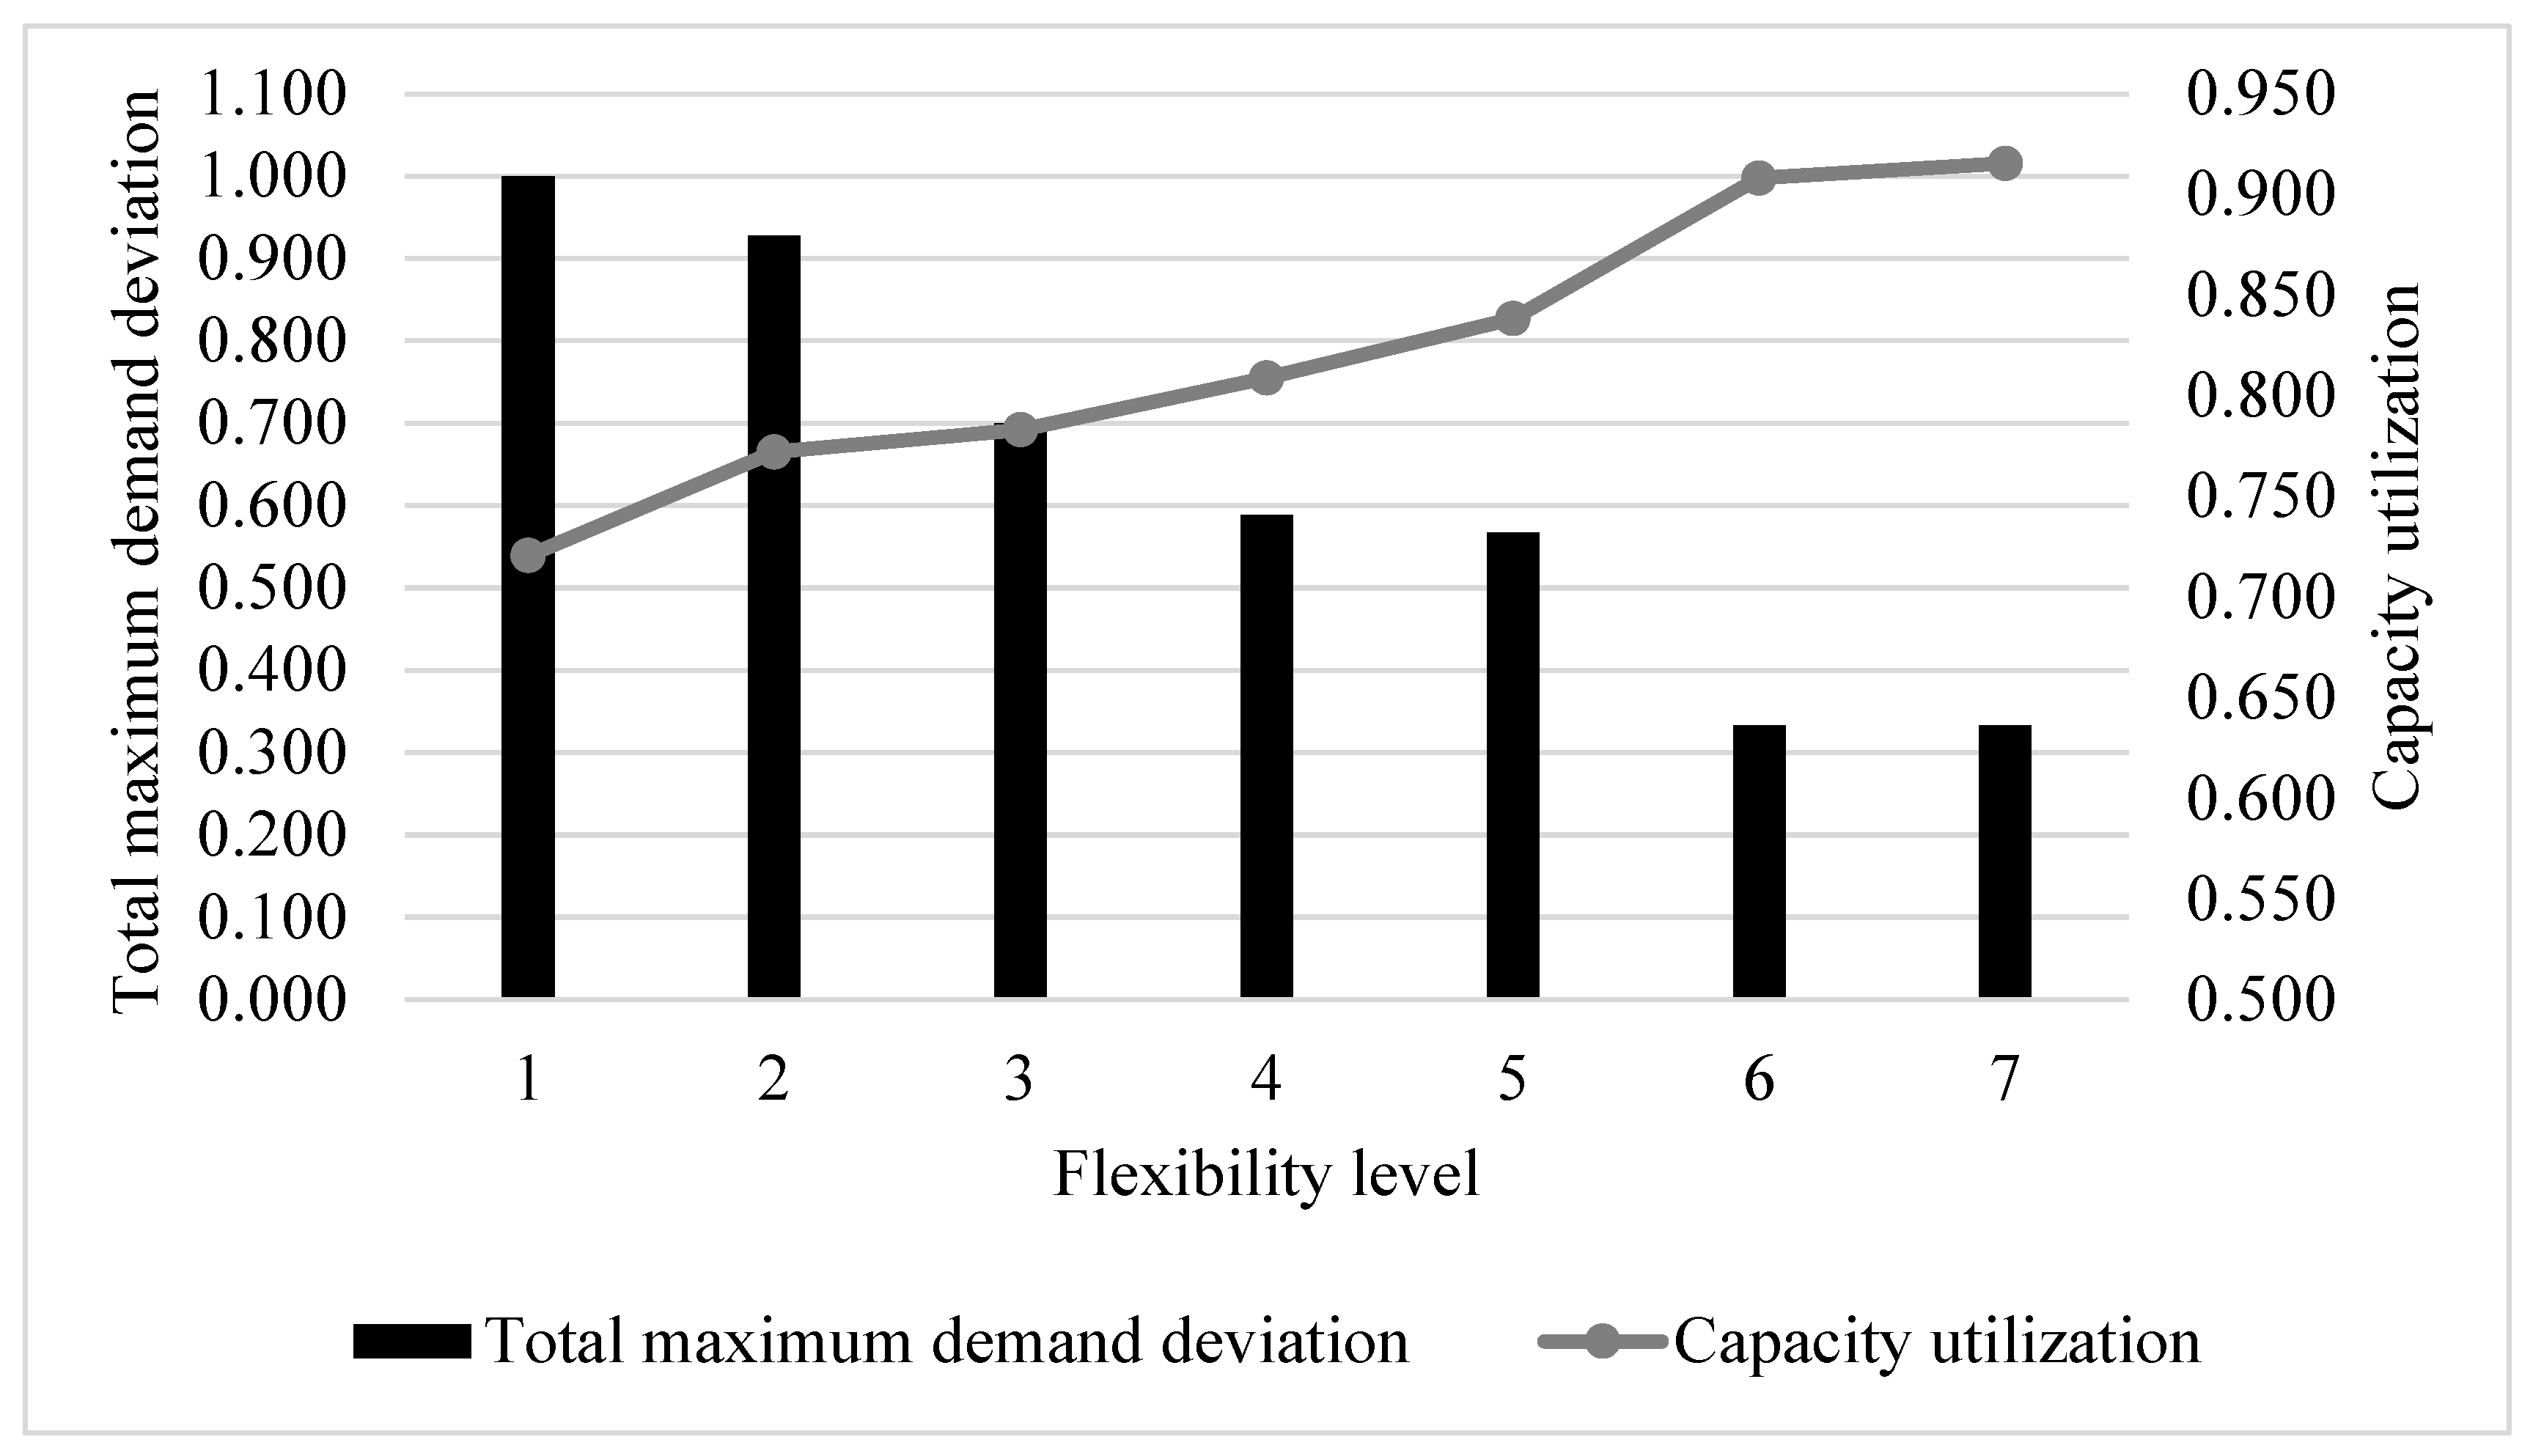
Figure 3.
Simultaneous impact of workload balance and flexibility level on demand deviation.
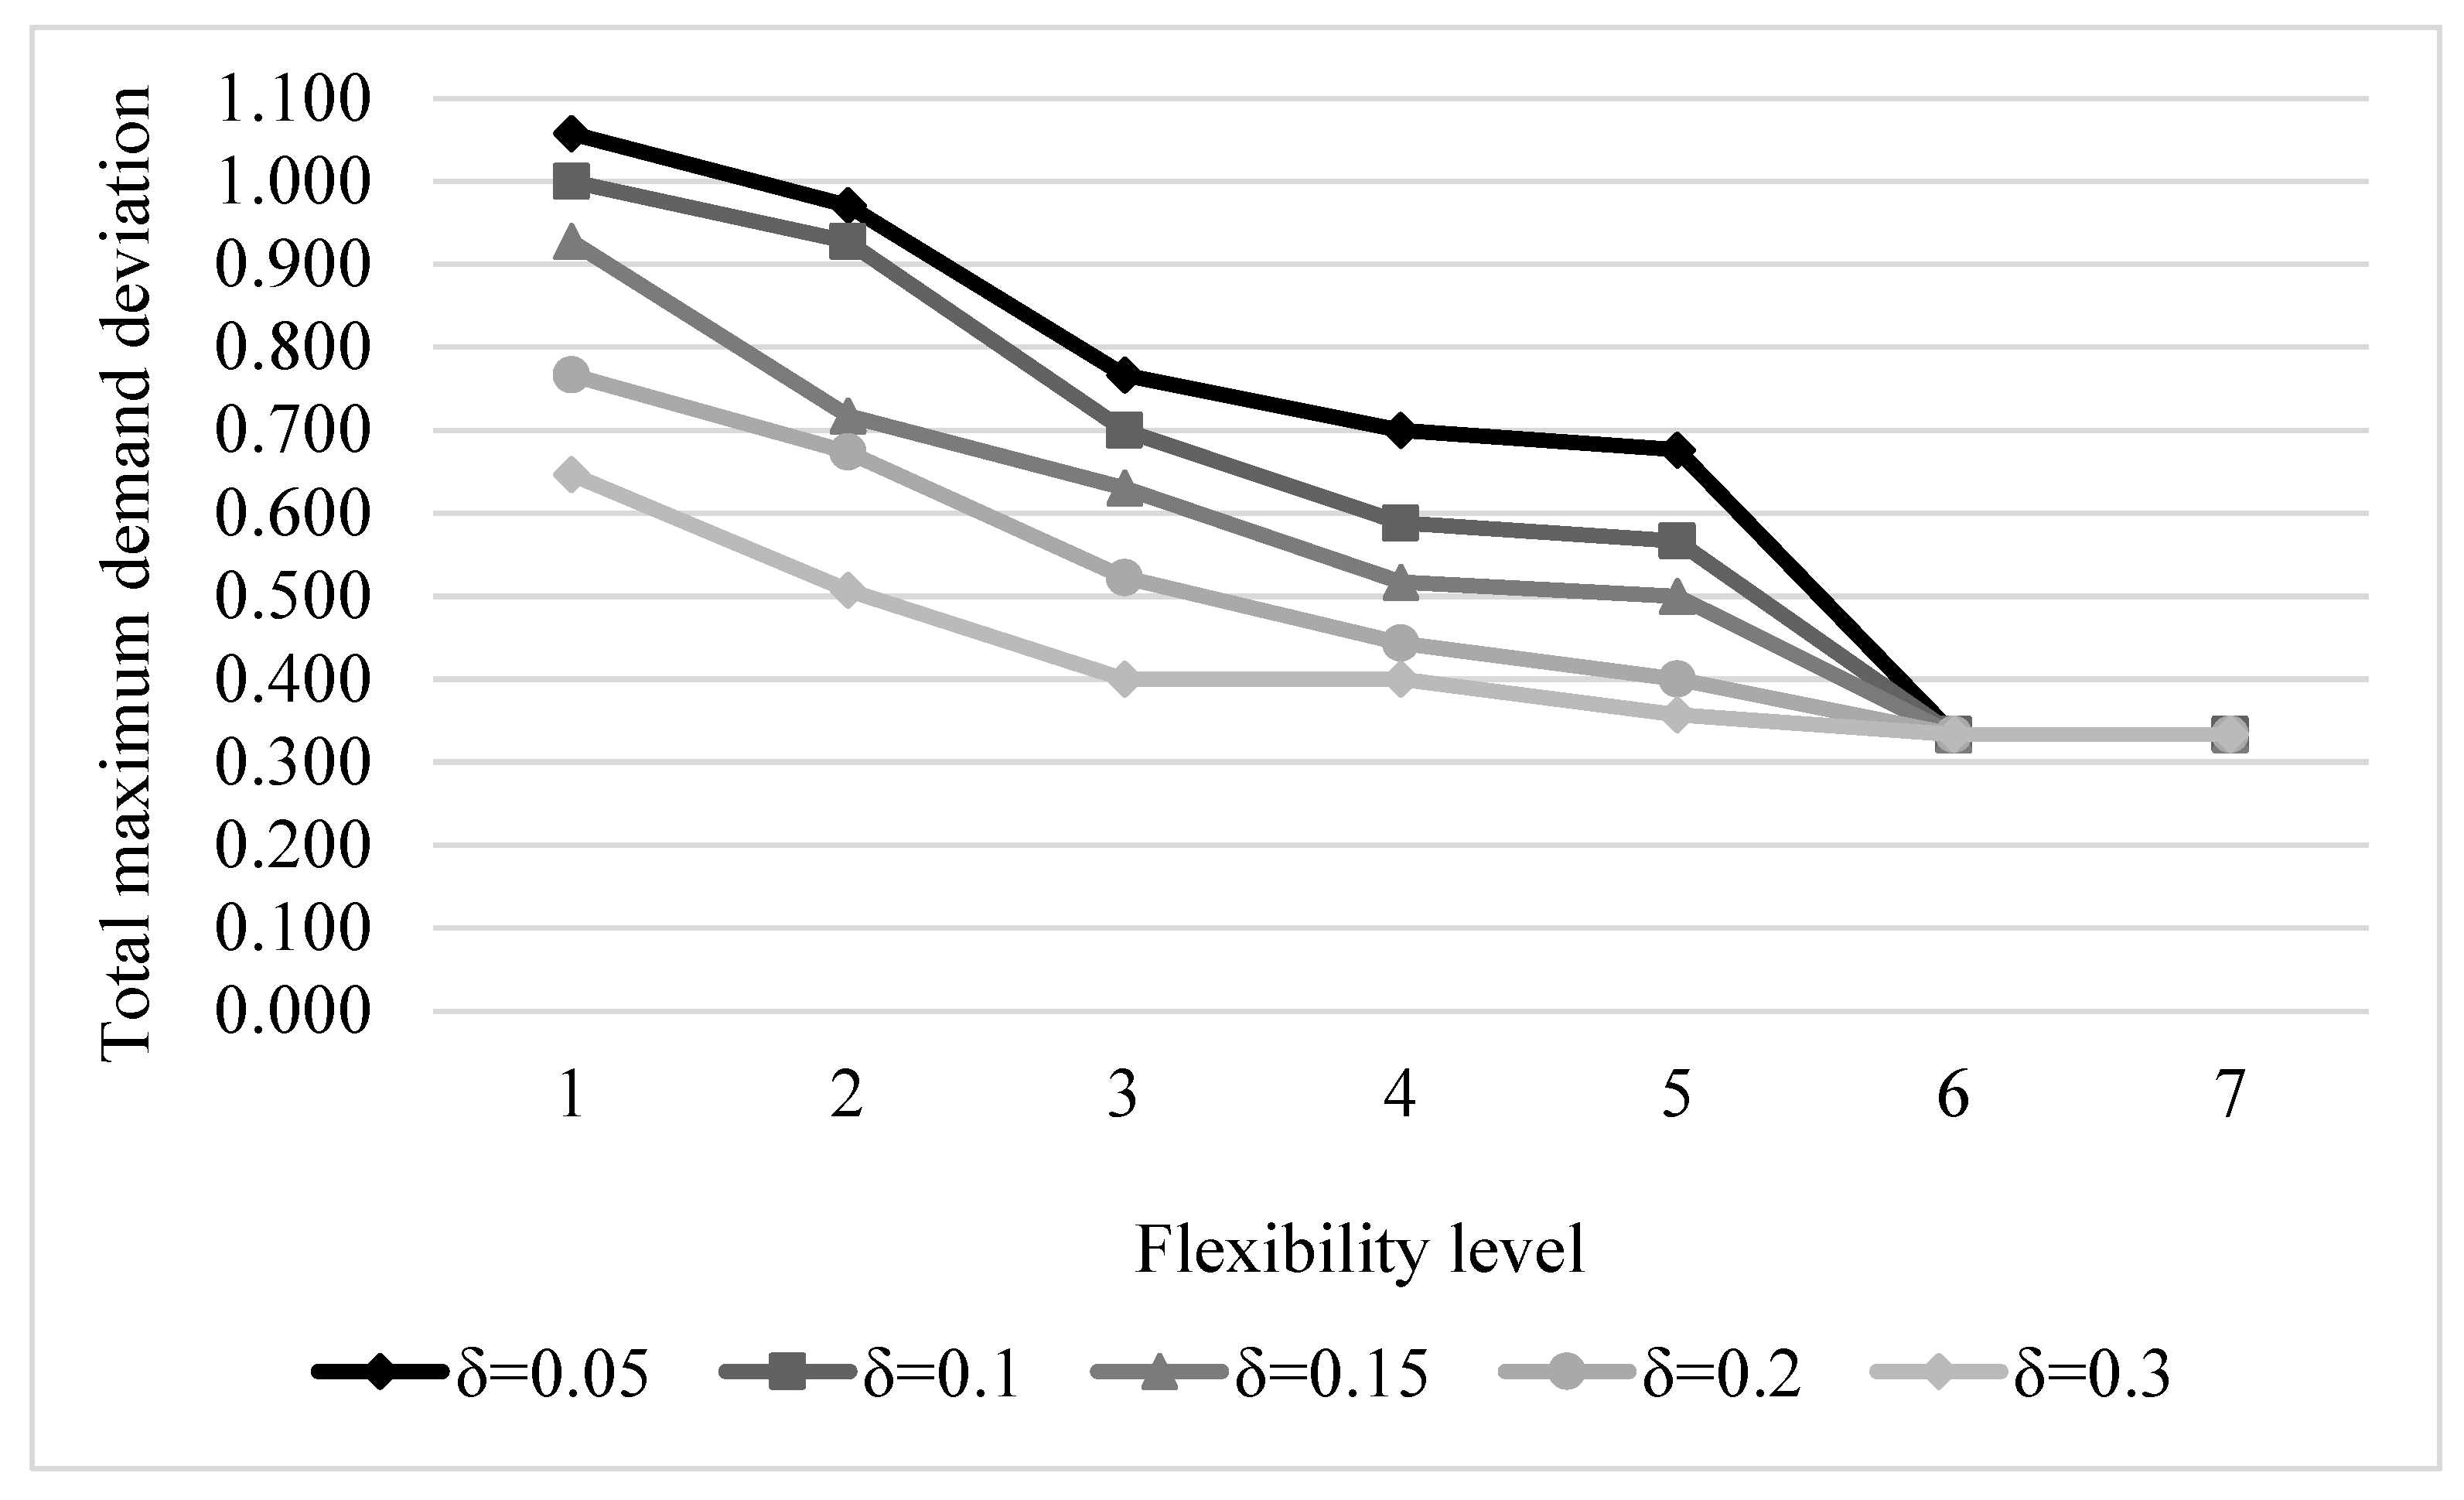
Figure 4.
Simultaneous impact of workload balance and flexibility level on capacity utilization.


Table 1.
Weekly demand distribution across cancer types.
| Cancer | New Patients | Returning Patients |
|---|---|---|
| Benign hematology | Poisson (9.45) | Binomial (40, 0.82) |
| Blood | Poisson (2.31) | Binomial (36, 0.84) |
| Breast | Poisson (2.58) | Binomial (28, 0.81) |
| Colon | Poisson (3.58) | Binomial (28, 0.75) |
| Genitourinary | Poisson (0.80) | Binomial (25, 0.82) |
| Head and neck | Poisson (1.61) | Binomial (17, 0.75) |
| Lung | Poisson (1.26) | Binomial (25, 0.80) |
| Skin | Poisson (0.28) | Poisson (0.81) |
Table 2.
Oncologists’ current specialization mixes.
| Oncologist | Specialization Mix |
|---|---|
| 1 | Benign hematology, blood, breast, colon, genitourinary, lung, skin |
| 2 | Benign hematology, blood |
| 3 | Benign hematology, blood, colon |
| 4 | Breast, colon |
| 5 | Benign hematology, genitourinary, lung |
| 6 | Benign hematology, genitourinary, head and neck, lung, skin |
| 7 | Breast, colon |
Table 3.
Oncologists’ weekly schedules and capacities.
| Clinic | Mon AM | Mon PM | Tue AM | Tue PM | Wed AM | Wed PM | Thu AM | Thu PM | Fri AM | |
|---|---|---|---|---|---|---|---|---|---|---|
| Oncologist | ||||||||||
| 1 | No Clinic | 7 | 8 | 7 | No Clinic | 8 | 8 | No Clinic | 7 | |
| 2 | No Clinic | No Clinic | No Clinic | 13 | No Clinic | No Clinic | 13 | 13 | No Clinic | |
| 3 | 13 | 13 | No Clinic | No Clinic | 13 | No Clinic | No Clinic | No Clinic | No Clinic | |
| 4 | No Clinic | No Clinic | No Clinic | 12 | 13 | No Clinic | No Clinic | 12 | No Clinic | |
| 5 | No Clinic | 13 | No Clinic | No Clinic | 13 | No Clinic | No Clinic | 13 | No Clinic | |
| 6 | 13 | No Clinic | 13 | No Clinic | No Clinic | 13 | No Clinic | No Clinic | 13 | |
| 7 | No Clinic | No Clinic | 12 | No Clinic | No Clinic | No Clinic | 12 | No Clinic | 12 | |
Table 4.
Number of specializations assigned to each oncologist.
| Oncologist | ||
|---|---|---|
| 1 | 1 | 3 |
| 2 | 2 | 2 |
| 3 | 3 | 3 |
| 4 | 2 | 2 |
| 5 | 3 | 3 |
| 6 | 1 | 3 |
| 7 | 2 | 2 |
Table 5.
Patient loss and demand deviation from the supply target.
| Cancer | New Patients | Returning Patients | ||
|---|---|---|---|---|
| Num. of Unserved Patients | Num. of Unserved Patients | |||
| Benign hematology | 4 | 0.286 | 1 | 0.027 |
| Blood | 1 | 0.200 | 1 | 0.029 |
| Breast | 1 | 0.200 | 1 | 0.038 |
| Colon | 2 | 0.286 | 1 | 0.040 |
| Genitourinary | 1 | 0.333 | 1 | 0.043 |
| Head and neck | 1 | 0.250 | 0 | 0.000 |
| Lung | 1 | 0.333 | 1 | 0.043 |
| Skin | 0 | 0.000 | 0 | 0.000 |
Table 6.
Optimal oncologist specialization mix.
| Oncologist | Specialization Mix |
|---|---|
| 1 | Blood, genitourinary, lung |
| 2 | Benign hematology, blood |
| 3 | Benign hematology, blood, colon |
| 4 | Breast, colon |
| 5 | Benign hematology, genitourinary |
| 6 | Benign hematology, head and neck, lung, skin |
| 7 | Breast, colon |
Table 7.
Clinic utilizations.
| Clinic | Mon AM | Mon PM | Tue AM | Tue PM | Wed AM | Wed PM | Thu AM | Thu PM | Fri AM | ||
|---|---|---|---|---|---|---|---|---|---|---|---|
| Oncologist | |||||||||||
| 1 | 0.857 | 0.857 | 0.857 | 0.857 | 0.857 | 0.857 | 0.857 | ||||
| 2 | 0.846 | 0.917 | 0.923 | 0.895 | |||||||
| 3 | 0.846 | 0.923 | 0.923 | 0.897 | |||||||
| 4 | 0.917 | 0.833 | 0.909 | 0.886 | |||||||
| 5 | 0.917 | 0.917 | 0.846 | 0.892 | |||||||
| 6 | 0.917 | 0.833 | 0.917 | 0.917 | 0.896 | ||||||
| 7 | 0.909 | 0.909 | 0.818 | 0.879 | |||||||
Table 8.
Required specialization mix for a new hire.
| Case | [L, U] | Specialization Mix |
|---|---|---|
| 1 | [1, 2] | Blood, breast |
| 2 | [1, 3] | Blood, breast, skin |
| 3 | [1, 8] | Blood, breast, skin |
| 4 | [2, 3] | Blood, genitourinary, skin |
| 5 | [2, 4] | Blood, genitourinary, skin |
Table 9.
Impact of on patient loss and demand deviation from the supply target.
| Cancer | ||||||||
|---|---|---|---|---|---|---|---|---|
| Benign Hematology | 0.786 | 0.622 | 0.286 | 0.000 | 0.286 | 0.000 | 0.286 | 0.000 |
| Blood | 0.800 | 0.618 | 0.400 | 0.088 | 0.200 | 0.000 | 0.200 | 0.000 |
| Breast | 0.800 | 0.615 | 0.400 | 0.000 | 0.200 | 0.000 | 0.200 | 0.000 |
| Colon | 0.714 | 0.480 | 0.286 | 0.000 | 0.286 | 0.000 | 0.143 | 0.000 |
| Genitourinary | 0.667 | 0.565 | 0.333 | 0.130 | 0.333 | 0.000 | 0.333 | 0.000 |
| Head and Neck | 0.750 | 0.600 | 0.250 | 0.000 | 0.250 | 0.000 | 0.250 | 0.000 |
| Lung | 0.667 | 0.522 | 0.333 | 0.000 | 0.333 | 0.000 | 0.333 | 0.000 |
| Skin | 0.000 | 0.500 | 0.000 | 0.000 | 0.000 | 0.000 | 0.000 | 0.000 |
Table 10.
Investigated flexibility levels.
| Flexibility Level | Description |
|---|---|
| 1 | Oncologists can see at least one cancer type |
| 2 | Oncologists can see at most two cancer types |
| 3 | Oncologists can see at most three cancer types |
| 4 | Oncologists can see two to three cancer types |
| 5 | Oncologists can see two to four cancer types |
| 6 | Current specialization flexibility |
| 7 | Fully flexible specialization mix |
Table 11.
Impact of flexibility level on patient loss and demand deviation from the supply target.
| Cancer | Level 1 | Level 2 | Level 3 | Level 4 | ||||
| Benign hematology | 0.500 | 0.000 | 0.357 | 0.000 | 0.500 | 0.189 | 0.500 | 0.081 |
| Blood | 0.400 | 0.265 | 0.400 | 0.118 | 0.400 | 0.176 | 0.400 | 0.088 |
| Breast | 0.400 | 0.231 | 0.600 | 0.154 | 0.400 | 0.077 | 0.400 | 0.077 |
| Colon | 0.429 | 0.320 | 0.429 | 0.240 | 0.286 | 0.000 | 0.429 | 0.080 |
| Genitourinary | 0.667 | 0.304 | 0.667 | 0.261 | 0.333 | 0.174 | 0.333 | 0.087 |
| Head andneck | 0.500 | 0.333 | 0.500 | 0.200 | 0.500 | 0.200 | 0.500 | 0.067 |
| Lung | 0.333 | 0.000 | 0.333 | 0.000 | 0.333 | 0.000 | 0.333 | 0.000 |
| Skin | 0.000 | 0.000 | 0.000 | 0.000 | 0.000 | 0.000 | 0.000 | 0.000 |
| Cancer | Level 5 | Level 6 | Level 7 | |||||
| Benign hematology | 0.500 | 0.027 | 0.286 | 0.000 | 0.286 | 0.000 | ||
| Blood | 0.400 | 0.059 | 0.200 | 0.000 | 0.200 | 0.000 | ||
| Breast | 0.400 | 0.000 | 0.200 | 0.000 | 0.200 | 0.000 | ||
| Colon | 0.429 | 0.000 | 0.143 | 0.000 | 0.143 | 0.000 | ||
| Genitourinary | 0.333 | 0.000 | 0.333 | 0.000 | 0.333 | 0.000 | ||
| Head and neck | 0.500 | 0.067 | 0.250 | 0.000 | 0.250 | 0.000 | ||
| Lung | 0.333 | 0.043 | 0.333 | 0.000 | 0.333 | 0.000 | ||
| Skin | 0.000 | 0.000 | 0.000 | 0.000 | 0.000 | 0.000 | ||
Disclaimer/Publisher’s Note: The statements, opinions and data contained in all publications are solely those of the individual author(s) and contributor(s) and not of MDPI and/or the editor(s). MDPI and/or the editor(s) disclaim responsibility for any injury to people or property resulting from any ideas, methods, instructions or products referred to in the content. |
© 2024 by the authors. Licensee MDPI, Basel, Switzerland. This article is an open access article distributed under the terms and conditions of the Creative Commons Attribution (CC BY) license (https://creativecommons.org/licenses/by/4.0/).
Share and Cite
MDPI and ACS Style
Keshtzari, M.; Norman, B.A. Capacity Allocation in Cancer Centers Considering Demand Uncertainty. Sci 2024, 6, 22. https://doi.org/10.3390/sci6020022
AMA Style
Keshtzari M, Norman BA. Capacity Allocation in Cancer Centers Considering Demand Uncertainty. Sci. 2024; 6(2):22. https://doi.org/10.3390/sci6020022
Chicago/Turabian StyleKeshtzari, Maryam, and Bryan A. Norman. 2024. "Capacity Allocation in Cancer Centers Considering Demand Uncertainty" Sci 6, no. 2: 22. https://doi.org/10.3390/sci6020022