Abstract
The Russian Black Pied (RBP) is one of Russia’s most popular dairy cattle breeds. It was developed in the USSR during the 1930s by crossing Russian native cattle with Dutch cattle. Since the mid-1970s, the RBP has been cross-bred with Holstein cattle to enhance milk production. To trace haplotypes and selection signatures in the RBP genomes formed during cross-breeding and selection, we conducted local ancestry inference and scans for selection signatures in 12 resequenced RBP animals. Scans for selection using hapFLK and window-based FST identified 65 putatively selected regions across the genome, with 4 identified by both methods. Candidate missense variants were detected within these regions, including KIAA1755, CNBD1, and MPZL3, which may be related to milk traits, pathogen resistance, and climate adaptation. Local ancestry inference and functional annotation analyses suggest that regions with a higher fraction of native haplotypes are enriched for genes associated with keratin filaments, antimicrobial defence, the immune system, protein digestion, and amino acid transporters. The results of our study could be utilised for conservation purposes and the improvement of this and other breeds.
1. Introduction
Cattle are a vital milk, meat, and draft power source worldwide. In modern Russian animal husbandry, cattle farming primarily focuses on milk production, with dairy and dual-purpose pedigree herds numbering 2.6 million head (compared to 0.3 million for beef herds) in 2023 [1,2]. One of the most popular dairy breeds is the Russian Black Pied (RBP). This breed was developed in the USSR during the 1930s by crossing local Russian cattle from various climate zones with imported breeds of Dutch origin, primarily the Dutch Black Pied [3,4]. Since the mid-1970s, the cross-breeding of the RBP with the Holstein breed, commonly referred to as “Holsteinisation”, has occurred with the intention of increasing milk productivity [3,4]. Consequently, the RBP now possesses a significant proportion of the Holstein ancestry [5,6]. Recently, many highly Holsteinised RBP populations have been officially recognised as Holstein. As a result, the proportion of the RBP in the national pedigree dairy herd decreased from 55.6% in 2015 to 17.6% in 2023 [1]. Concerns exist regarding the Holsteinisation of the RBP leading to the loss of unique, potentially adaptive alleles passed down from local cattle populations [5].
Despite extensive cross-breeding with Holstein, the RBP retains adaptive features inherent to Russian native cattle. For instance, in winter, the coat of the RBP provides superior thermal insulation properties compared to pure Holsteins [7,8]. Also, the comparative genetic data suggest that the RBP harbours alleles conferring genetic resistance to leucosis development at higher frequencies than the Holstein breed [9]. Given the complex origin of the RBP, uncovering the changes in their genome resulting from cross-breeding and follow-up selection could be essential for conservation purposes and genetic improvement of this breed.
One approach to detecting such genetic changes is scanning for signatures of selection. Selection signatures are genomic footprints left by artificial or natural selection. Examples include shifts in allele or haplotype frequencies in extreme cases, resulting in runs of homozygosity and longer haplotypes at the selected sites [10]. The analyses for signatures of selection in cattle breeds that are exceptionally adapted to their environments or chosen for productive characteristics offer insights into the genetic foundation of their distinctive traits. For instance, a study on Yakut, the northernmost cattle breed, revealed a unique breed-specific amino acid change in the highly conserved NRAP gene. This mutation was absent from other cattle breeds but present in every Yakut cattle individual. Moreover, this mutation was also observed in 16 species of hibernating or cold-adapted mammals across six distinct phylogenetic orders, marking the only documented case of convergent evolution at the amino acid level shared between a single breed and multiple wild animals [11]. Signatures of selection scans in the Wagyu breed, famous for its top-quality marbled meat, pointed to several candidate genes for marbling (DGAT1, IQGAP2, RSRC1, DIP2B [12], ZPLD1, KLF2, GPCPD1, SLC25A10, GAA, KLF13, and LRP2BP [13]). It should be noted, however, that methods for detecting selection signatures may demonstrate reduced statistical power when applied to admixed populations [14,15]. An alternative approach widely employed for analysing the genomes of admixed populations is local ancestry inference (LAI). This type of analysis facilitates the genome-wide identification of the genetic origins of chromosomal segments in admixed individuals. At the population level, genomic regions exhibiting deviating ancestry proportions may indicate selection [16].
The roots of the LAI analysis can be traced back to early attempts to ascertain the ancestry of hybrid populations, which initially relied solely on morphology. For instance, in a 1937 paper, Bisschop analysed various morphological traits of African Sanga cattle (hump, thighs, hindquarters, rump, skeleton, etc.) and argued that the Sanga originated from cross-breeding between long-horned Zebu and humpless Egyptian long-horned cattle [17]. Later, genetic markers such as blood groups and protein polymorphisms allowed for a more detailed study of the ancestry of populations. Stormont and colleagues (1986), for example, analysed blood groups (B system phenogroups) in Beefalo cattle, a hybrid of bison (Bison bison) and domestic cattle, concluding that Beefalo was primarily derived from Charolais, Angus, and Hereford breeds. Simultaneously, gel electrophoresis of blood proteins (haemoglobin, transferrin, and carbonic anhydrase) revealed very few bison-specific markers in the Beefalo population. This contradicts the widely accepted assertion that Beefalo cattle have three-eighths bison ancestry [18]. Interestingly, a recent genomic study confirmed the latter result, revealing that most Beefalo animals exhibit no detectable bison ancestry. Their phenotypic resemblance to bison is likely due to an indicine component [19].
The introduction of new genetic markers, including microsatellites, restriction fragment length polymorphisms, and single-nucleotide polymorphisms (SNPs), along with significant advancements in high-throughput SNP genotyping technologies, has facilitated the development of software tools capable of estimating the ancestry proportions for specific individuals. Among these tools, STRUCTURE and ADMIXTURE have likely emerged as the most widely utilised [20]. Their invention provided insights into the genetic histories of various human, animal, and plant populations. In cattle studies, their utilisation helped clarify the origin and genetic composition of European, African, Russian, Iranian, Chinese, Indian, and numerous other native breeds [6,21,22,23,24,25,26]. The aforementioned tools were designed to estimate global ancestry. Meanwhile, the development of tools for local ancestry inference has lagged slightly behind, as this type of analysis heavily depends on high SNP density [27]. Consequently, the increase in density of SNP arrays in the late 2000s and the growing availability of whole-genome sequencing in the early 2010s accelerated the creation of several software tools for LAI analysis, with RFMix [28] probably becoming the most popular.
In studies of hybrid cattle populations, the LAI analysis allowed for identifying genomic regions where ancestry fractions significantly deviated from their genome-wide averages, presumably due to artificial selection or genetic adaptation (e.g., [29,30,31,32]). The most significant finding in cattle discovered through the LAI approach is the evidence for mitonuclear coadaptation in African hybrid indicine × taurine populations. Despite extensive admixture, all African hybrid cattle populations possess a taurine mitochondrial genome. By employing LAI analysis, Ward and colleagues (2022) demonstrated that the nuclear genes encoding mitochondrial proteins have a notably higher proportion of taurine ancestry than the rest of the genome in these populations. The authors concluded that this phenomenon supports the hypothesis of incompatibility between the indicine nuclear genome and the taurine mitochondrial genome [33]. Overall, the LAI approach is applicable in various research fields, ranging from genome-wide association studies to investigations of epistatic interactions and gene regulation [34,35,36].
It can be concluded that contemporary bioinformatics methods now facilitate uncovering genomic changes in admixed populations resulting from cross-breeding and subsequent selection. With this in mind, we conducted local ancestry inference and scans for signatures of selection in the Russian Black Pied cattle using whole-genome resequencing data.
2. Materials and Methods
2.1. Data Preparation
The key steps of our analytical workflow are illustrated in Figure 1. Twenty-four Russian Black Pied (RBP) cattle individuals were genotyped on the GGP HD150K array (~139,000 SNPs) at Neogen Europe Ltd. (Ayr, UK) in our earlier work [6]. Among them, eleven animals were excluded from the analysis as they had second-degree relatives in the sample, as indicated by PI_HAT statistics (>0.25) produced by PLINK v.1.9 software (using the “--genome” option) [37]. This step aims to ensure the representativeness of the samples for further resequencing, which is compromised in the presence of close relatives (as the same chromosomal segments are sequenced multiple times). The remaining thirteen animals were resequenced using Hiseq4000 technology at Novogene Co., Ltd. (Hong Kong, China) for approximately 50 Gbp each. The raw resequencing data were processed following the “Fastq to GVCF guidelines” of the 1000 Bull Genomes Project (1KBGP) [38].
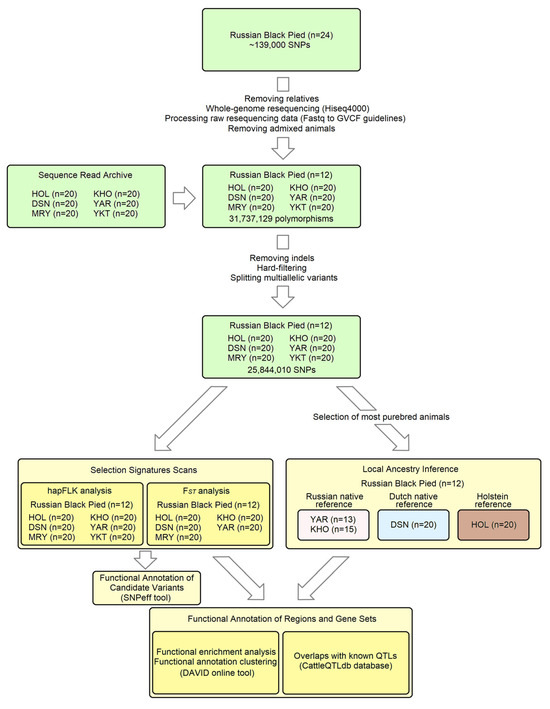
Figure 1.
The key steps of the analytical workflow.
To discover local ancestry and signatures of selection, we examined breeds genetically closest to the RBP. We utilised the 1KBGP set of genomes, which contains whole-genome resequencing data from over 5000 animals of taurine cattle breeds worldwide [39]. The 1KBGP and our RBP data were combined using the following procedure: The gVCF files of RBP individuals and gVCFs of over 500 additional animals from 29 breeds mapped against the same reference genome (ARS-UCD1.2) were merged using the GenotypeGVCFs module of the GATK v.3.8-1-0-gf15c1c3ef package [40]. These samples from diverse taurine breeds were used to reduce potential ascertainment bias when identifying polymorphic sites, which could influence our selection of related breeds [41]. In the resulting VCF file, only SNPs were retained (GATK options “-T SelectVariants -selectType SNP”), which were subsequently filtered by the VariantFiltration GATK module using the hard-filtering parameters “QD < 2.0||FS > 60.000|| MQ < 40.00||MQRankSum < −12.5||ReadPosRankSum < −8.0” adopted from GATK Best Practices [42]. Another commonly used filtering option for GATK is the variant quality score recalibration (VQSR) method, which relies on a machine learning algorithm [43]. Simulations show that VQSR outperforms hard filtering when retaining true variants but has a similar or even higher fraction of false positives [44]. The VQSR requires well-curated databases of known genetic variants currently lacking for cattle. The multiallelic SNPs were split into biallelic variants using BCFtools version 1.11 (“norm -m -any” option) [45]. The dataset was LD-pruned using PLINK v.1.9 software with the “--indep-pairwise 100 kb 100 0.2” option. The thirteen RBP animals were extracted using the “--keep” option, and the resulting file, containing approximately 62,000 SNPs, was merged with the 1KBGP set using the “--merge-list --keep-allele-order” option. This combined dataset was employed to analyse population structure using ADMIXTURE software v.1.3.0, with a cluster range (K) of 2–12 [46] and measuring population differentiation (FST [47]) between RBP and 1KBGP breeds using the EIGENSTRAT package [48]. Based on the results of these analyses (Figure S1, Table S1), the five breeds closest to the RBP were selected: Holstein–Friesian (HOL), German Black Pied (Deutsche Schwarzbunte Niederungsrind, DSN), Meuse–Rhine–Yssel (MRY), Kholmogory (KHO), and Yaroslavl (YAR).
Resequencing data for the breeds HOL, DSN, MRY, KHO, YAR, and YKT (in which Yakut cattle were used as a genetically distant outgroup in the hapFLK analysis) were downloaded from the Sequence Read Archive database [49], with a focus on samples with the highest genome coverage. As a quality control step, we processed the raw resequencing data to generate autosomal VCF files containing high-quality biallelic SNPs, as previously described. Following LD pruning, ADMIXTURE analysis was conducted to exclude putatively admixed or misidentified individuals. As a result, for each of the breeds mentioned above, we selected the twenty most purebred samples with the highest genome coverage (see Table S2 for IDs). One admixed animal was excluded from subsequent analysis in the Russian Black Pied breed. The chosen gVCF files of the RBP (n = 12) and six additional breeds (n = 20 × 6 = 120) were merged using the GenotypeGVCFs module of GATK. The resulting VCF file comprised 31,737,129 polymorphic sites (SNPs and indels). After removing indels, applying a hard-filtering procedure, and splitting multiallelic variants, 25,844,010 SNPs were kept.
2.2. Scans for Selection Signatures
We conducted scans for signatures of selection in the genomes of the RBP using hapFLK and FST methods. For the hapFLK analysis, the dataset was filtered for minor allele frequency and call rate in PLINK v.1.9 (--maf 0.1 --geno 0.1). The number of haplotype clusters (K) was estimated using fastPhase software v.1.2 [50]. HapFLK v.1.4 software [51] was run with the following parameters: “--K 30 --nfit=30 --kfrq”. This analysis was conducted for the set involving the RBP and closely related breeds, with YKT serving as the outgroup. P-values were calculated using the “rlm” function from the “MASS” R package [52], assuming a normal distribution for the hapFLK statistic values. The correction for multiple testing was performed using the “qvalue” R package [53]. In our analysis, we considered the putatively selected regions as those containing at least one SNP with a q-value < 0.01. The upstream and downstream boundaries were defined by the first SNP with a q-value > 0.2. To identify breeds under selection, haplotype diversity plots and local trees were visualised using scripts provided with hapFLK (hapflk-clusterplot.R, local_reynolds.py, and local_trees.R).
The FST between the RBP and the combined set of five closely related breeds was calculated for sliding windows and individual SNPs using VCFtools software v.0.1.13 [54]. The window-based analysis was performed using the options “--fst-window-size 50000 --fst-window-step 25000 --max-missing 0.9”. The single-point analysis was carried out without the options mentioned above. It was restricted to SNPs with an overall call rate of at least 90% and at least 80%, specifically in the RBP. Windows containing fewer than 100 SNPs were excluded, and the top 0.1% of weighted FST windows were chosen as candidates. For individual SNPs, those with FST > 0.4 and annotated by the SNPeff tool [55] as missense and nonsense substitutions, start-and-stop codon losses, and splice acceptor and donor variants were considered candidates. Where needed, the linkage disequilibrium between variants was estimated with PLINK v.1.9 (“--ld” option).
Duplicated regions in a genome may result in the detection of false-positive SNP sites and create an apparent excess of heterozygotes [56,57]. Therefore, to account for the potential influence of duplications on selection scans, we also searched for copy number variants (CNVs) in the genomes of the RBP using the “cn.MOPS” R package [58] in the windows of 700 SNPs. The identified CNVs were merged into CNV regions (CNVRs) with the “bedmap” function of the BEDOPS toolkit v.2.4.41 [58] using at least 50% reciprocal overlap in at least two animals. The putatively selected regions, with over 10% of their length covered by duplications, were excluded from the analysis. Additionally, we excluded candidate SNPs identified through single-point FST analysis that were found within duplications.
2.3. Local Ancestry Inference (LAI)
RFMix [28] has probably been the most used local ancestry inference (LAI) analysis method for many years. The Gnomix algorithm was recently developed and claims to outperform RFMix in accuracy [59]. We performed population genetics simulations with AdmixSim software v.2 [60] to choose between these algorithms. In brief, we simulated a hybrid population (n = 1000) with ancestry fractions of 80%, 10%, and 10% based on three different breeds from the 1KBGP, allowing it to “evolve” over twenty generations. For one of the two breeds with a minor contribution, we additionally simulated admixture (50%) with various 1KBGP breeds to emulate an impure reference. Next, we ran RFMix and Gnomix on the hybrid population using one admixed and two pure reference populations. RFMix was executed with the “--reanalyze-reference” option, which is suitable for admixed reference (https://github.com/slowkoni/rfmix/blob/master/MANUAL.md (accessed on 27 May 2024)). Gnomix was employed with the default parameters. We calculated the correlations between the simulated and detected ancestry fractions in the genomes of the hybrid population for both methods. As a result, Gnomix outperformed RFMix in revealing components with admixed (r = 0.66 vs. 0.10) and pure (0.87 vs. 0.24, 0.84 vs. 0.31) references. Following this, we explored different options in Gnomix to maximise the correlation. The best result was obtained with the “calibrate: True” option, surpassing the default parameters (for admixed reference: 0.76 vs. 0.66; for pure references: 0.90 vs. 0.87, 0.89 vs. 0.84).
The history of the RBP breed indicates that its genome is expected to include three major components inherited from Russian local cattle, Dutch local breeds, and Holsteins. Therefore, we employed three reference panels for analysis. The panel for the Russian native component (n = 28) comprised the most purebred animals from YAR (n = 13) and KHO (n = 15). The DSN (n = 20) was the reference panel for Dutch native cattle ancestry. Holstein samples (n = 20) constituted the panel for Holstein ancestry. It is worth noting that Holsteins are related to the Dutch local breed known as Dutch Friesian (Dutch Black Pied) in the Netherlands or German Black Pied (DSN) in Germany [25,61]. However, after many generations of intensive selection, the Holstein breed has significantly diverged from its ancestral population [25], as our analysis shows (Figure S1). We also conducted principal component analysis (PCA) using PLINK v.1.9 software (“--pca” option) on an LD-filtered dataset (“--indep-pairwise 50_5_0.4” option resulting in approximately 824K SNPs) comprising close breeds (utilised for hapFLK analysis). Our PCA results confirm that DSN and Holstein individuals form two distinct, non-overlapping clusters (Figure S2). In light of this, we refer to the component in the RBP genome inherited directly from Dutch local breeds as “Dutch native” to differentiate it from the modern Holstein component. The VCF file was initially phased with Beagle v.5.4 [62] using a likelihood-based version of the genetic map from Qanbari and Wittenburg [63]. The Gnomix analysis was conducted using the “calibrate: True” option and the aforementioned genetic map.
2.4. Functional Annotation of Genome Regions and Gene Sets
We performed functional enrichment analyses and functional annotation clustering using the DAVID tool [64]. The annotation of selected genome regions with genes was conducted using the ARS-UCD1.2 Ensembl annotation file (https://ftp.ensembl.org/pub/release-110/gtf/bos_taurus/Bos_taurus.ARS-UCD1.2.110.gtf.gz (accessed on 5 September 2024)). As a result, all genes from this file were utilised as the background for the DAVID analyses. Functional enrichment analyses were carried out for three gene sets: (1) genes with >50% intersection with regions whose ancestries deviate from the genome-wide average; (2) genes with >50% intersection with putatively selected regions identified by window-based FST and/or hapFLK analyses; and (3) genes containing candidate variants identified by single-point FST analysis. We used q-value (FDR) = 0.05 in the functional enrichment analysis as the significance threshold. An enrichment score (ES) of >1.3 was applied as the cut-off threshold in our clustering analysis.
We searched for overlaps with known quantitative trait loci (QTLs) from CattleQTLdb [65] for the regions identified in the selection scans. To simplify the count of overlaps, if two or more QTLs for the same trait fell into a particular region, they were counted as a single QTL.
3. Results
3.1. Scans for Selection Signatures
A comprehensive list of regions identified in the RBP by hapFLK and window-based FST is presented in Table S3. The hapFLK analysis uncovered 20 regions (Figure 2A) that are putatively selected in the RBP breed, of which two overlapped with duplications and were thus excluded from further analysis. Of the remaining 18 regions, 9 are organised into clusters of 2 or 3 closely located regions on BTA2, BTA13, BTA14, and BTA15. Six regions exhibited selection signatures shared with another breed: three with MRY, two with HOL, and one with YAR (Table S3). Following the window-based FST analysis (Figure 2A), the top 99 intervals were combined into 53 non-overlapping regions, of which two were excluded due to excessive overlap with duplications. Four regions contained the intersection of the hapFLK and window-based FST results (Table S3). The single-point FST analysis (Figure 2A) identified 96 missense and 3 nonsense variants with FST > 0.4 (Table S4). One missense variant was discovered in a duplicated region and was subsequently excluded. Twelve missense mutations from six genes were identified in six putatively selected intervals, two overlapping between the hapFLK and window-based FST analyses (Table 1 and Table S5).
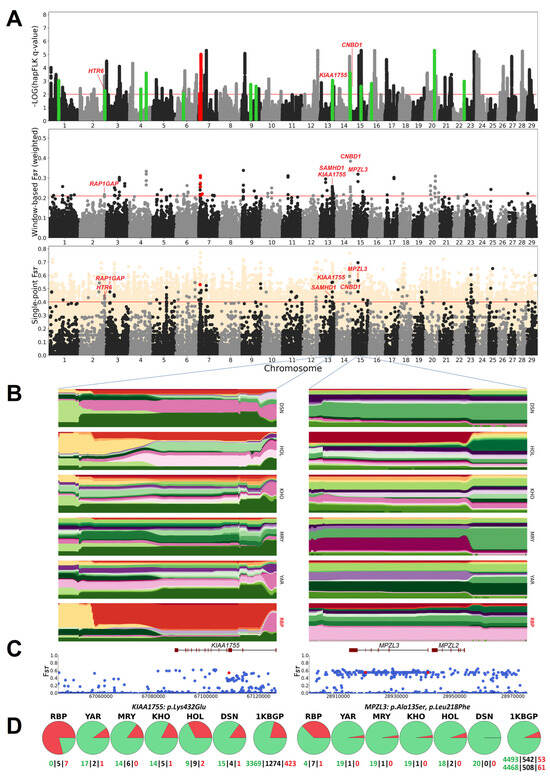
Figure 2.
(A) Manhattan plots for hapFLK, window-based, and single-point FST analyses of Russian Black Pied cattle. Variants and regions eliminated due to excessive overlap with duplications are highlighted in red. In the single-point FST analysis, a dark foreground indicates missense and nonsense substitutions, start-and-stop codon losses, and splice acceptor and donor variants, while a light background displays other variant types. (B,C) Haplotype diversity plots (B) and single-point FST values (C) for KIAA1755 and MPZL3 gene regions. The red dots denote candidate variants. (D) Pie charts depicting allele frequencies of the respective candidate variants in Russian Black Pied cattle, closely related breeds, and the 1KBGP. Green and red represent the reference and alternative alleles, respectively. The bottom of the charts indicates the numbers of homozygous and heterozygous animals.

Table 1.
Candidate missense variants from regions putatively selected in the Russian Black Pied (RBP) breed, their alternative allele frequencies in the RBP and closely related breeds, and the 1000 Bull Genomes Project (1KBGP).
The missense variants identified at the intersection of window-based FST and hapFLK methods are located in the KIAA1755 and CNBD1 genes. The KIAA1755 gene encodes an uncharacterised protein (https://www.genecards.org/cgi-bin/carddisp.pl?gene=KIAA1755 (accessed on 14 October 2024)). According to a genome-wide association study (GWAS) in Holstein cows, an SNP near the KIAA1755 gene is associated with a somatic cell score, an essential indicator of mastitis resistance [66]. Moreover, a transcriptome study revealed that KIAA1755 significantly upregulates its expression in the mammary glands during pregnancy in pigs and, consequently, may play a role in developing the swine mammary gland [67]. The missense variant from the KIAA1755 gene (BTA13:67108721, Lys432Glu, FST = 0.548) has an alternative allele frequency of 0.79 in the RBP, with all the animals being carriers. In five closely related breeds, this frequency does not exceed 0.33.
The CNBD1 gene encodes cyclic nucleotide-binding domain-containing protein 1, which has a poorly characterised function (https://www.genecards.org/cgi-bin/carddisp.pl?gene=CNBD1 (accessed on 14 October 2024)). There is evidence that the function of this gene in cattle is linked to pathogen resistance. Thus, according to a GWAS in German Black Pied cattle, CNBD1 is associated with faecal egg counts of gastrointestinal nematodes [68]. In another GWAS involving Holsteins, an SNP close to the CNBD1 gene was associated with susceptibility to Mycobacterium avium subsp. paratuberculosis infection [69]. In the RBP, the missense variant of the CNBD1 gene (BTA14:75438515, Asn275His, FST = 0.466) has an alternative allele frequency of 0.71 and a carrier rate of 0.92. In the other five breeds, its frequency does not exceed 0.33.
Other mutations are found in genes identified by window-based FST or hapFLK methods. Among these, the most prominent are two missense variants in the MPZL3 gene (BTA15:28919395, Leu218Phe, FST = 0.561; BTA15:28940819, Ala13Ser, FST = 0.561), located in the region with the highest weighted FST among those containing genes. The MPZL3 gene encodes myelin protein zero-like protein 3 (https://www.genecards.org/cgi-bin/carddisp.pl?gene=MPZL3 (accessed on 14 October 2024)), which is localised in the mitochondria. MPZL3 plays a role in various biological processes, including regulating the hair follicle cycle. According to Cao and colleagues (2007), a missense mutation in MPZL3 led to severe skin and hair abnormalities in mice [70]. Another study shows that the MPZL3 knockout mice developed sebaceous hypertrophy and hair loss [71]. The results relevant to cattle come from a study of the Tianzhu white yak (Bos grunniens), adapted to cold climates. The authors discovered that the MPZL3 gene regulates the hair follicle cycle in this species by performing a scan for RNA editing sites [72]. The two missense mutations in the MPZL3 gene identified in our study are in strong linkage disequilibrium (r2 = 1, D’ = 1) and exhibit the same frequencies in the RBP and closely related breeds. In the RBP, the alternative allele frequency for these variants is 0.38, with a carrier rate of 0.67. In other closely related breeds, the alternative alleles are either absent or present at low frequencies (0.03-0.05).
3.2. Local Ancestry Inference (LAI)
According to the LAI analysis (Figure 3, Table S6), the genome-wide average fractions of Russian native, Dutch native, and Holstein ancestries in the RBP genome were estimated to be 10.13%, 11.84%, and 78.03%, respectively. The ancestry fractions in certain regions largely deviated from these values. Thus, in the genomes of the RBP, 22.30 Mb (0.9% of the autosomal genome) and 9.65 Mb (0.39%) exhibited ≥50% of Russian and Dutch native ancestries, respectively. When combining these components (i.e., non-Holstein ancestry), 114.92 Mb (4.62%) contained ≥50%. Furthermore, 2.31 Mb (0.09%) had >90% non-Holstein ancestry. None of the regions were inherited 100% from Russian or Dutch native cattle. Considering local estimates for Holstein ancestry, 506.56 Mb (20.35%) had a fraction of >90%. Among this segment, 76.62 Mb (3.08%) were of 100% Holstein origin.
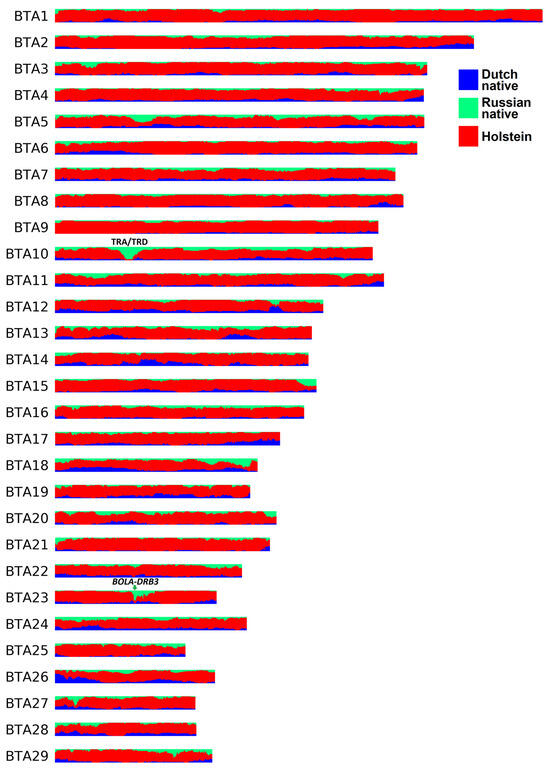
Figure 3.
The local ancestry plot for the Russian Black Pied breed.
Some regions in the RBP genome displayed a high proportion of segments from Russian native cattle, either alone or when combined with segments from Dutch native cattle. The only region exhibiting over 90% Russian native ancestry was identified on chromosome 10, covering over two megabases (23.18–25.25 Mb) (Figure 3). This interval broadly corresponds to the bovine TRA/TRD locus (22.2 Mb–25.9 Mb) [73]. In cattle, the TRA/TRD locus contains multiple T cell receptor alpha and delta genes playing a role in adaptive immunity [73,74]. Another region of interest is located on chromosome 23 and spans ~125 Kb (25.69–25.82 Mb) (Figure 3). More than 80% of haplotypes in this genomic interval match Russian or Dutch native cattle segments. This region contains the BOLA-DRB3 gene coding for bovine major histocompatibility complex class II. The BOLA-DRB3 polymorphisms are a known genetic factor for BLV infectivity, proviral load [75], and resistance/susceptibility to BLV-induced leucosis in cattle [76,77,78].
Based on the LAI results, we calculated ancestry fractions for putatively selected regions (Table S7). Of the 65 putatively selected areas, 16 exhibited over 90% Holstein ancestry. Four genes (H4C14, OR2D3G, HECA, and TXLNB) were identified within these intervals. One region detected by hapFLK (BTA1:47764970-47814477) displayed 100% Holstein ancestry with no annotated genes. None of the putatively selected regions had more than 50% Russian native or Dutch native origins, even when these components were combined.
3.3. Functional Annotation of Gene Sets
The functional enrichment in regions exhibiting ≥50% ancestry from Russian native cattle resulted in 117 statistically significant terms. The most prevalent among these were associated with keratin (“Keratin_II”, “keratinisation”, “keratin filament”, etc.), nucleases (“Nuclease”, “RNAse_Pc”, “RNA nuclease activity”, etc.), amino acid transporters (“AA_transporter”, “L-ornithine transmembrane transporter activity”, “AA/rel_permease1”, etc.), antimicrobial defence (“defence response to Gram-positive bacterium”, “Beta/alpha-defensin_C”, “Antibiotic”, etc.), the immune system (“MHC II”, “inhibitory MHC class I receptor activity”, “Intestinal immune network for IgA production”, etc.), protein digestion (“Aspartic_peptidase_A1”, “PEPTIDASE_A1”, “Protein digestion and absorption”, etc.), and sensory transduction (“olfactory receptor activity”, “sensory perception of smell”, “Sensory transduction”, etc.) (Table S8). The functional annotation clustering for the same regions produced 14 statistically significant clusters. The top cluster (ES = 20.6) included terms related to keratin and filaments. The second, third, and fourth top clusters primarily pertained to amino acid transporters (ES = 10.2), nucleases (ES = 8.6), and antimicrobial defence (ES = 6.9), respectively. Among the remaining clusters were those linked to the immune system (ES = 3.7 and 3.1), sensory transduction (ES = 3.1), and protein digestion (ES = 3) (Table S9). The functional enrichment analysis for regions showing ≥50% Dutch native ancestry resulted in 25 statistically significant terms. Most were linked to CRAL-TRIO and GOLD domains (“CRAL_TRIO_N”, “CRAL-TRIO_dom_sf”, “GOLD_dom”, “DOMAIN:GOLD”, etc.) and metabolism (“Metabolism of xenobiotics by cytochrome P450”, “Glutathione metabolism”, “Drug metabolism-other enzymes”, etc.) (Table S8). The functional annotation clustering for these regions resulted in two significant clusters also comprising terms related to CRAL-TRIO and GOLD domains (ES = 6.2) and metabolism (ES = 2.3) (Table S9).
The functional enrichment analysis for regions exhibiting >90% Holstein ancestry produced one significant term (“S_100”) (Table S8). The functional annotation clustering yielded eight clusters (Table S9). The top cluster primarily included terms associated with the small calcium-binding protein S100 (ES = 2.3). The second and third top clusters were related to chitinase activity (ES = 2) and motor proteins (ES = 1.7). The functional annotation for regions with 100% Holstein ancestry resulted in 14 significant terms related to the homeobox domain (“Homeobox_metazoa”, “DNA_BIND:Homeobox”, “Homeobox_CS”, etc.) and neurotransmission (“Neurotrans-gated_channel_TM”, “Neurotransmitter_ion_chnl_CS”, “Neur_channel”, etc.) (Table S8). The functional annotation clustering yielded two significant clusters: one comprised terms associated with the homeobox domain and RNA polymerase (ES = 2.7), and the other included terms related to neurotransmission (ES = 2.1) (Table S9). In addition, we conducted functional annotation for regions with <10% of the Holstein component (i.e., >90% of Russian native and Dutch native ancestries combined). The functional enrichment analysis resulted in twelve significant terms, related to the transmembrane transport of amino acids (“DOMAIN:Cationic amino acid transporter C-terminal”, “L-ornithine transmembrane transport”, “amino acid transmembrane transporter activity”, etc.) (Table S8). The functional annotation clustering produced no clusters with ES > 1.3.
The functional annotation analyses for window-based selection scan regions did not reveal enriched terms or clusters. The functional enrichment analysis based on genes identified in the single-point analysis yielded no significant terms. However, the functional annotation clustering based on this gene set revealed three significant clusters related to the cyclic nucleotide-binding domain (ES = 2), peptidases (ES = 1.7), and leucine-rich repeats (ES = 1.4) (Table S10).
The search for intersections with QTLs identified 36 out of 65 putatively selected consensus regions containing at least one QTL (Table S11). In CattleQTLdb, traits are categorised into higher-order groups. The most common were QTLs that fell into the categories of “Milk Association” (47 QTLs), “Reproduction Association” (14 QTLs), “Production Association” (9 QTLs), and “Meat and Carcass Association” (7 QTLs). Among the traits, the most prevalent were QTLs linked to “Milk protein yield” (6 QTLs), “Milk fat yield” (5 QTLs), “Conception rate” (4 QTLs), “Body weight” (4 QTLs), “Milk fat percentage” (4 QTLs), “Milk kappa-casein percentage” (4 QTLs), “Milk caproic acid content” (4 QTLs), and “Milk caprylic acid content” (4 QTLs).
4. Discussion
This study focused on determining the local ancestry inference in Russian Black Pied cattle genomes. We also conducted a scan for genome signatures of selection in this breed using whole-genome resequencing data. The primary conclusion from our study is that despite strong Holsteinisation, the genomes of the Russian Black Pied breed still retain high-frequency haplotypes likely inherited from Russian (and Dutch) native cattle. Genes in these regions are involved in the immune system and resistance to pathogens. Furthermore, we identified promising candidate genetic variants in putatively selected genomic regions that could be utilised in future studies examining the association between genotype, economically important traits, and adaptive traits in cattle, with potential applications in marker-assisted selection and gene editing.
Similar to our study, the research on composite Xinjiang Brown cattle, developed through crossing the commercial Swiss Brown dairy breed with local Kazakh cattle, demonstrates an excess of Kazakh haplotypes enriched in pathways related to bacterial and protozoan infections [29]. This suggests that links between native haplotypes and immune response are not exclusive to the Black Pied breed. Our observation that the immune response BOLA-DRB3 gene from the BoLA region originates from Russian or Dutch local cattle haplotypes aligns with a study of a heat-resistant composite Brangus (Angus/Brahman) breed, where the BoLA region was shown to be primarily inherited from tropical Brahman cattle [30]. One of the main reasons for creating composite breeds is to merge commercial breeds’ productivity with local cattle’s adaptive traits. The observed phenomenon confirms that this approach is effective at the genome-wide level.
Furthermore, our BOLA-DRB3 finding aligns well with comparative genetic data. In a study by Lazebnaya (2022), the overall frequency of BOLA-DRB3 alleles conferring resistance to bovine leucosis was found to be significantly higher in the RBP (0.29) compared to Holsteins (0.18), as summarised across several populations [9]. According to veterinary regulations in Russia, all animals displaying pathomorphological or haematological signs of bovine leucosis must be culled [79]. Therefore, it can be assumed that the BOLA-DRB3 locus in the RBP is experiencing purifying selection against alleles that predispose to leucosis, which have been introduced by the Holstein breed, in which they are more prevalent. The same could be speculated about the TRA/TRD locus for >90% originating from Russian native cattle and involved in adaptive immunity.
Apart from the immunity and pathogen resistance genes, the regions with an excess of Russian native haplotypes in our study demonstrate functional enrichments likely related to the climate adaptations of the Black Pied breed. The highest enrichment score was observed for the keratin filament category, with keratins being the primary component of cattle hair, affecting coat and horn characteristics and playing an essential role in adaptation to different climates [80]. This is supported by studies from Picard and colleagues (1999), who showed that the keratin sheath of horns in bovid species from lower temperate zones has lower thermal conductance than that of horns from the tropics, thus restricting heat loss in colder environments [81]. Other genomic studies imply the importance of keratin filament functional categories in the cold adaptation of cattle. This is supported by the study of CNVRs in Yakut and Kholmogory cattle breeds, both known for their cold adaptation, indicating that CNVRs shared between these two breeds involve genes enriched in terms related to keratin filaments [82]. A genome scan in Ladakhi cattle reared at high altitudes and exposed to extreme cold has revealed signatures of selection in genes coding for keratin proteins. Cattle adaptation to low temperatures relies on multiple features, including the insulative properties of skin and coat, thermoregulatory (shivering and non-shivering thermogenesis, piloerection, vasoconstriction, regulation of respiratory rate, etc.) and behavioural (huddling and changes in body posture) responses to cold [83]. Therefore, the enrichment of Russian native cattle haplotypes for other terms or clusters, such as those related to metabolism (amino acid transporters and protein digestion) or sensory transduction, may also be linked to adaptations to the harsh climate in the Russian Black Pied. On the other hand, the abovementioned metabolic terms/clusters might reflect the selection for productive traits Russian native cattle populations have experienced in the past. For example, amino acid transporters are necessary for cattle, other ruminants, and non-ruminant species to uptake amino acids from the gastrointestinal tract into the blood [84]. Similarly, protein digestibility in the bovine gastrointestinal tract is an economically important trait that differs significantly for various feedstuffs [85].
The regions in the RBP genome with the highest fractions of Holstein ancestry are enriched for terms and clusters that may be linked to economically important traits. Thus, the regions with >90% of Holstein haplotypes demonstrate enrichments related to the S100 proteins. These calcium-binding molecules are involved in various physiological processes [86]. In cattle, the S100 proteins are among the main components of the teat canal lining and are presumably involved in the resistance of cows to mastitis [87]. The regions with 100% Holstein ancestry are enriched for terms related to neurotransmission (synaptic transmission), which may be explained by selection for behavioural traits [88].
In contrast to the ancestral inference results showing that native haplotypes are likely under purifying selection, the genes detected in selection scans (mainly positive selection) did not show significant functional enrichments except those identified in single-point analysis. This could be due to low statistical power because of a relatively small sample size (n = 12), which is a limitation of our study. On the other hand, the search in CattleQTLdb revealed multiple overlaps of putatively selected regions with bovine QTLs, which are most commonly associated with milk traits. This finding is unsurprising, as the RBP is a dairy breed, with selection efforts primarily focused on improving milk productivity (milk yield, fat yield, fat percentage, etc. [89]).
There are also substantial findings related to individual genes. For example, GRIK2 is encoding for a glutamate receptor involved in cold sensing and, therefore, can participate in adaptation to low temperatures [90]. The SLC6A19 gene encodes a neutral amino acid transporter whose inhibition reduces protein absorption and increases urinary loss of amino acids [91,92]. Selection for changes in these genes could influence the RBP’s productive traits.
Our limited sample size and the differences in the selection scan approach could account for the discrepancies with the previous study on the RBP [93]. We found an overlap for two genes (LRRIQ3 and BNIP1), with an earlier study suggesting that these genes have strong signals detectable on smaller and larger datasets and by different methods. The difference in gene sets could also be attributed to distinct genotyping technologies (sequencing and DNA arrays) and the genetic makeup of the studied populations. The genome resequencing approach is not biased toward preselected SNP sets, while the genotyping arrays are.
Our study centred on whole-genome resequenced datasets, facilitating the search for candidate causative variants in the putatively selected regions. One such mutation we identified is the missense mutation in the MPZL3 gene. This gene is associated with the thermal insulation properties of hair coats and thermoregulatory phenotypes. Unlike earlier Russian Yakut and Yaroslavl cattle studies [11,94], we did not uncover breed-specific variants under selection in the RBP cattle. This outcome is expected for composite breeds with a relatively lower proportion of unique genetics than breeds predominantly formed locally. Indeed, our recent scan for signatures of selection in the local Buryat cattle, which have not undergone cross-breeding with other (including commercial) breeds, has revealed numerous unique variants absent from the 1KBGP [12]. However, we identified some alleles (e.g., in the BNIP1) that can be regarded as nearly breed-specific in the RBP due to their low frequency in other population breeds.
All putatively selected alleles in our study also segregate in other breeds, suggesting the parental population origins of these variants. Therefore, our data are in agreement with observations from multiple species, indicating that selection typically acts on standing variations (which endure in a population across many generations) rather than on “de novo” mutations [95,96,97]. Such variants may be maintained in populations by chance, or alternatively, their persistence may be prolonged due to linkage disequilibrium with sites under balancing selection [98]. According to simulation studies, phenotypic changes in response to selection initially rely almost entirely on standing variations. However, the contribution of “de novo” mutations increases over time [99]. Therefore, the absence of recent mutations among the putatively selected variants in our RBP sample might indicate that this breed has a high potential for further improvement through selective breeding.
It is also notable that variants from eleven genes (BNIP1, ADAMTS5, ENSBTAG00000018549 (SPAG16), ADAMTS1, TMEM67, NCOA6, RBM12B, OR11L1, EEF2K, KCNH6, and SOGA1) pinpointed by single-point analysis had a minor allele frequency of <1% in the 1KBGP dataset. According to commonly used classification, such variants are considered “rare”. The rare variants often have large phenotypic effects and are associated with disease [100]. In cattle, a whole-genome imputation study has shown that rare variants contribute, at least in part, to “missing heritability” [101]. The minor allele frequency of the aforementioned variants in the 1KBGP dataset ranges from 0.1% to 0.96%, whereas in the RBP, it is between 17% and 29%. Considering carrier rates, the total fraction of animals either homozygous or heterozygous for the alternative allele ranges from 33% to 55%. Given this, it may be speculated that these rare variants play an important role in shaping the RBP phenotype.
In the context of breed-specific artificial selection and adaptation, it is noteworthy that many alleles putatively selected in the RBP likely existed at lower frequencies in the parental populations but seem not to have experienced selective pressure in those populations. For example, the variant Lys432Glu of the KIAA1755 gene selected in the RBP was likely present in all three parental populations, as supported by its current frequencies in HOL, DSN, and YAR/KHO. However, haplotype diversity plots (Figure 2B) indicate that this variant did not undergo selection in these populations. The same applies to the Ala13Ser and Leu218Phe variants from the MPZL3 gene, which were putatively selected in the RBP but not in its Holstein and Russian native ancestors (Figure 2B). This phenomenon may be attributed to variations in breed management practices between the RBP and its parental populations. Alternatively, it might reflect differences in the genetic backgrounds of the breeds, which can influence the phenotypic effects of alleles and, consequently, their response to selection [102,103]. We may hypothesise that the variants revealed in KIAA1755, MPZL3, and other genes are particularly important to the productivity and adaptation of the RBP and could be utilised to enhance this breed.
The variants identified in this study should be further investigated for their associations with adaptive and/or economically important traits, with the potential use in marker-assisted selection in the Russian Black Pied breed. Furthermore, as these variants are likely enriched for functional polymorphisms, they may also have applications in genomic selection, which is known to benefit from including causative SNPs in the breeding value estimation [104].
In conclusion, our study reveals haplotypes, genes, and candidate variants subject to purifying and positive selection in the Russian Black Pied breed. Our results may be used to conserve the breed and enhance its genetics.
Supplementary Materials
The following supporting information can be downloaded at https://www.mdpi.com/article/10.3390/sci7020051/s1, Figure S1: ADMIXTURE analysis of the Russian Black Pied breed and breeds from the 1KBGP; Figure S2: Principle component analysis of the Russian Black Pied (RBP), Yaroslavl (YAR), Kholmogory (KOL), Meuse–Rhine–Yssel (MRY), Holstein (HOL), and Deutsche Schwarzbunte Niederungsrind (DSN) breeds; Table S1: The FST distances between the RBP and other breeds; Table S2: The animal samples used in this study; Table S3: Consensus selection signature regions detected by FST and hapFLK and corresponding genes; Table S4: Candidate SNPs with FST > 0.4 between the Russian Black Pied (RBP) and close breeds, and their alternative allele frequencies in the RBP, close breeds, and 1000 Bull Genomes Project (1KBGP); Table S5: Candidate SNPs from regions putatively selected in the Russian Black Pied (RBP), their alternative allele frequencies and genotype distributions in the RBP and close breeds, and the 1000 Bull Genomes Project (1KBGP); Table S6: Genome-wide local ancestry estimation; Table S7: Local ancestry estimated for putatively selected regions; Table S8: Functional enrichment analysis for regions with different local ancestry fractions; Table S9: Functional annotation clustering for regions with different local ancestry fractions; Table S10: Functional annotation clustering for genes detected in single-point FST analysis; Table S11: Consensus selection signature regions detected by FST and hapFLK, their corresponding genes, and overlaps with the cattleQTLdb database.
Author Contributions
Conceptualisation, D.M.L. and N.S.Y.; methodology, D.M.L.; formal analysis, A.V.I. and A.A.Y.; resources, N.S.Y. and D.M.L.; writing—original draft preparation, A.V.I. and D.M.L.; writing—review and editing, D.M.L.; project administration, D.M.L.; funding acquisition, N.S.Y. and D.M.L. All authors have read and agreed to the published version of the manuscript.
Funding
This study was supported by funding from project No. FWNR-2022-0039.
Institutional Review Board Statement
The collection of animal samples for this study was approved by the ICG SB RAS Ethical Committee (approval 37/28, 28 November 2017).
Informed Consent Statement
Not applicable.
Data Availability Statement
The raw sequencing data for the Russian Black Pied animals are available from NCBI SRA under the BioProject accession number PRJNA1217332.
Acknowledgments
This research was supported in part by the computational resources of HPC facilities at the collaborative centre “Bioinformatics” ICG SB RAS.
Conflicts of Interest
The authors declare no conflicts of interest.
References
- Yearbook on Breeding Work in Dairy Cattle Breeding in the Farms of the Russian Federation (2023); All-Russian Research Institute of Animal Breeding: Moscow, Russia, 2024.
- Yearbook on Breeding Work in Beef Cattle Breeding in the Farms of the Russian Federation (2023); All-Russian Research Institute of Animal Breeding: Moscow, Russia, 2024.
- Ernst, L.K.; Dmitriev, N.G.; Paronyan, I.A. Genetic Resources of Farm Animals in Russia and Neighboring Countries; VNIIGRZH: St. Petersburg, Russia, 1994. [Google Scholar]
- Kostomakhin, N.M.; Voronkova, O.A.; Gabedava, M.A. Improvement of Black Pied Cattle of Various Origins: Monograph; RSAU-MTAA: Kaluga, Russia, 2023. [Google Scholar]
- Abdelmanova, A.S.; Volkova, V.V.; Dotsev, A.V.; Zinovieva, N.A. Characterization of the Genetic Diversity of Modern and Archival Populations of Black-and-White Cattle Using Microsatellite Markers. Dostizheniya Nauk. I Tekhniki APK 2020, 34, 34–38. [Google Scholar]
- Yurchenko, A.; Yudin, N.; Aitnazarov, R.; Plyusnina, A.; Brukhin, V.; Soloshenko, V.; Lhasaranov, B.; Popov, R.; Paronyan, I.A.; Plemyashov, K.V.; et al. Genome-Wide Genotyping Uncovers Genetic Profiles and History of the Russian Cattle Breeds. Heredity 2018, 120, 125–137. [Google Scholar] [CrossRef] [PubMed]
- Kadralieva, B.T.; Kosilov, V.I.; Babicheva, I.A.; Mironova, I.V.; Khabibullin, I.M. Indicators of the Development of the Hair Cover of Primary Cows of Different Genotypes by Seasons of the Year. Izv. Orenbg. State Agrar. Univ. 2023, 100, 244–249. [Google Scholar]
- Salakhov, F.D. Comparative Characteristics of Economically Useful Traits and Adaptive Qualities of Holstein and Brown Swiss Cows in the Industrial Technology of Milk Production. Ph.D. Thesis, Bashkir State Agrarian University, Ufa, Russia, 2017. [Google Scholar]
- Lazebnaya, I.V. Resistance to Bovine Leukemia Virus in Holstein and Russian Black-and-White Breeds Based on BOLA-DRB3 Gene Alleles. Sci. Eur. 2022, 86, 8–10. [Google Scholar]
- Saravanan, K.A.; Panigrahi, M.; Kumar, H.; Bhushan, B.; Dutt, T.; Mishra, B.P. Selection Signatures in Livestock Genome: A Review of Concepts, Approaches and Applications. Livest. Sci. 2020, 241, 104257. [Google Scholar] [CrossRef]
- Buggiotti, L.; Yurchenko, A.A.; Yudin, N.S.; Vander Jagt, C.J.; Vorobieva, N.V.; Kusliy, M.A.; Vasiliev, S.K.; Rodionov, A.N.; Boronetskaya, O.I.; Zinovieva, N.A.; et al. Demographic History, Adaptation, and NRAP Convergent Evolution at Amino Acid Residue 100 in the World Northernmost Cattle from Siberia. Mol. Biol. Evol. 2021, 38, 3093–3110. [Google Scholar] [CrossRef] [PubMed]
- Igoshin, A.V.; Romashov, G.A.; Yurchenko, A.A.; Yudin, N.S.; Larkin, D.M. Scans for Signatures of Selection in Genomes of Wagyu and Buryat Cattle Breeds Reveal Candidate Genes and Genetic Variants for Adaptive Phenotypes and Production Traits. Anim. Open Access J. 2024, 14, 2059. [Google Scholar] [CrossRef]
- Shi, L.; Hu, M.; Lai, W.; Yi, W.; Liu, Z.; Sun, H.; Li, F.; Yan, S. Detection of Genomic Variations and Selection Signatures in Wagyu Using Whole-Genome Sequencing Data. Anim. Genet. 2023, 54, 808–812. [Google Scholar] [CrossRef]
- Souilmi, Y.; Tobler, R.; Johar, A.; Williams, M.; Grey, S.T.; Schmidt, J.; Teixeira, J.C.; Rohrlach, A.; Tuke, J.; Johnson, O.; et al. Admixture Has Obscured Signals of Historical Hard Sweeps in Humans. Nat. Ecol. Evol. 2022, 6, 2003–2015. [Google Scholar] [CrossRef]
- Lohmueller, K.E.; Bustamante, C.D.; Clark, A.G. Detecting Directional Selection in the Presence of Recent Admixture in African-Americans. Genetics 2011, 187, 823–835. [Google Scholar] [CrossRef]
- Seldin, M.F.; Pasaniuc, B.; Price, A.L. New Approaches to Disease Mapping in Admixed Populations. Nat. Rev. Genet. 2011, 12, 523–528. [Google Scholar] [CrossRef]
- Bisschop, J.H.R. Parent Stock and Derived Types of African Cattle, with Particular Reference to the Importance of Conformational Characteristics in the Study of Their Origin. S. Afr. J. Sci. 1937, 33, 852–870. Available online: https://hdl.handle.net/10520/AJA00382353_8188 (accessed on 11 January 2025).
- Stormont, C.J.; Morris, B.G.; Suzuki, Y.; Dodd, J. Blood Typing Beefalo Cattle. In Proceedings of the 3rd World Congress on Genetics Applied to Livestock Production, Lincoln, NE, USA, 16–22 July 1986. [Google Scholar]
- Shapiro, B.; Oppenheimer, J.; Heaton, M.P.; Kuhn, K.L.; Green, R.E.; Blackburn, H.D.; Smith, T.P.L. Most Beefalo Cattle Have No Detectable Bison Genetic Ancestry. eLife 2024, 13, RP102750. [Google Scholar] [CrossRef]
- Lawson, D.J.; van Dorp, L.; Falush, D. A Tutorial on How Not to Over-Interpret STRUCTURE and ADMIXTURE Bar Plots. Nat. Commun. 2018, 9, 3258. [Google Scholar] [CrossRef] [PubMed]
- Kim, K.; Kwon, T.; Dessie, T.; Yoo, D.; Mwai, O.A.; Jang, J.; Sung, S.; Lee, S.; Salim, B.; Jung, J.; et al. The Mosaic Genome of Indigenous African Cattle as a Unique Genetic Resource for African Pastoralism. Nat. Genet. 2020, 52, 1099–1110. [Google Scholar] [CrossRef] [PubMed]
- Karimi, K.; Strucken, E.M.; Moghaddar, N.; Ferdosi, M.H.; Esmailizadeh, A.; Gondro, C. Local and Global Patterns of Admixture and Population Structure in Iranian Native Cattle. BMC Genet. 2016, 17, 108. [Google Scholar] [CrossRef]
- Wang, Y.; Ma, J.; Wang, J.; Zhang, L.; Hu, J.; Ma, M.; Xu, L.; Chen, Y.; Zhu, B.; Wang, Z.; et al. Genetic Origin and Introgression Pattern of Pingliang Red Cattle Revealed Using Genome-Wide SNP Analyses. Genes 2023, 14, 2198. [Google Scholar] [CrossRef]
- Dixit, S.P.; Bhatia, A.K.; Ganguly, I.; Singh, S.; Dash, S.; Sharma, A.; Anandkumar, N.; Dang, A.K.; Jayakumar, S. Genome Analyses Revealed Genetic Admixture and Selection Signatures in Bos Indicus. Sci. Rep. 2021, 11, 21924. [Google Scholar] [CrossRef]
- Neumann, G.B.; Korkuć, P.; Arends, D.; Wolf, M.J.; May, K.; König, S.; Brockmann, G.A. Genomic Diversity and Relationship Analyses of Endangered German Black Pied Cattle (DSN) to 68 Other Taurine Breeds Based on Whole-Genome Sequencing. Front. Genet. 2022, 13, 993959. [Google Scholar] [CrossRef]
- Chen, N.; Cai, Y.; Chen, Q.; Li, R.; Wang, K.; Huang, Y.; Hu, S.; Huang, S.; Zhang, H.; Zheng, Z.; et al. Whole-Genome Resequencing Reveals World-Wide Ancestry and Adaptive Introgression Events of Domesticated Cattle in East Asia. Nat. Commun. 2018, 9, 2337. [Google Scholar] [CrossRef]
- Tang, H.; Coram, M.; Wang, P.; Zhu, X.; Risch, N. Reconstructing Genetic Ancestry Blocks in Admixed Individuals. Am. J. Hum. Genet. 2006, 79, 1–12. [Google Scholar] [CrossRef]
- Maples, B.K.; Gravel, S.; Kenny, E.E.; Bustamante, C.D. RFMix: A Discriminative Modeling Approach for Rapid and Robust Local-Ancestry Inference. Am. J. Hum. Genet. 2013, 93, 278–288. [Google Scholar] [CrossRef] [PubMed]
- Chen, Q.; Xu, L.; Zhang, M.; Zhang, T.; Yan, M.; Zhai, M.; Huang, X. Whole Genome Resequencing Reveals the Genetic Contribution of Kazakh and Swiss Brown Cattle to a Population of Xinjiang Brown Cattle. Gene 2022, 839, 146725. [Google Scholar] [CrossRef]
- Goszczynski, D.E.; Corbi-Botto, C.M.; Durand, H.M.; Rogberg-Muñoz, A.; Munilla, S.; Peral-Garcia, P.; Cantet, R.J.C.; Giovambattista, G. Evidence of Positive Selection towards Zebuine Haplotypes in the BoLA Region of Brangus Cattle. Animal 2018, 12, 215–223. [Google Scholar] [CrossRef] [PubMed]
- McHugo, G.P.; Ward, J.A.; Ng’ang’a, S.I.; Frantz, L.A.F.; Salter-Townshend, M.; Hill, E.W.; O’Gorman, G.M.; Meade, K.G.; Hall, T.J.; MacHugh, D.E. Genome-Wide Local Ancestry and the Functional Consequences of Admixture in African and European Cattle Populations. Heredity 2025, 134, 49–63. [Google Scholar] [CrossRef]
- Lyu, Y.; Ren, Y.; Qu, K.; Quji, S.; Zhuzha, B.; Lei, C.; Chen, N. Local Ancestry and Selection in Admixed Sanjiang Cattle. Stress Biol. 2023, 3, 30. [Google Scholar] [CrossRef] [PubMed]
- Ward, J.A.; McHugo, G.P.; Dover, M.J.; Hall, T.J.; Ng’ang’a, S.I.; Sonstegard, T.S.; Bradley, D.G.; Frantz, L.A.F.; Salter-Townshend, M.; MacHugh, D.E. Genome-Wide Local Ancestry and Evidence for Mitonuclear Coadaptation in African Hybrid Cattle Populations. iScience 2022, 25, 104672. [Google Scholar] [CrossRef]
- Natri, H.M.; Hudjashov, G.; Jacobs, G.; Kusuma, P.; Saag, L.; Darusallam, C.C.; Metspalu, M.; Sudoyo, H.; Cox, M.P.; Gallego Romero, I.; et al. Genetic Architecture of Gene Regulation in Indonesian Populations Identifies QTLs Associated with Global and Local Ancestries. Am. J. Hum. Genet. 2022, 109, 50–65. [Google Scholar] [CrossRef]
- Ni, X.; Zhou, M.; Wang, H.; He, K.Y.; Broeckel, U.; Hanis, C.; Kardia, S.; Redline, S.; Cooper, R.S.; Tang, H.; et al. Detecting Fitness Epistasis in Recently Admixed Populations with Genome-Wide Data. BMC Genom. 2020, 21, 476. [Google Scholar] [CrossRef]
- Thornton, T.A.; Bermejo, J.L. Local and Global Ancestry Inference and Applications to Genetic Association Analysis for Admixed Populations. Genet. Epidemiol. 2014, 38 (Suppl. 1), S5–S12. [Google Scholar] [CrossRef]
- Purcell, S.; Neale, B.; Todd-Brown, K.; Thomas, L.; Ferreira, M.A.R.; Bender, D.; Maller, J.; Sklar, P.; de Bakker, P.I.W.; Daly, M.J.; et al. PLINK: A Tool Set for Whole-Genome Association and Population-Based Linkage Analyses. Am. J. Hum. Genet. 2007, 81, 559–575. [Google Scholar] [CrossRef] [PubMed]
- 1000 Bull Genomes Project. In 1000 Bulls GATK Fastq to GVCF Guidelines (GATKv3.8); 2019; Available online: https://hal.science/hal-04787725v1/file/12711_2024_942_MOESM1_ESM.pdf (accessed on 7 August 2021).
- Hayes, B.J.; Daetwyler, H.D. 1000 Bull Genomes Project to Map Simple and Complex Genetic Traits in Cattle: Applications and Outcomes. Annu. Rev. Anim. Biosci. 2019, 7, 89–102. [Google Scholar] [CrossRef] [PubMed]
- McKenna, A.; Hanna, M.; Banks, E.; Sivachenko, A.; Cibulskis, K.; Kernytsky, A.; Garimella, K.; Altshuler, D.; Gabriel, S.; Daly, M.; et al. The Genome Analysis Toolkit: A MapReduce Framework for Analyzing next-Generation DNA Sequencing Data. Genome Res. 2010, 20, 1297–1303. [Google Scholar] [CrossRef] [PubMed]
- Clark, A.G.; Hubisz, M.J.; Bustamante, C.D.; Williamson, S.H.; Nielsen, R. Ascertainment Bias in Studies of Human Genome-Wide Polymorphism. Genome Res. 2005, 15, 1496–1502. [Google Scholar] [CrossRef]
- Hard-Filtering Germline Short Variants. Available online: https://gatk.broadinstitute.org/hc/en-us/articles/360035890471-Hard-filtering-germline-short-variants (accessed on 6 March 2024).
- DePristo, M.A.; Banks, E.; Poplin, R.; Garimella, K.V.; Maguire, J.R.; Hartl, C.; Philippakis, A.A.; del Angel, G.; Rivas, M.A.; Hanna, M.; et al. A Framework for Variation Discovery and Genotyping Using Next-Generation DNA Sequencing Data. Nat. Genet. 2011, 43, 491–498. [Google Scholar] [CrossRef]
- Lefouili, M.; Nam, K. The Evaluation of Bcftools Mpileup and GATK HaplotypeCaller for Variant Calling in Non-Human Species. Sci. Rep. 2022, 12, 11331. [Google Scholar] [CrossRef]
- Danecek, P.; Bonfield, J.K.; Liddle, J.; Marshall, J.; Ohan, V.; Pollard, M.O.; Whitwham, A.; Keane, T.; McCarthy, S.A.; Davies, R.M.; et al. Twelve Years of SAMtools and BCFtools. Gigascience 2021, 10, giab008. [Google Scholar] [CrossRef]
- Alexander, D.H.; Novembre, J.; Lange, K. Fast Model-Based Estimation of Ancestry in Unrelated Individuals. Genome Res. 2009, 19, 1655–1664. [Google Scholar] [CrossRef]
- Hudson, R.R.; Slatkin, M.; Maddison, W.P. Estimation of Levels of Gene Flow from DNA Sequence Data. Genetics 1992, 132, 583–589. [Google Scholar] [CrossRef]
- Price, A.L.; Patterson, N.J.; Plenge, R.M.; Weinblatt, M.E.; Shadick, N.A.; Reich, D. Principal Components Analysis Corrects for Stratification in Genome-Wide Association Studies. Nat. Genet. 2006, 38, 904–909. [Google Scholar] [CrossRef]
- Katz, K.; Shutov, O.; Lapoint, R.; Kimelman, M.; Brister, J.R.; O’Sullivan, C. The Sequence Read Archive: A Decade More of Explosive Growth. Nucleic Acids Res. 2022, 50, D387–D390. [Google Scholar] [CrossRef] [PubMed]
- Scheet, P.; Stephens, M. A Fast and Flexible Statistical Model for Large-Scale Population Genotype Data: Applications to Inferring Missing Genotypes and Haplotypic Phase. Am. J. Hum. Genet. 2006, 78, 629–644. [Google Scholar] [CrossRef] [PubMed]
- Fariello, M.I.; Boitard, S.; Naya, H.; SanCristobal, M.; Servin, B. Detecting Signatures of Selection through Haplotype Differentiation among Hierarchically Structured Populations. Genetics 2013, 193, 929–941. [Google Scholar] [CrossRef] [PubMed]
- Ripley, B.; Venables, B.; Bates, D.M.; Hornik, K.; Gebhardt, A.; Firth, D. Package “MASS.” Cran R. 2024. Available online: https://CRAN.R-project.org/package=MASS (accessed on 25 May 2024).
- Storey, J.D.; Bass, A.J.; Dabney, A.; Robinson, D. Qvalue: Q-Value Estimation for False Discovery Rate Control. R Packag. Version 2.24.0. 2020. [Google Scholar] [CrossRef]
- Danecek, P.; Auton, A.; Abecasis, G.; Albers, C.A.; Banks, E.; DePristo, M.A.; Handsaker, R.E.; Lunter, G.; Marth, G.T.; Sherry, S.T.; et al. The Variant Call Format and VCFtools. Bioinformatics 2011, 27, 2156–2158. [Google Scholar] [CrossRef]
- Cingolani, P.; Platts, A.; Wang, L.L.; Coon, M.; Nguyen, T.; Wang, L.; Land, S.J.; Lu, X.; Ruden, D.M. A Program for Annotating and Predicting the Effects of Single Nucleotide Polymorphisms, SnpEff: SNPs in the Genome of Drosophila Melanogaster Strain W1118; Iso-2; Iso-3. Fly 2012, 6, 80–92. [Google Scholar] [CrossRef]
- Karunarathne, P.; Zhou, Q.; Schliep, K.; Milesi, P. A Comprehensive Framework for Detecting Copy Number Variants from Single Nucleotide Polymorphism Data: “RCNV”, a Versatile r Package for Paralogue and CNV Detection. Mol. Ecol. Resour. 2023, 23, 1772–1789. [Google Scholar] [CrossRef]
- McKinney, G.J.; Waples, R.K.; Seeb, L.W.; Seeb, J.E. Paralogs Are Revealed by Proportion of Heterozygotes and Deviations in Read Ratios in Genotyping-by-Sequencing Data from Natural Populations. Mol. Ecol. Resour. 2017, 17, 656–669. [Google Scholar] [CrossRef]
- Klambauer, G.; Schwarzbauer, K.; Mayr, A.; Clevert, D.-A.; Mitterecker, A.; Bodenhofer, U.; Hochreiter, S. Cn.MOPS: Mixture of Poissons for Discovering Copy Number Variations in next-Generation Sequencing Data with a Low False Discovery Rate. Nucleic Acids Res. 2012, 40, e69. [Google Scholar] [CrossRef]
- Hilmarsson, H.; Kumar, A.S.; Rastogi, R.; Bustamante, C.D.; Montserrat, D.M.; Ioannidis, A.G. High Resolution Ancestry Deconvolution for Next Generation Genomic Data. bioRxiv 2021. [Google Scholar] [CrossRef]
- Zhang, R.; Liu, C.; Yuan, K.; Ni, X.; Pan, Y.; Xu, S. AdmixSim 2: A Forward-Time Simulator for Modeling Complex Population Admixture. BMC Bioinform. 2021, 22, 506. [Google Scholar] [CrossRef]
- Neumann, G.B.; Korkuć, P.; Arends, D.; Wolf, M.J.; May, K.; Reißmann, M.; Elzaki, S.; König, S.; Brockmann, G.A. Design and Performance of a Bovine 200 k SNP Chip Developed for Endangered German Black Pied Cattle (DSN). BMC Genom. 2021, 22, 905. [Google Scholar] [CrossRef] [PubMed]
- Browning, B.L.; Tian, X.; Zhou, Y.; Browning, S.R. Fast Two-Stage Phasing of Large-Scale Sequence Data. Am. J. Hum. Genet. 2021, 108, 1880–1890. [Google Scholar] [CrossRef]
- Qanbari, S.; Wittenburg, D. Male Recombination Map of the Autosomal Genome in German Holstein. Genet. Sel. Evol. 2020, 52, 73. [Google Scholar] [CrossRef]
- Sherman, B.T.; Hao, M.; Qiu, J.; Jiao, X.; Baseler, M.W.; Lane, H.C.; Imamichi, T.; Chang, W. DAVID: A Web Server for Functional Enrichment Analysis and Functional Annotation of Gene Lists (2021 Update). Nucleic Acids Res. 2022, 50, W216–W221. [Google Scholar] [CrossRef] [PubMed]
- Hu, Z.-L.; Park, C.A.; Wu, X.-L.; Reecy, J.M. Animal QTLdb: An Improved Database Tool for Livestock Animal QTL/Association Data Dissemination in the Post-Genome Era. Nucleic Acids Res. 2013, 41, D871–D879. [Google Scholar] [CrossRef]
- Wang, P.; Li, X.; Zhu, Y.; Wei, J.; Zhang, C.; Kong, Q.; Nie, X.; Zhang, Q.; Wang, Z. Genome-Wide Association Analysis of Milk Production, Somatic Cell Score, and Body Conformation Traits in Holstein Cows. Front. Vet. Sci. 2022, 9, 932034. [Google Scholar] [CrossRef]
- Zhao, W.; Shahzad, K.; Jiang, M.; Graugnard, D.E.; Rodriguez-Zas, S.L.; Luo, J.; Loor, J.J.; Hurley, W.L. Bioinformatics and Gene Network Analyses of the Swine Mammary Gland Transcriptome during Late Gestation. Bioinform. Biol. Insights 2013, 7, 193–216. [Google Scholar] [CrossRef] [PubMed]
- Wolf, M.J.; Yin, T.; Neumann, G.B.; Korkuć, P.; Brockmann, G.A.; König, S.; May, K. Genome-Wide Association Study Using Whole-Genome Sequence Data for Fertility, Health Indicator, and Endoparasite Infection Traits in German Black Pied Cattle. Genes 2021, 12, 1163. [Google Scholar] [CrossRef]
- Canive, M.; González-Recio, O.; Fernández, A.; Vázquez, P.; Badia-Bringué, G.; Lavín, J.L.; Garrido, J.M.; Juste, R.A.; Alonso-Hearn, M. Identification of Loci Associated with Susceptibility to Mycobacterium Avium Subsp. Paratuberculosis Infection in Holstein Cattle Using Combinations of Diagnostic Tests and Imputed Whole-Genome Sequence Data. PLoS ONE 2021, 16, e0256091. [Google Scholar] [CrossRef]
- Cao, T.; Racz, P.; Szauter, K.M.; Groma, G.; Nakamatsu, G.Y.; Fogelgren, B.; Pankotai, E.; He, Q.-P.; Csiszar, K. Mutation in Mpzl3, a Novel [Corrected] Gene Encoding a Predicted [Corrected] Adhesion Protein, in the Rough Coat (Rc) Mice with Severe Skin and Hair Abnormalities. J. Investig. Dermatol. 2007, 127, 1375–1386. [Google Scholar] [CrossRef]
- Leiva, A.G.; Chen, A.L.; Devarajan, P.; Chen, Z.; Damanpour, S.; Hall, J.A.; Bianco, A.C.; Li, J.; Badiavas, E.V.; Zaias, J.; et al. Loss of Mpzl3 Function Causes Various Skin Abnormalities and Greatly Reduced Adipose Depots. J. Investig. Dermatol. 2014, 134, 1817–1827. [Google Scholar] [CrossRef] [PubMed]
- Zhou, X.; Bao, P.; Zhang, X.; Guo, X.; Liang, C.; Chu, M.; Wu, X.; Yan, P. Genome-Wide Detection of RNA Editing Events during the Hair Follicles Cycle of Tianzhu White Yak. BMC Genom. 2022, 23, 737. [Google Scholar] [CrossRef] [PubMed]
- Li, T.-T.; Xia, T.; Wu, J.-Q.; Hong, H.; Sun, Z.-L.; Wang, M.; Ding, F.-R.; Wang, J.; Jiang, S.; Li, J.; et al. De Novo Genome Assembly Depicts the Immune Genomic Characteristics of Cattle. Nat. Commun. 2023, 14, 6601. [Google Scholar] [CrossRef]
- Connelley, T.K.; Degnan, K.; Longhi, C.W.; Morrison, W.I. Genomic Analysis Offers Insights into the Evolution of the Bovine TRA/TRD Locus. BMC Genom. 2014, 15, 994. [Google Scholar] [CrossRef]
- Nakatsuchi, A.; Watanuki, S.; Borjigin, L.; Sato, H.; Bai, L.; Matsuura, R.; Kuroda, M.; Murakami, H.; Sato, R.; Asaji, S.; et al. BoLA-DRB3 Polymorphism Controls Proviral Load and Infectivity of Bovine Leukemia Virus (BLV) in Milk. Pathogens 2022, 11, 210. [Google Scholar] [CrossRef] [PubMed]
- Maezawa, M.; Fujii, Y.; Akagami, M.; Kawakami, J.; Inokuma, H. BoLA-DRB3*15:01 Allele Is Associated with Susceptibility to Early Enzootic Bovine Leukosis Onset in Holstein-Friesian and Japanese Black Cattle. Vet. Microbiol. 2023, 284, 109829. [Google Scholar] [CrossRef]
- Lo, C.-W.; Takeshima, S.-N.; Okada, K.; Saitou, E.; Fujita, T.; Matsumoto, Y.; Wada, S.; Inoko, H.; Aida, Y. Association of Bovine Leukemia Virus-Induced Lymphoma with BoLA-DRB3 Polymorphisms at DNA, Amino Acid, and Binding Pocket Property Levels. Pathogens 2021, 10, 437. [Google Scholar] [CrossRef]
- Xu, A.; van Eijk, M.J.; Park, C.; Lewin, H.A. Polymorphism in BoLA-DRB3 Exon 2 Correlates with Resistance to Persistent Lymphocytosis Caused by Bovine Leukemia Virus. J. Immunol. 1993, 151, 6977–6985. [Google Scholar] [CrossRef]
- Order of the Ministry of Agriculture of the Russian Federation No. 156 dated March 24, 2021, On the Approval of Veterinary Rules for the Implementation of Preventive, Diagnostic, Restrictive, and Other Measures, the Establishment and Lifting of Quarantin. Available online: https://base.garant.ru/400714035/ (accessed on 15 January 2025).
- Colombi, D.; Perini, F.; Bettini, S.; Mastrangelo, S.; Abeni, F.; Conte, G.; Marletta, D.; Cassandro, M.; Bernabucci, U.; Ciampolini, R.; et al. Genomic Responses to Climatic Challenges in Beef Cattle: A Review. Anim. Genet. 2024, 55, 854–870. [Google Scholar] [CrossRef]
- Picard, K.; Thomas, D.W.; Festa-Bianchet, M.; Belleville, F.; Laneville, A. Differences in the Thermal Conductance of Tropical and Temperate Bovid Horns. Écoscience 1999, 6, 148–158. [Google Scholar] [CrossRef]
- Buggiotti, L.; Yudin, N.S.; Larkin, D.M. Copy Number Variants in Two Northernmost Cattle Breeds Are Related to Their Adaptive Phenotypes. Genes 2022, 13, 1595. [Google Scholar] [CrossRef] [PubMed]
- Shephard, R.W.; Maloney, S.K. A Review of Thermal Stress in Cattle. Aust. Vet. J. 2023, 101, 417–429. [Google Scholar] [CrossRef]
- Jiang, Q.; Sherlock, D.N.; Guyader, J.; Loor, J.J. Abundance of Amino Acid Transporters and MTOR Pathway Components in the Gastrointestinal Tract of Lactating Holstein Cows. Animals 2023, 13, 1189. [Google Scholar] [CrossRef]
- Erasmus, L.J.; Botha, P.M.; Cruywagen, C.W.; Meissner, H.H. Amino Acid Profile and Intestinal Digestibility in Dairy Cows of Rumen-Undegradable Protein from Various Feedstuffs. J. Dairy Sci. 1994, 77, 541–551. [Google Scholar] [CrossRef] [PubMed]
- Cerón, J.J.; Ortín-Bustillo, A.; López-Martínez, M.J.; Martínez-Subiela, S.; Eckersall, P.D.; Tecles, F.; Tvarijonaviciute, A.; Muñoz-Prieto, A. S-100 Proteins: Basics and Applications as Biomarkers in Animals with Special Focus on Calgranulins (S100A8, A9, and A12). Biology 2023, 12, 881. [Google Scholar] [CrossRef]
- Smolenski, G.A.; Cursons, R.T.; Hine, B.C.; Wheeler, T.T. Keratin and S100 Calcium-Binding Proteins Are Major Constituents of the Bovine Teat Canal Lining. Vet. Res. 2015, 46, 113. [Google Scholar] [CrossRef] [PubMed]
- Bykowska, O.; Gontier, C.; Sax, A.-L.; Jia, D.W.; Montero, M.L.; Bird, A.D.; Houghton, C.; Pfister, J.-P.; Costa, R.P. Model-Based Inference of Synaptic Transmission. Front. Synaptic Neurosci. 2019, 11, 21. [Google Scholar] [CrossRef]
- Durov, A.S.; Deeva, V.S. Evaluation of Breeding Groups by Living Weight of Over-Age Cows Depending on Breeding. Innov. Food Saf. 2021, 1, 89–97. [Google Scholar] [CrossRef]
- Gong, J.; Liu, J.; Ronan, E.A.; He, F.; Cai, W.; Fatima, M.; Zhang, W.; Lee, H.; Li, Z.; Kim, G.-H.; et al. A Cold-Sensing Receptor Encoded by a Glutamate Receptor Gene. Cell 2019, 178, 1375–1386.e11. [Google Scholar] [CrossRef]
- Xu, J.; Hu, Z.; Dai, L.; Yadav, A.; Jiang, Y.; Bröer, A.; Gardiner, M.G.; McLeod, M.; Yan, R.; Bröer, S. Molecular Basis of Inhibition of the Amino Acid Transporter B(0)AT1 (SLC6A19). Nat. Commun. 2024, 15, 7224. [Google Scholar] [CrossRef]
- Cheng, Q.; Shah, N.; Bröer, A.; Fairweather, S.; Jiang, Y.; Schmoll, D.; Corry, B.; Bröer, S. Identification of Novel Inhibitors of the Amino Acid Transporter B(0) AT1 (SLC6A19), a Potential Target to Induce Protein Restriction and to Treat Type 2 Diabetes. Br. J. Pharmacol. 2017, 174, 468–482. [Google Scholar] [CrossRef] [PubMed]
- Yurchenko, A.A.; Daetwyler, H.D.; Yudin, N.; Schnabel, R.D.; Vander Jagt, C.J.; Soloshenko, V.; Lhasaranov, B.; Popov, R.; Taylor, J.F.; Larkin, D.M. Scans for Signatures of Selection in Russian Cattle Breed Genomes Reveal New Candidate Genes for Environmental Adaptation and Acclimation. Sci. Rep. 2018, 8, 12984. [Google Scholar] [CrossRef]
- Ruvinskiy, D.; Igoshin, A.; Yurchenko, A.; Ilina, A.V.; Larkin, D.M. Resequencing the Yaroslavl Cattle Genomes Reveals Signatures of Selection and a Rare Haplotype on BTA28 Likely to Be Related to Breed Phenotypes. Anim. Genet. 2022, 53, 680–684. [Google Scholar] [CrossRef] [PubMed]
- Schrider, D.R.; Kern, A.D. Soft Sweeps Are the Dominant Mode of Adaptation in the Human Genome. Mol. Biol. Evol. 2017, 34, 1863–1877. [Google Scholar] [CrossRef] [PubMed]
- Lai, Y.-T.; Yeung, C.K.L.; Omland, K.E.; Pang, E.-L.; Hao, Y.; Liao, B.-Y.; Cao, H.-F.; Zhang, B.-W.; Yeh, C.-F.; Hung, C.-M.; et al. Standing Genetic Variation as the Predominant Source for Adaptation of a Songbird. Proc. Natl. Acad. Sci. USA 2019, 116, 2152–2157. [Google Scholar] [CrossRef]
- Ryan, K.; Greenway, R.; Landers, J.; Arias-Rodriguez, L.; Tobler, M.; Kelley, J.L. Selection on Standing Genetic Variation Mediates Convergent Evolution in Extremophile Fish. Mol. Ecol. 2023, 32, 5042–5054. [Google Scholar] [CrossRef]
- Gao, Z.; Przeworski, M.; Sella, G. Footprints of Ancient-Balanced Polymorphisms in Genetic Variation Data from Closely Related Species. Evolution 2015, 69, 431–446. [Google Scholar] [CrossRef]
- Matuszewski, S.; Hermisson, J.; Kopp, M. Catch Me If You Can: Adaptation from Standing Genetic Variation to a Moving Phenotypic Optimum. Genetics 2015, 200, 1255–1274. [Google Scholar] [CrossRef]
- Gibson, G. Rare and Common Variants: Twenty Arguments. Nat. Rev. Genet. 2012, 13, 135–145. [Google Scholar] [CrossRef]
- Gonzalez-Recio, O.; Daetwyler, H.D.; MacLeod, I.M.; Pryce, J.E.; Bowman, P.J.; Hayes, B.J.; Goddard, M.E. Rare Variants in Transcript and Potential Regulatory Regions Explain a Small Percentage of the Missing Heritability of Complex Traits in Cattle. PLoS ONE 2015, 10, e0143945. [Google Scholar] [CrossRef]
- Barton, N.H. How Does Epistasis Influence the Response to Selection? Heredity 2017, 118, 96–109. [Google Scholar] [CrossRef] [PubMed]
- Sevillano, C.A.; Ten Napel, J.; Guimarães, S.E.F.; Silva, F.F.; Calus, M.P.L. Effects of Alleles in Crossbred Pigs Estimated for Genomic Prediction Depend on Their Breed-of-Origin. BMC Genom. 2018, 19, 740. [Google Scholar] [CrossRef] [PubMed]
- Fragomeni, B.O.; Lourenco, D.A.L.; Masuda, Y.; Legarra, A.; Misztal, I. Incorporation of Causative Quantitative Trait Nucleotides in Single-Step GBLUP. Genet. Sel. Evol. 2017, 49, 59. [Google Scholar] [CrossRef] [PubMed]


Disclaimer/Publisher’s Note: The statements, opinions and data contained in all publications are solely those of the individual author(s) and contributor(s) and not of MDPI and/or the editor(s). MDPI and/or the editor(s) disclaim responsibility for any injury to people or property resulting from any ideas, methods, instructions or products referred to in the content. |
© 2025 by the authors. Licensee MDPI, Basel, Switzerland. This article is an open access article distributed under the terms and conditions of the Creative Commons Attribution (CC BY) license (https://creativecommons.org/licenses/by/4.0/).