1. Introduction
The United States is one of the world’s most urbanized countries with just over 80% of its total population living in urban dwellings as of 2010 [
1]. However, since 2010, the urban population has increased by about 500% while the rural population increased only 19% [
2]. With urbanization expected to increase over the coming decades, this could translate into a significant change in land use including conversion of forest, farm, and other lands for housing, transportation, and commercial buildings.
The process of urbanization is often associated with socioeconomic development and poverty reduction [
3,
4]. However, it is also associated with important, irreversible biophysical change in land use that drives the loss of farmlands and other terrestrial carbon pools [
5], threatens biodiversity [
6,
7], affects hydrological systems [
8,
9] and alters local and regional climate [
10,
11,
12].
A recent study indicates that, ca. 2001, urbanization in the continental United States (CONUS), occupied only 1.1% of the total land area but had significant impacts on surface climate including water, energy and the carbon cycles [
9]. It showed that the impact of impervious surface area (ISA) associated with urbanization has added an average annual warming of 1.1 °C with 1.9 °C of it occurring between June and August. The study also revealed that across much of the moderate-to-high density ISA, more than 35% of the incoming precipitation is expelled as surface runoff, compared to less than 15% over vegetated lands, leading to higher flash-flooding risk in urbanized areas. In addition to biophysical impacts, urbanization also tends to increase the quantity and types of products that humans produce, use, and discard, thereby affecting waste generation and management, water quality, and chemical production and use. As such, it is important to develop methodologies to project urban expansion in order to address the numerous complex urban-related environmental problems and to assist in sustainable development of urban areas [
13].
Although census data have been a traditional source for creating urban maps, spatially explicit urban mapping is increasingly using remote sensing data, especially over large areas such as the CONUS [
14,
15,
16,
17]. Several urban growth projection models exist. These models vary widely regarding their methodologies, theoretical assumptions and complexity. For example, the agent-based models present a number of opportunities and challenges but are mainly directed to real estate development. Other models use cellular automata and Markov chains to project the location and quantity of urban and other land cover types in expanding areas [
18]. These models, such as SLEUTH, require several inputs including Slope, Land Use/Cover, Excluded layers, Urban areas, Transportation and Hillshading, hence the name. Several reviews are available on the subject [
19,
20,
21]. They show that the prevailing modeling techniques often include numerous biophysical, political and socioeconomic factors to capture the spatiotemporal complexity of urban growth. However, data availability is considered a strong restraining factor, limiting the large scale applicability of these methods.
In the U.S., population is projected by the Census Bureau as a bulk country-level number including urban and rural populations, but little information is available about its spatial distribution or its rates of urban versus rural expansion. Individual states sometimes produce and report their own projections, which often are inconsistent in format and time-horizons, and do not normally go beyond the state or county level.
In this paper, our objective is to develop a methodology to project and spatially map future urbanization expansion over the CONUS from a single projected national population value, using the year 2020 as an example, and assess its spatial pattern based on past urban growth information.
2. Materials and Methods
In this paper, the build-up is characterized by the National Land Cover Dataset (NLCD) impervious surface area (ISA). This is a 30 m Landsat-based product, developed by the Multi-Resolution Land Characteristics Consortium (MRLC) and represents the percent impervious area within each pixel [
22,
23]. The NLCD ISA data used in this study is from 2001 to 2011. We also use the Center for International Earth Science Information Network (CIESIN) 2.5 arc-minute (~5 km) Gridded Population consisting of population count estimates derived from national and sub-national administrative units [
24]. The U.S. Census Bureau 2020 National Population Projection is a single numeric value that takes into account future births, deaths, and net international migration rates [
25]. The data for U.S. Urban Areas [
26], Places [
27], and State Boundaries [
28] are all in vector polygon format and are used for calculating zonal statistics for the gridded population and ISA data. The bulk of the datasets that served this study are listed in
Table 1.
The gridded datasets were processed and co-registered to the same common 0.05 degrees (~5 km) Climate Modeling Grid (CMG) over the CONUS. The CMG spatial resolution was chosen to correspond to available North American Land Data Assimilation System (NLDAS-2) hourly climate drivers, and to facilitate future modeling studies [
12].
2.1. Population
The U.S. Census data shows that the U.S. population is projected to grow to an aggregate 334,503,458 persons by 2020 [
25]. While this indicator captures the overall trend of the U.S. population growth including urban and rural districts, it does not inform about its spatial distribution nor does it discriminate between urban and rural growth. Our analysis disaggregates this single-value indicator to extract useful information as far as the city-scale. A 2020 CMG-scale population dataset was created, along with state-wide population summaries, based on the Census Bureau 2020 National Population Projection of 334,503,458 persons (inclusive of Alaska and Hawaii) [
25]. First, for the years 2010 and 2015, gridded CIESEN population were aggregated to the state level and fractions of the population of each state to the total population were obtained and compared between the two years. Except for California, Florida and Texas which showed a slight increase in the fractions in 2015, most of the states including the District of Columbia (D.C.) experienced no significant change in their fractions. After adjustment of projected populations for Alaska and Hawaii (0.63% of the total), the remaining 2020 CONUS population (332,396,086) was redistributed over the conterminous states (including D.C.) based on their 2015 fractions, representative of the most recent state population distribution. These states’ results were further disaggregated to CMGs based on the 2015 fraction of each CMG population to the state’s population to which it belongs. The disaggregation process introduced minor discrepancies, due mostly to rounding errors and to northern and southern country border issues, resulting in a loss of 0.1% of the population, an average of 1 person per CMG for the contiguous states including D.C. The resultant state-wide breakdown is shown in
Section 3.
2.2. Land Use
We use a realistic algorithm that enables us to produce a plausible future Land Use (LU) map based on decadal population and ISA change implicitly taking regional specificities into account. Using the 2001 [
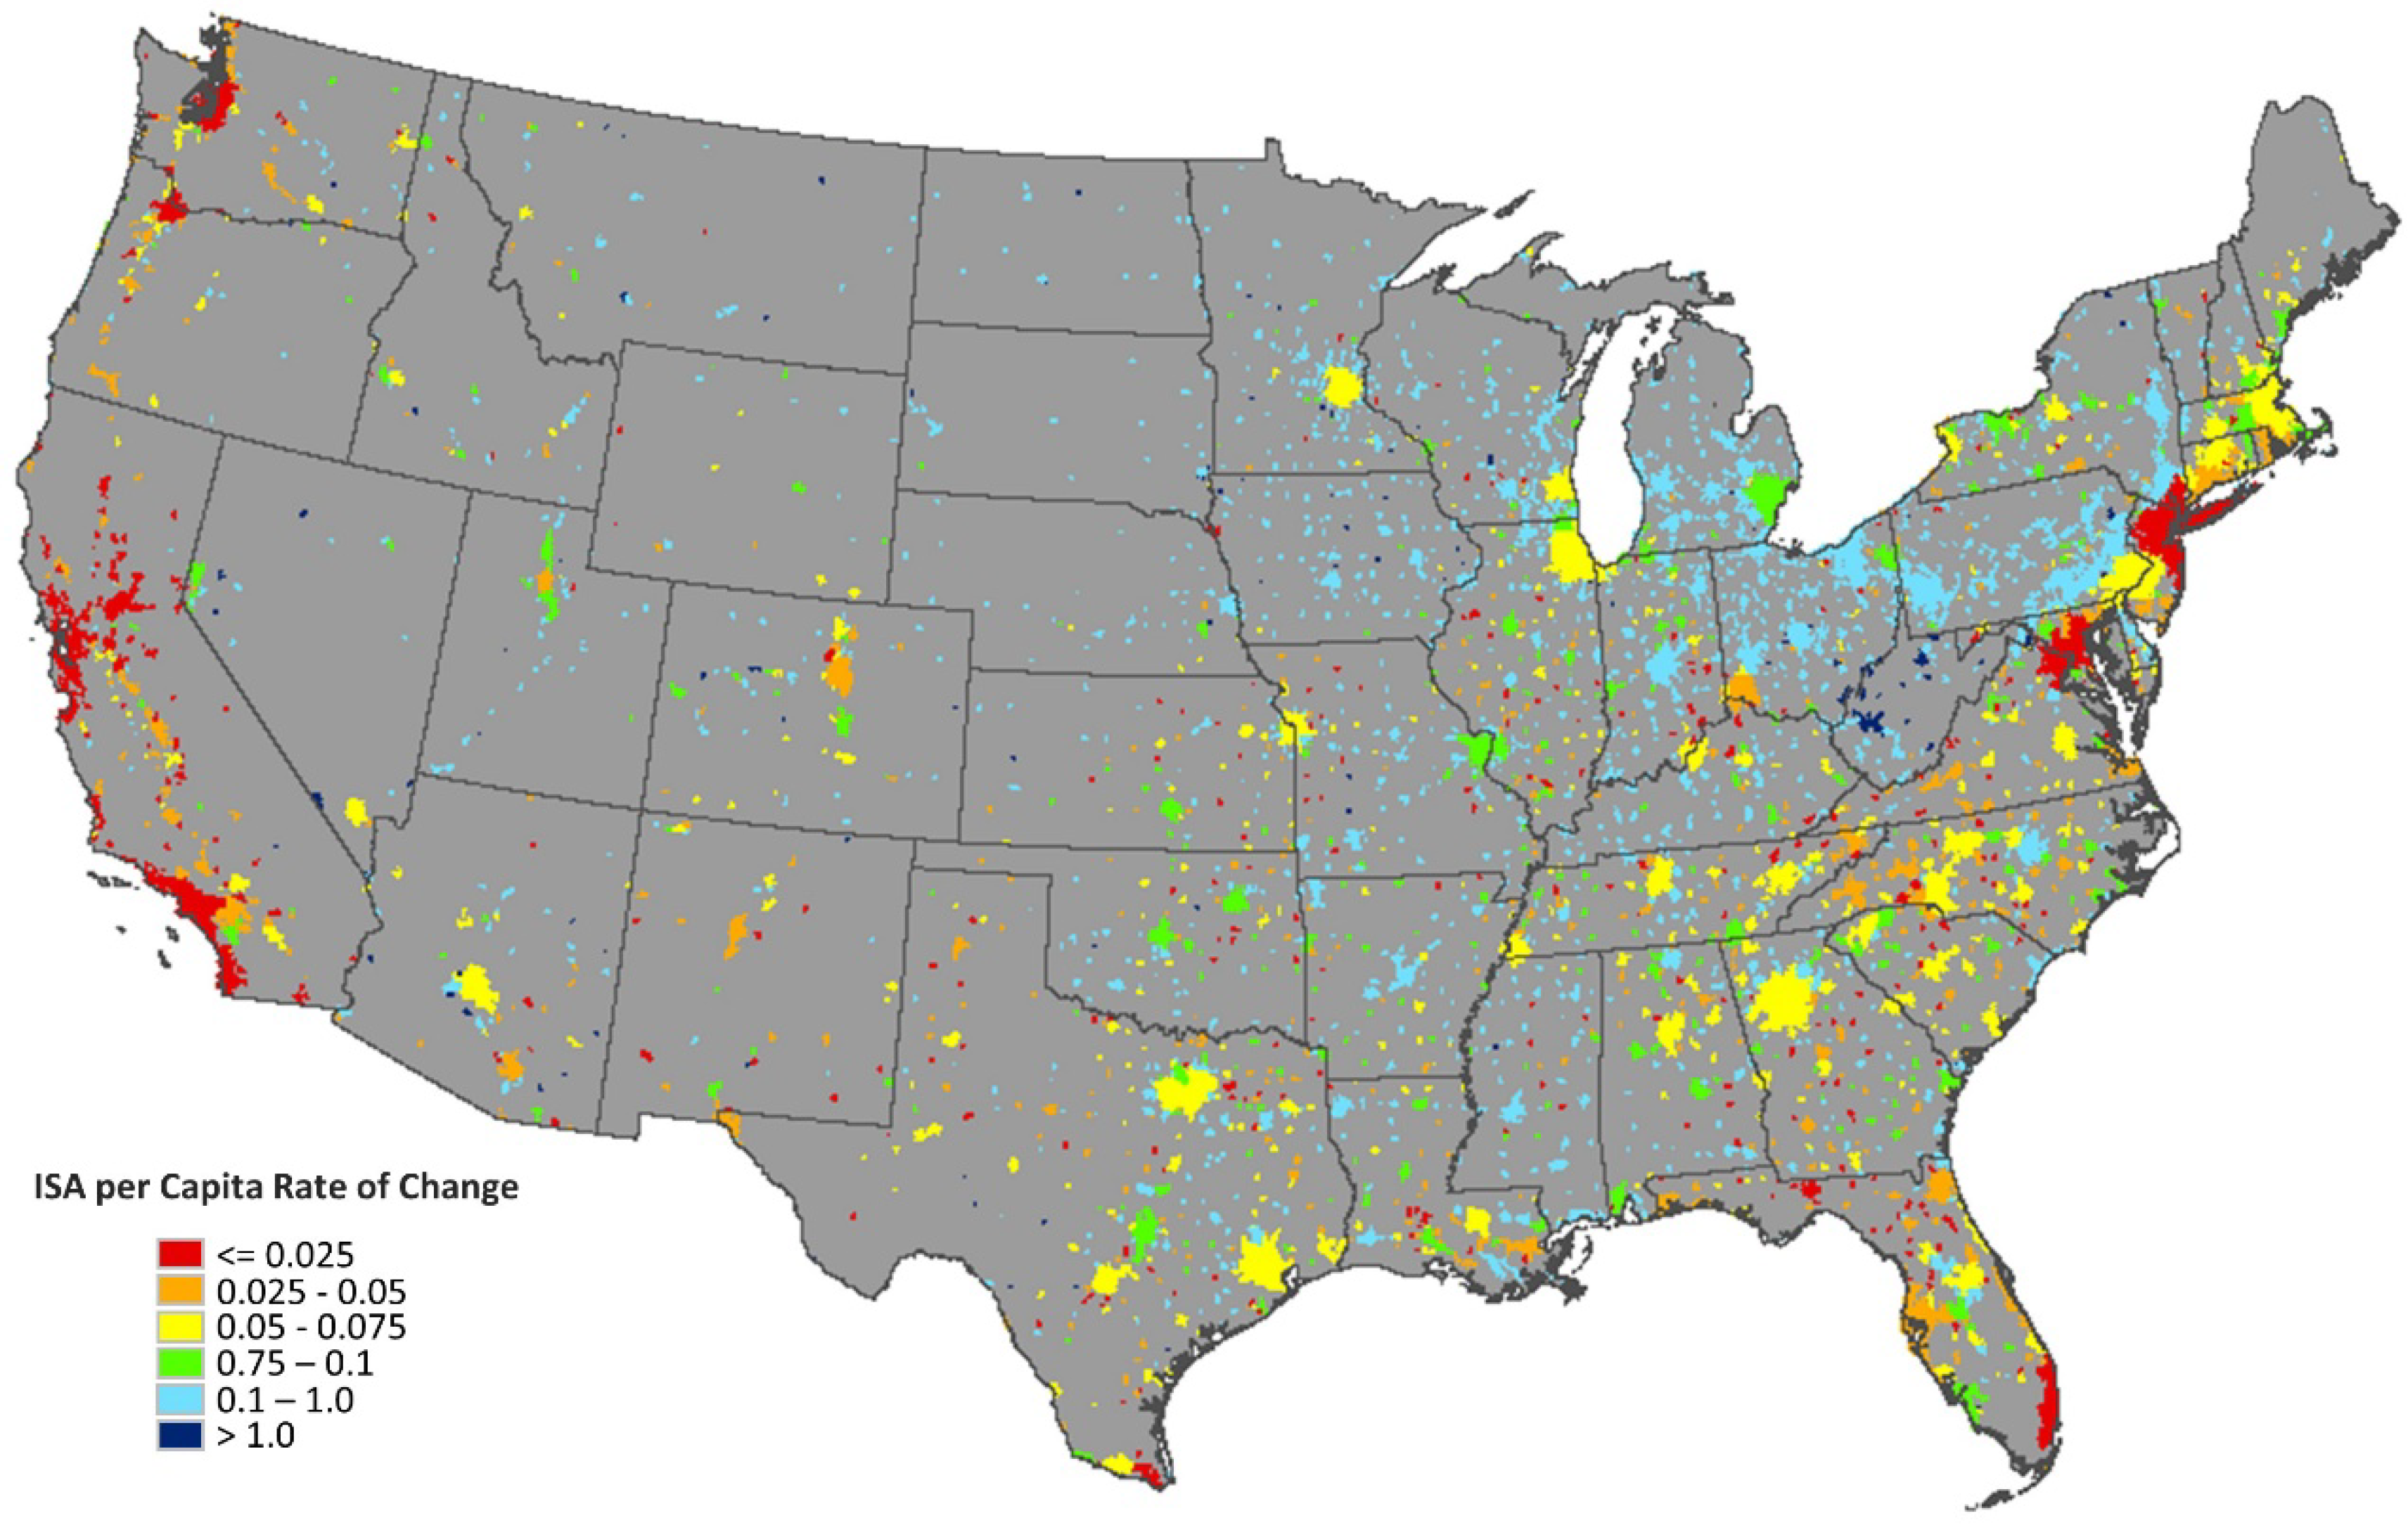
29] and the 2011 gridded population and ISA maps, we compute a spatially explicit decadal rate of change of ISA per capita at the CMG level. Then, using the gridded 2020 population, described in
Section 2.1, along with the decadal rate of change of ISA per capita, it is possible to estimate the size of ISA for each CMG for 2020. This algorithm assumes a linear relationship between population growth and ISA over the short 10-year period and takes into account an implicit regional specificity. The linearity of the algorithm is not granted, however a post algorithm analysis of the results showed only 1 CMG out of 500,000+ resulted in an ISA greater than unity. We considered a business as usual scenario in which impervious surface can, with an equal probability distribution, occupy any land cover type other than water. Thus a CMG increase or decrease in ISA was equally distributed over all other land cover types co-existing in the CMG. The relationship is spatially explicit and thus implicitly includes non-linearity aspects of the cultural and geographical heritage of each urban area of the CONUS, since different regions have different land use patterns. This approach does not pretend to predict the details of future land use but rather provides a first order spatially-explicit gridded increase in ISA at the horizon 2020. The determination of impervious surface growth using similar methodologies has been used in the past and has provided reasonable results [
30].
2.3. Geographic Location Statistics
The datasets produced were investigated at local, state, and continental scales in order to gain better insights into the future of population growth and land urbanization and its regional variation within the CONUS. Local- and state-scale zonal statistics were computed in ArcGIS using the Urban Areas 1:500k shapefile [
26] agglomerates along with the U.S. Census Bureau MAF/TIGER 1:500k Cartographic Boundary Shapefiles—Places (Incorporated Places and Census Designated Places) [
27] and the standard ESRI U.S. State Boundaries shapefile [
28] respectively. All data zonal boundaries were converted to a ‘gridded’ vector representation to conform to the CMG borders. The final projection system for all raster data is Geographic WGS84 conforming to land surface models input requirements. While performing the zonal statistical analyses, the data were projected to USA Contiguous Albers Equal Area Conic with all pixels representing an equal area. All areas in following sections, unless otherwise noted, are referred to as urban areas for the agglomerates and cities for the places and are reported in hectares (1 ha = 10
4 m
2).
4. Concluding Remarks
Sustainable urban growth requires the monitoring of the relationship between land use and population. In the United States population grew by 0.7% between 2015 and 2016, its slowest annual growth in about 80 years, bringing the total population to just over 323 million [
38]. Considering this relatively slow annual growth rate, the nation’s population is projected to reach 334,503,458 people by 2020 [
25]. Where and how this population growth is going to affect land use is not conveyed by this number. We developed a methodology based on historic growth pattern to spatially disaggregate this number to city-scale and further differentiate its distribution within urban and non-urban districts.
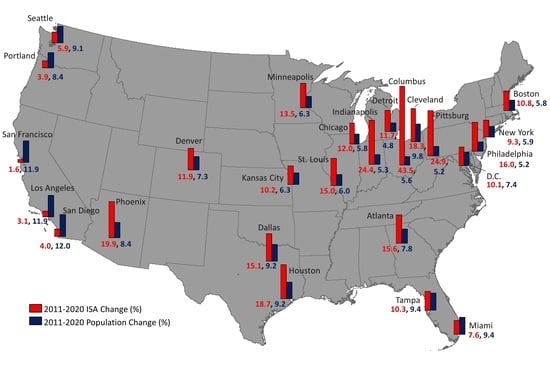
We find substantial variations in population and land development trends in different parts of the U.S. Most of the west coast large urban areas are projected to undergo a decrease in per capita land use between 2011 and 2020, with San Francisco (CA) leading the way with a 9.2% reduction. In most other areas of the CONUS, especially in the Upper Midwest, urban impervious surface areas are projected to increase significantly faster than population growth.
At city-level, on the east coast (e.g., New York, Miami) a population growth faster than land use is expected to reduce the per capita land use in 2020 leading to an increase in population density. Similar growth patterns are observed in large cities on the west coast (e.g., Los Angeles).
The land use and population dynamic observed at the city and urban area scales do not scale up to the state level and the top 5 CONUS states with highest ISA and population are set to remain the same between 2011 and 2020. At the continental scale, urbanization as reflected by ISA use is projected to expand by 0.17% between 2011 and 2020, an increase over the 0.11% reported between 2001 and 2011.


