Neighborhood Walkability and Housing Affordability among U.S. Urban Areas

Abstract
1. Introduction
2. Methodology
2.1. Study Area
2.2. Housing Affordability
2.3. Walkability
2.4. Modeling
2.5. Modeling: Control Variables
3. Results
3.1. National Analysis
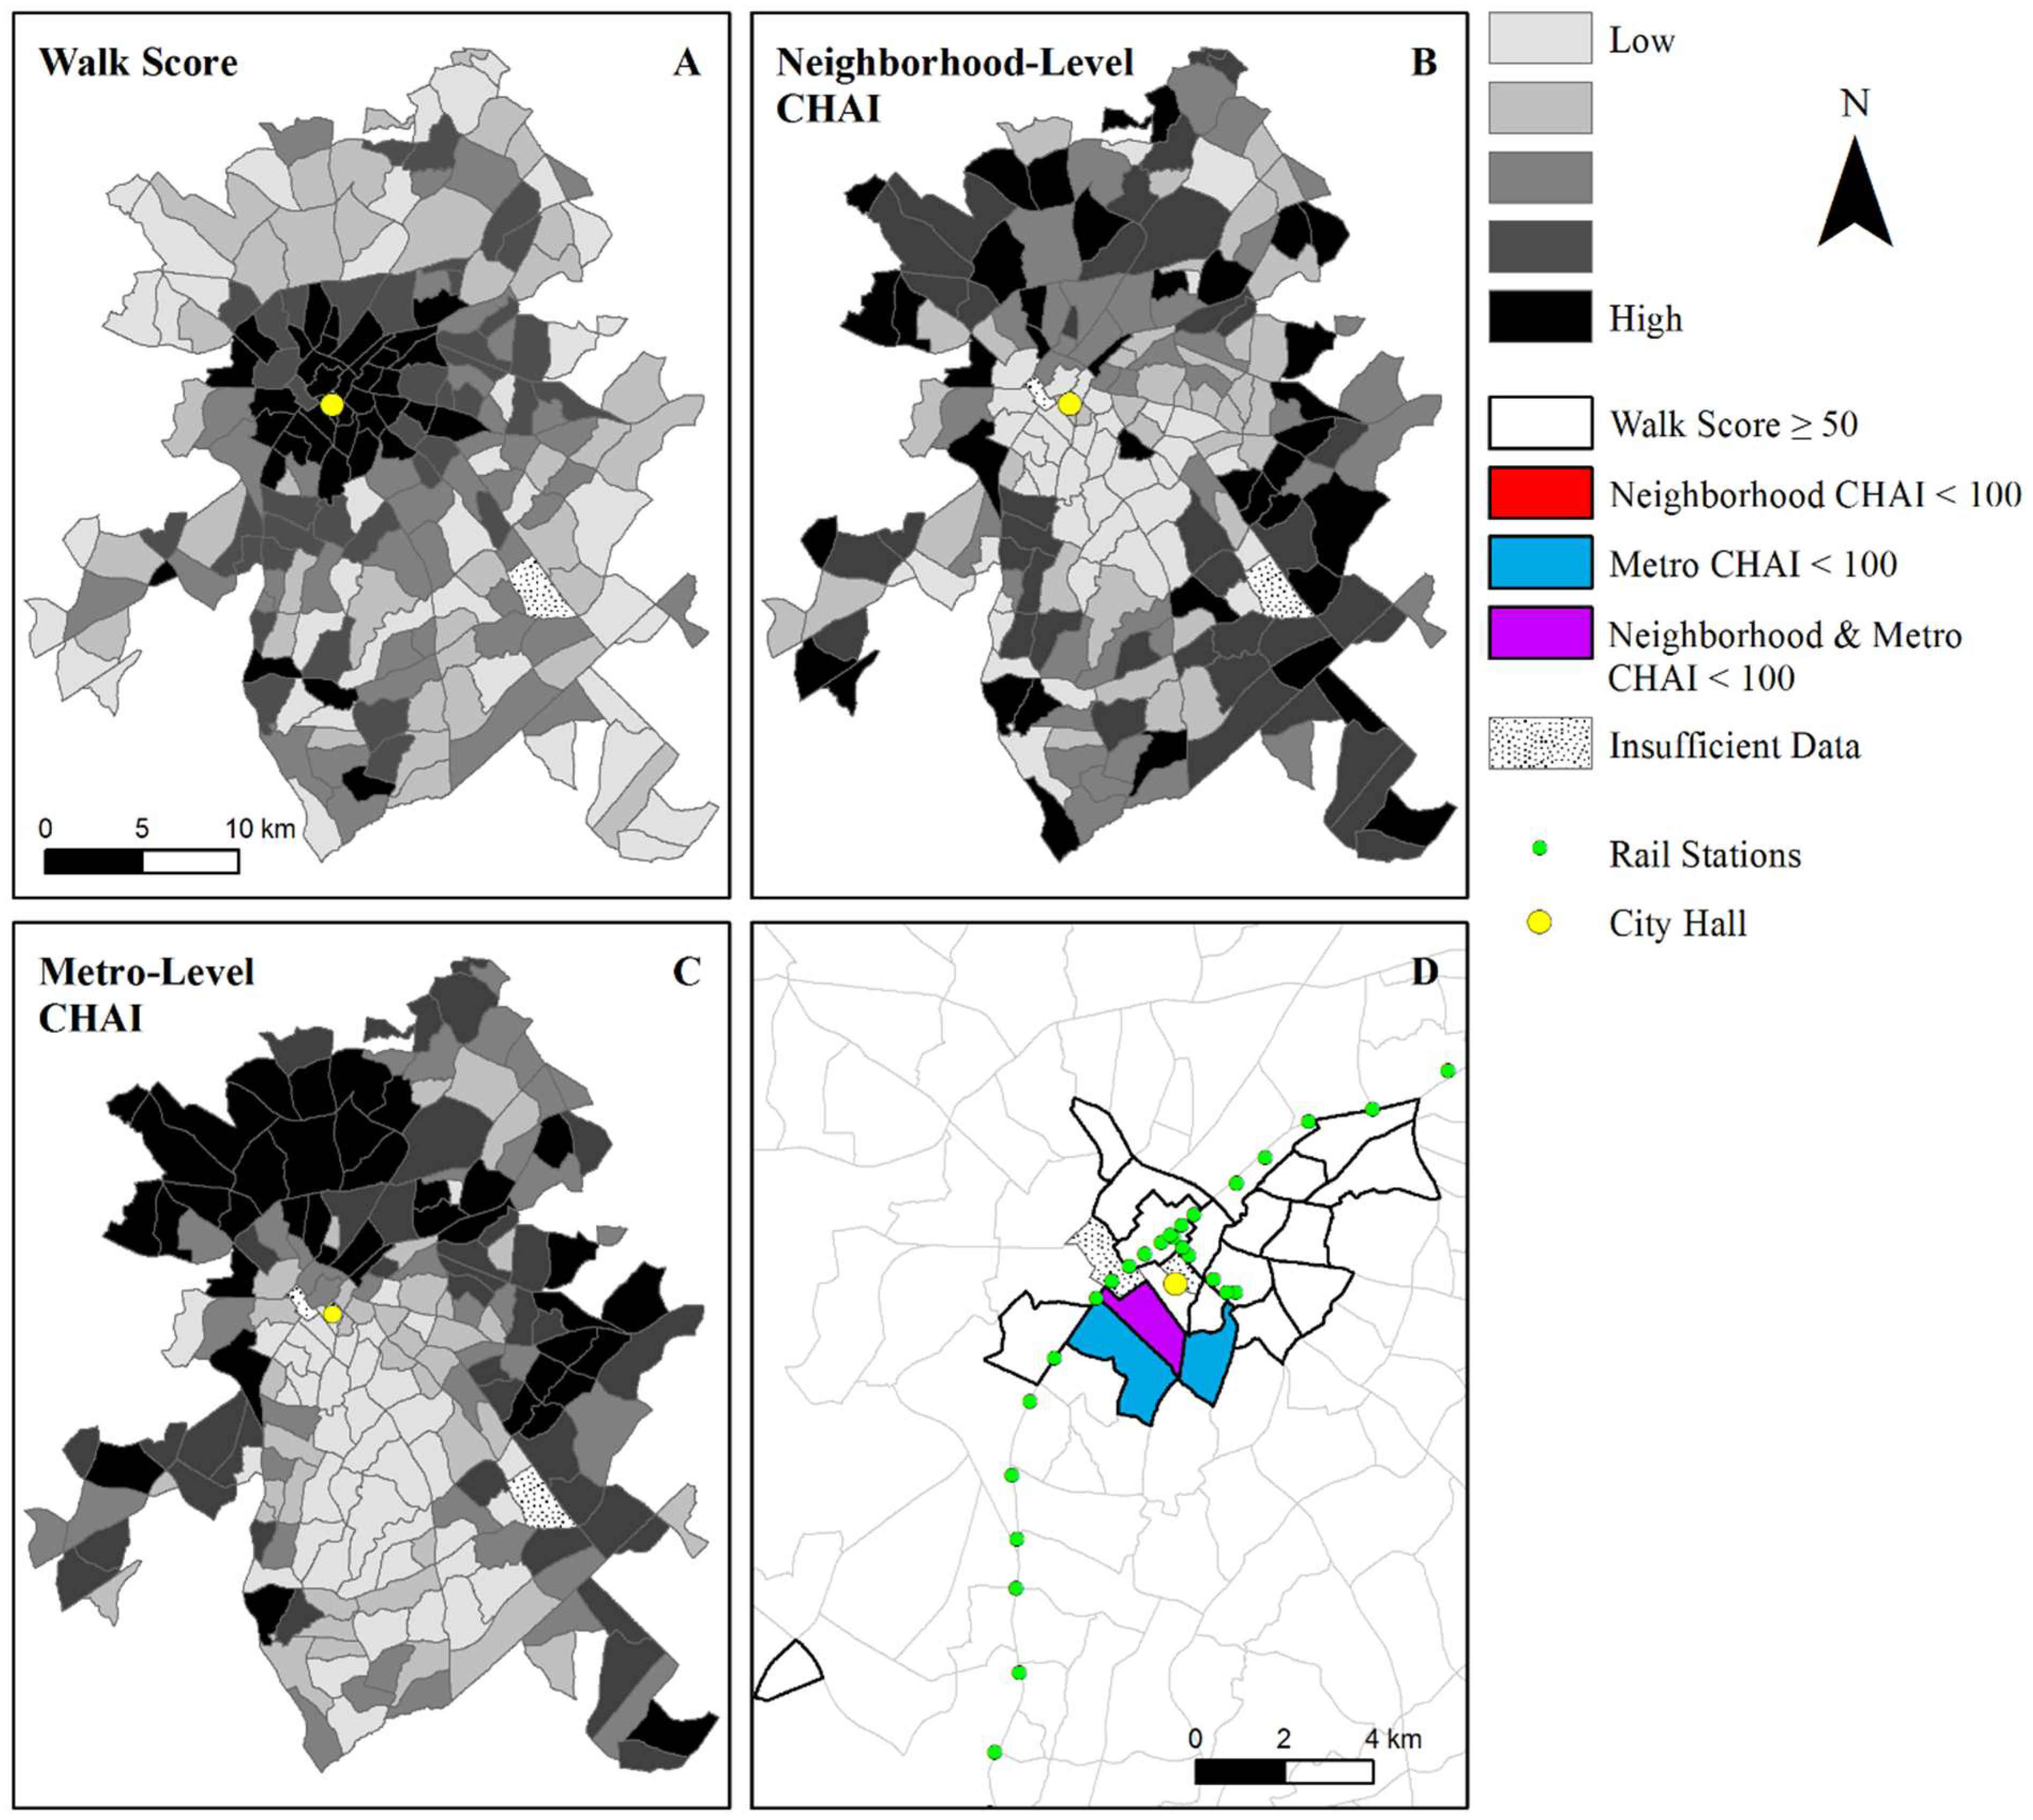
3.2. Case Studies
4. Discussion and Conclusions
Funding
Acknowledgments
Conflicts of Interest
References
- Sohmer, R.R.; Lang, R.E. Downtown Rebound (FMF Census Note 03); Fannie Mae: Washington, DC, USA, 2001. [Google Scholar]
- Birch, E.L. Having a longer view on downtown living. J. Am. Plan. Assoc. 2002, 68, 5–21. [Google Scholar] [CrossRef]
- Goetz, E.G. Clearing the Way: Deconcentrating the Poor in Urban America; The Urban Institute Press: Washington, DC, USA, 2003. [Google Scholar]
- Zukin, S.; Trujillo, V.; Frase, P.; Jackson, D.; Recuber, T.; Walker, A. New retail capital and neighborhood change: Boutiques and gentrification in New York City. City Community 2009, 8, 47–64. [Google Scholar] [CrossRef]
- Ehrenhalt, A. The Great Inversion and the Future of the American City; Random House, Inc.: New York, NY, USA, 2012; ISBN 978-0307474377. [Google Scholar]
- Florida, R. The Rise of the Creative Class; Basic Books: New York, NY, USA, 2002; ISBN 9780465024766. [Google Scholar]
- Brown, J.; Meczynski, M. “Complexcities”: Locational choices of creative knowledge workers. Built Environ. 2009, 35, 238–252. [Google Scholar] [CrossRef]
- Bereitschaft, B. Neighborhood change among creative-cultural districts in mid-sized US metropolitan areas, 2000–2010. Reg. Stud. Reg. Sci. 2014, 1, 158–183. [Google Scholar] [CrossRef]
- Moos, M. From gentrification to youthification? The increasing importance of young age in delineating high-density living. Urban Stud. 2016, 53, 2903–2920. [Google Scholar] [CrossRef]
- Talen, E. Pedestrian access as a measure of urban quality. Plan. Pract. Res. 2002, 17, 257–278. [Google Scholar] [CrossRef]
- Jabareen, Y.R. Sustainable urban forms: Their typologies, models, and concepts. J. Plan. Educ. Res. 2006, 26, 38–52. [Google Scholar] [CrossRef]
- Tran, M.C. Healthy cities—Walkability as a component of health-promoting urban planning and design. J. Sustain. Urban. Plan. Prog. 2016, 1, 11–21. [Google Scholar] [CrossRef]
- Frank, L.D.; Engelke, P. Impacts of the built environment on health: Walkable places and the exposure to air pollution. Int. Reg. Sci. Rev. 2005, 28, 193–216. [Google Scholar] [CrossRef]
- Lovasi, G.S.; Neckeman, K.M.; Quinn, J.W.; Weiss, C.C.; Rundle, A. Effect of individual or neighborhood disadvantage on the association between neighborhood walkability and body mass index. Am. J. Public Health 2009, 99, 279–284. [Google Scholar] [CrossRef]
- Sallis, J.F.; Saelens, B.; Frank, L.; Conway, T.L.; Slymen, D.J.; Cain, K.L.; Chapman, J.E.; Kerr, J. Neighborhood built environment and income: Examining multiple health outcomes. Soc. Sci. Med. 2009, 68, 1285–1293. [Google Scholar] [CrossRef] [PubMed]
- Leyden, K.M. Social capital and the built environment: The importance of walkable neighborhoods. Am. J. Public Health 2003, 93, 1546–1551. [Google Scholar] [CrossRef] [PubMed]
- French, S.; Wood, L.; Foster, S.A.; Giles-Corti, B.; Frank, L.; Learnihan, V. Sense of community and its association with the neighborhood built environment. Environ. Behav. 2013, 46, 677–697. [Google Scholar] [CrossRef]
- Kamruzzaman, M.; Wood, L.; Hine, J.; Currie, G.; Giles-Corti, B.; Turrell, G. Patterns of social capital associated with transit oriented development. J. Transp. Geogr. 2014, 35, 144–155. [Google Scholar] [CrossRef]
- Frank, L.D.; Sallis, J.F.; Conway, T.L.; Chapman, J.E.; Saelens, B.E.; Bachman, W. Many pathways from land use to health. J. Am. Plan. Assoc. 2006, 72, 75–87. [Google Scholar] [CrossRef]
- Stone, B.; Mednick, A.C.; Holloway, T.; Spak, S.N. Is compact growth good for air quality? J. Am. Plan. Assoc. 2007, 73, 404–420. [Google Scholar] [CrossRef]
- Brueckner, J.K.; Rosenthal, S.S. Gentrification and neighborhood housing cycles: Will America’s future downtowns be rich? Rev. Econ. Stat. 2009, 91, 725–743. [Google Scholar] [CrossRef]
- Goetz, E. Gentrification in black and white: The racial impact of public housing demolition in American cities. Urban Stud. 2010, 48, 1581–1604. [Google Scholar] [CrossRef]
- Myers, D. Peak Millennials: Three reinforcing cycles that amplify the rise and fall of urban concentration by millennials. Hous. Policy Debate 2016, 26, 928–947. [Google Scholar] [CrossRef]
- Neckerman, K.M.; Lovasi, G.S.; Davies, S.; Purciel, J.Q.; Feder, E.; Raghunath, N.; Wasserman, B.; Rundle, A. Disparities in urban neighborhood conditions: Evidence from GIS measures and field observation in New York City. J. Public Health Policy 2009, 30, S264–S285. [Google Scholar] [CrossRef]
- Koschinsky, J.; Talen, E. Affordable housing and walkable neighborhoods: A national urban analysis. Cityscape J. Policy Dev. Res. 2015, 17, 13–56. [Google Scholar]
- Riggs, W. Inclusively walkable: Exploring the equity of walkable housing in the San Francisco Bay Area. Local Environ. 2016, 21, 527–554. [Google Scholar] [CrossRef]
- Bereitschaft, B. Equity in neighbourhood walkability? A comparative analysis of three large U.S. cities. Local Environ. 2017, 22, 859–879. [Google Scholar] [CrossRef]
- Cortright, J. Walking the Walk: How Walkability Raises Home Values in U.S. Cities. CEOs for Cities, August 2009. Available online: http://blog.walkscore.com/wp-content/uploads/2009/08/WalkingTheWalk_CEOsforCities.pdf (accessed on 2 August 2018).
- Rauterkus, S.Y.; Miller, N.G. Residential land values and walkability. J. Sustain. Real Estate 2011, 3, 23–43. [Google Scholar] [CrossRef]
- Sohn, D.W.; Moudon, A.V.; Lee, J. The economic value of walkable neighborhoods. Urban Des. Int. 2012, 17, 115–128. [Google Scholar] [CrossRef]
- Bartholomew, K.; Ewing, R. Hedonic price effects of pedestrian- and transit-oriented development. J. Plan. Lit. 2011, 26, 18–34. [Google Scholar] [CrossRef]
- Olaru, D.; Smith, B.; Taplin, J.H.E. Residential location and transit-oriented development in a new rail corridor. Transp. Res. Part A 2011, 45, 219–237. [Google Scholar] [CrossRef]
- Hass, P.M.; Makarewicz, C.; Benedict, A.; Sanchez, T.W.; Dawkins, C.J. Housing & Transportation Cost Trade-Offs and Burdens of Working Households in 28 Metros; Center for Neighborhood Technology and Virginia Tech: Chicago, IL, USA; Blacksburg, VA, USA, 2006. [Google Scholar]
- Mattingly, K.; Morrissey, J. Housing and transport expenditure: Socio-spatial indicators of affordability in Auckland. Cities 2014, 38, 69–83. [Google Scholar] [CrossRef]
- Mulliner, E.; Smallbone, K.; Maliene, V. An assessment of sustainable housing affordability using a multiple criteria decision making method. Omega 2013, 41, 270–279. [Google Scholar] [CrossRef]
- U.S. Bureau of Labor Statistics. Economic News Release: Consumer Expenditures—2016. 2017. Available online: https://www.bls.gov/news.release/cesan.nr0.htm (accessed on 23 April 2018).
- Kiersz, A. The Economies of the 40 Biggest US Cities, Ranked from Worst to Best. Business Insider. 20 June 2018. Available online: https://www.businessinsider.com/us-economy-by-metro-area-ranked-san-francisco-seattle-austin-2018-4 (accessed on 3 December 2018).
- National Association of Realtors (NAR). Housing Affordability Index: Methodology. Available online: https://www.nar.realtor/research-and-statistics/housing-statistics/housing-affordability-index/methodology (accessed on 10 July 2018).
- U.S. Census Bureau. 2012–2016 American Community Survey 5-Year Estimates. Available online: http://factfinder2.census.gov (accessed on 12 July 2018).
- Piazzesi, M.; Schneider, M.; Tuzel, S. Housing, Consumption and Asset Pricing. J. Financ. Econ. 2007, 83, 531–569. [Google Scholar] [CrossRef]
- Walk Score®. 2018. Available online: https://www.walkscore.com/methodology.shtml (accessed on 24 June 2018).
- Duncan, D.T.; Meline, J.; Kestens, Y.; Day, K.; Elbel, B.; Trasande, L.; Chaix, B. Walk Score, transportation mode choice, and walking among French adults: A GPS, accelerometer, and mobility survey study. Int. J. Res. Public Health 2016, 13, 611. [Google Scholar] [CrossRef]
- Towne, S.D., Jr.; Won, J.; Lee, S.; Ory, M.G.; Forjuoh, S.N.; Wang, S.; Lee, C. Using Walk ScoreTM and neighborhood perceptions to assess walking among middle-aged and older adults. J. Community Health 2016, 41, 977–988. [Google Scholar] [CrossRef]
- McDonald, N.C. The effect of objectively measured crime on walking in minority adults. American J. Health Prom. 2008, 22, 433–436. [Google Scholar] [CrossRef] [PubMed]
- Satariano, W.A.; Ivey, S.L.; Kurtovich, E.; Kealey, M.; Hubbard, A.E.; Bayles, C.M.; Bryant, L.L.; Hunter, R.H.; Prohaska, T.R. Lower-body function, neighborhoods, and walking in an older population. Am. J. Prev. Med. 2010, 38, 419–428. [Google Scholar] [CrossRef] [PubMed]
- Lachapelle, U.; Noland, R.B. Inconsistencies in associations between crime and walking: A reflection of poverty and density. Int. J. Sustain. Transp. 2015, 9, 103–115. [Google Scholar] [CrossRef]
- Hess, D.B.; Almeida, T.M. Impact of proximity to light rail rapid transit on station-area property values in Buffalo, New York. Urban Stud. 2007, 44, 1041–1068. [Google Scholar] [CrossRef]
- Immergluck, D. Large redevelopment initiatives, housing values and gentrification: The case of the Atlanta Beltline. Urban Stud. 2009, 46, 1723–1745. [Google Scholar] [CrossRef]
- Ben-Akiva, M.; Morikawa, T. Comparing ridership attraction of rail and bus. Transp. Policy 2002, 9, 107–116. [Google Scholar] [CrossRef]
- Currie, G. The demand performance of bus rapid transit. J. Public Trans. 2005, 8, 41–55. [Google Scholar] [CrossRef]
- Noland, R.B.; Weiner, M.D.; DiPetrillo, S.; Kay, A.I. Attitudes toward transit-oriented development: Resident experiences and professional perspectives. J. Transp. Geogr. 2017, 60, 130–140. [Google Scholar] [CrossRef]
- Rubin, G.M. Is housing age a commodity? Hedonic price estimates of unit age. J. Hous. Res. 1993, 4, 165–184. [Google Scholar]
- Zhao, N. Half of US Homes Built before 1980. National Association of Homebuilders. Available online: http://eyeonhousing.org/2018/08/half-of-us-homes-built-before-1980 (accessed on 8 August 2018).
- Franklin, J.P.; Waddell, P. A hedonic regression of home prices in King County, Washington, using activity-specific accessibility measures (pp. 16). Presented at the TRB 2003 Annual Meeting, Washington, DC, USA, 12–16 January 2003. [Google Scholar]
- U.S. Department of Housing and Urban Development (HUD). Location Affordability Index Data and Methodology—Version 2.1. September 2016. Available online: https://www.hudexchange.info/resources/documents/Location-Affordability-Index-Data-and-Methodology-V2.1.pdf (accessed on 15 August 2018).
- Glaeser, E.L.; Gyourko, J. The impact of building restrictions on housing affordability. Econ. Policy Rev. 2003, 9, 21–39. [Google Scholar]
- Saiz, A. The geographic determinants of housing supply. Quart. J. Econ. 2010, 125, 1253–1296. [Google Scholar] [CrossRef]
- Hilber, C.A.L. Neighborhood externality risk and the homeownership status of properties. J. Urban Econ. 2005, 57, 213–241. [Google Scholar] [CrossRef]
- Phillips, J.; Goodstein, E. Growth management and housing prices: The case of Portland. Contemp. Econ. Policy 2000, 18, 334–344. [Google Scholar] [CrossRef]
- Cox, W. A Question of Values: Middle-Income Housing Affordability and Urban Containment Policy. Frontier Centre for Public Policy No. 180. , October 2015. Available online: https://fcpp.org/wp-content/uploads/PS180-Cox-A-Question-of-Values_CF1.pdf (accessed on 30 August 2018).
- Li, W.; Joh, K.; Lee, C.; Kim, H.-W.; Park, H.; Woo, A. Assessing benefits of neighborhood walkability to single-family property values: A spatial hedonic study in Austin, Texas. J. Plan. Res. 2015, 35, 471–488. [Google Scholar] [CrossRef]
- Gilderbloom, J.I.; Riggs, W.W.; Meares, W.L. Does walkability matter? An examination of walkability’s impact on housing values, foreclosures and crime. Cities 2015, 42, 13–24. [Google Scholar] [CrossRef]
- Bereitschaft, B. Equity in microscale urban design and walkability: A photographic survey of six Pittsburgh streetscapes. Sustainability 2017, 9, 1233. [Google Scholar] [CrossRef]
- Saberi, M.; Wu, H.; Amoh-Gyimah, R.; Smith, J.; Arunachalam, D. Measuring housing and transportation affordability: A case study of Melbourne, Australia. J. Transp. Geogr. 2017, 65, 134–146. [Google Scholar] [CrossRef]
- Fields, D. Contesting the financialization of urban space: Community organizations and the struggle to preserve affordable rental housing in New York City. J. Urban Affairs 2015, 37, 144–165. [Google Scholar] [CrossRef]
- Marom, N.; Carmon, N. Affordable housing plans in London and New York: Between marketplace and social mix. Hous. Stud. 2015, 30. [Google Scholar] [CrossRef]
- Rosen, G.; Walks, A. Castles in Toronto’s sky: Condo-ism as urban transformation. J. Urban Affairs 2015, 37, 289–310. [Google Scholar] [CrossRef]
- Fotheringham, A.S.; Brunsdon, C.; Charlton, M. Geographical Weighted Regression: The Analysis of Spatially Varying Relationships; John Wiley & Sons Ltd.: Chichester, UK, 2002. [Google Scholar]


| Neighborhood Scale | Metropolitan Scale | |||||
|---|---|---|---|---|---|---|
| B | S.E. | Sig. | B | S.E. | Sig. | |
| Renter + Owner | ||||||
| Constant | 2.040 | 0.018 | <0.001 | 2.880 | 0.043 | <0.001 |
| Walk Score | −0.002 | <0.001 | <0.001 | -- | -- | -- |
| ‡ Crime Index | -- | -- | -- | 0.040 | 0.005 | <0.001 |
| Rail Within 2 km | -- | -- | -- | -- | -- | -- |
| Coast Within 100 km | −0.088 | 0.006 | <0.001 | −0.085 | 0.007 | <0.001 |
| ‡ Employment Access | -- | -- | -- | −0.069 | 0.004 | <0.001 |
| ‡ % Housing Post-1980 | -- | -- | -- | −0.036 | 0.004 | <0.001 |
| No. Bedrooms | 0.044 | 0.003 | <0.001 | -- | -- | -- |
| Model r2 | 0.398 | 0.267 | ||||
| Owner Only | ||||||
| Constant | 3.018 | 0.051 | <0.001 | 2.89 | 0.087 | <0.001 |
| Walk Score | -- | -- | -- | -- | -- | -- |
| ‡ Crime Index | -- | -- | -- | 0.125 | 0.007 | <0.001 |
| Rail Within 2 km | -- | -- | -- | -- | -- | -- |
| Coast Within 100 km | −0.159 | 0.008 | <0.001 | −0.125 | 0.010 | <0.001 |
| ‡ Employment Access | −0.094 | 0.004 | <0.001 | −0.093 | 0.005 | <0.001 |
| ‡ % Housing Post-1980 | -- | -- | -- | −0.038 | 0.005 | <0.001 |
| No. Bedrooms | 0.042 | 0.003 | <0.001 | -- | -- | -- |
| Model r2 | 0.428 | 0.352 | ||||
| Renter Only | ||||||
| Constant | 2.215 | 0.030 | <0.001 | 1.956 | 0.039 | <0.001 |
| Walk Score | −0.001 | <0.001 | <0.001 | -- | -- | -- |
| ‡ Crime Index | −0.035 | 0.004 | <0.001 | −0.056 | 0.003 | <0.001 |
| Rail Within 2 km | -- | -- | -- | -- | -- | -- |
| Coast Within 100 km | -- | -- | -- | -- | -- | -- |
| ‡ Employment Access | -- | -- | -- | 0.021 | 0.003 | <0.001 |
| ‡ % Housing Post-1980 | -- | -- | -- | -- | -- | -- |
| No. Bedrooms | 0.011 | 0.003 | <0.001 | 0.026 | 0.002 | <0.001 |
| Model r2 | 0.116 | 0.204 | ||||
| Neighborhood Scale | Metropolitan Scale | |||||
|---|---|---|---|---|---|---|
| B | S.E. | Sig. | B | S.E. | Sig. | |
| Renter + Owner | ||||||
| Constant | 2.991 | 0.101 | <0.001 | 3.363 | 0.146 | <0.001 |
| Walk Score | -- | -- | -- | -- | -- | -- |
| ‡ Crime Index | -- | -- | -- | 0.135 | 0.017 | <0.001 |
| ‡ Distance to Rail | -- | -- | -- | -- | -- | -- |
| ‡ Employment Access | −0.075 | 0.010 | <0.001 | −0.175 | 0.018 | <0.001 |
| ‡ % Housing Post-1980 | -- | -- | -- | -- | -- | -- |
| No. Bedrooms | -- | -- | -- | -- | -- | -- |
| Model r2 | 0.230 | 0.345 | ||||
| Owner Only | ||||||
| Constant | 2.143 | 0.058 | <0.001 | 3.456 | 0.233 | <0.001 |
| Walk Score | -- | -- | -- | -- | -- | -- |
| ‡ Crime Index | 0.101 | 0.014 | <0.001 | 0.327 | 0.027 | <0.001 |
| ‡ Distance to Rail | -- | -- | -- | -- | -- | -- |
| ‡ Employment Access | −0.094 | 0.015 | <0.001 | -0.261 | 0.028 | <0.001 |
| ‡ % Housing Post-1980 | -- | -- | -- | -- | -- | -- |
| No. Bedrooms | -- | -- | -- | -- | -- | -- |
| Model r2 | 0.230 | 0.443 | ||||
| Renter Only | ||||||
| Constant | 1.782 | 0.065 | <0.001 | 2.530 | 0.050 | <0.001 |
| Walk Score | -- | -- | -- | -- | -- | -- |
| ‡ Crime Index | 0.045 | 0.013 | <0.001 | −0.111 | 0.010 | <0.001 |
| ‡ Distance to Rail | -- | -- | -- | -- | -- | -- |
| ‡ Employment Access | -- | -- | -- | -- | -- | -- |
| ‡ % Housing Post-1980 | -- | -- | -- | −0.29 | 0.008 | <0.001 |
| No. Bedrooms | -- | -- | -- | -- | -- | -- |
| Model r2 | 0.056 | 0.372 | ||||
| Neighborhood Scale | Metropolitan Scale | |||||
|---|---|---|---|---|---|---|
| B | S.E. | Sig. | B | S.E. | Sig. | |
| Renter + Owner | ||||||
| Constant | 2.280 | 0.052 | <0.001 | 2.473 | 0.021 | <0.001 |
| Walk Score | −0.001 | <0.001 | <0.001 | -- | -- | -- |
| ‡ Crime Index | -- | -- | -- | -- | -- | -- |
| ‡ Distance to Rail | -- | -- | -- | -- | -- | -- |
| ‡ Employment Access | -- | -- | -- | -- | -- | -- |
| ‡ % Housing Post-1980 | −0.032 | 0.008 | <0.001 | −0.066 | 0.012 | <0.001 |
| No. Bedrooms | 0.033 | 0.007 | <0.001 | -- | -- | -- |
| Model r2 | 0.233 | 0.084 | ||||
| Owner Only | ||||||
| Constant | 2.446 | 0.041 | <0.001 | 1.986 | 0.071 | <0.001 |
| Walk Score | -- | -- | -- | -- | -- | -- |
| ‡ Crime Index | 0.028 | 0.008 | 0.001 | 0.124 | 0.016 | <0.001 |
| ‡ Distance to Rail | -- | -- | -- | -- | -- | -- |
| ‡ Employment Access | -- | -- | -- | -- | -- | -- |
| ‡ % Housing Post-1980 | −0.043 | 0.008 | <0.001 | -- | -- | -- |
| No. Bedrooms | -- | -- | -- | -- | -- | -- |
| Model r2 | 0.140 | 0.155 | ||||
| Renter Only | ||||||
| Constant | 1.816 | <0.001 | <0.001 | 1.074 | 0.170 | <0.001 |
| Walk Score | -- | -- | -- | -- | -- | -- |
| ‡ Crime Index | 0.046 | 0.011 | <0.001 | -- | -- | -- |
| ‡ Distance to Rail | -- | -- | -- | -- | -- | -- |
| ‡ Employment Access | -- | -- | -- | -- | -- | -- |
| ‡ % Housing Post-1980 | -- | -- | -- | -- | -- | -- |
| No. Bedrooms | -- | -- | -- | 0.050 | 0.008 | <0.001 |
| Model r2 | 0.054 | 0.111 | ||||
| Neighborhood Scale | Metropolitan Scale | |||||
|---|---|---|---|---|---|---|
| B | S.E. | Sig. | B | S.E. | Sig. | |
| Renter + Owner | ||||||
| Constant | 2.773 | 0.060 | <0.001 | 3.147 | 0.078 | <0.001 |
| Walk Score | -- | -- | -- | -- | -- | -- |
| ‡ Crime Index | -- | -- | -- | -- | -- | -- |
| ‡ Distance to Rail | -- | -- | -- | -- | -- | -- |
| ‡ % Housing Post-1980 | -- | -- | -- | -- | -- | -- |
| ‡ Employment Access | −0.060 | 0.006 | <0.001 | -0.097 | 0.007 | <0.001 |
| No. Bedrooms | -- | -- | -- | -- | -- | -- |
| Model r2 | 0.238 | 0.306 | ||||
| Owner Only | ||||||
| Constant | 2.941 | 0.064 | <0.001 | 3.428 | 0.133 | <0.001 |
| Walk Score | -- | -- | -- | -- | -- | -- |
| ‡ Crime Index | -- | -- | -- | -- | -- | -- |
| ‡ Distance to Rail | -- | -- | -- | -- | -- | -- |
| ‡ % Housing Post-1980 | -- | -- | -- | -- | -- | -- |
| ‡ Employment Access | −0.071 | 0.006 | <0.001 | -0.117 | 0.013 | <0.001 |
| No. Bedrooms | -- | -- | -- | -- | -- | -- |
| Model r2 | 0.279 | 0.197 | ||||
| Renter Only | ||||||
| Constant | 2.146 | 0.026 | <0.001 | 2.382 | 0.031 | <0.001 |
| Walk Score | -- | -- | -- | −0.001 | <0.001 | 0.002 |
| ‡ Crime Index | -- | -- | -- | −0.051 | 0.007 | <0.001 |
| ‡ Distance to Rail | -- | -- | -- | -- | -- | -- |
| ‡ % Housing Post-1980 | -- | -- | -- | −0.028 | 0.005 | <0.001 |
| ‡ Employment Access | -- | -- | -- | -- | -- | -- |
| No. Bedrooms | −0.022 | 0.005 | 0.001 | -- | -- | -- |
| 0.059 | 0.288 | |||||
© 2019 by the author. Licensee MDPI, Basel, Switzerland. This article is an open access article distributed under the terms and conditions of the Creative Commons Attribution (CC BY) license (http://creativecommons.org/licenses/by/4.0/).
Share and Cite
Bereitschaft, B. Neighborhood Walkability and Housing Affordability among U.S. Urban Areas. Urban Sci. 2019, 3, 11. https://doi.org/10.3390/urbansci3010011
Bereitschaft B. Neighborhood Walkability and Housing Affordability among U.S. Urban Areas. Urban Science. 2019; 3(1):11. https://doi.org/10.3390/urbansci3010011
Chicago/Turabian StyleBereitschaft, Bradley. 2019. "Neighborhood Walkability and Housing Affordability among U.S. Urban Areas" Urban Science 3, no. 1: 11. https://doi.org/10.3390/urbansci3010011
APA StyleBereitschaft, B. (2019). Neighborhood Walkability and Housing Affordability among U.S. Urban Areas. Urban Science, 3(1), 11. https://doi.org/10.3390/urbansci3010011