
Correlations between Spatial Attributes and Visitor Stay in Chinese Gardens: A Case Study of the Ningbo Tianyige Museum Gardens


Abstract
:1. Introduction
1.1. Background
1.2. Literature Review
1.3. Research Aim and Objective
- What are the spatial characteristics of Tianyige Museum gardens with different spatial types?
- How are the visitor stays distributed in the Tianyige Museum gardens?
- Which spatial attributes have an impact on the visitor stay preferences?
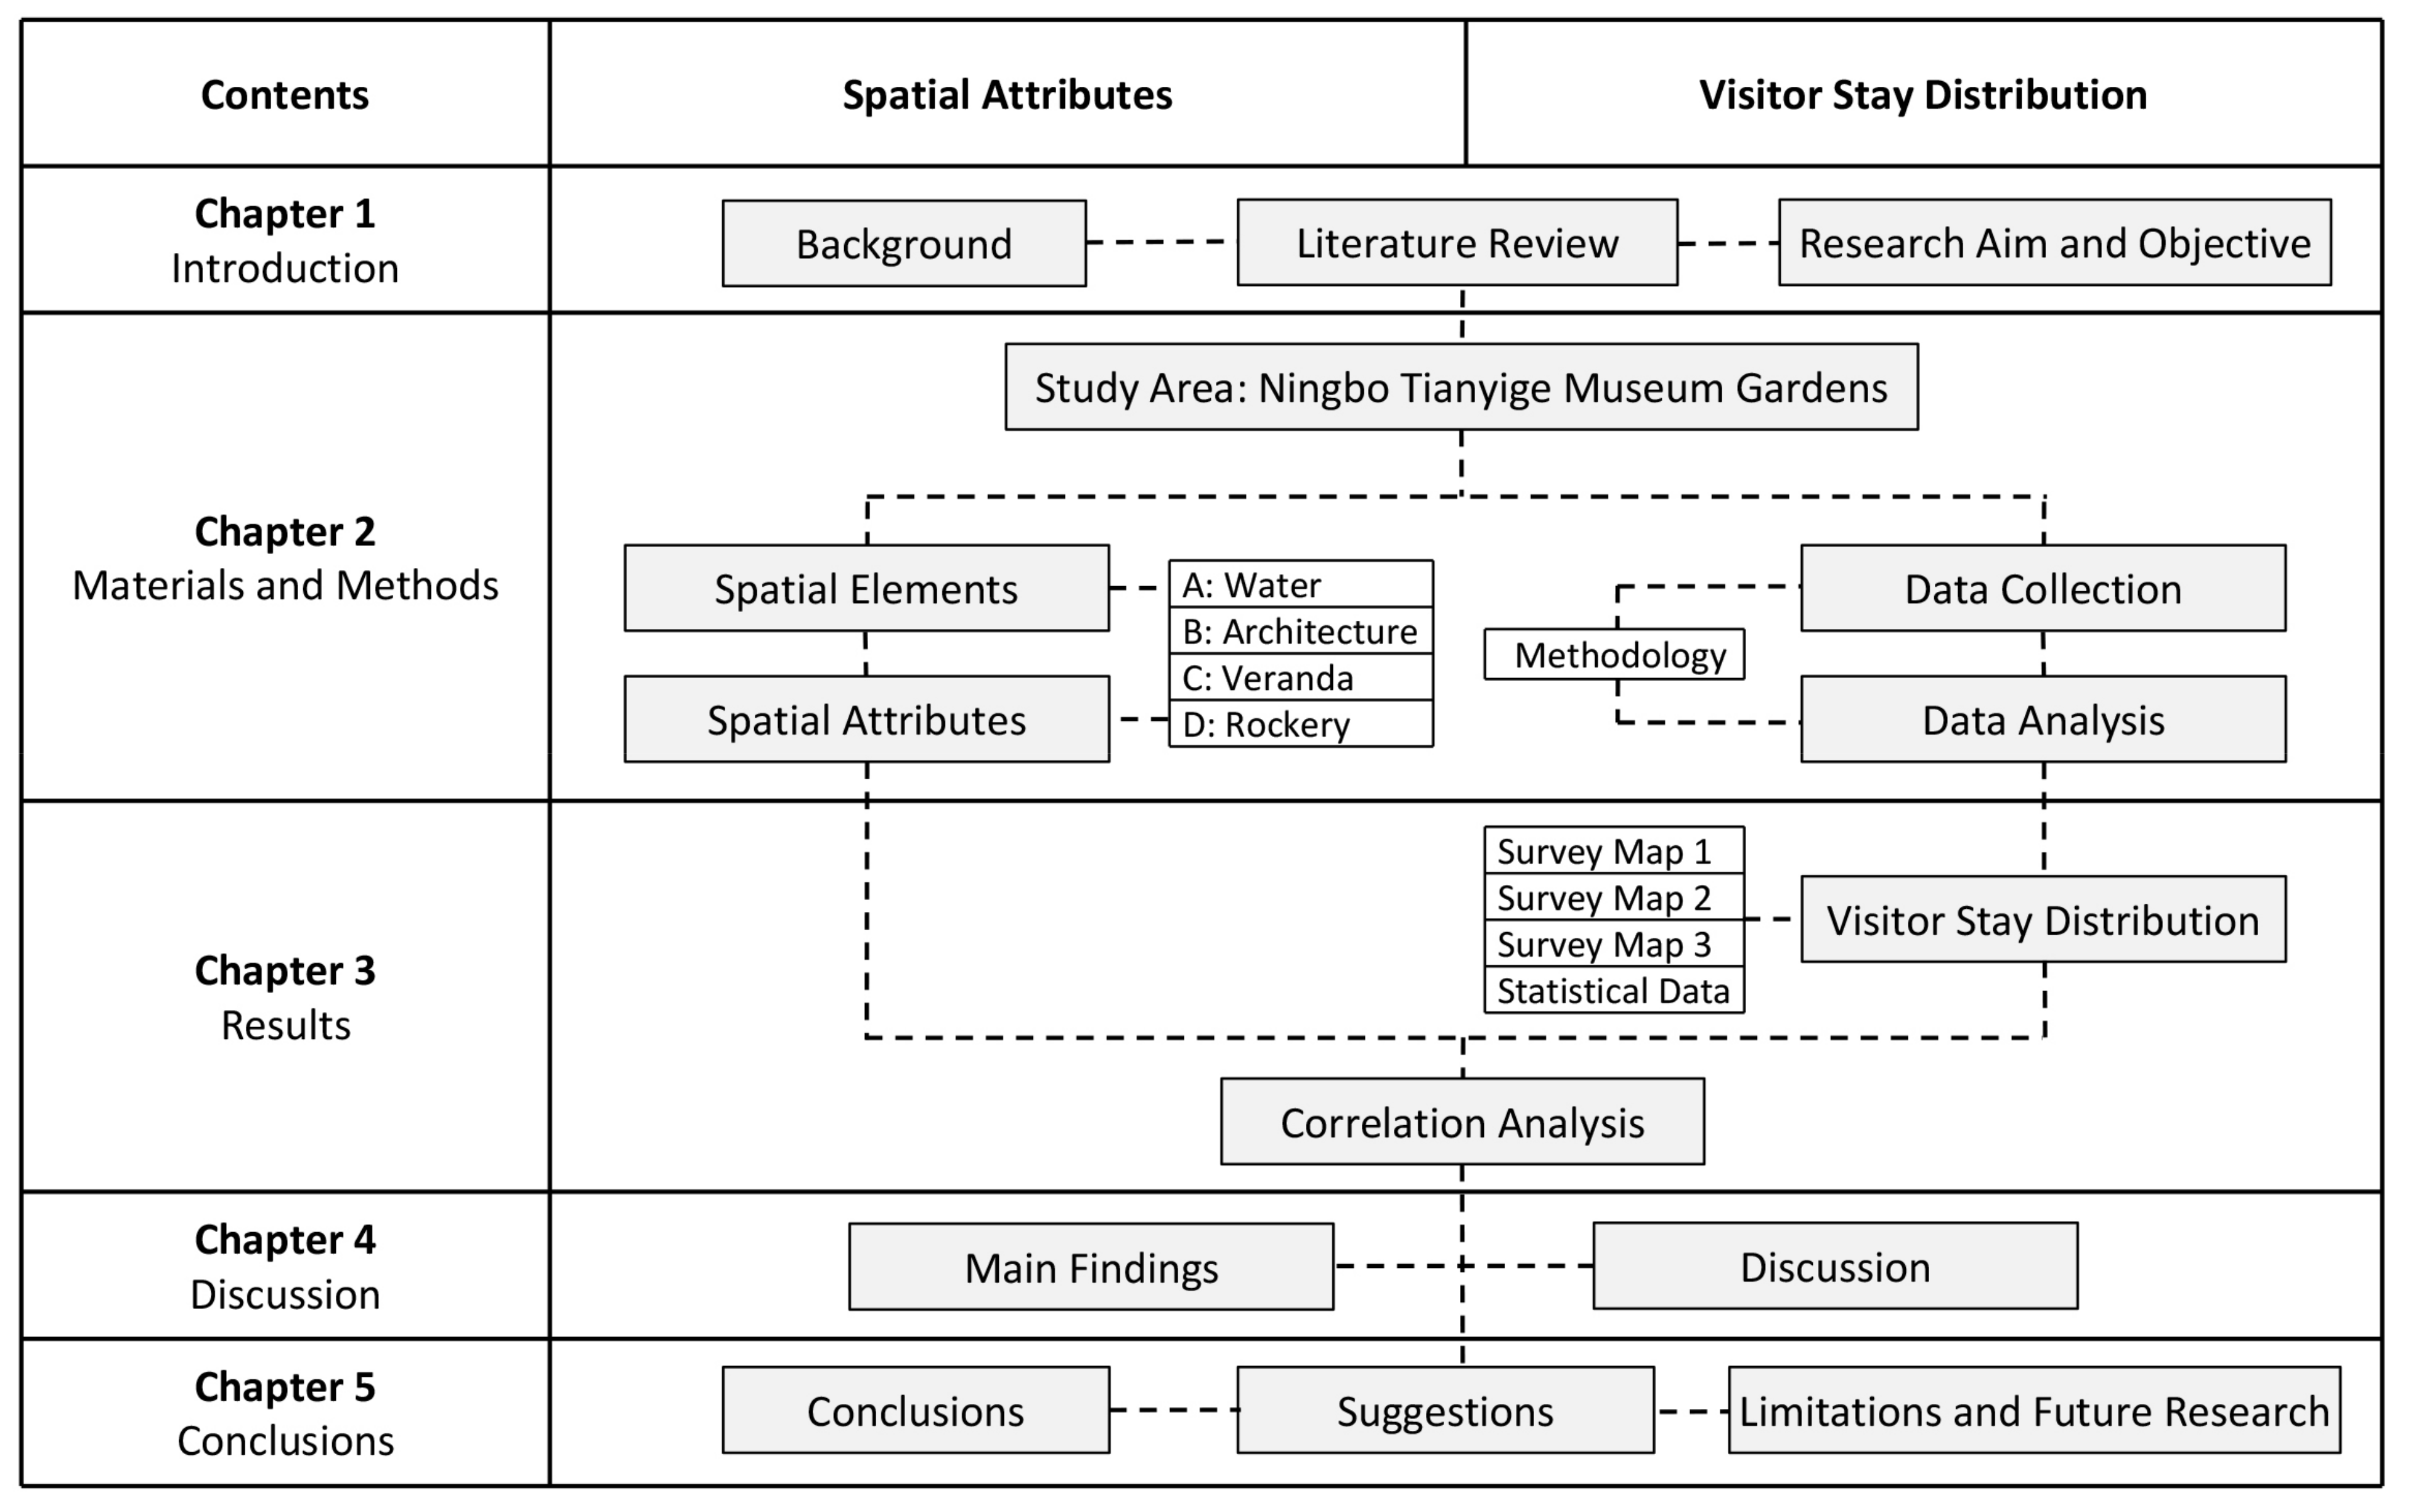
1.4. Research Structure
2. Materials and Methods
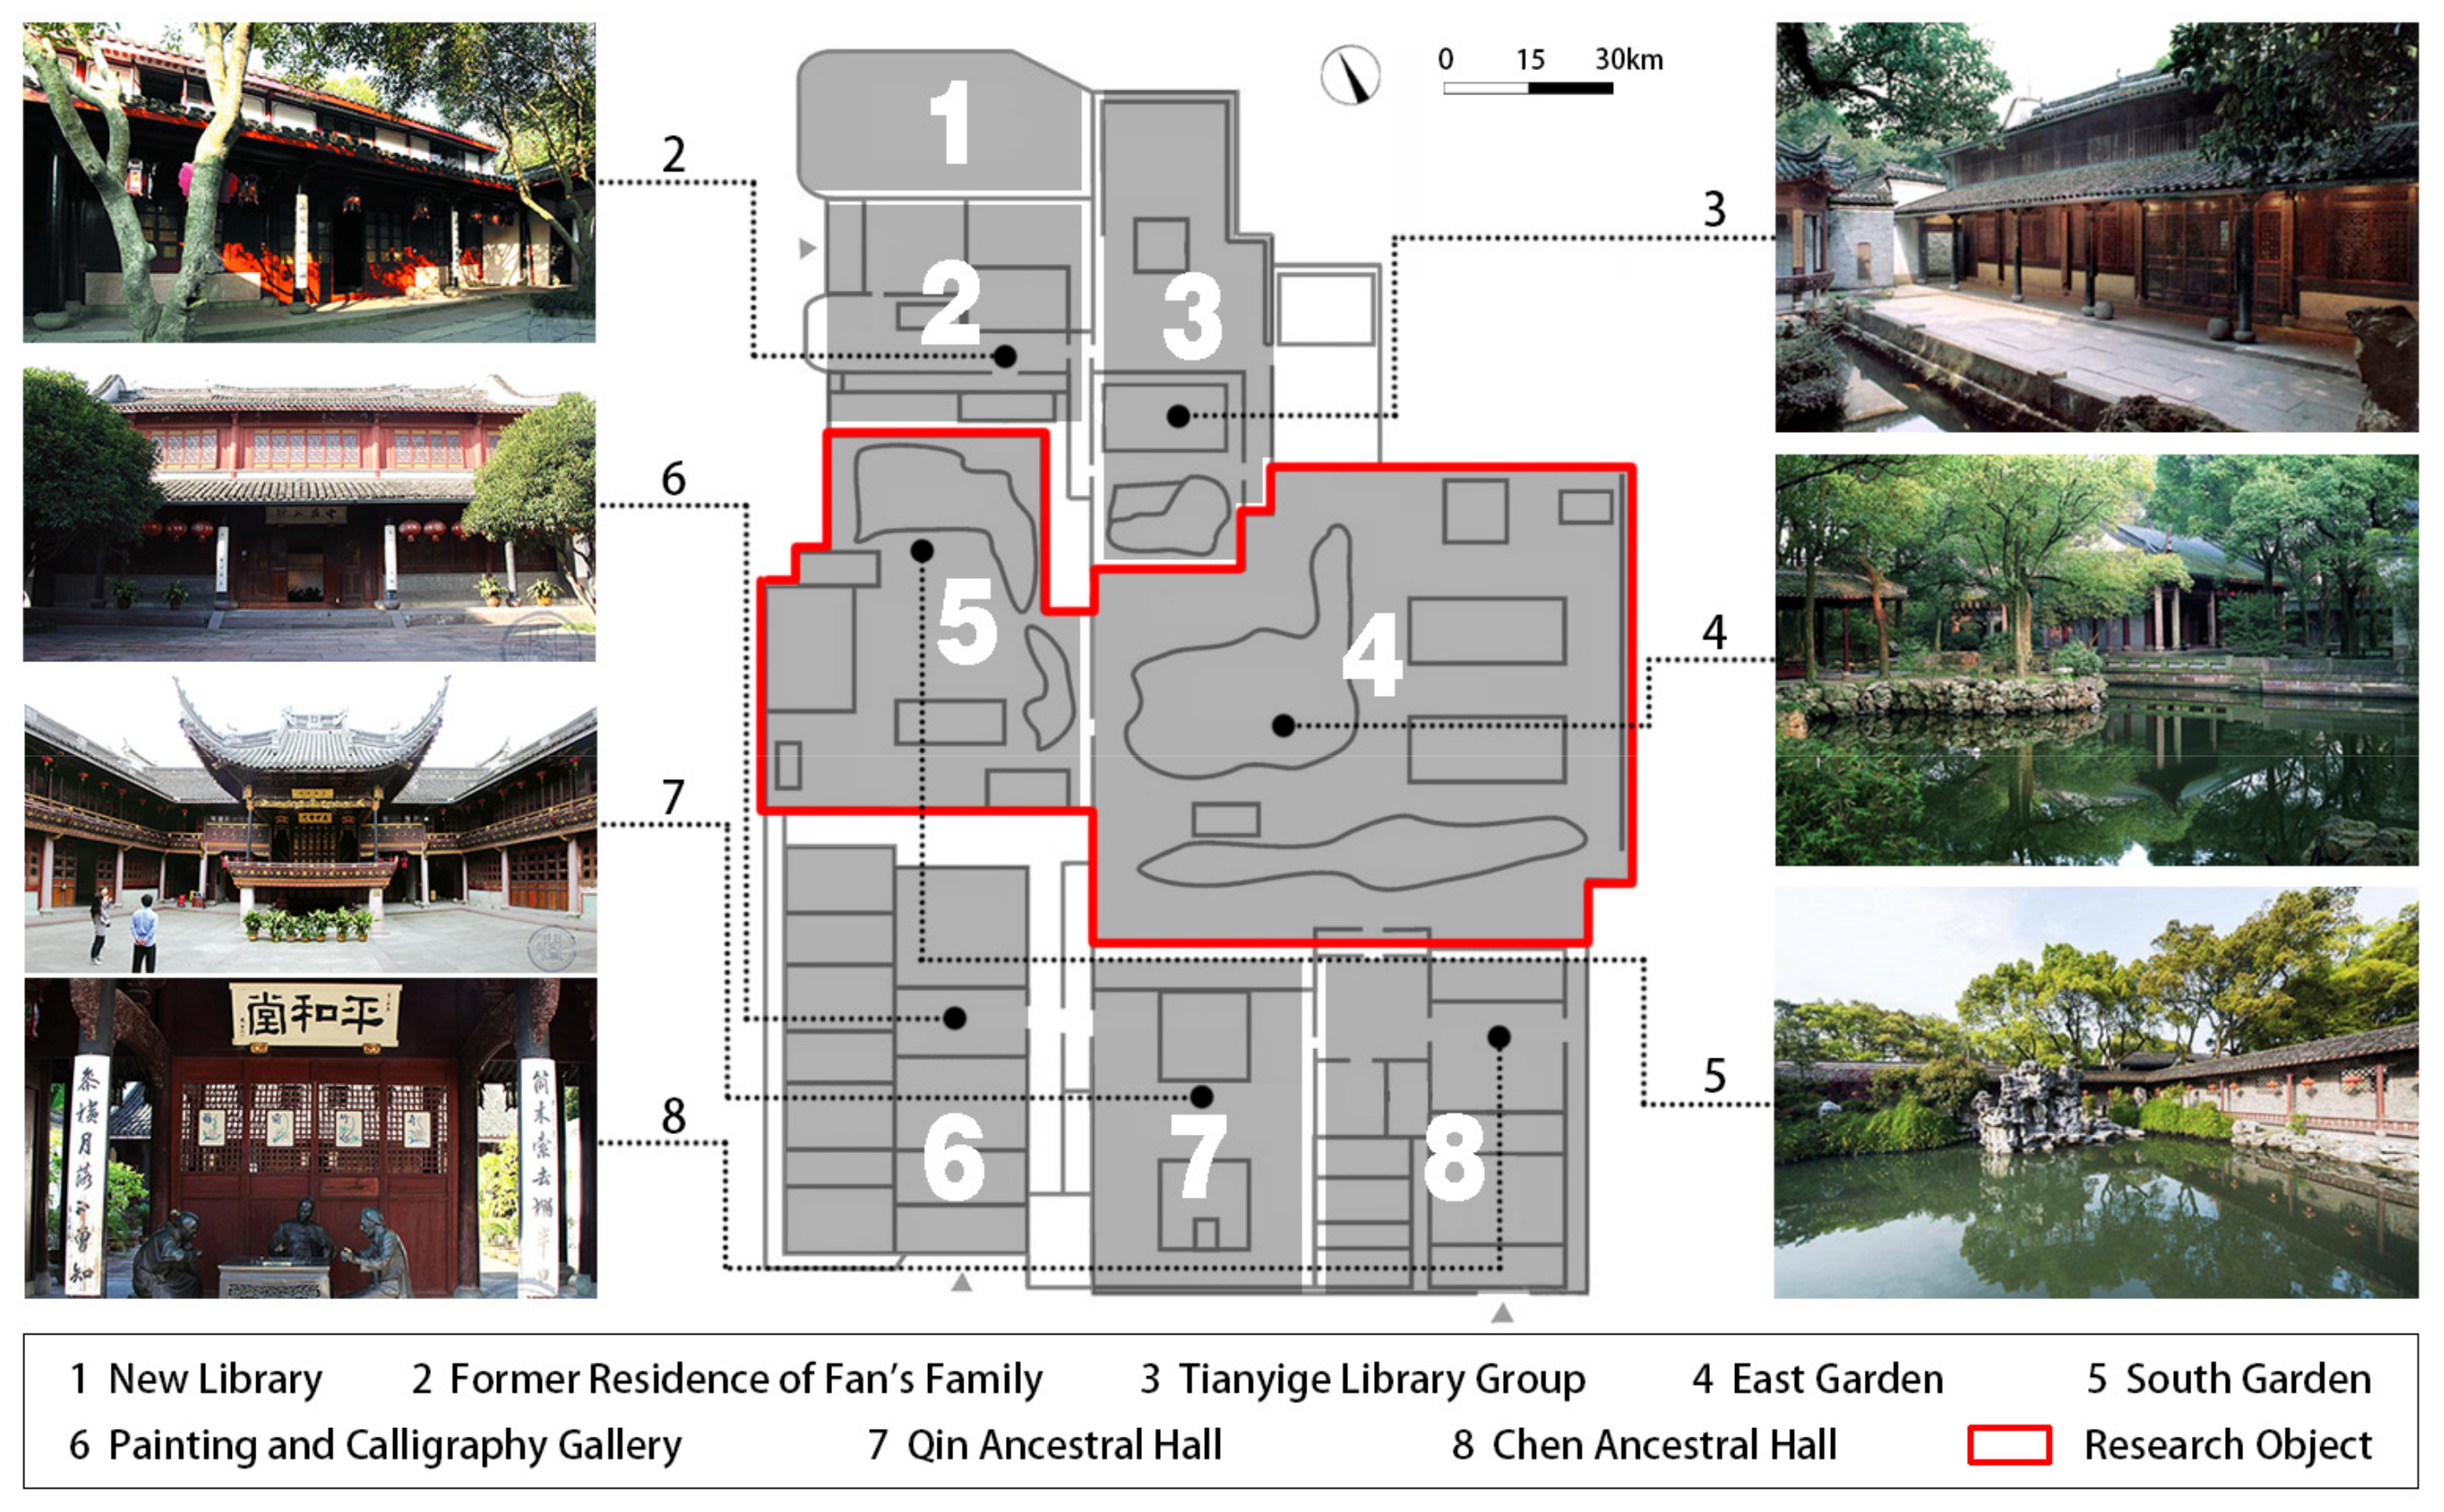
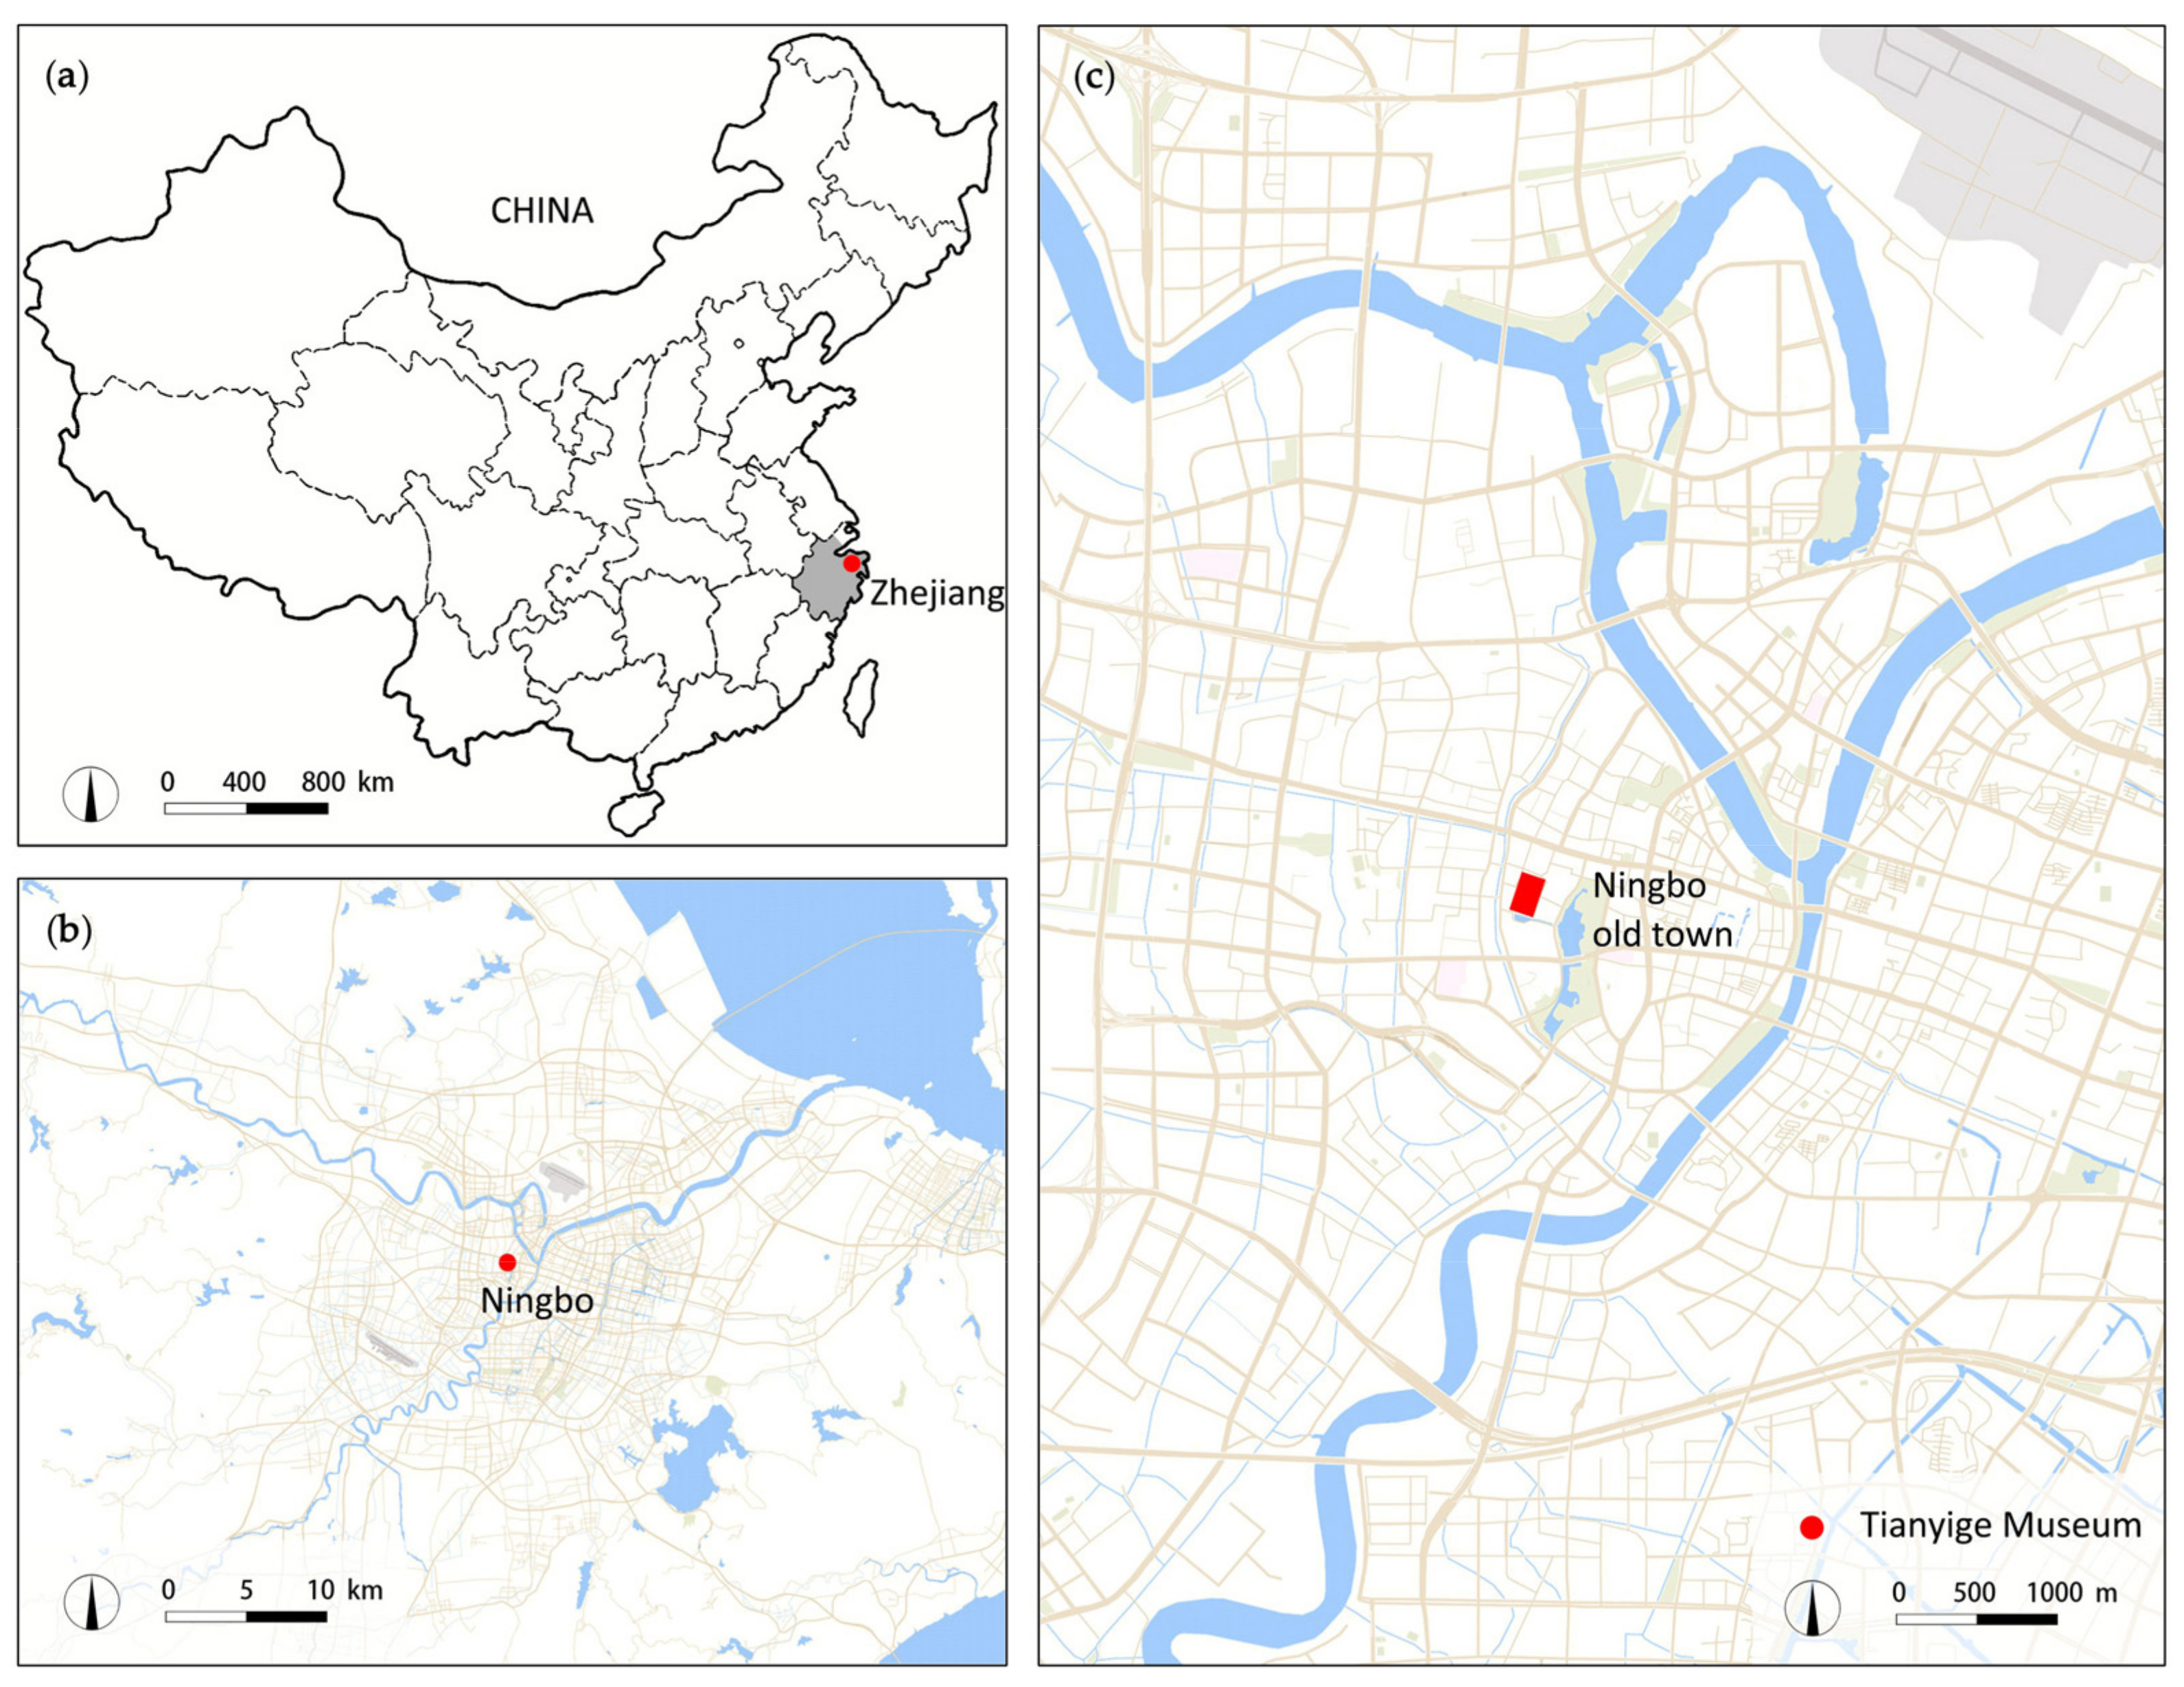
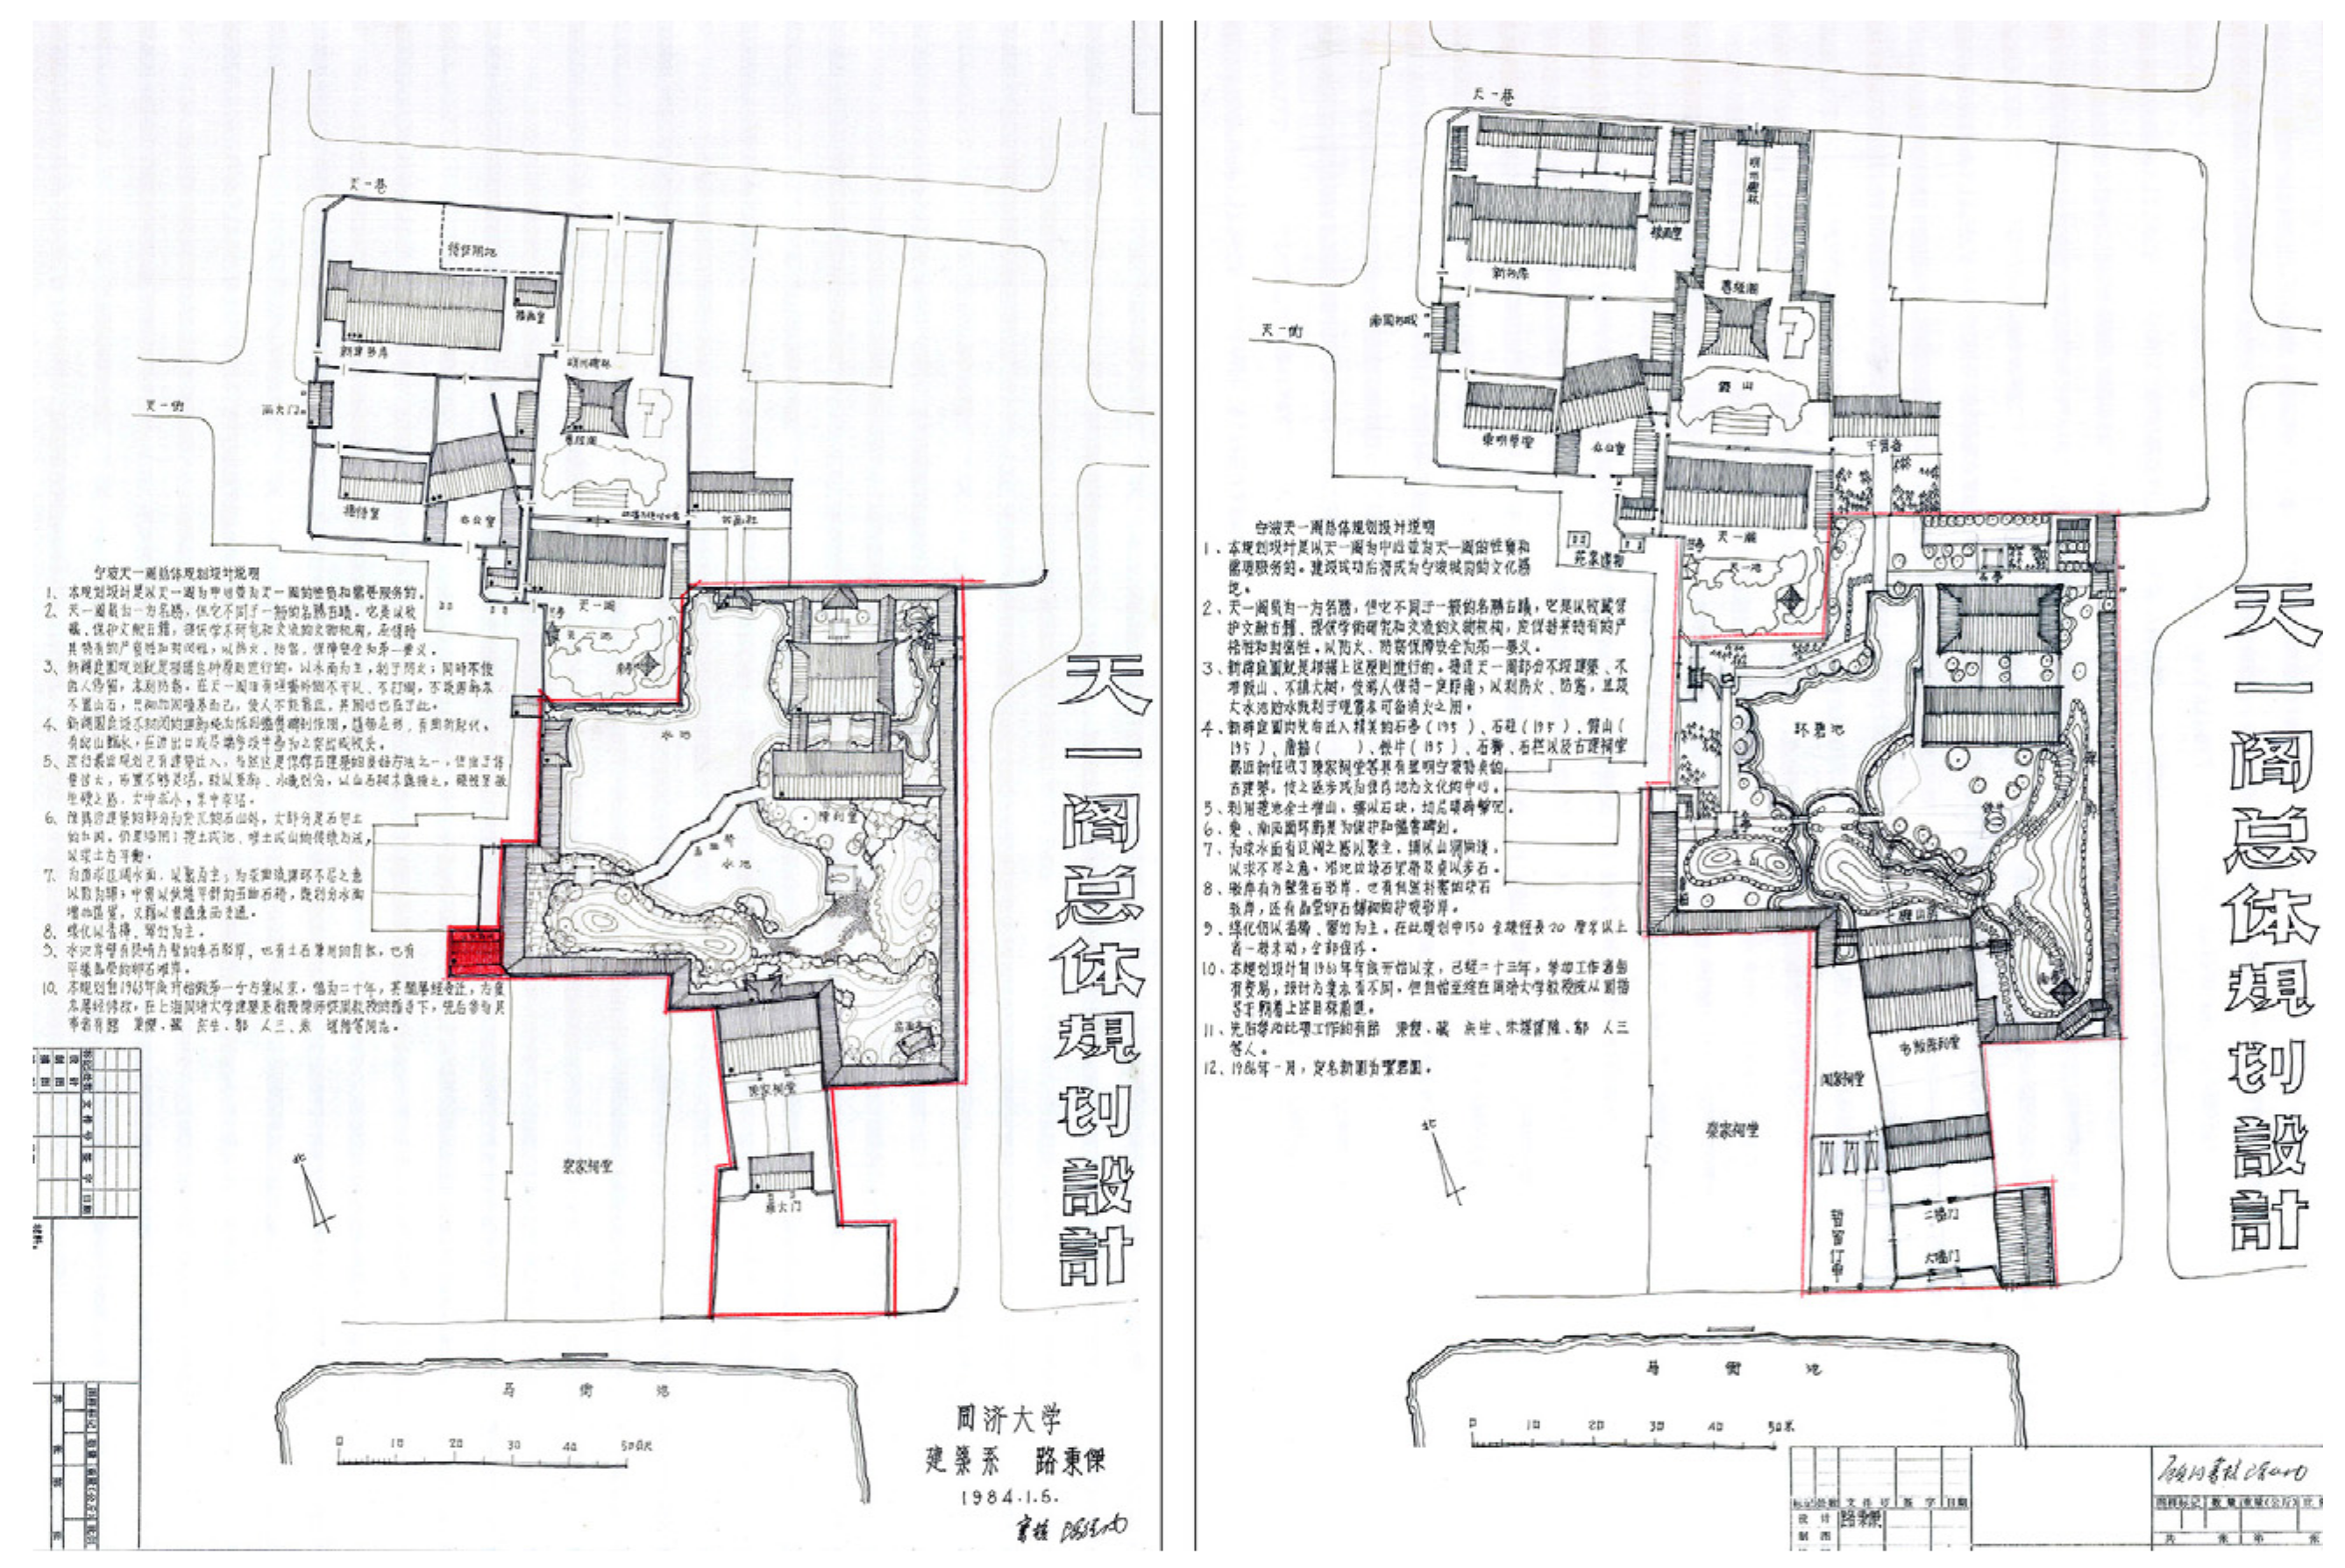
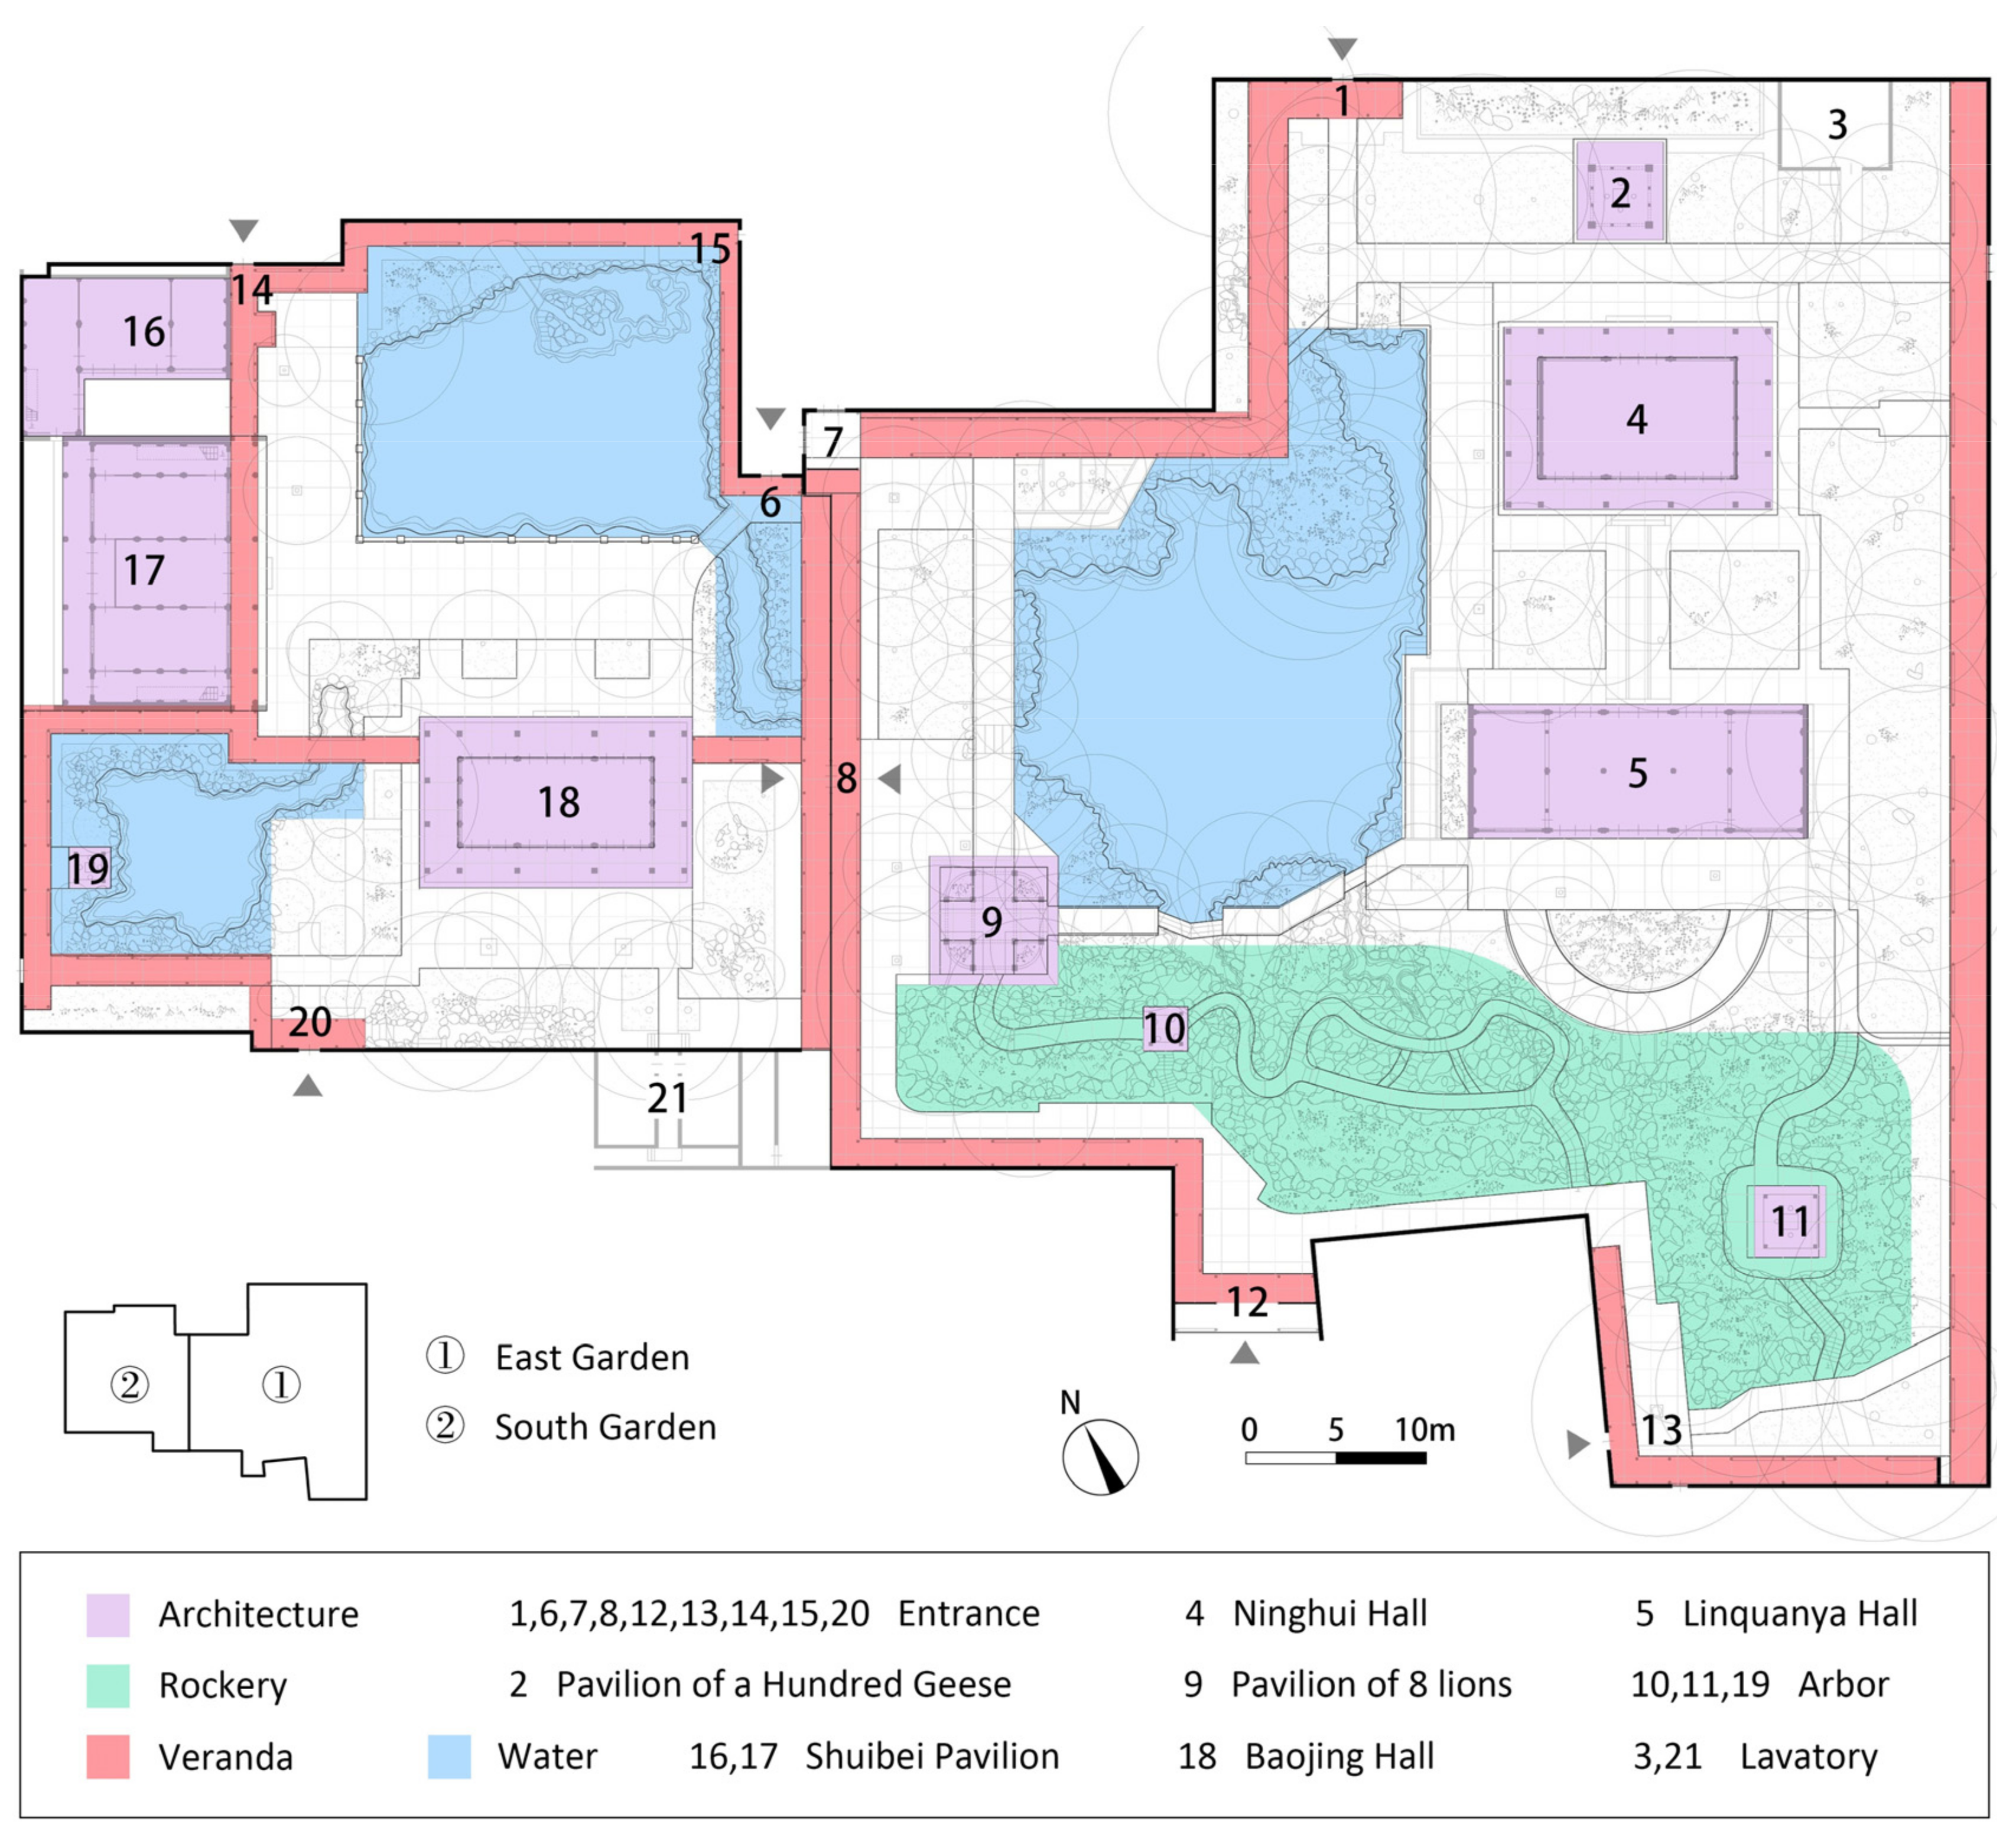
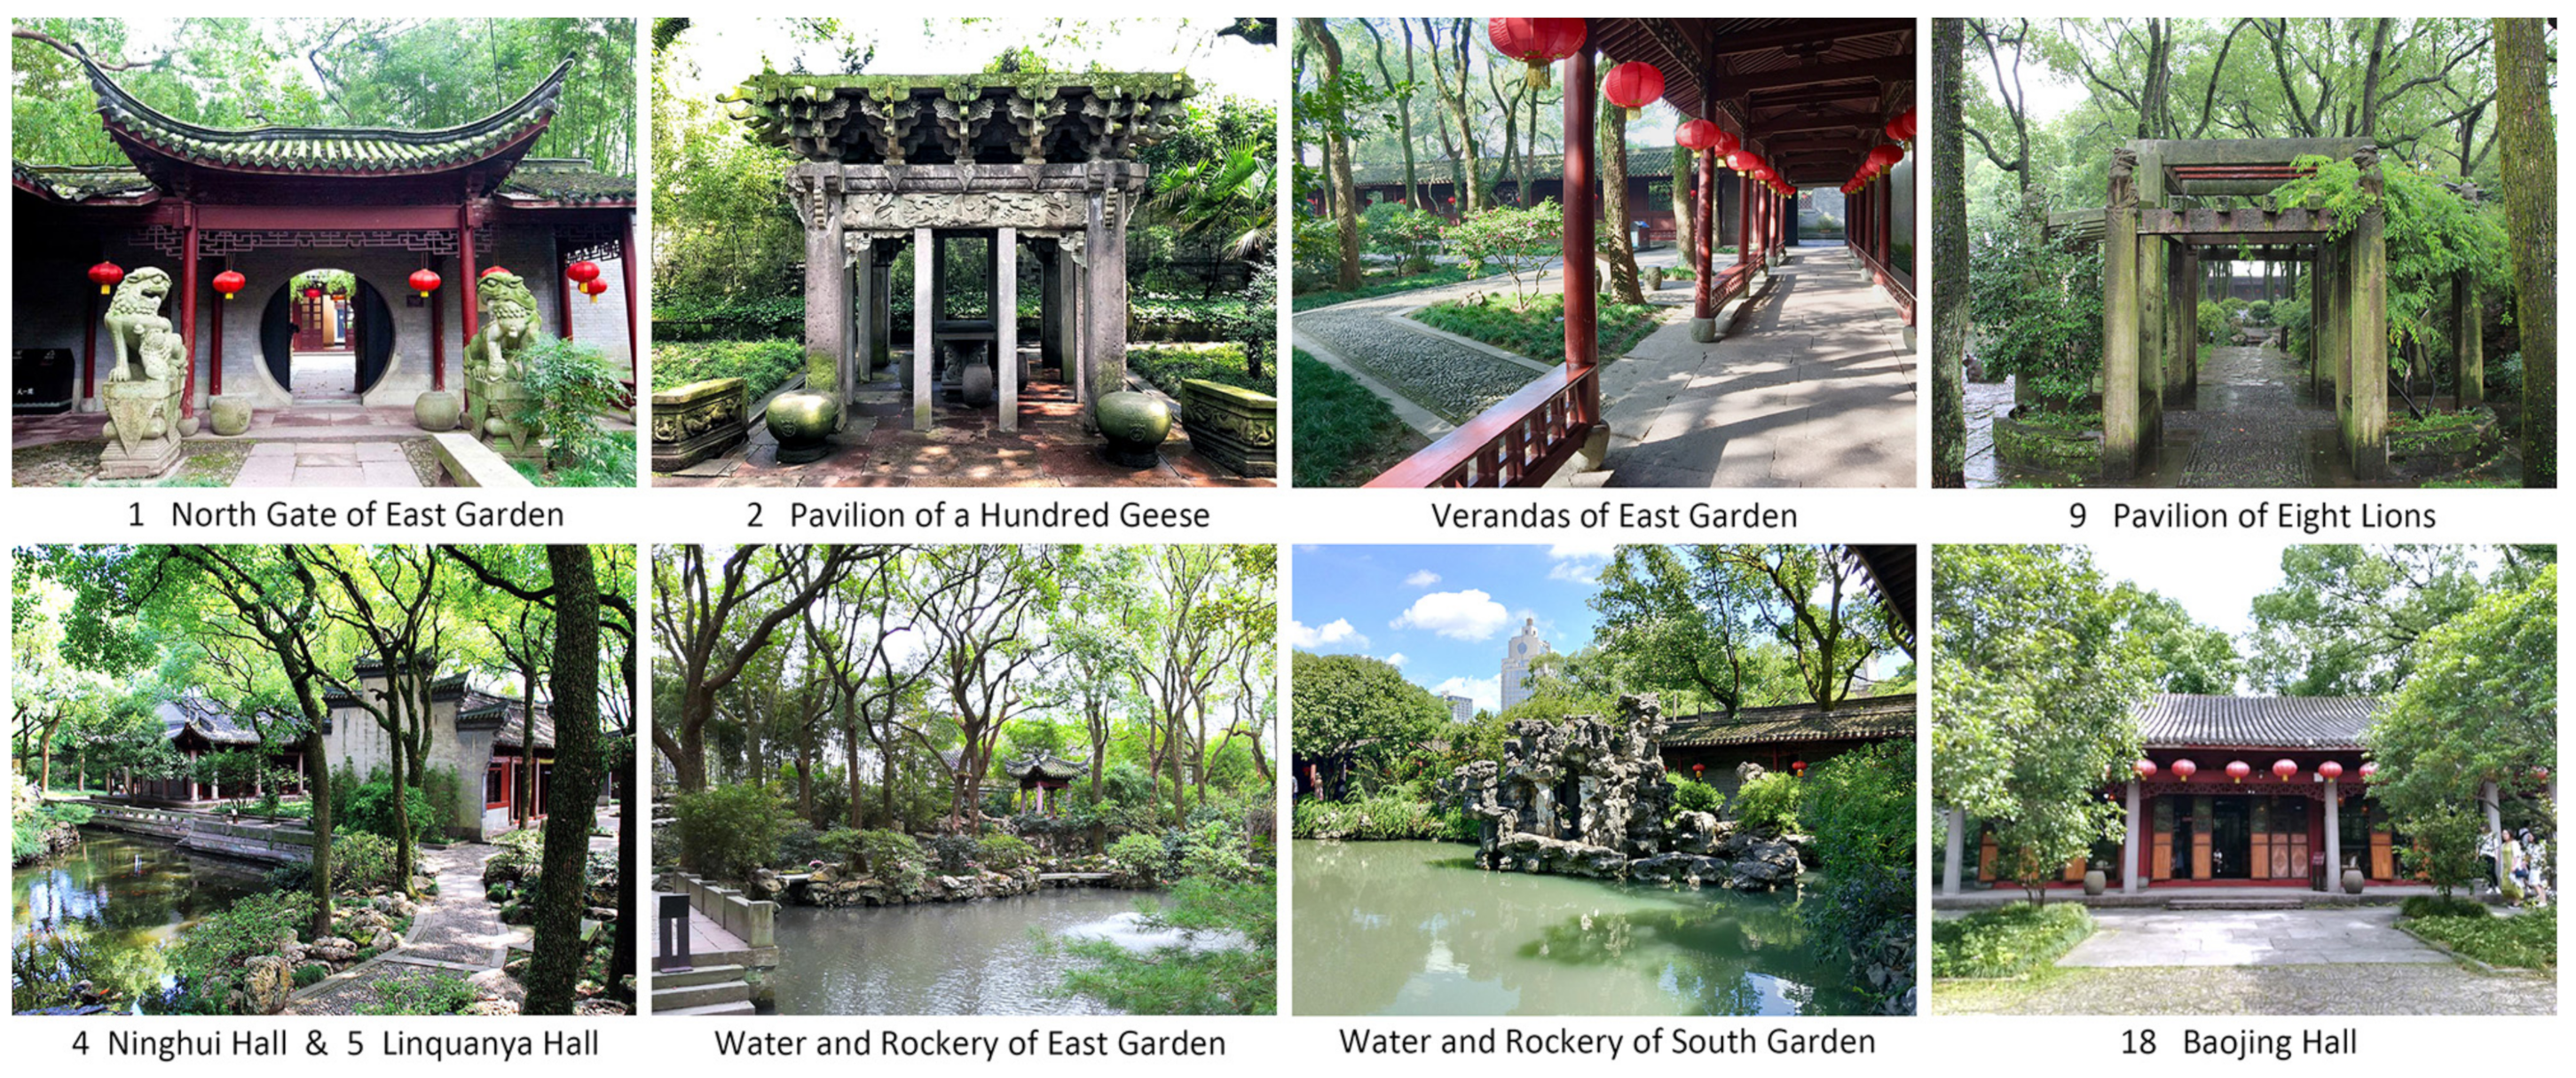
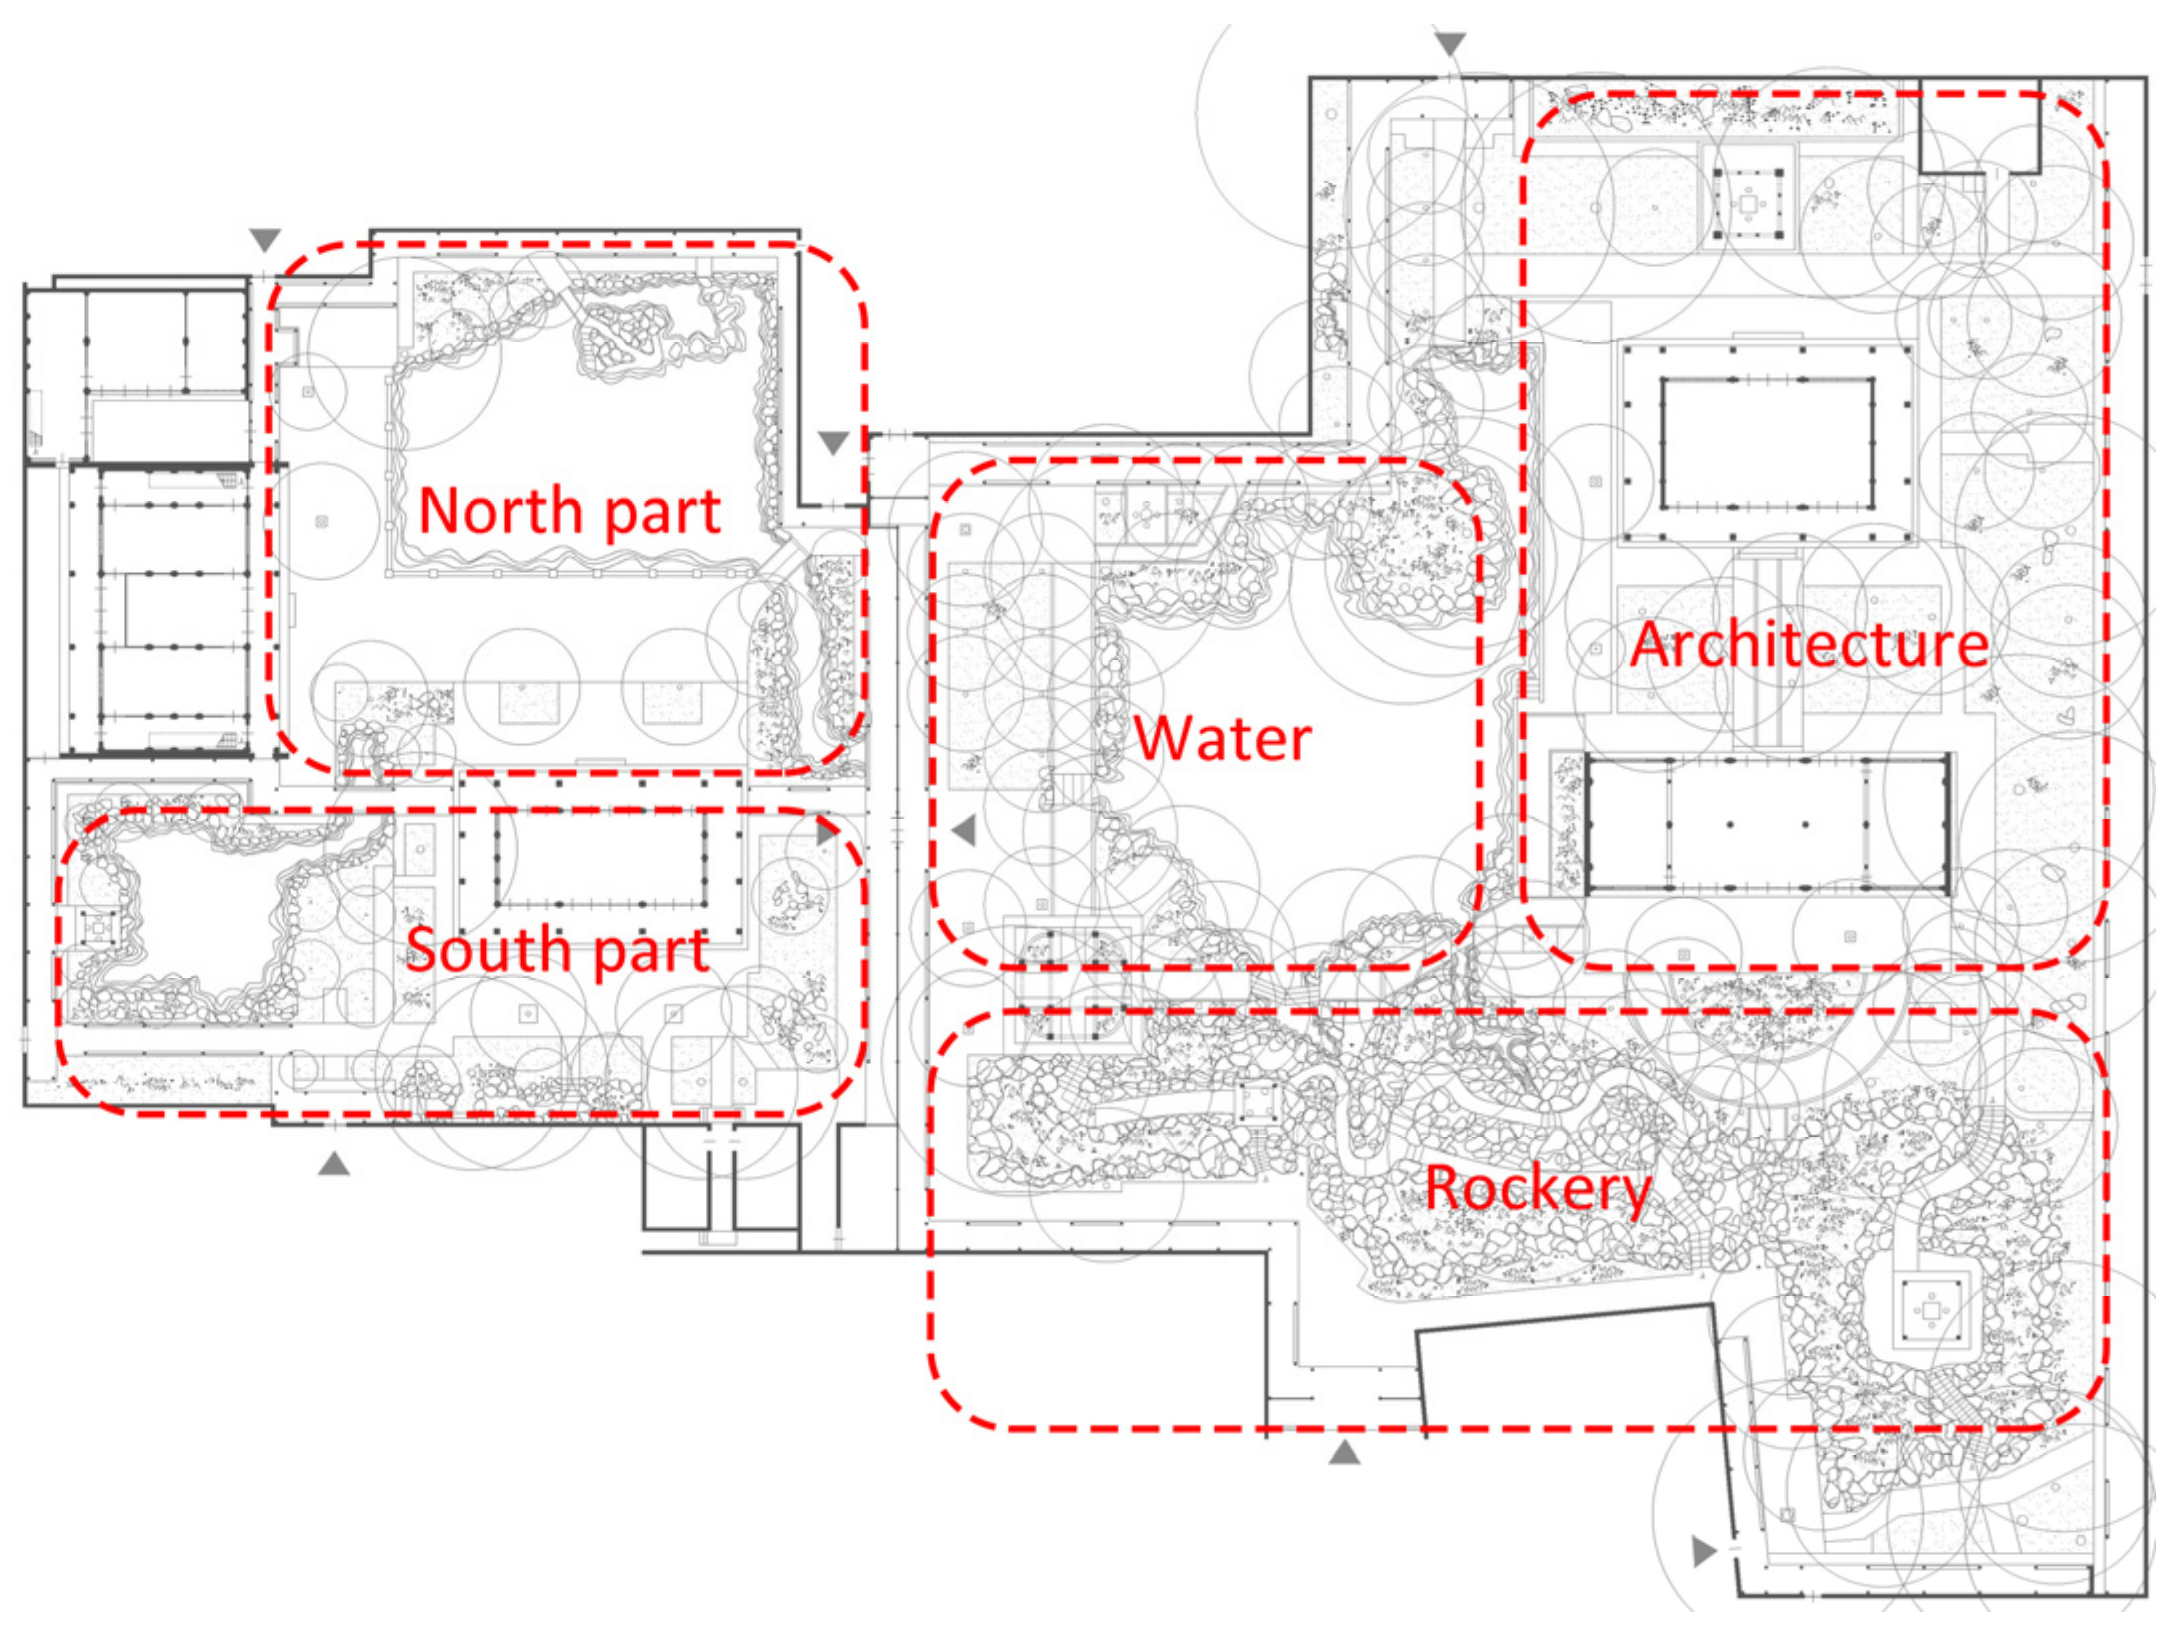
2.1. Study Area: Ningbo Tianyige Museum Gardens
2.2. Spatial Analysis
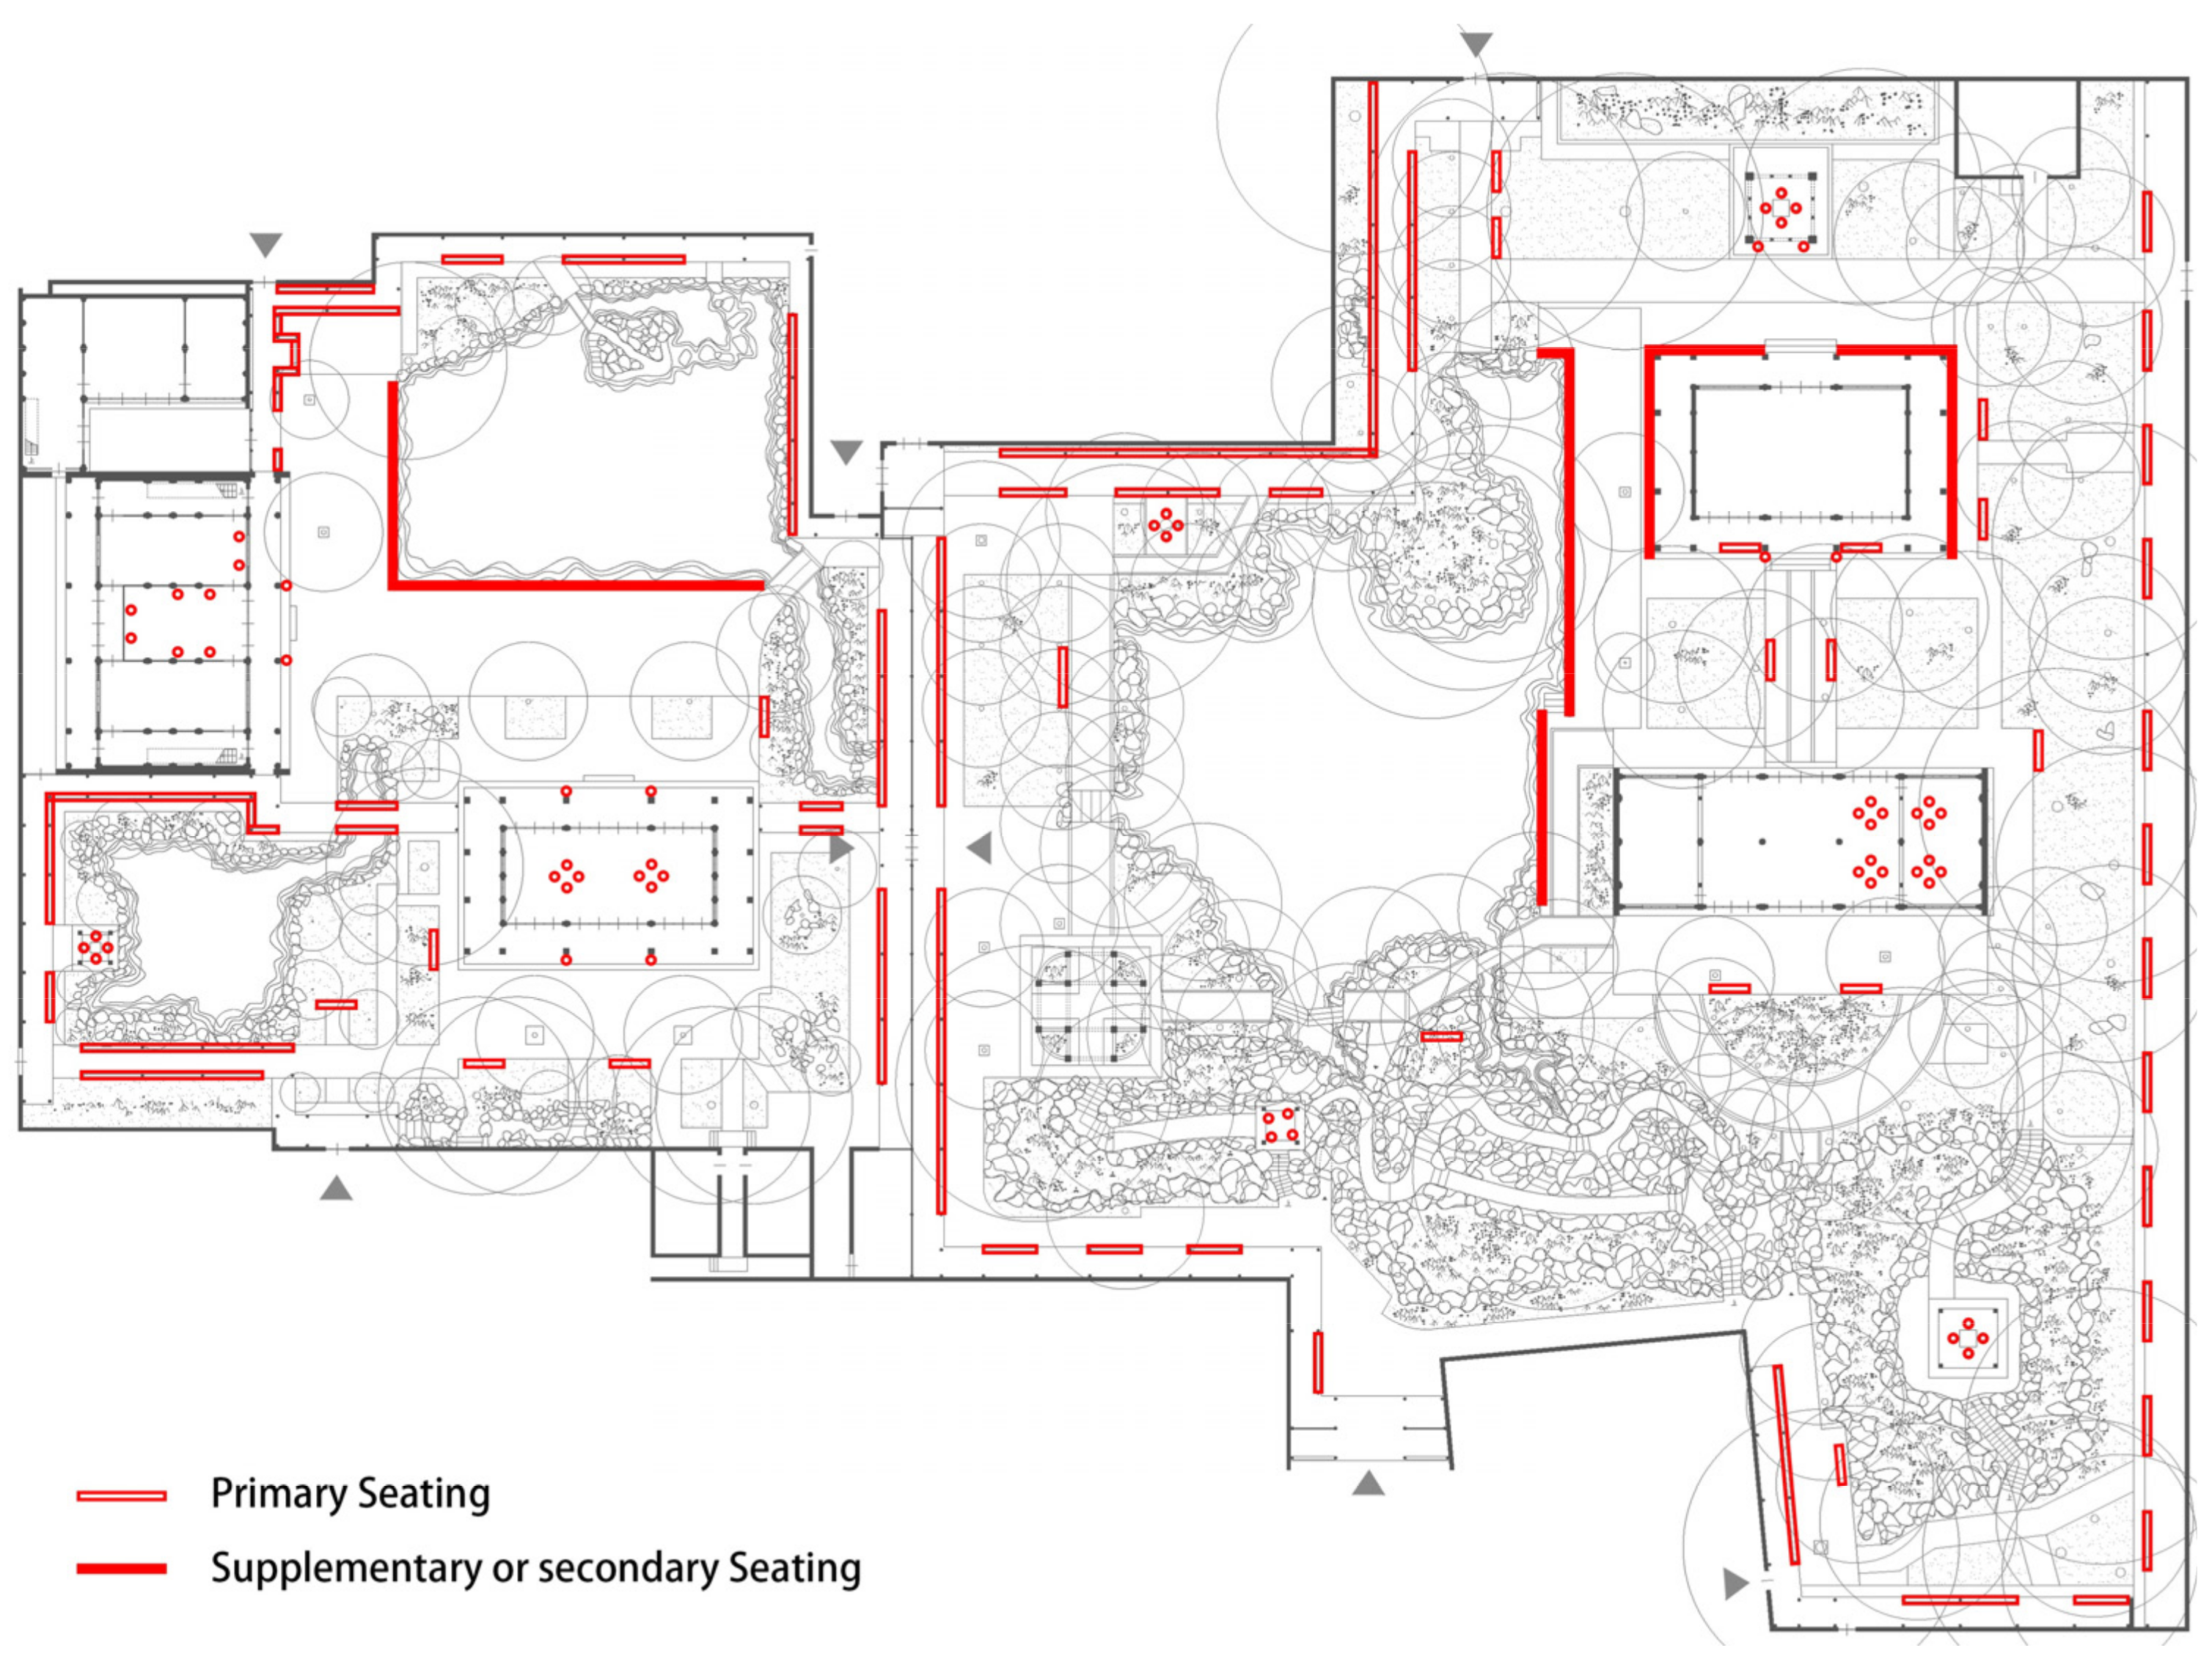
2.2.1. Spatial Elements of the Garden
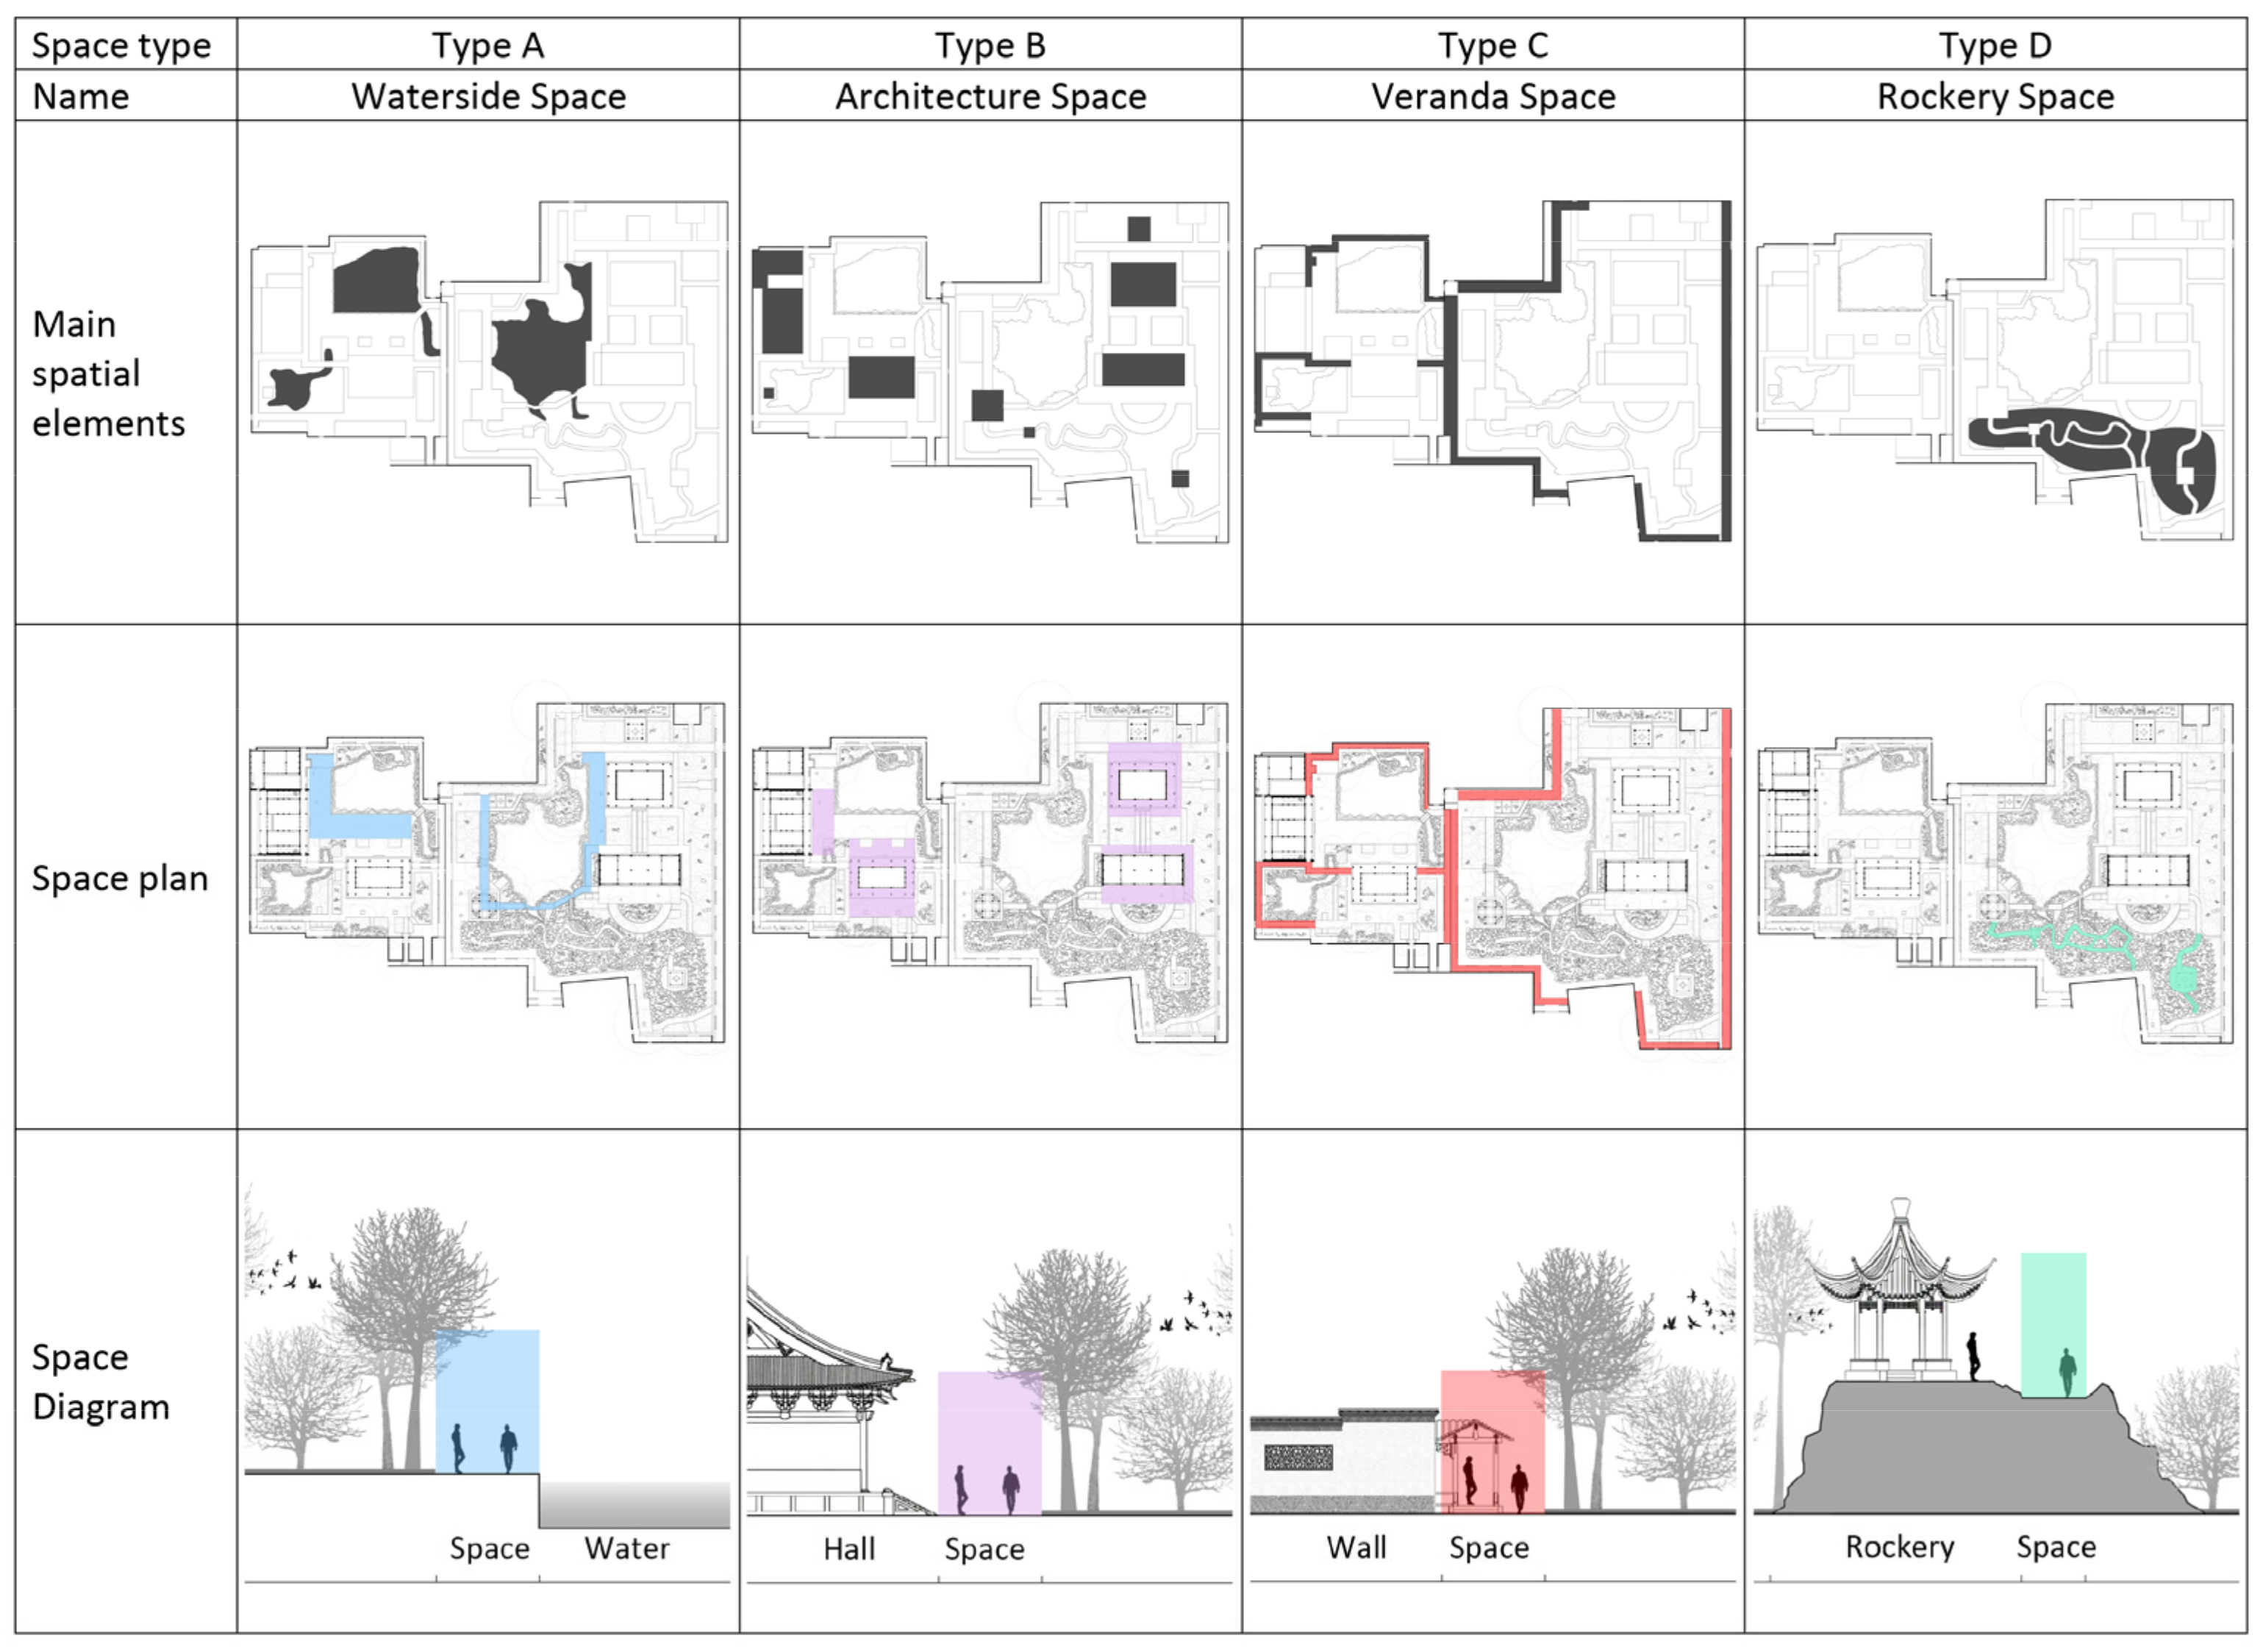
2.2.2. Classification of Garden Space
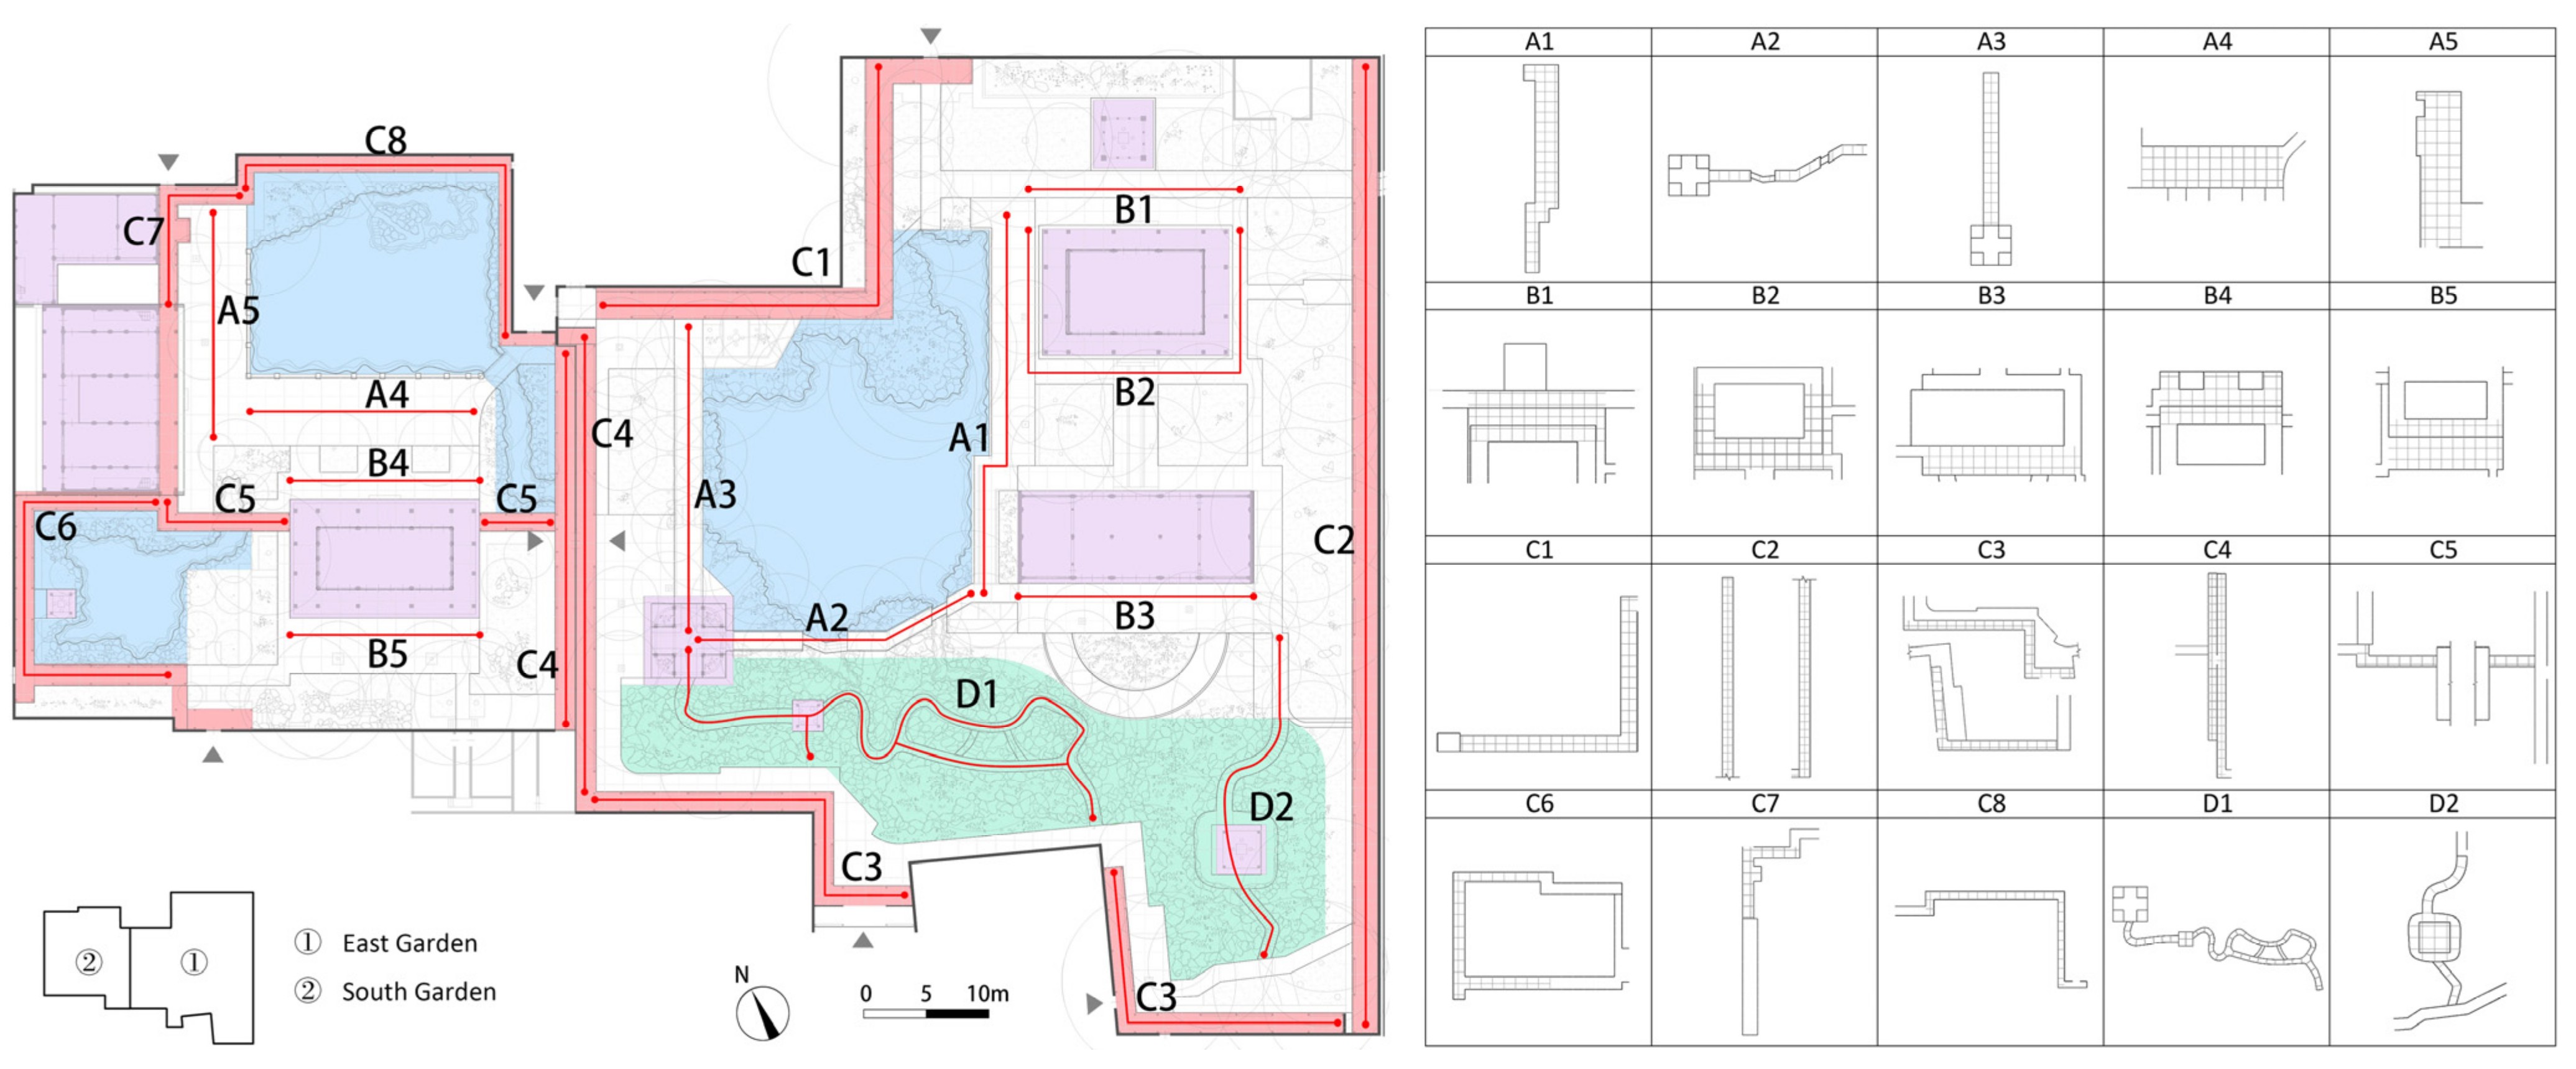
2.2.3. Measurement Attributes of the Twenty Garden Units
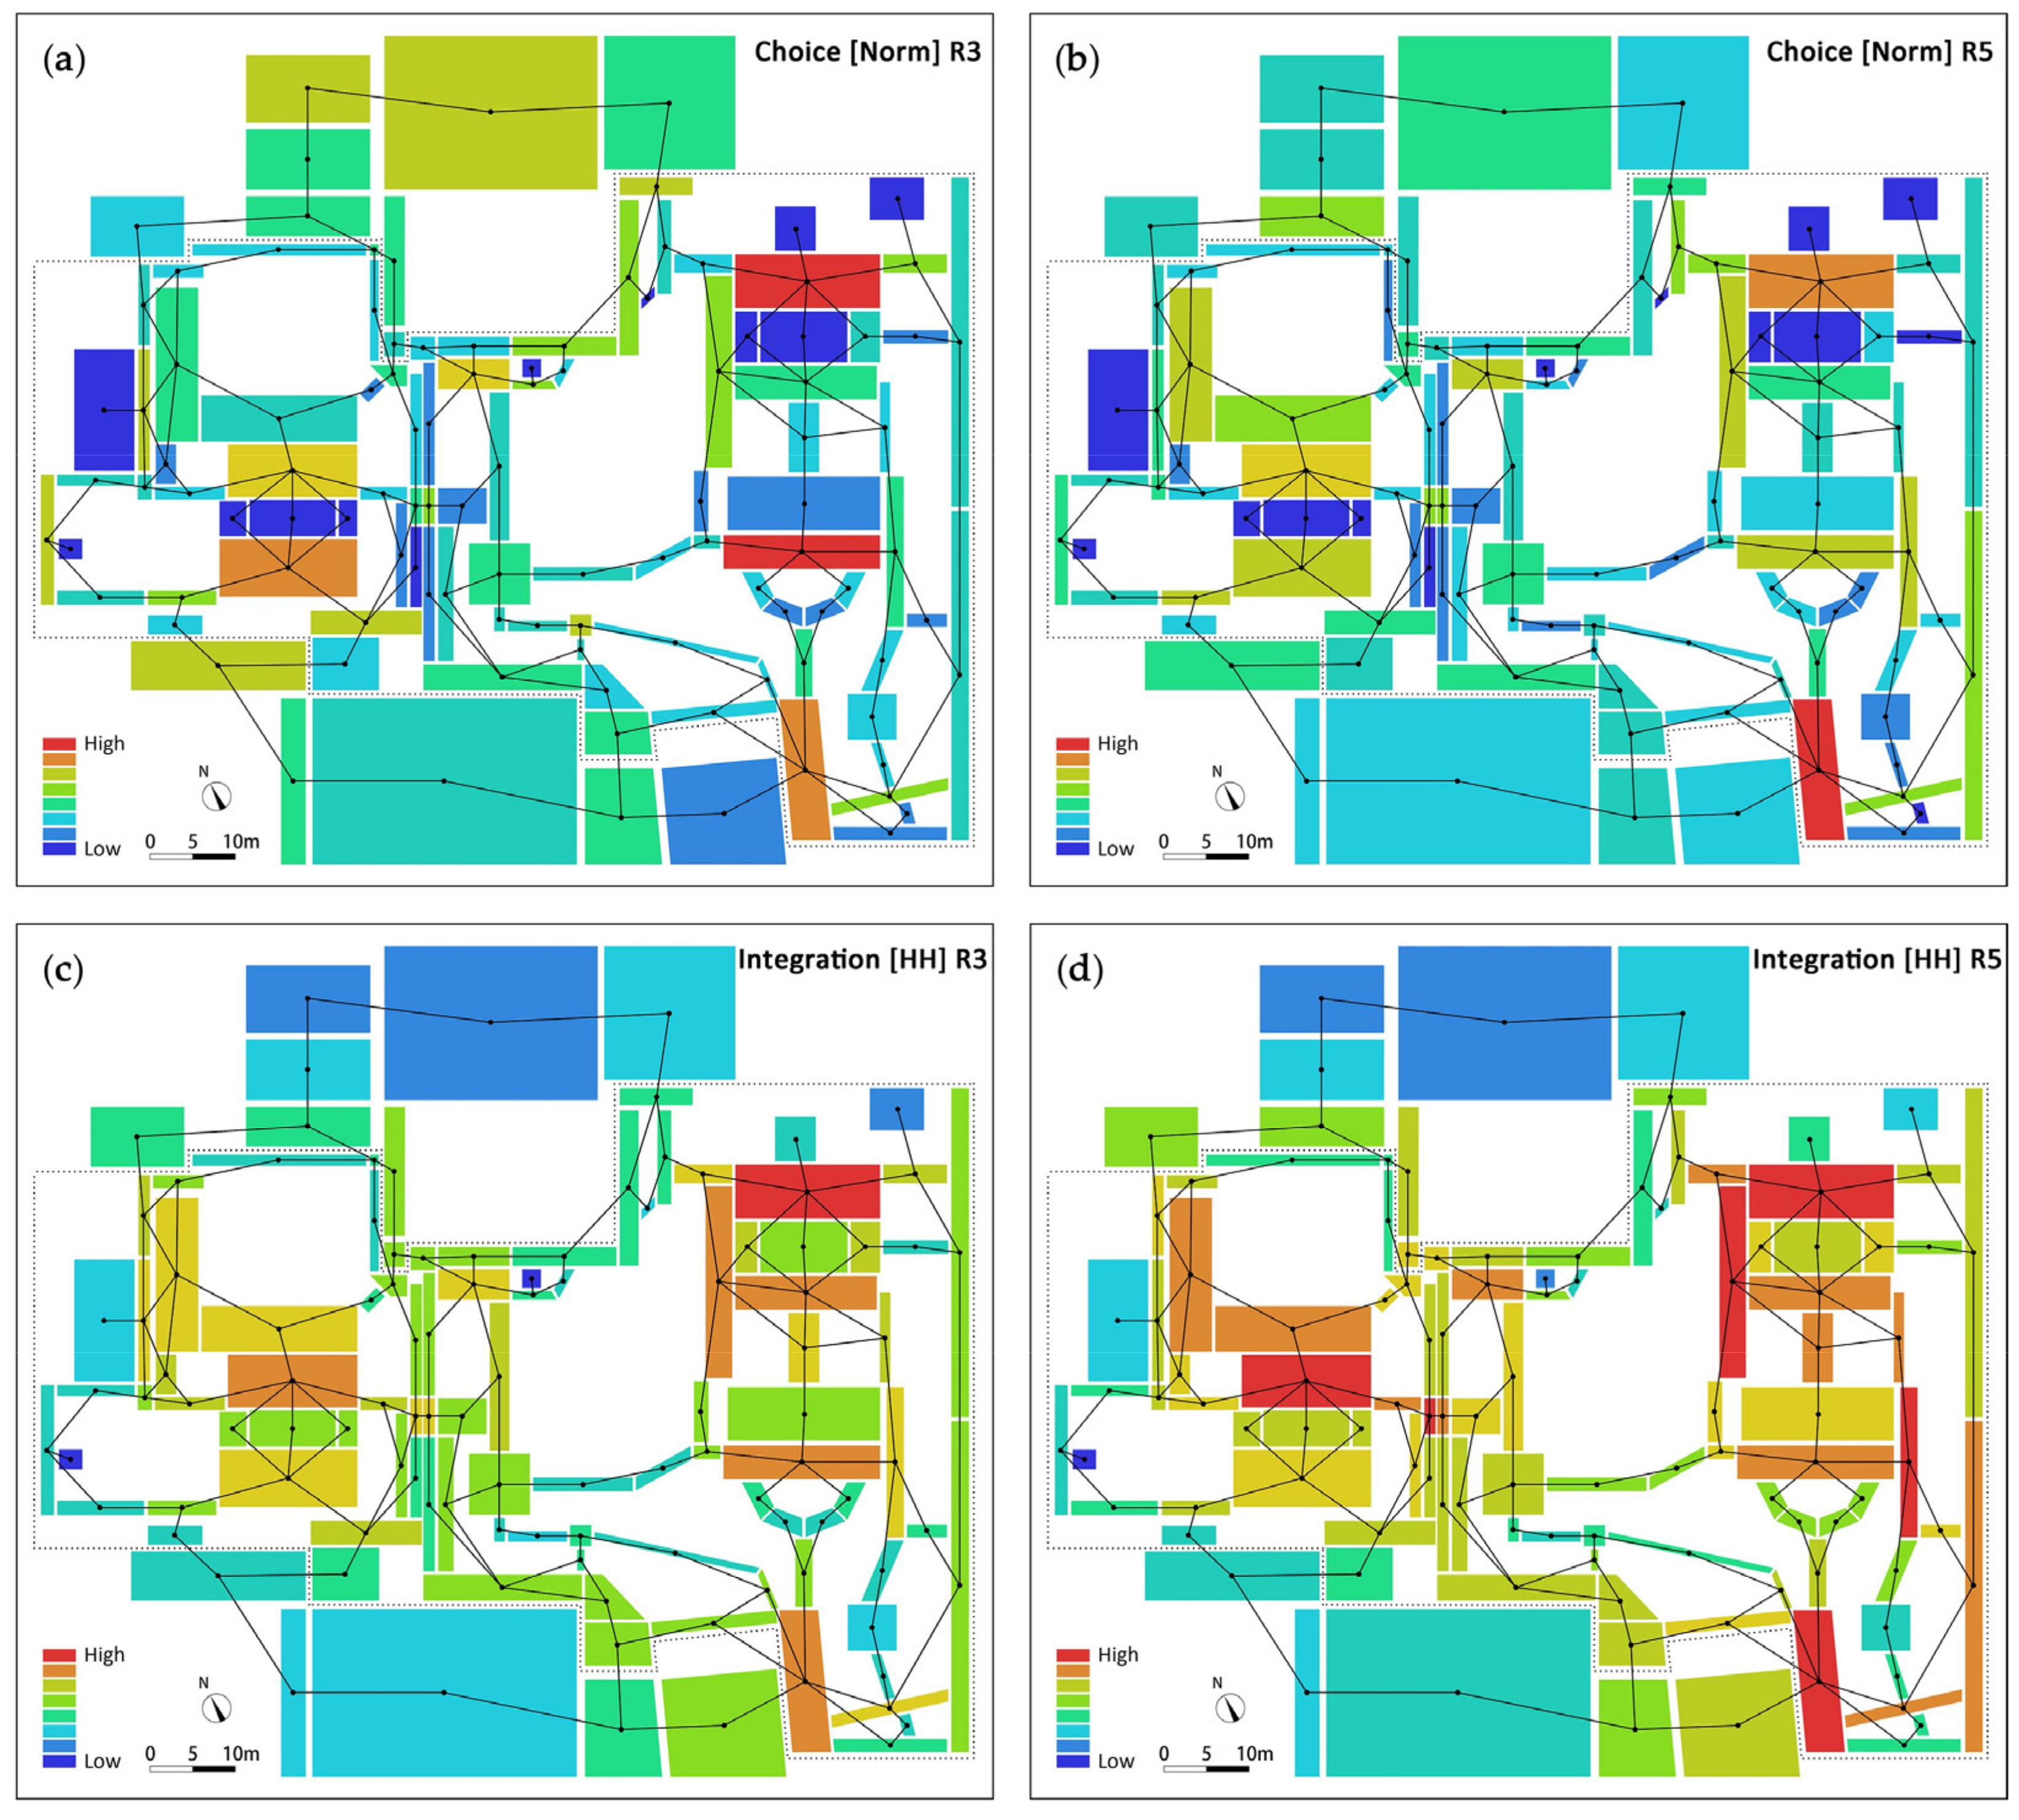
2.2.4. Configurational Attributes of the Twenty Garden Units
2.3. Data Collection
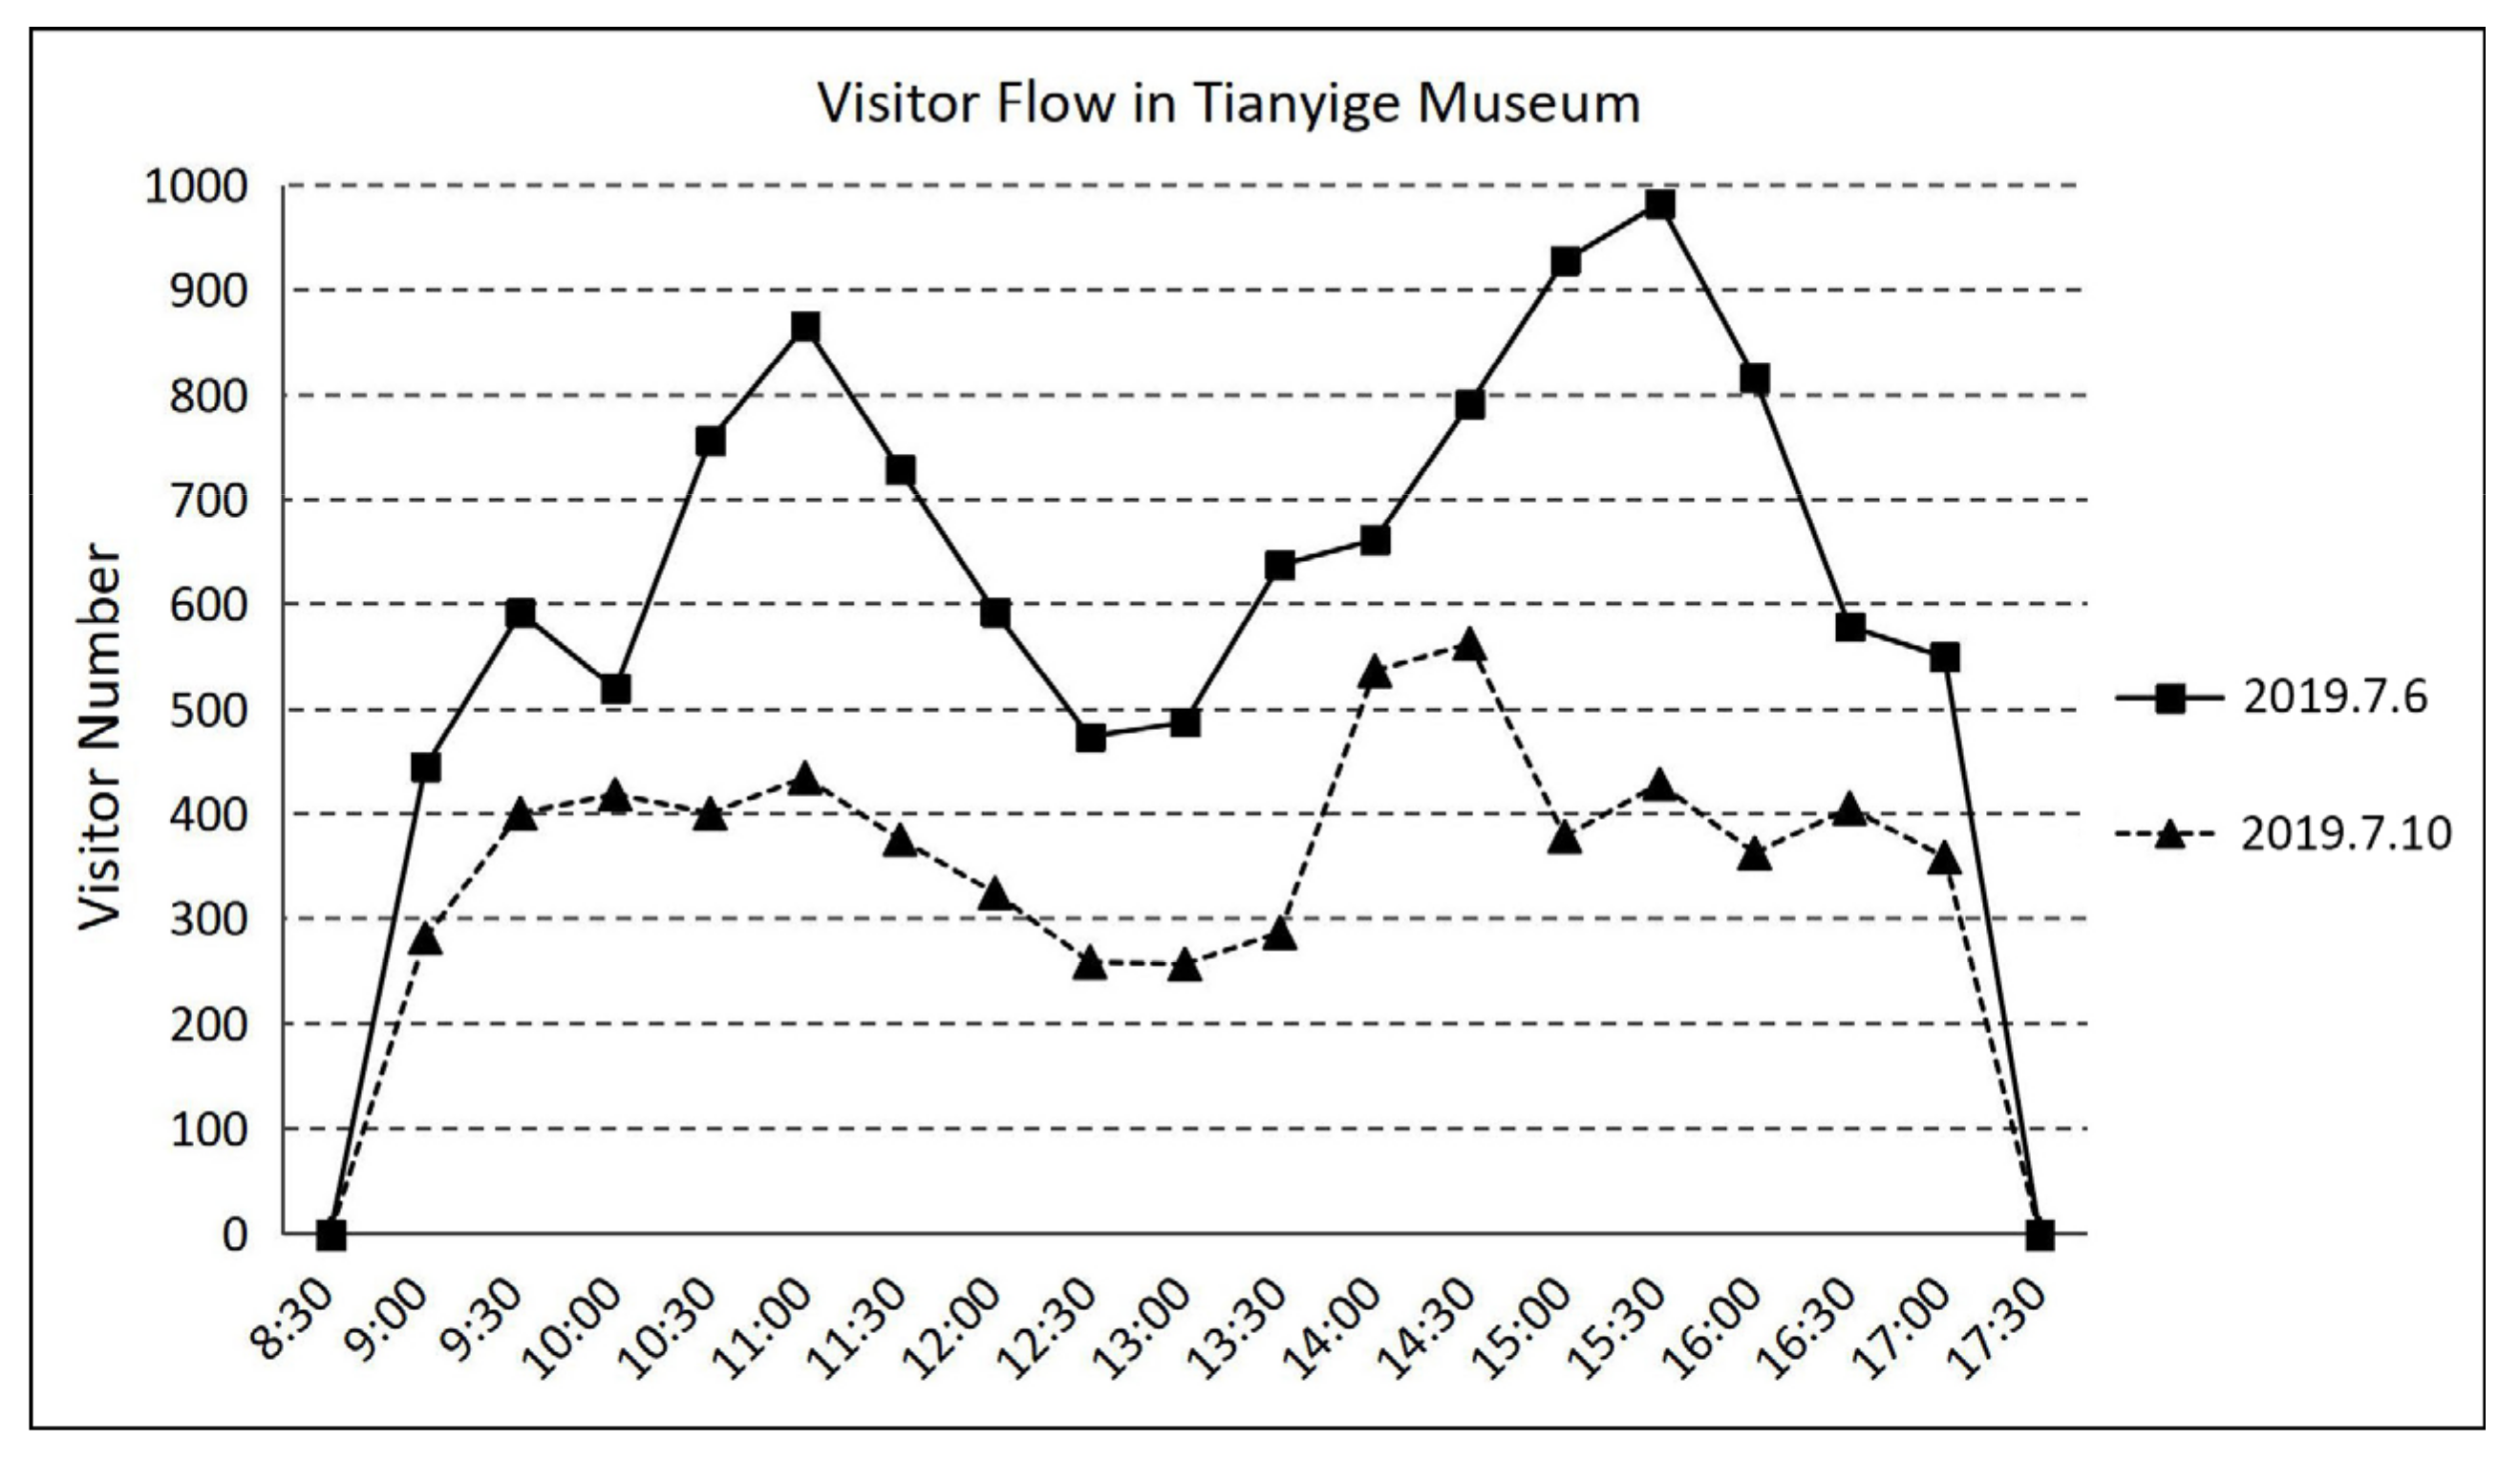
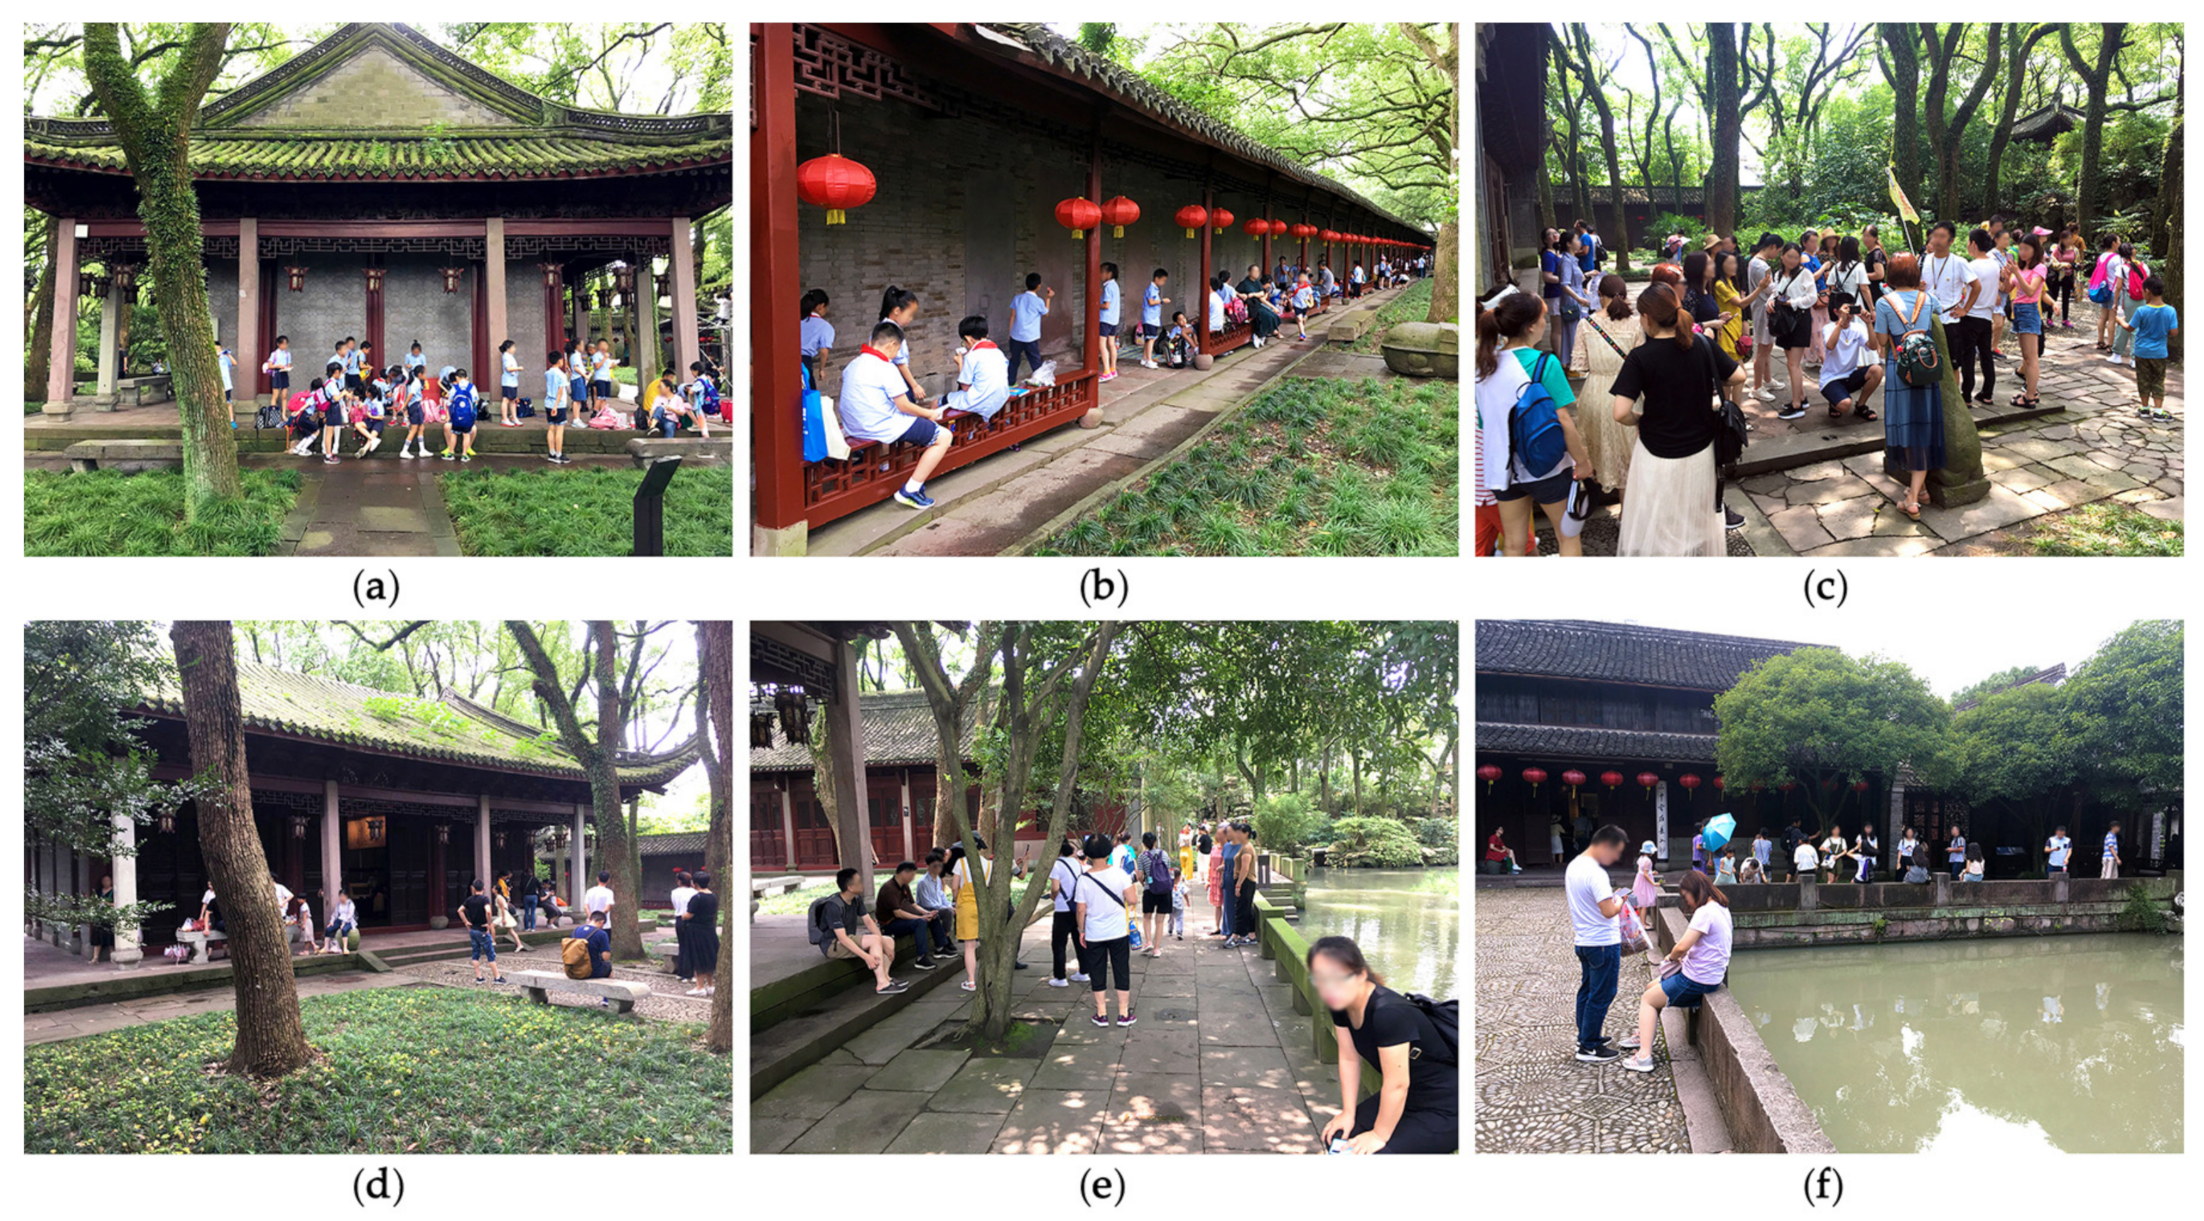
2.3.1. Visitor Flow and Activities
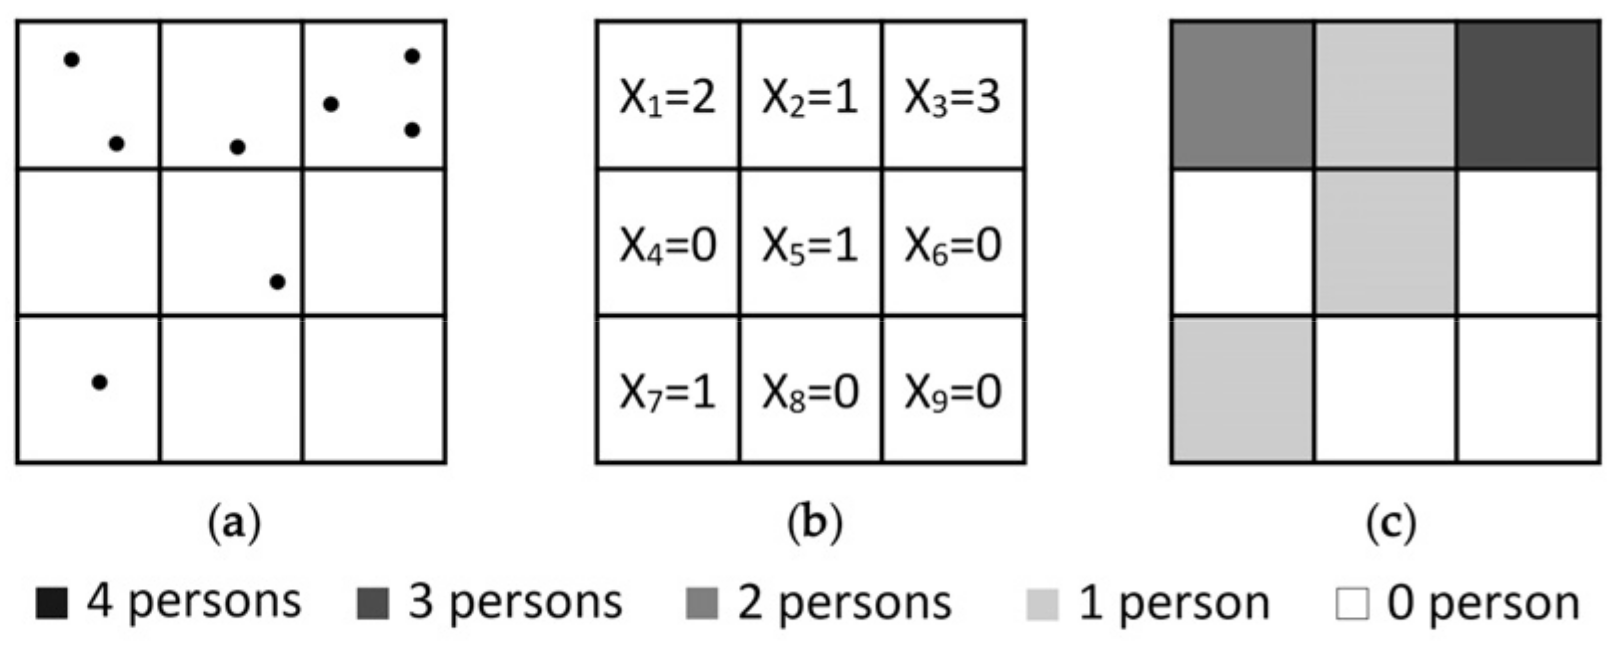
2.3.2. Visitor Stay Record
2.4. Data Analysis
3. Results
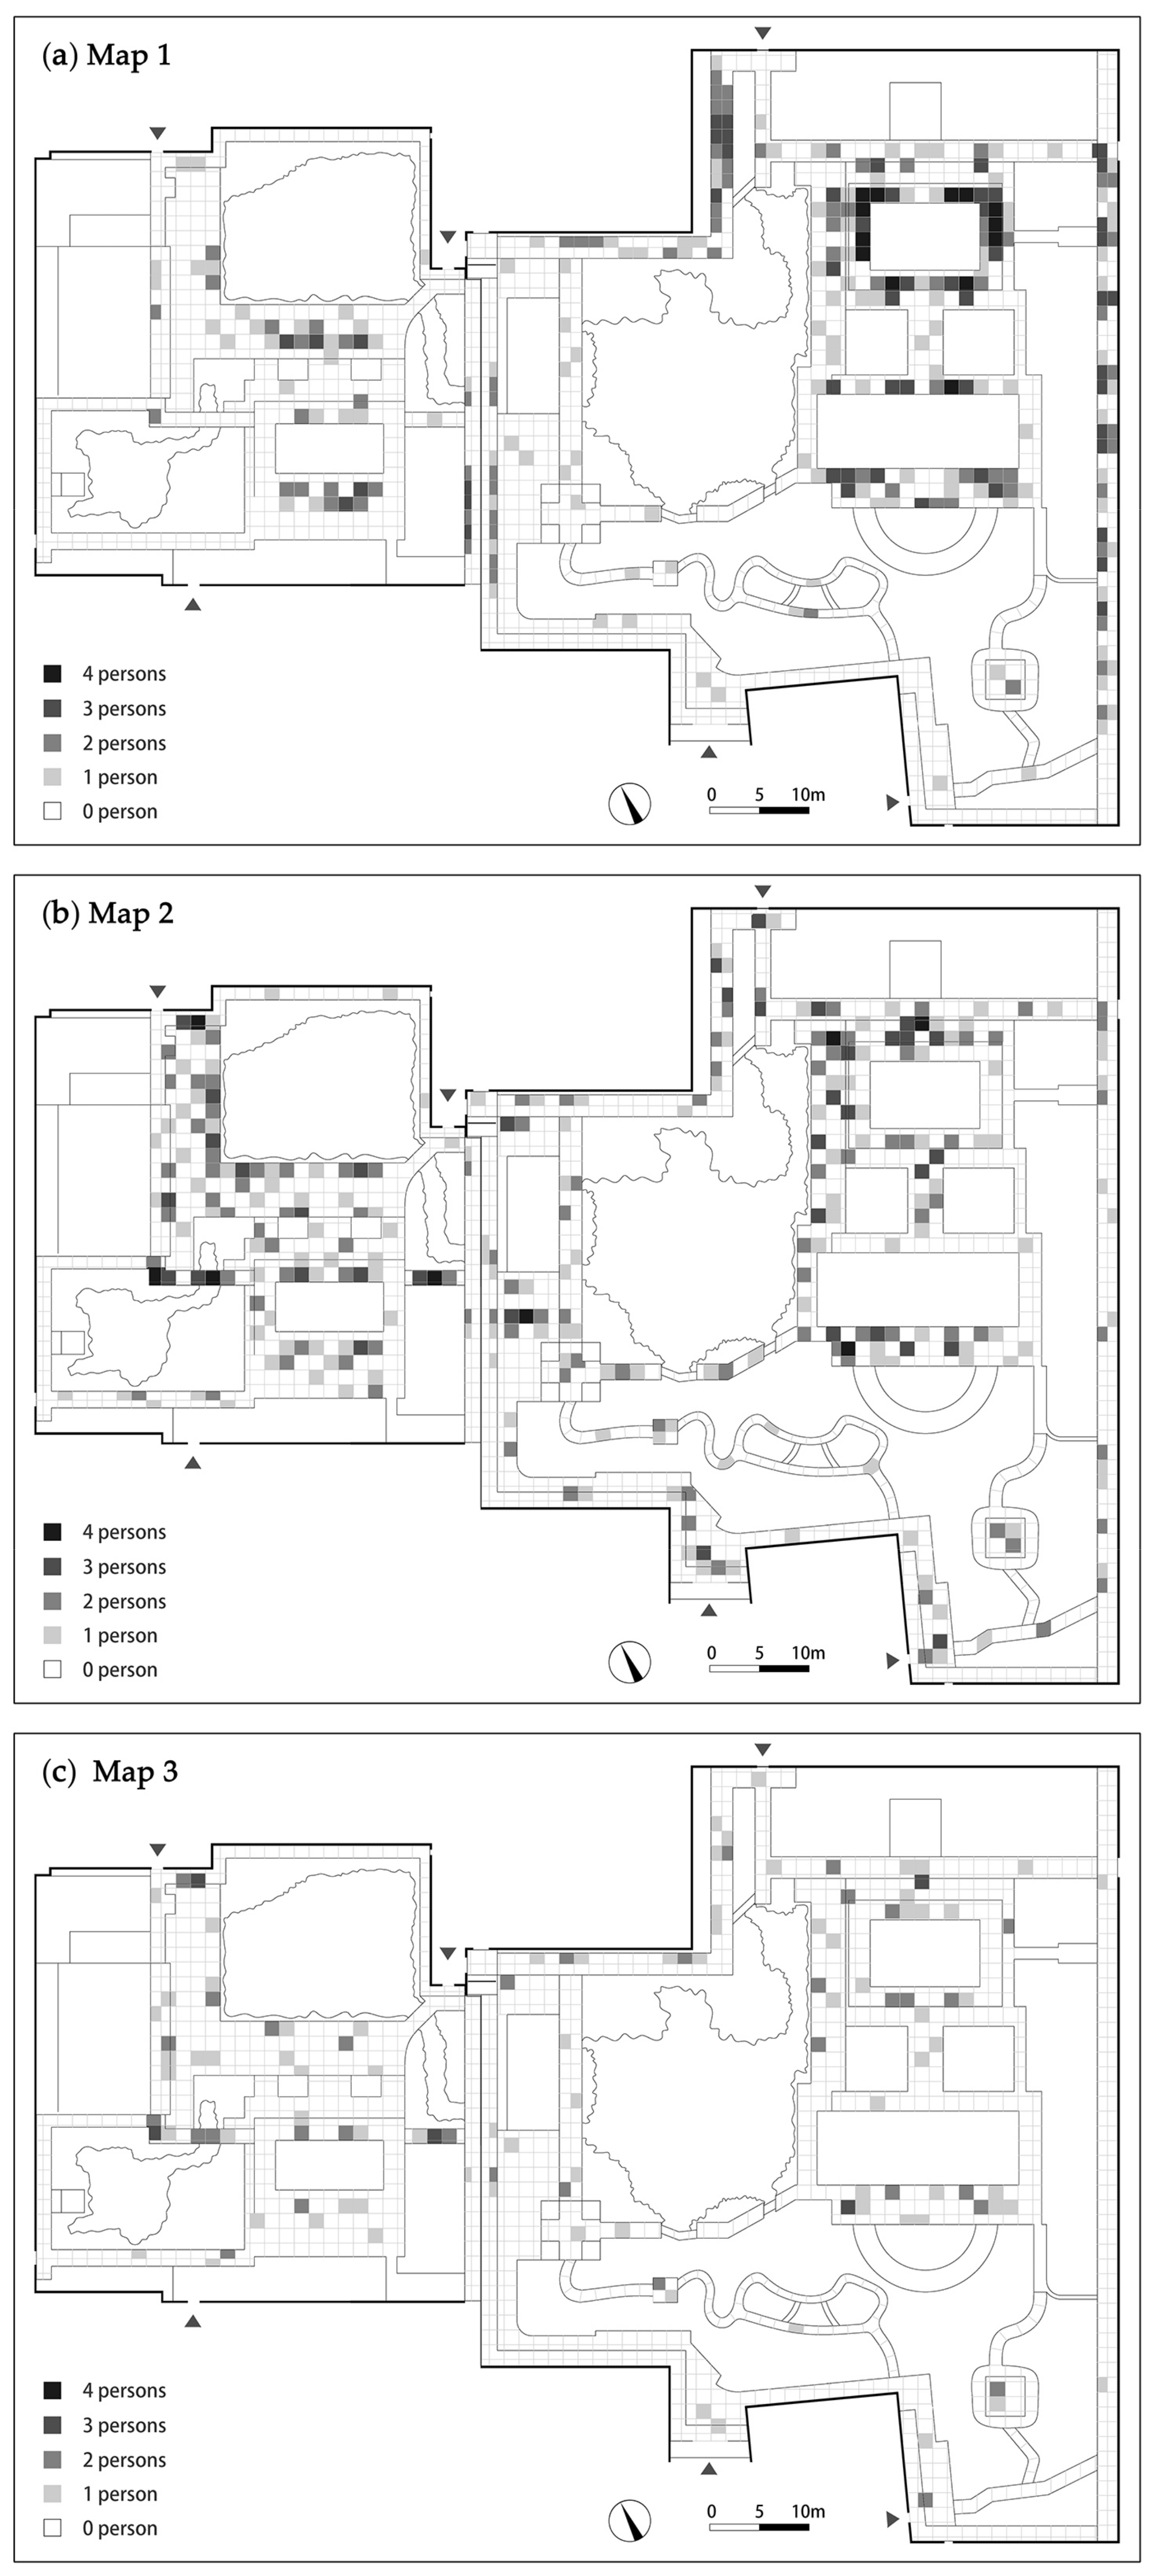
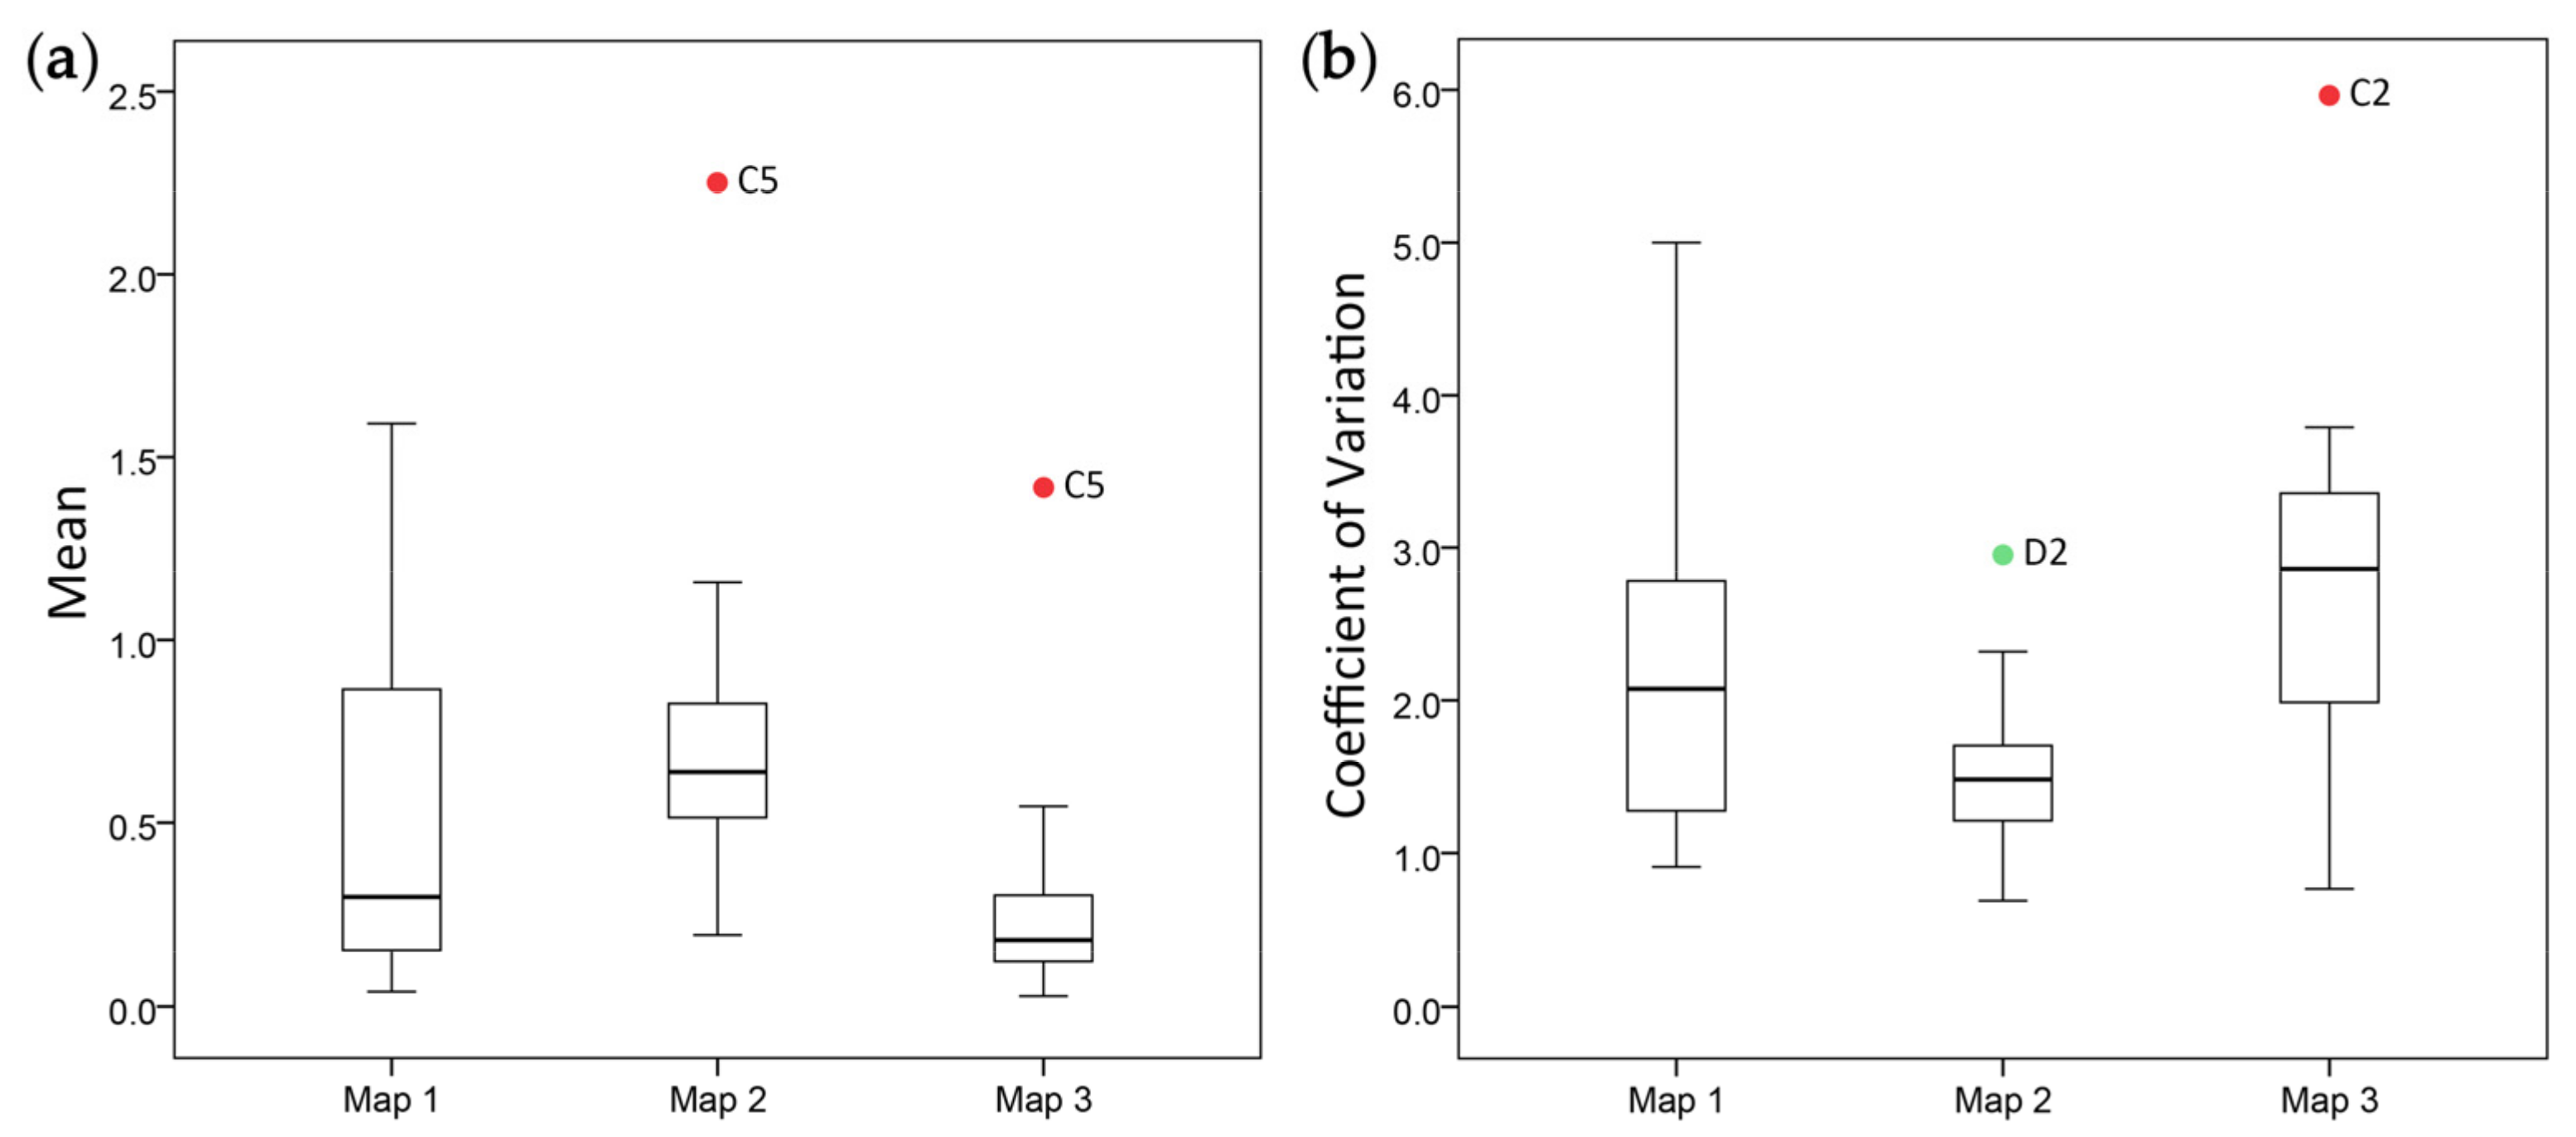
3.1. Visitor Stay Distribution Statistics
3.2. Correlations between Visitor Stay Density and Spatial Attributes
3.3. Correlations between Visitor Stay Dispersion and Spatial Attributes
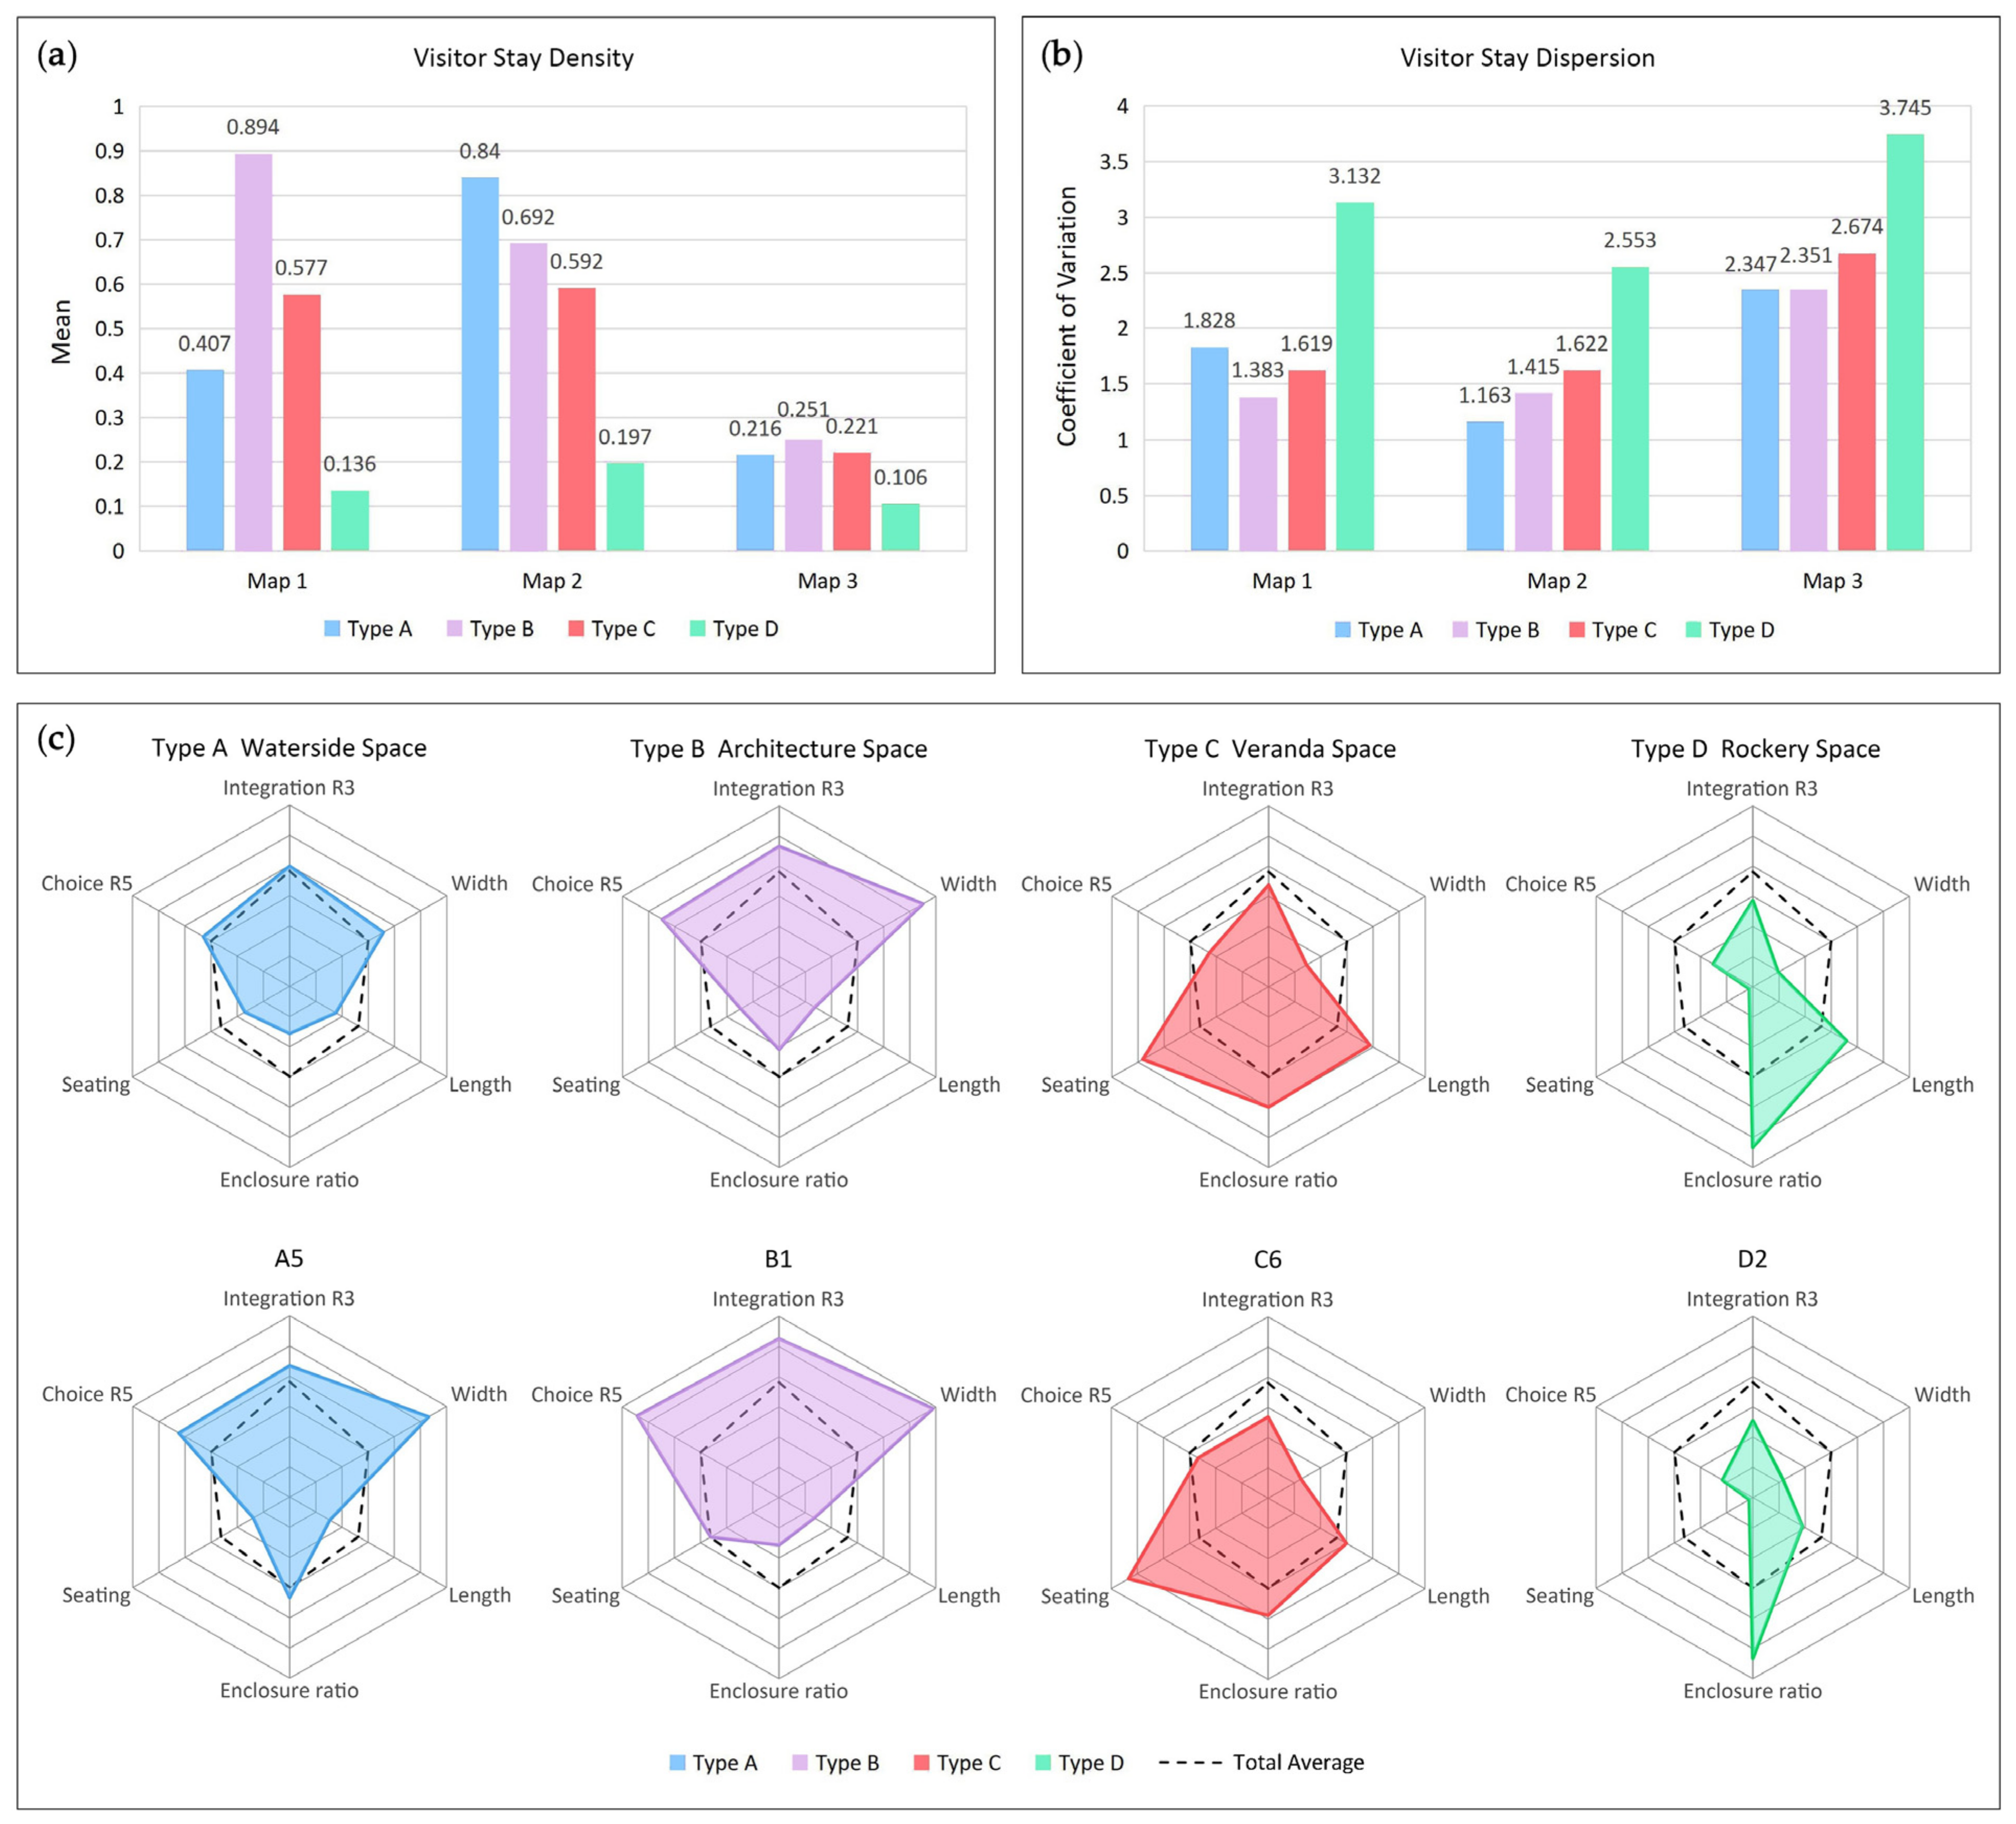
3.4. Characteristics of Visitor Stay Distribution and the Four Types of Garden Space
4. Discussion
4.1. Main Findings
4.2. Spatial Composition of Tianyige Garden
4.2.1. Composition Elements of Tianyige Garden Space
4.2.2. Forms and Configurations of Tianyige Garden Space
4.2.3. Distinctive Characteristics of Tianyige Garden Space
4.3. Attractiveness and Openness of the Garden Space
4.3.1. Attractiveness of the Four Types of Garden Space
4.3.2. Openness of the Garden Space Based on Six Spatial Attributes
4.4. Visitors and Activities
5. Conclusions
Author Contributions
Funding
Institutional Review Board Statement
Informed Consent Statement
Data Availability Statement
Acknowledgments
Conflicts of Interest
Appendix A. Calculation Methods of Space Syntax Measures
References
- Wang, J.Y. On the earliest form of garden in China. Acta Hortic. Sin. 1965, 4, 101–106. [Google Scholar]
- Wang, J.Y. The historical development of Chinese landscape garden. Chin. Landsc. Archit. 1985, 1, 34–38. [Google Scholar]
- Meng, Z.Z. The artistic characteristics and public attribute of Chinese garden: A case of Yangzhou. China Anc. City 2015, 29, 4–7. [Google Scholar]
- Zhou, W.Q. History of Chinese Classical Gardens; Tsinghua University Press: Beijing, China, 1990; pp. 183–184. [Google Scholar]
- Tong, J. Records of Jiangnan Gardens, 2nd ed.; China Architecture & Building Press: Beijing, China, 1984; pp. 3–14. [Google Scholar]
- Tong, J. Glimpses of Gardens in Eastern China; China Architecture & Building Press: Beijing, China, 1997; pp. 1–38. [Google Scholar]
- Liu, D.Z. Suzhou Classical Gardens; China Architecture & Building Press: Beijing, China, 1979; pp. 3–50. [Google Scholar]
- Chen, C.Z. Suzhou Gardens, centenary ed.; Tongji University Press: Shanghai, China, 2018; pp. 10–71. [Google Scholar]
- Zhao, J.J.; Woudstra, J. ‘Making green the motherland’: Greening the Chinese socialist undertaking (1949–1978). Stud. Hist. Gard. Des. L. 2012, 32, 312–330. [Google Scholar] [CrossRef]
- Zhao, J.J. Sixty years of landscape policies and development in China (1): ‘Chinese also new’. Landsc. Archit. 2009, 26, 102–105. [Google Scholar] [CrossRef]
- Zhao, J.J. Sixty years of landscape policies and development in China (4): Garden revolution. Landsc. Archit. 2009, 26, 75–79. [Google Scholar] [CrossRef]
- Lin, G.S. The development of the practice of contemporary Chinese landscape architecture—A critic based on five perspectives. In Proceedings of the 2010 47th International Federation of Landscape Architects World Congress (47th IFLA 2010), Suzhou, China, 28–30 March 2010; pp. 309–313. [Google Scholar]
- Wang, D. The Outline Study on the Chinese Modern Landscape Design (1949–1978) Development Program. Master’s Thesis, Hainan University, Haikou, China, 2012. [Google Scholar]
- Wang, N.N. The Historical Development of People’ Parks in New China (1949–1978). Master’s Thesis, Huazhong University of Science and Technology, Wuhan, China, 2016. [Google Scholar]
- Gao, L.; Woudstra, J. From landscape of gods to landscape of man: Imperial altars in Beijing. Stud. Hist. Gard. Des. L. 2011, 31, 231–268. [Google Scholar] [CrossRef]
- Yue, Z. Chinese garden heritage reservation study based on the history of Zhuozheng Garden. In Proceedings of the International Symposium on Prof. Chen Zhi’s Gardening Thought & Doctoral Forum of Landscape Architecture Theories and Practice, Nanjing, China, 14–15 November 2009; pp. 129–132. [Google Scholar]
- Gu, G.C.; Cheng, Y.; Li, L.; Guo, L.; Deng, H. The research of changes of the Chinese historical private classical garden and the authenticity of the protection. J. Hum. Settl. West China 2018, 33, 69–77. [Google Scholar] [CrossRef]
- Yang, B.; Volkman, N. From traditional to contemporary: Revelations in Chinese garden and public space design. Urban Des. Int. 2010, 15, 208–220. [Google Scholar] [CrossRef] [Green Version]
- Öztürk, H. The Sadabad Park project in İstanbul—Balancing garden heritage conservation and contemporary park design. J. Landsc. Archit. 2009, 4, 70–81. [Google Scholar] [CrossRef]
- Rostami, R.; Lamit, H.; Khoshnava, S.M.; Rostami, R. Successful public places: A case study of historical Persian gardens. Urban For. Urban Green. 2016, 15, 211–224. [Google Scholar] [CrossRef]
- Fung, S.; Huang, J. Mutuality and the cultures of landscape architecture. New Archit. 2001, 19, 4–7. [Google Scholar]
- Fung, S.; Jackson, M. Four key terms in the history of Chinese gardens. In Proceedings of the International Conference on Chinese Architectural History, Hong Kong, China, 7–10 August 1995; pp. 21–42. [Google Scholar]
- Fung, S. Self, scene and action: The final chapter of Yuan Ye. In Landscapes of Memory and Experience; Birksted, J., Ed.; Spon Press: London, UK, 2000; pp. 129–136. [Google Scholar]
- Chen, C.Z. On Chinese Gardens; Tongji University Press: Shanghai, China, 1984; pp. 1–58. [Google Scholar]
- Fung, S. Longing and belonging in Chinese garden history. In Perspectives on Garden Histories; Conan, M., Ed.; Dumbarton Oaks: Washington, DC, USA, 1999; pp. 205–219. [Google Scholar]
- Fung, S.; Liu, S.D.; Sun, Y. Aperspectival effects in the Liu Yuan, Suzhou. Archit. J. 2016, 56, 36–39. [Google Scholar]
- Yu, R.R.; Gu, N.; Ostwald, M. The mathematics of spatial transparency and mystery: Using syntactical data to visualise and analyse the properties of the Yuyuan Garden. Vis. Eng. 2016, 4, 4. [Google Scholar] [CrossRef] [Green Version]
- Yuan, X.; Wu, S. Soundscape of classical Chinese garden. Front. Archit. Civ. Eng. China 2008, 2, 172–178. [Google Scholar] [CrossRef]
- Yu, R.R.; Ostwald, M. Spatio-visual experience of movement through the Yuyuan Garden: A computational analysis based on isovists and visibility graphs. Front. Archit. Res. 2018, 7, 497–509. [Google Scholar] [CrossRef]
- Zhang, T.T.; Lian, Z.F.; Xu, Y.N. Combining GPS and space syntax analysis to improve understanding of visitor temporal–spatial behaviour: A case study of the Lion Grove in China. Landsc. Res. 2020, 45, 534–546. [Google Scholar] [CrossRef]
- Mu, X.D. Image, word and Chinese gardens: Juxtaposition of photograph and lyric by Chen Congzhou. J. Tongji Univ. Soc. Sci. Sect. 2018, 29, 48–63. [Google Scholar]
- Elsadek, M.; Sun, M.; Sugiyama, R.; Fujii, E. Cross-cultural comparison of physiological and psychological responses to different garden styles. Urban For. Urban Green. 2019, 38, 74–83. [Google Scholar] [CrossRef]
- Suthasupa, S. Kenrokuen’s six garden attributes and the understanding-and-exploration approach. Procedia Soc. Behav. Sci. 2012, 50, 657–666. [Google Scholar] [CrossRef] [Green Version]
- Tsumita, H.; Fukushima, K.; Shimazu, M. Study of the landscape composition and psychological evaluation in Japanese Zakanshiki garden. J. Archit. Plann. AIJ 2016, 81, 2393–2399. [Google Scholar] [CrossRef] [Green Version]
- Sun, P. The Contrast Interpretation of Chinese Classical Gardens between Space Syntax Theory and Traditional Theories: The Space Research of Chengde Mountain Resort. Ph.D. Thesis, Beijing Forestry University, Beijing, China, 2012. [Google Scholar]
- Chen, R. Research on Traditional Chinese Garden’s Space Syntax and Insights into Contemporary Regional Reconstruction. Master’s Thesis, Tsinghua University, Beijing, China, 2012. [Google Scholar]
- Luo, J.C.; Hong, B. Analysis of the characteristics of Beijing Grand View Garden based on space syntax. South Archit. 2019, 190, 93–98. [Google Scholar] [CrossRef]
- Polat, A.T.; Akay, A. Relationships between the visual preferences of urban recreation area users and various landscape design elements. Urban For. Urban Green. 2015, 14, 573–582. [Google Scholar] [CrossRef]
- Lindemann-Matthies, P.; Köhler, K. Naturalized versus traditional school grounds: Which elements do students prefer and why? Urban For. Urban Green. 2019, 46, 126475. [Google Scholar] [CrossRef]
- Wang, R.; Zhao, J.; Liu, Z. Consensus in visual preferences: The effects of aesthetic quality and landscape types. Urban For. Urban Green. 2016, 20, 210–217. [Google Scholar] [CrossRef]
- Lin, W.; Chen, Q.B.; Jiang, M.Y.; Zhang, X.X.; Liu, Z.F.; Tao, J.Y.; Wu, L.J.; Xu, S.; Kang, Y.S.; Zeng, Q.Y. The effect of green space behaviour and per capita area in small urban green spaces on psychophysiological responses. Landsc. Urban. Plan. 2019, 192, 103637. [Google Scholar] [CrossRef]
- Deng, L.; Li, X.; Luo, H.; Fu, E.K.; Ma, J.; Sun, L.X.; Huang, Z.; Cai, S.Z.; Jia, Y. Empirical study of landscape types, landscape elements and landscape components of the urban park promoting physiological and psychological restoration. Urban For. Urban Green. 2020, 48, 126488. [Google Scholar] [CrossRef]
- Harris, V.; Kendal, D.; Hahs, A.K.; Threlfall, C.G. Green space context and vegetation complexity shape people’s preferences for urban public parks and residential gardens. Landsc. Res. 2018, 43, 150–162. [Google Scholar] [CrossRef]
- Rahnema, S.; Sedaghathoor, S.; Allahyari, M.S.; Damalas, C.A.; Bilali, H.E. Preferences and emotion perceptions of ornamental plant species for green space designing among urban park users in Iran. Urban For. Urban Green. 2019, 39, 98–108. [Google Scholar] [CrossRef]
- Zhao, J.W.; Xu, W.Y.; Li, R.J. Visual preference of trees: The effects of tree attributes and seasons. Urban For. Urban Green. 2017, 25, 19–25. [Google Scholar] [CrossRef]
- Qiu, L.; Yu, N.; Gao, Y.; Zhang, T.; Gao, T. Public visual preference for dead wood in different types of landscape. Forests 2021, 12, 44. [Google Scholar] [CrossRef]
- Yalowitz, S.S.; Bronnenkant, K. Timing and tracking: Unlocking visitor behavior. Visit. Stud. 2009, 12, 47–64. [Google Scholar] [CrossRef]
- Mygind, L.; Bentsen, P. Reviewing automated sensor-based visitor tracking studies: Beyond traditional observational methods? Visit. Stud. 2017, 20, 202–217. [Google Scholar] [CrossRef]
- Zwinkels, J.; Oudegeest, T.; Laterveer, M. Using visitor observation to evaluate exhibits at the Rotterdam zoo aquarium. Visit. Stud. 2009, 12, 65–77. [Google Scholar] [CrossRef]
- Kirchgessner, M.L.; Sewall, B.J. The impact of environmental, social, and animal factors on visitor stay times at big cat exhibits. Visit. Stud. 2015, 18, 150–167. [Google Scholar] [CrossRef]
- Skov, M.; Lykke, M.; Jantzen, C. Introducing walk-alongs in visitor studies: A mobile method approach to studying user experience. Visit. Stud. 2018, 21, 189–210. [Google Scholar] [CrossRef]
- Stylianou-Lambert, T. Photographing in the art museum: Visitor attitudes and motivations. Visit. Stud. 2017, 20, 114–137. [Google Scholar] [CrossRef]
- Song, X.P.; Richards, D.R.; He, P.; Tan, P.Y. Does geo-located social media reflect the visit frequency of urban parks? A city-wide analysis using the count and content of photographs. Landsc. Urban. Plan. 2020, 203, 103908. [Google Scholar] [CrossRef]
- Wei, H.X.; Ma, B.Q.; Hauer, R.J.; Liu, C.Y.; Chen, X.; He, X.Y. Relationship between environmental factors and facial expressions of visitors during the urban forest experience. Urban For. Urban Green. 2020, 53, 126699. [Google Scholar] [CrossRef]
- Fox, D. External agents of change: A 10-year trend study of garden visitor behaviour in England. Tour. Recreat. Res. 2017, 42, 446–456. [Google Scholar] [CrossRef]
- Li, D.Z. Introduction to Environmental Ethology; Tsinghua University Press: Beijing, China, 1999; pp. 1–11. [Google Scholar]
- Do, D.T.; Cheng, Y.; Shojai, A.; Chen, Y. Public park behaviour in Da Nang: An investigation into how open space is used. Front. Archit. Res. 2019, 8, 454–470. [Google Scholar] [CrossRef]
- Sharif, A.A. User activities and the heterogeneity of urban space: The case of Dahiyat Al Hussein park. Front. Archit. Res. 2020, 9, 837–857. [Google Scholar] [CrossRef]
- Sonti, N.F.; Campbell, L.K.; Svendsen, E.S.; Johnson, M.L.; Novem Auyeung, D.S. Fear and fascination: Use and perceptions of New York City’s forests, wetlands, and landscaped park areas. Urban For. Urban Green. 2020, 49, 126601. [Google Scholar] [CrossRef]
- Zhai, Y.J.; Baran, P.K.; Wu, C.Z. Can trail spatial attributes predict trail use level in urban forest park? An examination integrating GPS data and space syntax theory. Urban For. Urban Green. 2018, 29, 171–182. [Google Scholar] [CrossRef]
- Zhai, Y.J.; Baran, P.K.; Wu, C.Z. Spatial distributions and use patterns of user groups in urban forest parks: An examination utilizing GPS tracker. Urban For. Urban Green. 2018, 35, 32–44. [Google Scholar] [CrossRef]
- Hu, X.Y.; Shen, P.Y.; Shi, Y.; Zhang, Z.H. Using Wi-Fi probe and location data to analyze the human distribution characteristics of green spaces: A case study of the Yanfu Greenland Park, China. Urban For. Urban Green. 2020, 54, 126733. [Google Scholar] [CrossRef]
- Guan, P.; Xu, X.D.; Xu, N.; Wang, W. Analyses of the impact of built environment factors of small public green spaces on public health—A case study on the old city center of Nanjing, Jiangsu Province. Landsc. Archit. Front. 2020, 8, 76–92. [Google Scholar] [CrossRef]
- Jiang, J.Y.; Chen, M.; Zhang, J.H. Analyses of elderly visitors’ behaviors to community parks in Shanghai and the impact factors. Landsc. Archit. Front. 2020, 8, 94–109. [Google Scholar] [CrossRef]
- Zhai, Y.J.; Baran, P.K. Urban park pathway design characteristics and senior walking behavior. Urban For. Urban Green. 2017, 21, 60–73. [Google Scholar] [CrossRef]
- Zhai, Y.J.; Li, D.Y.; Wu, C.Z.; Wu, H.B. Urban park facility use and intensity of seniors’ physical activity—An examination combining accelerometer and GPS tracking. Landsc. Urban. Plan. 2021, 205, 103950. [Google Scholar] [CrossRef]
- Cohen, D.A.; Han, B.; Derose, K.P.; Williamson, S.; Marsh, T.; Raaen, L.; McKenzie, T.L. The paradox of parks in low-income areas: Park use and perceived threats. Environ. Behav. 2016, 48, 230–245. [Google Scholar] [CrossRef] [PubMed]
- Chen, F.F. The Summary Reviews of Chinese Garden History Studies. Master’s Thesis, Tianjin University, Tianjin, China, 2007. [Google Scholar]
- Zhang, T.T. The Summary Reviews of Chinese Garden History Studies (2006–2011). Master’s Thesis, Tianjin University, Tianjin, China, 2012. [Google Scholar]
- Gu, Z.X.; Zhang, Q.P. Research status and future trends of domestic studies on Suzhou classical gardens in the past two decades: Bibliometric analysis based on CNKI. Chin. Landsc. Archit. 2018, 34, 73–77. [Google Scholar]
- Jim, C.Y.; Chen, W.Y. Recreation–amenity use and contingent valuation of urban greenspaces in Guangzhou, China. Landsc. Urban. Plan. 2006, 75, 81–96. [Google Scholar] [CrossRef]
- Jim, C.Y.; Chen, W.Y. Leisure participation pattern of residents in a new Chinese city. Ann. Assoc. Am. Geogr. 2009, 99, 657–673. [Google Scholar] [CrossRef]
- Lin, Q.Q.; Zhang, L.; Wu, G.L. Study on Chen Congzhou’s gardening theory from construction process of East Garden in Tianyige Museum. Landsc. Archit. 2019, 36, 42–46. [Google Scholar] [CrossRef]
- Shi, Z.Q. A preliminary study on Tianyige garden. In Tianyi Pavilion Series, 10th ed.; Tianyige, M., Ed.; Zhejiang Ancient Books Publishing House: Hangzhou, China, 2012; pp. 224–228. [Google Scholar]
- Lai, D.L. 20th century aesthetic studies of the Chinese garden and the contributions of Chen Congzhou. Architect 2018, 16, 15–22. [Google Scholar]
- Gu, K. Tentative study on historiographical context of Chen Congzhou’s Chinese garden research: Correlation and comparison with Liu Dunzhen and Tong Jun. Architect 2019, 17, 66–72. [Google Scholar]
- Wu, X.Y. Comparison of differences between ancient and modern gardens. Chin. Landsc. Archit. 1999, 15, 64–65. [Google Scholar]
- Zhang, Y.Z.; Zhao, S.C. Spatial composition and pedestrian behavior characteristics in the traditional commercial streets of Lhasa, Tibet. J. Archit. Plann. AIJ 2018, 83, 45–54. [Google Scholar] [CrossRef] [Green Version]
- Lynch, K. The Image of the City; The MIT Press: Cambridge, MA, USA, 1960; pp. 46–72. [Google Scholar]
- Norberg-Schulz, C. Existence, Space & Architecture; Praeger: New York, NY, USA, 1971; pp. 17–27. [Google Scholar]
- Norberg-Schulz, C. Architecture: Presence, Language and Place; Skira: Milan, Italy, 2000; pp. 131–158. [Google Scholar]
- Ashihara, Y. Exterior Design in Architecture; Van Nostrand Reinhold Company: New York, NY, USA, 1981; pp. 42–50. [Google Scholar]
- Li, X. Research on the Contemporary Open Space of Zhongguancun West Zone of Beijing. Master’s Thesis, Tsinghua University, Beijing, China, 2011. [Google Scholar]
- Gehl, J. Life between Buildings: Using Public Space; Van Nostrand Reinhold Company: New York, NY, USA, 1987; pp. 155–162. [Google Scholar]
- Hillier, B.; Burdett, R.; Peponis, J.; Penn, A. Creating life: Or, does architecture determine anything? Archit. Comport./Archit. Behav. 1987, 3, 233–250. [Google Scholar]
- Kruger, M.J.T. On node and axial grid maps: Distance measures and related topics. In Proceedings of the European Conference on the Representation and Management of Urban Change, Cambridge, UK, 28–29 September 1989; pp. 1–34. [Google Scholar]
- Tianyige Museum. 2017 Visitor Survey Report of Tianyige Museum. Available online: http://www.tianyige.com.cn/news/notice/67a39924fefaa3326a8583ebc0b6cea3 (accessed on 24 August 2021).
- Tianyige Museum. 2018 Visitor Survey Report of Tianyige Museum. Available online: http://www.tianyige.com.cn/news/notice/22c6d704c499ca3bee2ce2112c9c2634 (accessed on 24 August 2021).
- Tianyige Museum. 2019 Visitor Survey Report of Tianyige Museum. Available online: http://www.tianyige.com.cn/news/notice/3bc241182db59f8cc323c1dc7eca83a3 (accessed on 24 August 2021).
- Tianyige Museum. 2020 Visitor Survey Report of Tianyige Museum. Available online: http://www.tianyige.com.cn/news/notice/8a59b3e992f1a824e231f6ee08480b22 (accessed on 24 August 2021).
- Tianyige Museum. Official App of Tianyige Museum: Version 1.9 for Android and version 2.9 for iOS. Available online: https://m.tyg.youwandao.com/download/ (accessed on 24 August 2021).
- Jia, J.P.; He, X.Q.; Jin, Y.J. Statistics, 7th ed.; China Renmin University Press: Beijing, China, 2018; pp. 67–88. [Google Scholar]
- Wen, Y.X. An Elementary Study on the Design of the Space of Verandas. Master’s Thesis, Southeast University, Nanjing, China, 2004. [Google Scholar]
- Zhang, X.Y. A Study on Design Theories of Traditional Chinese Garden-Passageway. Ph.D. Thesis, Beijing Forestry University, Beijing, China, 2007. [Google Scholar]
- Tang, Z. Research on Passageway Space Quantization Characteristic in Jiangnan Private Gardens. Master’s Thesis, Nanjing Agricultural University, Nanjing, China, 2009. [Google Scholar]
- Liu, J.H.; Yu, Y.F. Quantification study on space elements of Tianyige garden. J. Mt. Agric. Biol. 1999, 18, 167–170. [Google Scholar] [CrossRef]
- Ji, C. The Explanation of Yuan Ye, 2nd ed.; Chen, Z., Ed.; China Architecture & Building Press: Beijing, China, 1988; pp. 71–72. [Google Scholar]
- Pan, G.X. The problems of the layout of Suzhou gardens. J. Southeast Univ. 1963, 5, 45–65. [Google Scholar]
- Gu, K. Study on Gardens of Jiangnan Area in Ming Dynasty: Garden Ideas and Gardening Practices. Ph.D. Thesis, Southeast University, Nanjing, China, 2008. [Google Scholar]
- Ding, S.G.; Lu, P.; Liu, Y.Y.; Cheng, S. Stationary point method applied in spatial analysis on Chinese gardens: Taking an example of the Master of Nets Garden. J. Nanjing Agric. Univ. 2017, 40, 998–1006. [Google Scholar] [CrossRef]
- Ding, S.G.; Yang, Y.; Liu, Y.Y.; Niu, Y.; Lu, P. Study on regularities of stationary points distribution in Liu Garden based on visitors’ tour behaviors. Chin. Landsc. Archit. 2018, 34, 116–122. [Google Scholar]
- Senda, M.; Takagi, M.; Ogawa, K. Ro-space in the Chinese classical garden: Focused on the users’ understanding and their actions. J. Archit. Plan. Environ. Eng. Trans. AIJ 2001, 66, 261–267. [Google Scholar] [CrossRef]
- Ren, L.D.; Takagi, M.; Senda, M. Ro-space in the Chinese imperial garden analyzed by the users’ stay. J. Jpn. Inst. Landsc. Archit. 2005, 68, 421–424. [Google Scholar] [CrossRef] [Green Version]
- Shanghai Yuyuan Tourist Mart (Group) Co., Ltd. Annual Report of Yuyuan Inc. 2019. Available online: https://www.yuyuantm.com.cn/uploads/20200326161127/f.pdf (accessed on 24 August 2021).
- Yuan, F.F. Composition and Analysis of ‘Users’ of Tianyige. In Tianyi Pavilion Series, 11th ed.; Tianyige, M., Ed.; Zhejiang Ancient Books Publishing House: Hangzhou, China, 2013; pp. 165–167. [Google Scholar]
- Lv, H. Research on the Relationship between Recreation Activity and Space of the City Park. Ph.D. Thesis, Shandong Agricultural University, Taian, China, 2013. [Google Scholar]
- Su, M.M.; Wall, G. Residents’ use and perceptions of the Summer Palace world heritage site in Beijing, China. Int. J. Tour. Anthropol. 2014, 3, 357–369. [Google Scholar] [CrossRef]
- Su, M.M.; Wall, G. Exploring the shared use of world heritage sites: Residents and domestic tourists’ use and perceptions of the Summer Palace in Beijing. Int. J. Tourism Res. 2015, 17, 591–601. [Google Scholar] [CrossRef]
- Gu, X.S. Harmony between cultural heritage site and community: Taking the Mountain Resort in Chengde as an example. J. Hebei Norm. Univ. Natl. 2012, 32, 33–35. [Google Scholar] [CrossRef]
- Sun, Z.; Sun, S.W.; Li, C.C. Exploration of Park City: Connotation, concept and development. Chin. Landsc. Archit. 2021, 37, 14–17. [Google Scholar] [CrossRef]
- Ye, J.N.; Zhang, Y.; Wang, H. The new mode of the construction and development of Park City from the perspective of humanism in the new era. Chin. Landsc. Archit. 2021, 37, 24–28. [Google Scholar] [CrossRef]


| Type | Unit | Main Element | Roof | Adjacent Elements | Other Visible Elements |
|---|---|---|---|---|---|
| Type A | A1 | Water | Fully open | Water, Architecture | Veranda, Rockery |
| A2 | Water | Fully open | Water, Rockery | Architecture, Veranda | |
| A3 | Water | Fully open | Water, Grass | Veranda, Rockery | |
| A4 | Water | Fully open | Water, Pavement | Architecture, Veranda | |
| A5 | Water | Fully open | Water, Architecture | Veranda | |
| Type B | B1 | Architecture | Partial roof | Architecture, Grass | Veranda |
| B2 | Architecture | Partial roof | Architecture, Grass | Water, Veranda | |
| B3 | Architecture | Partial roof | Architecture, Grass | Water, Veranda, Rockery | |
| B4 | Architecture | Partial roof | Architecture, Pavement | Water, Veranda | |
| B5 | Architecture | Partial roof | Architecture, Grass | Water, Veranda | |
| Type C | C1 | Veranda | Full roof | Wall, Water | Architecture, Rockery |
| C2 | Veranda | Full roof | Wall, Grass | Architecture, Rockery | |
| C3 | Veranda | Full roof | Wall, Rockery | None | |
| C4 | Veranda | Full roof | Wall, Pavement, Grass | Water, Architecture, Rockery | |
| C5 | Veranda | Full roof | Water, Grass | Architecture | |
| C6 | Veranda | Full roof | Wall, Water | Architecture | |
| C7 | Veranda | Full roof | Wall, Pavement | Water, Architecture | |
| C8 | Veranda | Full roof | Wall, Water | Architecture | |
| Type D | D1 | Rockery | Fully open | Rockery | Water, Architecture |
| D2 | Rockery | Fully open | Rockery | None |
| Type | Unit | Length | Width | Perimeter | Enclo. Length | Enclo. Height | Seating | L/W | D/H | Enclos. Ratio |
|---|---|---|---|---|---|---|---|---|---|---|
| Type A | A1 | 30.9 | 3.5 | 68.8 | 14.3 | 5.0 | 30.0 | 6.657 | 0.700 | 20.8% |
| A2 | 20.2 | 1.5 | 43.4 | 20.2 | 3.5 | 2.0 | 13.467 | 0.429 | 46.5% | |
| A3 | 22.3 | 2.3 | 49.2 | 0 | 3.0 | 3.0 | 9.696 | 2.867 | 0 | |
| A4 | 18.8 | 5.5 | 48.6 | 0 | 4.0 | 18.8 | 3.418 | 2.625 | 0 | |
| A5 | 19.4 | 5.5 | 49.8 | 24.5 | 5.0 | 10.4 | 3.804 | 1.100 | 50.0% | |
| Type B | B1 | 17.1 | 6.4 | 47.0 | 11.1 | 4.5 | 19.6 | 2.672 | 1.422 | 23.6% |
| B2 | 17.1 | 4.1 | 69.4 | 24.7 | 4.5 | 25.6 | 4.171 | 0.911 | 35.6% | |
| B3 | 21.3 | 4.3 | 51.2 | 24.0 | 3.6 | 4.0 | 4.953 | 1.194 | 46.9% | |
| B4 | 15.3 | 6.7 | 44.0 | 11.0 | 4.0 | 2.0 | 2.284 | 1.675 | 25.0% | |
| B5 | 15.3 | 6.8 | 44.2 | 11.0 | 4.0 | 4.0 | 2.250 | 1.700 | 24.9% | |
| Type C | C1 | 42.8 | 1.9 | 89.4 | 44.7 | 3.0 | 60.2 | NA | 0.633 | 50.0% |
| C2 | 78.5 | 1.9 | 160.8 | 80.4 | 3.0 | 34.8 | NA | 0.633 | 50.0% | |
| C3 | 63.6 | 1.3 | 129.8 | 97.4 | 3.0 | 29.5 | NA | 0.433 | 75.0% | |
| C4 | 68.6 | 1.4 | 142.8 | 71.4 | 3.0 | 49.9 | NA | 0.467 | 50.0% | |
| C5 | 17.9 | 1.5 | 38.8 | 9.7 | 4.0 | 13.1 | NA | 1.350 | 25.0% | |
| C6 | 38.0 | 1.3 | 78.6 | 45.8 | 3.0 | 40.1 | NA | 0.433 | 58.3% | |
| C7 | 14.8 | 1.5 | 32.6 | 16.3 | 3.0 | 18.9 | NA | 0.500 | 50.0% | |
| C8 | 37.8 | 1.3 | 78.2 | 67.0 | 3.0 | 20.3 | NA | 0.433 | 85.7% | |
| Type D | D1 | 67.0 | 0.9 | 135.8 | NA | 2 | 1.0 | NA | 0.500 | 80.0% |
| D2 | 24.0 | 1.2 | 50.4 | NA | 2 | 1.0 | NA | 0.500 | 80.0% |
| Type | Unit | Connectivity | Choice [Norm] R3 | Choice [Norm] R5 | Integration [HH] R3 | Integration [HH] R5 |
|---|---|---|---|---|---|---|
| Type A | A1 | 6 | 0.229 | 0.270 | 2.015 | 1.382 |
| A2 | 2 | 0.152 | 0.083 | 1.137 | 1.039 | |
| A3 | 3 | 0.163 | 0.163 | 1.604 | 1.218 | |
| A4 | 3 | 0.166 | 0.235 | 1.726 | 1.299 | |
| A5 | 5 | 0.226 | 0.260 | 1.814 | 1.281 | |
| Type B | B1 | 7 | 0.447 | 0.333 | 2.195 | 1.328 |
| B2 | 6 | 0.216 | 0.183 | 1.896 | 1.311 | |
| B3 | 5 | 0.456 | 0.287 | 1.924 | 1.242 | |
| B4 | 6 | 0.340 | 0.316 | 1.917 | 1.350 | |
| B5 | 5 | 0.397 | 0.258 | 1.793 | 1.206 | |
| Type C | C1 | 3 | 0.258 | 0.184 | 1.599 | 1.052 |
| C2 | 3 | 0.144 | 0.183 | 1.457 | 1.218 | |
| C3 | 6 | 0.302 | 0.148 | 1.538 | 1.201 | |
| C4 | 5 | 0.141 | 0.114 | 1.459 | 1.174 | |
| C5 | 3 | 0.136 | 0.111 | 1.636 | 1.233 | |
| C6 | 2 | 0.167 | 0.164 | 1.121 | 0.965 | |
| C7 | 4 | 0.176 | 0.142 | 1.504 | 1.143 | |
| C8 | 3 | 0.128 | 0.067 | 1.184 | 0.990 | |
| Type D | D1 | 3 | 0.145 | 0.115 | 1.325 | 1.031 |
| D2 | 2 | 0.133 | 0.071 | 1.062 | 1.004 |
| Type | Unit | Grid | Visitor Number | Mean | Standard Deviation | Coefficient of Variation | ||||||||
|---|---|---|---|---|---|---|---|---|---|---|---|---|---|---|
| Map 1 | Map 2 | Map 3 | Map 1 | Map 2 | Map 3 | Map 1 | Map 2 | Map 3 | Map 1 | Map 2 | Map 3 | |||
| Type A | A1 | 44 | 20 | 34 | 7 | 0.455 | 0.773 | 0.159 | 0.820 | 1.097 | 0.479 | 1.802 | 1.419 | 3.013 |
| A2 | 11 | 1 | 8 | 1 | 0.091 | 0.727 | 0.091 | 0.302 | 0.786 | 0.302 | 3.319 | 1.081 | 3.319 | |
| A3 | 23 | 7 | 17 | 6 | 0.304 | 0.739 | 0.261 | 0.470 | 0.810 | 0.541 | 1.546 | 1.096 | 2.073 | |
| A4 | 46 | 27 | 33 | 9 | 0.587 | 0.717 | 0.196 | 0.909 | 0.981 | 0.500 | 1.549 | 1.368 | 2.551 | |
| A5 | 38 | 11 | 44 | 12 | 0.289 | 1.158 | 0.316 | 0.611 | 0.945 | 0.574 | 2.114 | 0.816 | 1.816 | |
| Sum | 162 | 66 | 136 | 35 | 0.407 | 0.840 | 0.216 | 0.744 | 0.977 | 0.507 | 1.828 | 1.163 | 2.347 | |
| Type B | B1 | 49 | 50 | 43 | 14 | 1.020 | 0.878 | 0.286 | 1.331 | 1.130 | 0.645 | 1.305 | 1.287 | 2.255 |
| B2 | 49 | 78 | 29 | 13 | 1.592 | 0.592 | 0.265 | 1.485 | 0.888 | 0.605 | 0.933 | 1.500 | 2.283 | |
| B3 | 38 | 47 | 38 | 17 | 1.237 | 1.000 | 0.447 | 1.125 | 1.139 | 0.760 | 0.909 | 1.139 | 1.700 | |
| B4 | 45 | 8 | 25 | 6 | 0.178 | 0.556 | 0.133 | 0.490 | 0.867 | 0.457 | 2.753 | 1.559 | 3.436 | |
| B5 | 46 | 20 | 22 | 7 | 0.435 | 0.478 | 0.152 | 0.886 | 0.781 | 0.420 | 2.037 | 1.634 | 2.763 | |
| Sum | 227 | 203 | 157 | 57 | 0.894 | 0.692 | 0.251 | 1.236 | 0.979 | 0.590 | 1.383 | 1.415 | 2.351 | |
| Type C | C1 | 42 | 36 | 26 | 15 | 0.857 | 0.619 | 0.357 | 1.072 | 0.909 | 0.618 | 1.251 | 1.468 | 1.731 |
| C2 | 71 | 66 | 23 | 2 | 0.930 | 0.324 | 0.028 | 1.125 | 0.650 | 0.167 | 1.210 | 2.006 | 5.964 | |
| C3 | 44 | 5 | 29 | 5 | 0.114 | 0.659 | 0.114 | 0.321 | 0.888 | 0.387 | 2.816 | 1.347 | 3.395 | |
| C4 | 47 | 41 | 26 | 6 | 0.872 | 0.553 | 0.128 | 1.013 | 0.829 | 0.397 | 1.162 | 1.499 | 3.102 | |
| C5 | 12 | 3 | 27 | 17 | 0.250 | 2.250 | 1.417 | 0.622 | 1.545 | 1.084 | 2.488 | 0.687 | 0.765 | |
| C6 | 25 | 1 | 9 | 4 | 0.040 | 0.360 | 0.160 | 0.200 | 0.638 | 0.473 | 5.000 | 1.772 | 2.956 | |
| C7 | 11 | 2 | 10 | 6 | 0.182 | 0.909 | 0.545 | 0.405 | 1.446 | 1.036 | 2.225 | 1.591 | 1.901 | |
| C8 | 20 | 3 | 11 | 5 | 0.150 | 0.550 | 0.250 | 0.366 | 1.099 | 0.786 | 2.440 | 1.998 | 3.144 | |
| Sum | 272 | 157 | 161 | 60 | 0.577 | 0.592 | 0.221 | 0.934 | 0.960 | 0.591 | 1.619 | 1.622 | 2.674 | |
| Type D | D1 | 40 | 6 | 8 | 4 | 0.150 | 0.200 | 0.100 | 0.427 | 0.464 | 0.379 | 2.847 | 2.320 | 3.790 |
| D2 | 26 | 3 | 5 | 3 | 0.115 | 0.192 | 0.115 | 0.431 | 0.567 | 0.431 | 3.748 | 2.953 | 3.748 | |
| Sum | 66 | 9 | 13 | 7 | 0.136 | 0.197 | 0.106 | 0.426 | 0.503 | 0.397 | 3.132 | 2.553 | 3.745 | |
| Sum | 727 | 435 | 467 | 159 | 0.598 | 0.642 | 0.219 | 0.998 | 0.951 | 0.558 | 1.669 | 1.481 | 2.548 | |
| Mean | Pearson Correlation (r) | |||||||
| Choice [Norm] R3 | Choice [Norm] R5 | Integration [HH] R3 | Integration [HH] R5 | |||||
| Map 1 (N = 20) | 0.380 | 0.394 | 0.552 * | 0.445 * | ||||
| Map 2 (N = 19) | 0.413 | 0.488 * | 0.580 ** | 0.517 * | ||||
| Map 3 (N = 19) | 0.302 | 0.229 | 0.331 | 0.104 | ||||
| Mean | Pearson Correlation (r) | |||||||
| Length | Width | L/W (N = 9) | D/H | Enclosure ratio | Seating | |||
| Map 1 (N = 20) | 0.018 | 0.326 | −0.113 | 0.104 | −0.271 | 0.329 | ||
| Map 2 (N = 19) | −0.496 * | 0.417 | 0.172 | 0.277 | −0.398 | −0.074 | ||
| Map 3 (N = 19) | −0.490 * | 0.140 | 0.192 | 0.112 | −0.119 | 0.023 | ||
| Mean | Pearson Correlation (r) | ||||||
|---|---|---|---|---|---|---|---|
| Length | Width | L/W (N = 9) | D/H | Enclosure Ratio | Seating | ||
| Type A&B | Map 1 (N = 10) | −0.128 | 0.113 | −0.113 | −0.154 | 0.163 | 0.474 |
| Map 2 (N = 10) | 0.312 | −0.108 | 0.172 | −0.196 | 0.423 | 0.041 | |
| Map 3 (N = 10) | 0.023 | 0.072 | 0.192 | 0.069 | 0.268 | 0.022 | |
| Type C&D | Map 1 (N = 10) | 0.510 | 0.737 * | NA | 0.086 | −0.444 | 0.681 * |
| Map 2 (N = 9) | −0.322 | 0.360 | NA | −0.090 | −0.401 | 0.383 | |
| Map 3 (N = 9) | −0.718 * | 0.245 | NA | 0.054 | −0.311 | 0.121 | |
| Map 1 (N = 20) | ||||
| Pearson Correlation (r) | Coefficient of Variation 1 | Mean 1 | Length | Width |
| Coefficient of Variation 1 | 1 | −0.792 ** | −0.019 | −0.358 |
| Mean 1 | −0.792 ** | 1 | 0.018 | 0.326 |
| Length | −0.019 | 0.018 | 1 | NA |
| Width | −0.358 | 0.326 | NA | 1 |
| Map 2 (N = 18) | ||||
| Pearson Correlation (r) | Coefficient of Variation 2 | Mean 2 | Length | Width |
| Coefficient of Variation 2 | 1 | −0.845 ** | 0.545 * | −0.377 |
| Mean 2 | −0.845 ** | 1 | −0.597 ** | 0.368 |
| Length | 0.545 * | −0.597 ** | 1 | NA |
| Width | −0.377 | 0.368 | NA | 1 |
| Map 3 (N = 18) | ||||
| Pearson Correlation (r) | Coefficient of Variation 3 | Mean 3 | Length | Width |
| Coefficient of Variation 3 | 1 | −0.856 ** | 0.437 | −0.318 |
| Mean 3 | −0.856 ** | 1 | −0.387 | 0.099 |
| Length | 0.437 | −0.387 | 1 | NA |
| Width | −0.318 | 0.099 | NA | 1 |
| Coefficient of Variation | Control | Correlation (r) | ||||
|---|---|---|---|---|---|---|
| Mean 1 | Mean 2 | Mean 3 | Length | Width | ||
| Map 1 (N = 20) | None | −0.792 ** | −0.019 | −0.358 | ||
| Mean 1 | NA | −0.174 | ||||
| Map 2 (N = 18) | None | −0.845 ** | 0.545 * | −0.377 | ||
| Mean 2 | 0.094 | −0.132 | ||||
| Map 3 (N = 18) | None | −0.856 ** | 0.437 | −0.318 | ||
| Mean 3 | 0.222 | NA | ||||
Publisher’s Note: MDPI stays neutral with regard to jurisdictional claims in published maps and institutional affiliations. |
© 2021 by the authors. Licensee MDPI, Basel, Switzerland. This article is an open access article distributed under the terms and conditions of the Creative Commons Attribution (CC BY) license (https://creativecommons.org/licenses/by/4.0/).
Share and Cite
Yu, J.; Yokota, T.; Itami, E.; Yang, J. Correlations between Spatial Attributes and Visitor Stay in Chinese Gardens: A Case Study of the Ningbo Tianyige Museum Gardens. Urban Sci. 2021, 5, 74. https://doi.org/10.3390/urbansci5040074
Yu J, Yokota T, Itami E, Yang J. Correlations between Spatial Attributes and Visitor Stay in Chinese Gardens: A Case Study of the Ningbo Tianyige Museum Gardens. Urban Science. 2021; 5(4):74. https://doi.org/10.3390/urbansci5040074
Chicago/Turabian StyleYu, Jia, Takashi Yokota, Emiko Itami, and Jing Yang. 2021. "Correlations between Spatial Attributes and Visitor Stay in Chinese Gardens: A Case Study of the Ningbo Tianyige Museum Gardens" Urban Science 5, no. 4: 74. https://doi.org/10.3390/urbansci5040074
APA StyleYu, J., Yokota, T., Itami, E., & Yang, J. (2021). Correlations between Spatial Attributes and Visitor Stay in Chinese Gardens: A Case Study of the Ningbo Tianyige Museum Gardens. Urban Science, 5(4), 74. https://doi.org/10.3390/urbansci5040074