1. Introduction
Across the globe, and especially in the large cities and metropolitan areas of Iran, the COVID-19 pandemic has severely impacted racial and ethnic minorities, the elderly, disadvantaged households, healthcare workers and facilities, and urban management procedures in general [
1,
2]. Up until the outbreak of the virus, the fragility of the concepts of “Globalization” and the “Global Village” in times of global crisis, like the recent pandemic, had not been understood to this extent [
3]. In fact, not only has the recent pandemic exposed the vulnerability of cities to widespread and unpredictable infectious diseases, it also highlighted the need for a paradigm shift in current urban management procedures to develop more resilient cities, especially pandemic-resilient cities and societies [
4]. In more than two years tackling COVID-19, it became evident that implementing the same tactics and actions in all cities around the globe had far less impact on addressing the critical conditions caused by the pandemic than taking local actions and meeting local needs [
5]. Thus, one of the crucial aspects that need to be reconsidered in this paradigm shift is the role and influence of local institutions in managing and controlling crises such as pandemics [
6]. The more the local institutions that are in direct contact with the citizens have a proper understanding of the local condition, the decision-making power, and the budget and authority to implement the necessary measures promptly, the less the citizens’ lives are affected by the adverse effects of such crises [
6,
7].
As we can see in the literature review section, although local institutions took steps to manage and control the recent pandemic in several cities and countries, few studies assessed their effectiveness in improving the resilience of local communities to the COVID-19 pandemic. To address this gap, this research presents a resilience evaluation and promotion framework that can be utilized by other cities with similar urban areas and local institutions. Using the U.S National Research Council definition of resilience [
8], this paper considers resilience as the ability to prepare and plan for, absorb, recover from, and more successfully, adapt to the adverse impacts of the COVID-19 pandemic. The developed framework was used to evaluate the impact of the NDOs’ actions in improving the resilience of Tehran’s deteriorated neighborhoods against the recent pandemic. Tehran has 196 neighborhoods with at least one deteriorated urban block, 65% of which are concentrated in 56 neighborhoods in the center and southern parts of the city [
9]. Based on the Supreme Council of Urban Planning and Architecture of Iran’s index, a deteriorated block is a block in which the majority of parcels are unstable, impermeable (accessible from paths with a width of less than 6 m), and are less than 200 m
2 in area [
10]. Aside from these physical indicators, Tehran’s deteriorated neighborhoods face far greater economic, social, and environmental problems than other parts of the city [
9].
After it became clear that Tehran’s comprehensive and detailed plans, which mainly emphasized the physical aspects and neglected the other dimensions, were ineffective in renovating deteriorated areas, the city management decided to start a collaborative and interactive renovation approach based on direct participation with local residents [
9]. To accelerate and facilitate the renewal and rehabilitation of deteriorated urban areas through this bottom-up planning approach, NDOs were established by Tehran Municipality Urban Renewal Organization and have worked in deteriorated neighborhoods for over two decades [
11]. During the recent pandemic, NDOs continued their main missions, including physical, environmental, and socioeconomic interventions to organize the conditions of these neighborhoods. Moreover, due to their close connection with local communities and their knowledge of the deficiencies and priorities within deteriorated neighborhoods, these offices have taken some measures to improve residents’ quality of life and reduce COVID-19’s adverse effects since the outbreak began.
In the following sections, using 20 assessment indicators derived from the related literature and NDOs’ descriptions of services, we first evaluated the extent to which the actions of NDOs during the pandemic aligned with the needs of target neighborhoods. Then, NDOs with similar performances were classified into three clusters, and, based on the most imbalanced indicators in each cluster, short-term action priorities were determined to increase the resilience of neighborhoods against the current pandemic. In addition, using the Balance Indicator Circles (BICs), the priority of long-term actions was determined for each office so that balanced resilience improvements against possible future pandemics could be planned for their respective neighborhoods. Analyzing the responses to the recent pandemic and the role of local institutions like Tehran’s NDOs makes it possible for other cities to increase knowledge concerning urban pandemic resilience. This could also offer insights on how to deal with likely future pandemics and provide strategies to reduce the effects of pandemics on various aspects of citizens’ lives. The proposed framework can both be used to evaluate and promote the resilience of deteriorated urban neighborhoods against pandemics and against other crises in cities with similar urban areas.
2. Literature Review
From the beginning of the recent outbreak, some studies have examined how urban governance procedures and capacities affect spread patterns, control, prevention, and crisis management strategies related to the COVID-19 pandemic [
12,
13]. Research on COVID-19 patterns in 276 Chinese cities showed that the urban governance capacity is a determining factor in preventing and controlling the consequences of the recent pandemic due to the difference it makes to economic and social resilience against crises [
14]. There are also studies that introduced assessment frameworks to evaluate the effectiveness of defined goals and measures to enhance resilience to COVID-19 [
15,
16]. For instance, Lak et al. [
17] developed a 27-indicator framework with physical, infrastructural, socioeconomic, and environmental aspects. Evaluating this framework in Tehran’s neighborhoods showed a negative correlation between the resilience degree of each neighborhood and the cumulative number of infected cases. Shi et al. [
18] conducted a similar study in Wuhan, China, and identified the key elements concerning residents’ reactions to the pandemic. They proposed a framework to assess the capacities of communities to alleviate the adverse effects of the recent pandemic. By surveying 26 high-risk and 14 low-risk communities, they classified the concept of resilience assessment as spatial, economic, social, and governance.
Moreover, through the lens of urban resilience, a group of studies calls for the accentuation of the multilevel governance settings in planning inclusive policies and actions at the local level [
19]. Counter to metropolitan-wide regional governance trends in the latter half of the 20th century, some researchers suggested that many public goods are best provided at the local level due to a better understanding of local needs [
6]. Additionally, some scholars and practitioners have suggested that taking local measures to boost urban resilience, whether regarded as mitigation or adaptation, may increase public support for local actions [
20]. Therefore, to take advantage of such local capacities, several national, regional, and local governments in member countries of the Organization for Economic Co-operation and Development (OECD) have delegated part of their responsibilities to local development agencies that are supervised by municipalities and/or city councils [
21]. Through citizen self-organization and close communication with local communities, these agencies have played a facilitator role in a bottom-up development process based on local needs [
22]. In fact, these local institutions have become key components of urban resilience by identifying, prioritizing, and implementing sustainable development measures and modifying them to meet the ever-changing needs of local residents [
23].
Following the recent COVID-19 pandemic, different cities have utilized the capacities of local institutions to improve citizen resilience [
24,
25]. For instance, the cooperation of 187 local institutions associated with municipalities during the COVID-19 pandemic in England proved that the participation of local institutions resulted in a higher quality of service provision compared with independent and centralized models [
25]. It is also evident from the comparison of measures taken by local institutions in the Netherlands and England that, in low-income neighborhoods, effective interaction and collective participation constitute the core of resilience promotion; because communicating with vulnerable groups leads to a better understanding of their experiences, needs, and problems, and provides an opportunity to implement citizens’ mental and physical health promotion programs. Additionally, through activities based on local communities, like improving public spaces, primary care, and social support, and creating effective, structured, and mutual communication with residents, the sense of belonging and social capital improves, and the community’s preparedness to deal with the after-effects of the COVID-19 pandemic and similar crises in the future is enhanced [
26]. For instance, a study on the performance of 20 local agencies in the United States during the pandemic and social distancing shows that these agencies were able to maintain interactions with residents (that used to be face-to-face before the pandemic) virtually. In other words, the social capital gained by these local-scale agencies helped them supervise and improve local people’s mental and physical health during the crisis [
27]. Finally, in India, local institutions—as facilitators and mediators between local communities, healthcare authorities, and urban managers—managed to significantly control the spread of the disease at the local level. They gathered the required data to determine the feasibility of the necessary measures to reduce the risk of the virus spreading in the first step and then implemented these measures by setting up different care zones in the middle of the neighborhoods [
28].
The reviewed studies and experiences show that local institutions utilized a variety of local-level measures, such as empowerment, the use of smart technologies, facilitating inter-sectoral management, maintaining and promoting social capital, and neighborhood development, to manage the critical condition of the pandemic. Moreover, different practices reveal that, due to the scale of their performance and immediate interaction with the local community, local institutions can and should play a critical role in the explicit recognition of the needs and problems of each neighborhood based on their specific conditions and characteristics. Hence, it can be argued that COVID-19 highlighted the need for a paradigm shift from top-down thinking and planning to local planning, as the pandemic showed that conventional approaches cannot enhance or even maintain cities’ resilience when they are exposed to a widespread and unpredictable infectious disease.
3. Study Area
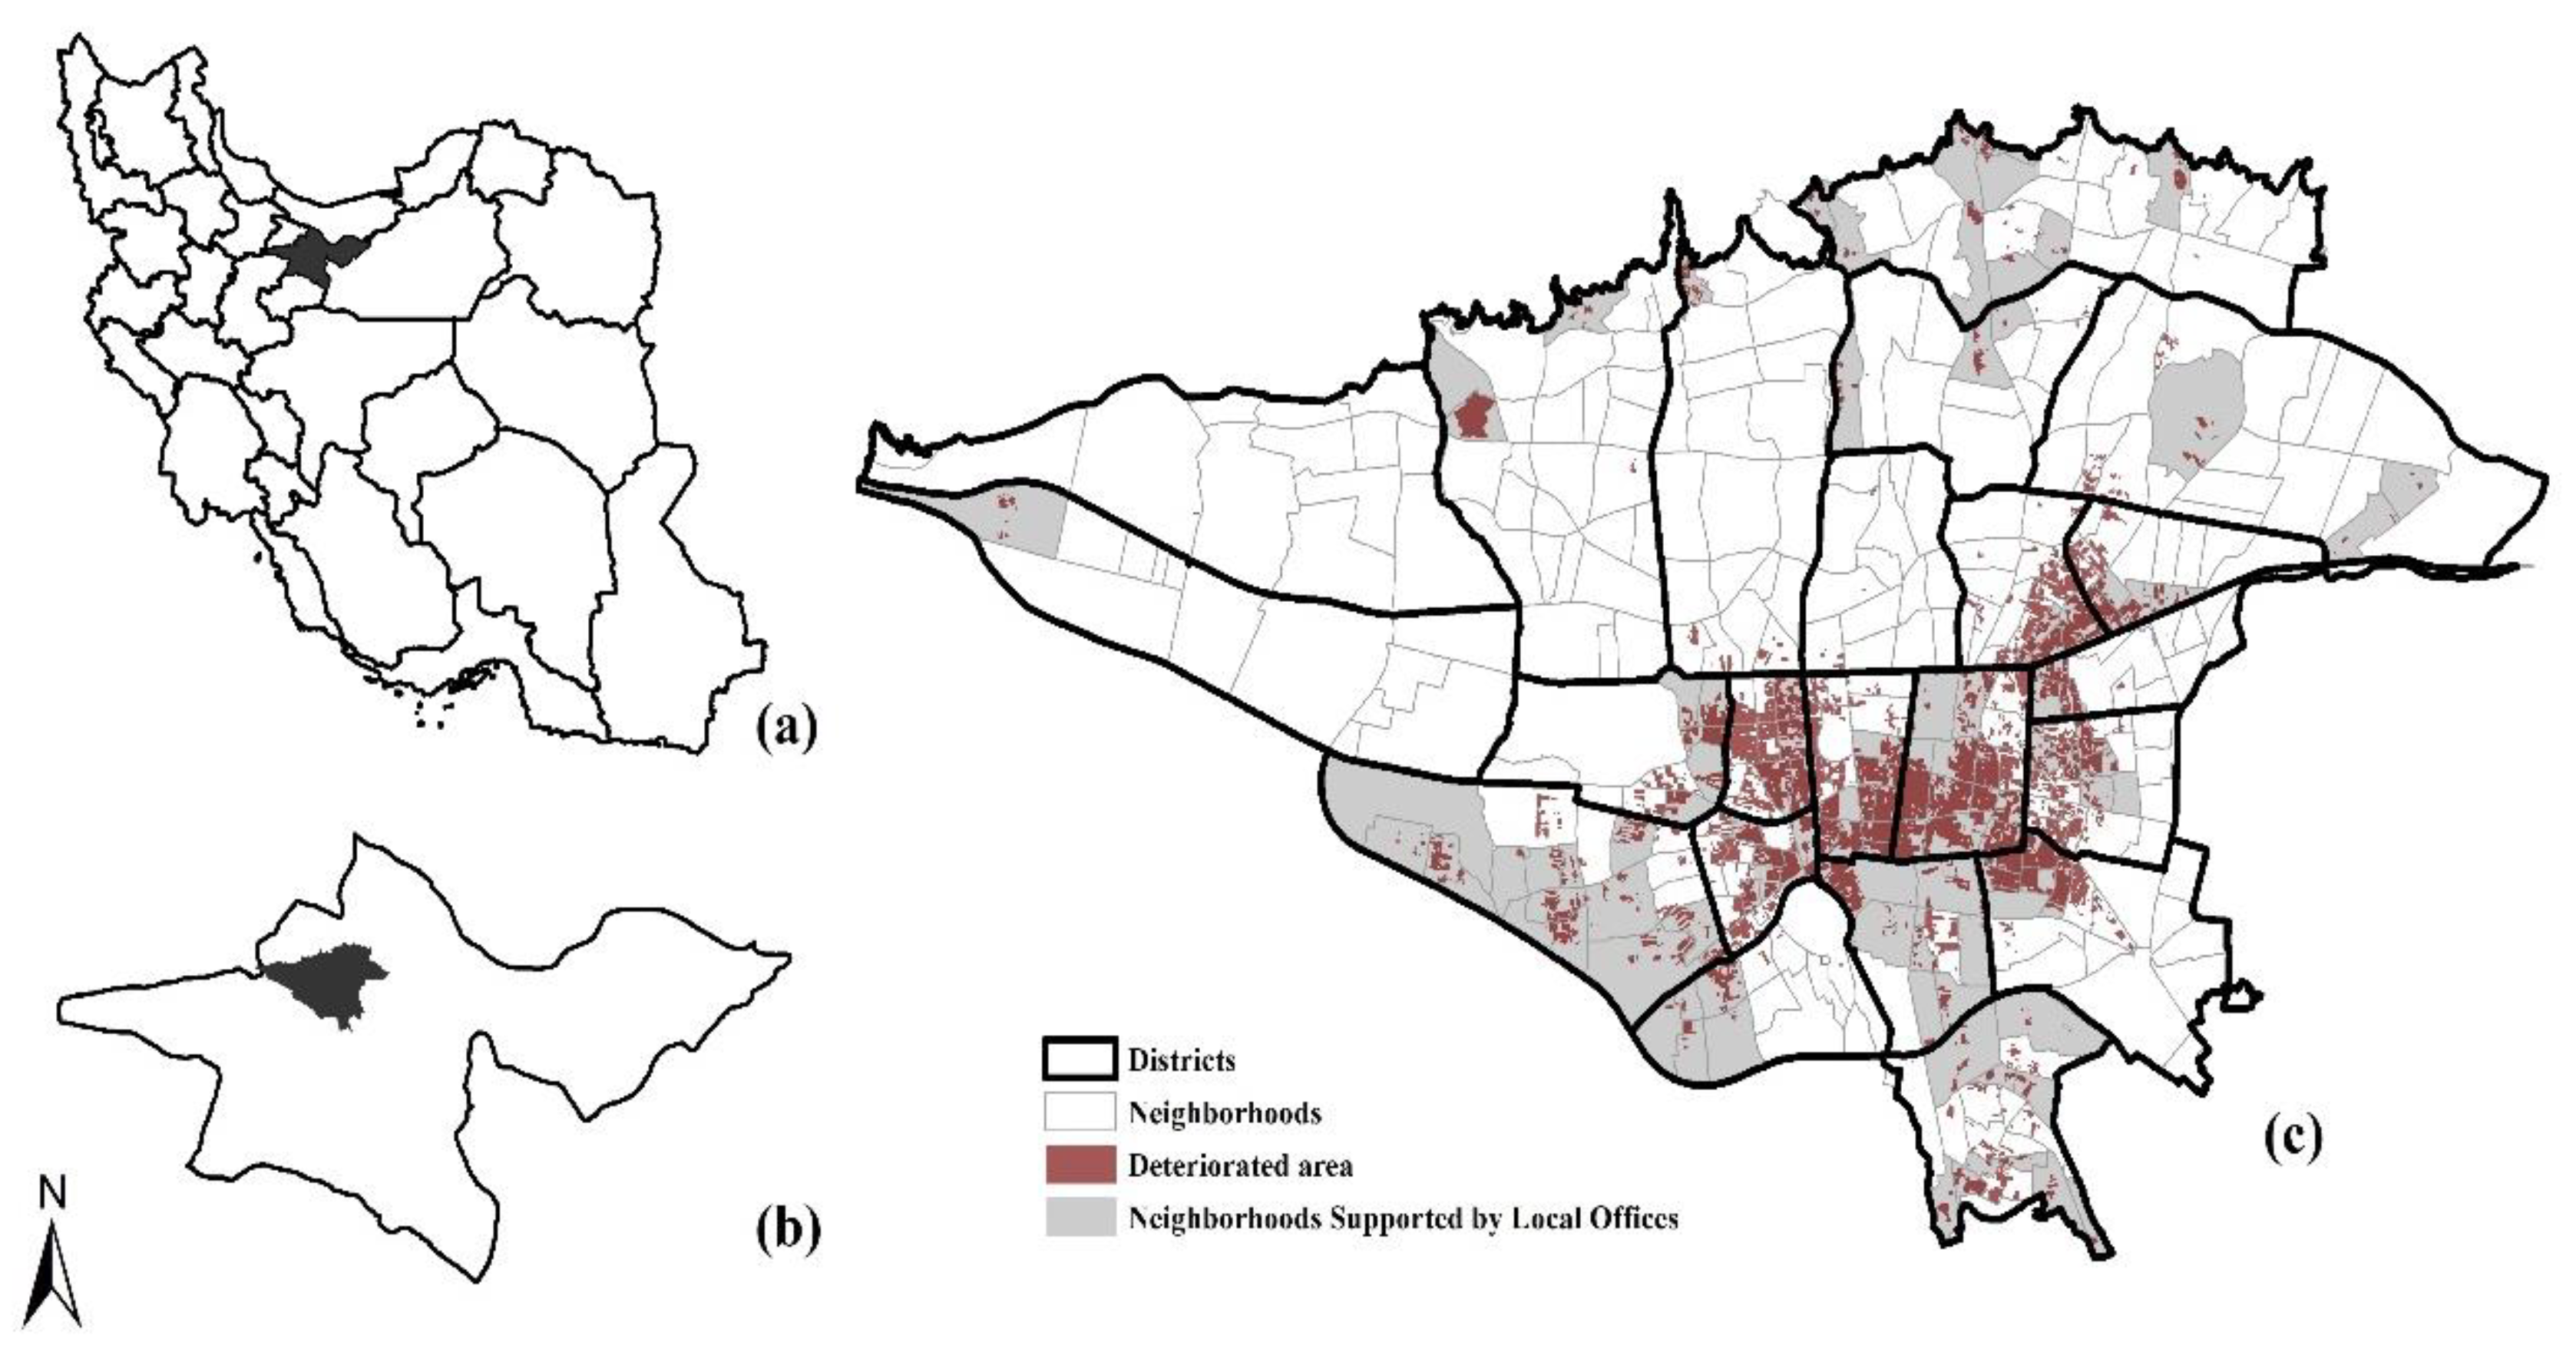
As shown in
Figure 1, the study areas in this research are Tehran’s deteriorated neighborhoods, which have their own renewal and regeneration programs that are under the supervision of 38 active NDOs. Tehran, the capital city of Iran, is divided into 22 districts (the largest level of urban subdivisions) and 353 neighborhoods (the smallest level of urban subdivisions). Currently, 4427 hectares of Tehran’s total area are considered to be deteriorated areas. These are located in 213 neighborhoods and include almost 30% of Tehran’s urban blocks. Although these areas make up 7% of Tehran’s total area, they are home to 20% of its population and are mostly located in the central and southern parts of the city [
29]. In comparison with other neighborhoods, the deteriorated neighborhoods of this city have always dealt with a deeper level of physical, economic, social, and environmental problems. For instance, a threefold higher population density and one-quarter fewer urban services per capita than the city average, low-income and disadvantaged residents, a high rate of poverty and social anomalies, and a variety of environmental issues are among the main characteristics of these neighborhoods [
10,
11,
30]. These multidimensional problems show that deteriorated neighborhoods cannot be enhanced automatically and spontaneously and cannot exit the decline stage of their life cycle without external intervention. Therefore, Tehran Municipality, as the primary custodian of renovating these neighborhoods, adopted an integrated intervention-based approach by considering physical, functional, social, economic, environmental, legal, and managerial aspects [
9].
In 2007, Tehran Municipality and its renewal organization shifted their approach to participatory and bottom-up urban development by establishing NDOs in deteriorated neighborhoods [
11]. These offices started their work by familiarizing the residents with urban plans and then took on the role of facilitator agents to accelerate the implementation of renewal and regeneration projects in the target areas. Since 2013, due to the positive results of NDOs’ activities, these offices have developed Neighborhood Development Plans (NDPs) based on each neighborhood’s unique priorities, weaknesses, and strengths with the participation of neighborhood residents, city managers, and other organizations and stakeholders [
9].
As a result of the COVID-19 outbreak, NDOs came up against serious challenges, so their renewal programs and the NDPs’ progress slowed or even stopped during this period. Moreover, as mentioned earlier, these neighborhoods and their residents were already struggling with complex physical, economic, social, health, and environmental issues before COVID-19. These problems were exacerbated due to a series of new challenges brought about by the pandemic. To address these challenges, NDOs that had been actively involved in the regeneration process of these neighborhoods for years and were well aware of the challenges and necessities of each neighborhood defined new activities under their main missions during this period and took some measures to increase the neighborhood’s resilience against the pandemic. In the following sections, we discuss how NDOs’ action priorities align with the actual needs and priorities of people living in the study area.
4. Materials and Methods
A five-step methodology was outlined for measuring the effectiveness of NDOs’ actions in improving the target neighborhoods’ resilience during the pandemic (
Figure 2). In the first step, a literature review was conducted, and environmental, social, economic, urban management, and urban services and infrastructure were identified as the five most commonly used factors in evaluating urban resilience against the COVID-19 pandemic [
31,
32,
33,
34]. Integrating these factors with the main missions of NDOs resulted in four assessment components: (1) Improving the quality of life in residential units; (2) social empowerment; (3) economic empowerment; and (4) providing local services and improving public spaces. Then, to analyze the compliance of NDOs’ action priorities with those of people living in deteriorated neighborhoods, 20 assessment indicators were derived from the related literature and NDOs’ descriptions of services (
Table 1). It is worth mentioning that, initially, 27 indicators were extracted from the literature. Two steps were then taken to validate these indicators. A comparison of the indicators and the NDOs’ descriptions of services was conducted, which was followed by a focus group meeting with the NDO managers. The validation process excluded seven indicators unrelated to NDOs’ descriptions of services, about which most offices had not taken any special action.
In the second step, all 38 NDOs were provided with structured worksheets containing the assessment components and indicators. Each NDO was asked to describe its actions related to each indicator and rank each indicator very low, low, moderate, high, or very high in terms of the action priorities defined for the neighborhood/neighborhoods it supports. A total of 24 NDOs participated in this study, and the rest declined to contribute for unspecified reasons. Thus, 14 of the 38 NDOs and the neighborhoods under their supervision were excluded from the evaluation procedure. After collecting the worksheets completed by 24 NDOs, each NDO’s actions under each component and indicator were determined, and the final score of each indicator was calculated based on the NDO’s viewpoint. Then, to prioritize the citizens’ demands during the COVID-19 pandemic, the 20 indicators were converted into 20 questions (answers in a Likert scale format) and 24 NDOs randomly distributed the online and in-person questionnaires among the residents living in the neighborhood/neighborhoods supervised by them. Considering that the target neighborhoods differ in population and range between 10,000 and 50,000, according to Cochran’s formula [
54], each NDO collected 385 questionnaires from residents of its supported neighborhood/neighborhoods. The questionnaires asked citizens to rank each indicator from very low, low, moderate, high, and very high in terms of its importance in improving the resilience of their family and/or neighborhood against COVID-19. Then, the priorities assigned to each indicator were converted into a final score of indicators for each neighborhood.
In the third step, the concept of a balanced-based model was used to compare residents’ priorities with those of NDOs in each neighborhood. This model was first developed in [
55], as part of the theory of “balanced neighborhood-based renewal in deteriorated areas of Tehran”. Through quantitative calculations and a graphic representation of the balance indicator in this model, it was possible to determine how balanced the renewal of a deteriorated neighborhood was and what measures should be prioritized to improve that neighborhood’s balance in all aspects of physical, economic, social, and environmental renewal [
55]. In this study, this model was based on the balance between each indicator’s dichotomies (one side demonstrates the action priority of NDOs and the other shows residents’ priority regarding each indicator), so that improvement of the whole system status depends on prioritizing all the indicators together and in a balanced manner. These dichotomies are the fundamental elements of the conceptual model.
To better understand this conceptual model, take an indicator dichotomy that examines the balance between housing and service provision as an example (the value of each side of dichotomies is a number between 0 and 1). If the value of housing renewal is 0.7 (one side of the dichotomy) and the value of urban services development is 0.2 (the other side of the dichotomy), the balance ratio (the proportion of smaller value to the greater one) will be 0.285. The calculated balance ratio shows that the same attention paid to the housing renewal of deteriorated urban areas was not paid to the development of urban services, which demonstrates a housing-service dichotomy imbalance in the neighborhood. In this example, if the value of urban service development increases from 0.2 to 0.5, the balance ratio will increase from 0.285 to 0.714, which means the housing and services development in this neighborhood is more balanced compared to the first condition. In this study, and for each indicator, its “priority in the measures defined by NDOs” and its “priority for the residents of deteriorated neighborhoods” in the pandemic period were considered as 20 dichotomies of the balanced-base model. Based on the priorities assigned to each indicator by the NDOs and residents of target neighborhoods, the balance ratio of each indicator was calculated. In the fourth step, the cluster analysis method was used to cluster NDOs based on their actions during the pandemic. First, the optimal number of clusters was determined using the hierarchical cluster analysis method. Then, using the K-means clustering method, NDOs were clustered based on their calculated balance ratio. To better understand the performance of the 24 NDOs, using the Z-score method, the calculated balance ratios were standardized so that the K-means clustering analysis method would provide more accurate results. Based on the hierarchical cluster analysis method, three clusters were determined to be the optimal number of clusters for the K-means method, and neighborhoods and their supporting NDOs were classified into these three clusters.
In the fifth step, to evaluate the balance between the NDOs’ action priorities and the residents’ needs, a unit circle was drawn, and for each indicator, on two aligned radii with the length of 1, two line segments (the lengths of which were equal to calculated score of each indicator in Equation (1)), called OAn and OBn, were drawn from the center of the circle (O) to form an An-Bn segment on a diameter dedicated to each indicator. Each diameter represents one of the 20 evaluation indicators and its related dichotomy. One side of each indicator dichotomy was assigned to residents’ priorities (segments labeled OA001 to OA020); on the other side, the action priorities of NDOs were placed (segments labeled OB001 to OB020). Conventionally, to achieve the maximum deviation of the centroid from the center, indicators with the highest score (whether this score was given to that indicator by the NDO or by the residents) come first in the arrangement (from the first to the fourth quadrant of the unit circle). In
Figure 3, all the segments on the diameters related to each indicator dichotomy are rotated counterclockwise from the highest score to the lowest, with a 9-degree angle between two subsequent diameters. In the case of an equal score for two or more indicators, the indicator with a lower balance ratio was drawn first. Therefore, as we move from the first quadrant to the second one, the priority given to the indicators decreases, and finally, by completion of the first and second quadrants for each of the 20 indicators, segments on the third and fourth quadrants have been already drawn with the other half of each indicator diameter in first and second quadrants, and the dichotomies of each indicator are completed. Finally, the surface resulting from connecting the endpoints of score segments on each 40-unit radii of the circle finds the greatest amount of deviation from the center of the circle to provide a better understanding of the level of balance/imbalance in NDOs’ performance.
Inside the Balance Indicator Circle (BIC), a 40-sided geometric surface is formed by connecting the vertex of the score segments. The deviation of the geometric center of this surface (G) from the center of the circle (O) indicates how well NDOs’ actions matched the needs of the residents during the COVID-19 pandemic. This geometric shape serves as a tool for observing, visualizing, and analyzing the imbalance between the actions of NDOs and the needs of residents in each neighborhood. All the indicators should be examined individually and should also be analyzed to check the balance/imbalance among all indicators. If point G corresponds exactly to the center of the BIC (O), and if the scores of each indicator (from both NDOs and residents) are at their maximum level, i.e., equal to 1, the 40-sided surface completely matches the BIC (ideal condition). This means that a full balanced condition is achieved because a full circle illustrates the complete balance between people’s priorities and the NDO’s actions during the pandemic. In contrast, the greater the distance between the centroid of this surface (point G) and the center of the BIC (point O), the greater the imbalance between the actions of the offices and the needs of the residents. To maintain or step towards balance in this 40-sided surface, indicators near the symmetrical point of G to O (point G’) are action priorities. In other words, these indicators are the underlying reasons for imbalance and by balancing them in the long term, the length of the GG’ line segment will become smaller and smaller, the centroid of the formed surface will become closer to the center of the BIC, and as a result, the existing imbalance will be eliminated.
5. Results and Discussion
5.1. K-Means Clustering Results
As explained in the previous section, NDOs’ action priorities and residents’ priorities during the COVID-19 pandemic were considered as two aspects of a balance-based model. To evaluate the compliance of these two aspects, in the first step, the standardized balance ratio calculated for each of the 20 indicators and 24 NDOs was used to conduct a K-means clustering analysis.
Figure 4 shows the clustering results and the distribution of target neighborhoods in three clusters. This figure indicates that neighborhoods in the same cluster are most similar to one another and relatively different from neighborhoods in the other two clusters when it comes to the balance/imbalance of the NDOs’ actions with residents’ needs. It is evident from the clustering shown in
Figure 4 that the issue raised in the Introduction must be addressed at the local scale and that adopting holistic approaches and prescribing a single solution to improve the resilience of different neighborhoods must be avoided. A prime example of this argument can be found in the central district of Tehran (District 12), where adjacent neighborhoods supported by different NDOs (O8, O16, O20, and O21) were placed in different clusters. In light of this issue, it can be argued that, although these neighborhoods are all located in the same urban district, each neighborhood’s residents had different priorities during the pandemic period, and each neighborhood’s NDO prioritized actions differently from the priorities set by other neighborhoods in the vicinity. Therefore, it is imperative to know each neighborhood’s strengths and weaknesses and understand its residents’ needs before planning and taking action during various crises, such as the recent pandemic.
Figure 4 also shows this situation. For example, neighborhoods supported by NDOs O11, O12, O9, and O3, which are adjacent to each other, belong to the first cluster. Based on K-means clustering logic, it is possible to infer that they have a homogenous pattern of balance/imbalance, although the individual status of some indicators is very different among these neighborhoods. Thus, a BIC should be drawn for each of the 24 NDOs so that the balance/imbalance status of individual indicators can be understood and compared, which is discussed in the next section.
A bar chart is shown in
Figure 5 to better explain the results of K-means clustering. According to this figure, if the standardized value of the indicators tends to negative numbers, there is a considerable imbalance between the actions prioritized by the NDOs and residents within that cluster, and if it tends to positive values, there is a relative balance regarding each specific indicator. For NDOs located in the first cluster, it can be argued that the value of standardized indicators A001-B001 to A011-B011 (except indicators A002-B002 and A006-B006) tended to −1, which signifies an imbalance between the priority of the NDOs’ actions and that of the residents regarding these nine indicators. In the second half of the first cluster, the standardized values of indicators A014-B014 to A020-B020 tended towards +1, indicating a relative balance between actions and residents regarding these seven indicators. The second cluster is almost the opposite of the first, with a high balance between NDOs’ priorities and residents’ priorities for indicators A002-B002 to A011-B011 and indicators A012-B012 to A020-B020 (except indicator A014-B014). This analysis and interpretation can also be made for the balance/imbalance between the actions of the development offices and the priorities of the residents in the third cluster.
The cluster analysis results provide the NDOs with important information about how to address the weaknesses and fundamental imbalances between the offices’ priorities and residents’ priorities in each neighborhood, considering that the COVID-19 pandemic has not yet passed and may recur. In fact, the offices in each cluster are now aware of the indicators that require serious and urgent intervention and action to improve their neighborhoods’ resilience in the short term. In other words, NDOs in each cluster should prioritize the indicator or indicators that demonstrate the most imbalance based on
Figure 5, and in each cluster, the indicators with the closest standardized value to −2 should be the priorities for the offices belonging to that cluster. The most balanced and imbalanced indicators within each cluster are shown in
Figure 5 and
Table 2, and the short-term action priorities of the offices belonging to each cluster are also suggested in
Table 2.
It is important to mention that the status of indicators in each cluster in
Figure 5 is not necessarily representative of the status of that indicator for all NDOs located in that cluster; the average values of all offices for that indicator are calculated and displayed on the graph. In one cluster, a gross imbalance between the actions of the offices and the needs of the residents can be seen, while in two other clusters, a slight imbalance or even a relative balance can be observed. In addition, a cluster analysis cannot reveal the status of an indicator concerning other indicators within a neighborhood. For example, from the cluster analysis results, in all 12 neighborhoods of the first cluster, the indicator A007-B007 has the highest degree of imbalance, but the issue is how this indicator is compared in each NDO. To fix these defects and to analyze the 24 NDOs more accurately in order to determine the priority of actions specific to each neighborhood, and to guide all indicators towards long-term balance, the BICs of each of the 24 NDOs should be drawn to increase neighborhood resilience for future pandemics.
5.2. Drawing the Balance Indicator Circles (BICs) for 24 NDOs
The BICs of 24 NDOs were graphically illustrated using the method described in the third to fifth steps of the Methodology Section (
Figure 6). By connecting the vertices of segments on adjacent radii, we obtained a star-shaped geometry unique to each neighborhood. Whenever two adjacent radii both correspond to the priority of residents, the sector formed by connecting them is colored green, when both correspond to the priority of NDOs, the sector formed by connecting them is colored orange, and when one radius corresponds to the priority of offices and the other to the priority of the neighborhood residents, the sector formed by connecting them is colored white. When the sectors in the first quadrant of the BIC are mainly green, residents prioritized those indicators more than the NDO, and when the sectors in the first quadrant are mainly orange, NDOs prioritized those indicators more than residents. The performance of NDOs can be evaluated based on the sector’s shape and color. To evaluate the performance of the offices, two specific quantities, as the outcomes of these circles, should be compared simultaneously.
The first quantity is the length of the line segment OG, which constitutes the distance between the center of the circle and the centroid of the 40-sided surface formed by connecting the vertices of indicator segments on the circle’s radii, and the second quantity is the total area of this surface. As mentioned in the methodology section, the greater the deviation of point G from the center of the circle (the length of the OG line segment), the greater the imbalance, and the closer the point G is to the center of the circle, the higher the balance between the actions and needs. However, the length of this line segment or the area of the geometric shape alone cannot indicate the performance of NDOs (relatively and compared to each other). Four possible conditions can be obtained based on the status of these two quantities: the first is the ideal one, which indicates a high level of balance (a short OG and large area), and the second is the worst condition, which shows a high level of imbalance (a long OG and small area). In the third case, the OG segment length is short and the area of the geometric shape is small, implying that, despite a relatively high balance, NDOs and residents have given low priority to virtually all the indicators’ roles in increasing resilience against the pandemic. In such cases, both NDOs and residents should be informed about the importance of actions related to each indicator in enhancing their neighborhood’s resilience against future pandemics and even the current pandemic. The fourth case occurs when the area of the formed geometric shape is high and close to the total area of the BIC, but the OG line segment is also long. This shows that some indicators have a considerably high priority while others have received lower priorities (either from residents or offices). In such cases, there are some deficiencies in the performance of the offices, and they should try to improve all indicators, specifically the neglected ones, in a more balanced manner.
In
Figure 6, among four possible conditions depending on the length of the OG line segment and the area of the geometric shape, the NDOs with the shortest OG lengths and the largest geometric shapes generally performed better during the recent pandemic. On the other hand, NDOs with the longest OG and the smallest geometric shape demonstrated a more unfavorable relative performance. For instance, NDOs O12, O10, and O11 exhibited the most favorable performance in the first cluster, while O2 and O9 exhibited the least favorable performance. In the second cluster, O14 and O13 exhibited the best performance compared to other offices, and O16 and O18 exhibited the worst performance. In the third cluster, O20 and O22 exhibited the most favorable performance, while O23 and O19 offices exhibited the least favorable performance.
As emphasized in the previous sections, developing local action plans based on the specific conditions of each neighborhood is the most appropriate solution to accelerate and facilitate the process of improving the resilience of neighborhoods and cities against all crises, including pandemics. The obtained results revealed that, in addition to measures that should be taken to address neighborhood weaknesses and deficiencies in the short term to ensure neighborhoods are more prepared for possible COVID-19 peaks (the actions derived from the cluster analysis), each neighborhood should implement a long-term, strategic action plan in order to gradually progress towards a more balanced status in all indicators to become more resilient against possible future pandemics. It was not possible to achieve such an action plan based on the results of the cluster analysis method, but a BIC makes it possible to observe and analyze the situation of each NDO as a whole unit and prioritize the necessary actions to achieve the maximum balance for each NDO. As mentioned in the methodology section, indicators that are in the vicinity of point G’ are action priorities. These require action in order to achieve a balance between the actions of the offices and the needs of the residents in each neighborhood, and by moving away from this point, the priority of actions regarding those indicators decreases.
Indicators with action priority fall into one of three categories. The first category is concerned with the indicators that currently have a high balance, indicating that the actions of the NDOs align with the expectations of residents, and this situation should continue for the foreseeable future. The second category is an imbalanced condition in which the NDO’s priority regarding a given indicator is much higher than the residents’ priority. The third category also represents an imbalance, but in these cases, NDO’s action priority given to an indicator is lower than that of residents, which is precisely the opposite of the second category. In the second and third categories, NDOs should direct the concentration of their financial, technical, human, and executive resources to overcome these imbalances in a multidisciplinary manner. Finally, it should be noted that the results of long-term action priorities of each NDO extracted from the BICs do not necessarily match the short-term actions determined by the cluster analysis method, since the primary purpose of long-term actions is to gradually advance the whole set of indicators toward a balanced status.
5.3. The Cumulative BIC
To obtain a general view of the performance of 24 NDOs and the neighborhoods that participated in this study, the average priority values of the indicators given by residents of all neighborhoods and NDOs were calculated to draw the cumulative BIC (
Figure 7). As shown in
Figure 7, the average total score given to the indicators by the neighborhood residents is almost the same, and all the sectors located in the first and second quadrants of the circle are almost the same sizes and colored green.
According to
Figure 7, it can be argued that all four components and 20 indicators are of relatively equal importance to citizens. Moreover, the placement of green sectors in the first and second quadrants and orange sectors in the third and fourth quarters shows that the priority assigned by residents to all indicators is higher than the scores assigned by NDOs. Moreover, the concentration of indicators related to improving the quality of public areas and providing local required services in the first quarter of the circle shows that citizens prioritized this component and its subsequent indicators. Hence, compared to the other three components, neighborhood residents believe that actions related to this component could have and also will have a greater impact on increasing their resilience against pandemics.
While this paper emphasizes that each neighborhood requires its own action plan based on its specific conditions, the proposed actions derived from the cumulative BIC can have some important applications. Firstly, the action priorities obtained from the cumulative BIC should be given more attention and integrated into all levels of urban management, including the five-year plans of Tehran Municipality and other urban development plans. Secondly, due to similarities in physical, economic, social, and environmental characteristics between Tehran’s deteriorated neighborhoods, these action priorities can be applied by 14 NDOs that did not participate in this study. Nevertheless, they must cooperate in future surveys to obtain an accurate and appropriate action plan for the neighborhood/neighborhoods under their supervision.
Based on the cumulative BIC, the indicators B017, B010, B009, and B015 are closest to point G’ and should be prioritized for action. Developing and equipping green and open spaces in the neighborhood for multipurpose use during the pandemic (B017) has been among the major responsibilities assigned to NDOs. However, obstacles such as the high mass–space ratio, the lack of land vacancies, high land prices, and the unattractiveness of deteriorated areas for investors have delayed or even prevented its implementation in Tehran’s deteriorated neighborhoods. As elaborated by Spennemann [
49] and Marchi et al. [
51], open and public green spaces can help to better manage the pandemic. During a pandemic, residents, especially in poor-quality neighborhoods suffering a lack of urban services, can spend hours in these spaces outside of their homes, improving their mental and physical health. By providing such spaces in deteriorated neighborhoods and removing the obstacles mentioned above through creative urban planning and design practices [
33], NDOs can better prepare their neighborhoods for future pandemics.
Maintaining and improving public transportation infrastructures (B015) and reducing social inequalities and supporting vulnerable groups living in the target neighborhoods (B009) should also be promoted by NDOs in the neighborhoods they support. During the recent pandemic, public transportation played an imperative role in managing the outbreak, as Liu et al. [
44] and Liu et al. [
43] pointed out. They argued that public transportation policies during the COVID-19 pandemic disproportionately affected vulnerable and disadvantaged groups such as the elderly, and low-income or ethnic groups. The results obtained in this study also confirm their arguments since most residents of Tehran’s deteriorated neighborhoods are on a low income and rely heavily on public transportation for their daily commute. However, public transportation in these neighborhoods is not well developed due to the physical and spatial conditions. Additionally, the inefficient public transportation facilities in these neighborhoods and the crowding of people on buses and subways contributed to many residents contracting the virus and spreading it throughout the city. The obtained results revealed that, although NDOs have been active in deteriorating neighborhoods for more than two decades, they have not been able to take effective steps to improve the status of these two indicators, which should be given special consideration in neighborhood development plans.
Finally, distributing healthcare and medical products and facilitating free/cheap access to medical services (B010) was not anticipated in NDOs’ descriptions of services before the COVID-19 pandemic. However, the recent pandemic showed that the availability and accessibility of resources, particularly healthcare facilities, are essential components for a society to survive, recover, and adapt to such a disastrous event [
1]. As emphasized by Wong and Kohler [
56], efforts to address the ongoing pandemic or future pandemics increasingly demand the participation of actors from different disciplines, socioeconomic backgrounds, and political identities. Therefore, NDOs should cooperate with healthcare institutions and other responsible entities, provide fair and equal access to healthcare facilities, and inform the local community to increase their preparedness against future pandemics.
6. Conclusions
The Coronavirus outbreak at the end of 2019 resulted in a high mortality rate and financial losses, and its devastation will be felt in many aspects of life for years to come. Cities, the primary center of the collective life of humans in the modern era, saw the largest and quickest spread of the virus, and consequently, they have borne the brunt of the COVID-19 pandemic’s economic and human toll. However, the level of vulnerability varies across nations, cities, and even in the districts and neighborhoods within a city. Deteriorated urban areas are among the most vulnerable and inefficient urban areas as they are characterized by economic and social problems and have a lower level of resilience to various crises, including pandemics, compared to other parts of the city. These urban areas also experience far more severe environmental and physical problems than other parts of the city. The inhabitants of deteriorated areas are, therefore, logically much more vulnerable than others in the face of a crisis such as the COVID-19 pandemic. These deteriorated neighborhoods are also present in the Tehran metropolis, comprising around 7% of its total area, while housing 20% of the population. The formation of neighborhood development offices as mediators between residents and city governors is the most evident step taken by Tehran municipal administration, as was the case in many other cities that needed to organize these areas.
Currently, 4427 hectares of deteriorated and inefficient areas in Tehran are being renovated and rehabilitated by 38 NDOs operating under the direction of Tehran Municipality (UROT: Urban Renewal Organization of Tehran). Each of these NDOs focuses on one or more neighborhoods with deteriorated areas. Through positive interactions with the local communities in these neighborhoods, these offices aim to renew deteriorated areas in Tehran from a physical, social, economic, and environmental point of view. With the outbreak of the COVID-19 pandemic, these offices took new measures to increase the resilience of these target neighborhoods. They have close relationships with the residents of their covered neighborhoods and are aware of the weaknesses and strengths of the neighborhoods. The purpose of this study was to assess how well these offices’ action priorities matched the requirements of the people living in the neighborhoods they were responsible for during the COVID-19 pandemic. For this reason, 20 evaluation indicators were extracted from the literature and organized under the four main missions of the offices: (1) Improving the quality of life and living in residential units; (2) social empowerment; (3) economic empowerment; and (4) improving the quality of public areas and delivering locally required services. By conducting several rounds of field surveys, the offices and the residents of each neighborhood rated each of these indicators based on their personal and institutional priorities. The data were then assessed using cluster analysis and a conceptual balance-based model. For each of the 24 NDOs, the balance ratios were calculated for all of the evaluation indicators. Then, NDOs were classified into three clusters based on the standardized values of the balance ratio by the K-means cluster analysis method; moreover, to better compare the balance among all the indicators in each neighborhood, BICs were drawn for each NDO.
Cluster analysis recommended short-term measures that include the indicators with more imbalances within each cluster to improve the resilience of NDOs and their actions against the COVID-19 pandemic. Additionally, the clustering revealed that even adjacent neighborhoods assigned different priorities to each indicator depending on the specific conditions they experience that demand special action plans. The BICs drawn for each of the 24 NDOs show the unique priorities of the long-term measures and that they do not have to correspond to those that the cluster analysis suggested. This is because, unlike the cluster analysis results, the BIC introduces indicators as priority areas for taking action that maintain the balance among all the resilience indicators, not just the ones with the lowest balance ratio. In other words, if the indicator selected as the priority of action currently has a high balance, it means the measures taken by offices are in line with residents’ expectations and should continue in the long run. In addition, based on the results of BICs, the offices should allocate their financial, technical, human, and executive resources to gradually maintain balance in the recommended indicators with a low balance ratio. Finally, by drawing the cumulative BIC, some action priorities at the macrolevel are recommended for application in the five-year plans of Tehran Municipality; moreover, the 14 NDOs that did not cooperate with this research team can also apply these measures. Because the deteriorated neighborhoods in Tehran, despite the background differences, have a similar situation in some aspects, the results of the 24 NDOs can be generalized to other neighborhoods.
The results of this study should be added to the description of the duties of NDOs and the prioritization of actions in the NDPs that have been prepared for deteriorated neighborhoods in Tehran. In essence, in addition to improving the resilience of neighborhoods against crises such as earthquakes, floods, and the like, it is also necessary to increase resilience against pandemics such as COVID-19. The evaluation framework proposed in this study, and the extracted indicators and components, are generalizable and can be used in other cities. However, the proposed actions, especially the prioritization determined for their implementation, are specific to the study area. There is no doubt that in other cities, the types of actions required and their prioritization will differ depending on the neighborhoods’ conditions and actions taken by local institutions. Nevertheless, the presented assessment framework demonstrates that by maintaining the level of preparedness in different neighborhoods of a city in a balanced manner, it is possible to respond more quickly and appropriately to future pandemics. This allows casualties and financial damages to be minimized and helps neighborhoods to return to normal conditions more quickly. It should be noted that the framework presented for achieving balanced resilience in this paper can be used in cities with deteriorated areas, informal settlements, and in general, any areas that are physically, economically, socially, and environmentally vulnerable. Finally, the framework for evaluating and determining the priority of action presented in this study can be used to assess the performance of local institutions and draw a road map to improve the resilience of cities, and their problematic areas in particular, against any crisis.
Author Contributions
Conceptualization, S.T., S.E., S.B.M. and A.S.; methodology, S.T., S.E., S.B.M. and A.S.; software, S.T., S.E. and S.B.M.; validation, S.T., S.E. and A.S.; formal analysis, S.T. and S.E.; investigation, S.T., S.E. and S.B.M.; resources, S.T., S.E., S.B.M. and A.S.; data curation, S.T. and S.E.; writing—original draft preparation, S.T., S.E. and S.B.M.; writing—review and editing, S.T., S.E. and A.S.; visualization, S.T. and S.B.M.; supervision, S.T., S.E. and A.S.; project administration, S.T. and S.E. All authors have read and agreed to the published version of the manuscript.
Funding
This research received no external funding.
Data Availability Statement
Not applicable.
Acknowledgments
The current paper is a part of Urban Renewal Organization of Tehran (UROT’s) research on evaluating the activities of NDOs in the pandemic era that was prepared in collaboration with NDOs. In addition, authors would like to thank Mohammadreza Ebrahimi for his valuable cooperation in advancing this research.
Conflicts of Interest
The authors declare no conflict of interest. The funders had no role in the design of the study; in the collection, analyses, or interpretation of data; in the writing of the manuscript; or in the decision to publish the results.
References
- Alizadeh, H.; Sharifi, A. Social Resilience Promotion Factors during the COVID-19 Pandemic: Insights from Urmia, Iran. Urban Sci. 2022, 6, 14. [Google Scholar] [CrossRef]
- Joy, M.; Vogel, R.K. Beyond Neoliberalism: A Policy Agenda for a Progressive City. Urban Aff. Rev. 2021, 57, 1372–1409. [Google Scholar] [CrossRef]
- UN-Habitat. Cities and Pandemics: Towards a More Just, Green and Healthy Future; UN Habitat: Nairobi, Kenya, 2021; ISBN 9789211328776. [Google Scholar]
- Afrin, S.; Chowdhury, F.J.; Rahman, M.M. COVID-19 Pandemic: Rethinking Strategies for Resilient Urban Design, Perceptions, and Planning. Front. Sustain. Cities 2021, 3, 1–13. [Google Scholar] [CrossRef]
- Alraouf, A.A. The New Normal or the Forgotten Normal: Contesting COVID-19 Impact on Contemporary Architecture and Urbanism. Archnet-IJAR 2021, 15, 167–188. [Google Scholar] [CrossRef]
- Allain-Dupré, D.; Chatry, I.; Kornprobst, A.; Michalun, M.-V.; Wheeler, O. The Territorial Impact of COVID-19: Managing the Crisis and Recovery across Levels of Government. OECD Cent. SMEs Entrep. Reg. Cities 2021, 10, 909698535–1620846020. [Google Scholar]
- Dutta, A.; Fischer, H.W. The Local Governance of COVID-19: Disease Prevention and Social Security in Rural India. World Dev. 2021, 138, 105234. [Google Scholar] [CrossRef]
- National Research Council. Disaster Resilience: A National Imperative Committee; The National Academies Press: Washington, DC, USA, 2012.
- Hajialiakbari, K.; Karimi, M.; Tayebi, S. Toward a Paradigm Shift in Urban Planning in Tehran: Neighborhood Development Plans. Civ. Eng. Archit. 2021, 9, 2492–2504. [Google Scholar] [CrossRef]
- Andalib, A.; Hajialiakbari, K. An Identification of the Neighbourhood Renewal Process in Tehran: Case Study—Khoob-Bakht Neighbourhood, Tehran, Iran. J. Urban Regen. Renew. 2019, 13, 27–43. [Google Scholar]
- Hajialiakbari, K. The Rise of the Facilitation Approach in Tackling Neighbourhood Decline in Tehran. In Urban Heritage Along the Silk Roads; Arefian, F.F., Moeini, S.H.I., Eds.; Springer: Berlin, Germany, 2020; Volume 1, pp. 55–74. [Google Scholar]
- Hunter, M. Resilience, Fragility, and Robustness: Cities and COVID-19. Urban Gov. 2021, 1, 115–125. [Google Scholar] [CrossRef]
- Sayarifard, A.; Nazari, M.; Rajabi, F.; Ghadirian, L.; Sajadi, H.S. Identifying the Non-Governmental Organizations’ Activities and Challenges in Response to the COVID-19 Pandemic in Iran. BMC Public Health 2022, 22, 1–13. [Google Scholar] [CrossRef]
- Chu, Z.; Cheng, M.; Song, M. What Determines Urban Resilience against COVID-19: City Size or Governance Capacity? Sustain. Cities Soc. 2021, 75, 103304. [Google Scholar] [CrossRef] [PubMed]
- Spoer, B.R.; Mcculley, E.; Lampe, T.M.; Yang, P.; Chen, A.; Ofrane, R.; Rollins, H.; Thorpe, L.E.; Bilal, U.; Gourevitch, M.N. Validation of a Neighborhood-Level COVID Local Risk Index in 47 Large, U.S. Cities. Health Place 2022, 76, 102814. [Google Scholar] [CrossRef] [PubMed]
- Mishra, S.V.; Gayen, A.; Haque, S.M. COVID-19 and Urban Vulnerability in India. Habitat Int. 2020, 103, 102230. [Google Scholar] [CrossRef] [PubMed]
- Lak, A.; Hakimian, P.; Sharifi, A. An Evaluative Model for Assessing Pandemic Resilience at the Neighborhood Level: The Case of Tehran. Sustain. Cities Soc. 2021, 75, 103410. [Google Scholar] [CrossRef]
- Shi, C.; Liao, L.; Li, H.; Su, Z. Which Urban Communities Are Susceptible to COVID-19? An Empirical Study through the Lens of Community Resilience. BMC Public Health 2022, 22, 1–15. [Google Scholar] [CrossRef]
- Cucca, R.; Ranci, C. Urban Policy in Times of Crisis: The Policy Capacity of European Cities and the Role of Multi-Level Governance. Urban Aff. Rev. 2021, 3, 10780874211041710. [Google Scholar] [CrossRef]
- Meerow, S.; Neuner, F.G. Positively Resilient? How Framing Local Action Affects Public Opinion. Urban Aff. Rev. 2021, 57, 70–103. [Google Scholar] [CrossRef]
- Mountford, D. Organising for Local Development: The Role of Local Development Agencies; Summary Report, Working Document, CFE/LEED; OECD: Paris, France, 2009; Available online: www.oecd.org/dataoecd/54/41/44682618.pdf?contentId=446 (accessed on 2 September 2022).
- Edelenbos, J.; Molenveld, A.; Mojanchevska, K.; Ensenado, E.; Ballinas, M.B.P.; Esteban, A.; Ruijsink, S.; Igalla, M.; Tsatsou, A. Community-Based Initiatives in the Urban Realm What Conditions Their Performance? J. Environ. Plan. Manag. 2021, 64, 1689–1712. [Google Scholar] [CrossRef]
- Bevilacqua, C.; Pizzimenti, P.; Hamdy, N.; Mangiulli, F. From Deinstitutionalization to Community-Based Urban Development: Investigating Accessibility of Urban Systems in Calabria through Network Analytics. Sustainability 2022, 14, 1348. [Google Scholar] [CrossRef]
- Douglas, M.; Katikireddi, S.V.; Taulbut, M.; McKee, M.; McCartney, G. Mitigating the Wider Health Effects of Covid-19 Pandemic Response. BMJ 2020, 369, 1–6. [Google Scholar] [CrossRef]
- Elston, T.; Bel, G. Does Inter-Municipal Collaboration Improve Public Service Resilience? Evidence from Local Authorities in England. Public Manag. Rev. 2022, 24, 1–28. [Google Scholar] [CrossRef]
- Den Broeder, L.; South, J.; Rothoff, A.; Bagnall, A.M.; Azarhoosh, F.; Van Der Linden, G.; Bharadwa, M.; Wagemakers, A. Community Engagement in Deprived Neighbourhoods during the COVID-19 Crisis: Perspectives for More Resilient and Healthier Communities. Health Promot. Int. 2022, 37, 1–15. [Google Scholar] [CrossRef] [PubMed]
- Alderden, M.; Perez, X. Community Resilience during the COVID 19 Pandemic: Experiences of Community-Based Violence Prevention and Recidivism Reduction Program Administrators. Am. J. Crim. Justice 2021, 3, 1–24. [Google Scholar] [CrossRef] [PubMed]
- Choudhary, A.; Subramanian, B. Stakeholder Strategies for Reducing the Impact of Global Health Crises. In Stakeholder Strategies for Reducing the Impact of Global Health Crises; Kumar, V., Malhotra, G., Eds.; IGI Global Publisher: Hershey, PA, USA, 2021; pp. 116–131. [Google Scholar]
- Tehran Municipality ICT Organization. Tehran Municipality Statistical Yearbook; Tehran Municipality ICT Organization: Tehran, Iran, 2021; pp. 1–300. (In Persian) [Google Scholar]
- Bayat, A.; Rezvanpour, N. Analyzing Factors and Spatial Reactions Creating Deteriorated Area of Tehran. Proc. Soc. Behav. Sci. 2016, 216, 249–259. [Google Scholar] [CrossRef]
- Tehran Municipality Urban Renewal Organization. Neighborhood Development Offices’ Description of Services; Tehran Municipality ICT Organization: Tehran, Iran, 2020. [Google Scholar]
- Hohl, A.; Lotfata, A. A Geographical Analysis of Socioeconomic and Environmental Drivers of Physical Inactivity in Post Pandemic Cities: The Case Study of Chicago, IL, USA. Urban Sci. 2022, 6, 28. [Google Scholar] [CrossRef]
- Sharifi, A.; Khavarian-Garmsir, A.R. The COVID-19 Pandemic: Impacts on Cities and Major Lessons for Urban Planning, Design, and Management. Sci. Total Environ. 2020, 749, 1–3. [Google Scholar] [CrossRef] [PubMed]
- Mouratidis, K. How COVID-19 Reshaped Quality of Life in Cities: A Synthesis and Implications for Urban Planning. Land Use Policy 2021, 111, 105772. [Google Scholar] [CrossRef]
- Amerio, A.; Brambilla, A.; Morganti, A.; Aguglia, A.; Bianchi, D.; Santi, F.; Costantini, L.; Odone, A.; Costanza, A.; Signorelli, C.; et al. COVID-19 Lockdown: Housing Built Environment’s Effects on Mental Health. Int. J. Environ. Res. Public Health 2020, 17, 5973. [Google Scholar] [CrossRef]
- Wang, L.; Zhang, S.; Yang, Z.; Zhao, Z.; Moudon, A.V.; Feng, H.; Liang, J.; Sun, W.; Cao, B. What County-Level Factors Influence COVID-19 Incidence in the United States? Findings from the First Wave of the Pandemic. Cities 2021, 118, 103396. [Google Scholar] [CrossRef]
- Wilkinson, A.; Ali, H.; Bedford, J.; Boonyabancha, S.; Connolly, C.; Conteh, A.; Dean, L.; Decorte, F.; Dercon, B.; Dias, S.; et al. Local Response in Health Emergencies: Key Considerations for Addressing the COVID-19 Pandemic in Informal Urban Settlements. Environ. Urban. 2020, 32, 503–522. [Google Scholar] [CrossRef]
- Banai, R. Pandemic and the Planning of Resilient Cities and Regions. Cities 2020, 106, 102929. [Google Scholar] [CrossRef] [PubMed]
- Górska, A.; Dobija, D.; Grossi, G.; Staniszewska, Z. Getting through COVID-19 Together: Understanding Local Governments’ Social Media Communication. Cities 2022, 121, 103453. [Google Scholar] [CrossRef] [PubMed]
- Sharifi, A.; Khavarian-Garmsir, A.R.; Kummitha, R.K.R. Contributions of Smart City Solutions and Technologies to Resilience against the Covid-19 Pandemic: A Literature Review. Sustainability 2021, 13, 8018. [Google Scholar] [CrossRef]
- Fenxia, Z. Since January 2020 Elsevier Has Created a COVID-19 Resource Centre with Free Information in English and Mandarin on the Novel Coronavirus COVID-19; Elsevier: Amsterdam, The Netherlands, 2020. [Google Scholar]
- Ahsan, M.M. Strategic Decisions on Urban Built Environment to Pandemics in Turkey: Lessons from COVID-19. J. Urban Manag. 2020, 9, 281–285. [Google Scholar] [CrossRef]
- Liu, Q.; Liu, Z.; Kang, T.; Zhu, L.; Zhao, P. Transport Inequities through the Lens of Environmental Racism: Rural-Urban Migrants under Covid-19. Transp. Policy 2022, 122, 26–38. [Google Scholar] [CrossRef]
- Liu, Q.; Liu, Y.; Zhang, C.; An, Z.; Zhao, P. Elderly Mobility during the COVID-19 Pandemic: A Qualitative Exploration in Kunming, China. J. Transp. Geogr. 2021, 96, 103176. [Google Scholar] [CrossRef] [PubMed]
- Chen, X.; Quan, R. A Spatiotemporal Analysis of Urban Resilience to the COVID-19 Pandemic in the Yangtze River Delta. Nat. Hazards 2021, 106, 829–854. [Google Scholar] [CrossRef]
- Ouoba, Y.; Sawadogo, N. Food Security, Poverty and Household Resilience to COVID-19 in Burkina Faso: Evidence from Urban Small Traders’ Households. World Dev. Perspect. 2022, 25, 100387. [Google Scholar] [CrossRef]
- Askarizad, R.; Jinliao, H.; Jafari, S. The Influence of COVID-19 on the Societal Mobility of Urban Spaces. Cities 2021, 119, 103388. [Google Scholar] [CrossRef]
- Xin, R.; Ai, T.; Ding, L.; Zhu, R.; Meng, L. Impact of the COVID-19 Pandemic on Urban Human Mobility—A Multiscale Geospatial Network Analysis Using New York Bike-Sharing Data. Cities 2022, 126, 103677. [Google Scholar] [CrossRef]
- Spennemann, D.H.R. Exercising under COVID-2x: Conceptualizing Future Green Spaces in Australia’s Neighborhoods. Urban Sci. 2021, 5, 93. [Google Scholar] [CrossRef]
- Mouratidis, K. Urban Planning and Quality of Life: A Review of Pathways Linking the Built Environment to Subjective Well-Being. Cities 2021, 115, 103229. [Google Scholar] [CrossRef]
- Marchi, V.; Speak, A.; Ugolini, F.; Sanesi, G.; Carrus, G.; Salbitano, F. Attitudes towards Urban Green during the COVID-19 Pandemic via Twitter. Cities 2022, 126, 103707. [Google Scholar] [CrossRef] [PubMed]
- Mouratidis, K.; Yiannakou, A. COVID-19 and Urban Planning: Built Environment, Health, and Well-Being in Greek Cities before and during the Pandemic. Cities 2022, 121, 103491. [Google Scholar] [CrossRef] [PubMed]
- Hamidi, S.; Sabouri, S.; Ewing, R. Does Density Aggravate the COVID-19 Pandemic?: Early Findings and Lessons for Planners. J. Am. Plan. Assoc. 2020, 86, 495–509. [Google Scholar] [CrossRef]
- Israel, G.D. Determining Sample Size. J. Geogr. Inf. Syst. 1992, 8, 1–5. [Google Scholar]
- Andalib, A. The Theory of Balance-Based Urban Renewal; Islamic Azad University of Science and Research Publication: Tehran, Iran, 2016. [Google Scholar]
- Wong, A.S.Y.; Kohler, J.C. Social Capital and Public Health: Responding to the COVID-19 Pandemic. Global. Health 2020, 16, 1–4. [Google Scholar] [CrossRef]
| Publisher’s Note: MDPI stays neutral with regard to jurisdictional claims in published maps and institutional affiliations. |
© 2022 by the authors. Licensee MDPI, Basel, Switzerland. This article is an open access article distributed under the terms and conditions of the Creative Commons Attribution (CC BY) license (https://creativecommons.org/licenses/by/4.0/).


