Formulating a Railway Station Accessibility (RsAI) Model for Station Hierarchy Classification
Abstract
:1. Introduction
2. Literature
2.1. Accessibility
2.1.1. Spatial Separation Measure
Application of Spatial Separation Measure
2.1.2. Contour Measure
Application of Contour Measure
2.1.3. Cumulative Opportunities Accessibility Measure
Application of Cumulative Opportunities Accessibility Measure
2.1.4. Gravity Measure of Accessibility
Application of Gravity Measure of Accessibility
2.1.5. Utility Measure
Application of Utility Measures of Accessibility
2.1.6. Time–Space Measure
Application of Time–Space Measure
2.2. Travel Time Reliability
2.2.1. Travel Time
2.2.2. Travel Time Variability
2.2.3. Travel Time Reliability
3. Identifying Parameters for the Railway Station Accessibility Index Model
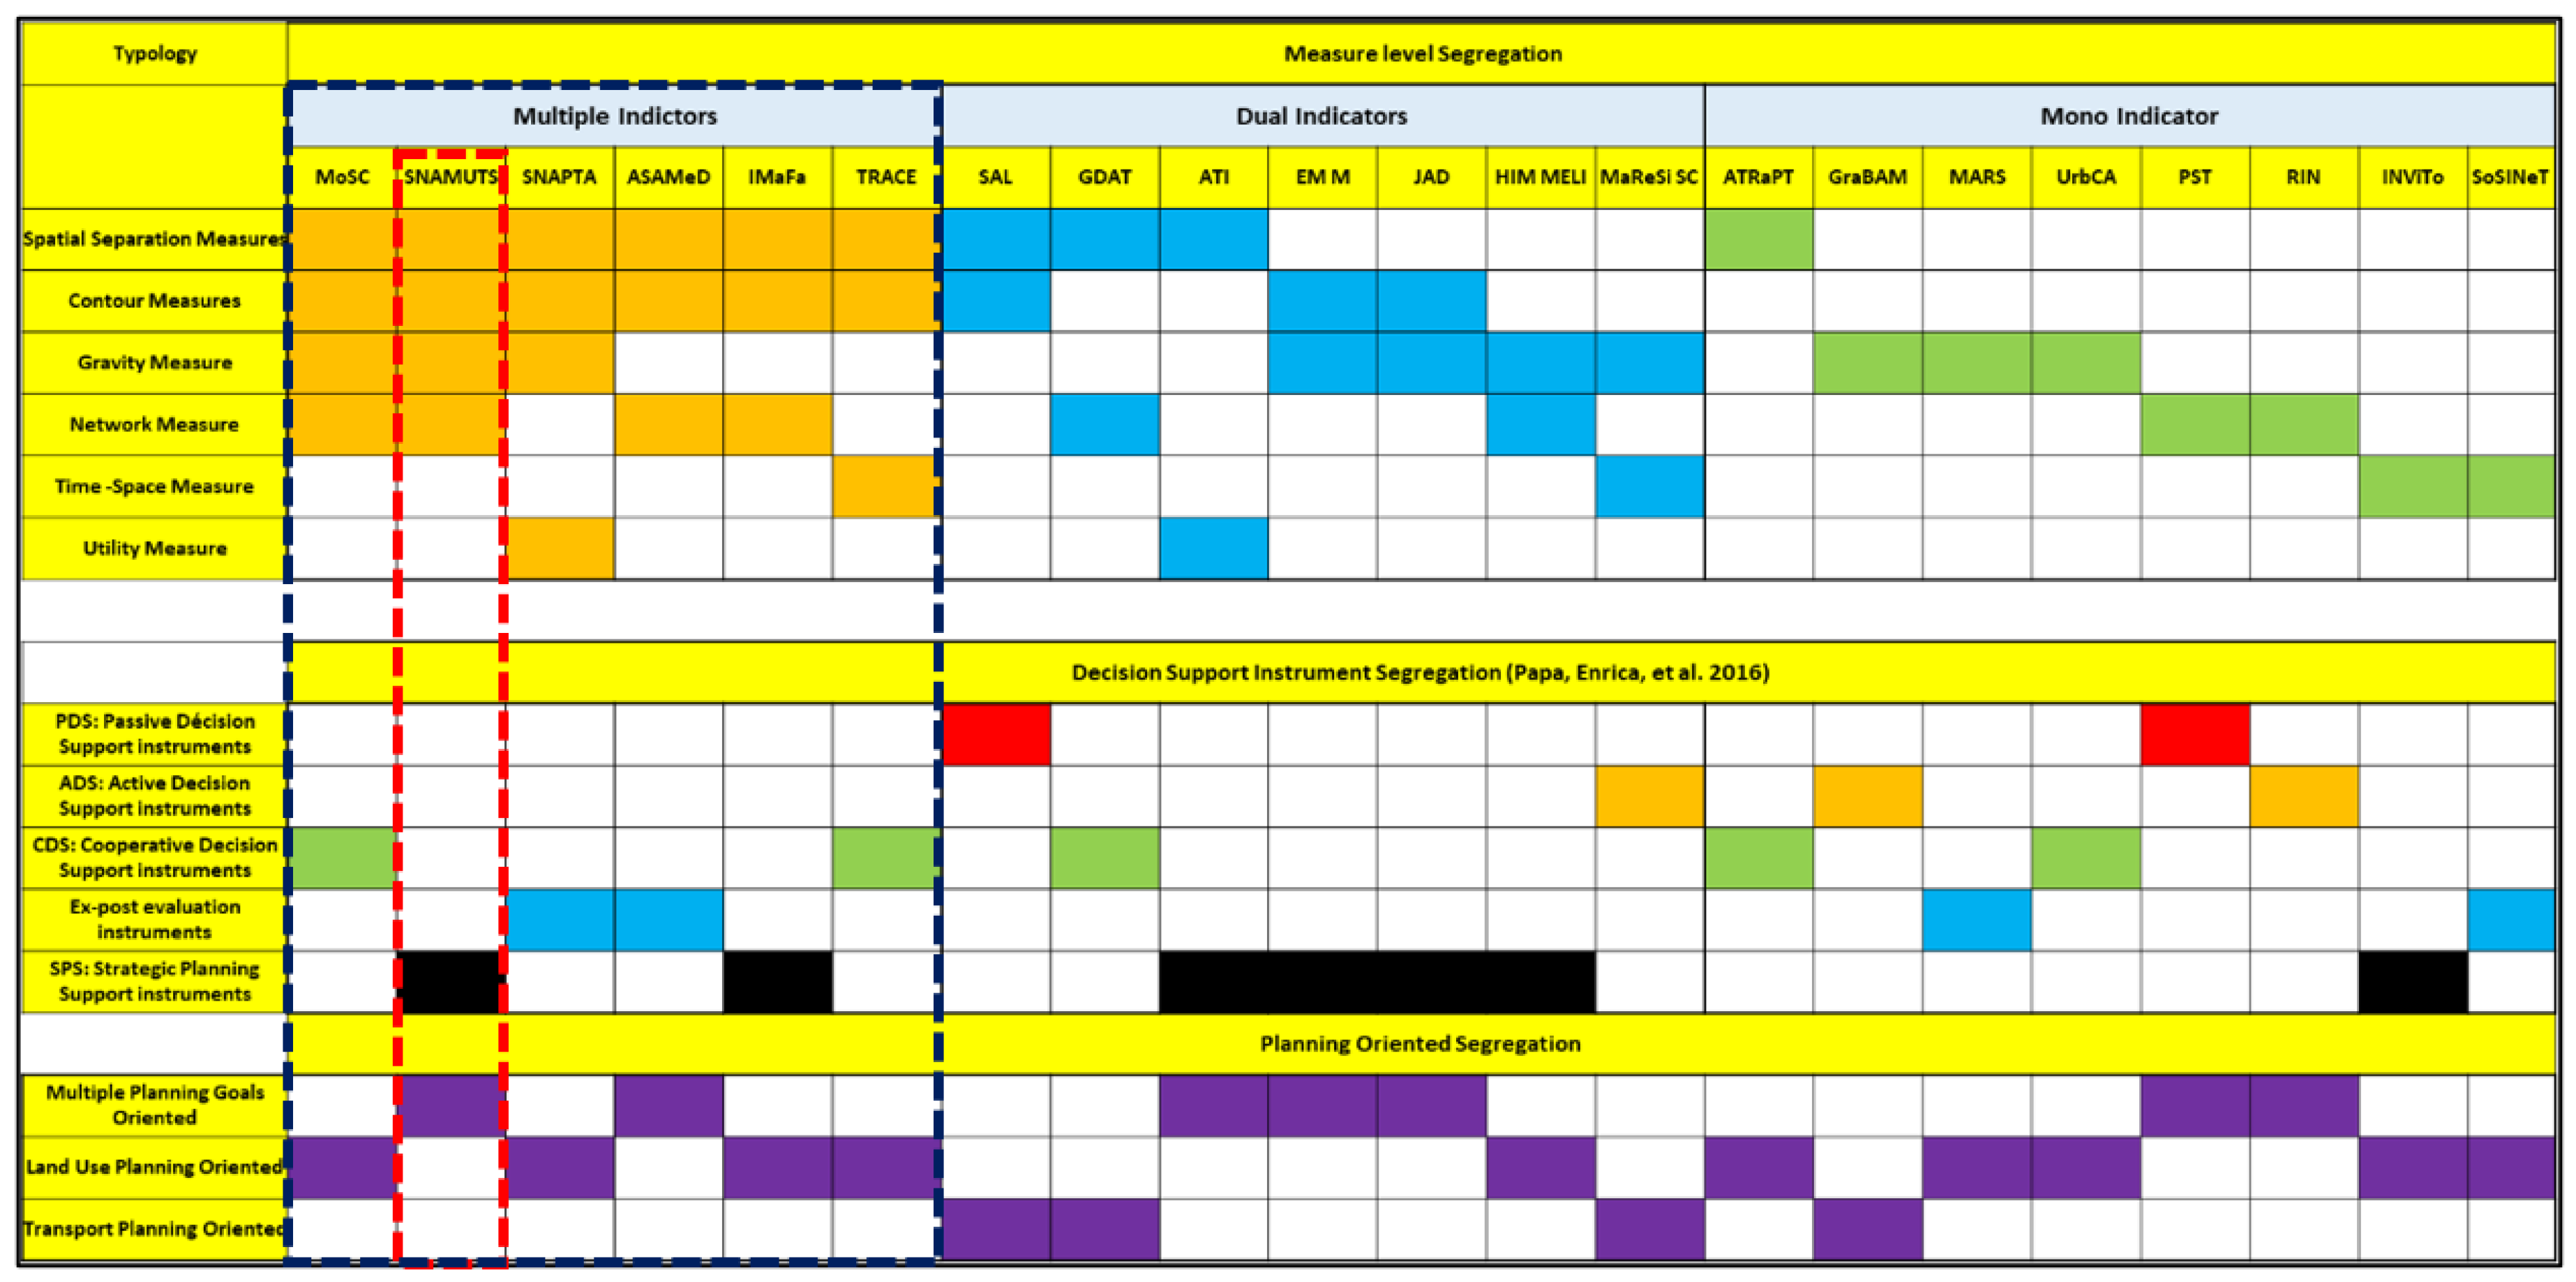
- Level 1 Segregation: Measure level segregation—this is segregated in models with multiple indicators, dual indicators, and mono indicators. A distinguishing characteristic of accessibility models is the type of accessibility measures they employ (as discussed in Table 1 about measures). Several researchers have attempted to classify these metrics, as evidenced by a review of the relevant literature [69,70,71,72]. The attempt here is to identify the models that employ the maximum number of measures. In Figure 1, under the measure level of segregation, eight accessibility models are related to only one of these metrics, whereas the remaining analyses use combinations of accessibility measures. Notable is the progression of accessibility indices that evaluate solely the physical and morphological characteristics of space and define accessibility in terms of the topological network qualities of urban space, utilizing transportation and other networks based on visual perception. An analysis of accessibility indices reveals that geographical separation and cumulative accessibility measures are the most often employed types of metrics. According to a study by Papa et al., the use of more complicated indicators such as time–space measures appears too difficult to convey to stakeholders and to compare longitudinally [73]. In the first level, six models have been identified that employ multiple measures (MoSC, SNAMUTS, SNAPTA, ASAMeD, IMaFa, and TRACE).
- Level 2 Segregation: Decision support instrument segregation, based on [73], evaluates the models based on the following parameters:
- PDS: Passive Decision Support instruments
- ADS: Active Decision Support instruments
- CDS: Cooperative Decision Support instruments
- Ex-post evaluation instruments
- SPS: Strategic Planning Support instruments
- 3.
- Level 3 Segregation: Planning-Oriented Segregation
- Multiple Planning Goals-oriented—this category comprises the accessibility models that can be utilized for various purposes, such as land use planning and transport planning.
- Land Use Planning-oriented—the second group consists of accessibility models that are primarily concerned with answering spatial planning questions, for example, determining the location of a particular activity and assisting providers, such as public transport operators, retailers, and educational or health service organizations, with strategic planning by analyzing the perceived needs of potential customers within defined catchment areas. Among this group, certain AIs (TRACE and IMaFa) were designed to support policies or decisions in specific industries, such as retail, education, health, or leisure services, while others (SAL and GraBAM) were established to account for a variety of activities.
- Transport Planning-oriented—the second type consists of accessibility models for which the primary objective is to manage, encourage, or reduce the use of a particular transport mode (i.e., they are transport planning-oriented). This category of accessibility models consists of public transportation or road trip planners that calculate the time required to reach a given destination, such as SAL, GDAT, MaReSISC, or GraBAM.
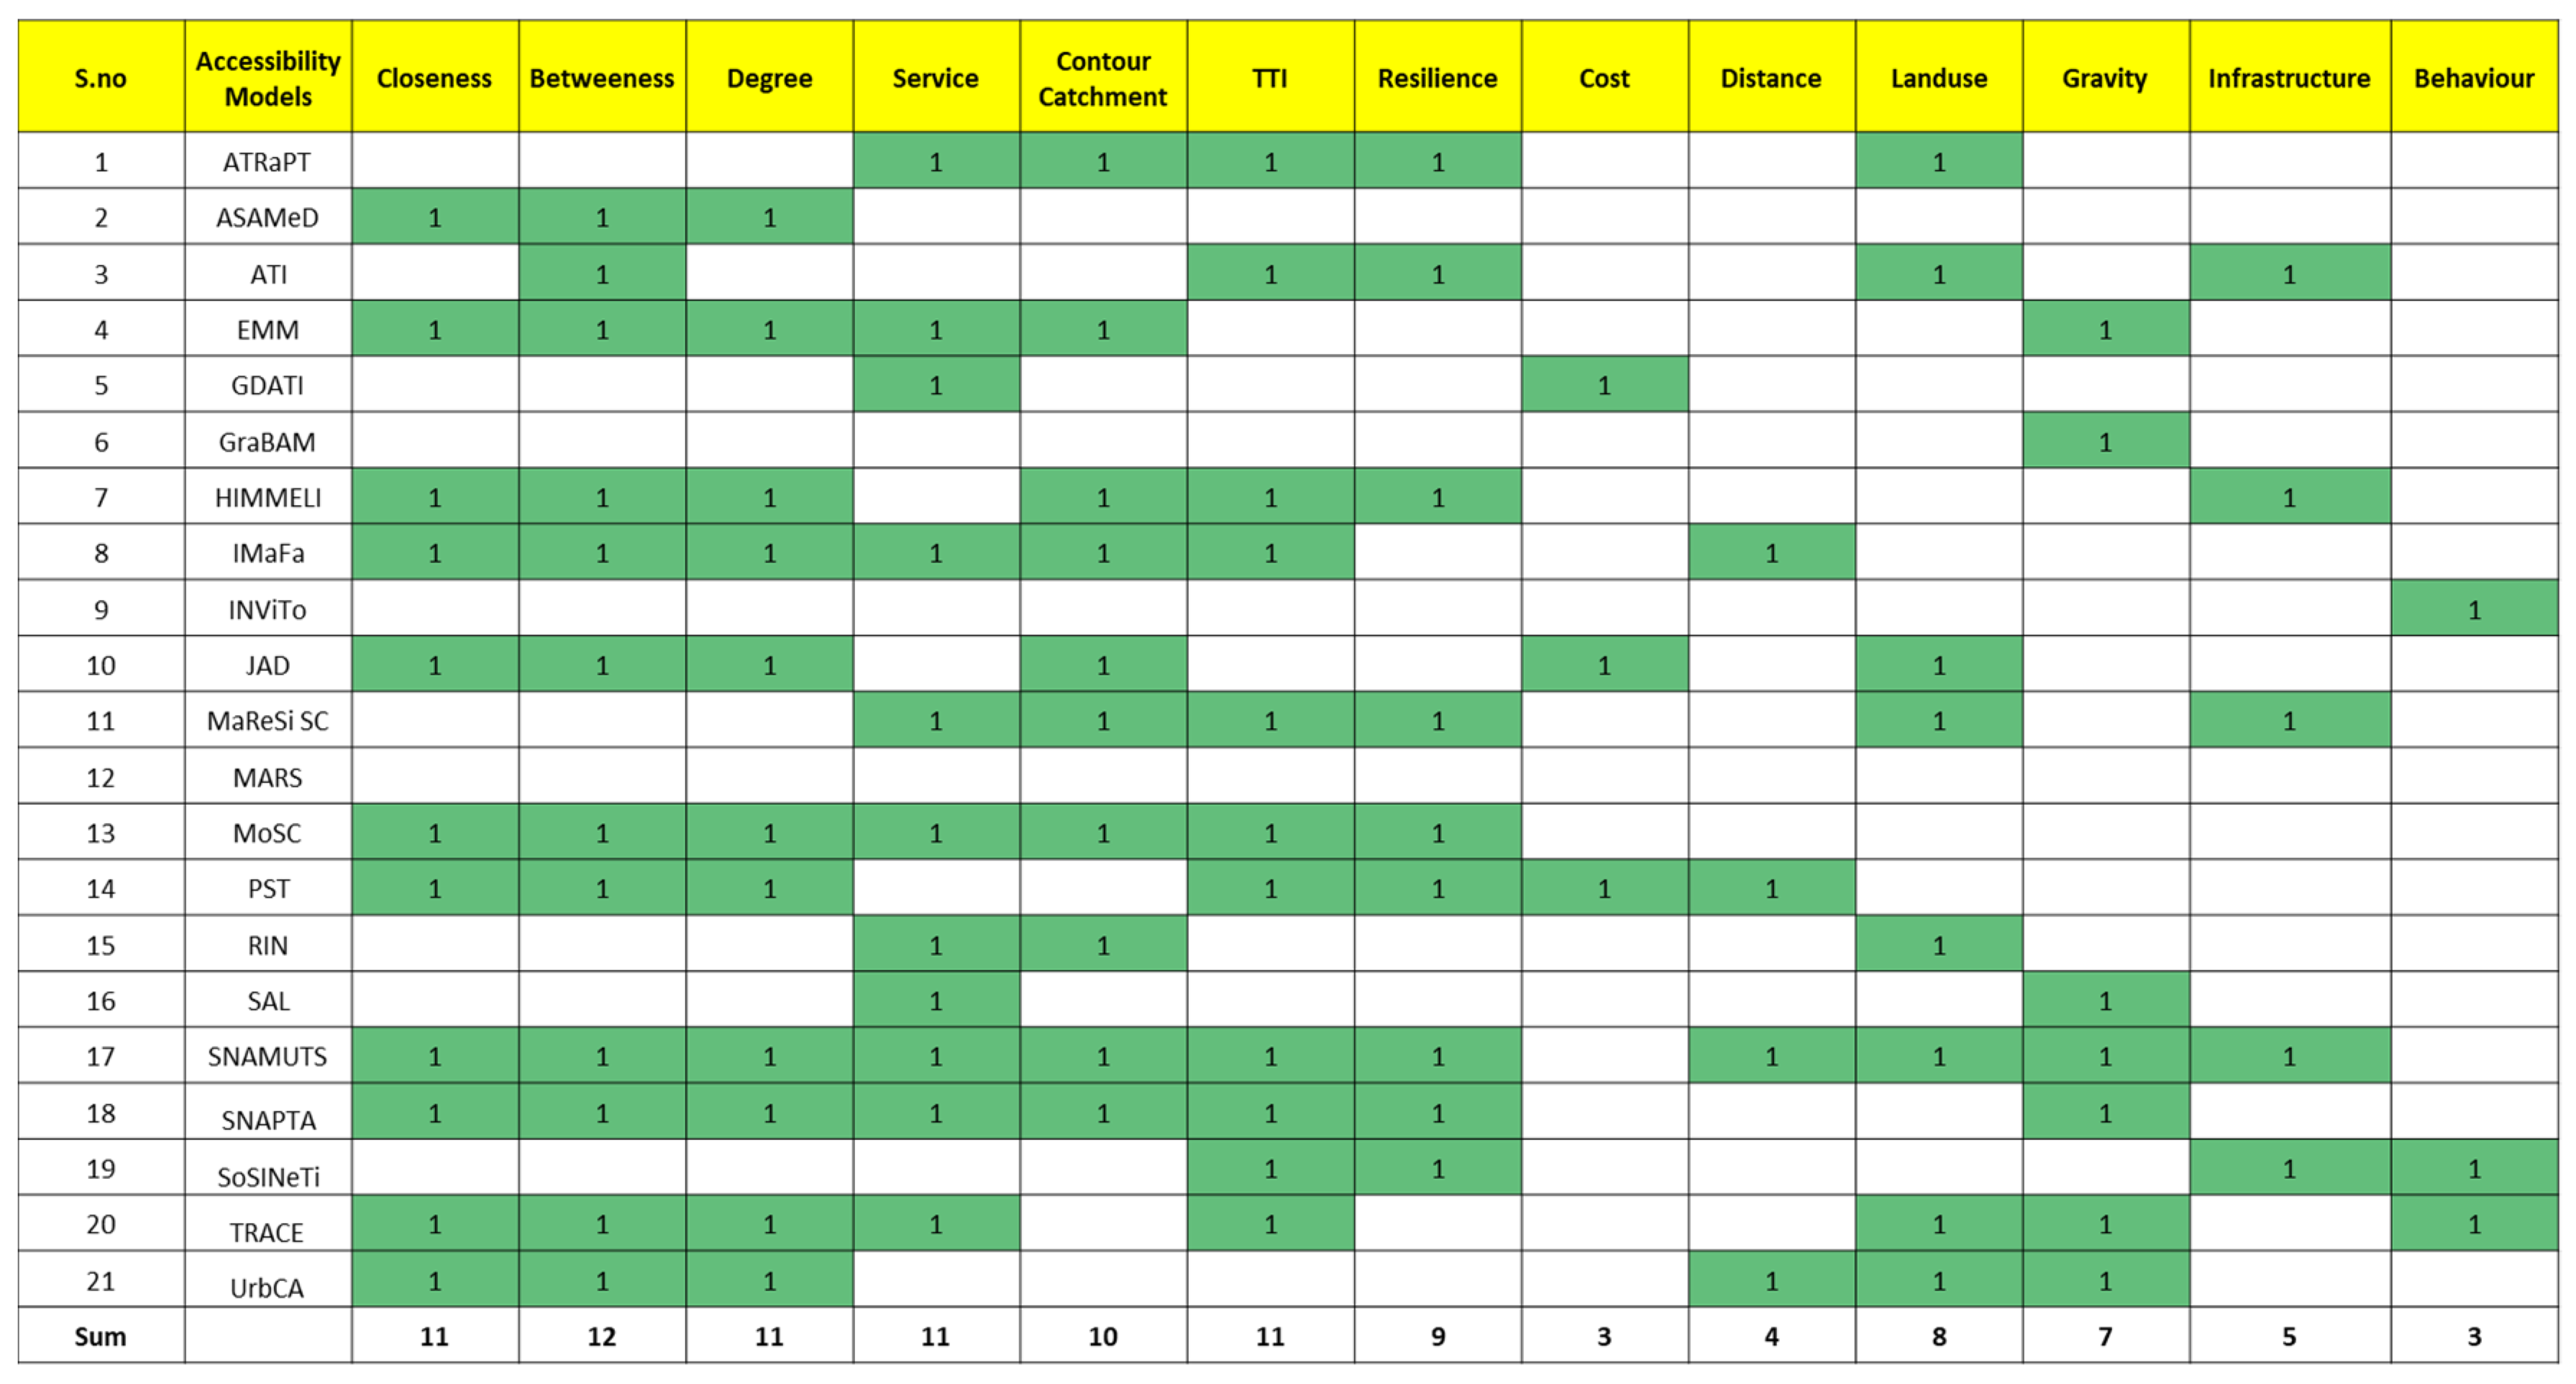
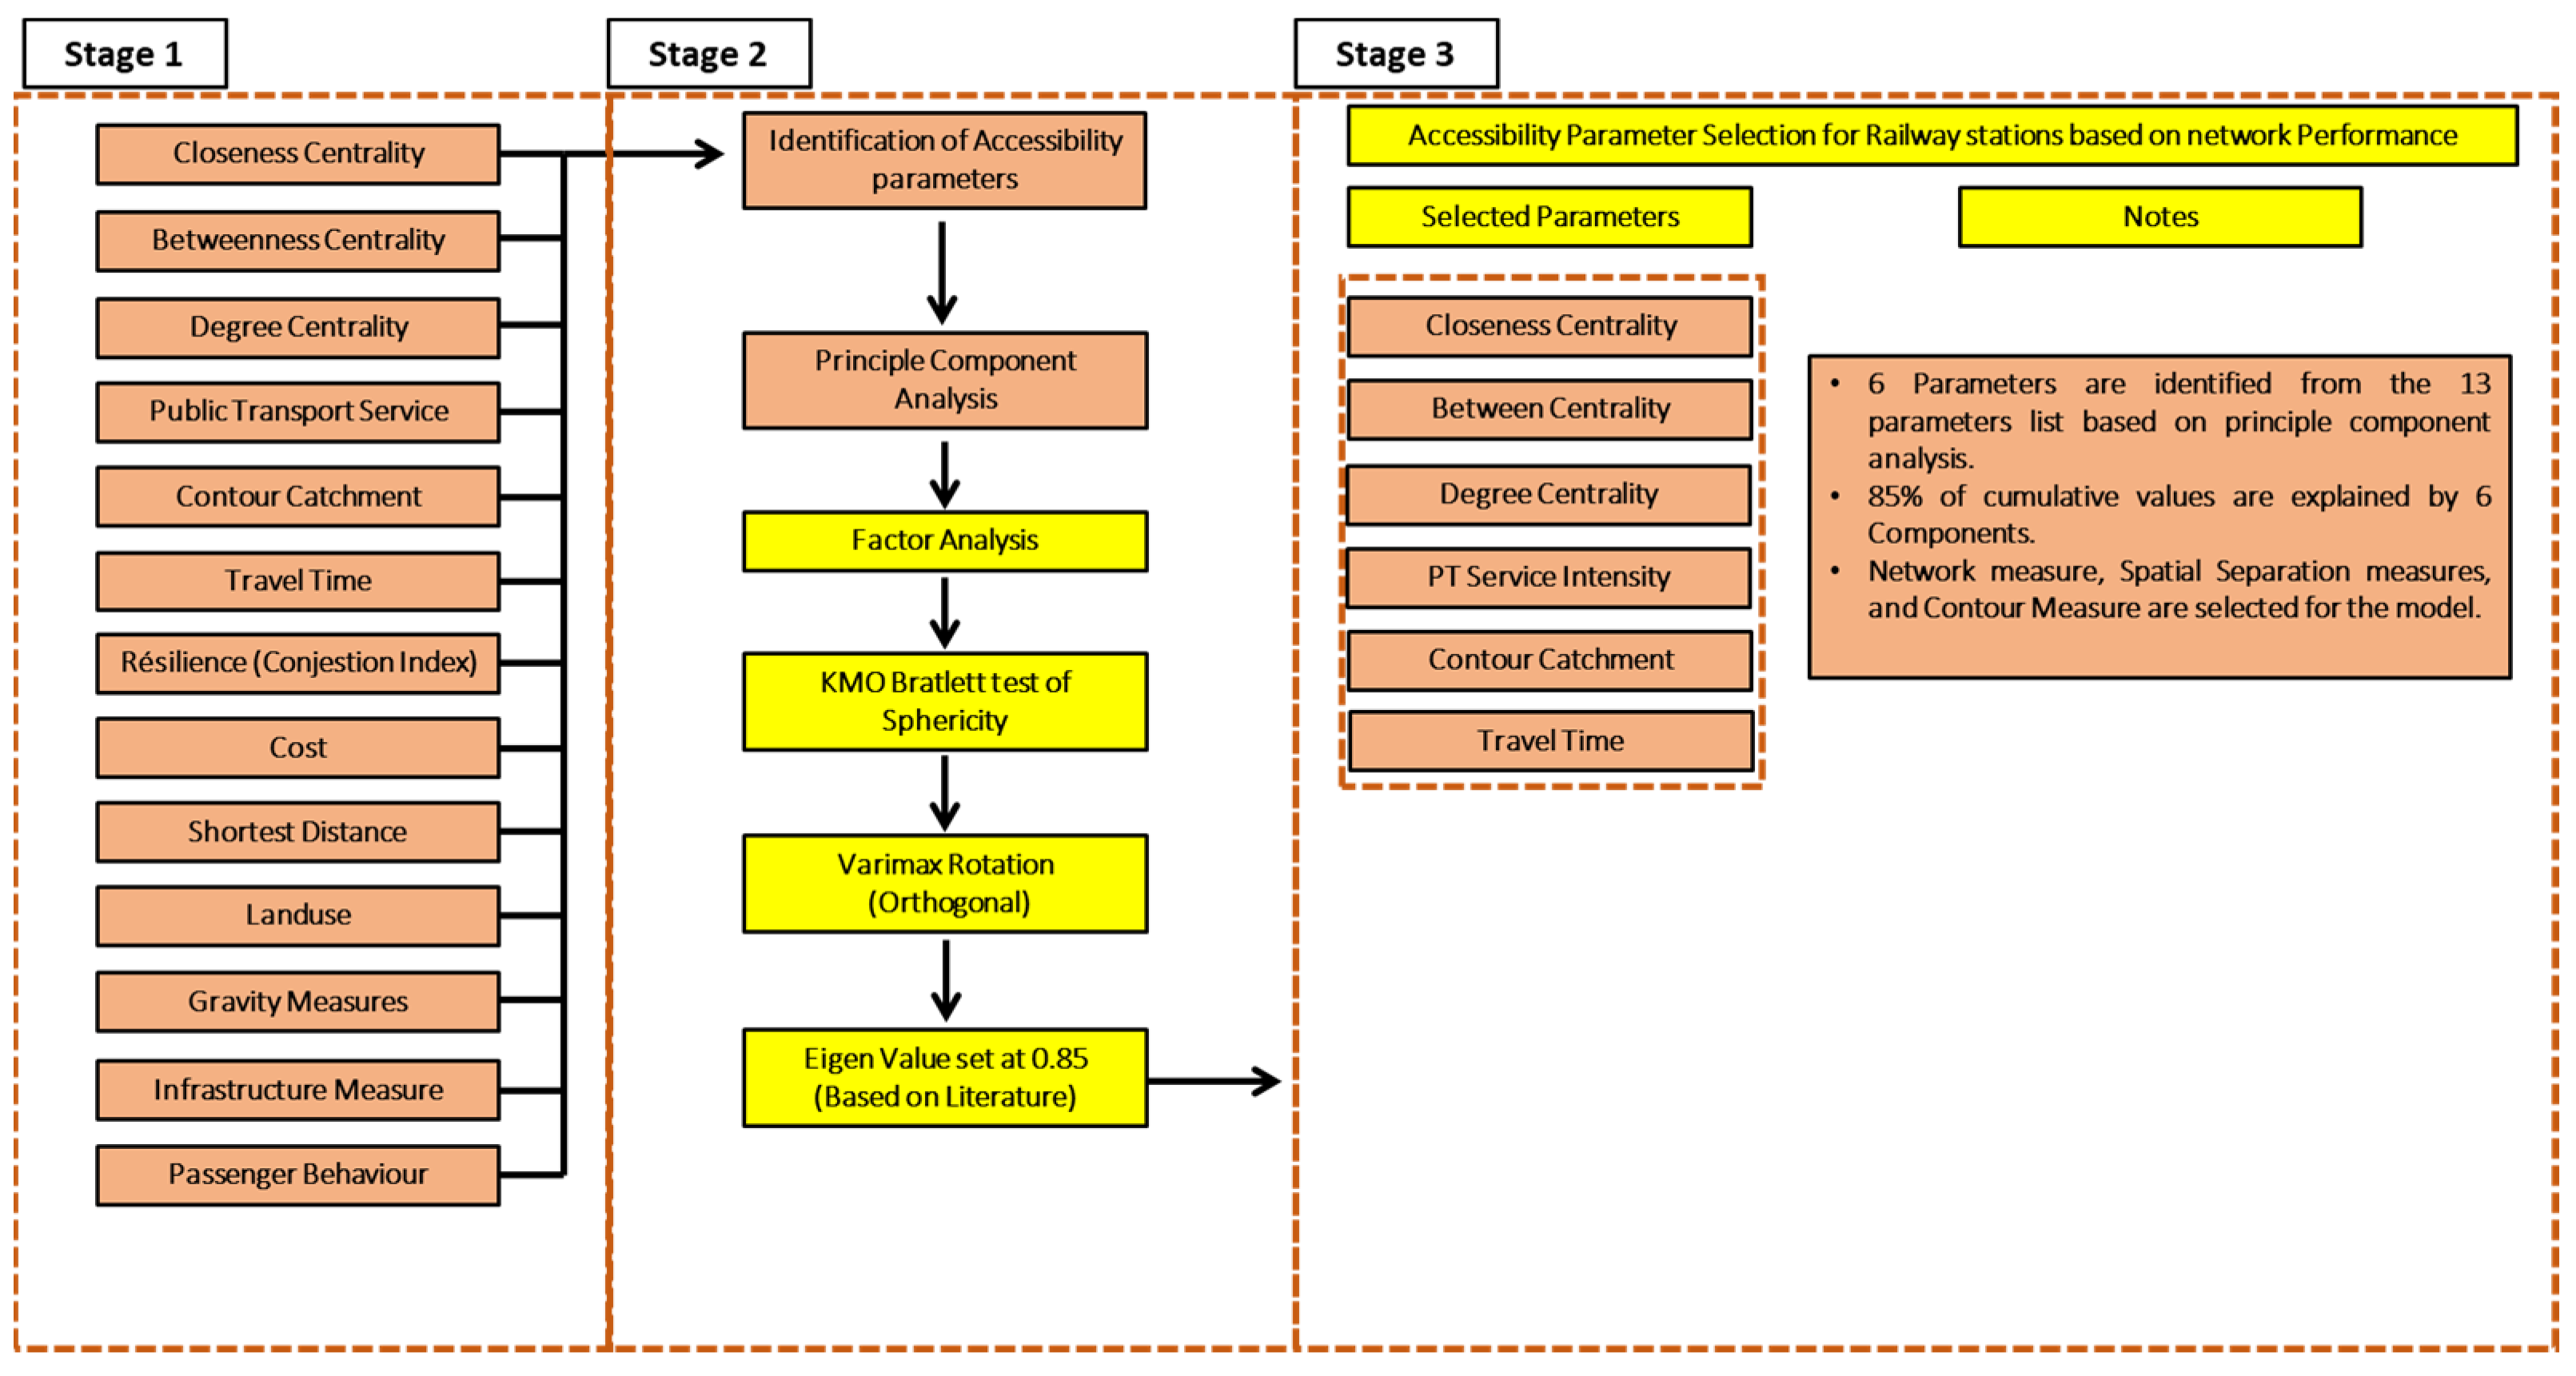
4. Selected Parameters
- Closeness Centrality;
- Betweenness Centrality;
- Degree Centrality;
- PT service Intensity;
- Contour Catchment;
- Travel time (travel time reliability).
5. Railway Station Accessibility Index Model (RsAI) (External)
- I.
- Closeness Centrality: In terms of speed and travel-time reliability, closeness centrality reflects the ease of transit along a transport network. It measures the minimal cumulative hindrance value between each pair of nodes in each direction. Closeness centrality is shown as an average for the whole network and each node.
- II.
- Betweenness Centrality: Betweenness centrality describes the geographical distribution of desirable travel pathways between the shortest pair of network nodes. This indicator is weighted by activity node catchment size. It indicates the degree to which an activity node is placed “at the crossroads” of network supply. This value is weighted by the catchment size and travel time reliability of activity nodes (travel impediment).
- III.
- Degree centrality: This indicator describes the directness of journeys along the transport network. It is a topological network indicator, measuring the minimum number of transfers between each pair of nodes. Degree centrality is shown as an average across the network and as an average for each node. Lower values indicate greater centrality.
- IV.
- PT Service Intensity: This indicator, derived from the network analysis, measures the operational input used to provide the service levels across the system. The number of vehicles for each mode that is in simultaneous revenue service during the weekday inter-peak period is counted. The index is expressed relative to the metropolitan population (vehicles or train sets per 100,000 residents).
- V.
- Contour Catchment: The influence of network speed intensity is quantified using contour catchments. This index indicates the station’s reachability; the higher quartile of 75% is used as the cutoff value. OD surveys were conducted on the stations to identify the catchment zones. The lower quartile (25%), middle quartile (55%), and upper quartile (75%) were selected to identify different zones. Speed isochrones for 30 min are observed on these contours.
- VI.
- Planning Time Index: The planning time index is calculated by dividing the trip time of the 95th percentile by the free-flow travel time. The planning time index compares near-worst-case trip time with travel time under light or free-flowing traffic conditions.
6. The Final RsAI (Railway Station Accessibility Model) (External) Is Derived as
7. Ranking Railway Stations Based on RsAI (External)
8. Results
9. Discussion
10. Conclusions
Author Contributions
Funding
Conflicts of Interest
References
- Schoon, J.G.; McDonald, M.; Lee, A. Accessibility Indices: Pilot Study and Potential Use in Strategic Planning. Transp. Res. Rec. 1999, 1685, 29–38. [Google Scholar] [CrossRef]
- Bhat, C.; Handy, S.; Kockelman, K.; Mahmassani, H.; Chen, Q.; Weston, L. Development of an Urban Accessibility Index: Literature Review; University of Texas at Austin: Austin, TX, USA, 2000. [Google Scholar]
- Dupuy, G.; Stransky, V. Cities and Highway Networks in Europe. J. Transp. Geogr. 1996, 4, 107–121. [Google Scholar] [CrossRef]
- Muraco, W.A. Intraurban Accessibility. Econ. Geogr. 1972, 48, 388–405. [Google Scholar] [CrossRef]
- Leake, G.R.; Huzayyin, A. Accessibility Measures and Their Suitability for Use in Trip Generation Models. Traffic Eng. Control 1979, 20, 566–572. [Google Scholar]
- Tang, J.; Zhen, F.; Cao, J.; Mokhtarian, P.L. How Do Passengers Use Travel Time? A Case Study of Shanghai–Nanjing High Speed Rail. Transportation 2018, 45, 451–477. [Google Scholar] [CrossRef]
- Weibull, J.W. An Axiomatic Approach to the Measurement of Accessibility. Reg. Sci. Urban Econ. 1976, 6, 357–379. [Google Scholar] [CrossRef]
- Handy, S.L.; Niemeier, D.A. Measuring Accessibility: An Exploration of Issues and Alternatives. Environ. Plan. A 1997, 29, 1175–1194. [Google Scholar] [CrossRef]
- Levinson, D.M.; Kumar, A. A Multi-Modal Trip Distribution Model. Transp. Res. Rec. 1994, 1466, 124–131. [Google Scholar]
- Mowforth, M.R.N. Trends in Accessibility to Employment in Greater London, 1971–1981. Transp. Plan. Technol. 1989, 13, 85–110. [Google Scholar] [CrossRef]
- Wachs, M.; Kumagai, T.G. Physical Accessibility as a Social Indicator. Socio-Econ. Plan. Sci. 1973, 7, 437–456. [Google Scholar] [CrossRef]
- Black, J.; Conroy, M. Accessibility Measures and the Social Evaluation of Urban Structure. Environ. Plan. A 1977, 9, 1013–1031. [Google Scholar] [CrossRef]
- Hanson, S.; Schwab, M. Accessibility and Intraurban Travel. Environ. Plan. A 1987, 19, 735–748. [Google Scholar] [CrossRef]
- Barber, B.; Sherman, L.; Kondo, W. Method for Evaluating Metropolitan Accessibility. Transp. Res. Rec. 1974, 499, 70–82. [Google Scholar]
- Carrothers, G.A.P. An Historical Review of the Gravity and Potential Concepts of Human Interaction. J. Am. Inst. Plan. 1956, 22, 94–102. [Google Scholar] [CrossRef]
- Hansen, W.G. How Accessibility Shapes Land Use. J. Am. Plan. Assoc. 1959, 25, 73–76. [Google Scholar] [CrossRef]
- Zhang, M.; Shen, Q.; Sussman, J. Job Accessibility in the San Juan Metropolitan Region: Implications for Rail Transit Benefit Analysis. Transp. Res. Rec. 1998, 1618, 22–31. [Google Scholar] [CrossRef]
- Handy, S.L. Regional versus Local Accessibility: Neo-Traditional Development and Its Implications for Non-Work Travel. Built Environ. 1992, 18, 253–267. [Google Scholar]
- Ben-Akiva, M.; Lerman, S.R. Disaggregate Travel and Mobility-Choice Models and Measures of Accessibility. In Behavioural Travel Modelling; Routledge: Abingdon, UK, 2021; pp. 654–679. ISBN 1003156053. [Google Scholar]
- Hägerstrand, T.; Pred, A. Space and Time in Geography: Essays Dedicated to Torsten Hägerstrand; CWK Gleerup, Centre for Digital Philosophy at the University of Western Ontario (Canada): London, ON, USA, 1981. [Google Scholar]
- Burns, L.D. Transportation, Temporal, and Spatial Components of Accessibility; Lexington Books: Washington, DC, USA, 1980. [Google Scholar]
- Hall, R.W. Travel Outcome and Performance: The Effect of Uncertainty on Accessibility. Transp. Res. Part B Methodol. 1983, 17, 275–290. [Google Scholar] [CrossRef]
- Marshall, S. Streets and Patterns; Routledge: Abingdon, UK, 2004; ISBN 1134370768. [Google Scholar]
- Pirie, G.H. Measuring Accessibility: A Review and Proposal. Environ. Plan. A 1979, 11, 299–312. [Google Scholar] [CrossRef]
- Kwan, M. Space-time and Integral Measures of Individual Accessibility: A Comparative Analysis Using a Point-based Framework. Geogr. Anal. 1998, 30, 191–216. [Google Scholar] [CrossRef]
- Geertman, S.C.M.; Ritsema Van Eck, J.R. GIS and Models of Accessibility Potential: An Application in Planning. Int. J. Geogr. Inf. Syst. 1995, 9, 67–80. [Google Scholar] [CrossRef]
- Song, S. Some Tests of Alternative Accessibility Measures: A Population Density Approach. Land Econ. 1996, 72, 474–482. [Google Scholar] [CrossRef]
- Lowe, J.C.; Moryadas, S. The Geography of Movement; Houghton Mifflin: Boston, MA, USA, 1975. [Google Scholar]
- Xie, F.; Levinson, D. Topological Evolution of Surface Transportation Networks. Comput. Environ. Urban Syst. 2009, 33, 211–223. [Google Scholar] [CrossRef]
- Garrison, W.L. Connectivity of the Interstate Highway System. Pap. Reg. Sci. 1960, 6, 121–137. [Google Scholar] [CrossRef]
- Kansky, K.J. Structure of Transportation Networks: Relationships between Network Geometry and Regional Characteristics; The University of Chicago: Chicago, IL, USA, 1963; ISBN 9798834034513. [Google Scholar]
- Haggett, P.; Chorley, R.J. Network Analysis in Geography; St. Martin’s Press: New York, NY, USA, 1969. [Google Scholar]
- Larsson, A.; Elldér, E. Accessibility Tool for Road and Public Transport Travel Time Analysis in Västra Götaland; COST Action TU 1002 Collect. Access. Instruments Improvement for Their Usability Planning Practice; Technical University of Munich: Munich, Germany, 2014; pp. 1–10. [Google Scholar]
- Charalambous, N.; Mavridou, M. Space Syntax: Spatial Integration Accessibility and Angular Segment Analysis by Metric Distance (ASAMeD). In Accessibility Instruments for Planning Practice; COST Office: Brussels, Belgium, 2012; pp. 57–62. [Google Scholar]
- Kovač, M.Š.; Pergar, P.; Sitar, M. From Accessibility to the Land Development Potential (ATI). Accessibility Instruments for Planning Practice; COST Office: Brussels, Belgium, 2012. [Google Scholar]
- Büttner, B.; Keller, J.; Wulfhorst, G. Erreichbarkeitsatlas Der Europäischen Metropolregion München (EMM). In Accessibility Instruments for Planning Practice; COST Office: Brussels, Belgium, 2012. [Google Scholar]
- Zakowska, L.; Starowicz, W.; Pulawska, S. Geographic/Demographic Accessibility of Transport Infrastructure (GDATI). In Accessibility Instruments for Planning Practice; COST Office: Brussels, Belgium, 2012. [Google Scholar]
- Papa, E.; Coppola, P. Gravity-Based Accessibility Measures for Integrated Transport-Land Use Planning (GraBAM). Access. Instrum. Plan. Pract. 2012, 117, 124. [Google Scholar]
- Arce-Ruiz, R.; Calderón, E.; Condeço-Melhorado, A.; Ortega, E. Isochrone Maps to Facilities. Shopping Centres in the Metrosur Influence Area (IMaFa). In Accessibility Instruments for Planning Practice; COST Office: Brussels, Belgium, 2012. [Google Scholar]
- Pensa, S.; Masala, E. InViTo: An Interactive Visualisation Tool to Support Spatial Decision Processes. In Technologies for Urban and Spatial Planning: Virtual Cities and Territories; IGI Global: Hershey, PA, USA, 2014; pp. 135–153. [Google Scholar]
- Straatemeier, T. Joint-Accessibility Design (JAD). In Accessibility Instruments for Planning Practice; COST Office: Brussels, Belgium, 2012. [Google Scholar]
- Tennøy, A. Method for Arriving at Maximum Recommendable Size of Shopping Centres (MaReSi SC). In Accessibility Instruments for Planning Practice; COST Office: Brussels, Belgium, 2012. [Google Scholar]
- Jaensirisak, S.; Jittrapirom, P.; Emberger, G.; Thiengburanathum, P.; Fukuda, T. Metropolitan Activity Relocation Simulator (Mars) Model for Chiang Mai City. In Proceedings of the New Binh Duong City, International Conference on Modeling the Future of Ho Chi Minh City Metropolitan Area (HCMCFuture 2015), Binh Duong New City, Vietnam, 24–25 September 2015; pp. 9–24. [Google Scholar]
- Trova, V. Measures of Street Connectivity: Spatialist Lines (MoSC). In Accessibility Instruments for Planning Practice; COST Office: Brussels, Belgium, 2012; pp. 103–109. [Google Scholar]
- Ståhle, A.; Marcus, L.; Karlström, A. Place Syntax: Geographic Accessibility with Axial Lines in GIS. In Proceedings of the Fifth International Space Syntax Symposium, Delft, The Netherlands, 13–17 June 2005; Techne Press: Amsterdam, The Netherlands, 2005; pp. 131–144. [Google Scholar]
- Gerlach, J. The German Guidelines for Integrated Network Design—Binding Accessibility Standards (RIN). In Accessibility Instruments for Planning Practice; COST Office: Brussels, Belgium, 2012. [Google Scholar]
- Silva, C.; Pinho, P. The Structural Accessibility Layer (SAL): Revealing How Urban Structure Constrains Travel Choice. Environ. Plan. A 2010, 42, 2735–2752. [Google Scholar] [CrossRef]
- Curtis, C.; Scheurer, J. Planning for Sustainable Accessibility: Developing Tools to Aid Discussion and Decision-Making. Prog. Plan. 2010, 74, 53–106. [Google Scholar] [CrossRef]
- Hull, A.; Karou, S. Spatial Network Analysis of Public Transport Accessibility (SNAPTA). In Accessibility Instruments for Planning Practice; COST Office: Brussels, Belgium, 2012. [Google Scholar]
- Höemke, M. Social Spatial Influences of New Transport Infrastructure (SoSINeTi). In Accessibility Instruments for Planning Practice; COST Office: Brussels, Belgium, 2012. [Google Scholar]
- Verhetsel, A.; Cant, J.; Vanoutrive, T. Retail Cluster Accessibility (TRACE). In Accessibility Instruments for Planning Practice; COST Office: Brussels, Belgium, 2012. [Google Scholar]
- Pinto, N.N.; Santos, B. Cellular Automata Modeling for Accessibility Appraisal in Spatial Plans (UrbCA). In Accessibility Instruments for Planning Practice; COST Office: Brussels, Belgium, 2012. [Google Scholar]
- Bates, J.; Polak, J.; Jones, P.; Cook, A. The Valuation of Reliability for Personal Travel. Transp. Res. Part E Logist. Transp. Rev. 2001, 37, 191–229. [Google Scholar] [CrossRef]
- Tseng, Y.; Rietveld, P.; Verhoef, E. A Meta-Analysis of Valuation of Travel Time Reliability. In Proceedings of the Colloquium Vervoersplanologisch Speurwerk, Antwerpen, Belgium, 24–25 November 2005; Department of Spatial Economics, Vrije Universiteit Amsterdam: Rotterdam, The Netherlands, 2005. [Google Scholar]
- Lomax, T.; Margiotta, R. Selecting Travel Reliability Measures; Citeseer: Pennsylvania, PA, USA, 2003. [Google Scholar]
- Asakura, Y. Reliability Measures of an Origin and Destination Pair in a Deteriorated Road Network with Variable Flows. In Proceedings of the Transportation Networks: Recent Methodological Advances, Selected Proceedings of the 4th EURO Transportation Meeting Association of European Operational Research Societies, Newcastle, UK, 9 September 1996. [Google Scholar]
- Bell, M.G.H.; Iida, Y. Transportation Network Analysis; Wiley (John) & Sons, Limited: Chichester, UK, 1997. [Google Scholar]
- Yang, H.; Bell, M.G.H.; Meng, Q. Modeling the Capacity and Level of Service of Urban Transportation Networks. Transp. Res. Part B Methodol. 2000, 34, 255–275. [Google Scholar] [CrossRef]
- Wanjek, M.; Hauger, G. Reliability of Travel Time: Challenges Posed by a Multimodal Transport Participation. IOP Conf. Ser. Mater. Sci. Eng. 2017, 245, 42029. [Google Scholar] [CrossRef]
- Emam, E.B.; Al-Deek, H. Using Real-Life Dual-Loop Detector Data to Develop New Methodology for Estimating Freeway Travel Time Reliability. Transp. Res. Rec. 2006, 1959, 140–150. [Google Scholar] [CrossRef]
- Rakha, H.; El-Shawarby, I.; Arafeh, M. Trip Travel-Time Reliability: Issues and Proposed Solutions. J. Intell. Transp. Syst. 2010, 14, 232–250. [Google Scholar] [CrossRef]
- Kumar, P.P.; Parida, M.; Swami, M. Performance Evaluation of Multimodal Transportation Systems. Procedia-Social Behav. Sci. 2013, 104, 795–804. [Google Scholar] [CrossRef]
- Chang, J.S. Assessing Travel Time Reliability in Transport Appraisal. J. Transp. Geogr. 2010, 18, 419–425. [Google Scholar] [CrossRef]
- Yang, S.; Malik, A.; Wu, Y.-J. Travel Time Reliability Using the Hasofer–Lind–Rackwitz–Fiessler Algorithm and Kernel Density Estimation. Transp. Res. Rec. 2014, 2442, 85–95. [Google Scholar] [CrossRef]
- Zhang, Y.-S.; Yao, E.-J. Splitting Travel Time Based on Afc Data: Estimating Walking, Waiting, Transfer, and in-Vehicle Travel Times in Metro System. Discret. Dyn. Nat. Soc. 2015, 2015, 539756. [Google Scholar] [CrossRef]
- Woodard, D.; Nogin, G.; Koch, P.; Racz, D.; Goldszmidt, M.; Horvitz, E. Predicting Travel Time Reliability Using Mobile Phone GPS Data. Transp. Res. Part C Emerg. Technol. 2017, 75, 30–44. [Google Scholar] [CrossRef]
- Ma, Z.; Ferreira, L.; Mesbah, M. A Framework for the Development of Bus Service Reliability Measures. In Proceedings of the Proceedings of the 36th Australasian Transport Research Forum (ATRF), Brisbane, QLD, Australia, 2–4 October 2013. [Google Scholar]
- Kaparias, I.; Bell, M.G.H.; Belzner, H. A New Measure of Travel Time Reliability for In-Vehicle Navigation Systems. J. Intell. Transp. Syst. 2008, 12, 202–211. [Google Scholar] [CrossRef]
- Geurs, K.T.; Ritsema van Eck, J.R. RIVM Report 408505006; Accessibility Measures: Review and Applications. Evaluation of Accessibility Impacts of Land-Use Transportation Scenarios, and Related Social and Economic Impact; Universiteit Utrecht-URU: Utrecht, The Netherlands, 2001. [Google Scholar]
- Geurs, K.T.; Van Wee, B. Accessibility Evaluation of Land-Use and Transport Strategies: Review and Research Directions. J. Transp. Geogr. 2004, 12, 127–140. [Google Scholar] [CrossRef]
- Halden, D. Accessibility Analysis Concepts and Their Application to Transport Policy, Programme and Project Evaluation. In Transport Projects, Programmes and Policies; Routledge: Abingdon, UK, 2017; pp. 227–242. ISBN 1315198541. [Google Scholar]
- Curl, A.; Nelson, J.D.; Anable, J. Same Question, Different Answer: A Comparison of GIS-Based Journey Time Accessibility with Self-Reported Measures from the National Travel Survey in England. Comput. Environ. Urban Syst. 2015, 49, 86–97. [Google Scholar] [CrossRef]
- Papa, E.; Silva, C.; Te Brömmelstroet, M.; Hull, A. Accessibility Instruments for Planning Practice: A Review of European Experiences. J. Transp. Land Use 2016, 9, 57–75. [Google Scholar] [CrossRef]
- Bhatnagar, R.V.; Ram, S. Classifying Indian Railway Passenger Stations Using a Multi-Criteria Framework. Transp. Dev. Econ. 2023, 9, 3. [Google Scholar] [CrossRef]


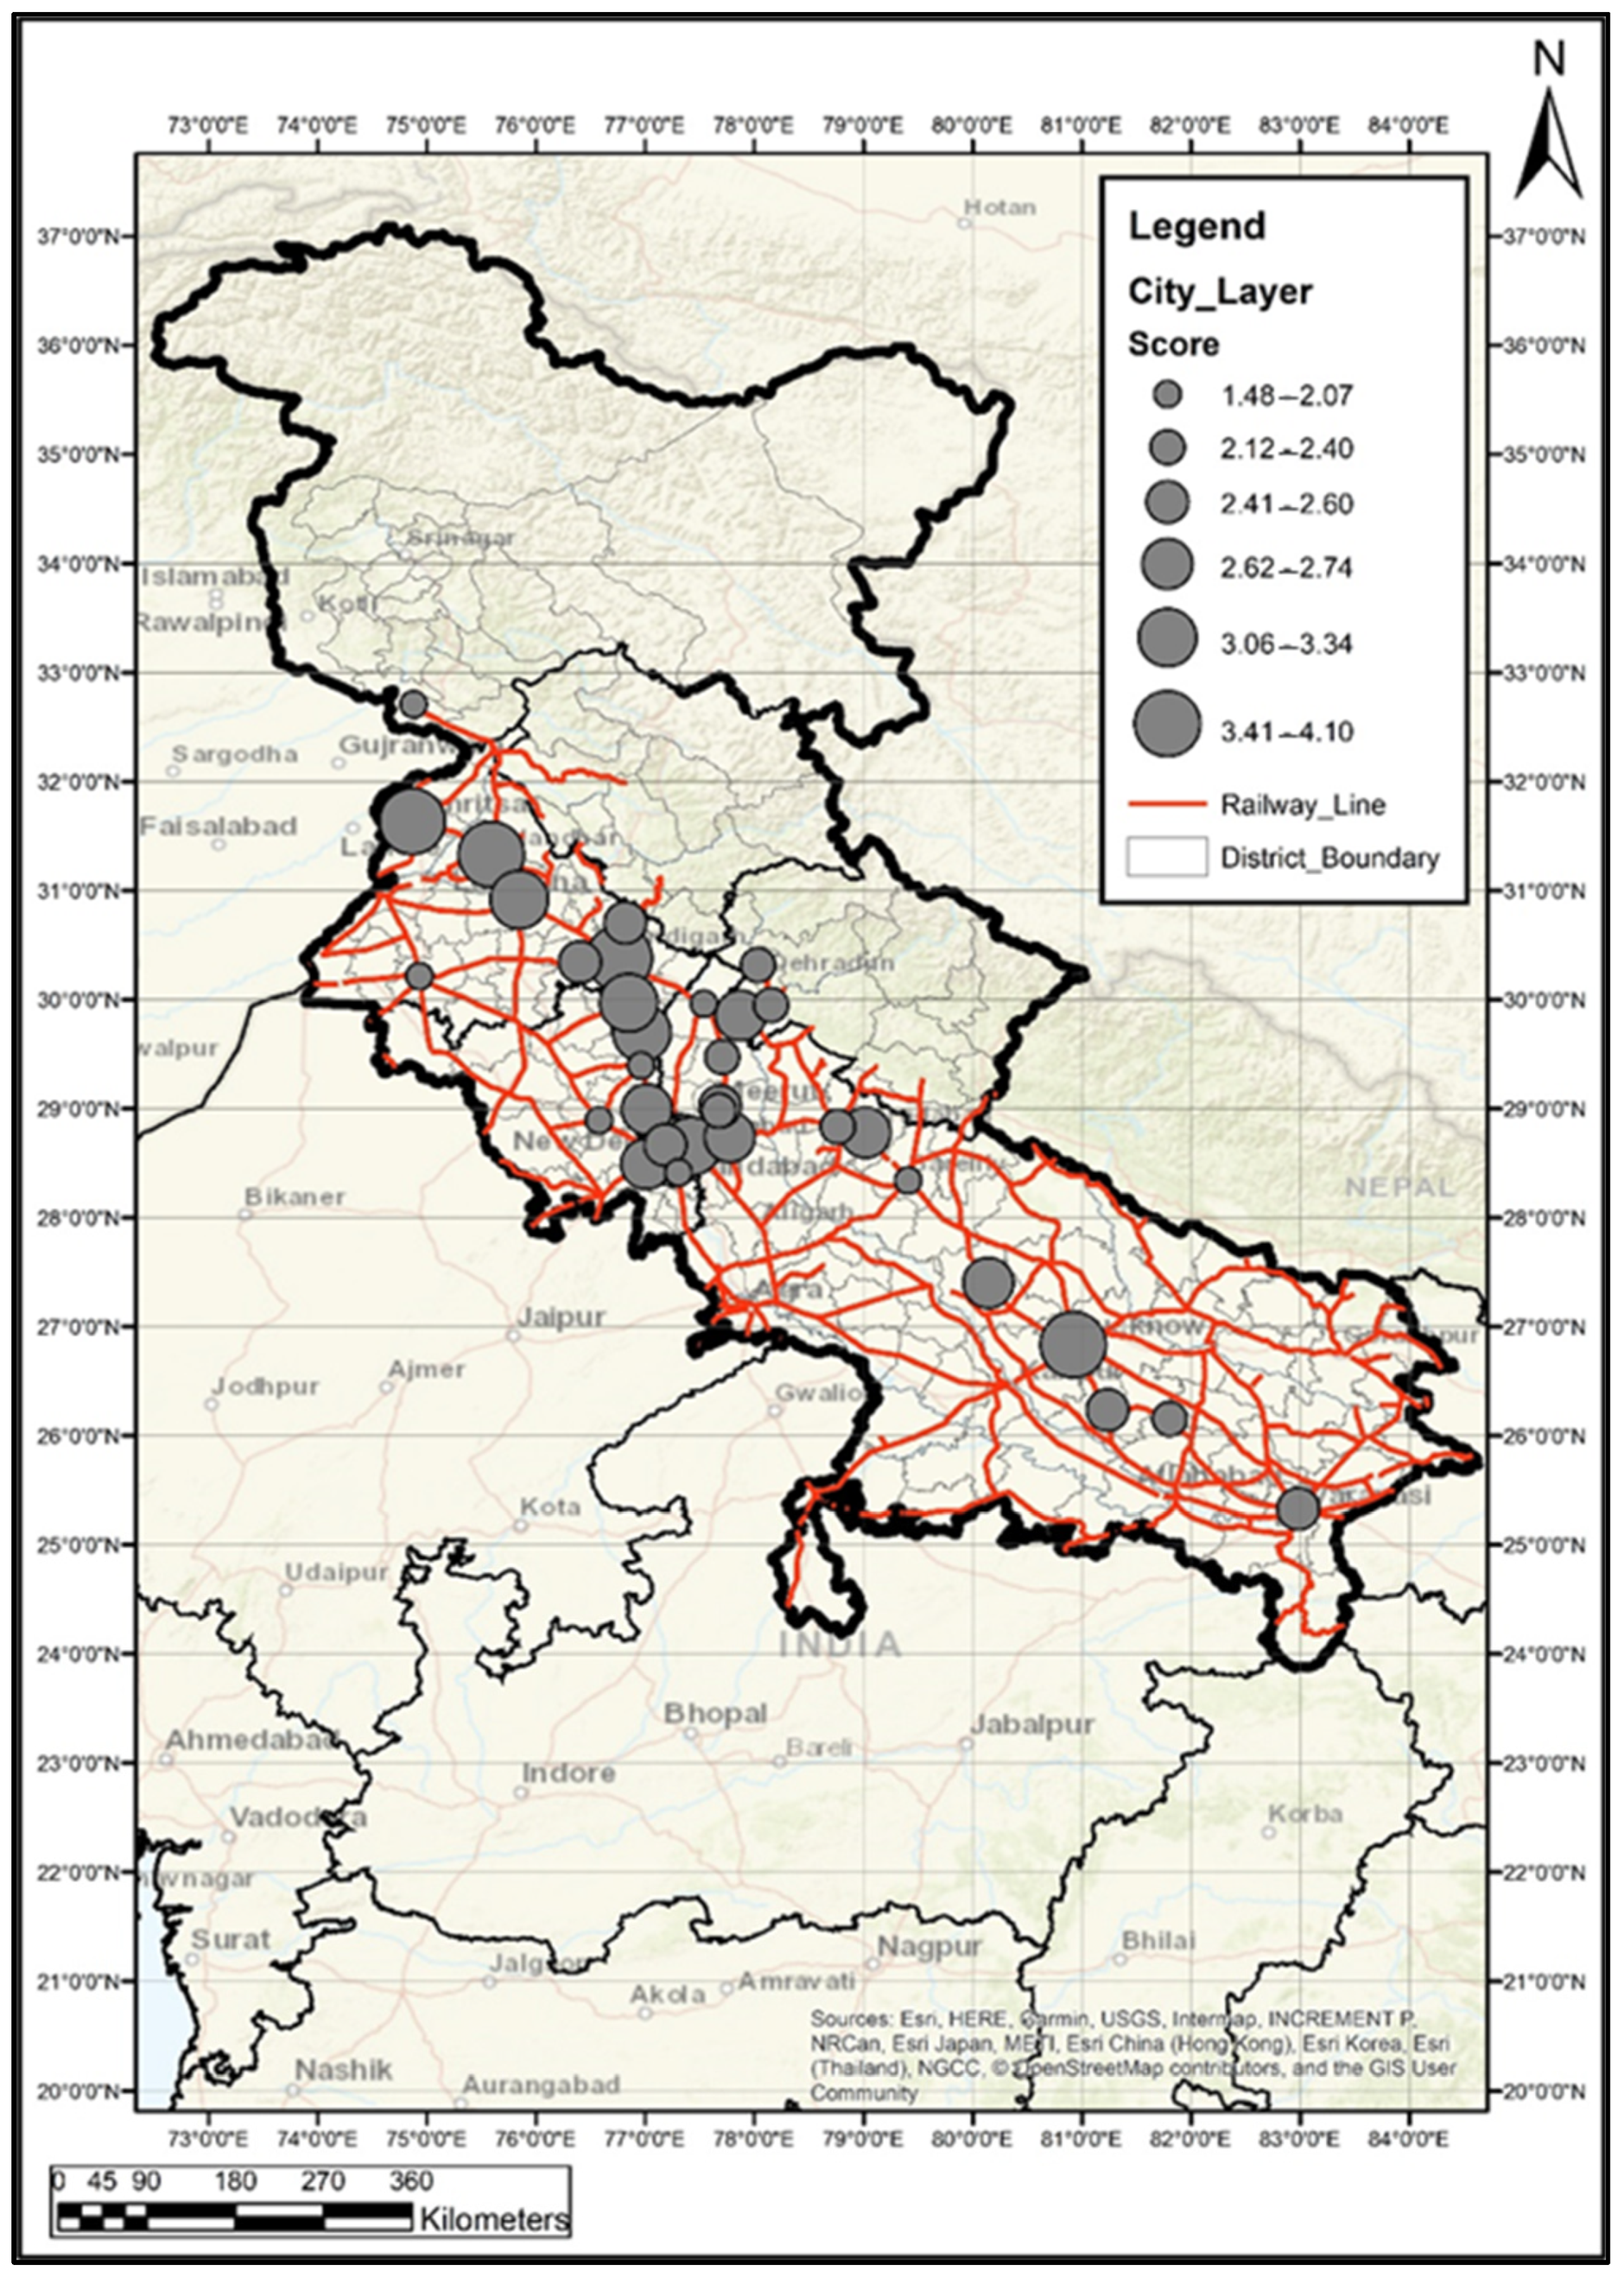
| Country | Acronym | Model—Name | References |
|---|---|---|---|
| Sweden | ATRaPT | Accessibility Tool for Road and Public Transport Travel Time Analysis | [33] |
| Greece | ASAMeD | Space Syntax: Spatial Integration Accessibility and Angular Segment Analysis by Metric Distance | [34] |
| Slovenia | ATI | From Accessibility to Land Development Potential | [35] |
| Denmark | EMM | Erreichbarkeitsatlas der Europäischen Metropolregion Muenchen | [36] |
| Poland | GDATI | Geographic/Demographic Accessibility of Transport Infrastructure | [37] |
| Italy | GraBAM | Gravity-Based Accessibility Measures for Integrated Transport-Land Use Planning | [38] |
| Finland | HIMMELI | Heuristic Three-level Instrument Combining Urban Morphology, Mobility, and Service Environment | [37] |
| Spain | IMaFa | Isochrone Maps to Facilities | [39] |
| Italy | INViTo | Interactive Visualization Tool | [40] |
| Netherlands | JAD | Joint-Accessibility Design | [41] |
| Norway | MaReSi SC | Method for Arriving at Maximus Recommendable Size of Shopping Centers | [42] |
| Thailand | MARS | Metropolitan Activity Relocation Simulator | [43] |
| Greece | MoSC | Measures of Street Connectivity: Spatiality Lines | [44] |
| Sweden | PST | Place Syntax Tool | [45] |
| Denmark | RIN | German Guidelines for Integrated Network Design-Binding Accessibility Standards | [46] |
| Portugal | SAL | Structural Accessibility Layer | [47] |
| Australia | SNAMUTS | Spatial Network Analysis for Multimodal Urban Transport Systems | [48] |
| United Kingdom | SNAPTA | Spatial Network Analysis of Public Transport Accessibility | [49] |
| Switzerland | SoSINeTi | Social Spatial Changes because of New Transport Infrastructure | [50] |
| Belgium | TRACE | Retail Cluster Accessibility | [51] |
| Portugal | UrbCA | Cellular Automata Modelling for Accessibility Appraisal in Spatial Plans | [52] |
| Stations | Railway Station Category | Closeness Centrality | Betweenness Centrality | Degree Centrality | Service Intensity | Contour Catchment | PTI |
|---|---|---|---|---|---|---|---|
| Anand Vihar | 1 | 74.69 | 67.63 | 229.835 | 40 | 6.33 | 5.15 |
| Nizamuddin | 1 | 102.89 | 67.06 | 113.861 | 40 | 5.85 | 6.11 |
| Old Delhi | 1 | 112.17 | 45.8 | 97.727 | 40 | 7 | 6.57 |
| New Delhi | 1 | 84.65 | 41.89 | 98.521 | 40 | 7 | 8.57 |
| Lucknow | 1 | 21.64 | 36.29 | 41.667 | 9.71 | 5.9 | 4.27 |
| Ludhiana | 2 | 79.93 | 82.99 | 81.498 | 25 | 4.25 | 3.17 |
| Amritsar | 2 | 69.48 | 72.74 | 60.564 | 21 | 4.75 | 3.02 |
| Ambala | 2 | 72.2 | 61.85 | 42.729 | 20 | 3.5 | 2.15 |
| Ghaziabad | 2 | 23.1 | 23.31 | 30.12 | 5.78 | 3.75 | 4.08 |
| Sarai Rohilla | 2 | 26.04 | 15.59 | 31.691 | 40 | 4.75 | 6.81 |
| Varanasi | 2 | 40.83 | 29.66 | 37.349 | 27 | 3.9 | 4.74 |
| Jalandhar | 3 | 66.81 | 70.56 | 54.828 | 25 | 4.78 | 3.01 |
| Patiala | 3 | 56.8 | 116.06 | 90.712 | 0 | 3.5 | 3.14 |
| Chandigarh | 3 | 34.75 | 29.36 | 38.5 | 32 | 3.65 | 4.65 |
| Saharanpur | 3 | 49.48 | 43.27 | 48.497 | 0 | 2.9 | 3.99 |
| Moradabad | 3 | 26.76 | 25.11 | 30.658 | 0 | 3.25 | 4.15 |
| Bathinda | 3 | 39.36 | 22.82 | 39.702 | 0 | 3.85 | 6.72 |
| Jammu Tawi | 3 | 20.49 | 14.75 | 22.04 | 0 | 4.25 | 4.91 |
| Panipat | 3 | 18.5 | 11.75 | 26.329 | 0 | 3.35 | 7.47 |
| Bareilly | 3 | 11.39 | 9.56 | 25.907 | 0 | 3.65 | 4.95 |
| Haridwar | 3 | 15 | 14 | 16.722 | 0 | 3.35 | 3.99 |
| Faridabad | 4 | 40 | 23.07 | 117.647 | 11 | 3.5 | 7.15 |
| Kurukshetra | 4 | 46.24 | 56.42 | 42.575 | 0 | 3.2 | 2.43 |
| Karnal | 4 | 49.48 | 53.59 | 32.302 | 0 | 2.85 | 2.39 |
| Dehradun | 4 | 32.48 | 22.22 | 57.471 | 17 | 3.1 | 4.91 |
| Sonipat | 4 | 31.44 | 41.09 | 34.13 | 0 | 3.2 | 3.13 |
| Meerut | 4 | 19.05 | 19.68 | 42.553 | 8 | 2.8 | 3.39 |
| Gurgaon | 4 | 18.87 | 15.98 | 21.277 | 25 | 3.4 | 4.65 |
| Rohtak | 4 | 29.78 | 25.16 | 63.654 | 0 | 3.49 | 4.56 |
| Roorkee | 4 | 21.65 | 22.87 | 21.096 | 0 | 2.75 | 3.45 |
| Meerut Cantt | 4 | 22.85 | 15.21 | 22.652 | 8 | 3.2 | 5.51 |
| Amethi | 4 | 15.5 | 14.31 | 28.34 | 0 | 2.85 | 3.43 |
| Hapur | 4 | 16.26 | 11.85 | 13.021 | 0 | 2.85 | 4.11 |
| Hardoi | 4 | 12.85 | 9.81 | 9.174 | 0 | 2.9 | 4.11 |
| Rampur | 4 | 18.28 | 17.02 | 16.31 | 0 | 3.15 | 3.42 |
| Muzaffarnagar | 4 | 24.79 | 23.96 | 22.578 | 0 | 3.35 | 3.41 |
| Raebareli | 4 | 24.04 | 21.95 | 19.704 | 0 | 3.2 | 3.45 |
| Stations | Railway Station Category | Closeness Centrality | Betweenness Centrality | Degree Centrality | Service Intensity | Contour Catchment | PTI |
|---|---|---|---|---|---|---|---|
| Anand Vihar | 1 | 0.91 | 0.91 | 1 | 0.9 | 0.98 | 0.25 |
| Nizamuddin | 1 | 0.99 | 0.91 | 0.94 | 0.9 | 0.96 | 0.14 |
| Old Delhi | 1 | 1 | 0.67 | 0.88 | 0.99 | 1 | 0.11 |
| New Delhi | 1 | 0.96 | 0.61 | 0.88 | 0.94 | 1 | 0.05 |
| Lucknow | 1 | 0.24 | 0.52 | 0.43 | 0.76 | 0.96 | 0.43 |
| Ludhiana | 2 | 0.94 | 0.98 | 0.78 | 0.35 | 0.62 | 0.79 |
| Amritsar | 2 | 0.87 | 0.94 | 0.61 | 0.35 | 0.77 | 0.85 |
| Ambala | 2 | 0.89 | 0.86 | 0.44 | 0.32 | 0.36 | 1 |
| Ghaziabad | 2 | 0.26 | 0.32 | 0.32 | 0.59 | 0.44 | 0.48 |
| Sarai Rohilla | 2 | 0.3 | 0.21 | 0.33 | 0.85 | 0.77 | 0.1 |
| Varanasi | 2 | 0.52 | 0.41 | 0.39 | 0.45 | 0.5 | 0.32 |
| Jalandhar | 3 | 0.85 | 0.93 | 0.55 | 0.35 | 0.78 | 0.85 |
| Patiala | 3 | 0.74 | 1 | 0.84 | 0 | 0.36 | 0.81 |
| Chandigarh | 3 | 0.42 | 0.41 | 0.4 | 0.65 | 0.41 | 0.33 |
| Saharanpur | 3 | 0.65 | 0.63 | 0.49 | 0 | 0.19 | 0.51 |
| Moradabad | 3 | 0.31 | 0.34 | 0.33 | 0 | 0.28 | 0.46 |
| Bathinda | 3 | 0.49 | 0.31 | 0.41 | 0 | 0.48 | 0.11 |
| Jammu Tawi | 3 | 0.23 | 0.2 | 0.25 | 0 | 0.62 | 0.29 |
| Panipat | 3 | 0.21 | 0.17 | 0.29 | 0 | 0.31 | 0.08 |
| Bareilly | 3 | 0.14 | 0.15 | 0.28 | 0 | 0.41 | 0.28 |
| Haridwar | 3 | 0.17 | 0.19 | 0.21 | 0 | 0.31 | 0.51 |
| Faridabad | 4 | 0.5 | 0.31 | 0.95 | 0.8 | 0.36 | 0.09 |
| Kurukshetra | 4 | 0.6 | 0.81 | 0.44 | 0 | 0.26 | 0.98 |
| Karnal | 4 | 0.65 | 0.78 | 0.34 | 0 | 0.17 | 0.98 |
| Dehradun | 4 | 0.39 | 0.3 | 0.58 | 0.69 | 0.24 | 0.29 |
| Sonipat | 4 | 0.37 | 0.6 | 0.36 | 0 | 0.26 | 0.81 |
| Meerut | 4 | 0.21 | 0.26 | 0.43 | 0.69 | 0.16 | 0.71 |
| Gurgaon | 4 | 0.21 | 0.22 | 0.25 | 0.8 | 0.33 | 0.34 |
| Rohtak | 4 | 0.35 | 0.34 | 0.64 | 0 | 0.35 | 0.36 |
| Roorkee | 4 | 0.24 | 0.31 | 0.25 | 0 | 0.17 | 0.69 |
| Meerut Cantt | 4 | 0.26 | 0.21 | 0.26 | 0.69 | 0.26 | 0.2 |
| Amethi | 4 | 0.18 | 0.2 | 0.31 | 0 | 0.17 | 0.7 |
| Hapur | 4 | 0.18 | 0.17 | 0.19 | 0 | 0.17 | 0.47 |
| Hardoi | 4 | 0.15 | 0.15 | 0.16 | 0 | 0.19 | 0.47 |
| Rampur | 4 | 0.2 | 0.23 | 0.21 | 0 | 0.25 | 0.7 |
| Muzaffarnagar | 4 | 0.28 | 0.33 | 0.26 | 0 | 0.31 | 0.71 |
| Raebareli | 4 | 0.27 | 0.3 | 0.24 | 0 | 0.26 | 0.69 |
| N.R—Selected Stations | Railway Station Category | Railway Station Accessibility—Value out of 6 | Station Importance | RsAI |
|---|---|---|---|---|
| Anand Vihar | 1 | 4.95 | 0.54 | 0.82 |
| Nizamuddin | 1 | 4.84 | 0.54 | 0.81 |
| Old Delhi | 1 | 4.65 | 0.73 | 0.78 |
| New Delhi | 1 | 4.44 | 0.83 | 0.74 |
| Lucknow | 1 | 3.33 | 0.55 | 0.56 |
| Ludhiana | 2 | 4.46 | 0.44 | 0.74 |
| Amritsar | 2 | 4.39 | 0.4 | 0.73 |
| Ambala | 2 | 3.87 | 0.53 | 0.64 |
| Varanasi | 2 | 2.41 | 0.46 | 0.43 |
| Sarai Rohilla | 2 | 2.57 | 0.43 | 0.43 |
| Ghaziabad | 2 | 2.58 | 0.45 | 0.4 |
| Jalandhar | 3 | 4.31 | 0.36 | 0.72 |
| Patiala | 3 | 3.75 | 0.37 | 0.62 |
| Chandigarh | 3 | 2.62 | 0.36 | 0.44 |
| Saharanpur | 3 | 2.46 | 0.39 | 0.41 |
| Bathinda | 3 | 1.71 | 0.35 | 0.3 |
| Moradabad | 3 | 1.79 | 0.42 | 0.29 |
| Jammu Tawi | 3 | 1.59 | 0.35 | 0.26 |
| Haridwar | 3 | 1.05 | 0.36 | 0.23 |
| Bareilly | 3 | 1.26 | 0.34 | 0.21 |
| Panipat | 3 | 1.4 | 0.34 | 0.18 |
| Kurukshetra | 4 | 3.01 | 0.31 | 0.51 |
| Faridabad | 4 | 3.09 | 0.27 | 0.5 |
| Karnal | 4 | 2.92 | 0.29 | 0.49 |
| Dehradun | 4 | 2.48 | 0.25 | 0.41 |
| Meerut | 4 | 2.4 | 0.33 | 0.41 |
| Sonipat | 4 | 2.48 | 0.3 | 0.4 |
| Gurgaon | 4 | 2.14 | 0.29 | 0.36 |
| Roorkee | 4 | 2.04 | 0.27 | 0.35 |
| Rohtak | 4 | 2.11 | 0.33 | 0.34 |
| Muzaffarnagar | 4 | 1.88 | 0.29 | 0.31 |
| Meerut Cantt | 4 | 1.55 | 0.22 | 0.31 |
| Raebareli | 4 | 1.19 | 0.29 | 0.29 |
| Rampur | 4 | 1.12 | 0.25 | 0.27 |
| Amethi | 4 | 1.6 | 0.23 | 0.26 |
| Hapur | 4 | 1.88 | 0.3 | 0.2 |
| Hardoi | 4 | 1.76 | 0.3 | 0.19 |
| Correlations | |||
|---|---|---|---|
| RsAI | Station Importance | ||
| RsAI | Pearson Correlation | 1 | 0.721 |
| Sig. (2-tailed) | 0.000 | ||
| N | 37 | 37 | |
| Station Importance | Pearson Correlation | 0.721 | 1 |
| Sig. (2-tailed) | 0.000 | ||
| N | 37 | 37 | |
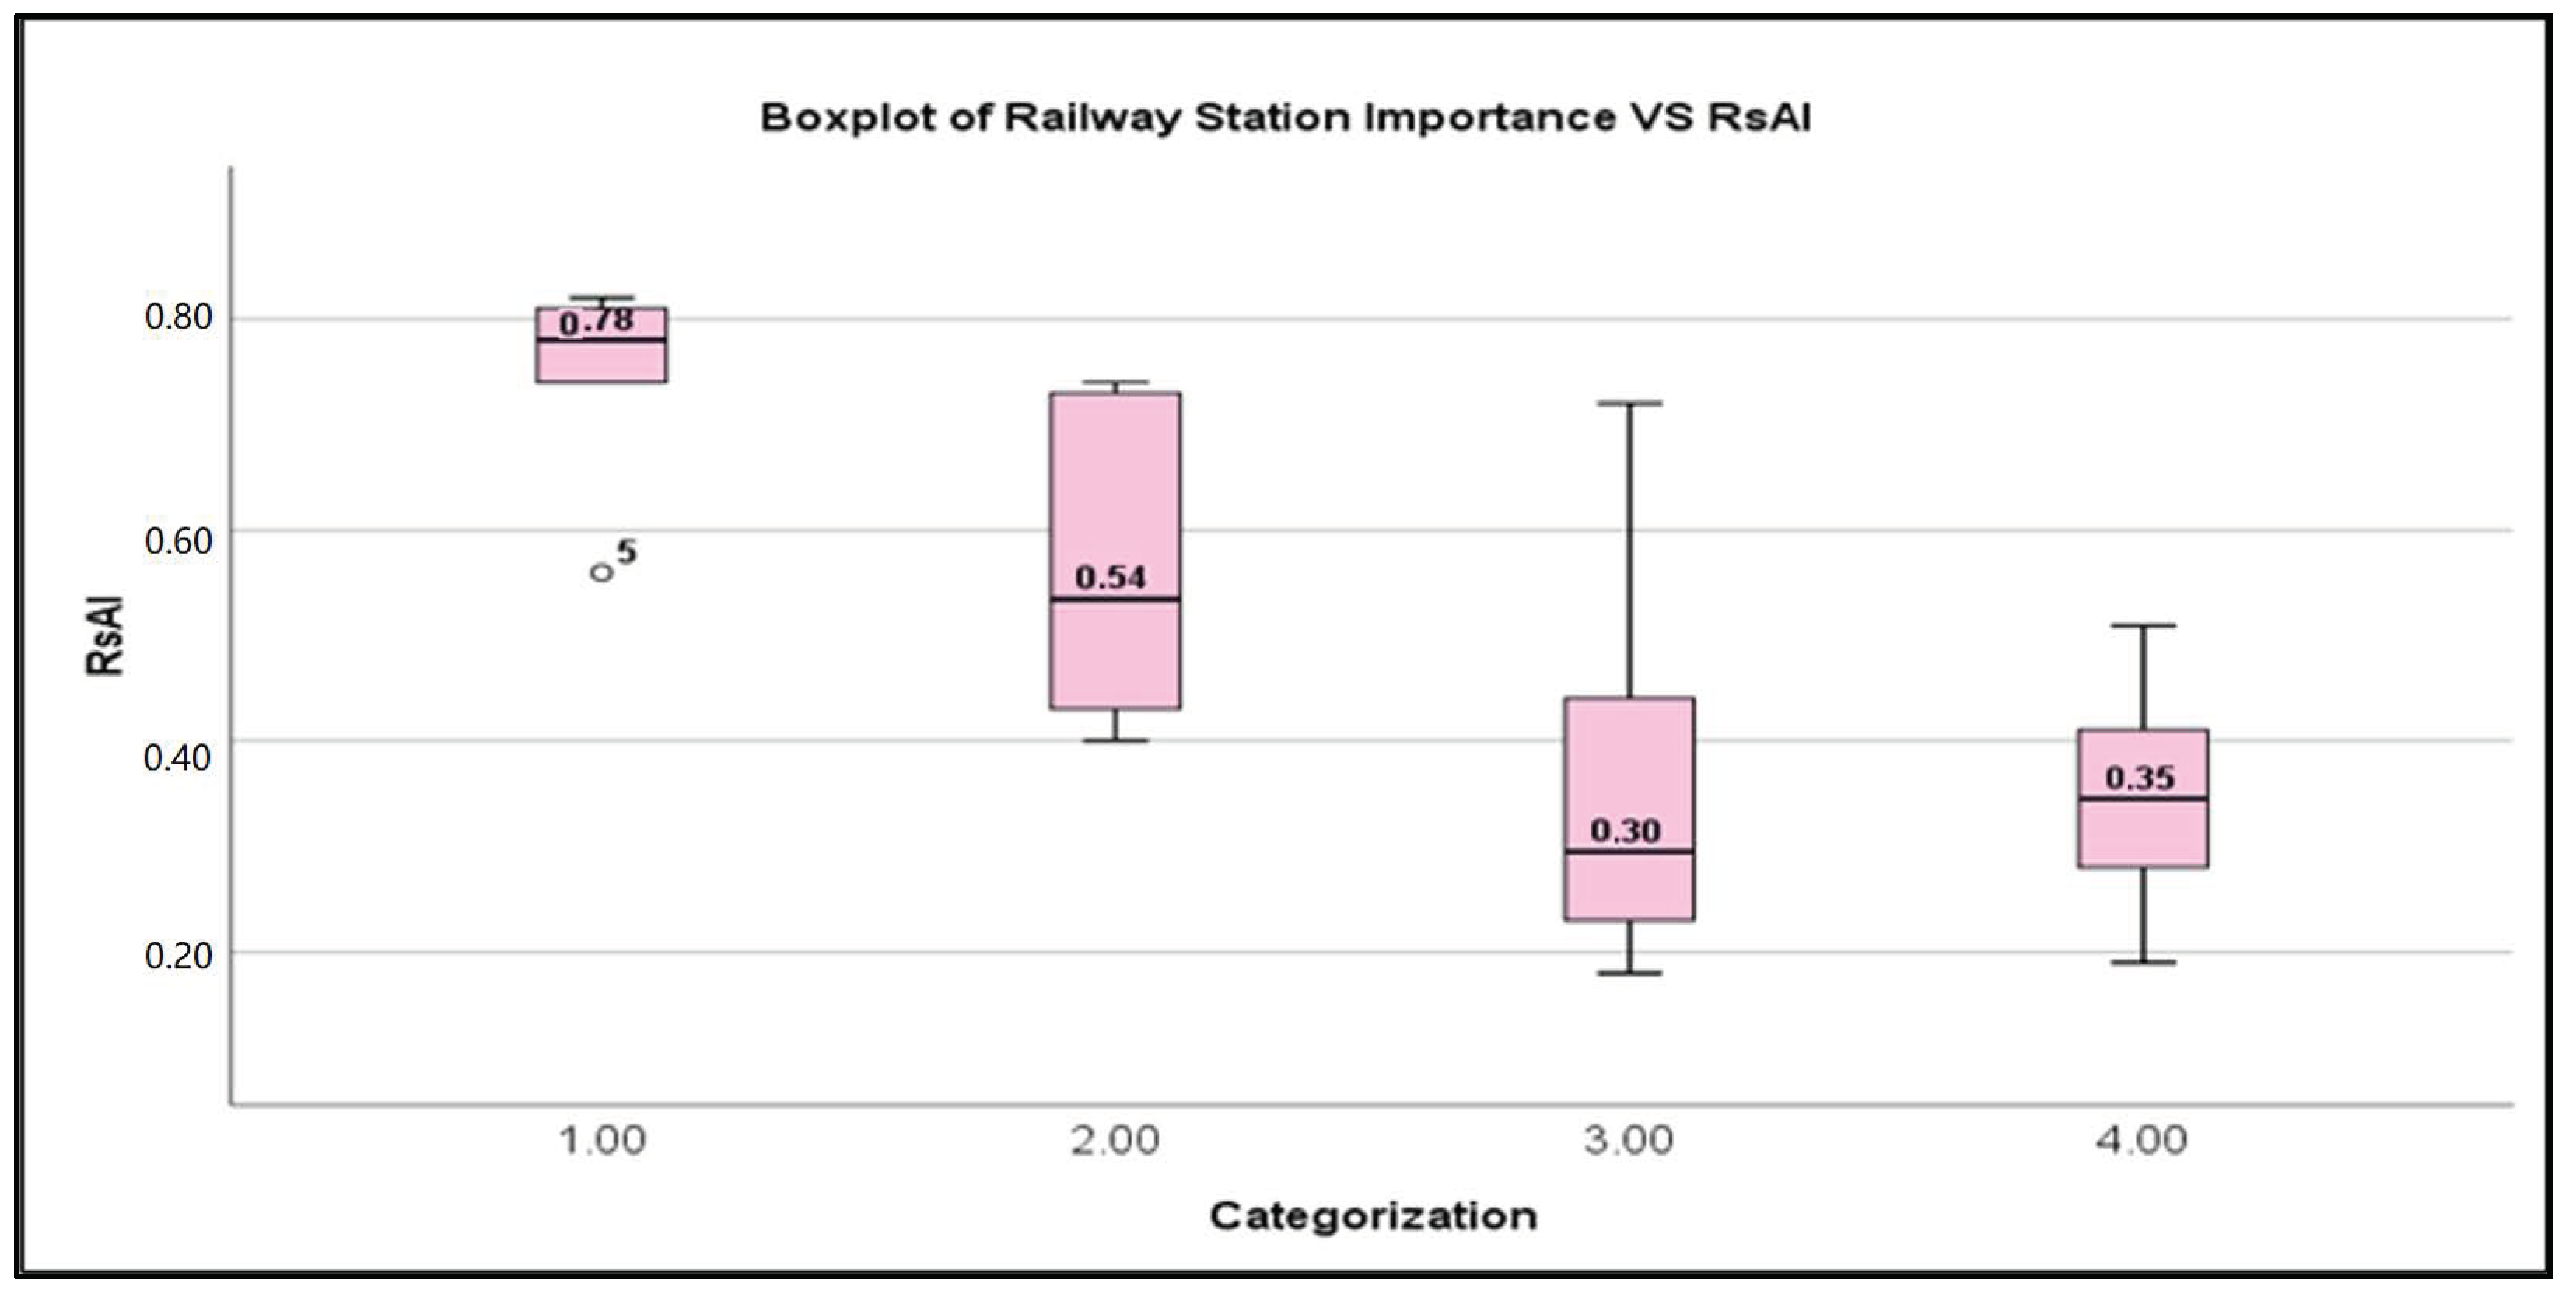
| Category-Wise Variation with RsAI | |||||||
|---|---|---|---|---|---|---|---|
| Minimum | Lower Quartile | Median | Upper Quartile | Maximum | IQR | Variation | |
| Category 1 | 0.56 | 0.74 | 0.78 | 0.81 | 0.82 | 0.07 | 0.26 |
| Category 2 | 0.4 | 0.43 | 0.54 | 0.71 | 0.74 | 0.28 | 0.34 |
| Category 3 | 0.18 | 0.24 | 0.30 | 0.43 | 0.72 | 0.20 | 0.54 |
| Category 4 | 0.19 | 0.29 | 0.35 | 0.41 | 0.51 | 0.13 | 0.32 |
Disclaimer/Publisher’s Note: The statements, opinions and data contained in all publications are solely those of the individual author(s) and contributor(s) and not of MDPI and/or the editor(s). MDPI and/or the editor(s) disclaim responsibility for any injury to people or property resulting from any ideas, methods, instructions or products referred to in the content. |
© 2023 by the authors. Licensee MDPI, Basel, Switzerland. This article is an open access article distributed under the terms and conditions of the Creative Commons Attribution (CC BY) license (https://creativecommons.org/licenses/by/4.0/).
Share and Cite
Bhatnagar, R.V.; Ram, S. Formulating a Railway Station Accessibility (RsAI) Model for Station Hierarchy Classification. Urban Sci. 2023, 7, 48. https://doi.org/10.3390/urbansci7020048
Bhatnagar RV, Ram S. Formulating a Railway Station Accessibility (RsAI) Model for Station Hierarchy Classification. Urban Science. 2023; 7(2):48. https://doi.org/10.3390/urbansci7020048
Chicago/Turabian StyleBhatnagar, Rahul Vardhan, and Sewa Ram. 2023. "Formulating a Railway Station Accessibility (RsAI) Model for Station Hierarchy Classification" Urban Science 7, no. 2: 48. https://doi.org/10.3390/urbansci7020048
APA StyleBhatnagar, R. V., & Ram, S. (2023). Formulating a Railway Station Accessibility (RsAI) Model for Station Hierarchy Classification. Urban Science, 7(2), 48. https://doi.org/10.3390/urbansci7020048


