


The Role of Performance in Smart Meter’s Acceptance: A Survey in Joinville, Brazil


1
Laboratory of Entrepreneurship and Innovation, Department of Production Engineering, Federal University of Santa Catarina, Florianopolis 88040900, Brazil
2
Department of Industrial Processes, Universidad Catolica de Temuco, Temuco 8331150, Chile
3
Polytechnic School, Federal University of Bahia, Salvador 40210630, Brazil
*
Author to whom correspondence should be addressed.
Urban Sci. 2024, 8(1), 1; https://doi.org/10.3390/urbansci8010001
Submission received: 9 November 2023
/
Revised: 14 December 2023
/
Accepted: 18 December 2023
/
Published: 20 December 2023
(This article belongs to the Topic Smart Cities: Infrastructure, Innovation, Technology, Governance and Citizenship)
Abstract
:The incorporation of renewable energy sources necessitates the upgrade of the electrical grid to a smart grid, which involves the implementation of smart meters. Although smart meters provide benefits to users, many smart meter implementation projects have failed to be accepted by users. This article assesses the factors influencing the acceptance of household smart meters in Joinville, a city in the south of Brazil. Based on the Unified and Extended Theory of Acceptance and Use of Technology (UTAUT2), a structural equation model was estimated using data from a sample of 136 respondents in the city of Joinville. The results indicate that Performance Expectancy, Hedonic Motivation, and Social Influence constructs have a more substantial effect on the Intention to Use smart meters. The results provide evidence for planning the upgrade of the electrical grid by implementing smart meters in southern Brazil.
1. Introduction
Global warming is a pressing concern that garners attention from nations worldwide, with this issue intensifying in recent years primarily due to human activities. If substantial efforts to reduce greenhouse gas (GHG) emissions are not mobilized in the coming decades, the impacts of climate change are projected to escalate gradually and become increasingly severe [1]. In light of this predicament, one of the pivotal measures to confront this challenge is the adoption of smart grids. Smart grids are designed to facilitate the efficient utilization of renewable energy sources [2]. The grid update aims to harmonize the demands and resources of all stakeholders, including providers, operators, end users, and others, in the electrical energy market [3]. The smart grid is built upon digital resources and information technology, enabling a two-way exchange of information between the energy provider and consumers. Moreover, smart energy grids allow for comprehensive monitoring, analysis, control, and communication across the energy system [4].
The literature underscores that innovations within the energy sector, including those integrated into smart grids, require social acceptance to succeed [5,6]. In simpler terms, stakeholders, such as the general public and consumers, must be open to using these technologies or acknowledging their utilization by others [4]. Despite the significance of taking residential customer acceptance into account, various initiatives aimed at implementing smart meters have encountered issues concerning their acceptance by residential consumers [7,8,9]. Therefore, proposing an acceptance model for residential smart meters is paramount to improving implementation processes to enhance acceptance among householders and, consequently, move towards the development of the present energy system to smart grids. Over the past decade, numerous studies have delved into the factors influencing households’ acceptance of smart meters, e.g., [10,11,12,13]. Despite this, several smart meter implementation initiatives continue to assume the universal acceptance of smart meters by consumers, even though such assumptions face widespread rejection in the literature, e.g., [12,13,14,15,16].
Like numerous other countries, Brazil is steadily gearing up for an extensive smart meter implementation program, which involves replacing 64 million meters with an investment of 91 billion reais by 2030 [17]. Despite a growing body of literature on smart meter acceptance, a notable gap exists in understanding the factors influencing this acceptance within South America, including Brazil. A comprehensive review of existing research findings, encompassing literature reviews [18,19,20,21,22,23,24] and smart meter acceptance studies conducted in over 40 locations [25], confirms this scarcity of research within the South American context.
Brazil’s population has already surpassed 213.3 million [26]. Against the backdrop of this population growth, the Brazilian government is keen on modernizing its energy grid for several compelling reasons, such as the increasing share of renewable energy sources in its energy matrix [27], the implementation of variable energy tariffs, comprehended locally as the white tariff [28], the increase in the number of consumers that are producing their own energy, also named of “prosumers” [29], and the decrease of non-technical energy losses [29,30]. With these foundational principles in mind, the Brazilian government actively promotes public policies and investments in smart meter adoption, thereby replacing conventional electricity meters with smart meters [31]. Despite the national plan for updating the electrical system, the replacement of traditional meters by smart meters is decentralized and carried out by the various energy utilities. This complexity occurs due to the inherent diversity and complexity of the Brazilian electrical system, which encompasses a variety of entities, ranging from private companies to public–private partnerships and fully public concessionaires. Though implementing smart meters offers numerous benefits to energy utilities, including improved data accuracy, the elimination of manual reading, and the potential to introduce various customer-centric services, the cost of replacing traditional meters with smart ones is paid for by residential consumers, as per the National Electric Energy Agency (ANEEL) [31]. Nevertheless, energy utilities have undertaken several pilot projects for smart meter implementation. Nevertheless, transitioning from pilot projects to widespread smart meter adoption necessitates a deeper examination of user needs and perspectives [8]. Consequently, understanding the factors that influence the acceptance of smart meters by the population is instrumental in shaping more effective public policy implementation. Furthermore, this knowledge helps to mitigate the delays and setbacks frequently encountered during the implementation process [32], which often arise from the oversight of consumer perspectives in the transition to smart grids, as noted in the literature, e.g., [12,13,14].
In light of this context, two fundamental inquiries guided this research. Firstly, what are the factors of smart meter acceptance? Secondly, how do these factors impact the acceptance of smart meters? Within this framework, the primary objective of this research is to assess the factors influencing the acceptance of residential smart meters in a specific city in the south of Brazil, specifically in the city of Joinville. Joinville is the largest urban center and industrial epicenter in Santa Catarina state [33]. It was selected as the focal point of this study due to its pivotal role in the Brazilian economic landscape, being the third wealthiest city in the southern region of the country [33]. Moreover, focusing the research on a single region ensures a more dependable and representative sample within the designated population [34]. The article’s results unveil critical insights for the formulation of public policies concerning the deployment of smart residential meters in the study area. Additionally, the findings aim to furnish valuable evidence regarding consumer behavior in the installation of smart meters in the southern region of Brazil.
2. Materials and Methods
The methodological approach is organized into three distinct steps. Initially, a model for evaluating the acceptance of new smart energy meter equipment is proposed, drawing upon the technology acceptance theory derived from the literature [35]. The second step elucidates the development of the research instrument. Finally, the third step expounds upon the estimation method and the metrics employed to validate the model, encompassing the measurement and structural models.
2.1. Theoretical Foundation to Model Proposal
In the realm of estimation theories for assessing the acceptance of new technologies, particularly those employed in the context of smart meters, there is a notable predilection for utilizing the Unified Theory of Acceptance and Use of Technology (UTAUT) [36] and the Unified and Extended Theory of Acceptance and Use of Technology (UTAUT2) [35] in the existing literature, e.g., [37,38,39,40]. UTAUT2, as proposed by Venkatesh et al. [35] stands out as one of the most comprehensive and versatile models for technology acceptance. This model represents an extension of the original UTAUT [36], which was developed through the integration of eight distinct acceptance models previously scattered throughout the literature. The Unified and Extended Theory of Acceptance and Use of Technology (UTAUT2) [35] includes the constructs Performance Expectancy, Effort Expectancy, Social Influence, Facilitating Conditions, Hedonic Motivation, Price Value, and Habit as predictors of the Behavioral Intention to Use construct, and the constructs Habit, Facilitating Conditions, and Behavioral Intention to Use as predictors of the Use Behavior construct.
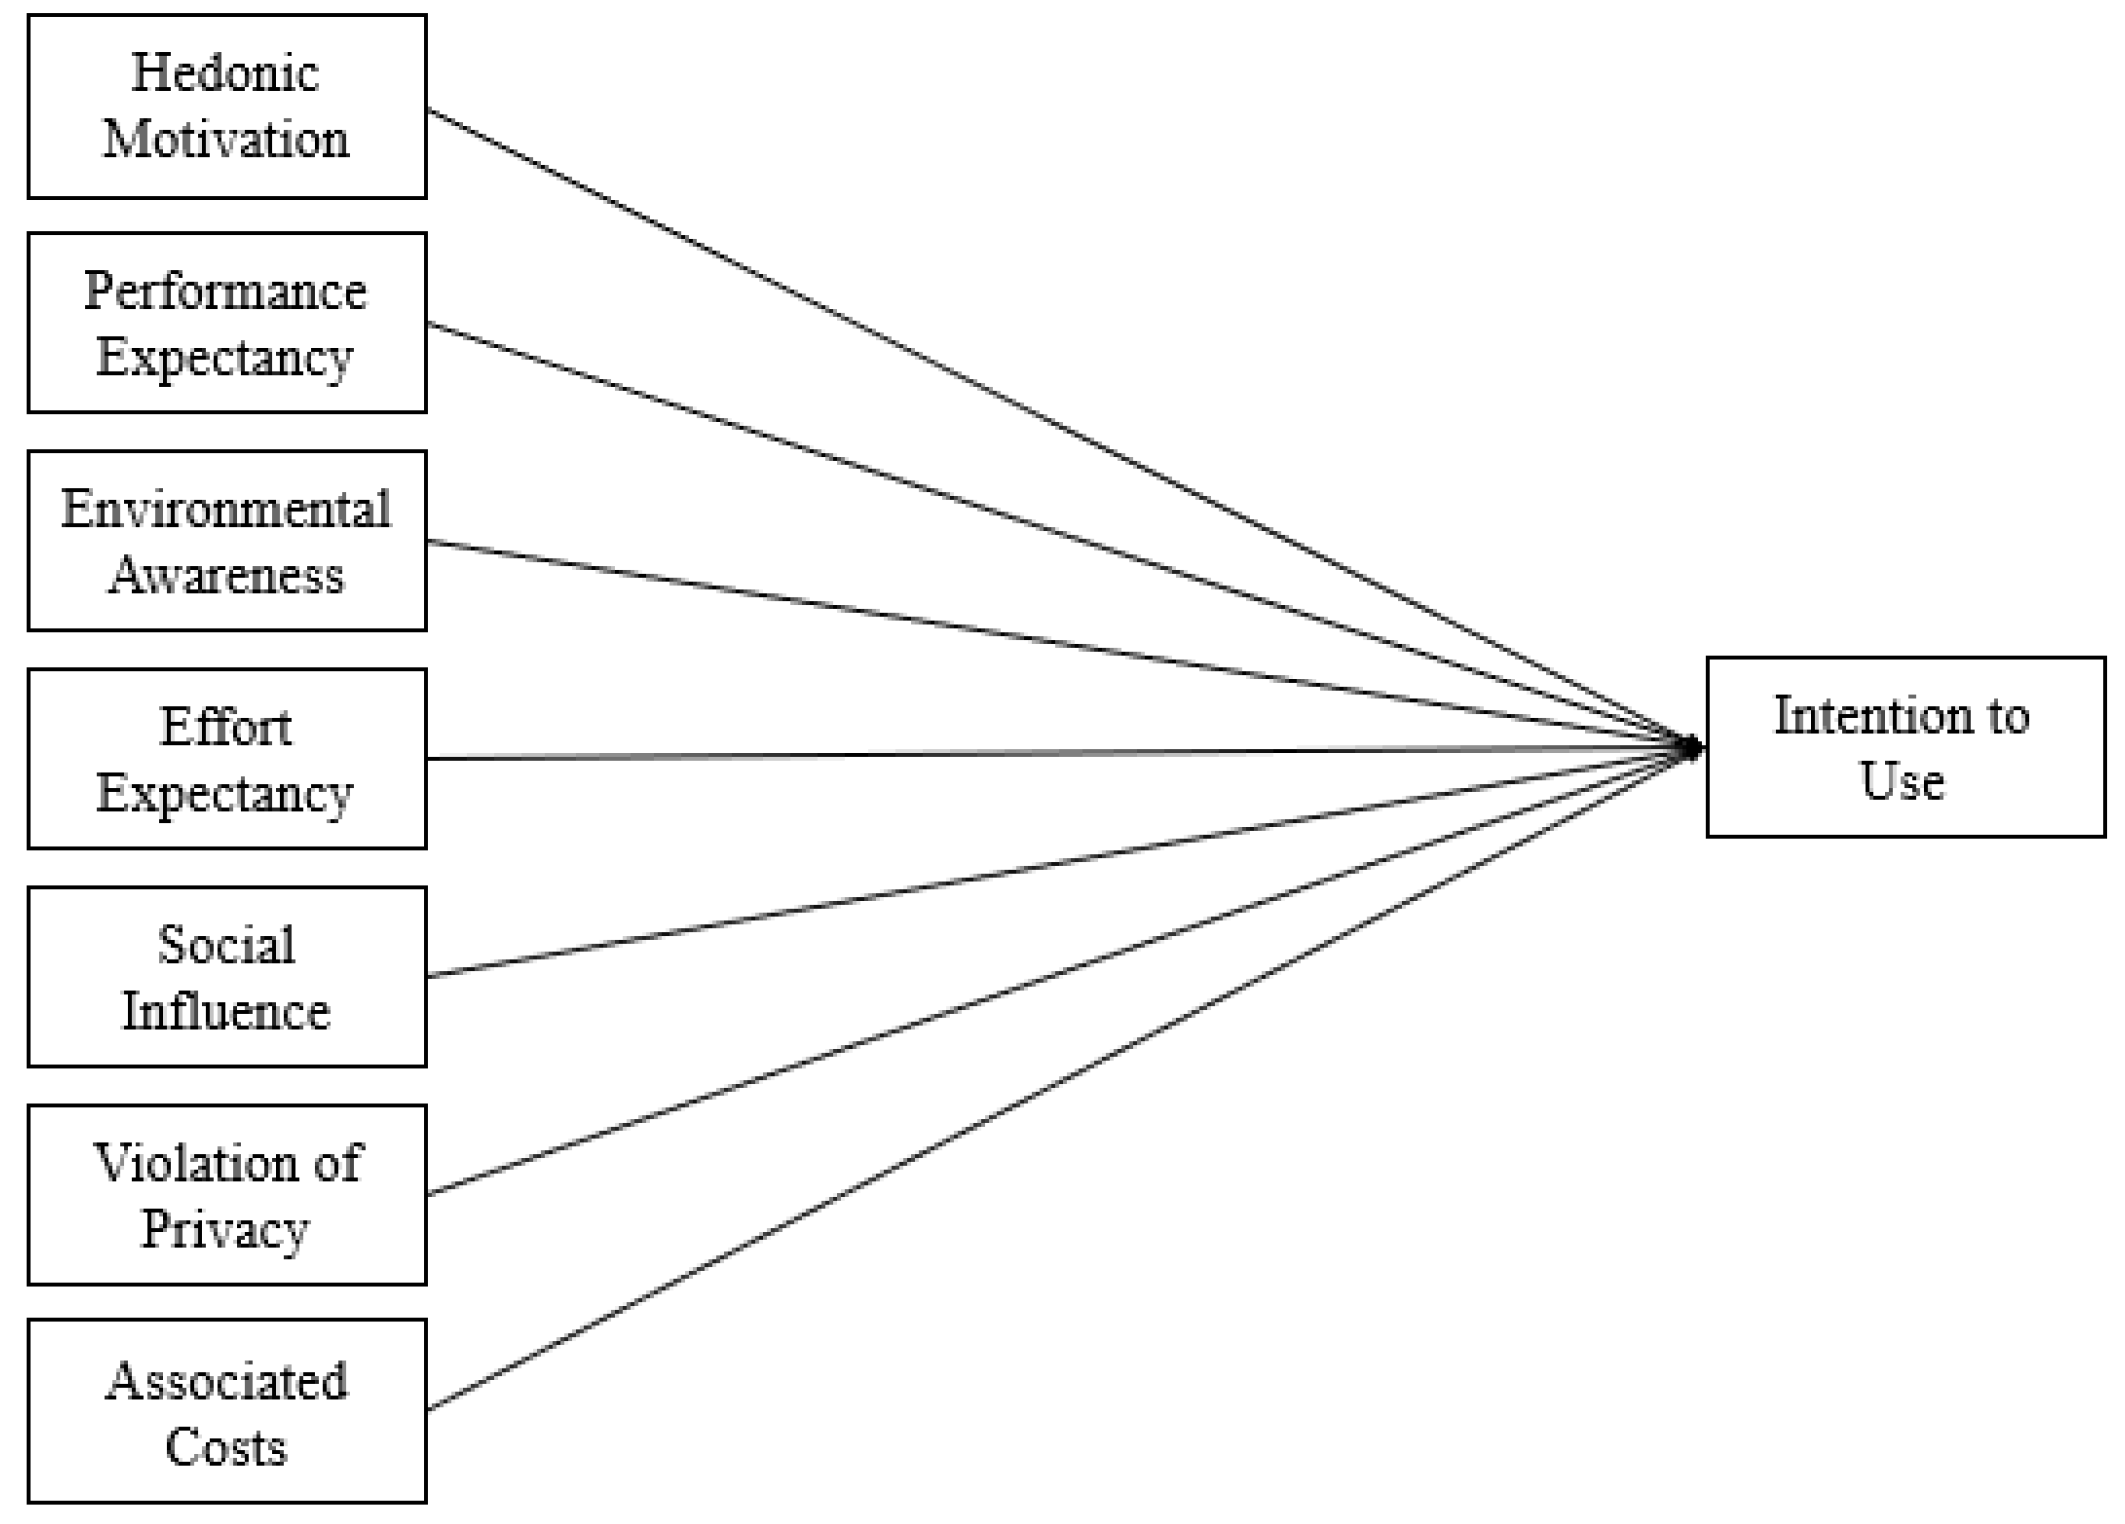
The UTAUT2 model was used as the base estimation model for this analysis because it is a recent theory and developed from previous theories, in addition to being considerably utilized to estimate the acceptance of smart meters in the literature, e.g., [37,38,39]. Even so, it was necessary to adapt the UTAUT2 model since the original model includes the relationship between the constructs Behavioral Intention > Use Behavior. The Use Behavior construct refers to consuming or using a specific technological product or service after purchasing it [35]. Users need to utilize the smart meter to measure the Use Behavior construct. Unfortunately, there are still no users in the population target who already use the smart meter, undermining User Behavior construct estimations. Moreover, the Habit, Price Value, and Facilitating Conditions constructs within the UTAUT2 model have been adapted and substituted with the Environmental Awareness, Associated Costs, and Violation of Privacy constructs. Environmental Awareness measures the extent to which individuals are concerned and informed about environmental shifts and the global warming issue [41]. In parallel, Violation of Privacy assesses the level of apprehension regarding the safeguarding of privacy and the security of consumer data [42]. Although not initially featured in the conventional UTAUT2 model, the inclusion of these constructs is imperative in acceptance models for new technologies that intersect sustainable energy and information technology, e.g., [4,42]. Associated Costs, another construct that diverges from the original UTAUT2 framework yet holds relevance in the context of smart meter acceptance, encompasses individual and social costs (subsidies) essential for the success of the implementation [41], particularly in Brazil, where the householders are responsible for paying for the meter [31]. The items used to build the AC and other constructs included in the proposed model were sourced from the literature (Appendix B). Some items were adapted for smart meter purposes and translated into Portuguese. Figure 1 displays the model proposed in this study.
The extant literature on smart meter acceptance encompasses various studies that utilize survey methods to construct and estimate acceptance models. These models are often grounded in established theories, such as the Theory of Reasoned Action (TRA) [43], the Theory of Planned Behavior (TPB) [44], the Technology Acceptance Model (TAM) [45], the Unified Theory of Acceptance and Use of Technology (UTAUT) [36] and its revised version, UTAUT2 [35]. Employing a compatibility analysis of the constructs proposed by Venkatesh et al. [36] makes it possible to gather the magnitude of the relationships in the proposed model (Figure 1) previously estimated in the literature. This analysis revealed 44 relationships that were also estimated using data from 15 different studies. A comprehensive compilation of these estimations of smart meter acceptance is presented in Appendix A. The findings of this literature review contribute to the analysis and discussion of the results in the present study.
2.2. Questionaire Building
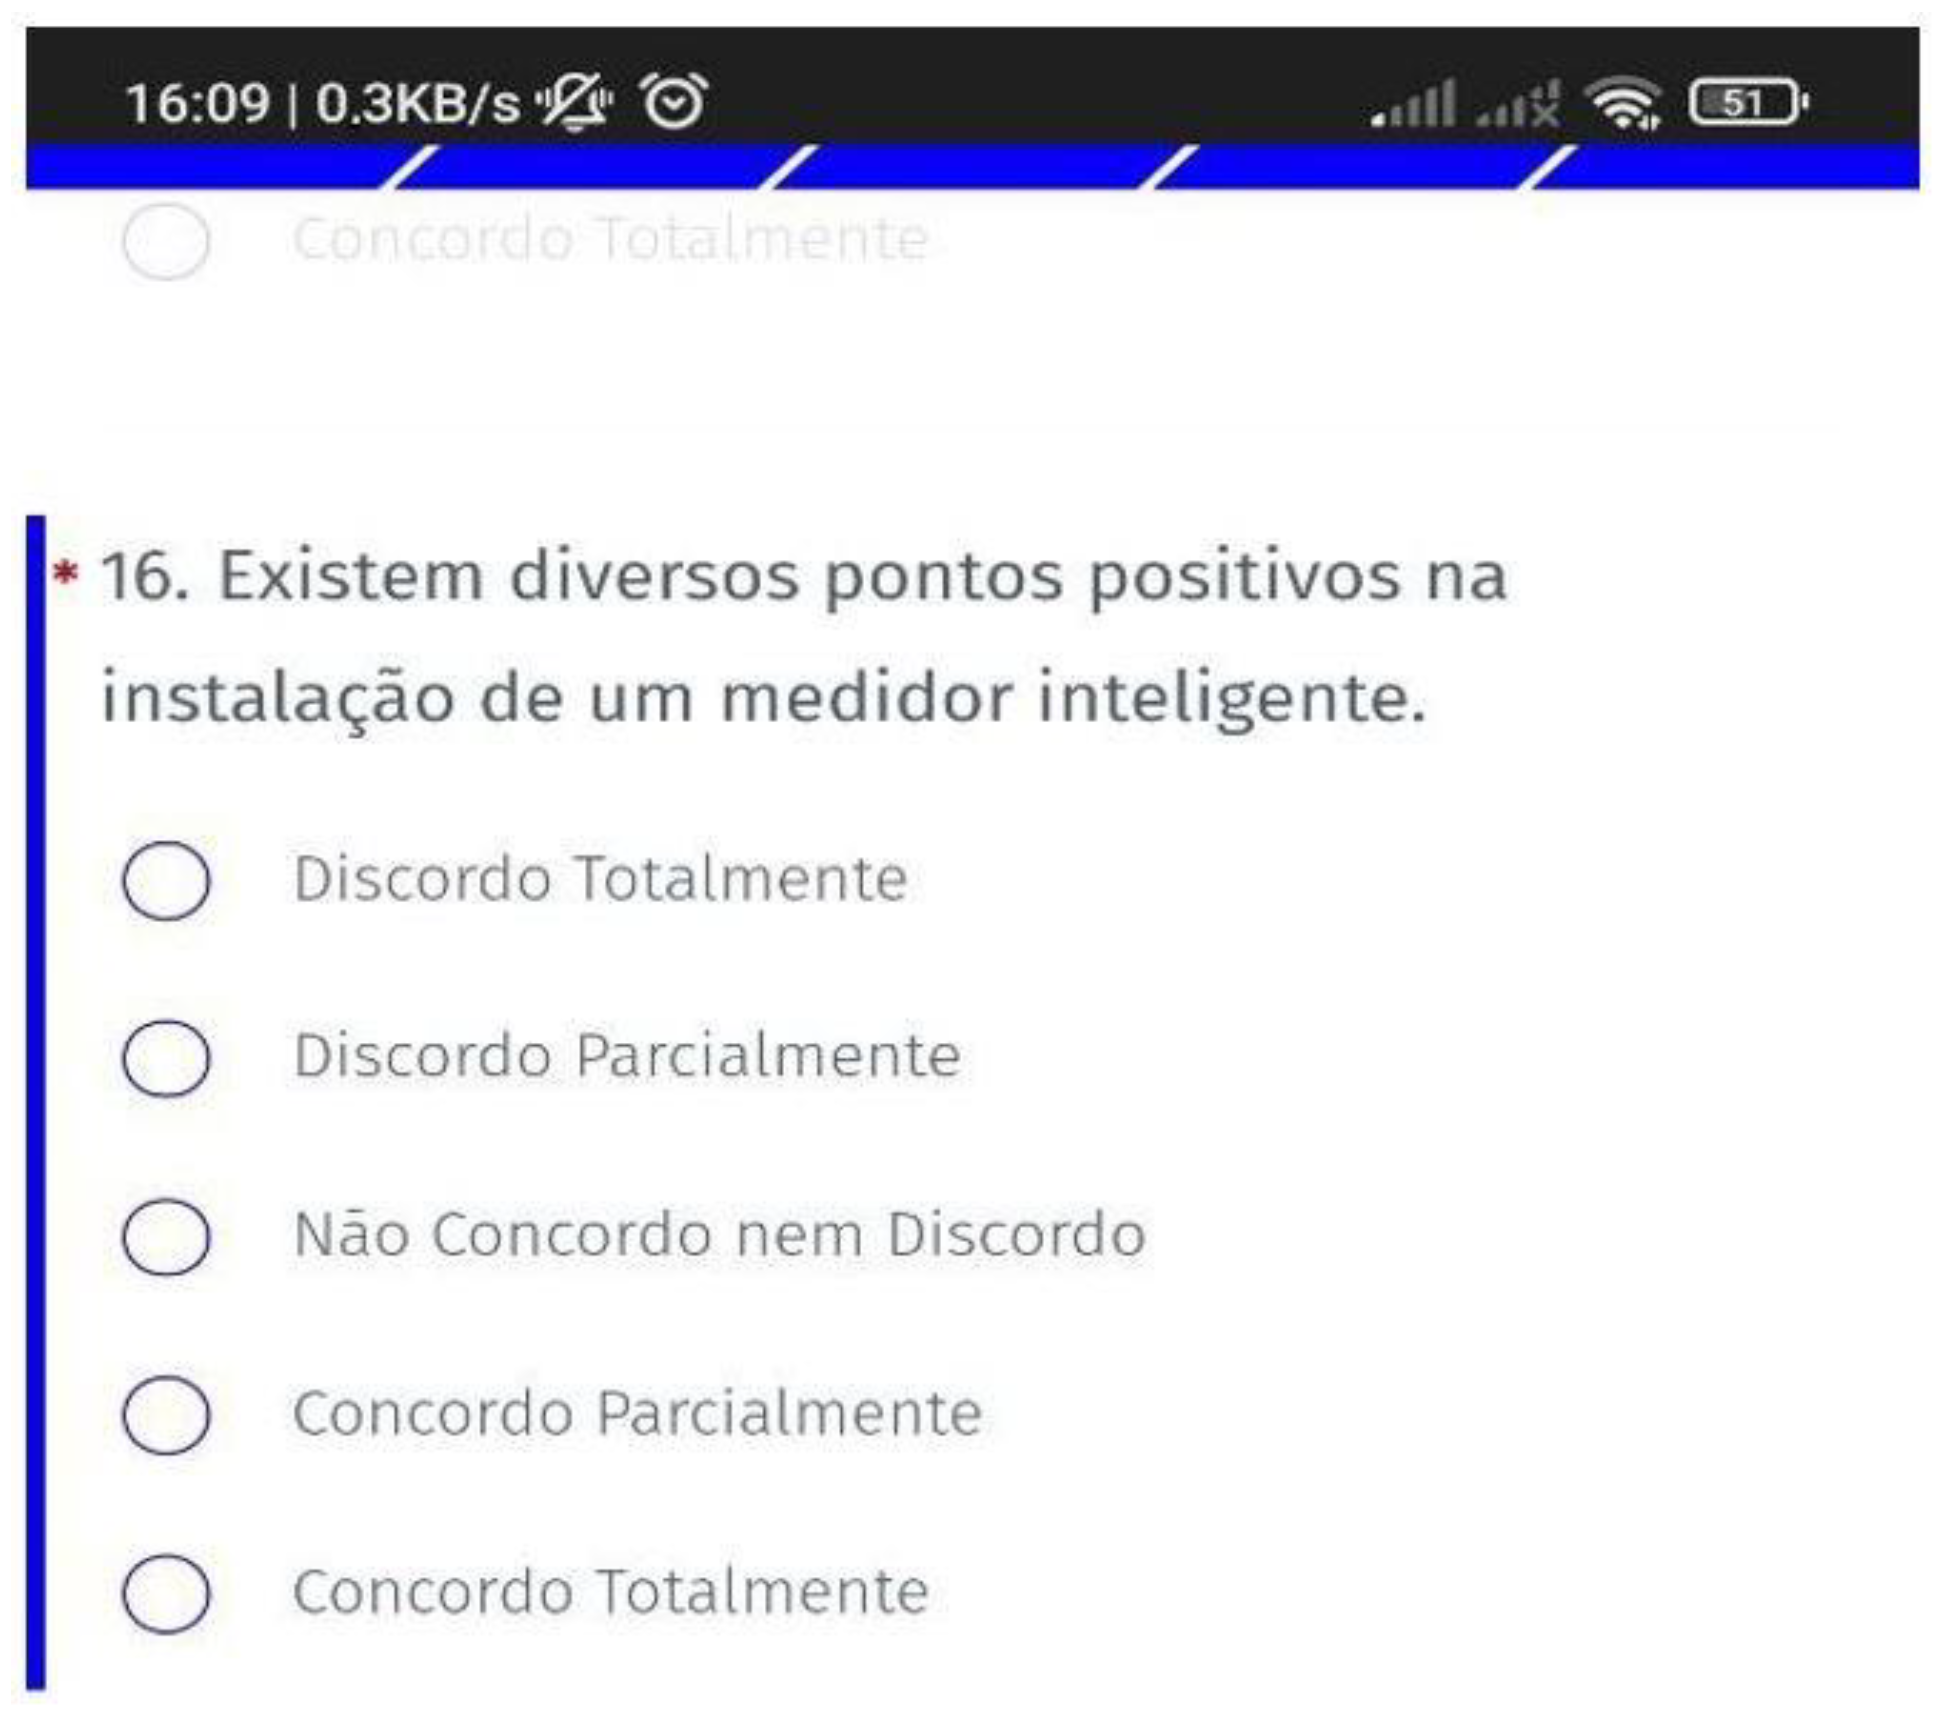
The questionnaire is divided into two main sections. In the first part, the socio-demographic characteristics of the respondents are collected, including information, such as age, gender, education level, type of housing, number of bedrooms, city, and neighborhood. The second part of the questionnaire measures respondents’ agreement or disagreement with 43 statements (Appendix B), each corresponding to measuring the constructs within the estimation model. For each item, respondents use a five-point Likert scale, where 1 represents “Strongly Disagree,” and 5 signifies “Strongly Agree.” All items used in the questionnaire are listed in Appendix B. A preview of the original mobile version of the questionnaire interface (for mobile devices) can be seen in Figure 2. The complete questionnaire is available at https://www.questionpro.com/a/TakeSurvey?tt=1vpL5VvhoAk%3D (accessed on 19 December 2023).
2.3. Estimation Model
Structural equation modeling (SEM) is a pivotal statistical tool in behavioral and social sciences, enabling the simultaneous examination of numerous interdependencies encapsulated by abstract concepts with statistical efficiency [46]. Two primary approaches exist for implementing SEM: the Partial Least Squares Structural Equation Modeling—PLS-SEM) and the Covariance Structural Equation Modeling—CB-SEM) [47]. PLS-SEM is the preferred choice for studies geared towards causal-predictive analysis, often applied in exploratory research, while CB-SEM is more suited for testing well-established theories, as it demands a more intricate theoretical foundation for its application [48]. Additionally, PLS-SEM excels in analyzing and resolving complex models, encompassing a multitude of variables, constructs, and data that do not conform to a multivariate normal distribution [49,50]. The utilization of PLS-SEM has made significant strides due to the introduction of new metrics for model evaluation, offering more options for assessing the consistency of estimated models [47,48,49]. Recent metrics aimed at evaluating discriminant validity and the overall model fit have enhanced the reliability of estimates [51]. In light of these considerations, the present study will use the PLS-SEM method and Smart PLS® v.3 software to estimate the proposed model.
In the assessment of convergent validity, it is essential to ensure that factor loadings exceed 0.707, revealing that at least 50% of the original variable (item) variance can be attributed to the corresponding latent variable [48,51]. For the reliability of constructs, the Composite Reliability (CR) should be greater than 0.7 for each construct [48,50]. Cronbach’s alpha is often recommended with values greater than 0.6 [46,48] to ensure the internal consistency of the constructs. Additionally, the Average Variance Extraction (AVE) should be greater than 0.5 [48,50,51]. These criteria collectively provide validity of the measurement model.
Discriminant validity is crucial as it measures the degree to which a construct is empirically distinct from other constructs within the structural model [51]. The conventional approach to evaluating discriminant validity is the Fornell and Larcker [52] approach, which suggests that the Average Variance Extraction (AVE) of each construct should be greater than the squared correlation between that construct and other constructs [53]. In PLS-SEM models, assessing discriminant validity is also recommended using the Heterotrait–Monotrait (HTMT) approach [48,49,50,51]. HTMT values below 0.85 indicate that the constructs are empirically distinct [49]. This multifaceted approach to assessing discriminant validity helps ensure that the model’s constructs are distinct and not unduly correlated.
The literature suggests using the Standardized Root Mean Square (SRMR) to evaluate the structural model, as it is a reference to measure the approximate fit and gather empirical evidence for the proposed model [48]. The SRMR values should be below 0.08, according to the literature [50]. In addition, this model will provide R2 values, Bayesian Information Criteria (BIC), and Akaike’s Information Criterion (AIC) as part of the assessment process. These metrics collectively help in evaluating the fit and performance of the structural model.
3. Results
This section is divided into five subsections. The first four subsections present results from the sample, common method bias, the measurement model, and the structural model, respectively. The fifth subsection presents the estimation results. The data analysis was conducted using Smart PLS® v.3 software. Further testing of the model’s predictive ability using alternative tools was not undertaken.
3.1. Sample
The questionnaire was disseminated through various social media platforms, text message groups, and professional and personal networks within the target population. We received a total of 203 responses to our questionnaire, with a response rate of 54.13%. Of the 203 responses, 65 were incomplete and two were from outside the geographic region of Joinville, resulting in 136 valid questionnaires (acceptance rate of 67%). Respondents took an average of 9 min to complete the valid questionnaires. Table 1 presents the sociodemographic characteristics of the sample, compared with data from the last available Census of Joinville’s population.
Table 1 highlights slight discrepancies between the sample and the general population regarding age and gender. The sample, on the whole, exhibits a higher quality of life, resulting in differences in variables, such as Education and Number of Bedrooms. Similarly, the difference in the Type of House variable can be attributed to a significant portion of the population residing in homes with substandard infrastructure, commonly referred to as favelas, which impacts the number of people living in houses. New technologies are typically adopted by this demographic segment first, so the higher income within the sample does not compromise the estimations, especially compared to similar studies [53]. Despite variations in Education, Type of Housing, and Number of Bedrooms between the sample and the population, the sample can be deemed suitable, especially compared to analogous studies, e.g., [53,54]. The similarity between the sample and the census data suggests that our findings are generalizable.
3.2. Common Method Bias
A typical challenge in survey data is Common Method Bias (CMB), which can bias the results [55]. The presence of CMB is especially concerning for self-report surveys [56]. To ensure that the survey instrument does not bias the estimations, we carefully examined all relationships between the constructs, and the VIF values within the models remained below 1.569, well below the limit of 3.3 recommended by the literature, e.g., [57]. The VIF values suggest that the survey instrument and/or method did not bias the model estimations.
3.3. Measurement Model
Table 2 summarizes the convergent validity of the proposed model. Factor loadings should be significant and greater than 0.707 [48,50,51]. Nineteen items were removed from the model due to low convergent validity. The proposed Associated Costs construct was also removed due to its low convergent validity. Validating the Associated Costs construct is challenging when assessing smart meter acceptance, as also found in the literature, e.g., [58]. All constructs had Composite Reliability (CR) values exceeding 0.70, as suggested in the literature [48]. Similarly, Cronbach’s alpha values were also satisfactory, above 0.7 [48,50]. All constructs had Average Variance Extraction (AVE) values exceeding 0.5, which is considered satisfactory [48,50], except for the Associated Costs construct, which was removed.
Discriminant validity is presented in Table 3 using the traditional approach [52] and in Table 4 the Heterotrait–Monotrait (HTMT) [48,49,50] approach. In Table 3 and Table 4, the bold type indicates the latent variables. In Table 3, the bold type also shows the square root of AVE in the diagonal, which must be greater than the correlation values to assure discriminant validity. The results indicate that all latent variables are sufficiently distinct, supporting the discriminant validity of the proposed model.
3.4. Structural Model
Table 5 presents the structural model evaluation results. The SRMR value is slightly higher than the 0.08 recommended in the literature [48,50], suggesting that the current model could be improved by adding more variables or moderating demographic factors. However, the study is valid, and further studies are needed to better understand the acceptance of smart meters in the analyzed population. The R2 values for the Intention of Use (IU) construct of UTAUT2 have moderate explanatory power, similar to those reported in other studies [59,60,61].
3.5. Estimations and Discussion
The relationships among the constructs, coefficients, and other indicators of the estimated model are presented in Table 6, derived from a bootstrap simulation of 5000 samples based on the dataset of 136 respondents from Joinville, Brazil. The coefficient value (β) indicates the strength of the relationship between constructs, and p-values determine the probability of confirming this relationship in the population.
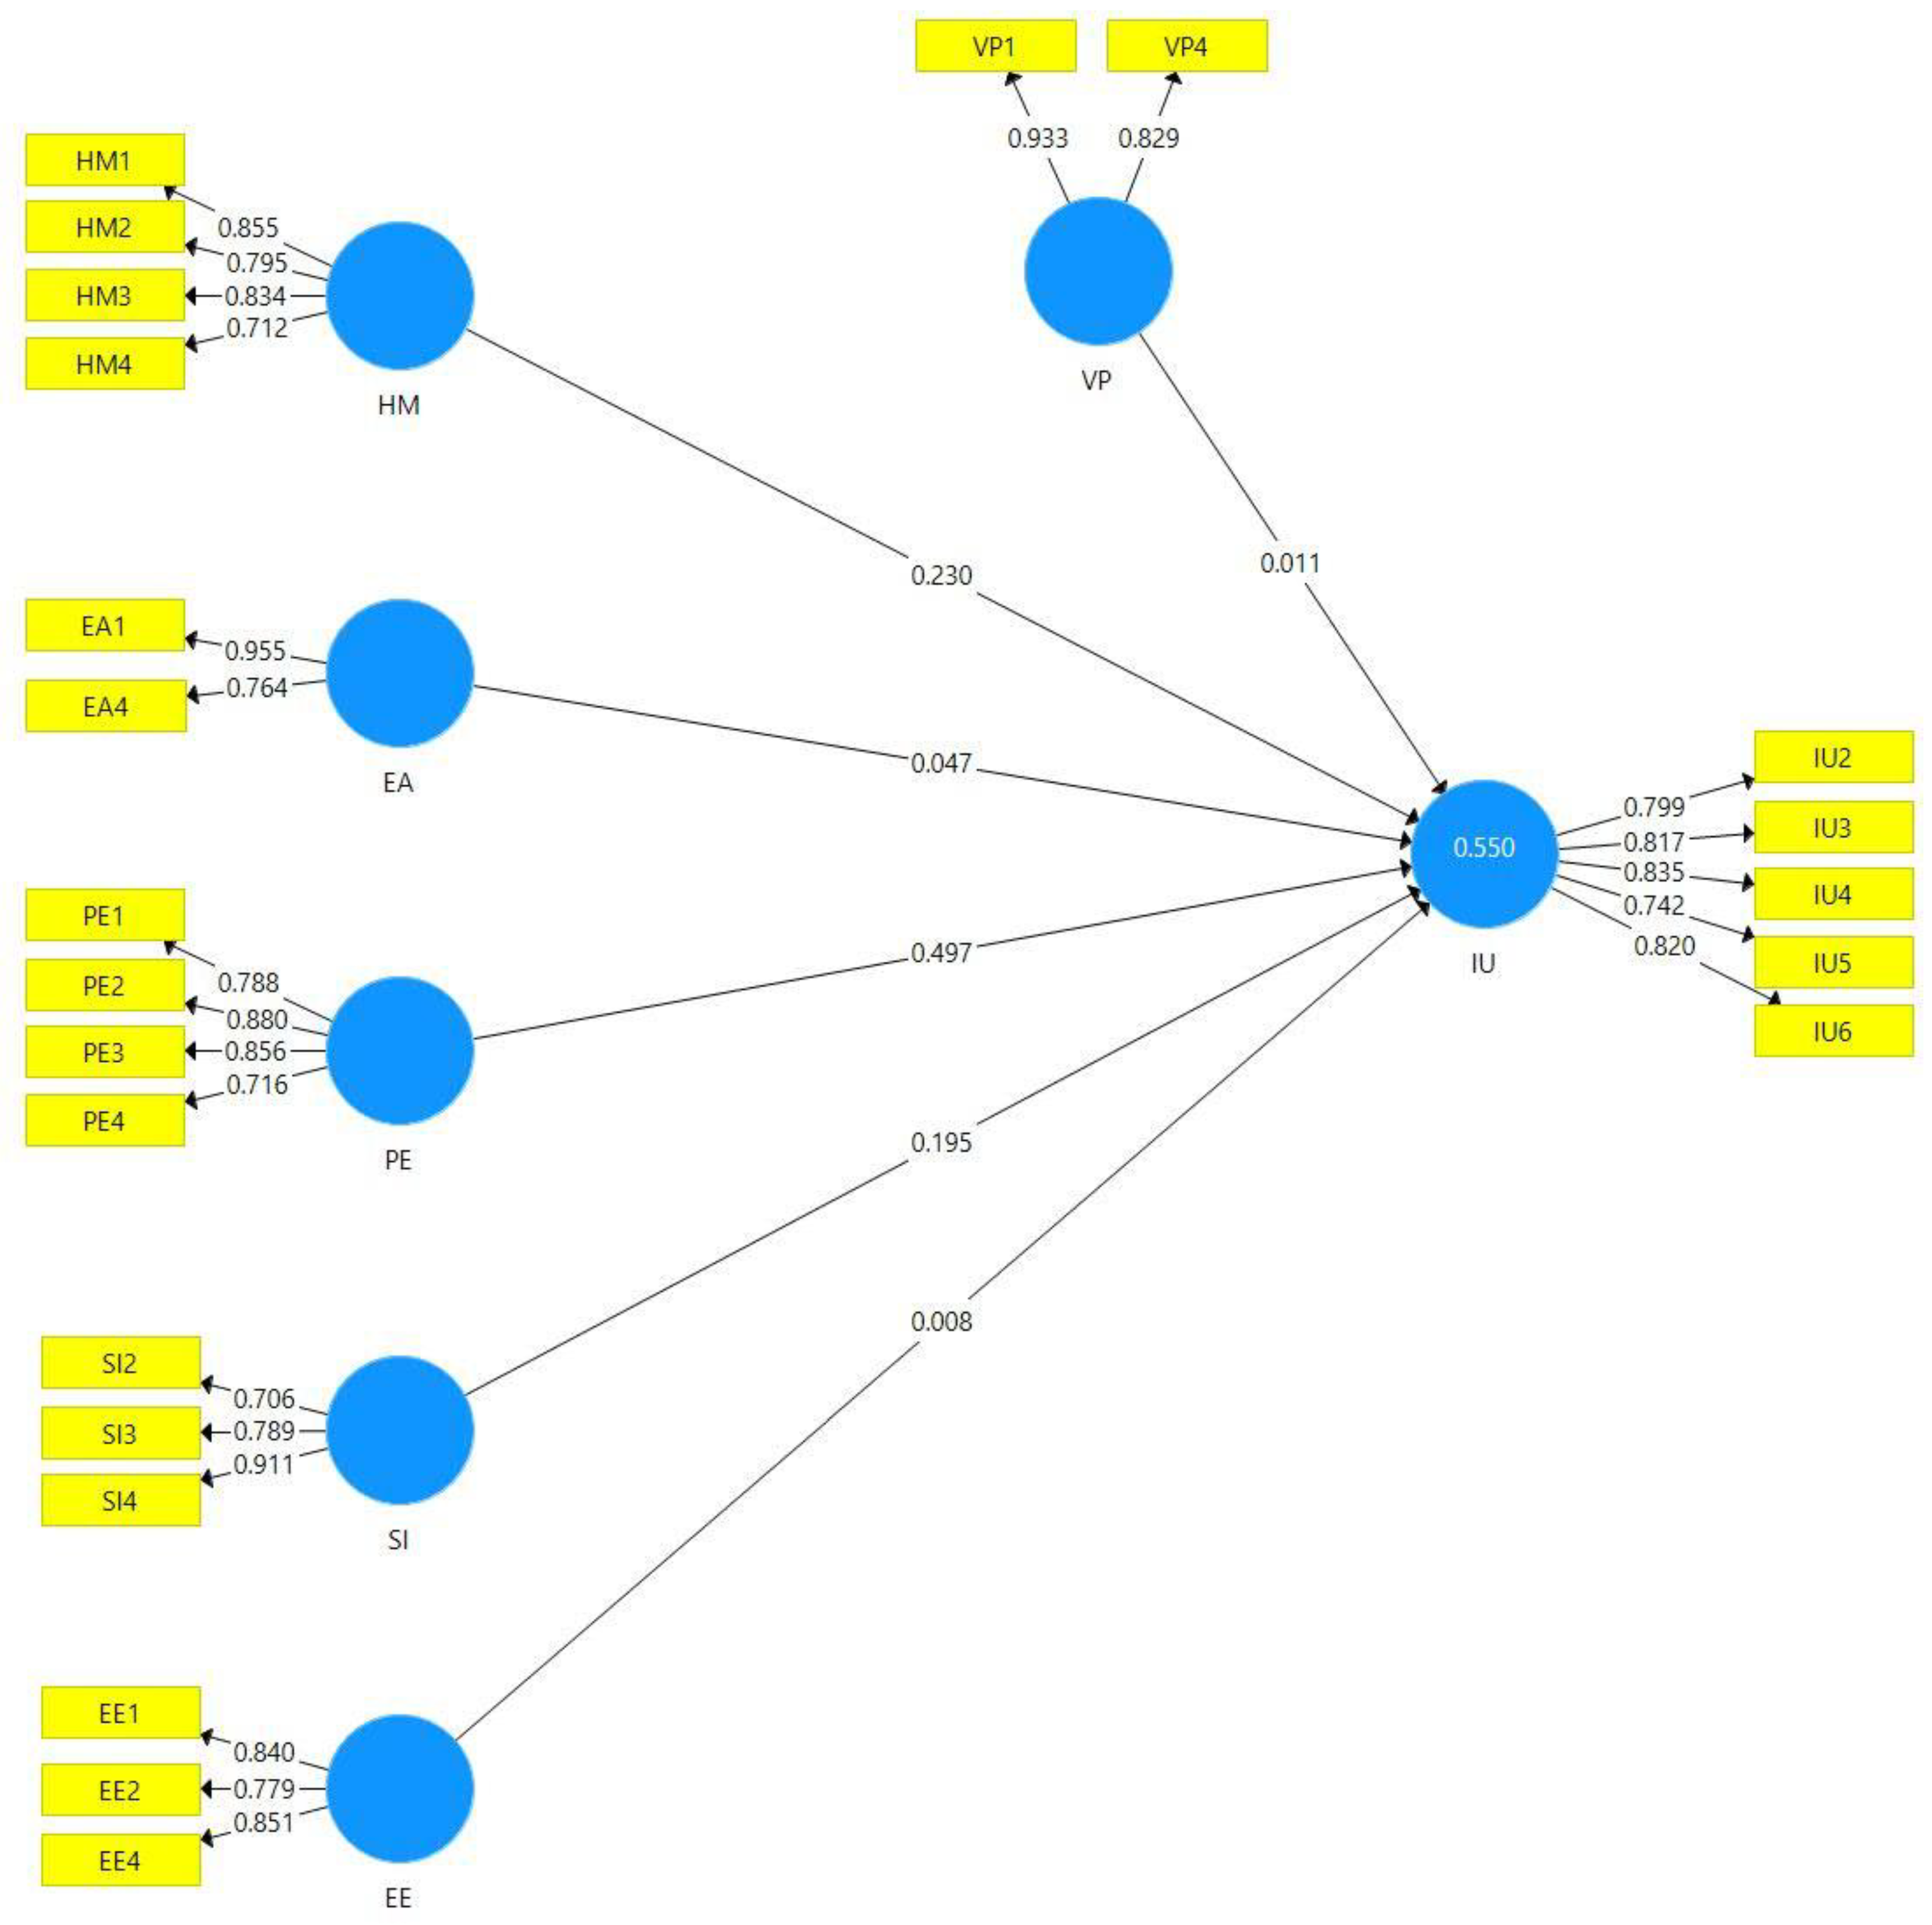
The results of the relationships between the constructs of the estimated model are also represented graphically in Figure 3.
4. Discussion
Performance Expectancy (PE) refers to how an individual believes using a particular technology will help them perform better at a given task or job [36]. In the case of smart meters, feedback provided to consumers is considered a critical factor in smart meter adoption [42,62] because it helps users achieve goals, such as reducing their daily energy consumption [63]. The relationship between PE and IU (β = 0.497; p-value < 0.001) was significant and the strongest of the seven constructs in the model. This result is consistent rk with the literature and previous studies on smart meter adoption in Republic of Korea and the USA [42,64,65].
Hedonic Motivation (HM) refers to the enjoyment and satisfaction that using a new technology provides rather than its functional benefits [35]. HM could influence the Intention to Use (IU) smart meters, reflecting an individual’s desire to use the device. As with Performance Expectancy (PE), the relationship between HM and IU is also significant in Joinville (β = 0.230; p-value < 0.001). However, the relationship is notably weaker than what has been reported in examinations conducted in Republic of Korea (β = 0.630) [11], Vietnam (β = 0.435) [11], and Indonesia (β = 0.505) [62]. Despite this, consumers in Joinville who find smart meters to be enjoyable to use will be more likely to accept them. Although there are few studies on this relationship, those suggest a positive effect of HM on IU, mainly when gamification interfaces are applied, e.g., [66,67]. Fensel et al. [66] also suggest that designing a user-friendly and intuitive platform to monitor and control energy consumption is paramount for improving the acceptance of smart meters. Given the limited number of studies on this relationship, further research is needed to investigate the effect of HM on the acceptance of smart meters.
Social influence (SI) refers to the degree to which an individual is susceptible to using a new technology because of the influence of other people or organizations that they consider essential [36]. Although this factor has already been frequently tested in the literature, it has become more critical due to the increasing use of social media [68]. SI was significantly related to IU (β = 0.195; p-value < 0.05) for the Joinville, SC sample. The estimated value is similar to those obtained by Warkentin et al. [38] (β = 0.208; p-value < 0.001) in the USA and Guerreiro et al. [9] (β = 0.108; p-value < 0.05) in Évora, Portugal. SI may be more important in Brazil because, according to a 2021 report by Hootsuite and WeAreSocial, Brazil is the third most active country on social media in the world, with users aged 13 or older spending an average of 3 h and 42 min per day on social media. This is more than in any other country except Colombia and the Philippines. Furthermore, 82.2 percent of Brazilians aged 13 or older are active social media users, compared to a global average of 53.3 percent [69]. The COVID-19 pandemic has accelerated the digital inclusion of older adults, who are now using smartphones and social media more to stay in touch with friends and family and to search for information and products that they are interested in [70]. This indicates that SI is becoming increasingly crucial for the acceptance of smart meters by the general population, not just younger individuals. Therefore, one strategy to boost the acceptance of smart meters is to use digital media as an ally, both through social networks and e-commerce, investing in the creation of content and dissemination on the topic.
Environmental Awareness (EA) is the degree to which people are concerned and aware of environmental changes and the problem of global warming [41]. Although not part of the traditional UTAUT2 model, EA is recommended for inclusion in acceptance models for new sustainable energy technologies, such as smart meters [4,42]. In this study, EA did not have a significant effect on UI (β = 0.047; p-value = 0.482). This result contradicts previous research on smart meter acceptance in Malaysia [4,40,42] and the USA [4,42]. Chen et al. [42] and Bugden and Stedman [4] note that a limitation of their studies is that they assume a positive relationship between EA and smart meter acceptance. For example, Chen et al. [43] report that 39.9% of their sample participants were liberal-leaning Democrats, who are more likely to have pro-environmental attitudes. Similarly, Bugden and Stedman [4] found that a large portion of their sample was from wealthier segments of the North American population, who are generally more favorable towards the environment and the benefits of smart meters. The Joinville sample also has higher purchasing power than the average population. However, the results suggest that the environmental factor is not yet decisive for smart meter acceptance. The non-significant EA may indicate that the estimated model lacks a better fit, perhaps requiring more variables or the moderation of socio-demographic factors to explain this factor.
Effort Expectancy (EE) encompasses concepts such as familiarity and perceived ease of use. It is defined as the individual’s perceived difficulty or ease in learning to use a specific technology [36]. Interestingly, in the present study, EE had no significant effect on Intention to Use (IU) (β = 0.008; p-value = 0.910), unlike all previous studies on smart meter acceptance, e.g., [4,9,40,65]. This result is contradictory, as EE comprises factors, such as ease of use and familiarity, which are recurrent in the literature as influencers of smart meter acceptance [19,59,71]. People who know little about this technology tend to judge it as complex [19]. Conversely, the easier a new technology seems to be to use, the greater its acceptance [58,65]. Again, the fact that the sample in this study had a higher income than the population average suggests they likely have access to many other smart devices. This greater familiarity with smart devices may increase familiarity with smart meters, making the relationship between EE and UI non-significant. Despite this, the result reinforces the need to test moderation with demographic variables for this relationship.
Violation of Privacy (VP) represents the degree of concern about ensuring the privacy and security of consumer data [58]. Like Environmental Awareness (EA), despite not being part of the traditional UTAUT2 model, these constructs should be incorporated into smart meter acceptance models [4,42]. Similar to Effort Expectancy (EE), the effect of VP on Intention to Use (IU) was not significant (β = 0.011; p-value = 0.869), which is opposite to the results of studies conducted in Malaysia [40] and the USA [4,42]. The issue of privacy violation is considered relevant in the digital world despite a lack of consensus in the literature on its effect on the intention to use residential smart meters. Recent studies provide evidence that concerns about hacker invasion, and the leakage and distribution of personal data are significant factors in the Intention to Use smart meters, e.g., [38,40,42,62]. However, other studies have not found significant results in this relationship, e.g., [72]. For example, Wunderlich et al. [72] reported that smart meter technology is still in its early stages in Germany, which suggests that people may evaluate privacy violations as less important than the potential benefits that this new technology can offer. The specific situation in Joinville and other Brazilian cities, where physical violence and property crime are high, may also contribute to survey respondents being less concerned about privacy and data protection. The non-significance of the relationship between VP and IU associated with the target sample/population reinforces the need to test moderation with demographic variables for this relationship.
Finally, of the other constructs analyzed, only Associated Costs (ACs) were not validated, as they did not achieve satisfactory results in the Measurement Model, and it was removed from the estimated model. Although AC is not originally incorporated into UTAUT2, it is a relevant factor for smart meter acceptance, as it is defined as the personal financial and social costs (subsidies) required to make the initial investment effective [41]. However, as Gumz et al. [58] have noted, validation problems related to the AC construct are common when estimating smart meter acceptance. This suggests that more consistent items should be included to enable the estimation of this relationship in future research.
5. Conclusions
This article assessed the factors influencing the acceptance of residential smart meters in Joinville, a city in the south of Brazil. The PLS-SEM model was estimated using 136 responses from the population. Focusing on a particular city provides more reliable estimations by eliminating specific factors that could affect the results.
This article provides several managerial implications for the more efficient implementation of smart meters in Brazil, particularly in the city of Joinville. Although the sample is limited to one city, the cultural and climate similarity between other cities in southern Brazil suggests that these results can be generalized to a much wider region. Performance Expectancy, Hedonic Motivation, and Social Influence were found to have a significant impact on the acceptance of smart meters by the study population. Developing public policies and communication strategies focused on these factors is essential to reduce potential consumer resistance, as seen in several other smart meter implementation projects. Moreover, the results contribute to the smart grid implementation, which depends entirely on the smart meter.
Among the theoretical contributions of this study is the limited amount of research on smart meter acceptance in South American populations. Furthermore, some of the estimated relationships suggest new directions for future research, such as the non-significance of the relationships between Violation of Privacy (VP) and Associated Costs (ACs) constructs and the Intention to Use (IU) construct. The higher level of violence in Brazil may reduce the perceived risk of personal data exposure, unlike what is seen in populations with higher levels of security, such as in the United States, e.g., [4,42]. Understanding the factors contributing to lower perceptions of privacy-related problems in Brazil can enable the development of solutions to facilitate the use of consumption data from smart meters.
The study’s findings are derived from a specific sample, and the generalizability of these results to the broader population may be limited. The study’s limitations acknowledge the potential for biases arising from the sampling procedure and the need for further research to assess the predictive accuracy of the proposed model.
Author Contributions
Conceptualization, D.F. and P.C.; methodology, D.F., P.C. and A.S.; formal analysis, D.F. and P.C.; investigation, D.F. and P.C.; resources, D.F. and P.C.; writing—original draft preparation, D.F. and P.C.; writing—review and editing, D.F., P.C., J.C. and A.S.; visualization, D.F., P.C., J.C. and A.S.; funding acquisition, D.F. All authors have read and agreed to the published version of the manuscript.
Funding
This research was funded by National Council for Scientific and Technological Development: 401432/2022-0 and Fundação de Amparo à Pesquisa e Inovação de Santa Catarina: 2022TR001415 and the APC was waived by MDPI.
Data Availability Statement
The data presented in this study is unavailable due to the privacy procedures and legal terms.
Conflicts of Interest
The authors declare no conflict of interest.
Appendix A. Previous Estimations of Smart Meter Acceptance in the Literature
| Reference | Sample Size | Country | Coefficient (β) |
| Performance Expectancy → Behavioral Intention to Use | |||
| [9] | 515 | Portugal | 0.128 |
| [37] | 453 | Germany | 0.140 |
| [37] | 453 | Germany | 0.150 |
| [40] | 318 | Malaysia | 0.254 |
| [40] | 318 | Malaysia | 0.275 |
| [42] | 711 | USA | 0.140 |
| [42] | 711 | USA | 0.670 |
| [65] | 255 | Republic of Korea | 0.614 |
| [64] | 287 | Republic of Korea | 0.551 |
| [71] | 227 | Saudi Arabia | −0.00151 |
| [11] | 270 | Taiwan | 0.263 |
| [11] | 211 | Republic of Korea | 0.351 |
| 292 | Taiwan | 0.160 | |
| Effort Expectancy → Behavioral Intention to Use | |||
| [13] | 609 | EUA | 0.350 |
| [9] | 515 | Portugal | 0.100 |
| [40] | 318 | Malaysia | 0.219 |
| [40] | 318 | Malaysia | 0.228 |
| [40] | 318 | Malaysia | 0.135 |
| [65] | 255 | Republic of Korea | 0.209 |
| [64] | 287 | Republic of Korea | 0.195 |
| [11] | 270 | Taiwan | 0.364 |
| Social Influence → Behavioral Intention to Use | |||
| [9] | 515 | Portugal | 0.108 |
| [38] | 229 | EUA | 0.208 |
| [40] | 318 | Malaysia | −0.016 |
| [73] | 1035 | USA | 0.08 |
| [74] | 292 | Taiwan | 0.087 |
| Hedonic Motivation → Behavioral Intention to Use | |||
| [62] | 301 | Indonesia | 0.505 |
| [73] | 211 | Republic of Korea | 0.630 |
| [73] | 211 | Vietnam | 0.435 |
| Associated Costs → Behavioral Intention to Use | |||
| [13] | 609 | USA | 0.210 |
| [9] | 515 | Portugal | −0.166 |
| [38] | 229 | USA | −0.145 |
| [42] | 711 | USA | −0.150 |
| [65] | 255 | Republic of Korea | −0.198 |
| [11] | 270 | Taiwan | 0.472 |
| [73] | 1035 | USA | −0.343 |
| [74] | 292 | Taiwan | −0.179 |
Appendix B
| Code | Ref. | Item Utilized in the Questionnaire (Portuguese) | Original Item in English |
| HM1 | [75] | Gosto de experimentar novas tecnologias. | I like to experiment with new (information) technologies. |
| HM2 | [75] | Eu gosto de testar coisas novas. | I like to try new things. |
| HM3 | [75] | Quero ser sempre o primeiro a testar novas tecnologias. | Among my fellows, I am usually the first to try out new information technology. |
| HM4 | [67] | Eu gosto de usar novos aplicativos e novos dispositivos. | I like using new gadgets and apps. |
| HM5 | [76] | Eu gosto de acompanhar desenvolvimentos tecnológicos na tv e na internet. | I like to follow the technical developments in newspapers and TV |
| PE1 | [65] | O medidor inteligente fornece informações importantes para mim. | The smart grid provides useful information for me. |
| PE2 | [77] | O medidor inteligente ajuda no meu controle do consumo de energia. | Because of the programme, I will have a better overview ofmy electricity consumption. |
| PE3 | [77] | O medidor inteligente vai contribuir para reduzir minha conta de luz. | The programme will reduce my electricity bill. |
| PE4 | [11] | Os medidores inteligentes vão ajudar a melhorar a qualidade do fornecimento de energia. | I expect, a smart meter would improve the reliability and quality of energy supplied and service from the utility. |
| PE5 | [77] | Os medidores inteligentes ajudam a diminuir as quedas de energia. | Because of the programme, there will be fewer blackouts in the future. |
| EA1 | [78] | O problema das mudanças climáticas é muito importante para mim. | I put emphasis on the issue of climate change. |
| EA2 | [78] | A substituição dos combustíveis fósseis por energias renováveis é muito importante para mim. | I put emphasis on the issue of renewable energy. |
| EA3 | [71] | Gostaria de consumir energia elétrica de fontes renováveis. | You would like to buy ‘‘green’’ electricity |
| EA4 | [78] | Me importo com as emissões de gases do efeito estufa na atmosfera. | I put emphasis on the issue of global CO2 emission. |
| EA5 | [42] | É importante considerar o impacto ambiental da geração de energia elétrica. | I am concerned about energy shortage. |
| EE1 | [35] | O medidor inteligente parece ser fácil de se usar. | Learning to operate the system would be easy for me. |
| EE2 | [11] | Parece ser fácil aprender sobre o que são os medidores inteligentes. | I expect, learning about and understanding smart meters would be easy for me. |
| EE3 | [67] | Uso equipamentos inteligentes (smart) no meu dia-a-dia. | I use office electronic devices (computer, printer, etc.) for my work or at home on a daily basis. |
| EE4 | [62] | É fácil acompanhar o consumo de energia no display do medidor inteligente. | I would have no difficulty reading the information on smart meter in-house display. |
| EE5 | [67] | É fácil utilizar equipamentos inteligentes (smart). | I like using new gadgets and apps. |
| SI1 | [36] | Pessoas com as quais eu me importo recomendariam o uso do medidor inteligente. | People who are important to me think that I should use the system. |
| SI2 | [11] | Eu instalaria um medidor inteligente se isso fosse recomendado pelo governo. | I will install a smart meter in my house if it is a government policy |
| SI3 | [11] | Eu instalarei um medidor inteligente se as pessoas das minhas redes sociais também instalarem. | I will install a smart meter in my house if people in my social network do. |
| SI4 | [73] | Meus amigos vão gostar se eu usar o medidor inteligente. | My friends want me to use the most advanced technologies available. |
| SI5 | [36] | Eu instalarei um medidor inteligente se meus colegas de trabalho acharem que é uma boa ideia. | I use the system because of the proportion of coworkers who use the system. |
| VP1 | [79] | Quero que minhas informações privadas estejam seguras. | I am concerned that a person can find private information about me on the Internet. |
| VP2 | [65] | Quero estar seguro contra ataques de hackers. | The smart grid can be attacked by cyber hackers. |
| VP3 | [11] | Quero que minha casa esteja segura contra invasões e arrombamentos. | I expect that my privacy would not be compromised by a smart meter in my house. |
| VP4 | [38] | A privacidade dos meus dados na internet é muito importante para mim. | It is very important to me that I am aware and knowledgeable about how my personal electrical usage information will be used. |
| VP5 | [38] | Quero que meus equipamentos inteligentes protejam meus dados. | I trust that my electric company would keep my best interests in mind when dealing with my electrical usage data. |
| AC1 | [80] | Estou ciente do custo para se implementar novas tecnologias. | I am aware of the cost of deploying the technologies. |
| AC2 | [77] | A economia de energia não compensa o custo do medidor inteligente. | The programme will increase my electricity bill. |
| AC3 | [74] | Ter que pagar para ter o medidor inteligente me incomodaria. | Using the SM device will have much additional cost. |
| AC4 | [11] | Há custos para a implementação de medidor inteligente em minha casa. | I expect there are no additional cost are associated with installing a smart meter in my house |
| AC5 | [9] | A mudança para a rede elétrica inteligente gera custos financeiros e problemas de saúde. | The EB may bring more risks to my health and my family |
| IU1 | [36] | Existem diversos pontos positivos na instalação de um medidor inteligente. | Using the system is a bad/good idea. |
| IU2 | [42] | Pretendo usar o medidor inteligente quando ele estiver disponível. | I intend to use a smart meter when the opportunity arises. |
| IU3 | [74] | Eu gostaria de utilizar um medidor inteligente em minha residência. | I intend to use the SM device. |
| IU4 | [38] | Gostaria que a companhia elétrica instalasse um medidor inteligente em minha residência. | Given these circumstances, installing smart meters at my home would be a good idea. |
| IU5 | [13] | As pessoas deveriam usar medidores inteligentes. | Smart meters would benefit my community |
| IU6 | [13] | Estou empolgado para ter um medidor inteligente em minha residência. | I would be excited to have a smart meter in my home |
References
- IPCC. Intergovernmental Panel on Climate Change; Paris. 2021. Available online: https://www.ipcc.ch/2021/08/09/ar6-wg1-20210809-pr/ (accessed on 30 November 2023).
- Hossain, M.S.; Madlool, N.A.; Rahim, N.A.; Selvaraj, J.; Pandey, A.K.; Khan, A.F. Role of Smart Grid in Renewable Energy: An Overview. Renew. Sustain. Energy Rev. 2016, 60, 1168–1184. [Google Scholar] [CrossRef]
- Ellabban, O.; Abu-Rub, H. Smart Grid Customers’ Acceptance and Engagement: An Overview. Renew. Sustain. Energy Rev. 2016, 65, 1285–1298. [Google Scholar] [CrossRef]
- Bugden, D.; Stedman, R. Unfulfilled Promise: Social Acceptance of the Smart Grid. Environ. Res. Lett. 2021, 16, 034019. [Google Scholar] [CrossRef]
- Goulden, M.; Bedwell, B.; Rennick-Egglestone, S.; Rodden, T.; Spence, A. Smart Grids, Smart Users? The Role of the User in Demand Side Management. Energy Res. Soc. Sci. 2014, 2, 21–29. [Google Scholar] [CrossRef]
- Gumz, J.; Fettermann, D.C. Better Deployments Come with Acceptance: An Investigation of Factors Driving Consumers’ Acceptance of Smart Meters. Curr. Sustain./Renew. Energy Rep. 2023, 10, 23–35. [Google Scholar] [CrossRef]
- Hess, D.J.; Coley, J.S. Wireless Smart Meters and Public Acceptance: The Environment, Limited Choices, and Precautionary Politics. Public Underst. Sci. 2014, 23, 688–702. [Google Scholar] [CrossRef]
- Jegen, M.; Philion, X.D. Power and Smart Meters: A Political Perspective on the Social Acceptance of Energy Projects. Can. Public Adm. 2017, 60, 68–88. [Google Scholar] [CrossRef]
- Guerreiro, S.; Batel, S.; Lima, M.L.; Moreira, S. Making Energy Visible: Sociopsychological Aspects Associated with the Use of Smart Meters. Energy Effic. 2015, 8, 1149–1167. [Google Scholar] [CrossRef]
- Krishnamurti, T.; Schwartz, D.; Davis, A.; Fischhoff, B.; de Bruin, W.B.; Lave, L.; Wang, J. Preparing for Smart Grid Technologies: A Behavioral Decision Research Approach to Understanding Consumer Expectations about Smart Meters. Energy Policy 2012, 41, 790–797. [Google Scholar] [CrossRef]
- Chou, J.-S.; Kim, C.; Ung, T.-K.; Yutami, I.G.A.N.; Lin, G.-T.; Son, H. Cross-Country Review of Smart Grid Adoption in Residential Buildings. Renew. Sustain. Energy Rev. 2015, 48, 192–213. [Google Scholar] [CrossRef]
- Buchanan, K.; Banks, N.; Preston, I.; Russo, R. The British Public’s Perception of the UK Smart Metering Initiative: Threats and Opportunities. Energy Policy 2016, 91, 87–97. [Google Scholar] [CrossRef]
- Bugden, D.; Stedman, R. A Synthetic View of Acceptance and Engagement with Smart Meters in the United States. Energy Res. Soc. Sci. 2019, 47, 137–145. [Google Scholar] [CrossRef]
- Bertoldo, R.; Poumadère, M.; Rodrigues, L.C., Jr. When Meters Start to Talk: The Public’s Encounter with Smart Meters in France. Energy Res. Soc. Sci. 2015, 9, 146–156. [Google Scholar] [CrossRef]
- Throndsen, W. What Do Experts Talk about When They Talk about Users? Expectations and Imagined Users in the Smart Grid. Energy Effic. 2017, 10, 283–297. [Google Scholar] [CrossRef]
- Kumar, A. Beyond Technical Smartness: Rethinking the Development and Implementation of Sociotechnical Smart Grids in India. Energy Res. Soc. Sci. 2019, 49, 158–168. [Google Scholar] [CrossRef]
- Dranka, G.G.; Ferreira, P. Towards a Smart Grid Power System in Brazil: Challenges and Opportunities. Energy Policy 2020, 136, 111033. [Google Scholar] [CrossRef]
- Alkawsi, G.A.; Bte. Ali, N. A Systematic Review of Individuals’ Acceptance of IOT-Based Technologies. Int. J. Eng. Technol. 2018, 7, 136. [Google Scholar] [CrossRef]
- Boudet, H.S. Public Perceptions of and Responses to New Energy Technologies. Nat. Energy 2019, 4, 446–455. [Google Scholar] [CrossRef]
- Buchanan, K.; Russo, R.; Anderson, B. The Question of Energy Reduction: The Problem(s) with Feedback. Energy Policy 2015, 77, 89–96. [Google Scholar] [CrossRef]
- Darby, S. Smart Metering: What Potential for Householder Engagement? Build. Res. Inf. 2010, 38, 442–457. [Google Scholar] [CrossRef]
- Jaramillo, N.C.; Cardona, C.J.F.; Henao, J.D.V. Smart Meters Adoption: Recent Advances and Future Trends. Dyna 2014, 81, 221–230. Available online: https://revistas.unal.edu.co/index.php/dyna/issue/download/3691/402#page=225 (accessed on 30 November 2023). [CrossRef]
- van de Kaa, G.; Fens, T.; Rezaei, J.; Kaynak, D.; Hatun, Z.; Tsilimeni-Archangelidi, A. Realizing Smart Meter Connectivity: Analyzing the Competing Technologies Power Line Communication, Mobile Telephony, and Radio Frequency Using the Best Worst Method. Renew. Sustain. Energy Rev. 2019, 103, 320–327. [Google Scholar] [CrossRef]
- Yang, B.; Liu, S.; Gaterell, M.; Wang, Y. Smart Metering and Systems for Low-Energy Households: Challenges, Issues and Benefits. Adv. Build. Energy Res. 2019, 13, 80–100. [Google Scholar] [CrossRef]
- Gumz, J.; Fettermann, D.C. What Improves Smart Meters’ Implementation? A Statistical Meta-Analysis on Smart Meters’ Acceptance. Smart Sustain. Built Environ. 2022, 11, 1116–1136. [Google Scholar] [CrossRef]
- IBGE (Instituto Brasileiro de Geografia e Estatistica). Estimativas Da População; IBGE: Brasilia, Brazil, 2021. Available online: https://ftp.ibge.gov.br/Estimativas_de_Populacao/Estimativas_2021/estimativa_dou_2021.pdf (accessed on 5 December 2022).
- REN21 (Renewable Energy Policy Network for the 21st Century). Renewables 2018: Global Status Report; REN21: Paris, France, 2018; Available online: https://opus.lib.uts.edu.au/bitstream/10453/142688/2/GSR2018_Full-Report_English.pdf (accessed on 19 December 2023).
- Aneel—Agência Nacional de Energia Elétrica. Tarifa Branca; ANEEL: Brasilia, Brazil, 2015. Available online: https://www.gov.br/aneel/pt-br/assuntos/tarifas/tarifa-branca (accessed on 19 December 2023).
- Rivera, R.; Esposito, A.S.; Teixeira, I. Redes Elétricas Inteligentes (Smart Grid): Oportunidade Para Adensamento Produtivo e Tecnológico Local; BNDES: Rio de Janeiro, Brazil, 2013. Available online: https://web.bndes.gov.br/bib/jspui/bitstream/1408/2927/1/RB%2040%20Redes%20el%C3%A9tricas%20inteligentes_P.pdf (accessed on 19 December 2023).
- Gumz, J.; Fettermann, D.C.; Frazzon, E.M.; Kück, M. Using Industry 4.0’s Big Data and IoT to Perform Feature-Based and Past Data-Based Energy Consumption Predictions. Sustainability 2022, 14, 13642. [Google Scholar] [CrossRef]
- de, A. Dantas, G.; de Castro, N.J.; Dias, L.; Antunes, C.H.; Vardiero, P.; Brandão, R.; Rosental, R.; Zamboni, L. Public Policies for Smart Grids in Brazil. Renew. Sustain. Energy Rev. 2018, 92, 501–512. [Google Scholar] [CrossRef]
- Moro, S.R.; Imhof, A.C.; Fettermann, D.C.; Cauchick-Miguel, P.A. Barriers to Bicycle Sharing Systems Implementation: Analysis of Two Unsuccessful PSS. Procedia CIRP 2018, 73, 191–196. [Google Scholar] [CrossRef]
- Foltran, M. Santa Catarina Tem Cinco Municípios Entre Os 100 Maiores PIBs Do Brasil. 2022. Available online: https://estado.sc.gov.br/noticias/santa-catarina-tem-cinco-municipios-entre-os-100-maiores-pibs-do-brasil/ (accessed on 18 December 2023).
- Forza, C. Survey Research in Operations Management: A Process-based Perspective. Int. J. Oper. Prod. Manag. 2002, 22, 152–194. [Google Scholar] [CrossRef]
- Venkatesh, V.; Thong, J.Y.L.; Xu, X. Consumer Acceptance and Use of Information Technology: Extending the Unified Theory of Acceptance and Use of Technology. MIS Q. 2012, 36, 157. [Google Scholar] [CrossRef]
- Venkatesh, V.; Morris, M.G.; Davis, G.B.; Davis, F.D. User Acceptance of Information Technology: Toward a Unified View. MIS Q. 2003, 27, 425. [Google Scholar] [CrossRef]
- Gerpott, T.J.; Paukert, M. Determinants of Willingness to Pay for Smart Meters: An Empirical Analysis of Household Customers in Germany. Energy Policy 2013, 61, 483–495. [Google Scholar] [CrossRef]
- Warkentin, M.; Goel, S.; Menard, P. Shared Benefits and Information Privacy: What Determines Smart Meter Technology Adoption? J. Assoc. Inf. Syst. 2017, 18, 758–786. [Google Scholar] [CrossRef]
- Alkawsi, G.A.; Ali, N.; Baashar, Y. An Empirical Study of the Acceptance of IoT-Based Smart Meter in Malaysia: The Effect of Electricity-Saving Knowledge and Environmental Awareness. IEEE Access 2020, 8, 42794–42804. [Google Scholar] [CrossRef]
- Alkawsi, G.A.; Ali, N.; Mustafa, A.S.; Baashar, Y.; Alhussian, H.; Alkahtani, A.; Tiong, S.K.; Ekanayake, J. A Hybrid SEM-Neural Network Method for Identifying Acceptance Factors of the Smart Meters in Malaysia: Challenges Perspective. Alex. Eng. J. 2021, 60, 227–240. [Google Scholar] [CrossRef]
- Huijts, N.M.A.; Molin, E.J.E.; Steg, L. Psychological Factors Influencing Sustainable Energy Technology Acceptance: A Review-Based Comprehensive Framework. Renew. Sustain. Energy Rev. 2012, 16, 525–531. [Google Scholar] [CrossRef]
- Chen, C.; Xu, X.; Arpan, L. Between the Technology Acceptance Model and Sustainable Energy Technology Acceptance Model: Investigating Smart Meter Acceptance in the United States. Energy Res. Soc. Sci. 2017, 25, 93–104. [Google Scholar] [CrossRef]
- Ajzen, I.; Fishbein, M. Understanding Attitudes and Predicting Social Behavior, 1st ed.; Prentice-Hall: Englewood Cliffs, NJ, USA, 1980. [Google Scholar]
- Ajzen, I. The Theory of Planned Behavior. Organ. Behav. Hum. Decis. Process. 1991, 50, 179–211. [Google Scholar] [CrossRef]
- Davis, F.D. Perceived Usefulness, Perceived Ease of Use, and User Acceptance of Information Technology. MIS Q. 1989, 13, 319. [Google Scholar] [CrossRef]
- Hair, F.J., Jr.; Sarstedt, M.; Hopkins, L.; Kuppelwieser, V.G. Partial Least Squares Structural Equation Modeling (PLS-SEM). Eur. Bus. Rev. 2014, 26, 106–121. [Google Scholar] [CrossRef]
- Ringle, C.M.; Sarstedt, M.; Straub, D.W. Editor’s Comments: A Critical Look at the Use of PLS-SEM in “MIS Quarterly”. MIS Q. 2012, 36, iii. [Google Scholar] [CrossRef]
- Hair, J.F.; Risher, J.J.; Sarstedt, M.; Ringle, C.M. When to Use and How to Report the Results of PLS-SEM. Eur. Bus. Rev. 2019, 31, 2–24. [Google Scholar] [CrossRef]
- Henseler, J.; Ringle, C.M.; Sarstedt, M. A New Criterion for Assessing Discriminant Validity in Variance-Based Structural Equation Modeling. J. Acad. Mark. Sci. 2015, 43, 115–135. [Google Scholar] [CrossRef]
- Hair, J.F.; Astrachan, C.B.; Moisescu, O.I.; Radomir, L.; Sarstedt, M.; Vaithilingam, S.; Ringle, C.M. Executing and Interpreting Applications of PLS-SEM: Updates for Family Business Researchers. J. Fam. Bus. Strategy 2021, 12, 100392. [Google Scholar] [CrossRef]
- Benitez, J.; Henseler, J.; Castillo, A.; Schuberth, F. How to Perform and Report an Impactful Analysis Using Partial Least Squares: Guidelines for Confirmatory and Explanatory IS Research. Inf. Manag. 2020, 57, 103168. [Google Scholar] [CrossRef]
- Fornell, C.; Larcker, D.F. Evaluating Structural Equation Models with Unobservable Variables and Measurement Error. J. Mark. Res. 1981, 18, 39–50. [Google Scholar] [CrossRef]
- Fettermann, D.C.; Borriello, A.; Pellegrini, A.; Cavalcante, C.G.; Rose, J.M.; Burke, P.F. Getting Smarter about Household Energy: The Who and What of Demand for Smart Meters. Build. Res. Inf. 2021, 49, 100–112. [Google Scholar] [CrossRef]
- Fettermann, D.C.; Cavalcante, C.G.S.; Ayala, N.F.; Avalone, M.C. Configuration of a Smart Meter for Brazilian Customers. Energy Policy 2020, 139, 111309. [Google Scholar] [CrossRef]
- Podsakoff, P.M.; MacKenzie, S.B.; Lee, J.-Y.; Podsakoff, N.P. Common Method Biases in Behavioral Research: A Critical Review of the Literature and Recommended Remedies. J. Appl. Psychol. 2003, 88, 879–903. [Google Scholar] [CrossRef]
- Podsakoff, P.M.; Organ, D.W. Self-Reports in Organizational Research: Problems and Prospects. J. Manag. 1986, 12, 531–544. [Google Scholar] [CrossRef]
- Kock, N. Common Method Bias: A Full Collinearity Assessment Method for PLS-SEM. In Partial Least Squares Path Modeling; Springer International Publishing: Cham, Switzerland, 2017; pp. 245–257. [Google Scholar] [CrossRef]
- Gumz, J.; Fettermann, D.C.; Sant’Anna, Â.M.O.; Tortorella, G.L. Social Influence as a Major Factor in Smart Meters’ Acceptance: Findings from Brazil. Results Eng. 2022, 15, 100510. [Google Scholar] [CrossRef]
- Sheikh, Z.; Islam, T.; Rana, S.; Hameed, Z.; Saeed, U. Acceptance of Social Commerce Framework in Saudi Arabia. Telemat. Inform. 2017, 34, 1693–1708. [Google Scholar] [CrossRef]
- Owusu Kwateng, K.; Osei Atiemo, K.A.; Appiah, C. Acceptance and Use of Mobile Banking: An Application of UTAUT2. J. Enterp. Inf. Manag. 2019, 32, 118–151. [Google Scholar] [CrossRef]
- Senyo, P.; Osabutey, E.L.C. Unearthing Antecedents to Financial Inclusion through FinTech Innovations. Technovation 2020, 98, 102155. [Google Scholar] [CrossRef]
- Chou, J.-S.; Gusti Ayu Novi Yutami, I. Smart Meter Adoption and Deployment Strategy for Residential Buildings in Indonesia. Appl. Energy 2014, 128, 336–349. [Google Scholar] [CrossRef]
- Avancini, D.B.; Rodrigues, J.J.P.C.; Martins, S.G.B.; Rabêlo, R.A.L.; Al-Muhtadi, J.; Solic, P. Energy Meters Evolution in Smart Grids: A Review. J. Clean. Prod. 2019, 217, 702–715. [Google Scholar] [CrossRef]
- Park, E.-S.; Hwang, B.; Ko, K.; Kim, D. Consumer Acceptance Analysis of the Home Energy Management System. Sustainability 2017, 9, 2351. [Google Scholar] [CrossRef]
- Park, C.-K.; Kim, H.-J.; Kim, Y.-S. A Study of Factors Enhancing Smart Grid Consumer Engagement. Energy Policy 2014, 72, 211–218. [Google Scholar] [CrossRef]
- Fensel, A.; Tomic, S.; Kumar, V.; Stefanovic, M.; Aleshin, S.V.; Novikov, D.O. SESAME-S: Semantic Smart Home System for Energy Efficiency. Inform.-Spektrum 2013, 36, 46–57. [Google Scholar] [CrossRef]
- Wemyss, D.; Castri, R.; Cellina, F.; De Luca, V.; Lobsiger-Kägi, E.; Carabias, V. Examining Community-Level Collaborative vs. Competitive Approaches to Enhance Household Electricity-Saving Behavior. Energy Effic. 2018, 11, 2057–2075. [Google Scholar] [CrossRef]
- Chawla, Y.; Kowalska-Pyzalska, A.; Oralhan, B. Attitudes and Opinions of Social Media Users Towards Smart Meters’ Rollout in Turkey. Energies 2020, 13, 732. [Google Scholar] [CrossRef]
- Kemp, S. Digital 2021: Brazil. 2021. Available online: https://datareportal.com/reports/digital-2021-brazil (accessed on 19 December 2023).
- Barbosa, M. 97% Dos Idosos Acessam a Internet, Aponta Pesquisa Da CNDL/SPC Brasil. 2021. Available online: https://cndl.org.br/varejosa/numero-de-idosos-que-acessam-a-internet-cresce-de-68-para-97-aponta-pesquisa-cndl-spc-brasil/ (accessed on 18 December 2023).
- Düştegör, D.; Sultana, N.; Felemban, N.; Al Qahtani, D. A Smarter Electricity Grid for the Eastern Province of Saudi Arabia: Perceptions and Policy Implications. Util. Policy 2018, 50, 26–39. [Google Scholar] [CrossRef]
- Wunderlich, P.; Veit, D.J.; Sarker, S. Adoption of Sustainable Technologies: A Mixed-Methods Study of German Households. MIS Q. 2019, 43, 673–691. [Google Scholar] [CrossRef]
- Hmielowski, J.D.; Boyd, A.D.; Harvey, G.; Joo, J. The Social Dimensions of Smart Meters in the United States: Demographics, Privacy, and Technology Readiness. Energy Res. Soc. Sci. 2019, 55, 189–197. [Google Scholar] [CrossRef]
- Chen, K.-Y.; Yeh, C.-F. Factors Affecting Adoption of Smart Meters in the Post-Fukushima Era in Taiwan: An Extended Protection Motivation Theory Perspective. Behav. Inf. Technol. 2017, 36, 955–969. [Google Scholar] [CrossRef]
- Cheng, D.; Liu, G.; Qian, C.; Song, Y.-F. Customer Acceptance of Internet Banking: Integrating Trust and Quality with UTAUT Model. In Proceedings of the 2008 IEEE International Conference on Service Operations and Logistics, and Informatics, Beijing, China, 12–15 October 2008; IEEE: Beijing, China, 2008; pp. 383–388. [Google Scholar] [CrossRef]
- Matschoss, K.; Kahma, N.; Heiskanen, E. Pioneering Customers as Change Agents for New Energy Efficiency Services—an Empirical Study in the Finnish Electricity Markets. Energy Effic. 2015, 8, 827–843. [Google Scholar] [CrossRef]
- Moser, C. The Role of Perceived Control over Appliances in the Acceptance of Electricity Load-Shifting Programmes. Energy Effic. 2017, 10, 1115–1127. [Google Scholar] [CrossRef]
- Lai, H.C.; Yu, Y.C.; Tuan, Y.M. Electricity-Saving Behavior Antecedents: Electricity-Saving Motivations, Constraints, Knowledge and Beliefs. In Proceedings of the 2016 IEEE International Conference on Industrial Engineering and Engineering Management (IEEM), Bali, Indonesia, 4–7 December 2016; IEEE: Bali, Indonesia, 2016; pp. 567–571. [Google Scholar] [CrossRef]
- Dinev, T.; Hart, P. An Extended Privacy Calculus Model for E-Commerce Transactions. Inf. Syst. Res. 2006, 17, 61–80. [Google Scholar] [CrossRef]
- Nambisan, S.; Agarwal, R.; Tanniru, M. Organizational Mechanisms for Enhancing User Innovation in Information Technology. MIS Q. 1999, 23, 365. [Google Scholar] [CrossRef]
Figure 1.
The model proposed to estimate the acceptance of smart meters.

Figure 2.
Interface of the mobile version of the questionnaire (in Portuguese).

Figure 3.
Estimations of the proposed model.


Table 1.
Descriptive analysis of the sample.
| Sample Characteristics | Sample | Census (IBGE, 2010) | |
|---|---|---|---|
| N | % | % | |
| Age | |||
| 15 to 24 years old | 34 | 25.00 | 18.00 |
| 25 to 39 years old | 37 | 27.21 | 26.30 |
| 40 to 59 years old | 40 | 29.41 | 25.20 |
| 60 years old or more | 25 | 18.38 | 8.80 |
| Education | |||
| Incomplete elementary | 0 | 0 | 35.02% |
| Complete elementary | 3 | 2.21% | 20.48% |
| Complete high school | 43 | 31.62% | 31.64% |
| Complete higher education | 49 | 36.03% | 12.30% |
| Postgraduate | 41 | 30.15% | * |
| Gender | |||
| Female | 71 | 52.21% | 50.40% |
| Male | 64 | 47.06% | 49.60% |
| Not identified | 1 | 0.74% | * |
| Type of housing | |||
| House | 65 | 47.79% | 83.53% |
| Apartment | 71 | 52.21% | 15.76% |
| Number of bedrooms | |||
| 1 bedroom | 6 | 4.41% | 22.36% |
| 2 bedrooms | 29 | 21.32% | 40.63% |
| 3 bedrooms | 69 | 50.74% | 31.60% |
| 4 or more bedrooms | 32 | 23.53% | 5.41% |
* Data not available in the Census [26].
Table 2.
Convergent validity.
| Construct | Item | Factor Loading | Cronbach’s Alpha | CR | AVE |
|---|---|---|---|---|---|
| Perform Expectancy (PE) | PE1 | 0.789 | 0.828 | 0.885 | 0.660 |
| PE2 | 0.879 | ||||
| PE3 | 0.856 | ||||
| PE4 | removed | ||||
| PE5 | removed | ||||
| Hedonic Motivation (HM) | MH1 | 0.855 | 0.828 | 0.877 | 0.641 |
| MH2 | 0.795 | ||||
| MH3 | 0.834 | ||||
| MH4 | 0.712 | ||||
| MH5 | removed | ||||
| Environmental Awareness (EA) | EA1 | 0.955 | 0.700 | 0.854 | 0.748 |
| EA2 | removed | ||||
| EA3 | removed | ||||
| EA4 | 0.765 | ||||
| EA5 | removed | ||||
| Effort Expectancy (EE) | EE1 | 0.840 | 0.764 | 0.864 | 0.679 |
| EE2 | 0.779 | ||||
| EE3 | removed | ||||
| EE4 | 0.851 | ||||
| EE5 | removed | ||||
| Social Influence (SI) | IS1 | removed | 0.736 | 0.846 | 0.650 |
| IS2 | 0.707 | ||||
| IS3 | 0.788 | ||||
| IS4 | 0.911 | ||||
| IS5 | removed | ||||
| Associated Costs (ACs) | AC1 | removed | |||
| AC2 | removed | ||||
| AC3 | removed | ||||
| AC4 | removed | ||||
| AC5 | removed | ||||
| Violation of Privacy (VP) | VP1 | 0.827 | 0.727 | 0.875 | 0.778 |
| VP2 | removed | ||||
| VP3 | removed | ||||
| VP4 | 0.827 | ||||
| VP5 | removed | ||||
| Intention to Use (IU) | IU1 | removed | 0.863 | 0.901 | 0.645 |
| IU2 | 0.798 | ||||
| IU3 | 0.816 | ||||
| IU4 | 0.837 | ||||
| IU5 | 0.740 |
Table 3.
Fornell and Larcker approach (Discriminant Validity).
| EA | EE | HM | IU | PE | SI | VP | |
|---|---|---|---|---|---|---|---|
| EA | 0.865 | ||||||
| EE | 0.090 | 0.824 | |||||
| HM | 0.015 | 0.389 | 0.801 | ||||
| IU | 0.268 | 0.403 | 0.426 | 0.803 | |||
| PE | 0.314 | 0.449 | 0.247 | 0.668 | 0.813 | ||
| SI | 0.311 | 0.392 | 0.354 | 0.532 | 0.481 | 0.806 | |
| VP | −0.002 | 0.140 | 0.023 | 0.087 | 0.158 | −0.047 | 0.882 |
Table 4.
Heterotrait–Monotrait (HTMT) approach (Discriminant Validity).
| EA | EE | HM | IU | PE | SI | |
|---|---|---|---|---|---|---|
| EE | 0.140 | |||||
| HM | 0.098 | 0.487 | ||||
| IU | 0.316 | 0.484 | 0.422 | |||
| PE | 0.395 | 0.560 | 0.277 | 0.769 | ||
| SI | 0.425 | 0.498 | 0.408 | 0.616 | 0.571 | |
| VP | 0.101 | 0.197 | 0.149 | 0.113 | 0.212 | 0.148 |
Table 5.
Structural Model.
| SRMR | R2 | R2 Adjusted | BIC | AIC | |
|---|---|---|---|---|---|
| Model Estimated | 0.096 | 0.550 | 0.529 | −75.286 | −95.675 |
Table 6.
Model estimated.
| Relationships | Coefficient (β) | T Values | p-Value | VIF |
|---|---|---|---|---|
| EA → IU | 0.047 | 0.704 | 0.482 | 1.178 |
| EE → IU | 0.008 | 0.113 | 0.910 | 1.455 |
| HM → IU | 0.230 | 3.981 | 0.000 *** | 1.263 |
| PE → IU | 0.497 | 6.010 | 0.000 *** | 1.569 |
| SI → IU | 0.195 | 2.543 | 0.011 ** | 1.556 |
| VP → IU | 0.011 | 0.165 | 0.869 | 1.061 |
** significant at 5%, and *** significant at 1%.
Disclaimer/Publisher’s Note: The statements, opinions and data contained in all publications are solely those of the individual author(s) and contributor(s) and not of MDPI and/or the editor(s). MDPI and/or the editor(s) disclaim responsibility for any injury to people or property resulting from any ideas, methods, instructions or products referred to in the content. |
© 2023 by the authors. Licensee MDPI, Basel, Switzerland. This article is an open access article distributed under the terms and conditions of the Creative Commons Attribution (CC BY) license (https://creativecommons.org/licenses/by/4.0/).
Share and Cite
MDPI and ACS Style
Fettermann, D.; Christoffel, P.; Castillo, J.; Sant’Anna, A. The Role of Performance in Smart Meter’s Acceptance: A Survey in Joinville, Brazil. Urban Sci. 2024, 8, 1. https://doi.org/10.3390/urbansci8010001
AMA Style
Fettermann D, Christoffel P, Castillo J, Sant’Anna A. The Role of Performance in Smart Meter’s Acceptance: A Survey in Joinville, Brazil. Urban Science. 2024; 8(1):1. https://doi.org/10.3390/urbansci8010001
Chicago/Turabian StyleFettermann, Diego, Pedro Christoffel, Jaime Castillo, and Angelo Sant’Anna. 2024. "The Role of Performance in Smart Meter’s Acceptance: A Survey in Joinville, Brazil" Urban Science 8, no. 1: 1. https://doi.org/10.3390/urbansci8010001