Article

Navigating Efficiency and Uncertainty: Risks of Relying on an At-Will Workforce in Urban Meal Delivery

1
Sid & Reva Department of Civil, Environmental & Infrastructure Engineering, George Mason University, Fairfax, VA 22030, USA
2
Independent Researcher, Chicago, IL 60602, USA
*
Author to whom correspondence should be addressed.
Urban Sci. 2024, 8(1), 17; https://doi.org/10.3390/urbansci8010017
Submission received: 19 November 2023 / Revised: 17 January 2024 / Accepted: 17 February 2024 / Published: 22 February 2024

Abstract

:
Increasing popularity in gig employment has enabled the use of an at-will workforce of self-contracted couriers to participate in many service industries serving urban areas. This gig workforce has come to play a particularly important role in the growing meal delivery service industry. Hiring at-will couriers for delivery job fulfillment can decrease the costs of satisfying nonstationary demand. However, at-will workers can show up for work at their will and without notice. Thus, this puts the service performance of the delivery company that relies on effective workforce management to ensure timely delivery of orders at risk. This work investigates the tradeoffs between using such an at-will workforce of couriers in place of a fixed fleet of drivers in servicing a meal delivery environment. A stochastic DES with tabu search heuristic and embedded ejection chain approach for optimal delivery job bundling, routing, and assignment was developed and run within a rolling horizon framework to replicate the dynamics of the meal delivery setting. Condition Value at Risk (CVaR) is adopted to measure the risk of late delivery due to uncertainty in workforce availability. Results from a numerical case study with 25 restaurants and 613 orders arriving over a 14-h period show tradeoffs from using at-will couriers in place of a comparable fixed fleet of drivers in terms of delivery resource utilization, efficiency risk of failing to satisfying orders and risk of significantly late delivery. Results indicate that using at-will couriers for meal delivery can enable more efficient use of delivery resources, but at the cost of a higher risk of late delivery, and sometimes intolerably late delivery, as compared to using a fixed fleet of drivers to fulfill orders.

1. Introduction

Demand for meal delivery services in urban areas has grown tremendously over the past decade, doubling in size early in the COVID-19 pandemic [1]. To keep these services cost-effective and, by extension, attractive, meal delivery platforms typically make use of an at-will workforce of self-contracted couriers. While hiring at-will couriers can decrease the costs of satisfying nonstationary demand, there is a risk that too few couriers will be available to fulfill orders, as such couriers check in and out to the work environment as they desire without warning. Moreover, instead of starting from a depot, as might be typical of company-owned vehicle fleets, the couriers enter the system at random locations within the region. They can also choose to relocate while idle as desired. This creates uncertainty in the availability of couriers and their proximities to orders for the meal delivery company. Meal delivery companies seek to effectively manage this ad hoc workforce and must efficiently distribute orders to the couriers to ensure timely deliveries. Uncertainty in courier availability and their locations when orders arrive precludes guarantees that there will be a sufficient workforce at the ready during high-demand periods. If the available workforce is insufficient, service capacity may be too small, causing delays in service provision. Delays in the food industry can lead to service failures; that is, the food may be past an acceptable level of freshness or delivered too late for its purpose. Therefore, the company cannot rely on any particular courier to be available at any particular location much beyond the present. However, meal delivery applications are time sensitive with delivery companies focused on key performance metrics, such as order fulfilment rate and click-to-door (CtD) times. Coupled with uncertainties in customer order arrivals and handling times at restaurants [2,3,4], these added driver availability stochasticities create challenges for the delivery company.
This work proposes an ejection chain neighborhood-embedded tabu search heuristic for solving a dynamic courier routing problem under a stochastic, dynamic meal delivery environment with uncertainty in upcoming order arrivals, pickup and delivery locations, handling times, travel times, and availability and initial locations of couriers who sign in and out from the platform at will and accept or reject order offers as desired. The heuristic is applied within a rolling horizon framework, developing and updating proposed routes that guide immediate order assignment and ultimate courier routing in a real-time, dynamic environment. A stochastic discrete-event simulator (DES) is presented that replicates real meal delivery operations accounting for the many sources of uncertainty. Embedding the heuristic within the DES environment creates a platform for assessing the benefits of optimized order assignments to couriers and developed routes over a planning horizon. Conditional Value at Risk (CVaR) is adopted to measure the risk of late delivery (i.e., beyond a threshold CtD set based on a tolerance level) due to uncertainty in workforce availability.
This work studies the effects of employing an at-will workforce of delivery drivers in place of a fixed fleet owned by the delivery company, and compares strategies for deploying this at-will workforce in this context. To this end, the following questions are investigated: (1) How many fixed-fleet drivers are required to service an area with a given demand, and what arrival rate of at-will couriers would be required to ensure similar performance in terms of chosen metrics? (2) How likely are service-level targets to be missed in fixed-fleet and at-will driver settings? (3) How do performance measures change in competitive environments, where couriers are more likely to reject delivery jobs or where a sufficient number may not sign in to work? Thus, this paper seeks to answer important, pressing questions about future workforces that rely on the gig economy to support urban services. This work identifies a key challenge associated with at-will couriers: the risk of insufficient courier availability. A stochastic DES is created to replicate real meal delivery operations including uncertainty in courier availability timing, location and willingness to accept a job offer. Further, the work adopts Conditional Value at Risk (CVaR) as a metric to measure the risk of late delivery due to this uncertainty in workforce availability. A review of the literature is given in the next section. This is followed in Section 3 by a definition of the meal delivery problem with at-will couriers investigated herein, description of the meal delivery DES environment, and details of the heuristic order assignment method and rolling-horizon framework. Results of numerical experiments conducted on a case study are described in Section 4. Section 5 provides conclusions.

2. Literature Review

Numerous works in the literature study delivery problems with a fixed fleet of drivers, deployment of which is centrally controlled by the delivery company. With greater online sales in recent years, there is an increased need for direct transportation of individual packages [5]. Archetti et al. [6] recognized the need for occasionaly drivers to meet this demand and proposed a static Vehicle Routing Problem with Occasional Drivers (VRPOD). In the VRPOD, a store has at its disposal a fixed fleet of drivers for completing deliveries, but also assigns delivery jobs to in-store customers who are compensated for accepting to make deliveries (referred to as occasional drivers) as needed. They considered only a static and deterministic environment. Their VRPOD is formulated as an integer program with the objective of minimizing total delivery costs. They proposed a multi-start heuristic for its solution. Dayarian and Savelsbergh [7] extended the VRPOD to stochastic and dynamic environments, where arrivals of online orders and in-store customers are uncertain. Both works considered only one pickup location (the store) and allow occasional drivers to execute only one delivery job.
Arslan et al. [8] also extended the VRPOD by introducing ad hoc drivers (similar to at-will drivers considered herein) who are offered the opportunity to fulfill multiple pickup and delivery tasks. A pickup and delivery routing problem is formulated that aims to determine the assignment of tasks and routes to the ad hoc drivers or dedicated vehicles. Like herein, the model was embedded in an event-based rolling horizon framework. Mancini and Gansterer [9] proposed and incorporated order bundling within the VRPOD. They proposed a mixed-integer program to determine best routes for the occasional drivers and order bundling strategy. A large neighborhood search (LNS)-based heuristic method was used for its solution.
The VRPOD is a general delivery problem. A number of works in recent years have focused specifically on meal delivery. Ulmer et al. [4] formulated the meal delivery problem as a route-based Markov decision process (MDP) with uncertainties in order placements and order handling times. In their work, a fleet of dedicated drivers is deployed to fulfill delivery jobs over a fixed time period. Yildiz and Savelsbergh [10] formulated the meal delivery problem as a mixed-integer program in which self-contracted couriers work during chosen, but predetermined, shifts. Thus, driver sign-in and -out times are known in advance. The model determines task assignments. The authors proposed a simultaneous column and row generation method to obtain exact solutions. Steever et al. [11] proposed a mixed-integer program to determine the sequence of meal pickups and deliveries, as well as the number of required couriers at each point in time. Results of numerical experiments show tradeoffs between a “split” policy that permits multiple drivers to serve a single customer in terms of improving freshness of the delivered orders and a “non-split” policy that saves in operational costs.
Jahanshahi et al. [12] modeled the meal delivery problem as an MDP and applied deep reinforcement learning (DRL) to determine best strategies for order taking by the meal delivery company and repositioning of idle couriers to support operations. Both synthetic and real data were used to study courier utilization rates in a small problem example under varying numbers of couriers (3 to 7 couriers). The number of couriers at each hour is determined by the platform to meet fluctuating demand. Couriers are assumed to accept all task offers. Fotouhi et al. [3] constructed a more realistic meal delivery simulation environment that captures key elements of the dynamic and uncertain environment assuming all couriers arrive at will, building on data from a real-world meal delivery environment. In addition to uncertainty in order arrivals and order preparation and handling times, Fotouhi et al. [3] also considered uncertainty in courier sign-in times, working durations, task acceptance or rejection, and travel times. The focus of their work was on the performance of meal delivery services under curbside pickup regulations in response to the COVID-19 pandemic. The work herein makes use of the probability distributions and other meal delivery environment settings described in [3].
Also accounting for various sources of uncertainty, Yildiz and Savelsbergh [13] proposed a theoretical model to determine how much to pay couriers and how many dedicated drivers to hire for delivering orders that can be rejected by at-will couriers to serve a single restaurant. Their results showed that including company-owned drivers can substantially improve the reliability of the meal delivery platform. They explain how their approach can be extended to multiple restaurants and how to determine which restaurants should be included in a service area. Only one prior work by Alvarez-Palau et al. [14] regarding meal delivery compared system performance between at-will couriers and maintaining a fixed fleet. For this purpose, they calculated delivery income and expenses through a Monte Carlo method for sampling from real data of meal delivery companies. They found that hiring full-time, fixed-fleet drivers is less profitable than using at-will couriers. Bi et al. [15] studied a meal delivery routing problem in which the use of at-will couriers is compared against use of a traditional fixed fleet of vehicles with full-time drivers. The results of their experiment indicate that using at-will couriers is more cost-effective and would lead to higher customer satisfaction rates.
Taking an alternative perspective, Zhou et al. [16] considered best strategies for maximizing earnings obtained by an individual at-will courier. A DRL method is proposed to find delivery job rejection and relocation policies to support the driver. Three other works in meal delivery also require mention. The first by Liu [17] considers a meal delivery environment in which a fleet of drones is optimally dispatched as orders arrive. In the second work, Zhao et al. [18] proposed an optimization model for dispatching drones and drivers to delivery jobs simultaneously that seeks to minimize a temporal-spatial distance measure. Results of numerical experiments show that delivery costs can be reduced through the use of this measure. The third, by Liao et al. [19], developed a multi-objective model to support greener meal deliveries. Objectives of minimizing carbon footprint, maximizing customer satisfaction, and maximizing courier utilization during meal delivery operations were simultaneously applied.
Table 1 synthesizes this literature. The table includes details of characteristics of the meal delivery environments that are replicated in these works, the class(es) of drivers considered, and other setting details. Occasional drivers are distinguished here from at-will drivers as the work periods of occasional drivers are known with certainty. In relation to this, there are works in other applications, such as ridesharing, where occasional drivers can set their own schedules. For example, Gurvich et al. [20] investigated the impact of allowing drivers to determine their own work schedules. Their results show that allowing for the self-scheduling of drivers is costly for both the ridesharing company and its customers. These works are not included in the table.
Critical to capturing meal delivery operational settings is the modeling of the many sources of uncertainty that complicate these operations, such as at-will couriers who may or may not be available at times they are needed, and even if available, may reject offered delivery offers. Like prior work from [3], this work accounts for these and additional sources of uncertainty. Some earlier works consider an environment with a fixed fleet of drivers. Others recognize that meal delivery platforms are increasingly relying on at-will drivers to reduce overhead at the expense of reduced control. No prior work, whether in a realistic or simplified testing environment, has investigated the benefits and risks of relying on such at-will couriers in place of a fixed fleet of drivers. This work seeks to fill this gap.

3. Developing the Environment and Replicating Delivery Operations

3.1. The Meal Delivery Problem

In general form, the Meal Delivery Problem aims to fulfill the delivery of a set of orders O = { 1 , 2 , , O } from customers Z = { 1,2 , , Z } for meals coming from one or more restaurants in a set R = { 1,2 , , R } and located in a generally compact area. Meal delivery tasks are assigned to vehicles V = { 1,2 , , V } . If a fixed fleet of vehicles with drivers is maintained, V represents the set of fixed-fleet drivers. Otherwise, if the platform relies on at-will couriers, V is the set of possible couriers who may or may not be checked into the system at the time of order assignment.
The total number of orders O that arrive in a period of interest, [ 0 , T ] , is a random variable determined by market demand. Each order o O is characterized by the 7-tuple of attributes ( r o , z o , v o , t p l a c e m e n t o , t r e a d y o , t p i c k u p o , t d e l i v e r y o ) . r o R denotes the restaurant in which order o is prepared. z o Z indicates the customer associated with order o and v o V represents the fixed-fleet driver or a courier who will fulfill the delivery task. Associated with each order is t p l a c e m e n t o , representing the order’s placement time, as well as the request time for the delivery task and a ready time t r e a d y o that is a random variable, which is not known in advance. Also associated with each order is pickup time t p i c k u p o and t d e l i v e r y o .
If the studied problem involves at-will couriers, each courier v V will sign into the meal delivery platform at an arbitrary time t e v [ 0 , T ] and will sign out from the platform at will. If the studied problem involves a fixed fleet, the driver is presumed to be available to work for the entirety of the period [ 0 , T ] .
The Meal Delivery Problem determines an assignment of delivery jobs to couriers or fixed-fleet drivers as appropriate to the application, providing the drivers with optimal routes in this stochastic and dynamic environment. A delivery job consists of a bundle of one or more orders that are fulfilled by a single courier or driver. The goal is to ensure high quality meal delivery service in terms of two key performance metrics: CtD time and freshness. Without loss of generality and with little loss for the application, only CtD times are discussed herein.
A stochastic DES is constructed to replicate this dynamic and uncertain meal delivery environment, details of which are given next. All notation are presented in Table 2.

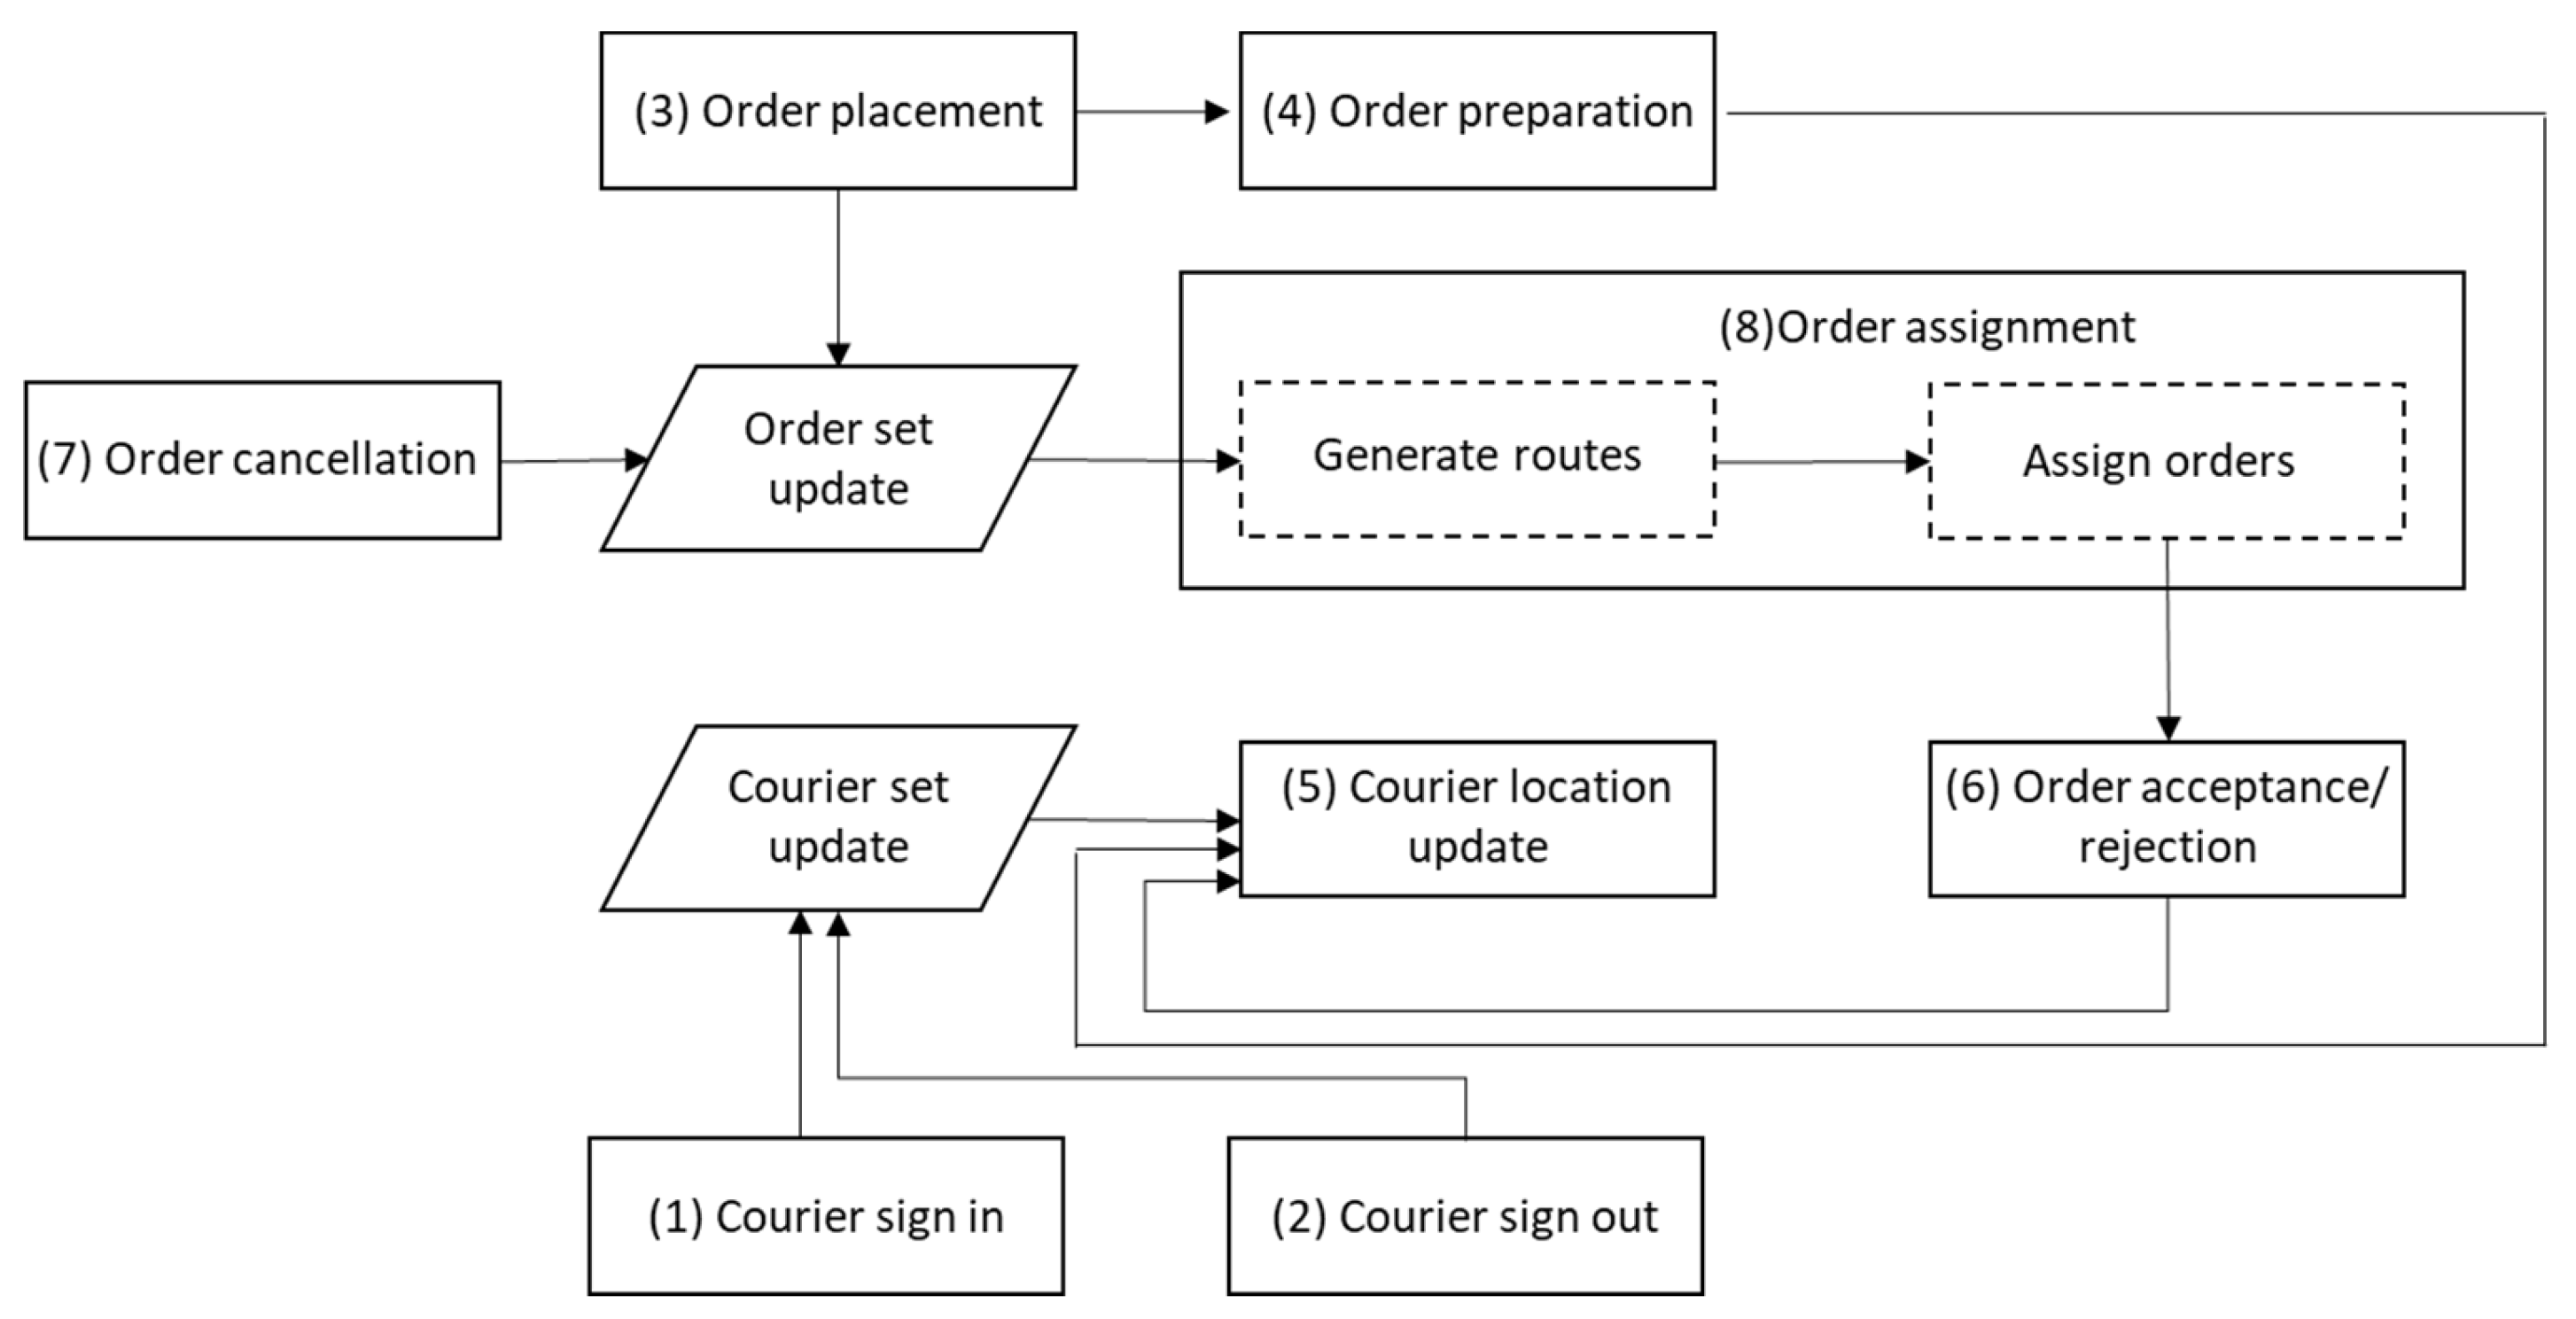
3.2. Simulating the Meal Delivery Environment with Fixed or At-Will Couriers

The stochastic DES was built to replicate the operations of the meal delivery environment in which meal order assignment and courier routing strategies can be tested (see Figure 1). The simulator consists of eight modules: (1) Courier sign in, (2) Courier sign out, (3) Order placement, (4) Order preparation, (5) Courier location update, (6) Order acceptance/rejection, (7) Order cancelation, and (8) Order assignment. Modules (1) to (6) update courier and order information, and module (8) routes and assigns idle couriers when new orders arrive. Details of these modules follow.
(1)
Courier sign in
In this module, whether new couriers sign into the platform at time t follows an exponential distribution with rate λ ( t ) . λ ( t ) is time-of-day dependent to replicate that there will be more couriers arriving during meal times. The sign-in time and location for each courier that checks in is denoted by t 0 v and n 0 v , respectively.
(2)
Courier sign out
A courier signs out from the platform under two circumstances: (i) current time t is no earlier than a pre-defined sign-out time t e v and (ii) courier idle time is larger than the courier v ’s willingness-to-wait time threshold w v . w v is assumed to be a random variable. For any v , w v is assumed to follow a normal distribution; thus, the majority of couriers have a similar wait time threshold. The sign-out time for each courier is set by Equation (1).
t e v = t 0 v + τ v ,
where τ v is courier v ’s planned work duration, which is only known to the courier. τ v follows a normal distribution for all couriers. A courier will sign out from the platform under any one of the following situations: (i) if idle for more than w v minutes; (ii) if idle at t e v ; or (iii) busy at t e v . In the third situation, the courier will sign out only after finishing the ongoing task. Courier v will not accept any future orders that arrive after t e v .
(3)
Order placement
Order arrivals are assumed to be Poisson distributed thus, orders arrive at intervals over time according to an exponential process. When a new order o is placed, the order along with the associated restaurant r o and location n r o , customer index z o at n z o , and order placement time t p l a c e m e n t o are sent to the meal delivery company for order assignment and courier routing.
(4)
Order preparation
After order o is placed at restaurant r o , following a normal distribution for order preparation time, the order becomes ready at t r e a d y o .
(5)
Courier location update
For the courier who is not idle, but has not yet arrived at a restaurant or customer, that courier will move towards a restaurant or customer location. If the courier is currently at a restaurant location and the order is ready, the courier will pick up this order and depart towards the next destination on the route. This destination can be a restaurant for another order pickup or a customer location. If the order is not ready, the courier will continue to wait at the restaurant until the order is ready to be picked up. Arrival times at these locations are updated according to realized travel times generated from a uniform distribution. After a job is complete, couriers move in the direction of the closest restaurant.
(6)
Order acceptance/rejection
Once a job is assigned to courier v , the courier can decide whether to accept it. A job can include a single order or a bundle of orders. Order acceptance follows a Bernoulli distribution.
(7)
Order cancellation
If a delivery job is not successfully assigned to a courier after a predefined time duration, the customer will cancel the order.
(8)
Order assignment
Jobs consisting of one or more orders are assigned to couriers. Received orders with anticipated ready times are bundled and assigned across drivers through optimization. The orders are offered to the couriers according to the outcomes of the optimization. The couriers receive only one job at a time, and new jobs are assigned over a rolling horizon. This process follows a three-step procedure: (1) generate pickup and delivery routes for undelivered orders, (2) bundle delivery jobs based on pickup and delivery routes, and (3) assign the nearest-term jobs to idle couriers according to the planned route. This three-step procedure is shown in Figure 2.
Step 1: Route generation through a Tabu search heuristic. The routes for all couriers currently in the system are pre-planned to guide order assignment and are updated as new orders come in. The route starts at the courier’s current location. Routes are generated to have minimum total click-to-door (CtD) time as per Equation (2). This problem of determining the routes falls under a class of vehicle routing with pickup and delivery problems.
min o O a c t i v e max ( t ^ d e l i v e r y o t p l a c e m e n t o d , 0 ) ,
t ^ d e l i v e r y o is the expected delivery time for order o and t p l a c e m e n t o is the order placement time, d is the delivery time requirement. For example, d = 35 means that orders must be delivered within 35 min. A tabu search heuristic in which new solutions are explored through N repeated decomposition and reconstruction cycles is applied for this purpose. In each cycle, solution s is decomposed into K disjoint sub-solutions (or subsets of routes): { s 1 ,   s 2 , ,   s K } . Each sub-solution is updated through an ejection chain neighborhood approach [21]. This updating process will continue until no improvement is obtained in the sub-solution for θ consecutive neighbor search moves. Solution after each cycle is achieved through the combination of all updated sub-solutions. Details of the tabu search method are given next and in Algorithm 1.
Algorithm 1. Tabu search procedure for route generation
Input: tabu tenure l , number of decomposition cycles N , subsets K , and stopping criteria parameter θ
{Initialization} Generate initial solution s 0
s = s 0
For decomposition cycle 1,2 , 3 ,   ,   N :
     {Diversification phase}
     Decompose s to K disjoint subsets of routes { s 1 ,   s 2 , ,   s K }
     Any routes with centroids contained in the same sector   k in a sweep are included in the same subset
     {Intensification phase}
     For k from 1 to K :
         s b e s t k = s k
        While s b e s t k is updated in the last θ neighbor search moves:
                  Generate neighboring solutions to s k via Neighborhood Search through Ejection Chain
              Update s k with best nontabu solution among neighboring solutions
                  If objective value of s k is better than        s b e s t k , then
                   s b e s t k = s k
                  {Update tabu list}
         s = s b e s t 1 ,   s b e s t 2 , ,   s b e s t k 1 { s b e s t k }
Return s
Initialization. To generate an initial solution, s 0 , at each decision point, courier availability due to sign-in and sign-out actions is updated. An initial solution s 0 is generated by myopically adding pickup and delivery nodes of unassigned orders to couriers: pickup and delivery nodes at which there are unassigned orders that are prioritized for inclusion in routes containing fewer orders.
Intensification Phase: Neighborhood search through Ejection Chain. The ejection chain method searches the neighborhood of the current solution by implementing ejection and insertion steps. Given an order o originally in route θ v and order o originally in route θ v , θ v θ v , ejection e ( o , o , θ v , θ v ) ejects o from route θ v , then inserts order o into route θ v . After the ejection of o , another ejection action inserts order o into another route θ v , forcing the ejection of order o . The insertion of an order to another route is executed sequentially, where the pickup node is first inserted into the route at a location with the lowest increase in CtD times of all orders and the delivery node is inserted in the location after its pickup node that results in the lowest increase in CtD time. The last ejected order is inserted in any route at any arbitrarily chosen location, creating an ejection chain. This ejection chain creates a new set of routes, s k , for k 1,2 , , K , that forms a neighbor of route set s k . This move from set s k to s k is considered a local move in the tabu search procedure and is employed within the intensification phase. As suggested in [21], the process of finding the optimal ejection chain is modeled as an all-to-all shortest path problem. In this shortest path problem, the arc from o to o is defined as the ejection action e ( o , o , θ v , θ v ) and its distance is the increase in CtD time incurred by this action. The path between the node pair with the shortest distance is chosen as the ejection chain. If only one route exists, a node is arbitrarily chosen to be ejected and reinserted into the same route at an arbitrary location that is consistent for its delivery or pickup pairing.
Tabu list. The tabu list contains the solutions that were developed by the ejection chain method in the last x iterations. If x 0 , this move is tabu; otherwise, accept the solution.
Diversification phase: Decomposition. A decomposition procedure is used to create greater diversity. Current solution s is decomposed into K disjoint subsets of routes { s 1 , s 2 , , s K } . All routes with their centroids contained in the same sector k in a sweep are included in the same subset. After the intensification process, routes are rejoined and decomposed into new subsets of routes, and the process repeats.
Steps 2 & 3: Bundle & assign orders. Orders within the best route of those generated in Step 1 are bundled into jobs of one or more orders, and the first job on the route is assigned to the courier for whom the route was created. If a courier rejects a job, the courier will not receive another order offer until the next decision point within the planning horizon, and any job that is rejected will be reassigned in the same decision point.

3.3. Simulating the Meal Delivery Environment with Fixed Fleet

Two modifications to the simulator were made to assess the operation of the meal delivery environment in which a fixed fleet is utilized. The first affects the availability of the delivery workforce. Fixed-fleet drivers begin their work in the platform at the beginning of the meal delivery period and will not leave the platform until all delivery jobs are assigned. All drivers begin their workday at a depot assumed to be located at the centroid of the restaurants. Drivers reposition toward the depot when idle. Unlike at-will couriers who can reject delivery job offers, fixed-fleet drivers must accept all assigned delivery jobs. The routes and order assignments for the fixed-fleet drivers are determined by the meal delivery platform following the same three-step procedure is described in the Section 3.2.

4. Evaluating the Risk of Late Delivery

To quantify the risk of late delivery from using at-will couriers, a risk evaluation metric, CVaR, is adopted. The value of CVaR is measured per the pseudo code in Algorithm 2.
Algorithm 2. CVaR measurement procedure
Input: tolerance level, 1 β , for 0   β 1, and number of simulation replications, L
Let S a m p l e C t D = { }
Repeat simulation L times, for each run storing CtD times of all orders in S a m p l e C t D
Count total number of orders in S a m p l e C t D , N
Sort CtD times in S a m p l e C t D in descending order and find cutoff point α at ( 1 β ) · N
Calculate CVaR as the average of the first α CtD times in sorted S a m p l e C t D
Output computed CVaR value

5. Case Study

5.1. Experiment Design

Numerical experiments were run to assess tradeoffs between using at-will couriers and hiring a fixed fleet of drivers. The experiments were conducted on a simulated meal delivery environment with 25 restaurants located within a 10 square-mile area. Horizontal and vertical coordinates for the restaurants were generated from a truncated normal distribution with of mean 5 miles and standard deviation of 3 miles over x- and y-axes of (0, 10) in miles. An average driving speed of 30 mile/h (or 48 km/h) was assumed. The travel distance between any two arbitrary locations was presumed to be 1.4 times the Euclidean distance of these two locations, which is consistent with assumptions in [4]. Table 3 presents other categories of uncertainty as set in the simulation runs and related details. Probability distribution functions were adopted from [3], where they were estimated based on data obtained from a meal delivery company for a real-world location—specifically, historical data involving a meal delivery company’s order deliveries completed each Friday over one month. The distributions and parameters of order placement, order preparation, courier sign-in time and sign-in location, and working durations were generated from the data. For each distribution, the data was fit to a normal distribution.
A 14-h meal-delivery period is investigated. To ensure that all orders arising within the period are fulfilled and completed, the simulator is set to run an extra 2 h, but with no new orders received in the added 2 h. For the runs with a fixed fleet of drivers, drivers were presumed to be available for all jobs if not in the process of fulfilling a job.
Experiments were conducted to test meal delivery performance as measured by CtD times under both fixed-fleet and at-will courier settings. In runs with the at-will couriers, the number of couriers arriving to the system over the 8-h period is presumed to be proportional to the order demand rate. In real settings, this behavior can be encouraged through surge pricing, where couriers are given a bonus to fulfill jobs during periods of high demand. Finally, for the heuristic, the number of decomposition cycles N , number of subsets K , stopping parameter θ , and tabu tenure are set to 5, 4, 7, and 5, respectively. Order assignment decisions are made every 3 min.
Additional experiments with these settings were conducted to assess the influence of courier availability to serve the system and courier likelihood of rejecting delivery jobs on system performance. Results of these runs were used to assess the risk to a meal delivery environment of relying on an at-will workforce.
In total, 30 experiments were conducted. Across experiments, the rejection rate ranged from 0 to 0.5, taken in increments of 0.1. Under each of the six rejection rate settings, the courier sign-in rate was set between 0 and 40% below the baseline taken in increments of 10%. Each experiment involved 100 replications of the simulated environment over an 8-h period. Average performance metrics over the 100 replications are reported.

5.2. Results and Discussion

Through repeated runs of the fixed-fleet and at-will courier models, the number of fixed-fleet drivers and hourly sign-in rates for the at-will couriers create an average 35-min CtD times. An average over the simulation replications of 602 orders are placed over the meal delivery period. Table 4 shows that on average 126 at-will drivers are needed over the 14-h period to obtain the same average order fulfillment percentage as can be attained by a fixed fleet with 32 drivers who work the entire 14 h.
To compare values, a concept of delivery resource is created. Delivery resource is defined as the sum of time periods in which a courier or driver is present in the meal delivery environment. With this measure, it is found that 126 at-will courier working hours, assuming a desired work duration of 2 h, is needed to obtain the average target performance of 35-min CtD time. With the fixed fleet, the total of 481 working hours is incurred. Thus, each order delivery consumes 0.51 courier hours with the at-will courier versus 0.78 driver hours per order with the fixed fleet. Thus, by using an at-will workforce, a reduction of 35% in resource utilization is possible while meeting the same average target performance level.
While the at-will work environment incurs less delivery resources per order to meet an average performance target, there are orders that do not meet the target. The risk of failing to meet the CtD time of 35 min and greater for each worker setting was further investigated.
Figure 3 shows the probability distribution of CtD time values. The figure indicates that the CtD times has a slightly skewed bell shape reaching its peak at approximately 30 min. It has a longer tail at its highest values, reaching over 80 min in some cases. Thus, the figure shows that under both workforce settings, some orders will fail to meet even very long CtD times. Excessively long CtD times can result in lost short-term profits. Even a few orders with excessively long CtD times can have longer-term repercussions through negative impacts on reputation and lost future business. To evaluate the risk of late delivery from using at-will couriers, this work compares the CVaR values of using at-will and fixed-fleet drivers at an exogenously chosen tolerance level ( 1 β ). Higher values of β imply lower tolerance for risk of late delivery.
The results in Table 5 show the risk of late delivery under values of β varying between 0.9 and 0.999, where 0.9 is a standard in CVaR literature [22]. For a tolerance for late delivery of β = 0.9, the CVaR of using fixed-fleet drivers was found to be 60.11, indicating the expected CtD time of the worst-case 10% of deliveries is 60.11 min. CVaR is slightly lower at 59.12 min for at-will couriers. These values can be compared to the desired 35-min CtD. This implies that if a high tolerance exists for late delivery, an at-will courier workforce may be preferred. With decreasing tolerance for late delivery, e.g., β = 0.995 , a fixed fleet of drivers will be preferred to using at-will couriers. That is, the difference in CVaR of using at-will couriers versus a fixed fleet of drivers is 26.96 min with 139.91 min for the former and 112.95 min for the latter. Thus, with low tolerance for extreme lateness in deliveries, operating with an at-will courier workforce may be problematic.
The risk of not being able to fulfill orders (i.e., business lost) as a consequence of having fewer than needed at-will couriers sign into the meal delivery setting was investigated. Figure 4 shows the change in CVaR with a reduction by 0 to 40% in increments of 10% in courier sign-in rate under different risk tolerance ( 1 β ) levels. At each tolerance level, the 100% sign-in rate of the at-will couriers provides a baseline for use in comparisons. The results indicate that for β of 0.9, 0.95, or 0.99, there is little change in CVaR with a reduction in courier sign-in rate from 0 to 10%. CVaR increases gradually as the reduction in courier sign-in rate increases from 10% to 40%, where β is set to 0.9 or 0.95. For a 10% reduction in courier sign-in rate and β of 0.999, inferring that the delivery company has almost no late-risk tolerance, CVaR changes more dramatically from 200 to 237. These observations suggest that even in cases with higher risk tolerance (where β = 0.9), the risk of fewer than needed at-will couriers signing into the meal delivery setting (e.g., at 20% reduction from baseline) may not be acceptable. However, at most levels of tolerance, a 10% reduction in couriers signing in may be acceptable.
Figure 5 shows the change in percentage of orders fulfilled with increasing order rejection probability by 0 to 0.5 in increment of 0.1 assuming a baseline courier sign-in rate. Generally, CVaR increases with increasing order rejection rate, and CVaR values are substantially higher with lower tolerance levels. For a tolerance level of 0.9, CVaR values increase gradually as rejection probability rises. For risk tolerance settings of 0.999, where there is very little acceptance of risk, even a small order rejection probability will lead to very high values of CVaR. This high CVaR value indicates the existence of unacceptable conditions.

6. Conclusions

An increasing popularity in gig employment has enabled the use of an at-will workforce of self-contracted couriers to participate in many service industries, and has come to play a particularly important role in the growing meal delivery service industry in many urban areas. Hiring at-will couriers for delivery job fulfillment can decrease the costs of satisfying nonstationary demand. However, at-will workers need not promise to show up for work. Using at-will couriers may pose important risks to a meal delivery company, affecting service reliability and, consequently, customer satisfaction, partner relationships, and reputation. This work investigates the tradeoffs between using such an at-will workforce of couriers in place of a fixed fleet of drivers in servicing a meal delivery environment. A stochastic DES with tabu search heuristic and embedded ejection chain approach for optimal delivery job bundling, routing and assignment was developed and run within a rolling horizon framework to replicate the dynamics of such a meal delivery environment. The DES captures the numerous sources of uncertainty, including courier sign-in and sign-out times and locations, delivery job rejection decisions, courier willingness to wait in the system while idle, order arrivals, order preparation times, travel times, order delivery and pickup locations, and more.
A risk evaluation metric, CVaR, is employed to measure the risk of intolerably late delivery. Results of numerical experiments involving runs of the DES for a medium-size case study with 25 restaurants indicate that using at-will couriers for meal delivery can enable more efficient use of delivery resources, but at a cost of higher risk of late delivery, and even intolerably late delivery, as compared to using a fixed fleet of drivers to fulfill orders. Prior works that have compared the use of a fixed-fleet against use of at-will couriers in meal delivery have all focused on cost. This work illuminates an additional dimension through its focus on risk and failure to meet acceptable service levels as a consequence of using a more cost-effective at-will workforce.
Additional experiments were conducted by feeding data from historical instances provided by Grubhub to the public in place of simulated data. Results of these experiments using both environments were remarkably similar and confirm the utility of the simulated environment.
This work made assumptions and can be extended in several directions. Of note, theoretical distributions were employed in creating case study details. While the vast majority of the chosen distributions followed similar distributions with relevant parameters obtained from real-world data, these presumed values were applied in an alternative, hypothetical location with fewer restaurants. Additional assumptions about courier repositioning behavior were made that may require modification, as the at-will couriers may reposition to locations with high restaurant density or popularity, or for personal tasks, rather than to the closest restaurant. Future extensions might include a study of the benefits of a mixed fixed-fleet and at-will workforce. Determining surge prices to attract more couriers to maintain sufficient delivery capacity in peak times, and thus support a profitable business model, is the subject of ongoing work by a subset of the authors.

Author Contributions

Conceptualization, E.M.-H. and S.S.; methodology, W.Z.; software, W.Z.; validation, W.Z. and E.M.-H.; formal analysis, W.Z.; investigation, W.Z. and E.M.-H.; resources, E.M.-H.; data curation, S.S.; writing—original draft preparation, W.Z.; writing—review and editing, E.M.-H.; visualization, W.Z.; supervision, E.M.-H.; project administration, E.M.-H.; funding acquisition, E.M.-H. All authors have read and agreed to the published version of the manuscript.

Funding

This research was funded by the U.S. National Science Foundation grant number 1823474.

Data Availability Statement

Some or all data, or code that support the findings of this study are available from the corresponding author upon reasonable request.

Conflicts of Interest

The authors declare no conflict of interest.

References

  1. McKinsey & Company Ordering in: The Rapid Evolution of Food Delivery. Available online: https://www.mckinsey.com/industries/technology-media-and-telecommunications/our-insights/ordering-in-the-rapid-evolution-of-food-delivery (accessed on 25 November 2022).
  2. Erera, A.L.; Reyes, D.; Savelsbergh, M.; O’Neil, R.J.; Sahasrabudhe, S. The Meal Delivery Routing Problem. Optim. Online 2018. Available online: https://optimization-online.org/2018/04/6571/ (accessed on 25 November 2022).
  3. Fotouhi, H.; Mori, N.; Miller-Hooks, E.; Sokolov, V.; Sahasrabudhe, S. Assessing the Effects of Limited Curbside Pickup Capacity in Meal Delivery Operations for Increased Safety during a Pandemic. Transp. Res. Rec. 2021, 2675, 436–452. [Google Scholar] [CrossRef]
  4. Ulmer, M.W.; Thomas, B.W.; Campbell, A.M.; Woyak, N. The Restaurant Meal Delivery Problem: Dynamic Pickup and Delivery with Deadlines and Random Ready Times. Transp. Sci. 2021, 55, 75–100. [Google Scholar] [CrossRef]
  5. US Census Bureau Annual Retail Trade Survey Shows Impact of Online Shopping on Retail Sales during COVID-19 Pandemic. Available online: https://www.census.gov/library/stories/2022/04/ecommerce-sales-surged-during-pandemic.html (accessed on 16 January 2024).
  6. Archetti, C.; Savelsbergh, M.; Speranza, M.G. The Vehicle Routing Problem with Occasional Drivers. Eur. J. Oper. Res. 2016, 254, 472–480. [Google Scholar] [CrossRef]
  7. Dayarian, I.; Savelsbergh, M. Crowdshipping and Same-Day Delivery: Employing In-Store Customers to Deliver Online Orders. Prod. Oper. Manag. 2020, 29, 2153–2174. [Google Scholar] [CrossRef]
  8. Arslan, A.M.; Agatz, N.; Kroon, L.; Zuidwijk, R. Crowdsourced Delivery—A Dynamic Pickup and Delivery Problem with Ad Hoc Drivers. Transp. Sci. 2019, 53, 222–235. [Google Scholar] [CrossRef]
  9. Mancini, S.; Gansterer, M. Bundle Generation for Last-Mile Delivery with Occasional Drivers. Omega 2022, 108, 102582. [Google Scholar] [CrossRef]
  10. Yildiz, B.; Savelsbergh, M. Provably High-Quality Solutions for the Meal Delivery Routing Problem. Transp. Sci. 2019, 53, 1372–1388. [Google Scholar] [CrossRef]
  11. Steever, Z.; Karwan, M.; Murray, C. Dynamic Courier Routing for a Food Delivery Service. Comput. Oper. Res. 2019, 107, 173–188. [Google Scholar] [CrossRef]
  12. Jahanshahi, H.; Bozanta, A.; Cevik, M.; Kavuk, E.M.; Tosun, A.; Sonuc, S.B.; Kosucu, B.; Başar, A. A Deep Reinforcement Learning Approach for the Meal Delivery Problem. Knowl.-Based Syst. 2022, 243, 108489. [Google Scholar] [CrossRef]
  13. Yildiz, B.; Savelsbergh, M. Service and Capacity Planning in Crowd-Sourced Delivery. Transp. Res. Part C Emerg. Technol. 2019, 100, 177–199. [Google Scholar] [CrossRef]
  14. Alvarez-Palau, E.J.; Calvet-Liñán, L.; Viu-Roig, M.; Gandouz, M.; Juan, A.A. Economic Profitability of Last-Mile Food Delivery Services: Lessons from Barcelona. Res. Transp. Bus. Manag. 2022, 45, 100659. [Google Scholar] [CrossRef]
  15. Bi, H.; Zhu, X.; Lu, F.; Huang, M. The Meal Delivery Routing Problem in E-Commerce Platforms under the Shared Logistics Mode. J. Theor. Appl. Electron. Commer. Res. 2023, 18, 1799–1819. [Google Scholar] [CrossRef]
  16. Zhou, W.; Fotouhi, H.; Miller-Hooks, E. Decision Support through Deep Reinforcement Learning for Maximizing a Courier’s Monetary Gain in a Meal Delivery Environment. In review by Decision Support Systems.
  17. Liu, Y. An Optimization-Driven Dynamic Vehicle Routing Algorithm for on-Demand Meal Delivery Using Drones. Comput. Oper. Res. 2019, 111, 1–20. [Google Scholar] [CrossRef]
  18. Zhao, Q.; Lu, F.; Wang, L.; Wang, S. Research on Drones and Riders Joint Take-out Delivery Routing Problem. Comput. Eng. Appl. 2022, 58, 269–278. [Google Scholar] [CrossRef]
  19. Liao, W.; Zhang, L.; Wei, Z. Multi-Objective Green Meal Delivery Routing Problem Based on a Two-Stage Solution Strategy. J. Clean. Prod. 2020, 258, 120627. [Google Scholar] [CrossRef]
  20. Gurvich, I.; Lariviere, M.; Moreno, A. Operations in the On-Demand Economy: Staffing Services with Self-Scheduling Capacity. In Sharing Economy: Making Supply Meet Demand; Hu, M., Ed.; Springer Series in Supply Chain Management; Springer International Publishing: Cham, Switzerland, 2019; pp. 249–278. ISBN 978-3-030-01863-4. [Google Scholar]
  21. Gendreau, M.; Guertin, F.; Potvin, J.-Y.; Séguin, R. Neighborhood Search Heuristics for a Dynamic Vehicle Dispatching Problem with Pick-Ups and Deliveries. Transp. Res. Part C Emerg. Technol. 2006, 14, 157–174. [Google Scholar] [CrossRef]
  22. Rockafellar, R.T.; Uryasev, S. Optimization of Conditional Value-at-Risk. JOR 2000, 2, 21–41. [Google Scholar] [CrossRef]
Figure 1. Diagram of the simulation environment.
Urbansci 08 00017 g001
Figure 2. Order assignment procedure: (a) route generation through Tabu search; (b) bundle and assign orders.
Urbansci 08 00017 g002
Figure 3. Comparison of CtD times for at-will couriers and fixed-fleet drivers.
Urbansci 08 00017 g003
Figure 4. Influence of reduction in courier sign-in rate from 100% baseline with 0.2 rejection probability under risk tolerance levels of: (a) 0.9; (b) 0.95; (c) 0.99; (d) 0.999.
Urbansci 08 00017 g004
Figure 5. Influence of change in courier order rejection probability under various risk tolerance levels of: (a) 0.9; (b) 0.95; (c) 0.99; (d) 0.999.
Urbansci 08 00017 g005
Table 1. Optimization in the meal delivery literature.
CitationDriver CategorySign in UncertaintySign out (or Work-Duration) UncertaintyOrder RejectionTravel Time UncertaintyOrder Arrival UncertaintyOrder Preparation UncertaintyApplication Size
Erera et al. [2]At-will couriers
Historical data

Historical data

Historical data

Historical data
Instances with hundreds of restaurants
Yildiz and Savelsbergh [10]Occasional couriers Same set as in Erera et al. [2]
Yildiz and Savelsbergh [13]Fixed fleet supplements at-will couriers
Sign out if idle time exceeds a threshold

Probability of rejecting orders
Focus on single restaurant
Steever et al. [11]Occasional couriers 14 and 34 restaurants
Ulmer et al. [4]Fixed fleet 110 restaurants
Jahanshahi et al. [12]Occasional couriers Orders randomly generated over space—no restaurants
Fotouhi et al. [3]At-will couriers
Sign out after a predetermined sign-out time

Probability of rejecting orders
Replications with 500 restaurants
Alvarez-Palau et al. [14]At-will couriers OR fixed fleet
Historical data

Historical data

Historical data

Historical data
Real-world delivery data, number of restaurants not mentioned
Zhou et al. [16]Single-driver perspective
Sign out after a predetermined sign-out time

Reject orders with information
Replications with 25 restaurants
Table 2. Notation.
Table 2. Notation.
Math SymbolsDescription
O set of orders, O = { 1 , 2 , , O }
Z set of customers, Z = { 1,2 , , Z }
R set of restaurants, R = { 1,2 , , R }
V set of fixed-fleet or couriers, V = { 1,2 , , V }
Ξ support set for uncertainty ξ Ξ    
T time period of meal delivery
r o the restaurant in which order o O is prepared
z o the customer associated with order o O
v o the fixed-fleet driver or a courier who deliver the order o O
t p l a c e m e n t o the placement time of order o O
t r e a d y o the ready time of order o O
t p i c k u p o the pickup time of order o O
t d e l i v e r y o the delivery time of order o O
t ^ d e l i v e r y o expected delivery time for order o O
d delivery time requirement
λ ( t ) parameter of exponential distribution, which denotes the new couriers sign in rate at time t
n 0 v sign in location of courier v V
t 0 v sign in time of courier v V
t e v pre-defined sign out time of courier v V
w v the courier v ’s willingness-to-wait time threshold
τ v courier v ’s planned work duration
n r o location from where the courier need to pick up order o O
z o customer index for order o O
n z o Location to where the courier need to deliver order o O
Table 3. Sources of uncertainty and assumptions.
Uncertainty CategoriesDescription
Order placementThe time between the placement of consecutive orders at each restaurant r R follows an exponential distribution ~ E x p ( λ r · ρ ( t ) ) , where λ r follows a uniform distribution ~ U 0.2 , 1 . This allows the generation of restaurants with varying popularity. ρ ( t ) is a time-based parameter that reflects the temporal influence on the arrival of couriers. For the eight-hour meal delivery period, ρ t = [ 1 , 2 , 3 , 2.5 , 2,1.5 , 2 , 4 , 7 , 6,4 , 3 , 2 , 1 ] .
Order preparation timesThe preparation time of each order follows a truncated normal distribution over interval (5, 120) with mean 17 and standard deviation 10; units in minutes.
Pickup and drop-off service timesThe pickup service time at restaurants and drop-off service time at customers follow truncated normal distributions, both within interval (1, 4) with mean 2.5 and standard deviation 0.5.
Courier sign-in timeThe time between the sign in of consecutive couriers into the platform follows an exponential distribution ~ E x p ( λ · ρ ( t ) ) . λ denotes the base arrival rate, ρ ( t ) reflects the temporal influence on the arrival of the couriers, capturing that more couriers may sign in at the height of demand. Thus, the actual number of at-will couriers present at any point in time will fluctuate over the meal delivery period.
Courier sign-in locationThe sign-in location along horizontal and vertical axes follows a truncated normal distribution within (0, 10) with mean 5 and standard deviation 3, units in miles.
Courier working durationA courier’s work duration follows a truncated normal distribution within (0, 480) with mean 120 and standard deviation 30, units in minutes.
Courier response timeA courier’s response time for accepting or rejecting an order follows a truncated normal distribution within (0.1, 1) with mean 0.3 and standard deviation 0.2, units in minutes.
Courier willingness to wait while idle A courier’s willingness to stay in the platform while idle follows a truncated normal distribution within (8, 22) with mean 15 and standard deviation 5, units in minutes.
Order rejectionCouriers reject a delivery job with probability p   = 0.2.
Order cancellationDuration a customer is willing to wait until his/her order is successfully assigned to a courier before canceling the order follows a truncated normal distribution in the range of (17, 60) with mean 27 and standard deviation 5 with all units in minutes.
Table 4. Fixed-fleet drivers vs. at-will couriers.
Average NumberCtDFreshnessDelivery Resource (Vehicle Hours)Resources Per Order (Vehicle Hours)
Fixed fleet drivers3235.2615.994810.80
At-will couriers126 (total over 14 h with 2-h desired work duration)35.2116.03295.010.49
Table 5. CVaR in minutes for fixed-fleet drivers and at-will couriers.
β Fixed-Fleet DriversAt-Will Couriers
0.960.1159.12
0.9161.3960.46
0.9262.9062.02
0.9364.6863.92
0.9466.8666.27
0.9569.6269.30
0.9673.3273.47
0.9778.6579.60
0.9886.9289.88
0.99101.85113.12
0.995112.95139.91
0.999133.16200.96
Disclaimer/Publisher’s Note: The statements, opinions and data contained in all publications are solely those of the individual author(s) and contributor(s) and not of MDPI and/or the editor(s). MDPI and/or the editor(s) disclaim responsibility for any injury to people or property resulting from any ideas, methods, instructions or products referred to in the content.

