Article

Collaborative Changes between Soil Fauna and Urbanization Gradients in Guangzhou’s Remnant Forests

1
School of Geography and Remote Sensing, Guangzhou University, Guangzhou 510006, China
2
Rural Non-Point Source Pollution Comprehensive Management Technology Center of Guangdong Province, Guangzhou 510006, China
3
Guangdong Institute of World Soil Resources, Guangzhou 510385, China
*
Author to whom correspondence should be addressed.
Urban Sci. 2024, 8(3), 122; https://doi.org/10.3390/urbansci8030122
Submission received: 19 July 2024 / Revised: 20 August 2024 / Accepted: 21 August 2024 / Published: 23 August 2024

Abstract

:
Remnant forests are vital in urban ecosystems as they serve as a crucial link between organisms, inorganic environments, and human settlements. However, there is a lack of research on how urbanization affects the physical and chemical properties of soil in remnant forests, as well as the response of soil fauna to environmental changes within these forests. Our study utilized the urbanization gradient research method to investigate the characteristics of the soil fauna community in remnant forests across different urbanization gradients and to understand its intrinsic response to environmental changes. Our results indicate support for the “moderate disturbance hypothesis” based on the statistical values of diversity indices. Additionally, it was found that SOM and Pb are the primary factors influencing soil fauna diversity in the remnant forests, while SOM and Zn are the main influencing factors for the dominant soil fauna groups. To elucidate the impact of urbanization on soil fauna biodiversity in remnant forests, future studies should consider other urbanization factors.

1. Introduction

In the past 40 years, China has experienced significant urbanization due to government planning, economic globalization, and the deepening of household registration system reforms [1]. From 2004 to 2019, the urbanized area of China increased from 3.04 × 10⁴ km2 to 6.03 × 10⁴ km2, marking a 98.4% increase [2]. Additionally, statistics released by the National Bureau of Statistics in early 2022 indicated that China’s urbanization rate in 2021 reached 64.72%, signifying a transition to modernization [3].
As urbanization and ecological levels improve, there exists an inverted “U” curve relationship. This signifies that, with the continuous advancement of urbanization, the environmental challenges stemming from rapid economic development become increasingly prominent. However, when urban development reaches modernization, these environmental issues are alleviated [4]. Consequently, in the current phase of economic development in China, more obvious ecological environmental problems are inevitable. The most significant problem is the continuous reduction in ecological space due to the expansion of production and living areas, leading to the substantial replacement of the original natural landscape dominated by vegetation with man-made impermeable surfaces [5]. This process has resulted in a range of adverse effects, including the exacerbation of the heat island effect, the diminishment of biodiversity, and the deterioration of soil environmental quality [6,7].
The remnant forest is the outcome of the competition for space. As an essential component of the urban ecosystem with an interconnected natural and man-made environment, the remnant forest plays a crucial role in storing and capturing carbon, enhancing soil quality, and maintaining the dynamic balance of interactions between nature, the city, and humans [8]. Furthermore, in comparison to other urban components, the remnant forest is subjected to fewer disturbances from human activities, and its inherent environmental characteristics are more stable. Its soil can serve as an important indicator of ecological changes [9]. In the context of urbanization, environmental variables like temperature and humidity have created a decreasing gradient at the urban-to-suburban ecological interface. This has affected the soil’s physicochemical properties and other characteristics of the remnant forest. It has also altered the soil’s ecological environment and distribution patterns in the spatial and temporal [10].
In recent years, prompted by growing concerns about the relationship between urban living and ecological well-being, there has been an increasing scholarly focus on the changes in the soil environment in remnant forests due to urbanization. For example, Magiera [11] discovered that urbanization has led to serious soil heavy metal pollution and posed serious ecological risks for urban forest soils in the industrial zone of Upper Silesia, Poland. By analyzing the gradient of urban environmental factors (like air temperature, nitrogen deposition rate, and CO2 emission), Chen [12] concluded that urbanization had a detrimental impact on the accumulation of soil organic carbon in urban pine forests in Guangdong Province. Additionally, Fang [13] studied the heavy metal content of urban woodland soil in Changsha City and found that rapid urbanization has resulted in differing potential ecological hazards for forest soil across different areas of the city, with higher levels of heavy metal damage observed in urban woodland soil compared to suburban areas.
Most of the existing research on remnant forests, both at home and abroad, focused on investigating the relationship between soil pollutants (like soil heavy metals and microplastics) and changes in physicochemical properties. In contrast, insufficient attention has been directed towards soil organisms, particularly concerning the limited exploration and examination of the pressure–state–response mechanism of soil fauna in response to environmental alterations. The relationship between soil fauna-related indicators and soil environmental factors remains inadequately elucidated [14,15]. Several studies posit a negative correlation between soil fauna diversity and the degree of urbanization. For example, Naggy [16] suggested that changes in habitats and food webs caused by urbanization would hinder the survival and reproduction of cryptozoological (rove beetles) taxa. Conversely, certain studies have illustrated that moderate urban disturbance can be conducive to the survival of soil fauna. For example, Yu [17] concluded that moderate urbanization can furnish favorable habitats and food sources for soil fauna, including concealed spaces beneath paved surfaces, irrigation water, and discarded food. The soil fauna represents an essential component of soil ecosystems, actively participating in the intricate processes of material and energy flow within the ecosystem, ultimately contributing significantly to the maintenance of ecosystem function and stability [18]. Therefore, it is of paramount importance to conduct comprehensive research on soil fauna diversity in urban surface layers and elucidate the associated environmental feedback mechanisms, both positive and negative.
To sum up, this study is centered on examining the soil fauna community in the remnant forests of Guangzhou, referring to the urbanization gradient research approach by establishing three distinct research gradients: urban, suburban, and exurban. This research methodology replaces the temporal scale with the spatial scale to investigate the soil fauna community characteristics within remnant forests across each gradient, along with the underlying influence mechanisms stemming from environmental changes. Furthermore, it aims to explore the potential ecological and environmental risks of the soil in the remnant forests of the city, hoping to provide a scientific basis for urban planning, urban forest conservation, and restoration strategies. Ultimately, this study aims to contribute to environmental risk management aligned with the objectives of the Five-Sphere Integrated Plan, while fostering the sustainable development of the urban environment.

2. Materials and Methods

2.1. Study Area and Site Selection

The study is situated within the Pearl River Delta of Guangzhou City, spanning latitudes from 22.43° N to 23.93° N and longitudes from 112.95° E to 114.05° E. It is positioned on the mainland of China, facing Lingdingyang Bay and the South China Sea. The region exhibits a subtropical monsoon climate, characterized by abundant water and heat resources. The predominant zonal soil is lateritic red earth, accompanied by subtropical evergreen broad-leaved forests typical of the monsoon region. Additionally, Guangzhou serves as a quintessential example of rapid urbanization expansion in China and globally [19]. Notably, as of 2021, the urbanization rate of Guangzhou City has escalated to 86.46% [20]. It plays a critical role in the coordinated construction and development of city clusters in the Guangdong-Hong Kong–Macao Greater Bay Area [21]. Moreover, it assumes significance in advancing the construction of an ecological civilization in urban areas nationwide [22].
In this study, the urbanization gradient analysis method was implemented with Liwan District as the focal point. Three urbanization gradient zones were established from west to east (R1 = 10 km, R2 = 20 km, R3 = 30 km), representing high to low levels of urbanization: urban, suburban, and exurban areas. In each gradient zone, 7 representative remnant forest plots were selected (Figure 1). These plots exhibit zonal vegetation, specifically evergreen broad-leaved forests, are situated at a minimum distance of 0.5 km from the primary road, and have remained unaffected by significant natural or human interference, such as forest fires, floods, or agricultural cultivation, over the past three decades.
Urban (r1 < 10 km): This area denotes a densely populated, highly urbanized old district with a history of over a century of residential and commercial use. The remnant forests are primarily situated close to buildings and are susceptible to substantial human disturbance. Suburban (10 km ≤ r4 < 20 km): This area represents a newly developed town during the rapid economic expansion of Guangzhou. The building density and land use intensity are lower compared to the urban area, and a greater expanse of remnant forest.
Exurban (r3 < 30 km): This region is designated as a key innovation zone for future development, primarily encircled by residential and small-scale commercial land. The remnant forests generally lie at higher elevations than those in the suburban area, encountering comparatively lesser human disturbance.

2.2. Soil Sampling

In the above three urbanization gradients, 21 remnant forest plots were established with sampling strips in areas with slopes between 15° and 20° and consistent slope directions. In each plot, three quadrats of uniform dimensions (5 m × 5 m, with a spacing of more than 10 m) were set up. Soil samples were then collected from relatively flat areas with consistent light conditions and minimal human interference using the diagonal sampling method. To minimize the impact of organic matter on the surface, soil samples were drilled from the same soil layer (0–10 cm) with a soil auger (d = 5 cm) after removing vegetation and litter. To reduce soil heterogeneity, three sampling points within each quadrat were mixed into one soil sample. In total, 126 soil samples were collected (63 soil physicochemical samples and 63 soil fauna samples). The sampling structure is illustrated in Figure 2.
The collected soil samples must be promptly sent to the laboratory for processing. For samples used for the determination of soil environmental elements, stones, and visible soil plants and animals and their remains need to be removed, sieved (2 mm, 20 mesh), and allowed to dry naturally before testing soil physicochemical indicators.

2.3. Indicators and Experimental Methods

2.3.1. Measurement of Soil Physicochemical Properties

Soil pH was measured using a 1:2.5 soil–water suspension with the potentiometric method. Soil organic matter (SOM) was determined using the H2SO4–K2Cr2O7 oxidation method. Soil total nitrogen (TN) was quantified by the Kjeldahl acid digestion method. Soil heavy metals (Zn, Cu, Cd, and Pb) were analyzed after digestion in a mixture of nitric, perchloric acid, and hydrogen peroxide. Subsequently, we referred to the document “Risk Screening Values for soil heavy metal The Pearl River Delta Area” (DB 44/T 1415-2014) [23] and used the single-factor pollution index (SPI) and Nemerow comprehensive pollution index (NPI) to assess the soil heavy metal contamination status in remnant forests of Guangzhou [24]. The single-factor pollution index and Nemerow comprehensive pollution index grading scheme are shown in Table 1.

2.3.2. Soil Fauna Sampling and Identification

Taking advantage of the fact that soil fauna avoids light and heat, the collected soil samples are placed on the Tullgren Dry Funnel for preliminary separation of soil fauna specimens. After continuous light irradiation for 48 h, take out the sample bottle placed under the dry funnel in advance (the bottle mouth needs to be close to the outer wall of the funnel mouth). To maintain the integrity of soil fauna and facilitate the subsequent identification of soil fauna and the measurement of related indicators, an appropriate amount of alcohol needs to be injected into the sample bottle in advance.
According to Yin Wenying’s “Illustrated Handbook of Soil Animals in China” [25], we counted and identified the collected soil fauna specimens under a stereo microscope (Leica S8 APO; Motic SMZ-171) to the major categories.

2.4. Statistical Analysis

The frequency of soil fauna is represented by the proportion of individuals of a particular species in the total catch. The abundance of soil fauna is divided into three levels: dominant groups (groups with a number of individuals N more than 10% of the catch, abbreviated as “+++”), common groups (groups with a number of individuals N accounting for 1% to 10% of the catch, marked as “++”), and rare groups (groups with a number of individuals N less than 1% of the catch, identified as “+”) [26]. Additionally, we selected the Shannon–Wiener Biodiversity Index (H’), Simpson’s Dominance Index (C), Density-Group Index (DG), Margalef Richness Index (D), and Pielou’s Evenness Index (J) to analyze the diversity of soil fauna communities, as the following equation:
H = Σ s i = 1 P i ln P i
C = Σ s i = 1 P i 2
D G = g / G Σ i = 1 g D i C i / D i m a x C
D = ( S 1 ) / ln N
J = H / ln S
where Pi = Ni/N, Ni is the number of individuals of the ith species. N is the total number of individuals in the community, and S is the total number of species. g is the number of different groups in a single community and G is the total number of groups in all communities. Di is the number of individuals in group I in a single community and Dimax is the maximum number of individuals in group I among all communities. Ci/C is the ratio of the occurrence of the ith taxon in the C community [27,28,29,30,31].
The processing of experimental data and the creation of charts and graphs were conducted using Microsoft Excel 2019, IBM SPSS 20.0, Origin 2023, and Canoco 5 software. Regarding the examination of the differences in soil physicochemical properties and soil fauna community indicators along the urbanization gradient in the remnant forests, a one-way analysis of variance (ANOVA) and the least significant difference (LSD) method were combined, with the level of significance set at p < 0.05. Additionally, Pearson correlation analysis was used to measure the linear relationship between soil physicochemical variables and soil fauna diversity indices, and redundancy analysis (RDA) was used to analyze the responses of dominant groups of soil fauna in remnant forests to environmental factors.

3. Results

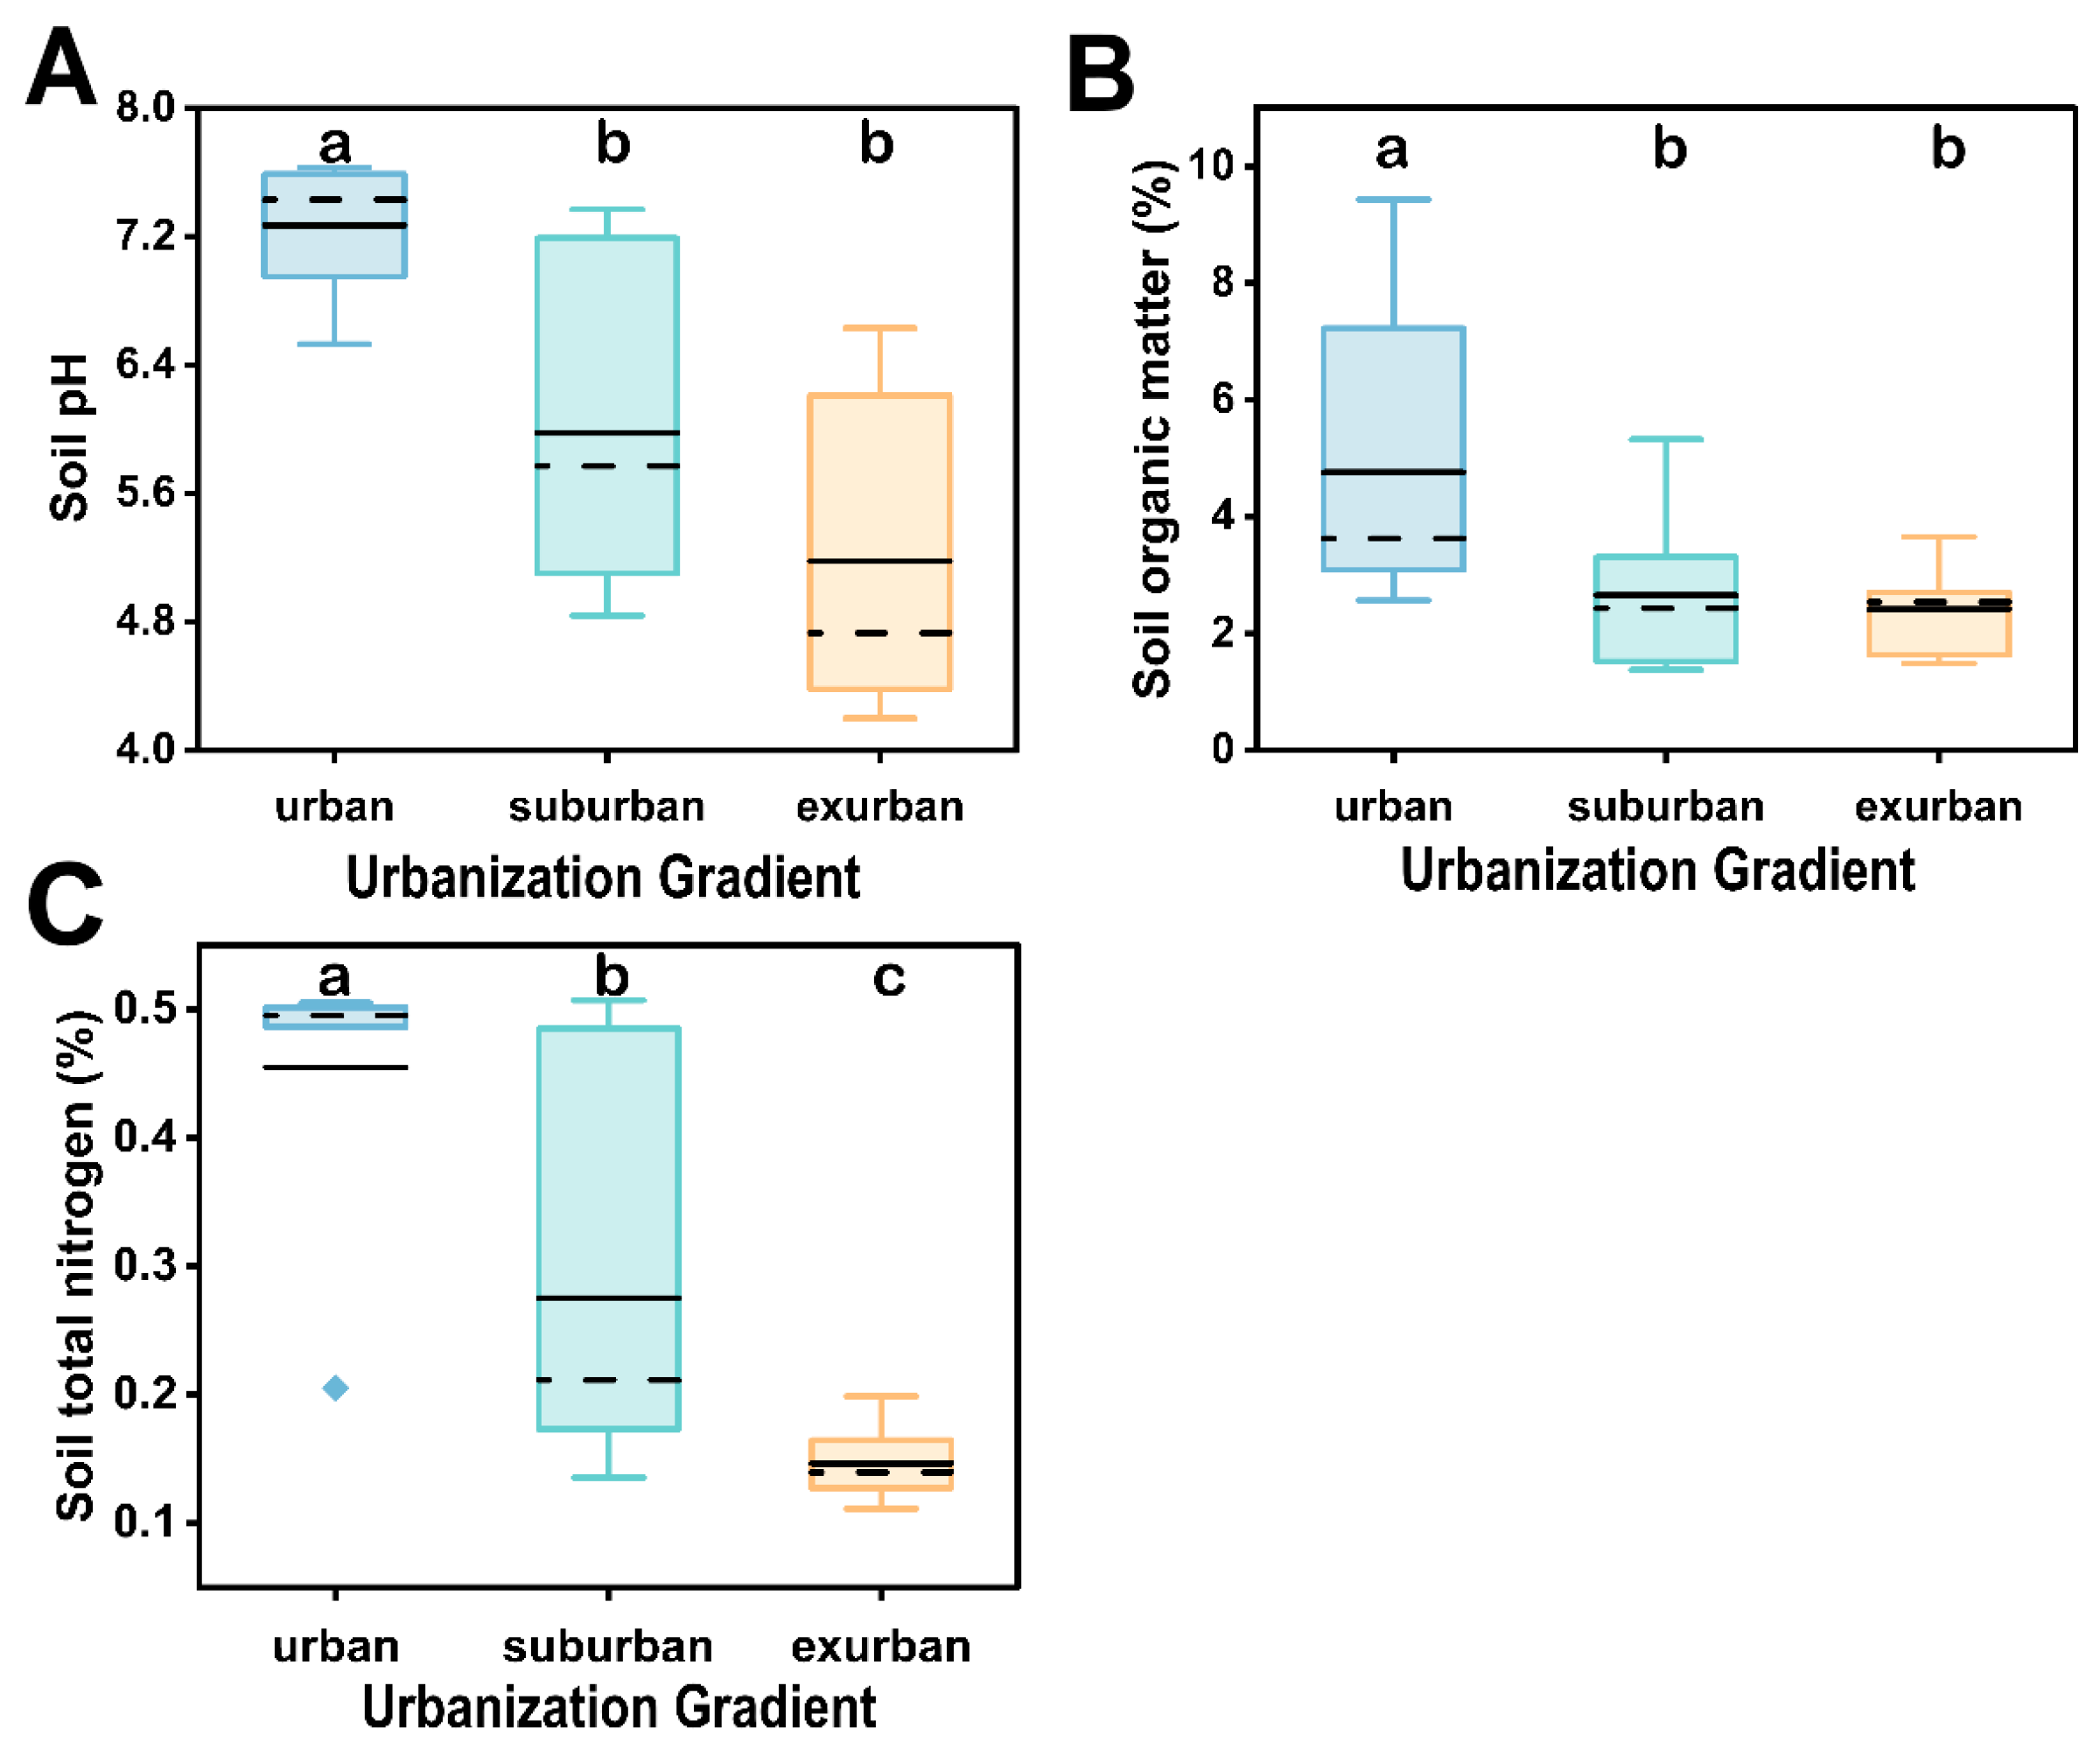
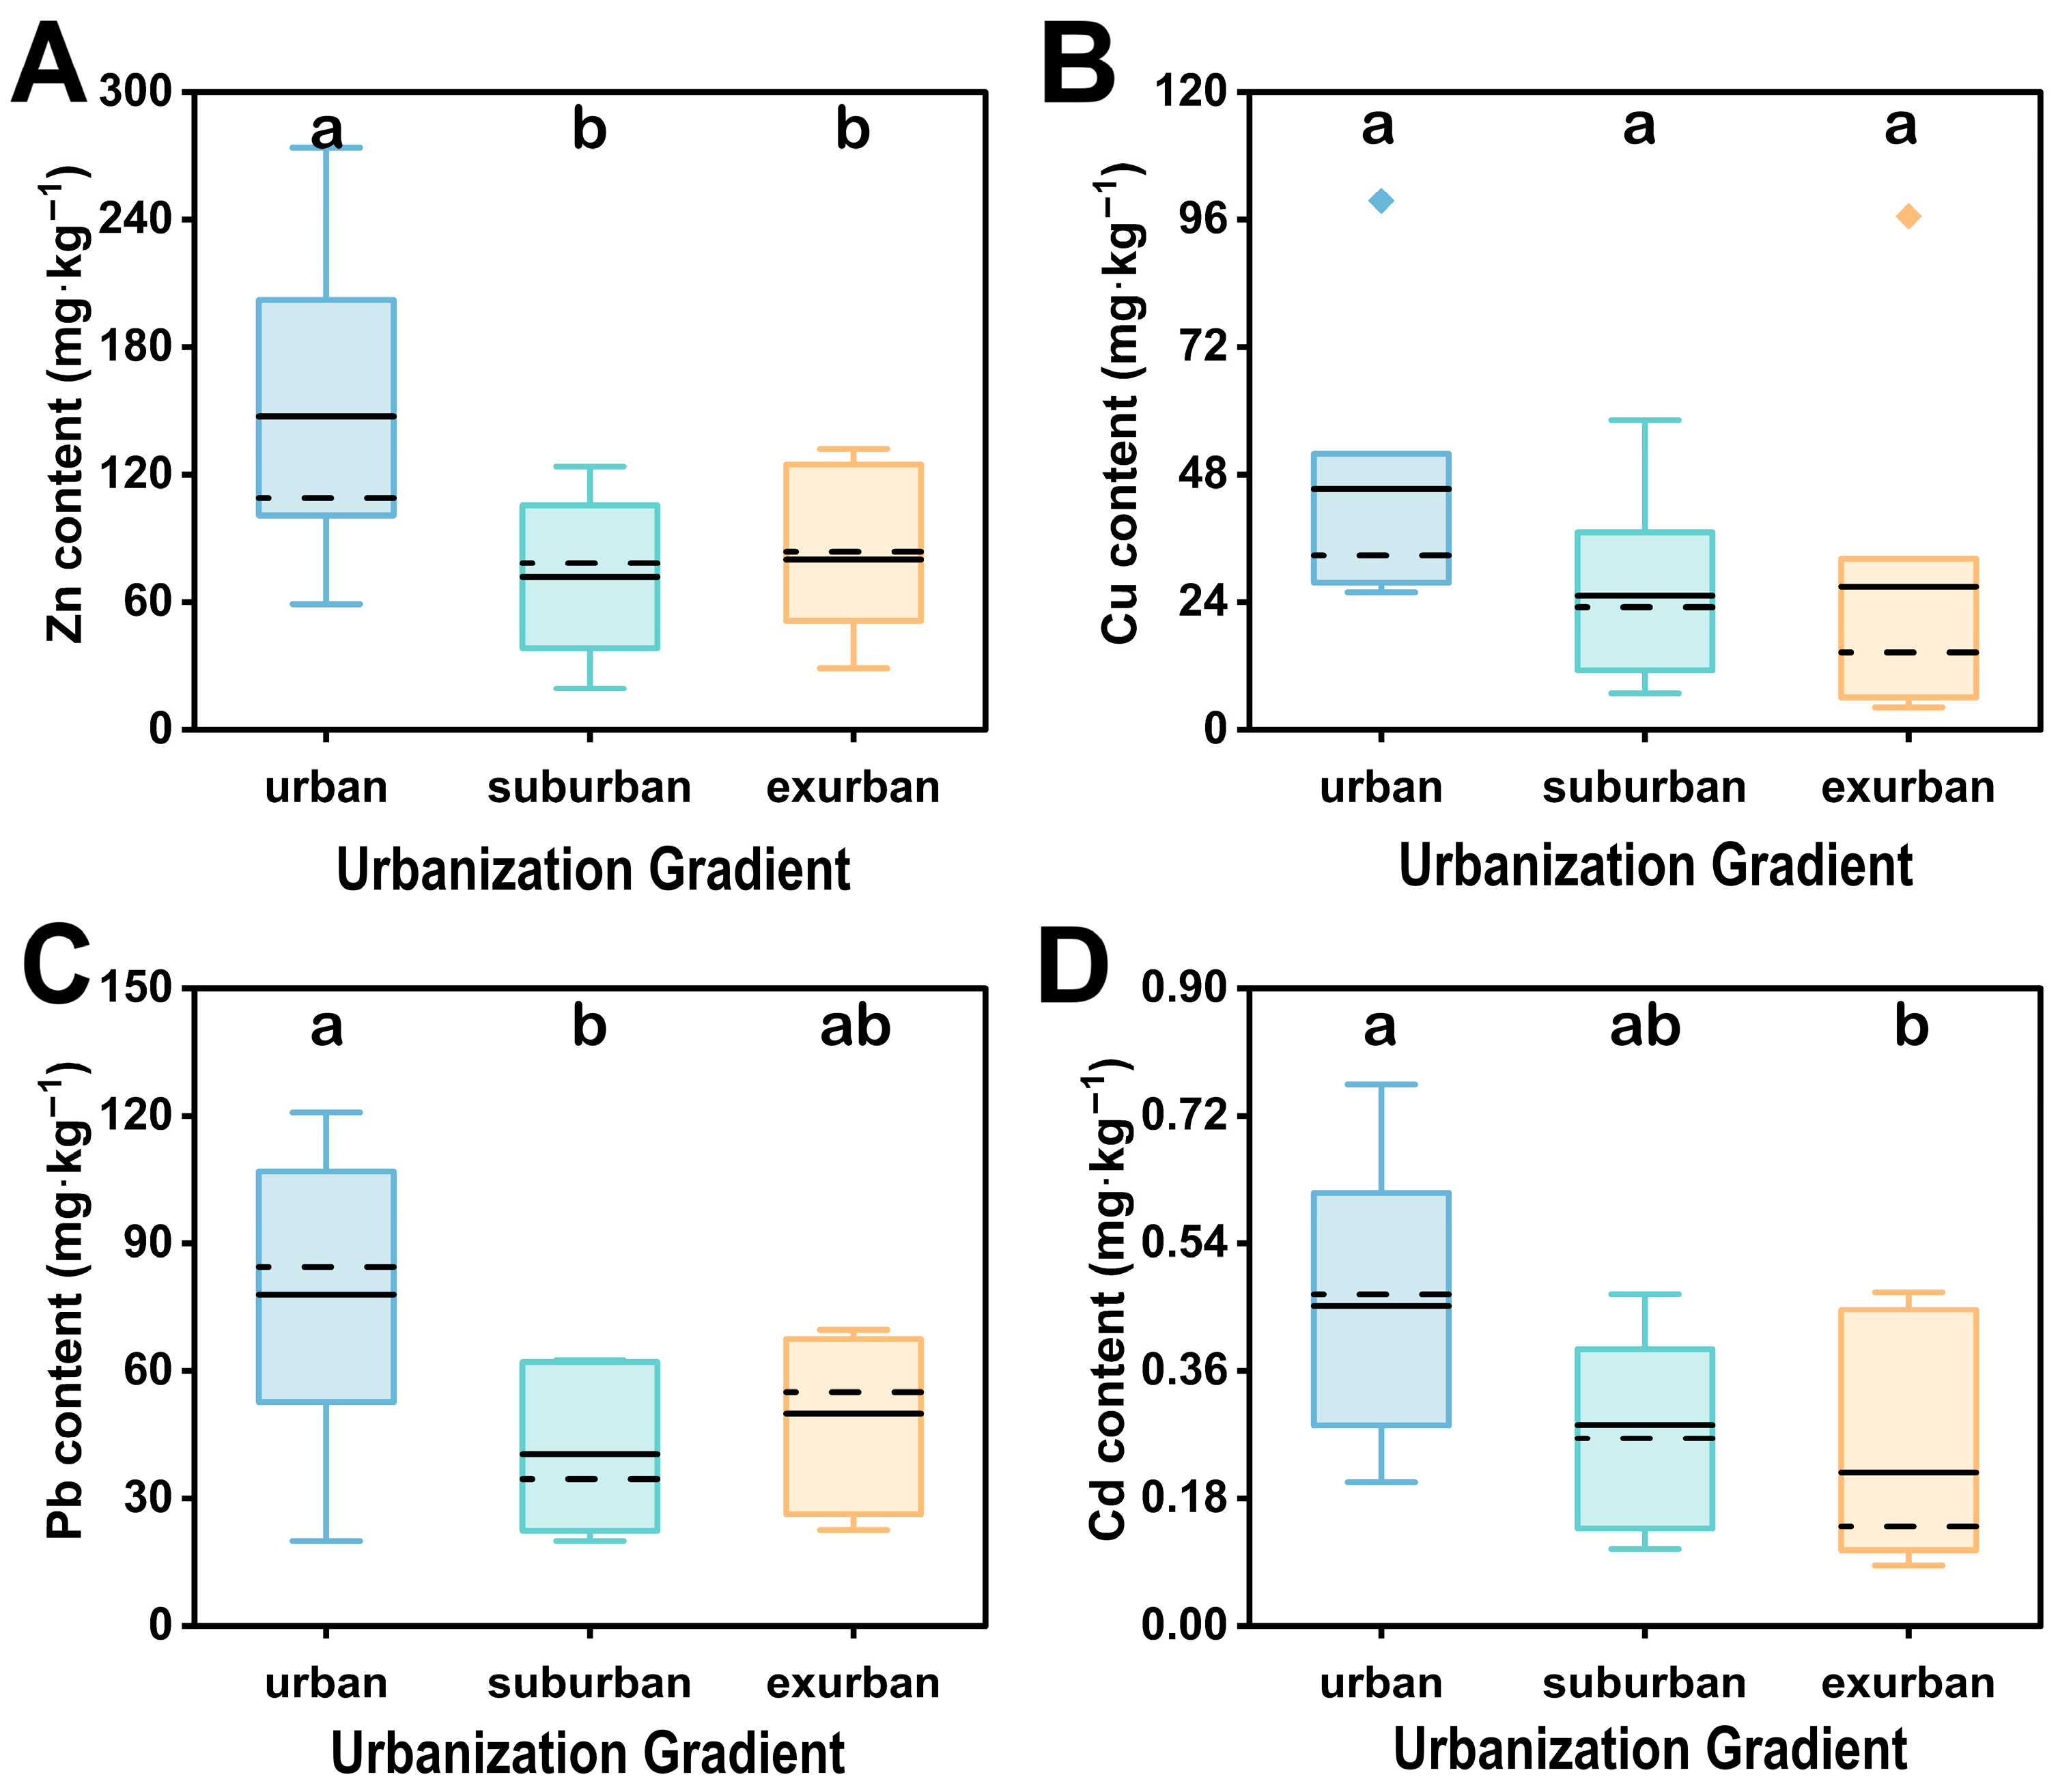
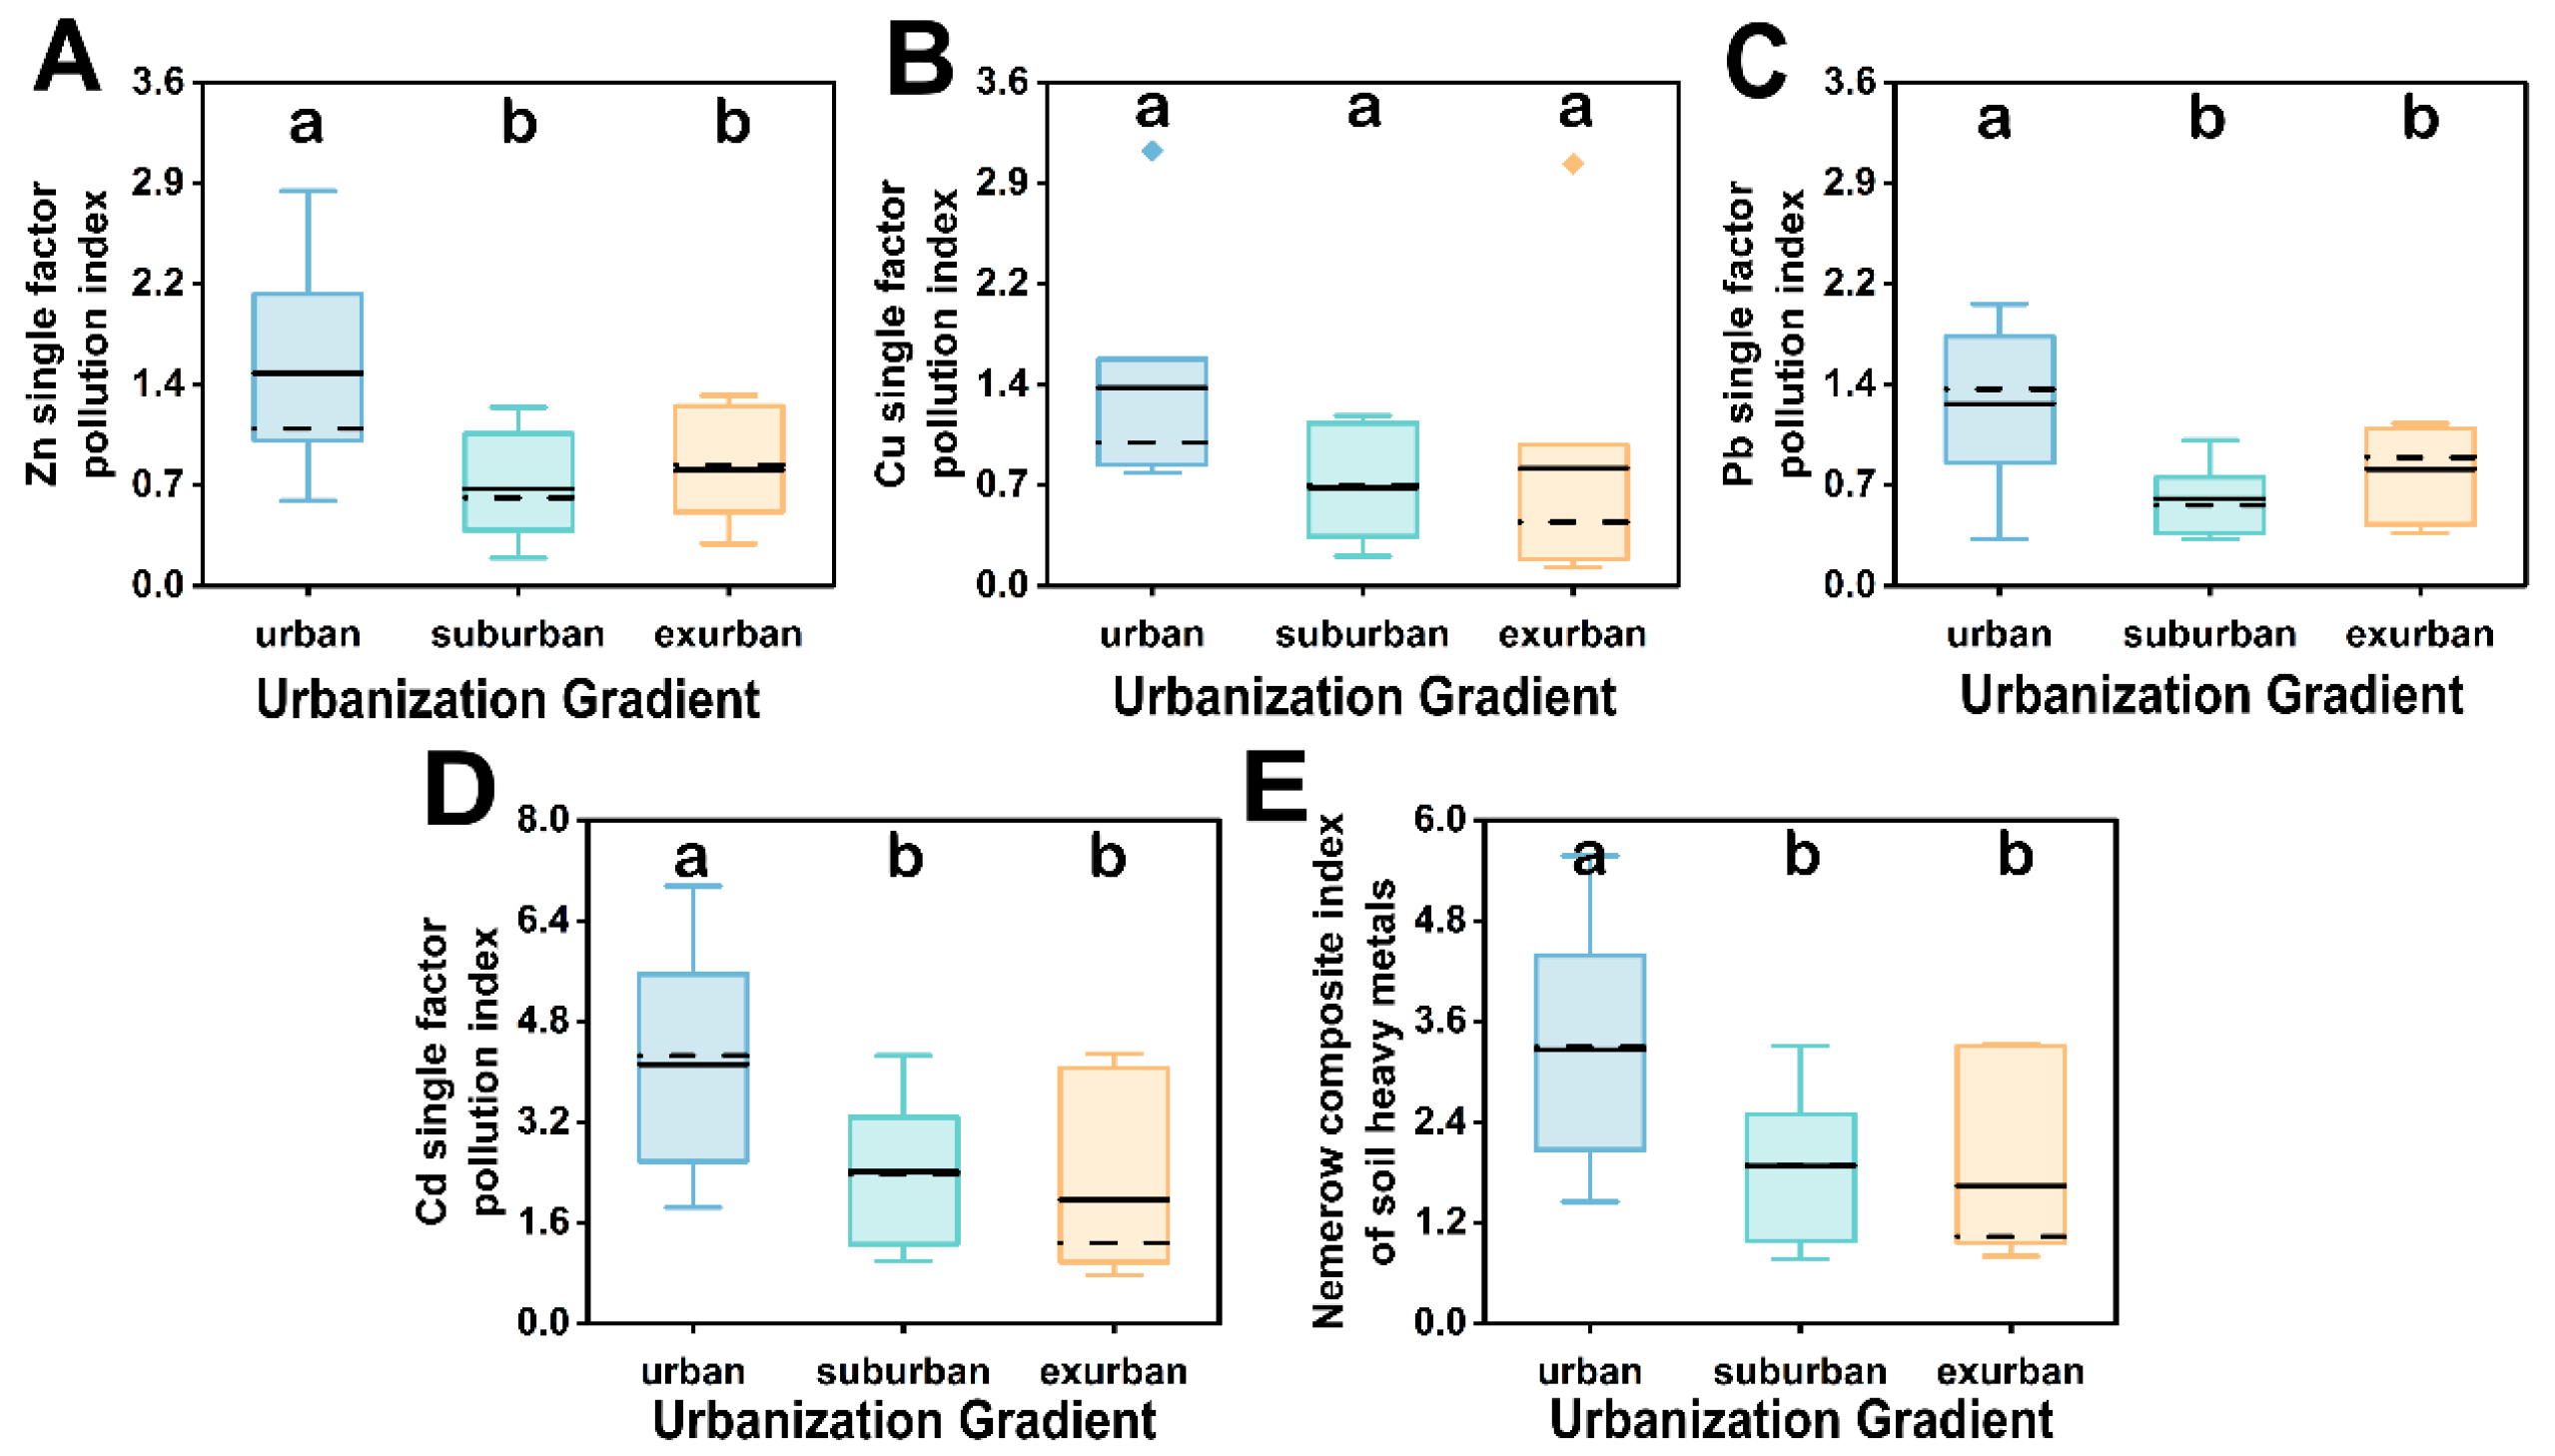
3.1. Soil Physicochemical Characteristics of Remnant Forests along Urbanization Gradient in Guangzhou

Significant statistical differences are evident in soil pH, soil organic matter, and soil total nitrogen across varying urbanization gradients (refer to Figure 3A–C). Concerning soil pH, the soils within remnant forests spanning distinct urbanization gradients predominantly exhibit an acidic nature. A pattern of declining soil acidity is observed as proximity to urban locales increases. Urban soil pH was measured at 7.27 ± 0.14, reflecting a neutral pH level. In terms of soil nutrients (Figure 3B,C), similar to the changing pattern of soil pH, urban areas demonstrate markedly higher nutrient levels than the suburban and exurban areas (p < 0.05).
According to Figure 4, the heavy metal content within the soil of remnant forests exhibits variance along the urbanization gradient. Notably, the average concentration of Zn in the soil (Figure 4A) displays a significant increase within urban areas than suburban and exurban (p < 0.05). The heavy metal element Zn in urban areas measures 147.62 mg/kg, surpassing the soil environmental background value of 97 mg/kg within the Pearl River Delta region. Additionally, as observed in Figure 4C, the average concentration of the heavy metal element Pb in urban areas registers 78.04 mg/kg, representing a 1.3-fold increase over the soil environmental background value of 60 mg/kg and significantly outpacing the other two gradients. Furthermore, concerning the average soil Cd content (Figure 4D), the heavy metal element Cd in the soil of remnant forests across different gradients surpasses the soil environmental background value of 0.11 mg/kg. Notably, the urban area exhibits the highest Cd content at 0.45 mg/kg, followed by the suburban area at 0.28 mg/kg, with the lowest levels in the exurban area at 0.21 mg/kg.
Based on the measured concentrations of soil heavy metals, a statistical analysis was conducted to determine the single-factor pollution index, as depicted in Figure 5. The results indicate varying degrees of soil heavy metal pollution in the remnant forest plots across different gradients. An analysis of the single-factor pollution index for Zn and Pb (Figure 5A,C) reveals that the average indices for Zn and Pb in urban areas range between 1 and 2, denoting slight pollution. In contrast, the average indices in suburban and exurban areas are below 1, indicating non-polluted levels. Overall, the pollution situation in urban areas is notably more severe compared to suburban and exurban areas. Specifically, Zn and Pb pollution levels in urban areas are significantly higher than in other gradients (p < 0.05). Moreover, the average single-factor pollution index for Cd (Figure 5D) reflects a moderate pollution level in urban areas, light pollution in suburban areas, and slight pollution in exurban areas. Notably, the single-factor pollution index for soil Cd in urban areas is significantly higher than in other gradients (p < 0.05).
In the context of remnant forests along the urbanization gradient in Guangzhou, the Nemerow pollution index reveals a hierarchy of pollution levels: urban > suburban > exurban (Figure 5E). Specifically, the soil heavy metal pollution in urban areas has escalated to a severity deemed “seriously polluted”, with the Nemerow pollution index notably higher than that of other gradients (p < 0.05). Conversely, the soil heavy metal pollution levels in suburban and exurban areas are categorized as “lightly polluted”.

3.2. Soil Fauna Biodiversity of Remnant Forests along Urbanization Gradient in Guangzhou

3.2.1. Composition of Soil Fauna Community

The findings presented in Table 2 indicate that a total of 1,300,945 soil fauna were captured in this study, encompassing 18 distinct groups. The predominant groups, namely, Collembola, Oribatida, and Parasiformes, collectively represented 87.36% of the total captures. Additionally, common groups like Diptera larvae, Diplopoda, Microdrile oligochaetes, and Symphyla accounted for 8.21% of the overall captures. The remaining 11 groups, classified as rare, collectively constituted only 4.43% of the total captures.

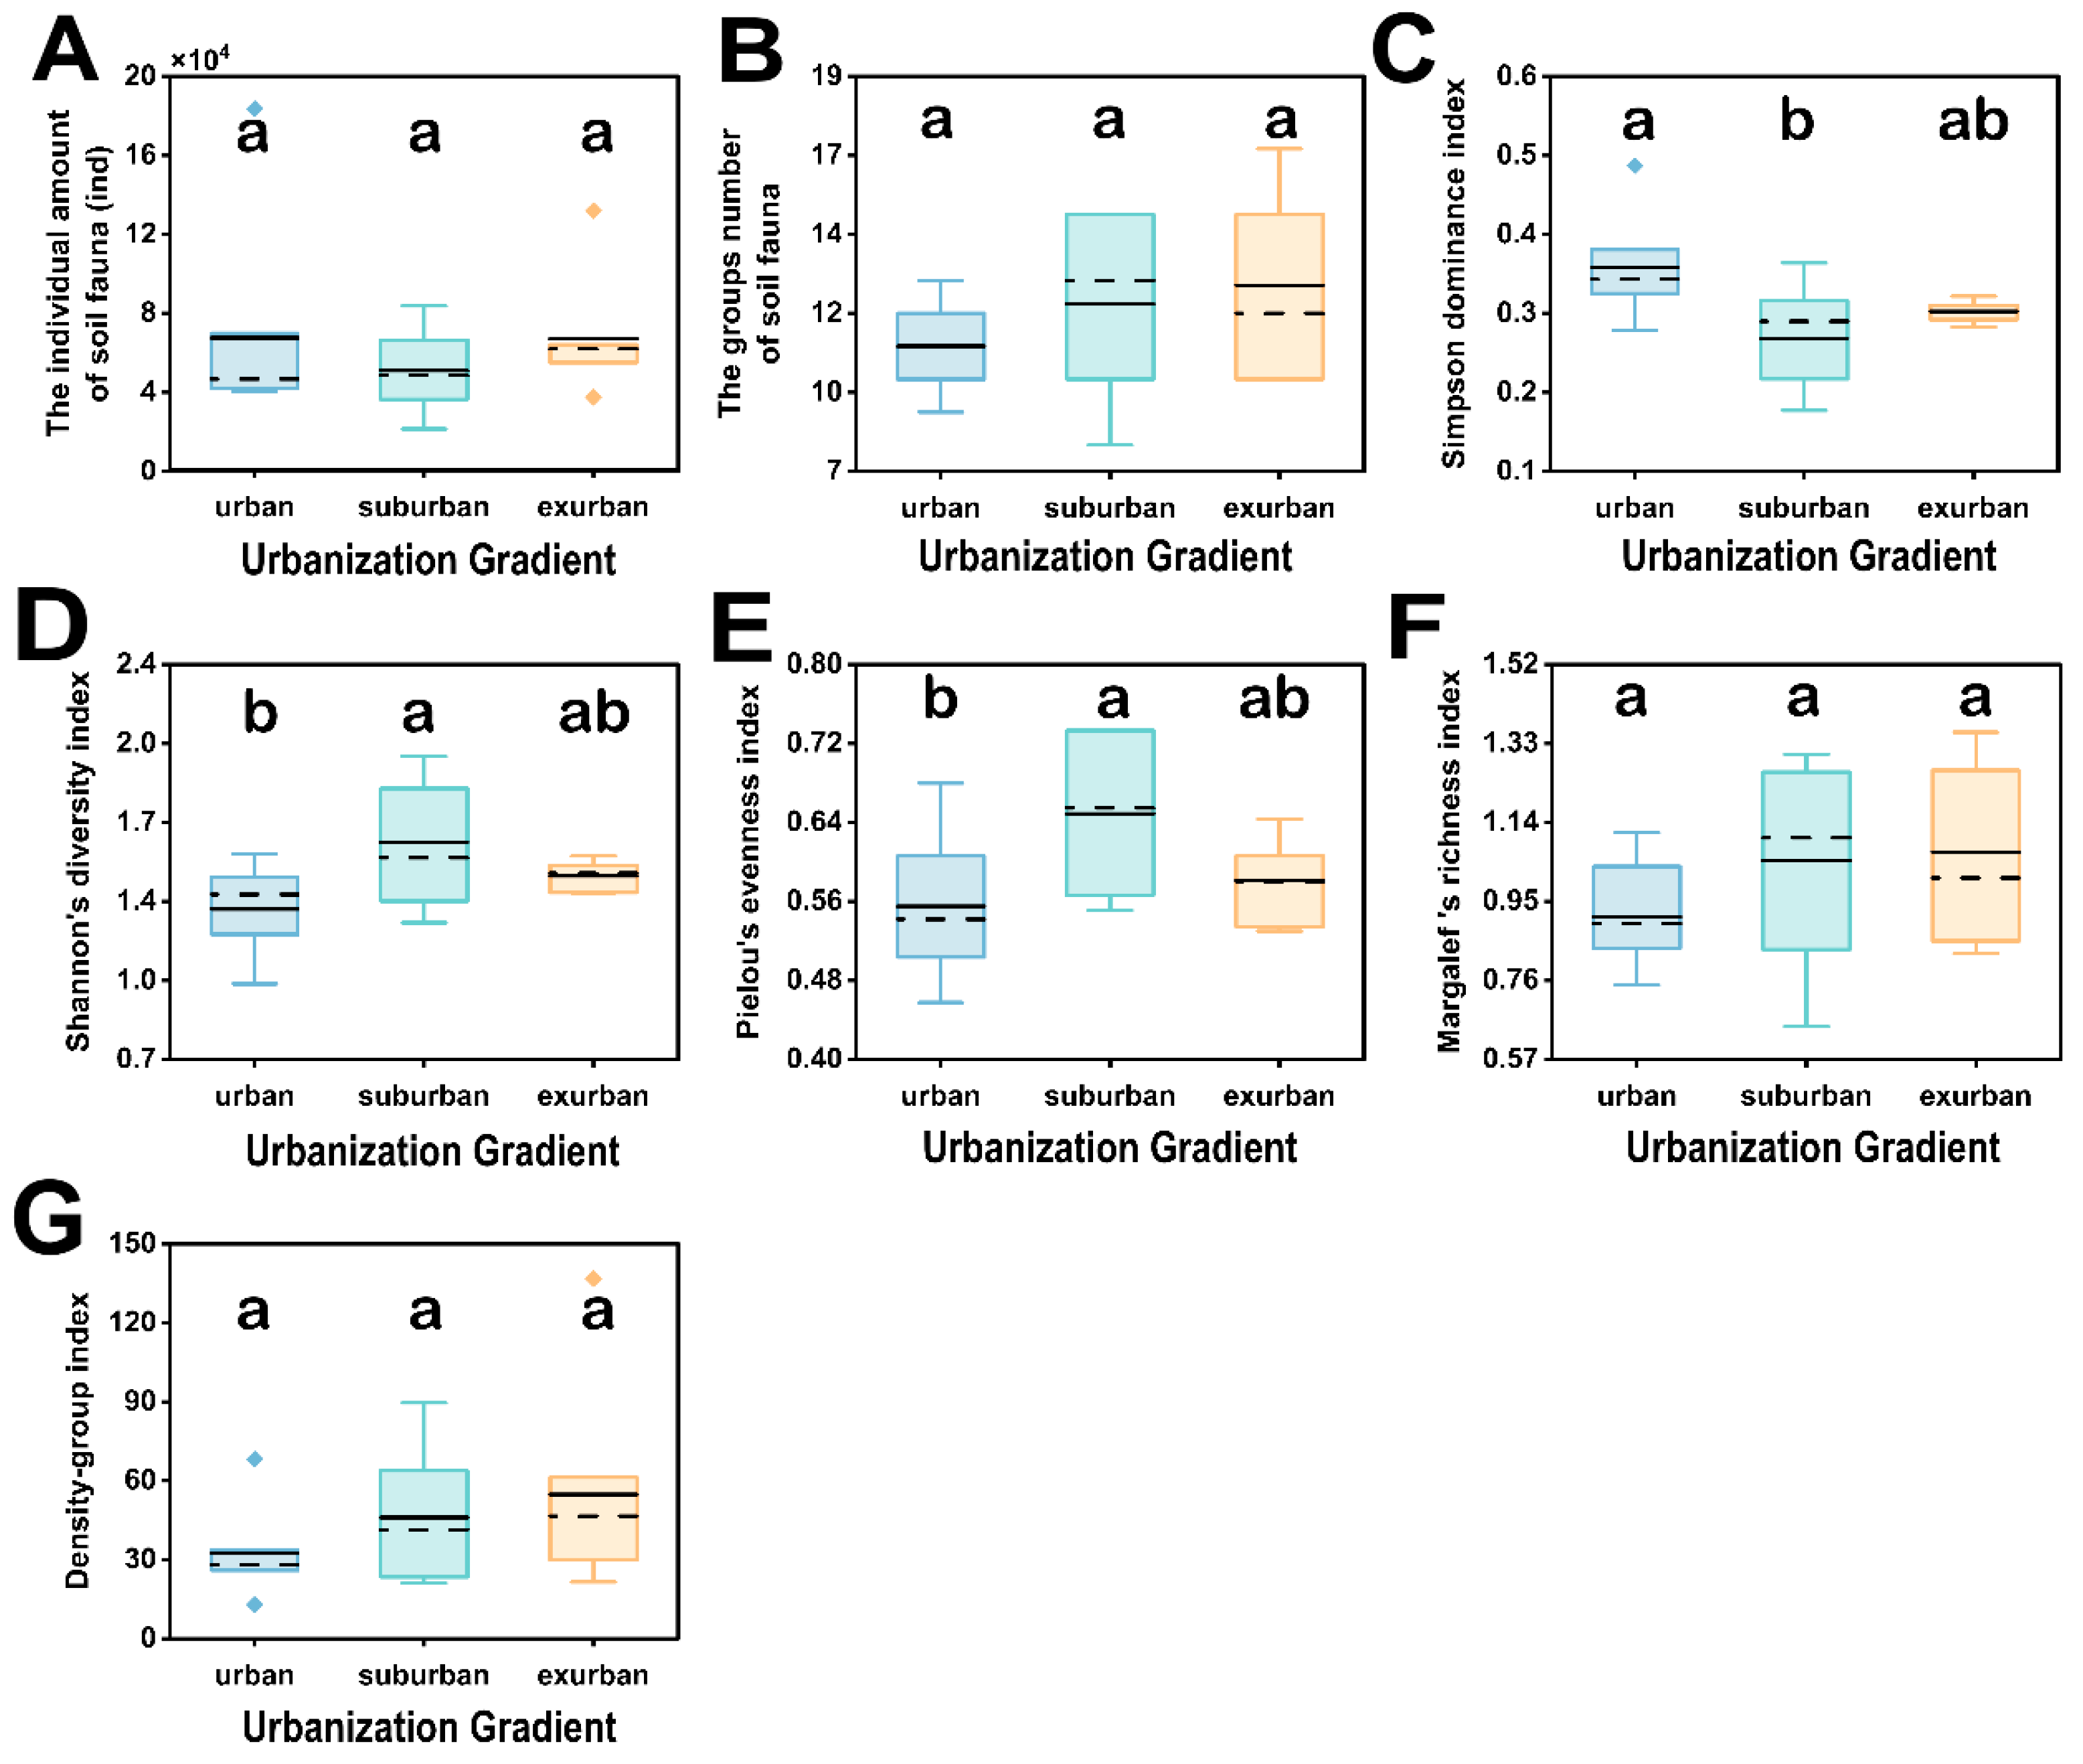
3.2.2. Diversity of Soil Fauna

In Figure 6A,B, there are no significant statistical differences in the number of individuals and groups of soil fauna in the remnant forests with different urbanization gradients. Although urban areas display the highest count of individual soil fauna, they exhibit the lowest number of soil fauna groups. This reduction in environmental heterogeneity, alongside habitat fragmentation and heightened environmental stress in urban remnant forests due to prolonged human interference, may lead to the decline in specific soil animal groups. Simultaneously, species with enhanced adaptability demonstrate an increased prevalence, consistent with the findings presented in Table 2. An analysis of Simpson’s dominance index (C) (Figure 6C) reveals that the dominance index of soil fauna communities in urban areas is the highest, while that of suburban areas is the lowest. Statistical outcomes for Pielou’s evenness index (J) align with the Shannon diversity index (H’) (Figure 6D,E), both indicating that urban areas possess the lowest diversity and the most uneven distribution of soil fauna communities, while suburban areas boast the highest diversity and the most even distribution. These trends are consistent with the statistical results of the Simpson dominance index (C).
Based on the correlation analysis results (Figure 7), a significant positive correlation between the number of individual soil fauna and the number of groups is evident. Additionally, the dominance index demonstrates a highly significant negative correlation with the Shannon diversity index and Pielou’s evenness index, as well as a significant negative correlation with the Margalef richness index. This implies that a heightened dominance within the soil fauna community corresponds to a reduced taxa diversity. Furthermore, a substantial negative correlation is observed between Pielou’s evenness index and the number of individuals, and a considerably positive correlation is noted with the Margalef richness index. Moreover, the richness index exhibits an extremely noteworthy positive correlation with the number of groups, diversity index, and density-group index. Lastly, the diversity index notably correlates positively with the number of groups and the density-group index.

3.3. The Relationship between Soil Fauna Biodiversity and Environmental Factors in Remnant Forests along Urbanization Gradient in Guangzhou

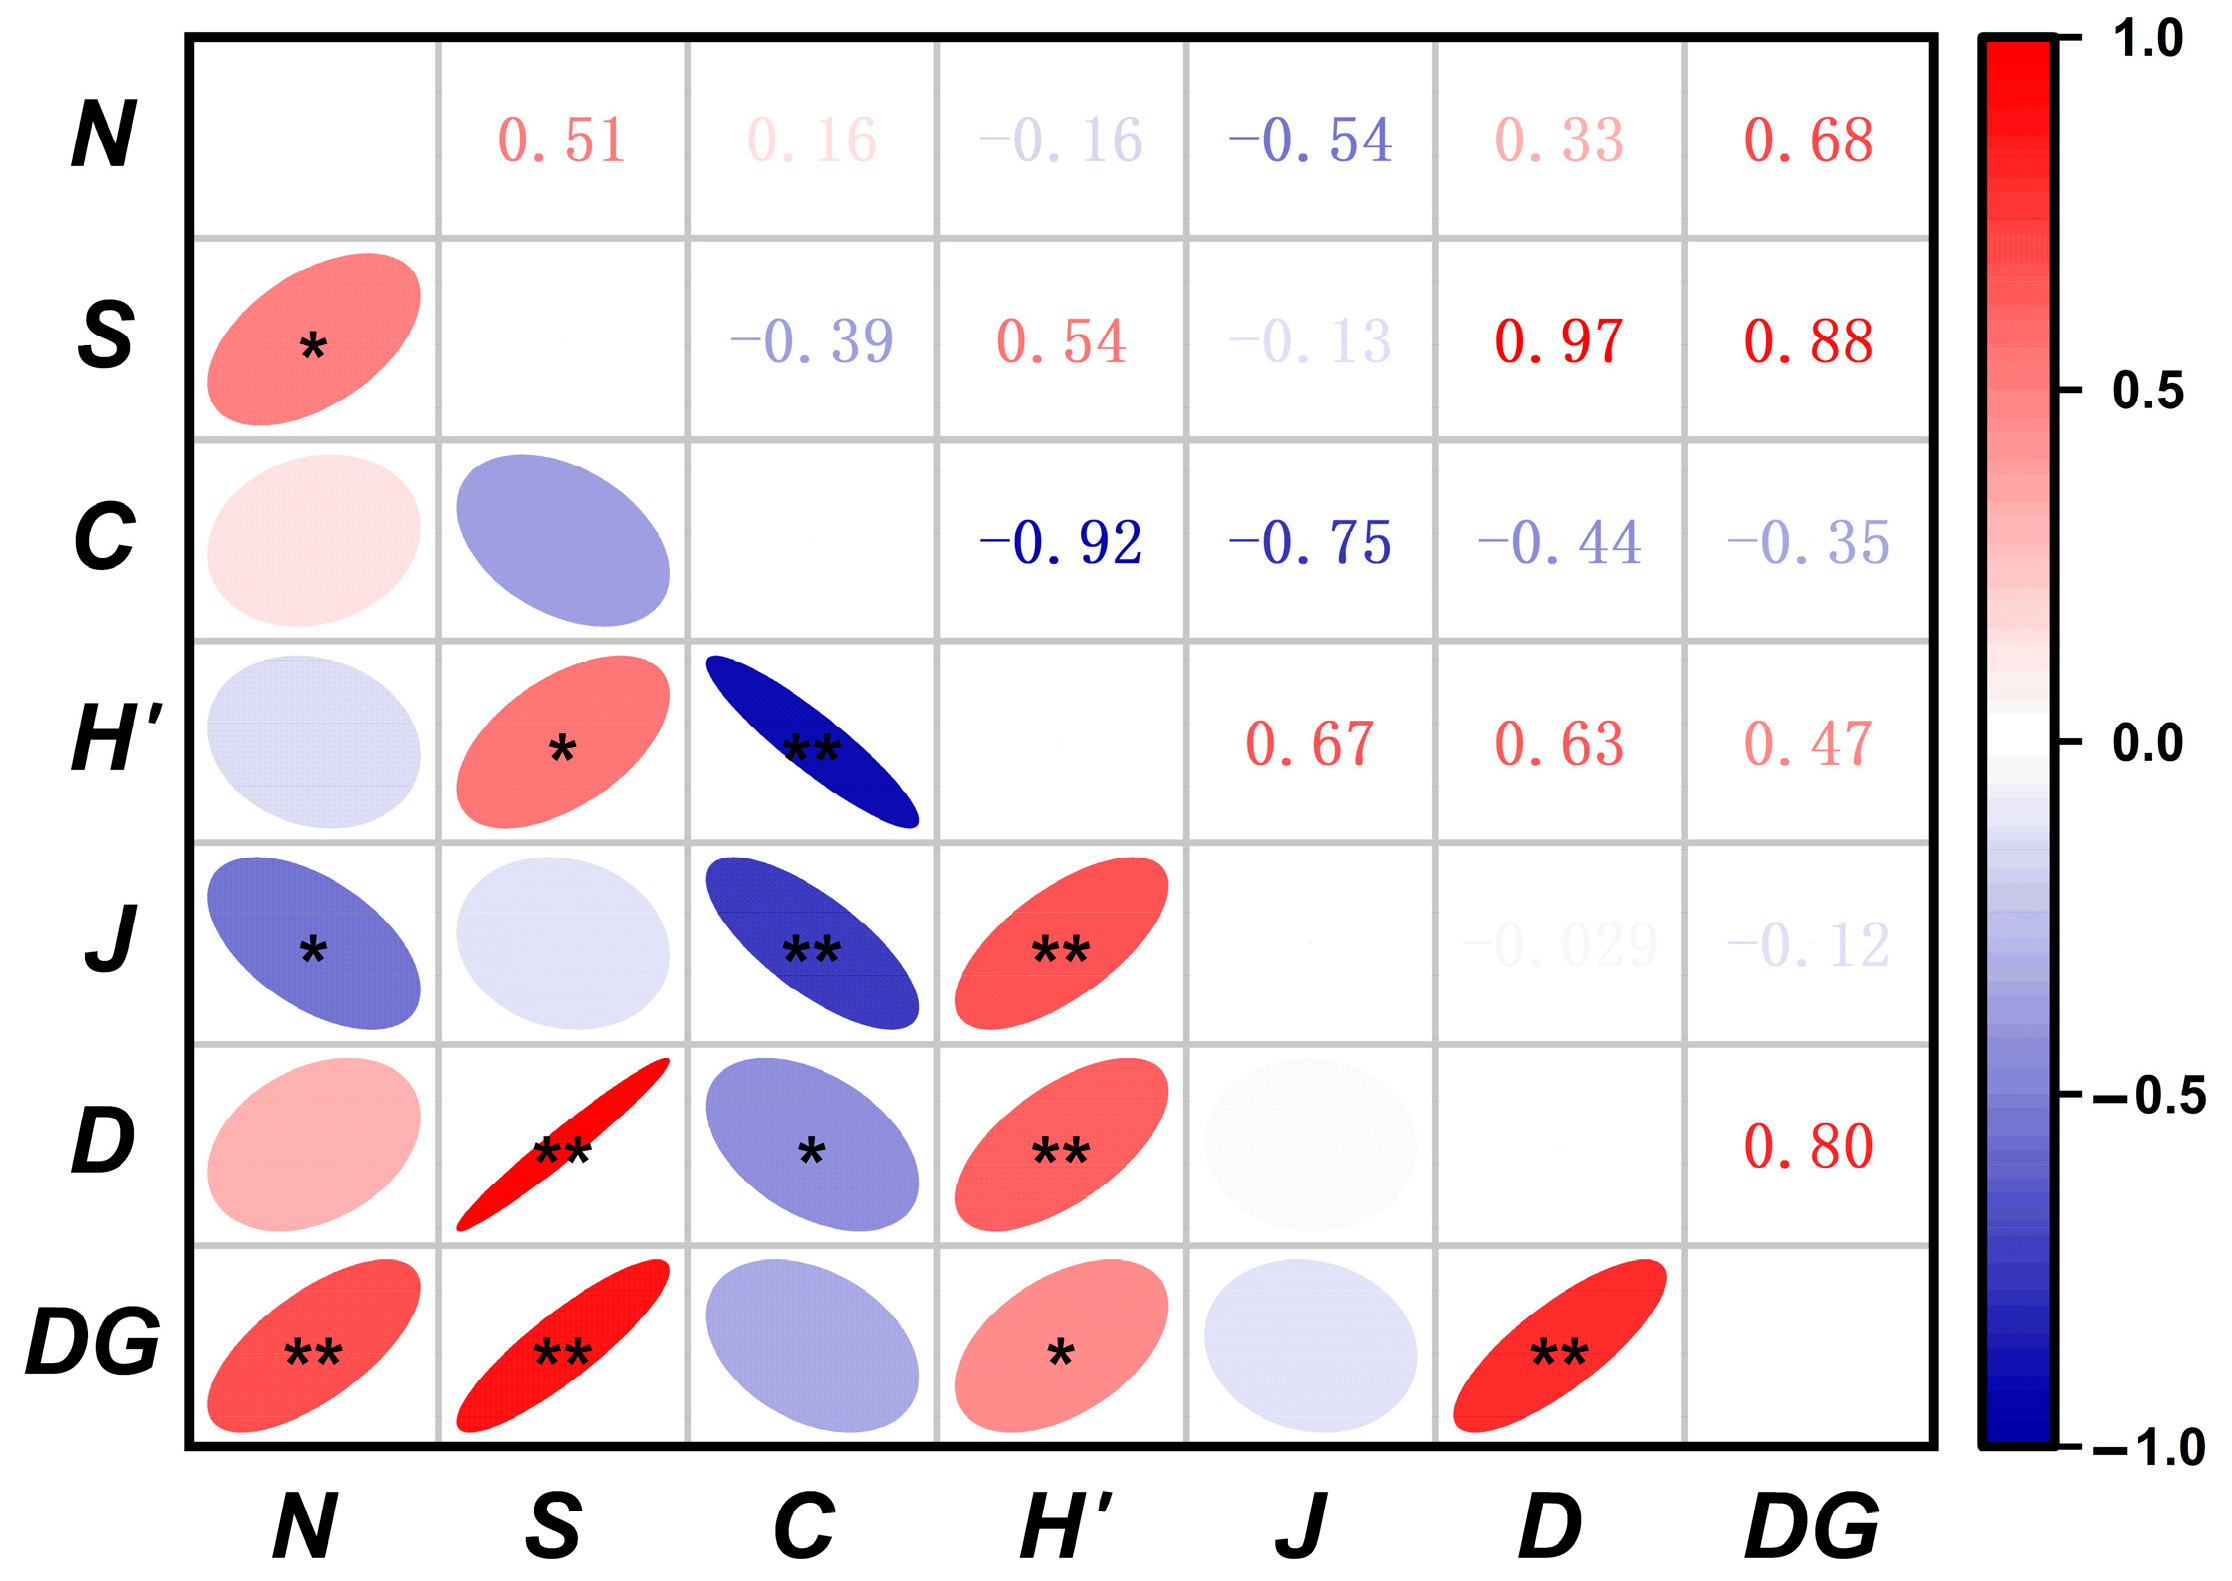
3.3.1. The Correlation Analysis between Soil Fauna Community Diversity Indices and Various Environmental Factors

We conducted a Pearson correlation analysis to investigate the association between the diversity index of soil fauna communities in remnant forests and various environmental factors. As depicted in Table 3, the results revealed that soil fauna diversity is influenced by distinct environmental factors. Specifically, soil organic matter demonstrates an extremely significant positive correlation with the abundance of soil fauna individuals (N) (p < 0.01). Furthermore, soil heavy metals exert an impact on the diversity of soil fauna communities, with the heavy metal Pb exhibiting the most substantial effect. Notably, Pb is significantly positively correlated with the Simpson dominance index (C) of soil fauna (p < 0.05), and significantly negatively correlated with the Shannon diversity index (H’) and Pielou’s evenness index (J) of soil fauna (p < 0.05).

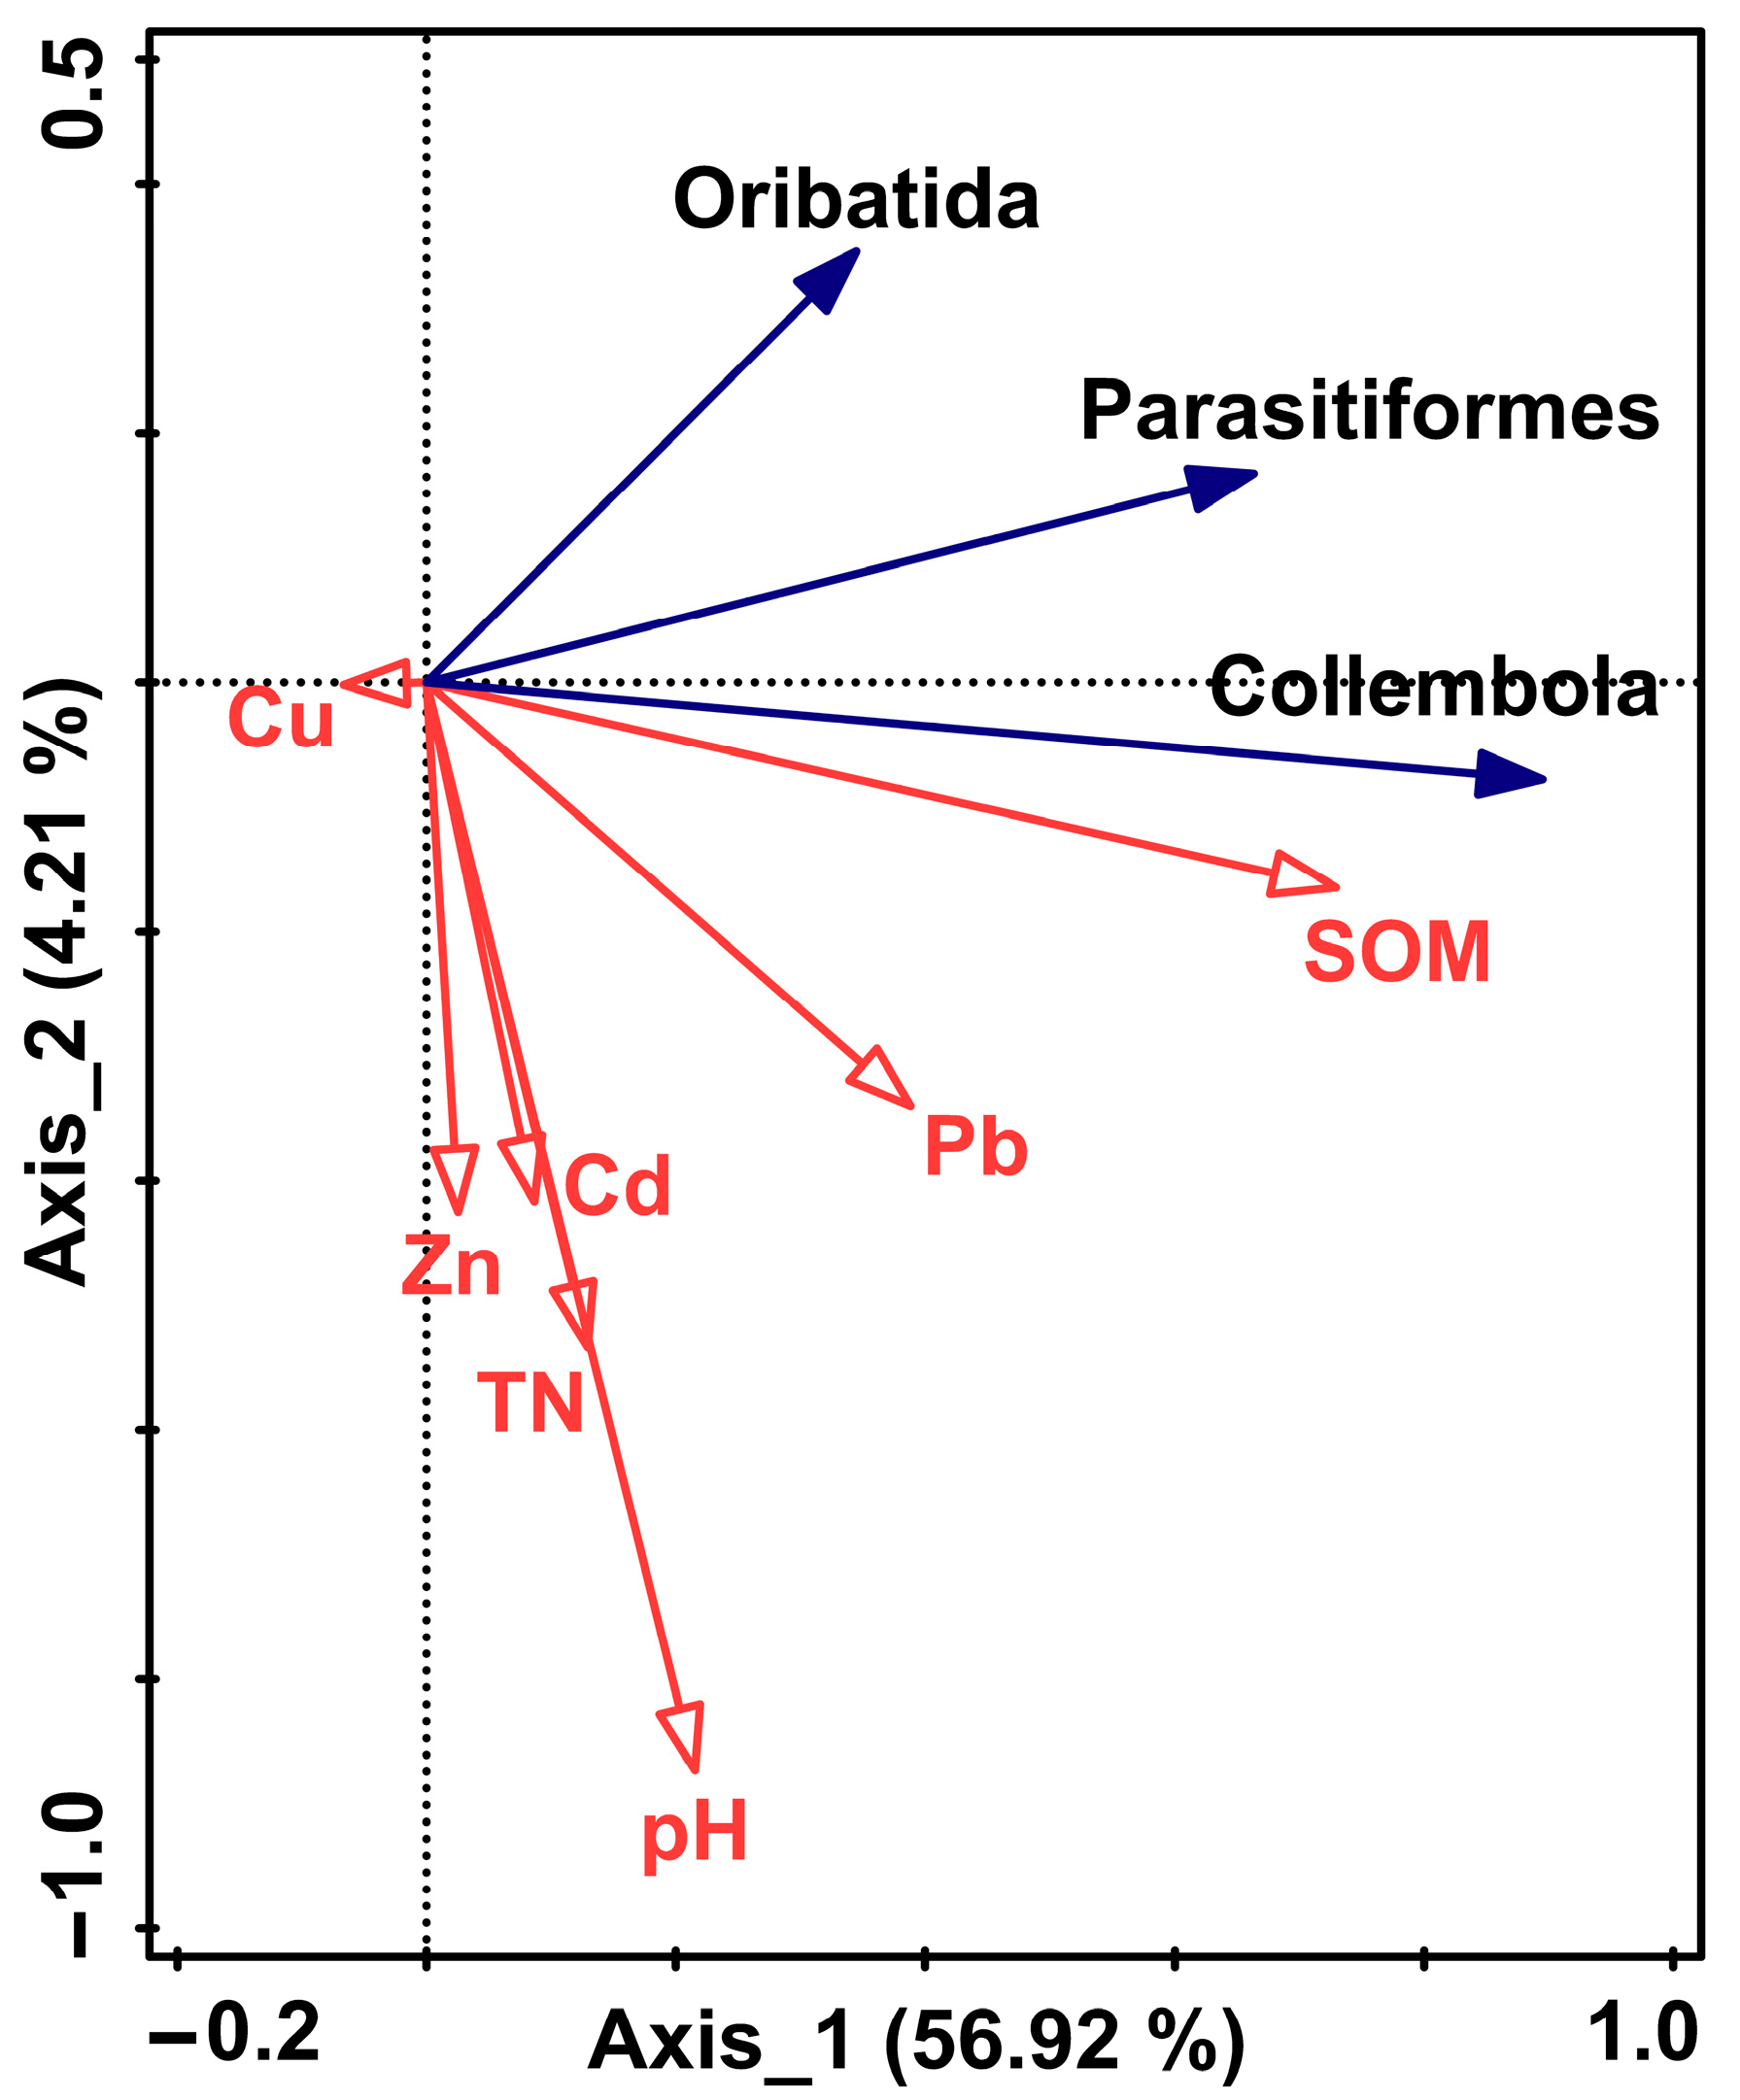
3.3.2. The Redundancy Analysis between the Dominant Soil Fauna Groups in Remnant Forests and Various Environmental Factors

Upon analyzing soil fauna communities within remnant forests along an urbanization gradient, it is evident that the predominant groups (Collembola, Parasitiformes, and Oribatida) collectively represent 87.36% of the soil fauna community. These groups play a crucial role in maintaining the stability of the soil fauna community in the remnant forests. Consequently, a redundancy analysis (RDA) was conducted to explore the relationship between the dominant groups and environmental factors in the soil fauna community of the remnant forests.
In the RDA ordination diagram, the red line denotes the representation of the environmental factors and the blue line signifies the species factors. The magnitude of the arrow line is indicative of the degree of correlation between a specific environmental factor and the distribution of the dominant group. A longer line denotes a stronger correlation, whereas a shorter line implies a weaker correlation. Moreover, the angle formed between the arrow line and the ordination axis serves to express the correlation between a specific environmental factor and the ordination axis. A smaller angle reflects a higher correlation.
The RDA analysis results (Figure 8) reveal that the eigenvalues of the first and second ordination axis amount to 56.92% and 4.21%, respectively, with cumulative explanatory variables accounting for 61.6% of the total eigenvalues. Notably, soil organic matter and soil heavy metal Cu demonstrate a stronger correlation to the first ordination axis, whereas soil total nitrogen, soil pH, and soil heavy metals Zn and Cd exhibit a stronger correlation to the second ordination axis.
Additionally, soil organic matter and soil heavy metal Zn are the primary environmental factors influencing the dominant groups of soil fauna, with respective explanatory values of 30.4% and 10.9% concerning changes in composition (p < 0.05). Oribatida demonstrate a positive correlation with soil organic matter and a negative correlation with other various environmental factors, particularly soil pH, which has been identified as its primary limiting factor. Parasitiformes exhibit positive correlations with soil organic matter and soil heavy metal Pb. Additionally, Collembola show positive correlations with soil organic matter, soil pH, and soil heavy metal Pb, while displaying negative correlations with soil heavy metal Cu.

4. Discussion

4.1. Analysis of Soil Fauna Community Diversity in Remnant Evergreen Broad-Leaved Forests along Urbanization Gradient

Urbanization exerts a significant influence on the composition and structural characteristics of soil fauna communities. In urban areas, the group number of soil fauna, the Shannon diversity index (H’), density-group index (DG), and Margalef richness index (D) are observed to be lower than other forest plots (Figure 6, Table A1). Additionally, the Simpson dominance index (C) is significantly higher in urban areas (Figure 6), indicating reduced soil fauna richness in remnant forest plots within urban settings and a simplified community structure. This is presumably attributed to heightened urbanization levels, intense human activities, and substantial human disturbance of the soil environment, resulting in an adverse impact on soil fauna survival and diminished diversity. Conversely, the Shannon diversity index (H’) and Pielou’s evenness index (J) of soil fauna in suburban areas are significantly higher than those in the exurban areas with lesser human disturbance. Furthermore, the Simpson dominance index (C) is markedly lower in suburban areas, signifying greater soil fauna richness than in exurban areas (Figure 6D,E and Figure 7). This finding indicates that moderate urbanization positively contributes to enhancing soil fauna community richness. This conclusion contradicts the research of Lovei [32], which demonstrates a significant decline in species richness with escalating urbanization but aligns with the conclusions of Fu [14], Yu [17], and Ferris [33]. Of these, Yu [17] posited that urban habitats furnish numerous resources for soil fauna, such as irrigation water, organic waste, and concealed spaces, all of which afford some degree of benefit to soil fauna survival.
The intricate nature of soil habitats exerts a notable influence on the composition and structure of soil fauna communities across diverse ecological niches. Particularly, areas with simpler habitats tend to harbor dominant species, consequently leading to reduced species diversity within the community [34]. In this study, except for the number of individuals (N), the Simpson dominance index (C) of soil fauna exhibits a negative correlation with other various soil fauna community indicators (Figure 7), notably, displaying an extremely significant negative correlation with the Shannon diversity index (H’) and Pielou’s evenness index (J) (p < 0.01). This provides further evidence for the impact of dominant species wherein a higher dominance index correspondingly correlates to lower biodiversity. In an overall assessment across sample plots, the prevalence of dominant species in urban soil fauna communities surpasses that of suburban and exurban areas, illustrating a proclivity towards simplified soil habitats. Previous research denotes an intrinsic relationship between the plant species within a habitat and the organization and configuration of the soil fauna community [35,36,37]. For instance, in urban ecosystems, characteristics of soil fauna habitats like size, connectivity, and landscape heterogeneity significantly influence soil fauna biodiversity [38]. Urban areas demonstrate higher susceptibility to human disturbance compared to suburban and exurban areas, leading to scenarios involving relatively simple vegetation types and invasive plants that disrupt regional plant diversity, adversely affecting the development of both soil habitat complexity and soil fauna community diversity [39,40,41]. This conclusion is akin to Huang [42]. Excessive human interference, uncomplicated vegetation types, and plant allelopathic effects can lead to alterations in the soil’s physical and chemical properties and the food structure of soil fauna. These changes can significantly impact the abundance and community structure of soil fauna groups, as well as the overall stability of soil ecological functions [43].

4.2. Analysis of the Mechanism of Soil Fauna Community Changes in Remnant Evergreen Broad-Leaved Forests along Urbanization Gradient

Soil fauna, as vital components of soil ecosystems, plays a significant role in the processes of organic matter decomposition and soil structure alteration, like the decomposition of organic debris and the loosening and mixing of soil [39]. The characteristics of soil fauna communities are indirectly affected by the evolving ecological conditions of the soil [42]. In the present study (Figure 7), a noteworthy positive correlation was established between soil organic matter and the population of soil fauna (p < 0.01). Conversely, the soil heavy metal Pb demonstrated a significant positive correlation with the Simpson dominance index of soil fauna, while exhibiting a significant negative correlation with the Shannon diversity index and Pielou’s evenness index (p < 0.05), which reflects that soil fauna is highly sensitive to changes in soil heavy metal Pb. Specifically, the Simpson dominance index of soil fauna in urban areas with slight Pb pollution was markedly higher compared to those in suburban and exurban areas devoid of Pb pollution (Figure 5 and Figure 6), aligning with the research outcomes of Song [44] and Ren [45].
Exceeding the safety threshold for heavy metal content in the soil ecosystem can impede the metabolic activities of various organisms, leading to irreversible damage or mortality [46]. Nonetheless, some studies have suggested that distinct soil fauna groups exhibit differential responses to a heavy metal presence [47,48]. This study conducted a redundancy analysis of the primary soil fauna community groups in the remnant forests and environmental factors (Figure 8). Our findings revealed that soil organic matter and heavy metal Zn are the primary environmental determinants influencing these dominant soil fauna groups. Specifically, the prevalence of soil heavy metal Zn significantly impacts the dominant soil fauna communities in the remnant forests, while exerting no significant negative effect on the overall soil fauna community (Table 3, Figure 8). Notably, the relationship between Pb and the dominant soil fauna communities is opposite to that of Zn, Cu, and Cd. This disparity is believed to stem from the Pb content remaining within the tolerance range of the dominant groups, or due to the comparatively shorter duration of Pb contamination affecting these dominant groups, in contrast to the duration of the Zn, Cu, and Cd presence [49]. This discernment underscores the varying sensitivities of distinct soil fauna types to specific heavy metal pollution, thereby positioning them as crucial indicators of soil environmental alterations, including pollution.
Additionally, the results of the correlation analysis between soil fauna community diversity and environmental factors (Table 3, Figure 8) reveal the differential impact of urban soil heavy metal pollution on soil fauna communities. Specifically, soil fauna exhibits a stronger response to Pb in the soil. Soil heavy metals result from the interaction of various harmful substances [50]. Furthermore, distinct soil fauna community indicators demonstrate varying degrees of responsiveness to different soil environmental factors, rendering them valuable as sensitive indicators for assessing changes in the soil environment.

5. Conclusions

(1) The soil environmental factors of the remnant forests change asynchronously along the urbanization gradient. Generally, the urban locales manifest heightened soil alkalinization and substantial heavy metal contamination in contrast to suburban and exurban areas.
(2) Utilizing Simpson’s dominance index, Shannon diversity index, and Pielou’s evenness index, it is discerned that soil fauna diversity is most pronounced in suburban environs, lending credence to the moderate disturbance hypothesis.
(3) Through a correlation analysis and redundancy analysis, it is discerned that SOM and Pb primarily influence soil fauna diversity in the remnant forests, while SOM and Zn are pivotal factors governing the predominant soil fauna groups.

Author Contributions

Conceptualization, methodology, and validation, G.X.; software, formal analysis, visualization, and writing—original draft preparation, Z.W.; investigation, S.Y., Z.W., Y.L., and Y.C.; resources, G.X. and H.W.; data curation, S.Y. and L.M.; writing—review and editing, G.X., L.M., Y.C., and Z.W.; supervision, G.X., S.Y., and L.M.; funding acquisition, G.X. and H.W. All authors have read and agreed to the published version of the manuscript.

Funding

The present study was supported by the National Natural Science Foundation of China (42071061), Annual Jointly Funded Projects by Municipal Government, University (or Academy) and Enterprise in 2024 (2024A03J0386), and Practical Teaching Base Project of Science, Industry, and Education of Guangzhou Universities and Colleges (2023KCJJD003).

Data Availability Statement

The raw data supporting the conclusions of this article will be made available by the authors on request.

Acknowledgments

We sincerely thank the reviewers and editors for their time and effort in reviewing the paper and their valuable suggestions, which greatly benefited this paper.

Conflicts of Interest

The authors declare that they have no known competing financial interests or personal relationships that could have appeared to influence the work reported in this paper.

Appendix A

Table A1. Means and LSD analysis results for all metrics across urbanization gradients.
GradientUrbanSuburbanExurban
Indicator
pH7.27 ± 0.14 a5.98 ± 0.34 b5.18 ± 0.34 b
SOM (%)4.76 ± 0.89 a2.66 ± 0.47 b2.42 ± 0.25 b
TN (%)0.45 ± 0.04 a0.28 ± 0.05 b0.15 ± 0.01 c
Zn (mg/kg)147.62 ± 25.00 a71.81 ± 13.43 b80.26 ± 13.40 b
Cu (mg/kg)45.33 ± 9.11 a25.24 ± 6.16 a26.90 ± 11.29 a
Pb (mg/kg)78.04 ± 12.51 a40.38 ± 6.06 b50.01 ± 6.53 ab
Cd (mg/kg)0.45 ± 0.07a0.28 ± 0.05 ab0.22 ± 0.06 b
P(Zn)1.52 ± 0.27 a0.70 ± 0.14 b0.83 ± 0.14 b
P(Cu)1.42 ± 0.28 a0.70 ± 0.13 a0.84 ± 0.35 a
P(Pb)1.30 ± 0.21 a0.62 ± 0.08 b0.83 ± 0.11 b
P(Cd)4.11 ± 0.61 a2.41 ± 0.39 b1.97 ± 0.53 b
Nemerow index3.26 ± 0.49 a1.88 ± 0.30 b1.64 ± 0.40 b
N67,617 ± 18,247 a51,125 ± 7034 a67,107 ± 10,515 a
S11.00 ± 0.49 a12.29 ± 0.94 a12.86 ± 0.91 a
C0.36 ± 0.02 a0.27 ± 0.02 b0.30 ± 0.00 ab
H’1.33 ± 0.06 b1.61 ± 0.09 a1.47 ± 0.02 ab
J0.56 ± 0.03 b0.65 ± 0.03 a0.58 ± 0.01 ab
D0.91 ± 0.04 a1.05 ± 0.09 a1.07 ± 0.07 a
DG32.61 ± 5.97 a46.04 ± 8.41 a54.80 ± 13.44 a
Note: Different letters in the figure show significant differences (p < 0.05)

References

  1. Research Group of the Market Economy Research Institute, Development Research Center of the State Council. New Technological Revolution and China’s Urbanization 2020–2050: Impact, Prospect and Strategy. J. Manag. World 2022, 38, 12–28. [Google Scholar]
  2. Chen, M.; Lu, D.; Zhang, H. Comprehensive Evaluation and the Driving Factors of China’s Urbanization. Acta Geogr. Sin. 2009, 64, 387–398. [Google Scholar]
  3. Wang, Y.; Shi, G. (Eds.) Economic Development Overview. In National Economic and Social Development Statistical Bulletin of the People’s Republic of China 2021; Yearbook Publishing House of the People’s Republic of China: Beijing, China, 2022; pp. 428–440. [Google Scholar]
  4. Wang, Q. China’s Urbanization and Carbon Emissions; Social Sciences Academic Press: Beijing, China, 2021; pp. 1–55. [Google Scholar]
  5. Zhou, H. The spatial characteristics of beautiful China should be distinctive. China Economic Times, 26 April 2013; p. 005. [Google Scholar]
  6. Mo, L.; Xu, G.; Zhang, J.; Wu, Z.; Yu, S.; Chen, X.; Peng, B.; Squartini, A.; Zanella, A. Threshold reaction of soil arthropods to simulative nitrogen deposition in urban green spaces. Front. Ecol. Evol. 2021, 9, 711774. [Google Scholar] [CrossRef]
  7. Mo, L.; Zanella, A.; Chen, X.; Peng, B.; Lin, J.; Su, J.; Luo, X.; Xu, G.; Squartini, A. Effects of simulated nitrogen deposition on the bacterial community of urban green spaces. Appl. Sci. 2021, 11, 918. [Google Scholar] [CrossRef]
  8. Longo, R.M.; da Silva, A.L.; Ribeiro, A.I.; Gomes, R.C.; Sperandio, F.C.; Nunes, A.N. Evaluating the Environmental Quality of Forest Remnants Using Landscape Metrics. Sustainability 2024, 16, 1543. [Google Scholar] [CrossRef]
  9. Yang, Y.; Fujihara, M.; Li, B.; Yuan, X.; Hara, K.; Da, L.; Tomita, M.; Zhao, Y. Structure and diversity of remnant natural evergreen broad-leaved forests at three sites affected by urbanization in Chongqing metropolis, Southwest China. Landsc. Ecol. Eng. 2014, 10, 137–149. [Google Scholar] [CrossRef]
  10. He, J.; Chen, X.; Feng, S.; Yao, T.; Liang, Q.; Fu, J. Stoichiometric characteristics of soil C, N and P in subtropical forests along an urban to suburban gradient. Chin. J. Ecol. 2016, 35, 591–596. [Google Scholar]
  11. Magiera, T.; Strzyszcz, Z.; Rachwal, M. Mapping particulate pollution loads using soil magnetometry in urban forests in the Upper Silesia Industrial Region, Poland. For. Ecol. Manag. 2007, 248, 36–42. [Google Scholar] [CrossRef]
  12. Chen, H.; Zhang, W.; Gilliam, F.; Liu, L.; Huang, J.; Zhang, T.; Wang, W.; Mo, J. Changes in soil carbon sequestration in Pinus massoniana forests along an urban-to-rural gradient of southern China recommended citation. Biogeosciences Discuss. 2013, 10, 6609–6616. [Google Scholar] [CrossRef]
  13. Fang, X.; Tang, Z.; Tian, D.; Xiang, W.; Sun, W. Distribution and ecological risk assessment of 7 heavy metals in urban forest soils in Changsha City. Acta Ecol. Sin. 2012, 32, 7595–7606. [Google Scholar] [CrossRef]
  14. Fu, F.; Lu, H. Effects of Urbanization on Soil Community Structure under Subtropical Evergreen Broad-leaved Forests. Ecol. Environ. Sci. 2015, 24, 938–946. [Google Scholar]
  15. Xu, G.; Wen, Y.; Cai, S.; Luo, X. Review for the effects of urban topsoil on the ecological health. Geogr. Res. 2019, 38, 2941–2956. [Google Scholar]
  16. Nagy, D.D.; Magura, T.; Horváth, R.; Debnár, Z.; Tóthmérész, B. Arthropod assemblages and functional responses along an urbanization gradient: A trait-based multi-taxa approach. Urban For. Urban Green. 2018, 30, 157–168. [Google Scholar] [CrossRef]
  17. Yu, S.; Wu, Z.; Xu, G.; Li, C.; Wu, Z.; Li, Z.; Chen, X.; Lin, M.; Fang, X.; Lin, Y. Inconsistent Patterns of Soil Fauna Biodiversity and Soil Physicochemical Characteristic Along an Urbanization Gradient. Front. Ecol. Evol. 2022, 9, 824004. [Google Scholar] [CrossRef]
  18. Zhang, H.; Lin, Q.; Huang, T.; Feng, Y.; Zhang, S. Distribution Patterns of Soil Fauna in Different Forest Habitat Types of North Hebei Mountains, China. Sustainability 2022, 14, 5934. [Google Scholar] [CrossRef]
  19. Xiong, C.; Wu, Z.; Zeng, Z.; Wang, J.; Liu, R.; Zheng, J.; Wan, J. Spatiotemporal evolution of forest landscape pattern in Guangdong-Hong Kong-Macao Greater Bay Area based on “Spatial Morphology-Fragmentation-Aggregation”. Acta Ecol. Sin. 2023, 43, 3032–3044. [Google Scholar]
  20. Guo, Y. (Ed.) Economic and Social Statistical Data. In Statistical Bulletin of the National Economic and Social Development of Guangzhou 2021; Guangzhou Yearbook Publishing House: Guangzhou, China, 2022; pp. 512–516. [Google Scholar]
  21. Guangzhou (Nansha) Vision and Strategy in the Guangdong-Hong Kong-Macao Greater Bay Area Era. Social Sciences in China, 11 June 2018; p. 008.
  22. Zhang, J.; Jing, S. The Practice and Experience of Constructing Ecological Culture in Guangzhou Since 1978. Urban Insight 2018, 61–72. [Google Scholar]
  23. DB 44/T 1415-2014; Risk Screening Values for Soil Heavy Metal the Pearl River Delta Area. Administration of Quality and Technology Supervision of Guangdong Province: Guangzhou, China, 2014.
  24. Song, H.; Wu, K.; Liu, P. Research progress on evaluation methods of soil heavy metal pollution. Jiangsu Agric. Sci. 2017, 45, 11–14. [Google Scholar]
  25. Yin, W. Illustrated Handbook of Soil Animals in China; Science Press: Beijing, China, 1998. [Google Scholar]
  26. Li, W.; Cui, L.; Wang, X.; Zhao, X.; Zhang, M.; Gao, C.; Zhang, Y. Relationship between Soil Animal Community Structure and Soil Physical and Chemical Properties in Lake Taihu Lakeshore, China. Sci. Silvae Sin. 2013, 49, 106–113. [Google Scholar]
  27. Shannon, C.E. A Mathematical Theory of Communication. Bell Syst. Tech. J. 1948, 27, 623–656. [Google Scholar] [CrossRef]
  28. Simpson, E.H. Measurement of Diversity. J. Cardiothorac. Vasc. Anesth. 1997, 11, 812. [Google Scholar] [CrossRef]
  29. Liao, C.; Li, J. Re-evaluating the character and application of density-group index (DG). Biodivers. Sci. 2009, 17, 127–134. [Google Scholar]
  30. Ulanowicz, R.E. Information theory in ecology. Comput. Chem. 2001, 25, 393–399. [Google Scholar] [CrossRef]
  31. Pielou, E.C.J. The Measurement of Diversity in Different Types of Biological Collections. J. Theor. Biol. 1966, 13, 131–144. [Google Scholar] [CrossRef]
  32. Lovei, G.L.; Horvath, R.; Elek, Z.; Magura, T. Diversity and assemblage filtering in ground-dwelling spiders (Araneae) along an urbanisation gradient in Denmark. Urban Ecosyst. 2019, 22, 345–353. [Google Scholar] [CrossRef]
  33. Ferris, H.; Tuomisto, H. Unearthing the role of biological diversity in soil health. Soil Biol. Biochem. 2015, 85, 101–109. [Google Scholar] [CrossRef]
  34. Gao, Y. Distribution Pattern and Influencing Factors of Soil Biodiversity in the Urban-Rural Ecotone of Shanghai. Master’s Thesis, East China Normal University, Shanghai, China, 2022. [Google Scholar]
  35. Yin, X.; Gu, W.; Dong, W.; Qiu, L.; Liu, Y.; Tao, L. The community change and diversity of soil fauna after artificial vegetation restoration in highway slope. Acta Ecol. Sin. 2008, 28, 4295–4305. [Google Scholar]
  36. Zhang, D.; Zhang, J.; Yang, W.; Wu, F.; Huang, Y.; Zhang, Z.; Wang, X.; Wang, X.; Zhu, L. Plant’s and soil organism’s diversity across a range of Eucalyptus grandis plantation ages. Acta Ecol. Sin. 2013, 33, 3947–3962. [Google Scholar] [CrossRef]
  37. Lin, Y.; Huang, Q.; Liu, H.; Peng, C.; Zhu, P.; Zhang, S.; Zhang, F. Effect of Long-Term Cultivation and Fertilization on Community Diversity of Cropland Soil Animals. Sci. Agric. Sin. 2010, 43, 2261–2269. [Google Scholar]
  38. Braaker, S.; Ghazoul, J.; Obrist, M.K.; Moretti, M. Habitat connectivity shapes urban arthropod communities: The key role of green roofs. Ecology 2014, 95, 1010–1021. [Google Scholar] [CrossRef]
  39. Huang, J.; Ke, X. Analysis of the ecological function of forest greening transformation in Yuexiu Park. Guangdong Landsc. Archit. 2003, 38–40. [Google Scholar] [CrossRef]
  40. Shen, B. Development and Countermeasures of Vegetation Landscape in Baiyun Mountain Scenic Spot, Guangzhou. Mod. Landsc. Archit. 2008, 77–81. [Google Scholar]
  41. Huang, X. Plant community investigation and landscape optimization research in Yuexiu Park, Guangzhou. Rural Sci. Technol. 2019, 76–77. [Google Scholar]
  42. Huang, Y.; Li, X.; Zhang, D.; Deng, C.X.; Luo, C.L.; Luo, Z.W.; Shen, J.L.; Xie, W.F. Characteristics of soil animal community with different garden plants and various planting periods in Wenjiang District, Chengdu, China. Chin. J. Appl. Ecol. 2020, 31, 3859–3868. [Google Scholar]
  43. Menezes-Oliveira, V.B.; Bianchi, M.O.; Espíndola, E.L.G. Changes in soil mesofauna structure due to different land use systems in south Minas Gerais, Brazil. Environ. Monit. Assess. 2021, 193, 431. [Google Scholar] [CrossRef]
  44. Song, B.; Ma, J.; Li, J.; Wei, L.; Yin, X. Soil animals and their response to soil pollution in Kaifeng City. Acta Pedol. Sin. 2007, 44, 529–535. [Google Scholar]
  45. Ren, T. Study on the Structural Characteristics of Soil Fauna Community and Its Correlation with Heavy Metal Pollution in Heavy Metal Polluted Areas: A Case Study of Shanxi Linfen Iron and Steel Co., Ltd. Master’s Thesis, Shanxi Normal University, Xi’an, China, 2012. [Google Scholar]
  46. Angon, P.B.; Islam, M.S.; Kc, S.; Das, A.; Anjum, N.; Poudel, A.; Suchi, S.A. Sources, effects and present perspectives of heavy metals contamination: Soil, plants and human food chain. Heliyon 2024, 10, e28357. [Google Scholar] [CrossRef] [PubMed]
  47. Crommentuijn, T.; Doodeman, C.; Vanderpol, J.; Doornekamp, A.; Rademaker, M.; Vangestel, C. Sublethal Sensitivity Index as an Ecotoxicity Parameter Measuring Energy Allocation under Toxicant Stress: Application to Cadmium in Soil Arthropods. Ecotoxicol. Environ. Saf. 1995, 31, 192. [Google Scholar] [CrossRef]
  48. Yang, X.; Xiang, C.; Liu, Z. Effect of Heavy Metal Pollution on Soil Animals. Chin. Agric. Sci. Bull. 2008, 24, 454–457. [Google Scholar]
  49. Austruy, A.; Laplanche, C.; Mombo, S.; Dumat, C.; Deola, F.; Gers, C. Ecological changes in historically polluted soils: Metal (loid) bioaccumulation in microarthropods and their impact on community structure. Geoderma 2016, 271, 181–190. [Google Scholar] [CrossRef]
  50. Wang, Y.; Wei, W.; Yang, X.; Chen, L.; Yang, L. Interrelationships between soil fauna and soil environmental factors in China: Research advance. Chin. J. Appl. Ecol. 2010, 21, 2441–2448. [Google Scholar]
Figure 1. The site location in Guangzhou City along the urbanization gradient.
Urbansci 08 00122 g001
Figure 2. Soil sample collection diagram.
Urbansci 08 00122 g002
Figure 3. Soil physicochemical characteristics in remnant forests along urbanization gradient: (A) Soil pH value in remnant forests along different urbanization gradients. (B) Soil organic matter content in remnant forests along different urbanization gradients. (C) Soil total nitrogen content in remnant forests along different urbanization gradients. Note: The solid line in the box represents the average, the dashed line represents the median, the dots outside the box represent outliers, and different letters in the figure show significant differences (p < 0.05), the same as below.
Urbansci 08 00122 g003
Figure 4. Soil heavy metal content in remnant forests across different urbanization gradients: (A) The concentration of soil heavy metal Zn in remnant forest along urbanization gradient. (B) The concentration of soil heavy metal Cu in remnant forest along urbanization gradient. (C) The concentration of soil heavy metal Pb in remnant forest along urbanization gradient. (D) The concentration of soil heavy metal Cd in remnant forest along urbanization gradient.
Urbansci 08 00122 g004
Figure 5. The single-factor pollution index and Nemerow composite index of soil heavy metals in different urbanization gradients: (AD) represent respectively the single-factor pollution indices of soil heavy metals (Zn, Cu, Pb and Cd) in remnant forests. (E) represents Nemerow composite index of soil heavy metals in different urbanization gradients.
Urbansci 08 00122 g005
Figure 6. Soil fauna diversity in remnant forests along urbanization gradient: (A) The individual amount of soil fauna in remnant forest along urbanization gradient. (B) The groups number of soil fauna in remnant forests along different urbanization gradients. (C) The Simpson dominance index of soil fauna in remnant forests along different urbanization gradients. (D) The Shannon’s diversity index of soil fauna in remnant forests along different urbanization gradients. (E) The Pielou’s evenness index of soil fauna in remnant forests along different urbanization gradients. (F) The Margalef’s richness index of soil fauna in remnant forests along different urbanization gradients. (G) The density-group index of soil fauna in remnant forests along different urbanization gradients.
Urbansci 08 00122 g006
Figure 7. Correlation analysis between soil fauna community diversity indices. Note: N represents the individual amount of soil fauna in the remnant forest. S represents the group number of soil fauna in remnant forests. C represents the Simpson dominance index of soil fauna. H’ represents the Shannon’s diversity index of soil fauna. J represents Pielou’s evenness index of soil fauna. D represents the Margalef richness index of soil fauna. DG represents the density-group index of soil fauna. * indicates a significant correlation at p < 0.05 level. ** indicates a highly significant correlation at p < 0.01 level. The size of each ellipse reflects the strength of the correlation between soil fauna diversity indices, with larger ellipses indicating stronger correlations. The colors represent the direction of the correlation.
Urbansci 08 00122 g007
Figure 8. The redundancy analysis of the dominant soil fauna groups and remnant forests environmental factors.
Urbansci 08 00122 g008
Table 1. Pollution index grade of single and comprehensive Nemerow.
GradePiPollution AssessmentNiPollution Assessment
1Pi ≤ 1.0No pollutionNi ≤ 0.7No pollution
21.0 < Pi ≤ 2.0Slightly pollution0.7 < Ni ≤ 1.0Slightly pollution
32.0 < Pi ≤ 3.0Lightly pollution1.0 < Ni ≤ 2.0Lightly pollution
43.0 < Pi ≤ 5.0Moderately pollution2.0 < Ni ≤ 3.0Moderately pollution
5Pi > 5.0Seriously pollutionNi > 3.0Seriously pollution
Table 2. Soil fauna community composition in remnant forests along urbanization gradient.
Soil Fauna GroupUrbanSuburbanExurbanSum by GroupProportion (%)Abundance
Collembola236,824121,978167,727526,52940.47+++
Oribatida121,212103,388160,937385,53729.64+++
Parasiformes69,26568,24686,920224,43117.25+++
Diptera larvae12,563704610,86530,4742.34++
Diplopoda11,54412,987899733,5282.58++
Microdrile oligochaetes882813,242424526,3152.02++
Symphyla16998489628216,4701.27++
Isopoda27186366220811,2920.87+
Diplura18694159526411,2920.87+
Scolopendromorpha1699152951037380.29+
Pauropoda10202209305762860.48+
Araneae1019850119030590.24+
Protura8502463594292550.71+
Acariformes340340102017000.13+
Uropygi17067951013590.10+
Thysanoptera0254634028860.22+
Coleoptera larvae0340152818680.14+
Coleoptera adult16991019220849260.38+
Sum by gradient473,319357,876469,750
Note: Sum by gradient represents the total number of soil fauna individuals collected from the seven sampling sites per gradient; sum by group represents the total number of individuals for each soil fauna group across all sampling sites.
Table 3. Correlation coefficient for the relationship between soil fauna diversity and soil physicochemical properties.
NSCH’JDDG
pH−0.12−0.220.32−0.19−0.14−0.16−0.42
SOM0.57 **−0.000.27−0.25−0.31−0.080.09
TN0.07−0.380.34−0.31−0.12−0.40−0.29
Zn−0.12−0.250.38−0.38−0.33−0.22−0.39
Cu−0.03−0.060.24−0.25−0.24−0.06−0.15
Pb0.17−0.270.51 *−0.54 *−0.50 *−0.29−0.31
Cd−0.08−0.170.33−0.28−0.25−0.14−0.31
Note: * indicates a significant correlation at p < 0.05 level; ** indicates a highly significant correlation at p < 0.01 level.
Disclaimer/Publisher’s Note: The statements, opinions and data contained in all publications are solely those of the individual author(s) and contributor(s) and not of MDPI and/or the editor(s). MDPI and/or the editor(s) disclaim responsibility for any injury to people or property resulting from any ideas, methods, instructions or products referred to in the content.

