Abstract
This study investigates the role of vegetation in enhancing thermal comfort and achieving energy savings in educational building courtyards located in hot, arid climates. The research focuses on an educational building courtyard in New Aswan City, Egypt, and employs a combination of field monitoring and numerical simulations to evaluate the thermal performance of the space. The study utilized the ENVI-met V5.5.1 model for thermal assessment and the Design-Builder software version 6.1.3.007 to quantify the potential energy savings. Nine different vegetation scenarios were proposed and analyzed to identify the most effective strategies for improving the courtyard’s thermal conditions. The results demonstrate that a 60% coverage of the courtyard with Cassia Nodosa vegetation produced the most significant improvements. This scenario led to a decrease of over 25.4 °C in physiological equivalent temperature (PET) and a reduction of more than 31.3 °C in mean radiant temperature (Tmrt). Moreover, the energy savings achieved were approximately 19.2%. Interestingly, the study also observed an unexpected decrease in the temperature mitigation efficacy of Ficus nitida when vegetation coverage was increased from 40% to 60%. This phenomenon can be attributed to the complex interplay between the inherent characteristics of the Ficus nitida species and the microclimatic factors within the courtyard environment. These findings provide valuable insights for designers and architects to integrate effective vegetation strategies into the design of educational building courtyards in hot, arid climates. By enhancing thermal comfort and reducing energy consumption, this approach can contribute to the creation of more sustainable and comfortable learning environments.
1. Introduction
The impacts of global climate change and rapid urbanization have precipitated the emergence of urban heat island (UHI) phenomena [1,2,3,4], heat stress, and excessive energy consumption [5,6,7]. These factors have significantly increased energy use in buildings, with projections indicating that buildings could account for up to 40% of all fossil fuel consumption [8]. Consequently, addressing thermal comfort becomes imperative in mitigating these challenges and promoting sustainable building practices. At the local level in Egypt, the increasing energy production and consumption are closely intertwined with the economy, with energy poised to play a crucial role in the country’s economic trajectory in the years ahead [9].
The construction industry plays a vital role in creating buildings that are energy-efficient and environmentally friendly, prioritizing occupant well-being as we move towards a more sustainable future [10]. Thermal comfort, which encompasses satisfaction with the thermal environment [11,12] and the ability to maintain a balance between heat production and loss at a normal body temperature without perspiring, is a key consideration [13]. In urban design, pedestrian thermal comfort reflects the integration of design, microclimate, and bio-meteorology, making it an important aspect to consider [14]. This is particularly crucial in hot-dry regions, where interior temperature and energy consumption are influenced by thermal comfort [15].
1.1. The Impact of Thermal Comfort on the Efficiency of Students’ Work
Educational buildings are a central focus in building science due to the significant interplay between building performance, thermal comfort, and energy consumption [16,17]. Given the extended time students spend in classrooms, optimizing indoor environmental conditions is crucial for enhancing academic performance [18]. The thermal performance of classrooms significantly affects not only student health and comfort but also cognitive function and productivity [19]. Globally, university campus designs typically follow an ergonomic approach, considering aspects like orientation, wayfinding, and aesthetics [20]. However, recent construction practices in Egypt have often neglected the critical importance of maintaining thermal comfort for students [21]. Numerous studies have shown that student performance declines markedly when classroom temperatures exceed 26 °C [16,19,22]. This underscores the need for high indoor environmental quality to ensure thermal efficiency, especially in hot and dry regions [23].
Research has highlighted the benefits of passive building design in reducing reliance on active energy systems for indoor thermal comfort and lighting [24]. Despite the importance of indoor environments in educational facilities, this area remains under-researched compared to other building types such as offices and hospitals. Dewidar et al. [18], investigated thermal conditions in a large lecture hall at Cairo University, recording temperature, relative humidity, and wind speed at 30 different points over an hour without occupants present. However, their study did not correlate these measurements with a thermal comfort index or consider the thermal sensation scale. In contrast, Yau et al. [25] conducted a more comprehensive study at the University of Malaya in Kuala Lumpur, a tropical region. They measured six key parameters influencing thermal comfort in six lecture halls, evaluated the thermal conditions against ASHRAE Standard 55 [26], and assessed occupant satisfaction through a questionnaire. Similarly, Farghal and Wagner [27] explored thermal comfort in educational buildings by collecting subjective comfort votes over twelve days during the cold season, aiming to predict a comfortable indoor environment using the adaptive comfort approach, particularly in hot climates.
Courtyards, recognized as ideal architectural features in arid desert regions [28,29], can significantly impact both their microclimates and the indoor climates in university buildings. They influence temperature, humidity, wind patterns, and solar radiation, creating cooler and more comfortable outdoor spaces while enhancing indoor conditions through natural ventilation and daylight. Despite these benefits, the interaction between courtyards and environmental factors has often been overlooked in building design, leading to missed opportunities for optimizing both sustainability and occupant comfort.
1.2. The Form of the Courtyard as an Architectural and Construction Solution Used in Regulating the Thermal Comfort of Buildings
Courtyards have been a fundamental architectural feature in Middle Eastern buildings for centuries, recognized for their ability to regulate thermal comfort in hot, dry climates [30,31]. Traditionally, they have served as passive, social spaces that enhance comfort by directing natural ventilation into adjacent rooms and reducing indoor temperatures [32,33]. Over time, courtyards have evolved from a common residential feature to a sophisticated passive design strategy used in traditional architecture to manage climate conditions. Al Masri [34] highlights that central courtyards provide substantial cooling benefits, in addition to offering privacy and security. Subhashini’s simulations further demonstrate that courtyards enhance cross-ventilation, channeling cooler air into surrounding spaces [35]. In Kuwait, the courtyard structure has proven particularly well-suited to the arid environment, offering energy savings, protecting building components from rapid deterioration, and creating comfortable, versatile spaces [36].
The effectiveness of courtyards in regulating thermal comfort is influenced by various factors, including the courtyard’s shape, height, and orientation. The aspect ratio (height-to-width) of the courtyard significantly affects its ability to create a favorable microclimate [37]. For instance, studies using the ENVI-met model have simulated microclimate conditions to understand how open spaces and solar orientation influence thermal comfort on typical summer days [16]. This model is widely regarded as a valuable tool for urban planners and designers, allowing them to integrate multidisciplinary aspects of urban microclimate into their projects. Additionally, the RayMan model has been employed to analyze long-term thermal comfort on university campuses, using physiologically equivalent temperature (PET) as the thermal index metric [38].
Further research has focused on optimizing the design of courtyards to enhance thermal comfort in traditional homes located in hot, arid climates [39,40,41]. Soflaei et al. [42] developed a courtyard model specifically for improving thermal comfort in Iranian homes, finding that square-shaped courtyards generally perform better thermally than rectangular ones. Increasing the height of courtyard walls can also improve shading effectiveness, thus reducing ambient temperatures. Muhaisen’s study supports these findings, suggesting that in hot climates, taller courtyard walls are more effective, while in colder climates, lower walls are preferable [28]. Moreover, the orientation of the courtyard is crucial for its thermal performance [31,43], with research by Taleghani et al. [44] demonstrating that factors such as orientation, elongation, green roofs, and pavement materials significantly influence the internal thermal behavior of courtyard structures in temperate environments.
1.3. The Role of Vegetation in Regulating the Thermal Comfort of Buildings
Various shading techniques were employed to enhance the thermal comfort of courtyards, including the use of shade devices and trees [45,46,47,48]. Among these, trees have been found to provide the most effective shading, with planted courtyards reducing temperatures by 4.6 K compared to unplanted ones [49,50]. Additionally, Ghaffarianhoseini et al. [51] suggested that well-designed unshaded courtyards may also contribute to thermally comfortable outdoor environments. The integration of plants in courtyards has been shown to reduce temperatures. Wei et al. [52] demonstrated that the use of plants in courtyards can lower temperatures by 8 K. In contrast, rooftop courtyards can reduce temperatures by 4.3 K. They further highlighted that green roofs are particularly effective at mitigating heat in courtyard structures. Similarly, Li et al. [53] investigated the impact of green roofs and vertical greening on indoor thermal comfort and energy consumption in the hot summer and cold winter climate regions of China. Their findings showed that these passive strategies could reduce cooling and heating loads by 8.8% and 1.85%, respectively. On the other hand, Gomaa et al. [54] investigated the optimal combination of grass and trees to enhance the outdoor thermal performance of pedestrians in hot, arid areas. They found that a scenario with 75% tree coverage and 50% grass cover could result in an average reduction of 7.5 degrees in the PET metric.
The effects of street direction, aspect ratio, the usage of water and trees for the courtyard, and the surface materials have all been studied in the literature [55]. Trees can help lower building exterior surface temperatures if cool pavements on public roadways cause them to increase. However, because their efficacy is tied to sheltering direct solar radiation, trees planted near building facades can scarcely confront diffuse solar radiation, and as a result, overall outcomes are greatly influenced by sun exposure, building orientation, and plant features [56]. Therefore, with the tree height being equal to the building height, the largest façade temperature drop was 1.87 °C.
Darvish et al. [57] used a coupled simulation by ENVI-met and Design Builder to examine how the placement of trees in courtyards affected energy usage. As a result, after planting deciduous and coniferous trees in the garden, PET levels and energy usage fell. Their findings demonstrated that using passive strategies based on covering trees in the courtyard space resulted in fewer hours of inside discomfort and energy savings. The tree not only lowered incoming solar radiation from the inside environment but also generated a cooler microclimate in the courtyard area by combining the effects of evaporation and shade. Coniferous trees (evergreens) lowered overall energy usage much more in inland locations with limited solar benefits.
As a result, the optimal positioning of these trees, with their varying performances in neighboring interior parts surrounding the courtyard, has a substantial influence on the building’s energy efficiency [57]. The results of the field measurements show that the temperature difference between the courtyards with 69% vegetation and 18% vegetation is 30 °C between 12 p.m. and 2 p.m. The findings confirmed that vegetation in the given region influences microclimates, particularly temperature, in the context of the tropics. Another explanation for the temperature is the plant’s evapotranspiration and photosynthesis. To lower the temperature, the vapor is discharged into the surrounding environment in the case of evapotranspiration [58].
The objective of this study is to evaluate the effectiveness of vegetation as a strategy to improve thermal comfort and reduce energy consumption in a semi-enclosed university courtyard, specifically at the Faculty of Arts at New Aswan University. This research addresses a critical gap in the current literature, which has largely focused on open outdoor spaces, by examining a semi-enclosed environment where existing building constraints limit other cooling interventions. The study employs a combination of field observations, simulation modeling, and energy analysis to assess how vegetation can mitigate the heat-related issues exacerbated by inadequate shading in newly developed desert cities in Egypt. By concentrating on this context, the research seeks to contribute valuable insights into the design of thermally comfortable spaces in hot, arid regions, particularly during peak heat periods.
2. Materials and Methods
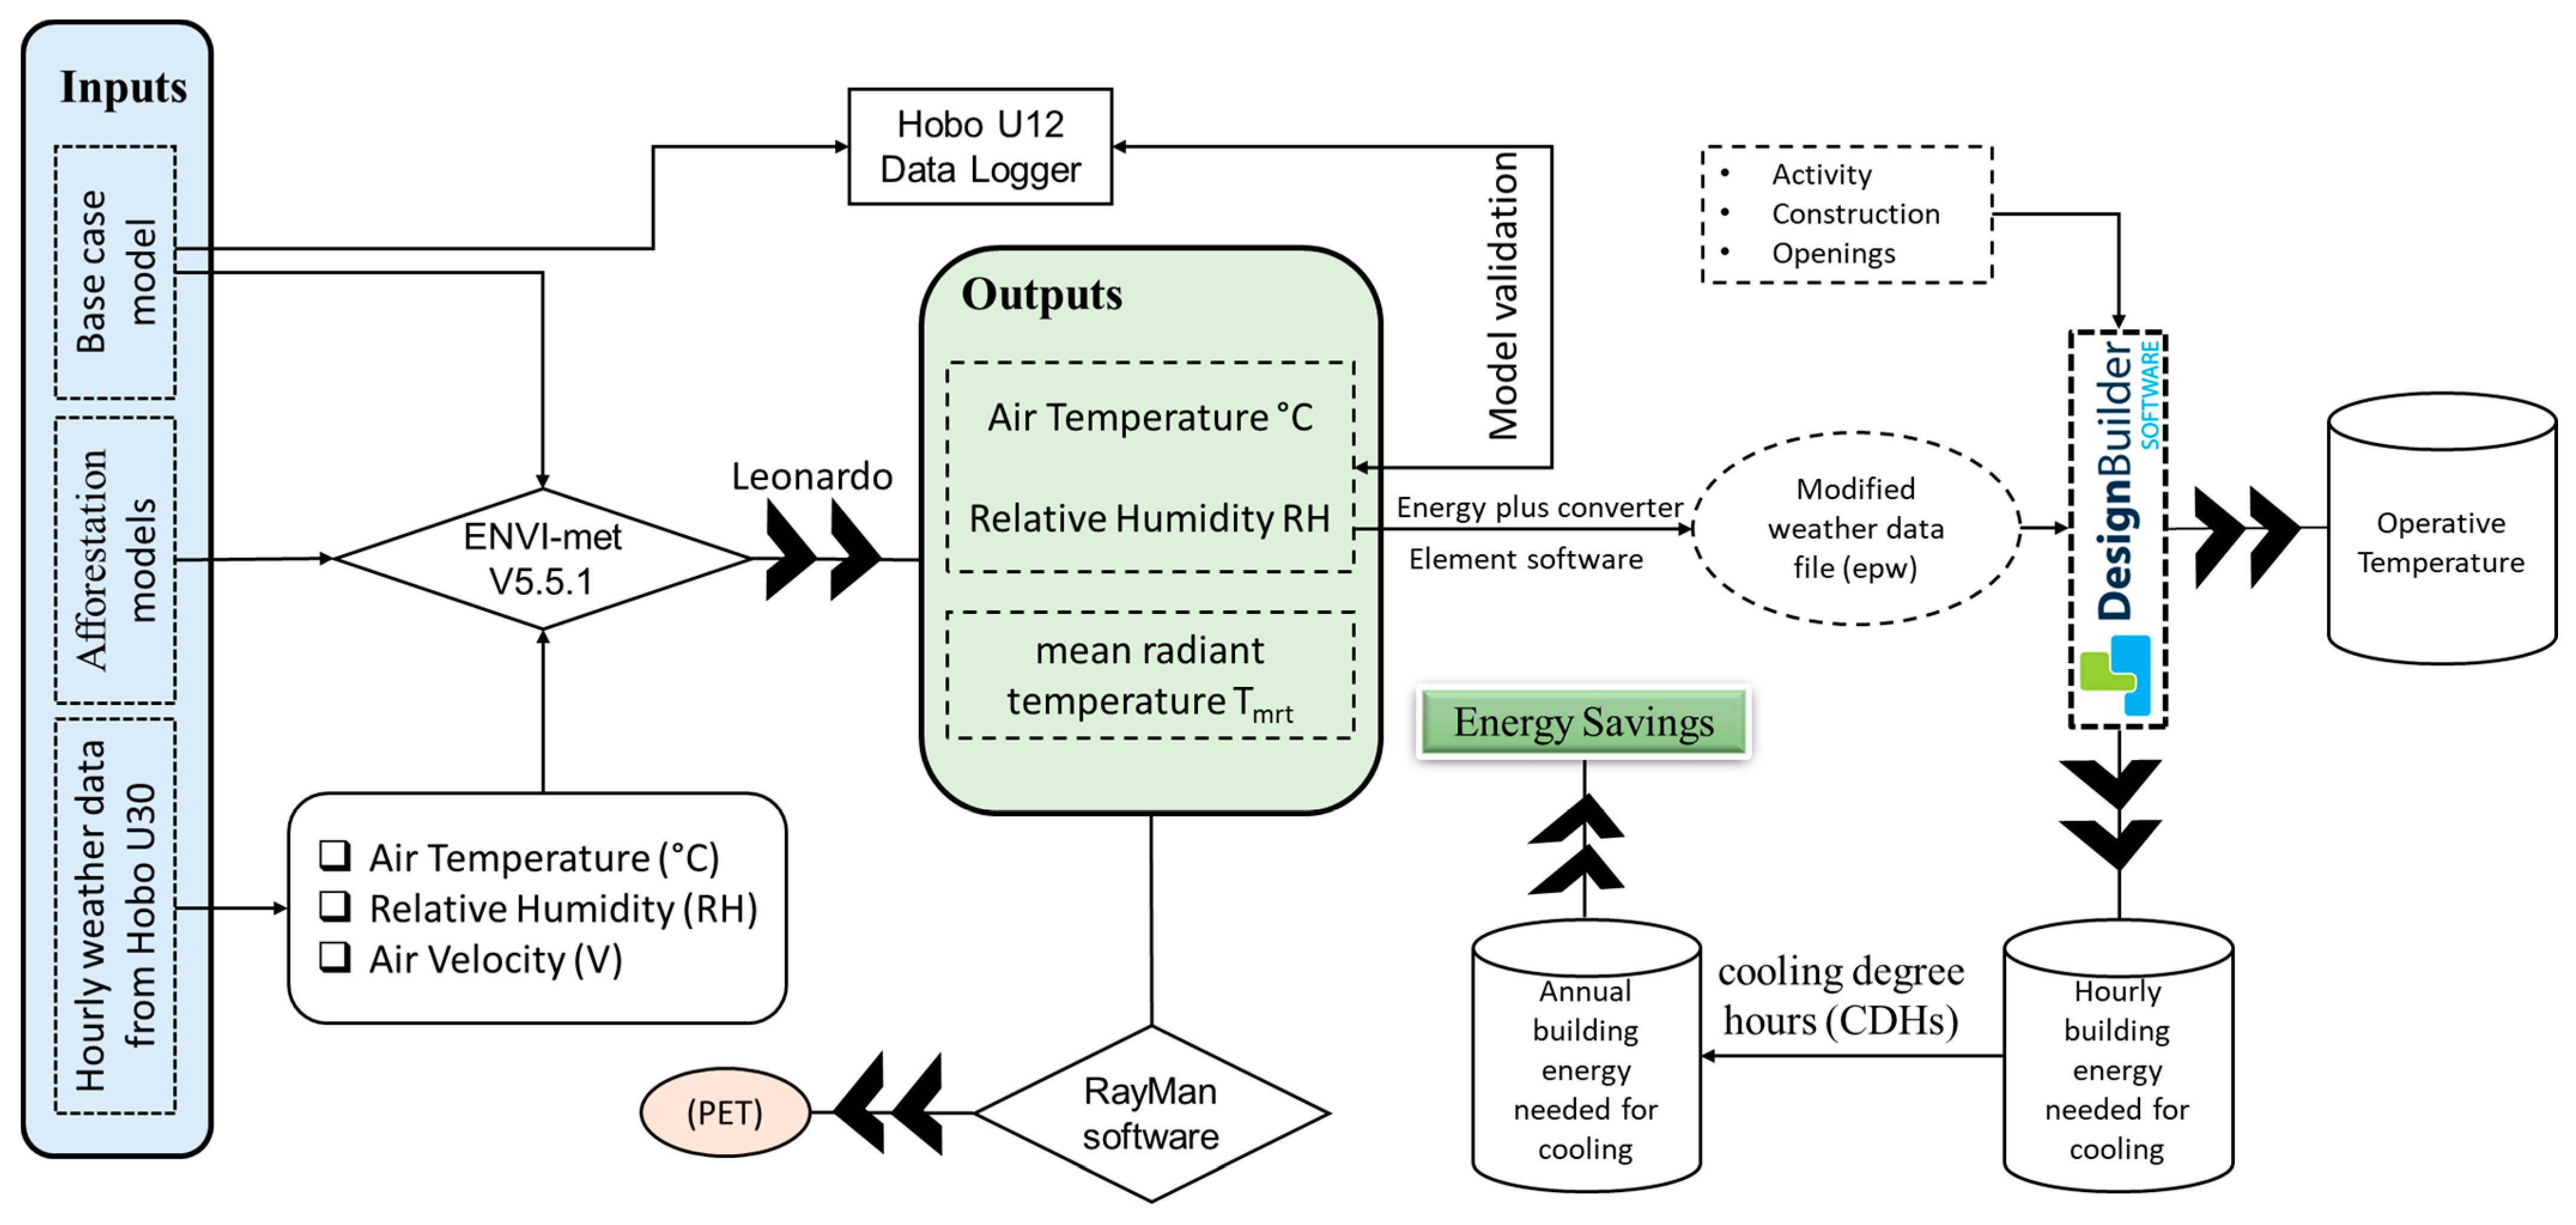
This study passes through several distinct phases to comprehensively assess the building courtyard microclimate performance with regard to occupants’ thermal comfort. Then, it discusses the potential effects of the energy demand for cooling in the same building, as seen in Figure 1. This paper adopted an experimental process that encompassed field measurements of air temperature and relative humidity. Then numerical simulations of the urban microclimate were conducted using ENVI-met V5.5.1 software. This software is specifically designed to generate a wide range of meteorological parameters and pedestrian thermal comfort indices [59]. ENVI-met employs computational fluid dynamics (CFD) techniques to simulate the complex interactions between air, plants, soil, and buildings based on fluid mechanics and heat transfer principles [59]. It enables the generation of various meteorological parameters, including air temperature (Ta), relative humidity (RH), and mean radiant temperature (Tmrt).

Figure 1.
Flowchart of methodology.
To validate the study model, the air temperature and relative humidity data extracted from the numerical simulations were compared with the corresponding measurements obtained in the experimental phase. This validation process ensured the accuracy and reliability of the study model. Furthermore, the study involved extracting PET results using the RayMan V1.2 software. The PET index, calculated using the RayMan model, is widely used for assessing outdoor thermal comfort by considering climatic factors such as air temperature, humidity, wind speed, and mean radiant temperature. However, certain considerations must be addressed when applying PET in contexts such as the thermal comfort of students or other populations in Egypt. The standard assumptions underlying the PET model may not fully account for cultural and behavioral adaptations specific to Egyptian populations, such as higher heat tolerance due to regular exposure or adjustments in daily activities to avoid peak heat discomfort. Additionally, variations in clothing and activity levels, influenced by cultural norms and institutional dress codes, can result in discrepancies between PET predictions and the actual thermal comfort experienced.
The final phase of the study involved building energy simulations to estimate and compare the cooling electricity demands for the base case without trees and the various vegetation scenarios. The simulations were performed using Design Builder software version 6.1.3.007, which incorporates EnergyPlus simulation engine version 8.7 and relies on standard EnergyPlus Weather (EPW) files containing hourly weather data to represent local climate conditions. For the base case, the Aswan 2002 EPW file provided with EnergyPlus for the project location was utilized. To simulate the impact of the different vegetation scenarios, a customized EPW file was generated by replacing the original weather data with synthesized microclimate data extracted from the ENVI-met model results for each scenario. The microclimate data substitutions followed ASHRAE Guideline 14-2002 [60] for weather data modifications. The parametric simulations yielded cooling electricity consumption, zone temperatures, and other relevant outputs to quantify the building energy performance differences resulting from the alternative urban vegetation scenarios in the local Aswan climate.
The ENVI-met software faces a limitation in terms of the extensive duration required for simulations, preventing its application for an entire year. In contrast, energy simulation software like Design Builder allows for the simulation of a building courtyard within a day. In the case of ENVI-met, approximately one day of continuous running is necessary to simulate a single day of a building courtyard. To overcome this limitation and evaluate the impact of vegetation adaptation scenarios on the overall annual energy consumption of the building, an alternative approach was adopted. This approach involves the utilization of the cooling degree hours (CDHs) method, which is based on the research conducted by Day et al. [61]. In their work, Day et al. suggested that a building’s energy consumption can be correlated with degree days, provided that the energy balance of the building is appropriately considered in a practical way.
To determine the energy consumption for the entire month of July, the energy consumption outputs obtained through Design Builder are scaled. This scaling is accomplished by employing cross-multiplication of the CDHs observed on the 13th of July to estimate the energy consumption for the remaining days of the month, considering the CDHs of the simulated day. Similarly, the energy consumption for the entire year is calculated by employing the cooling degree hours (CDH) for each month. By adopting this approach, a more comprehensive assessment of the influence of vegetation adaptation scenarios on the building’s energy consumption can be achieved. This method considers variations in energy demand across different months of the year, enabling a more accurate estimation of the building’s energy performance. The scaling of energy consumption outputs using the CDHs allows for a more informed evaluation of the impact of vegetation measures on energy efficiency.
2.1. The Case Study Model
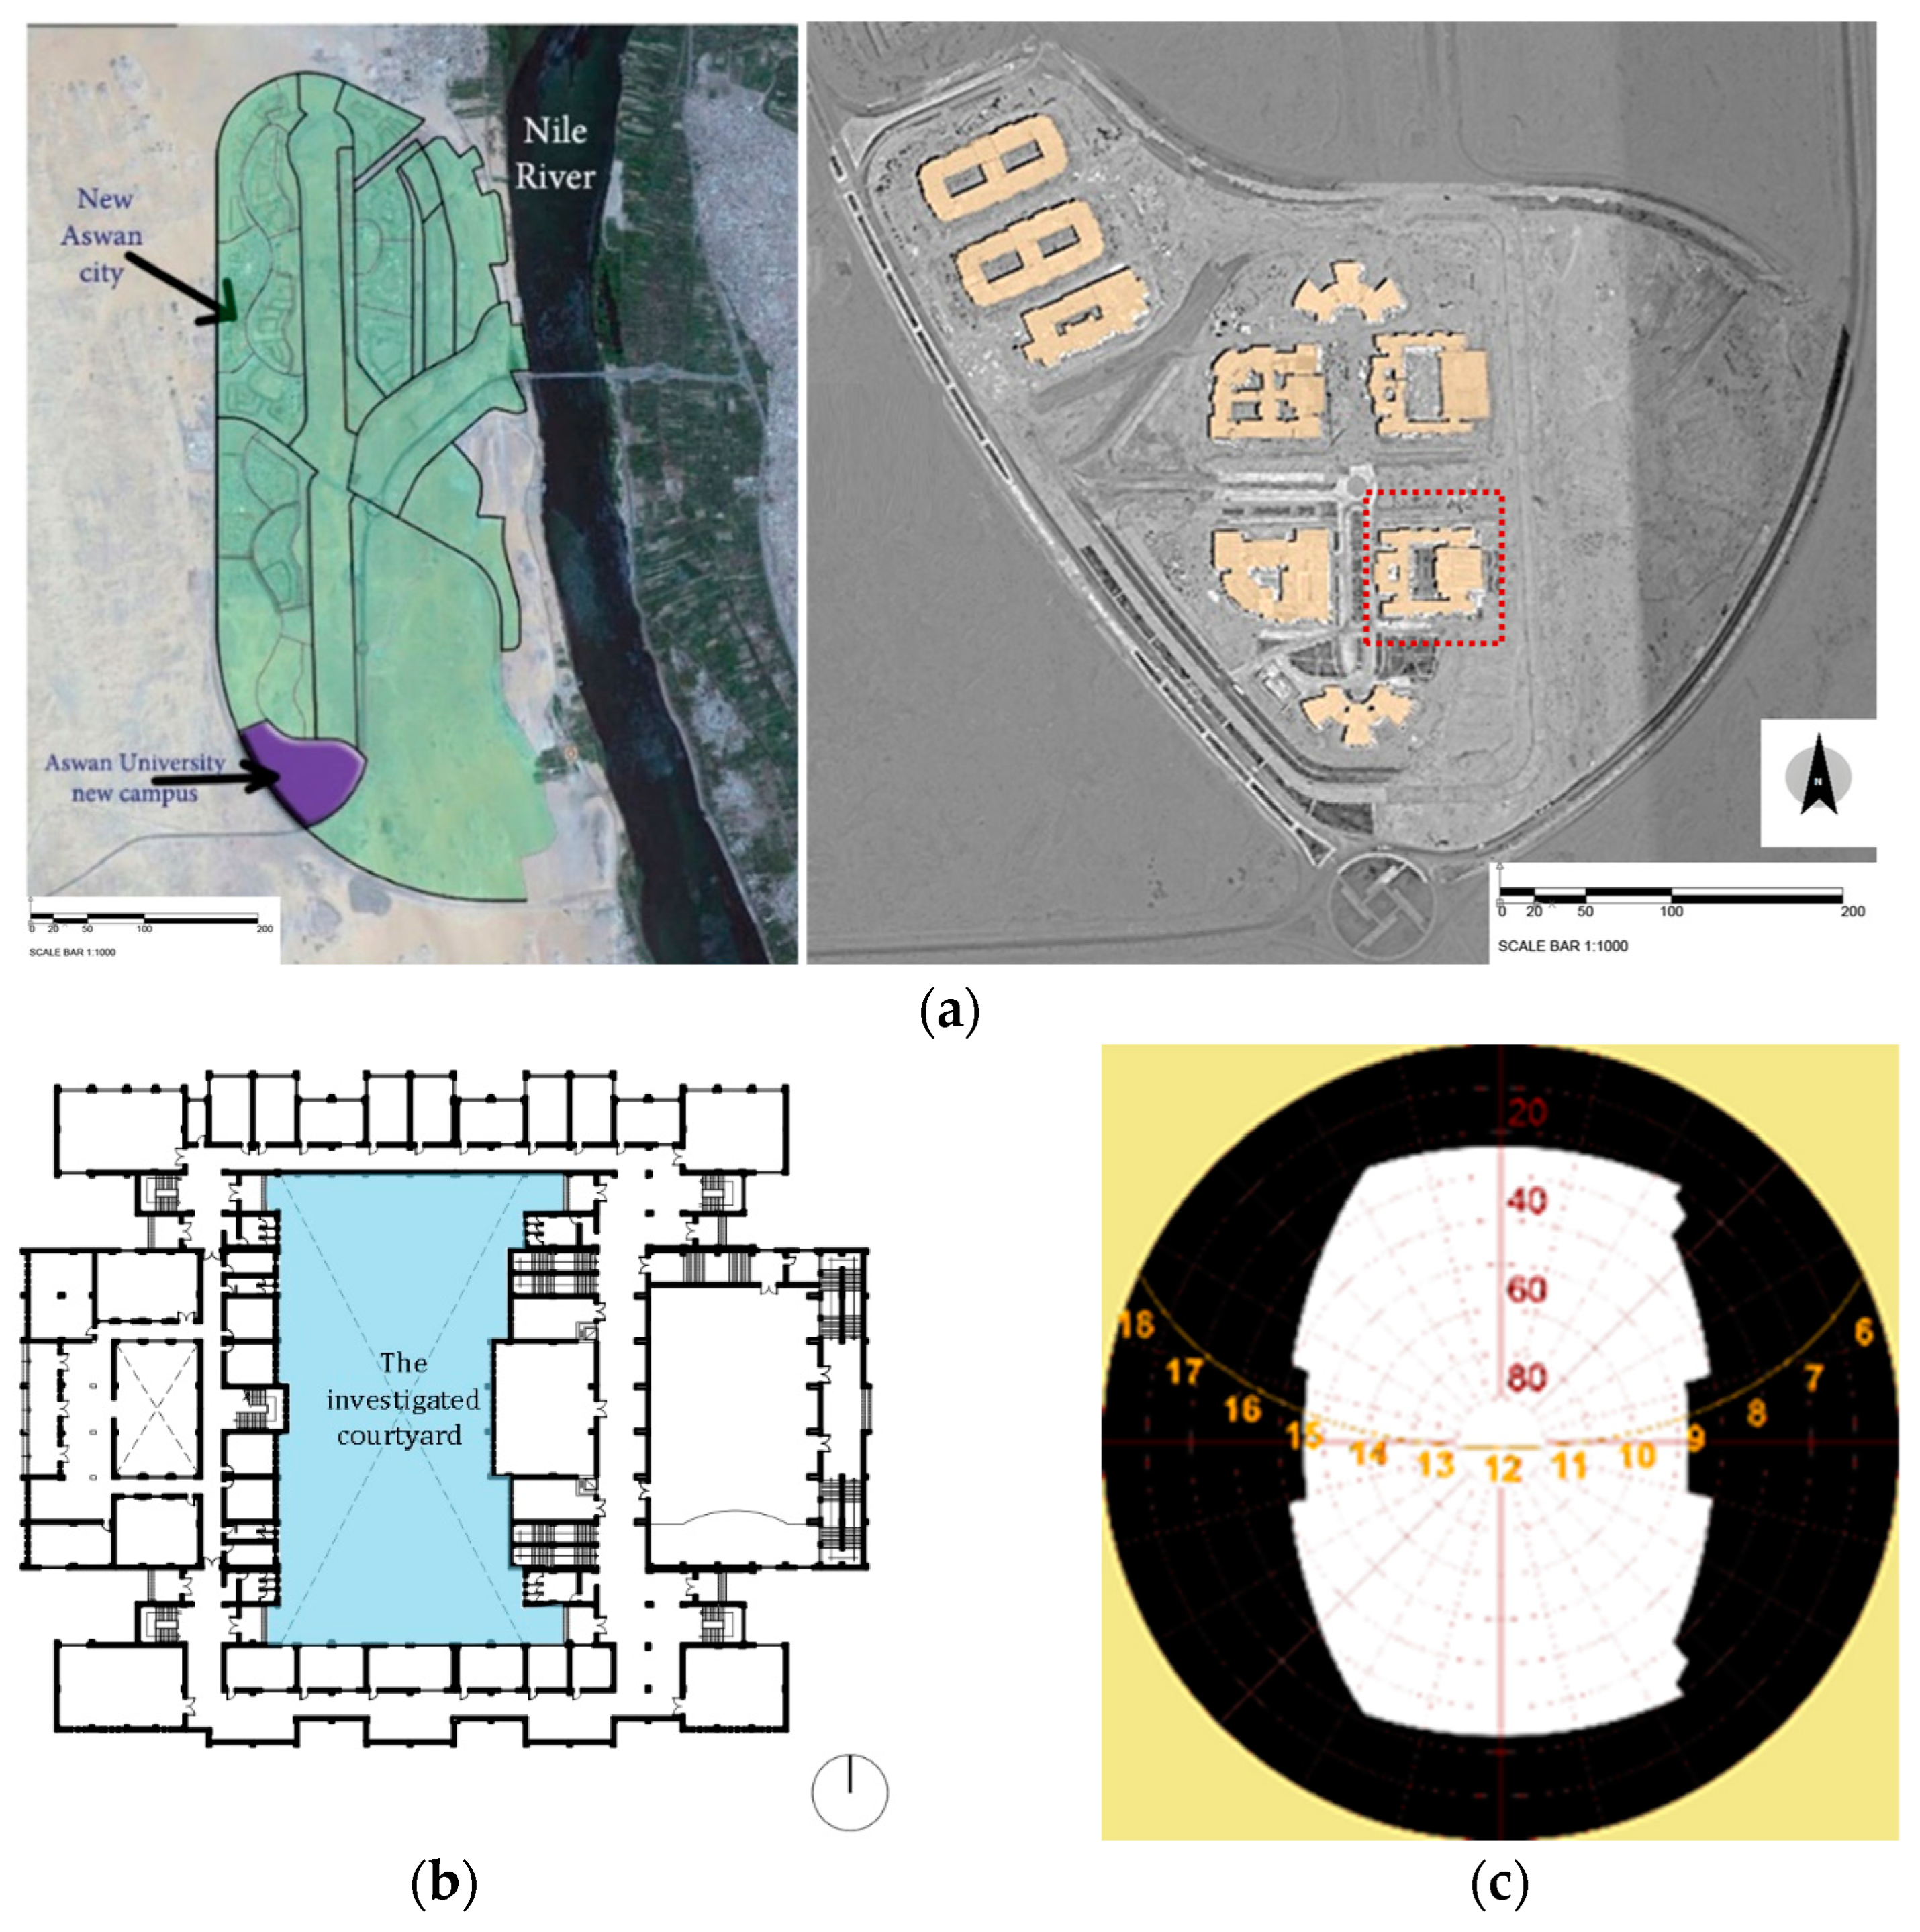
The new campus of Aswan University, located in New Aswan City, Egypt, was selected as the case study site for this building energy simulation analysis. New Aswan is located on the western bank of the Nile River in the southern sector of Egypt (24°0′ N, 32°51′ E). Therefore, it experiences a hot desert climate with high temperatures throughout the year [62,63], representing ideal conditions to evaluate the potential cooling energy savings achievable through courtyard vegetation. According to the Koppen classification, it is defined by a sweltering desert environment. With the lengthy, dry, and extremely hot summers and short, warm winters in this region, rainfall is scarce [64]. During the previous 20 years (from 2003 to 2023), July was the hottest month, with an average air temperature of 33.9 °C. It was 26.7 °C on average during the year. The greatest and lowest recorded yearly temperatures during this time were 47 °C and 8 °C, respectively [65]. Situating the study in one of the hottest regions in Egypt lends greater credibility and generalizability to the simulated results by maximizing the modeled impacts of passive cooling from added vegetation in an extreme climate. The climatic conditions of New Aswan City provide a robust test case to quantify the building energy performance benefits of increased tree coverage in a hot, arid environment.
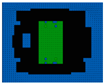
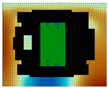
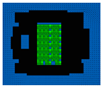
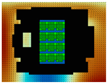
The Aswan University campus holds significant importance within the New Aswan City development project, primarily attributed to the substantial cost of new constructions, high user density, and the imperative to enhance thermal comfort for students. This focus on improving thermal conditions is anticipated to expedite the overall development process greatly [66]. The Faculty of Arts at Aswan University was chosen as a case study because it has a sizable courtyard without any tree cover, indicating the presence of a sizable area exposed to the sun, which also affects the interior areas surrounding the courtyard. The central courtyard of the case study building has dimensions of 55 m × 30 m, resulting in a total area of 1650 m2. With a height of 15 m, the courtyard has an aspect ratio (width to height) of 0.27. Sky view factor (SVF) analysis indicated a value of 0.474 for the courtyard, reflecting a high exposure to heat stress. Additionally, the location and the investigated courtyard are depicted in Figure 2.
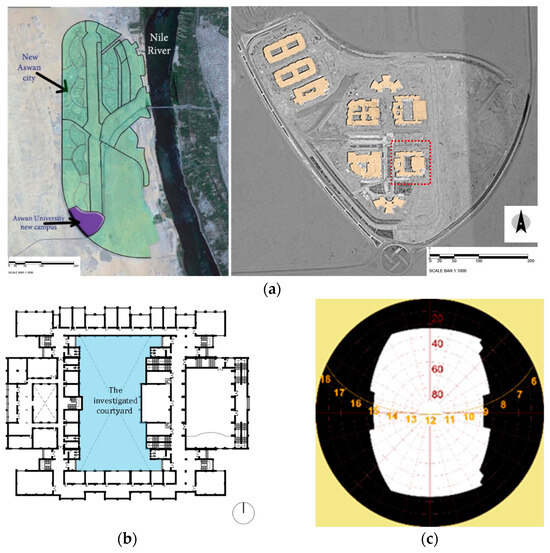
Figure 2.
The case study attributes: (a) the university location and the investigated building, (b) the architectural plan, including the courtyard of interest, (c) the SVF diagram of the courtyard.
2.2. Field Measurements
To verify the simulation model, an experimental measurement was conducted in the courtyard of the Faculty of Arts at a central location within the courtyard throughout the whole day for comparison with the simulation results. The measurements were recorded at the beginning of each hour on 13 July 2022. Air temperature and relative humidity were monitored at a height of 1.5 m using a “HOBO U12” data logger housed in custom-made solar radiation shields, as depicted in Figure 3 [67]. The measuring instrument was configured to monitor air temperature and relative humidity for 24 h at one-hour intervals.
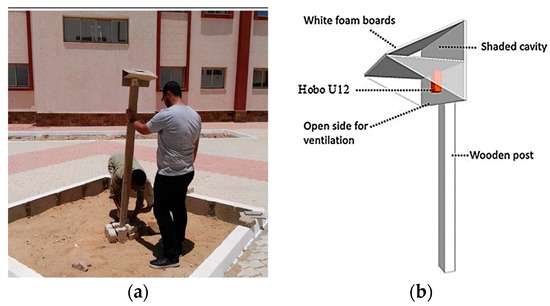
Figure 3.
HOBO U12 device; (a) installation of the in the field, (b) the structure of the measurement station.
2.3. The Simulation Processes
As shown in Table 1, the weather data for the case study served as the basis for meteorological inputs, and these data, along with human biometeorological parameters and building materials, were considered as data inputs for the simulation process.

Table 1.
Summary of data entry for the case study.
To calculate the hourly PET values, data extracted from ENVI-met, including air temperature, relative humidity, and mean radiant temperature, were used as input in RayMan V1.2 software. Additionally, personal variables were provided, with the metabolic rate set at 1.6 met and clothing insulation set at 0.5 clo. In the last phase, the case study building was modeled as a 2-dimensional footprint in AutoCAD 2021 V24.0.47.0 software and then imported into Design Builder 6.1.3.007 for detailed energy simulation. The building consists of a ground floor with two additional typical floors above. Hourly building energy simulations were performed in Design Builder by creating a simplified building form on the imported footprint, assigning local construction properties for walls, roofs, and windows, and modeling HVAC systems, internal loads, and schedules based on the building type. The vegetation scenario weather files generated in ENVI-met were used to represent the alternative urban microclimates. Design Builder computed whole-building energy performance outputs, including cooling electricity consumption, to quantify and compare the impacts of the different modeled urban vegetation scenarios. The building model incorporated detailed specifications of its envelope and occupant behavior. A cooling setpoint of 24 °C was established, aligning with Egyptian code 304.1 for cooling and air conditioning, which stipulates this temperature as the optimal level for human comfort [68]. Table 2 presents the simulation input data.
Table 2.
Design Builder input data.
2.4. Vegetation Coverage Scenarios in the Investigated Courtyard
Numerous strategies are available to enhance thermal comfort during a courtyard’s initial design phase [37,41,56,57,58]. However, due to the constraints imposed by an existing building and the inability to modify the building design or the courtyard’s shape, vegetation was selected as the primary approach in this study.
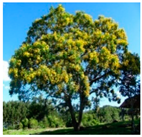
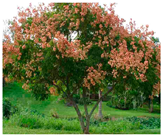
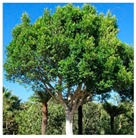
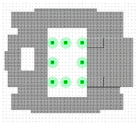
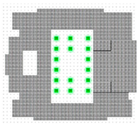
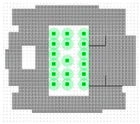
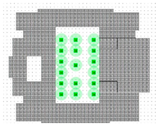
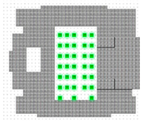
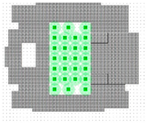
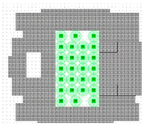
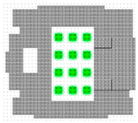
Extensive research has demonstrated that tree coverage serves as a key method for negative cooling (adaptation) at both urban and building scales. Urban trees have proven to be effective cooling applications, significantly influencing outdoor and indoor environments to achieve enhanced performance [69,70]. This is accomplished by leveraging the combined effects of shade provision and evaporative cooling [69], with particular attention given to the shape of the tree canopy. Consequently, shade trees known for their productivity, such as Cassia Nodosa, Cassia Leptophylla, and Ficus Nitida, were chosen to introduce climate change adaptation measures in the studied population. Cassia Leptophylla and Cassia Nodosa are both known for their relatively fast growth rates, with Cassia Leptophylla typically reaching its mature height of 7–10 m within 10 to 15 years, and Cassia Nodosa attaining full growth in about 8 to 12 years, reaching up to 10 m in height [71]. In contrast, Ficus Nitida, a slower-growing species, can take 15 to 25 years to reach its full mature height of 15–25 m [72]. Within the inner courtyard, trees were strategically incorporated in varying proportions of 20%, 40%, and 60% for each tree species, as depicted in Table 3. These specific proportions were selected to evaluate the impact of different tree coverage percentages on the thermal performance of the courtyard.
Table 3.
Tree characteristics and the proposed vegetation scenarios for the courtyard.
2.5. Validation of the Study Model
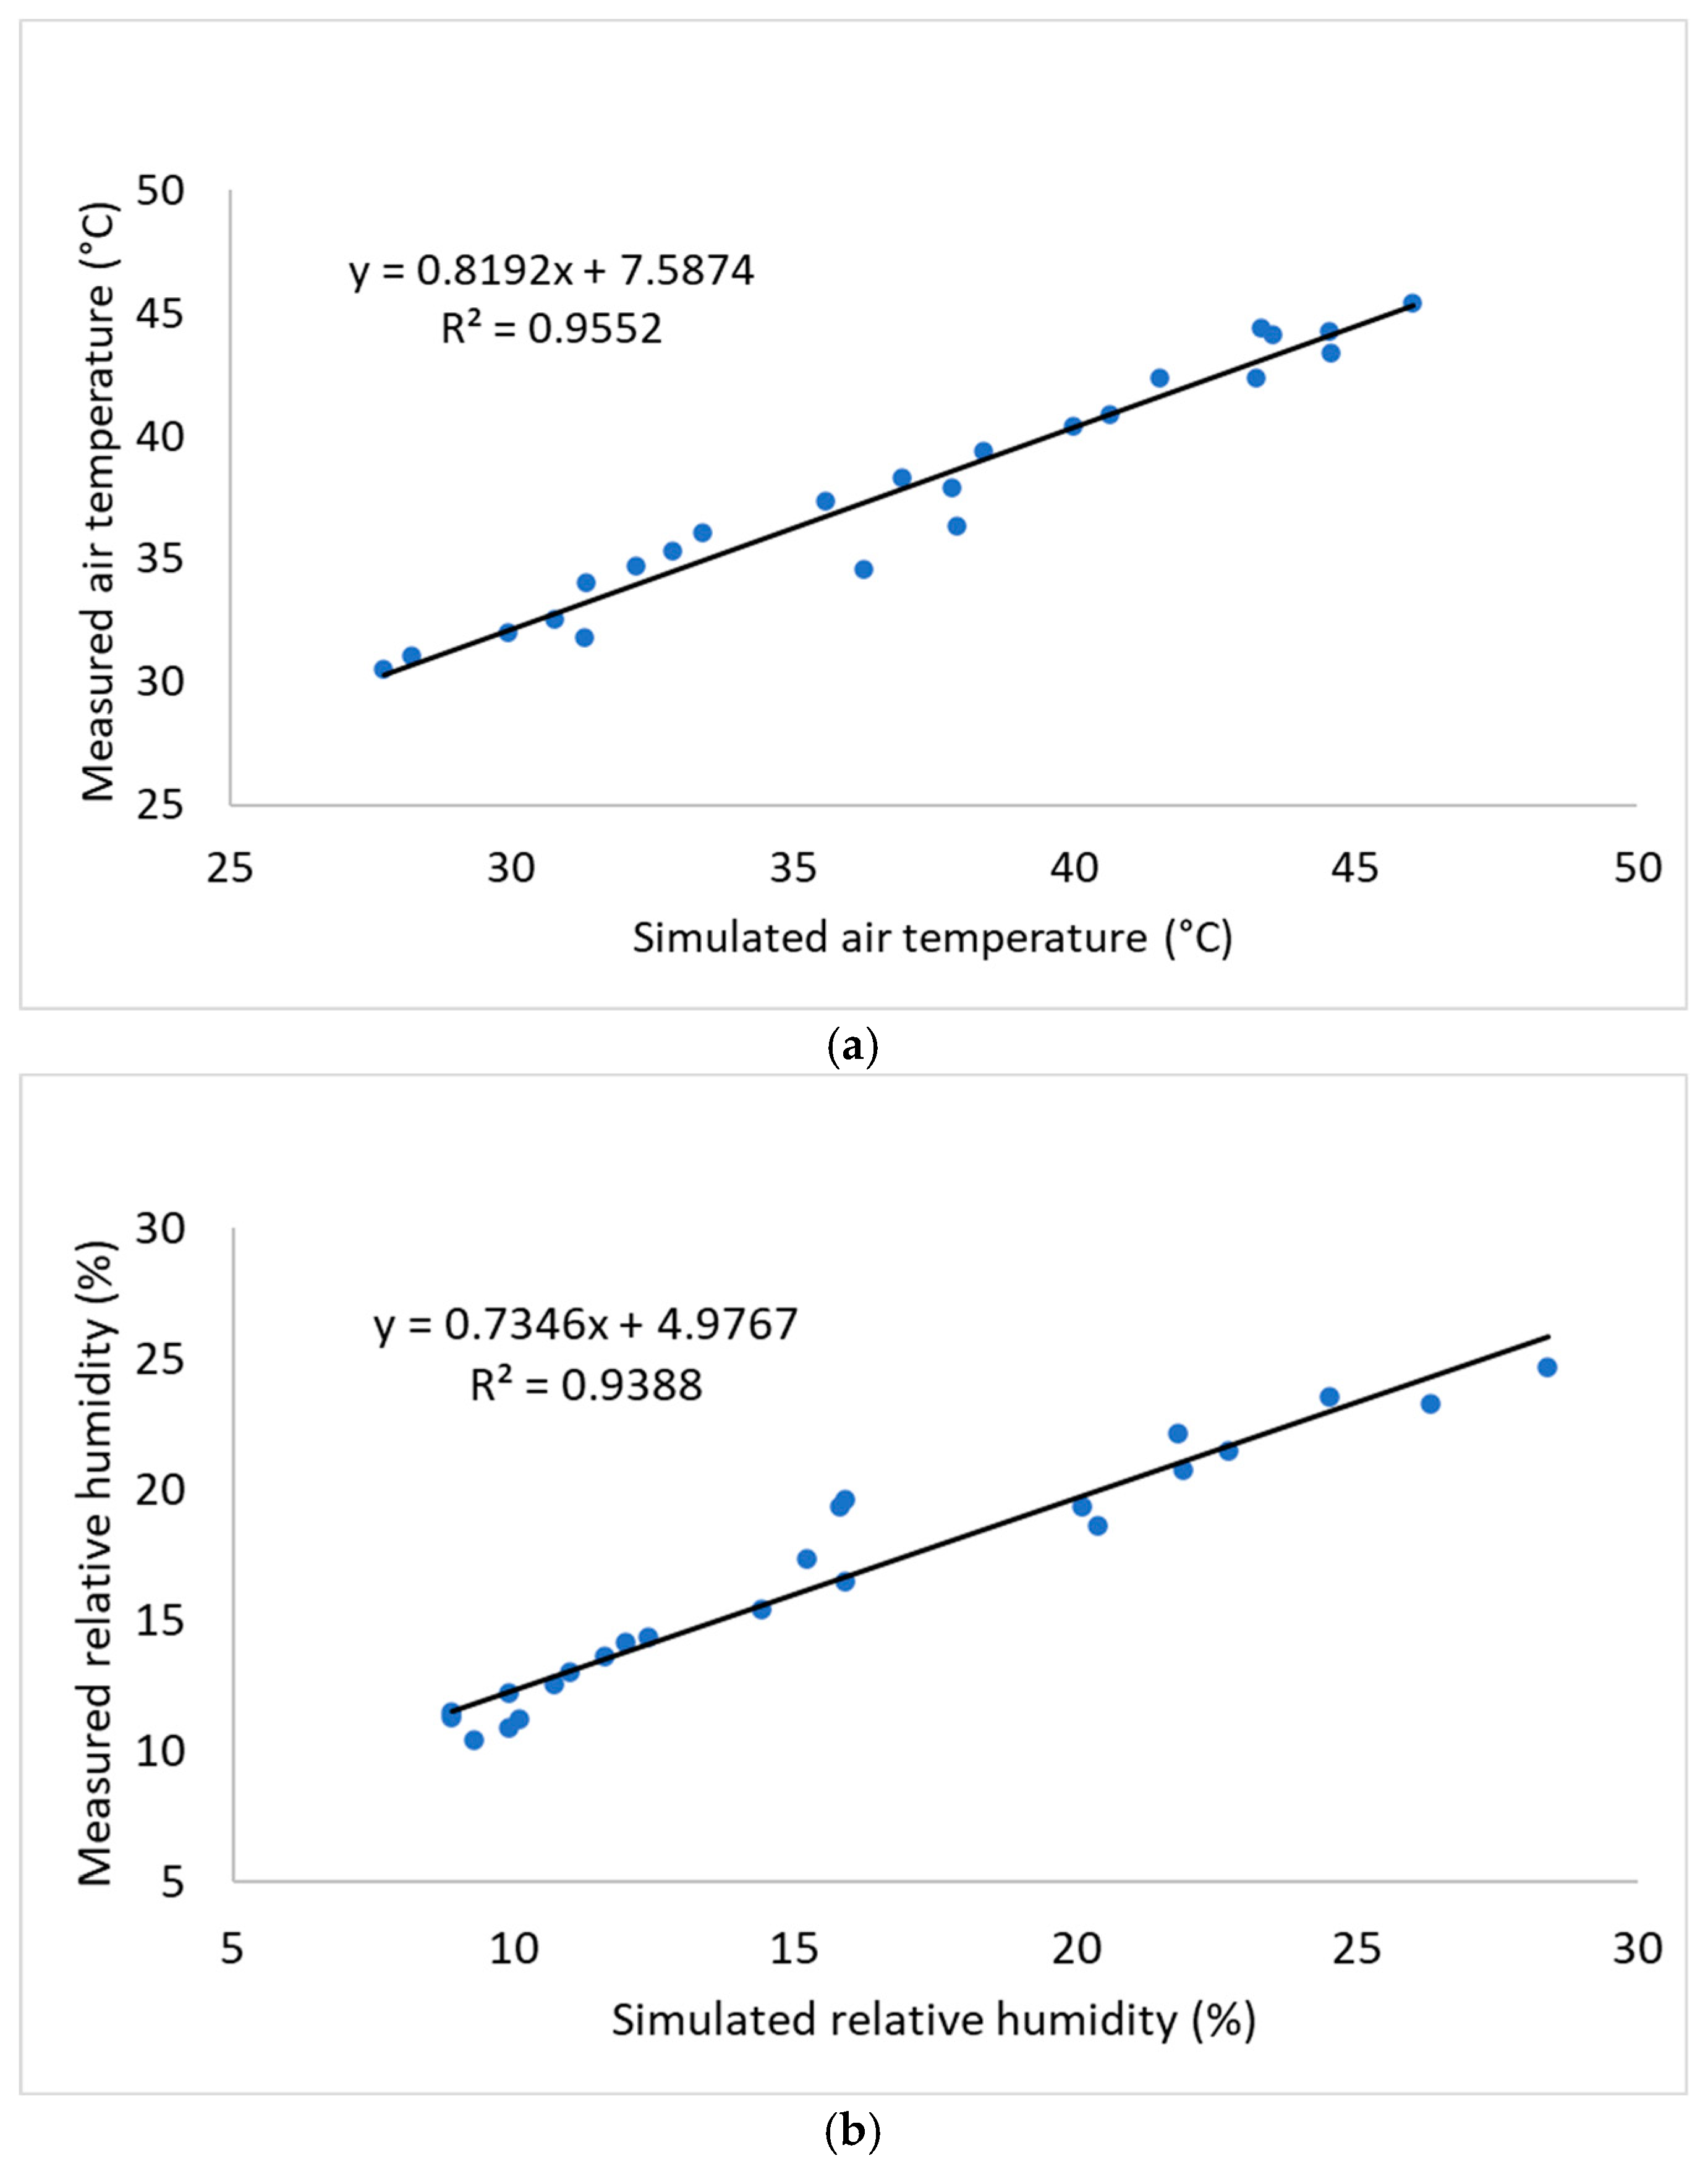
To assess the reliability of the ENVI-met model in replicating microclimate conditions, a verification process was conducted by comparing the simulated air temperature and relative humidity values with the observed data in the courtyard of the Faculty of Arts at New Aswan University on 13 July 2022. The examination of these two parameters spanned from 12:00 a.m. to 11:00 p.m. the following day, ensuring comprehensive validation.
The agreement between the simulated and recorded values was evaluated using matching coefficients to determine the level of concordance. The coefficient of determination (R2) served as a metric to quantify the strength of the association between the simulated and observed values. Notably, high levels of agreement were observed for both air temperature and humidity. The R2 values obtained were 0.9552 and 0.9388 for air temperature and relative humidity, respectively. Visual representations of these results are depicted in Figure 4a,b. Generally, the ENVI-met simulation model effectively reproduces the climatic data from the study site, demonstrating its capability to accurately assess potential improvements to thermal conditions through the manipulation of tree types and percentages in the courtyard. Consequently, the ENVI-met simulation model is deemed suitable for fulfilling the objectives of the study.
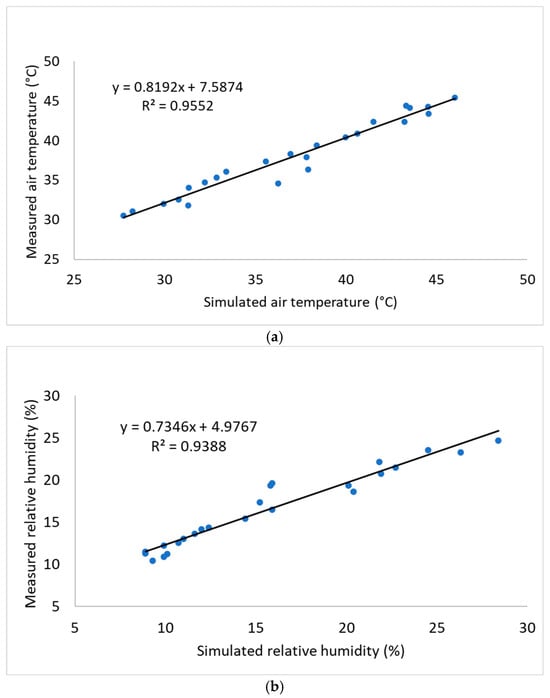
Figure 4.
Validation model for the Faculty of Arts courtyard, New Aswan University in terms of: (a) air temperature; (b) relative humidity.
3. Results
The simulation results demonstrated statistically significant reductions in electricity consumption and costs for the educational building across all modeled urban vegetation scenarios compared to the base case without trees.
3.1. Courtyard Microclimate Performance
3.1.1. Analysis of Air Temperature and Relative Humidity
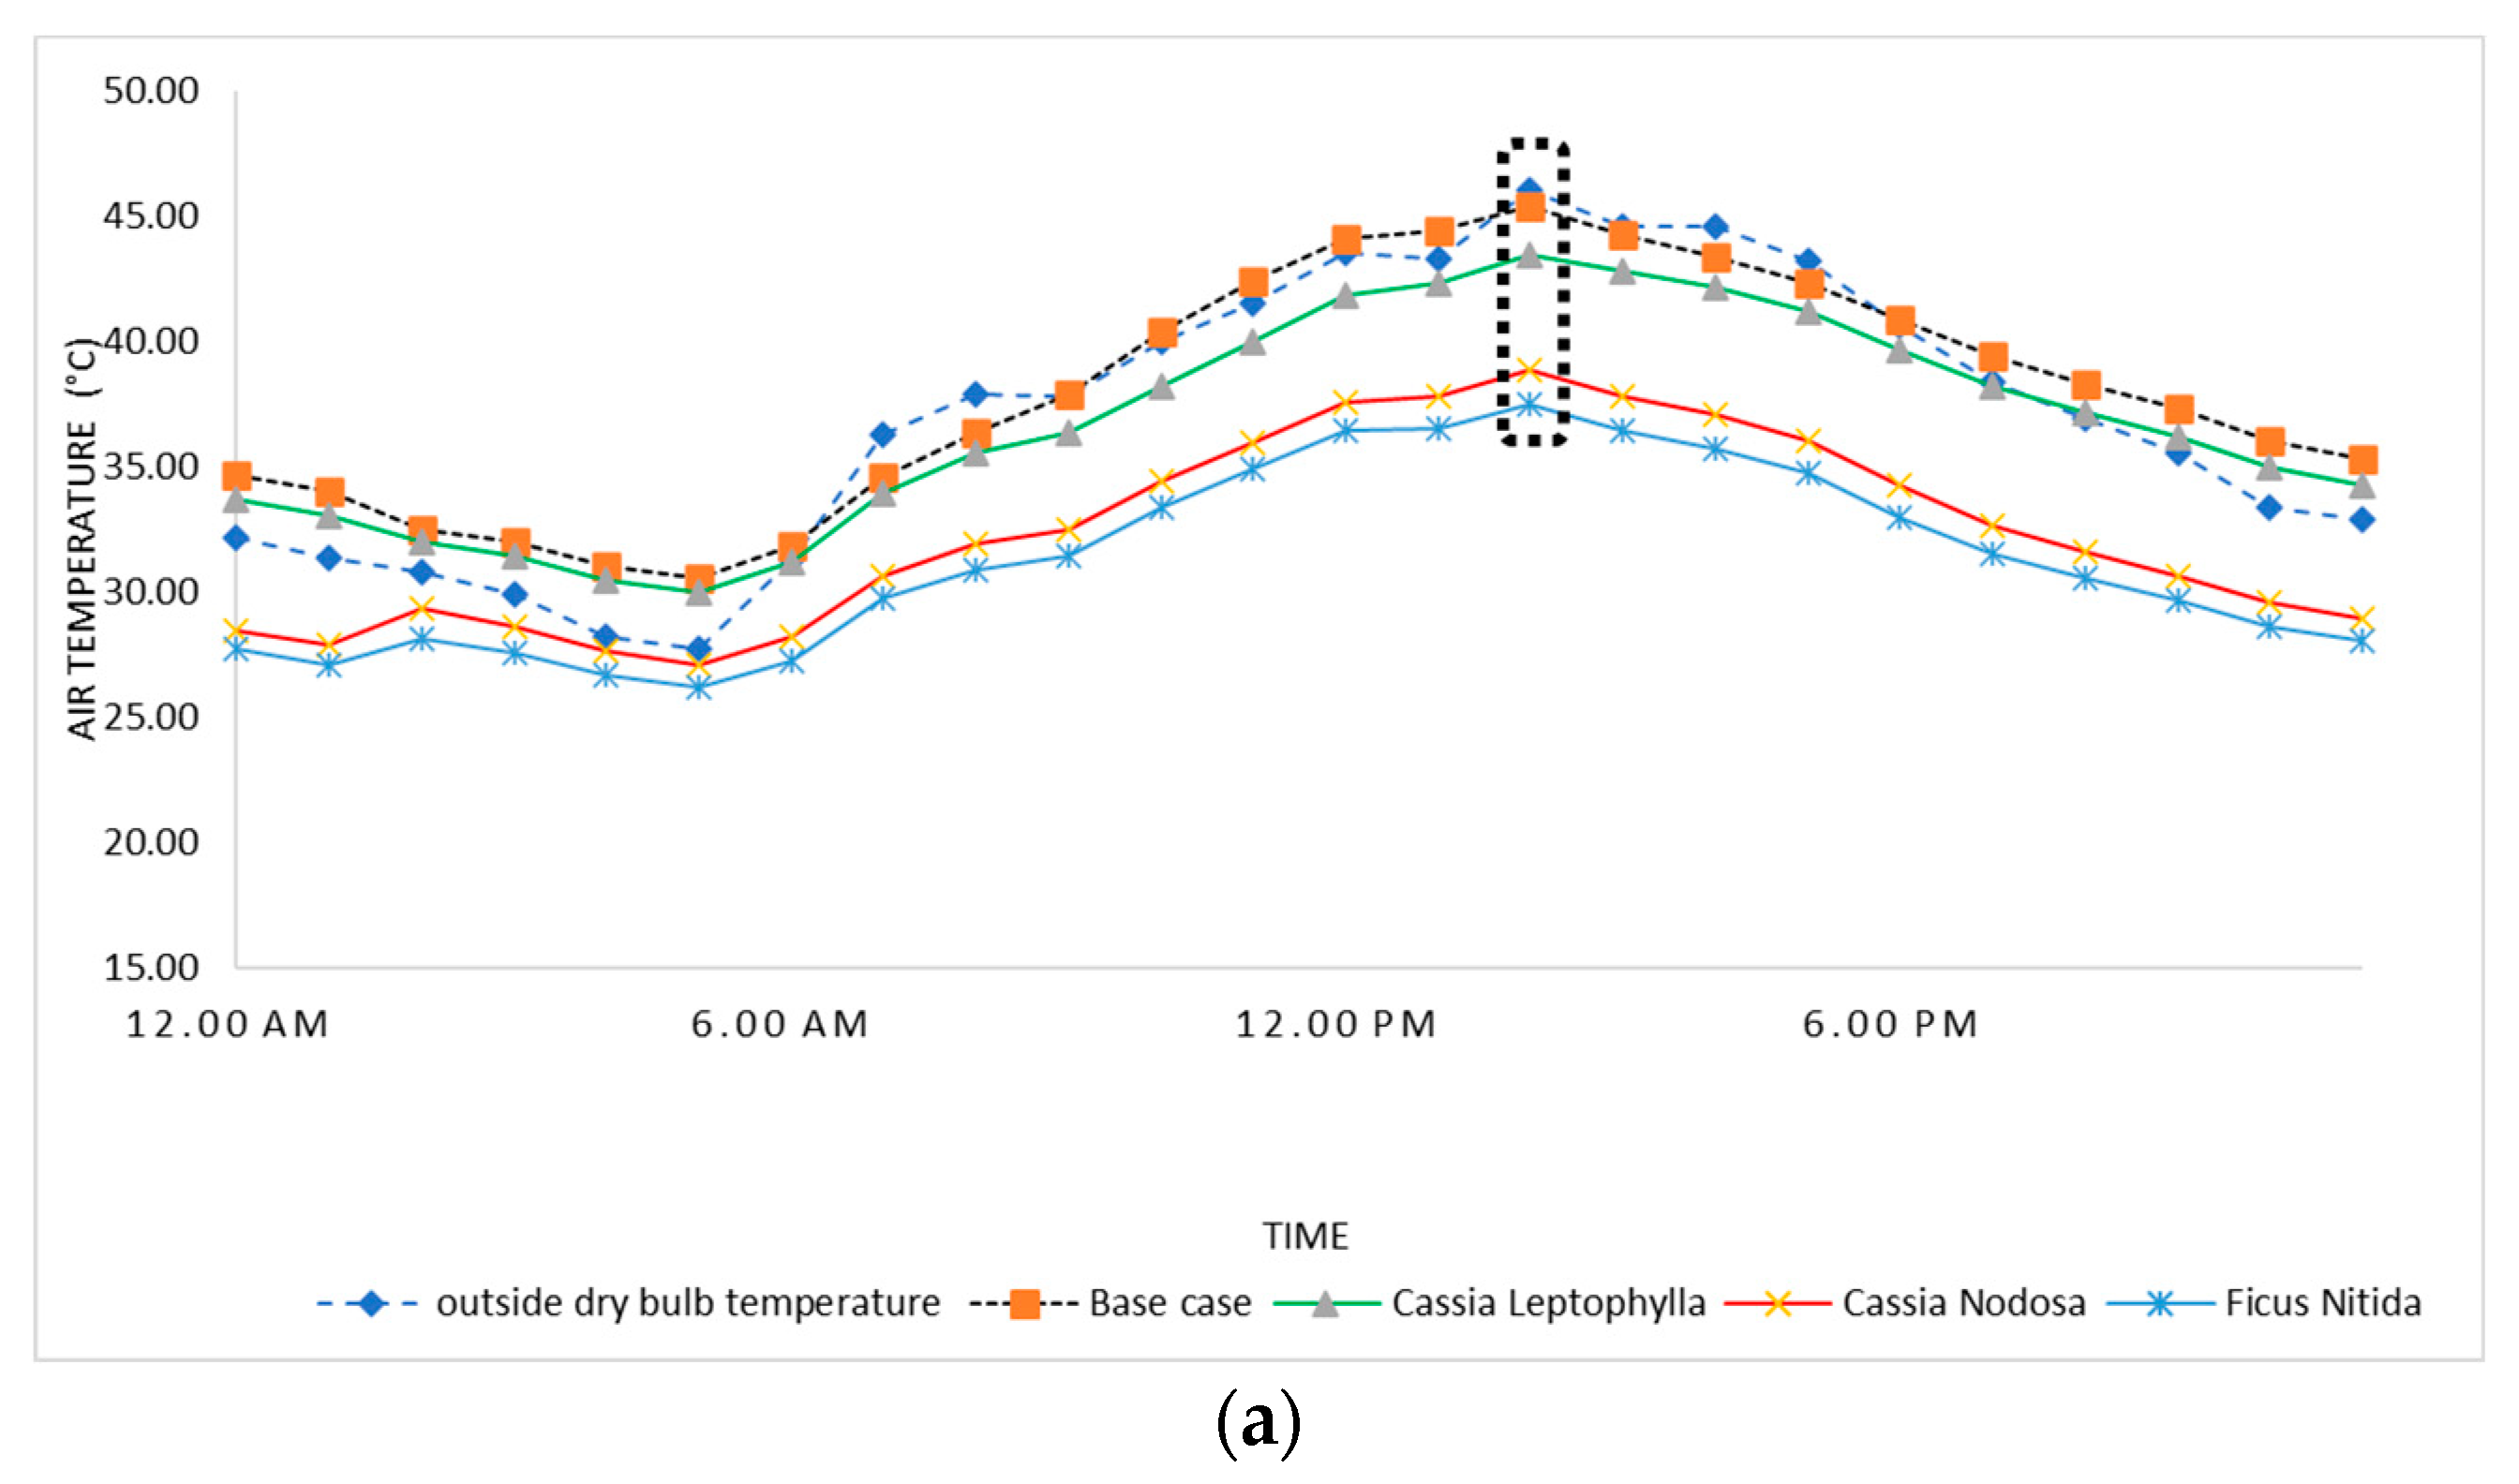
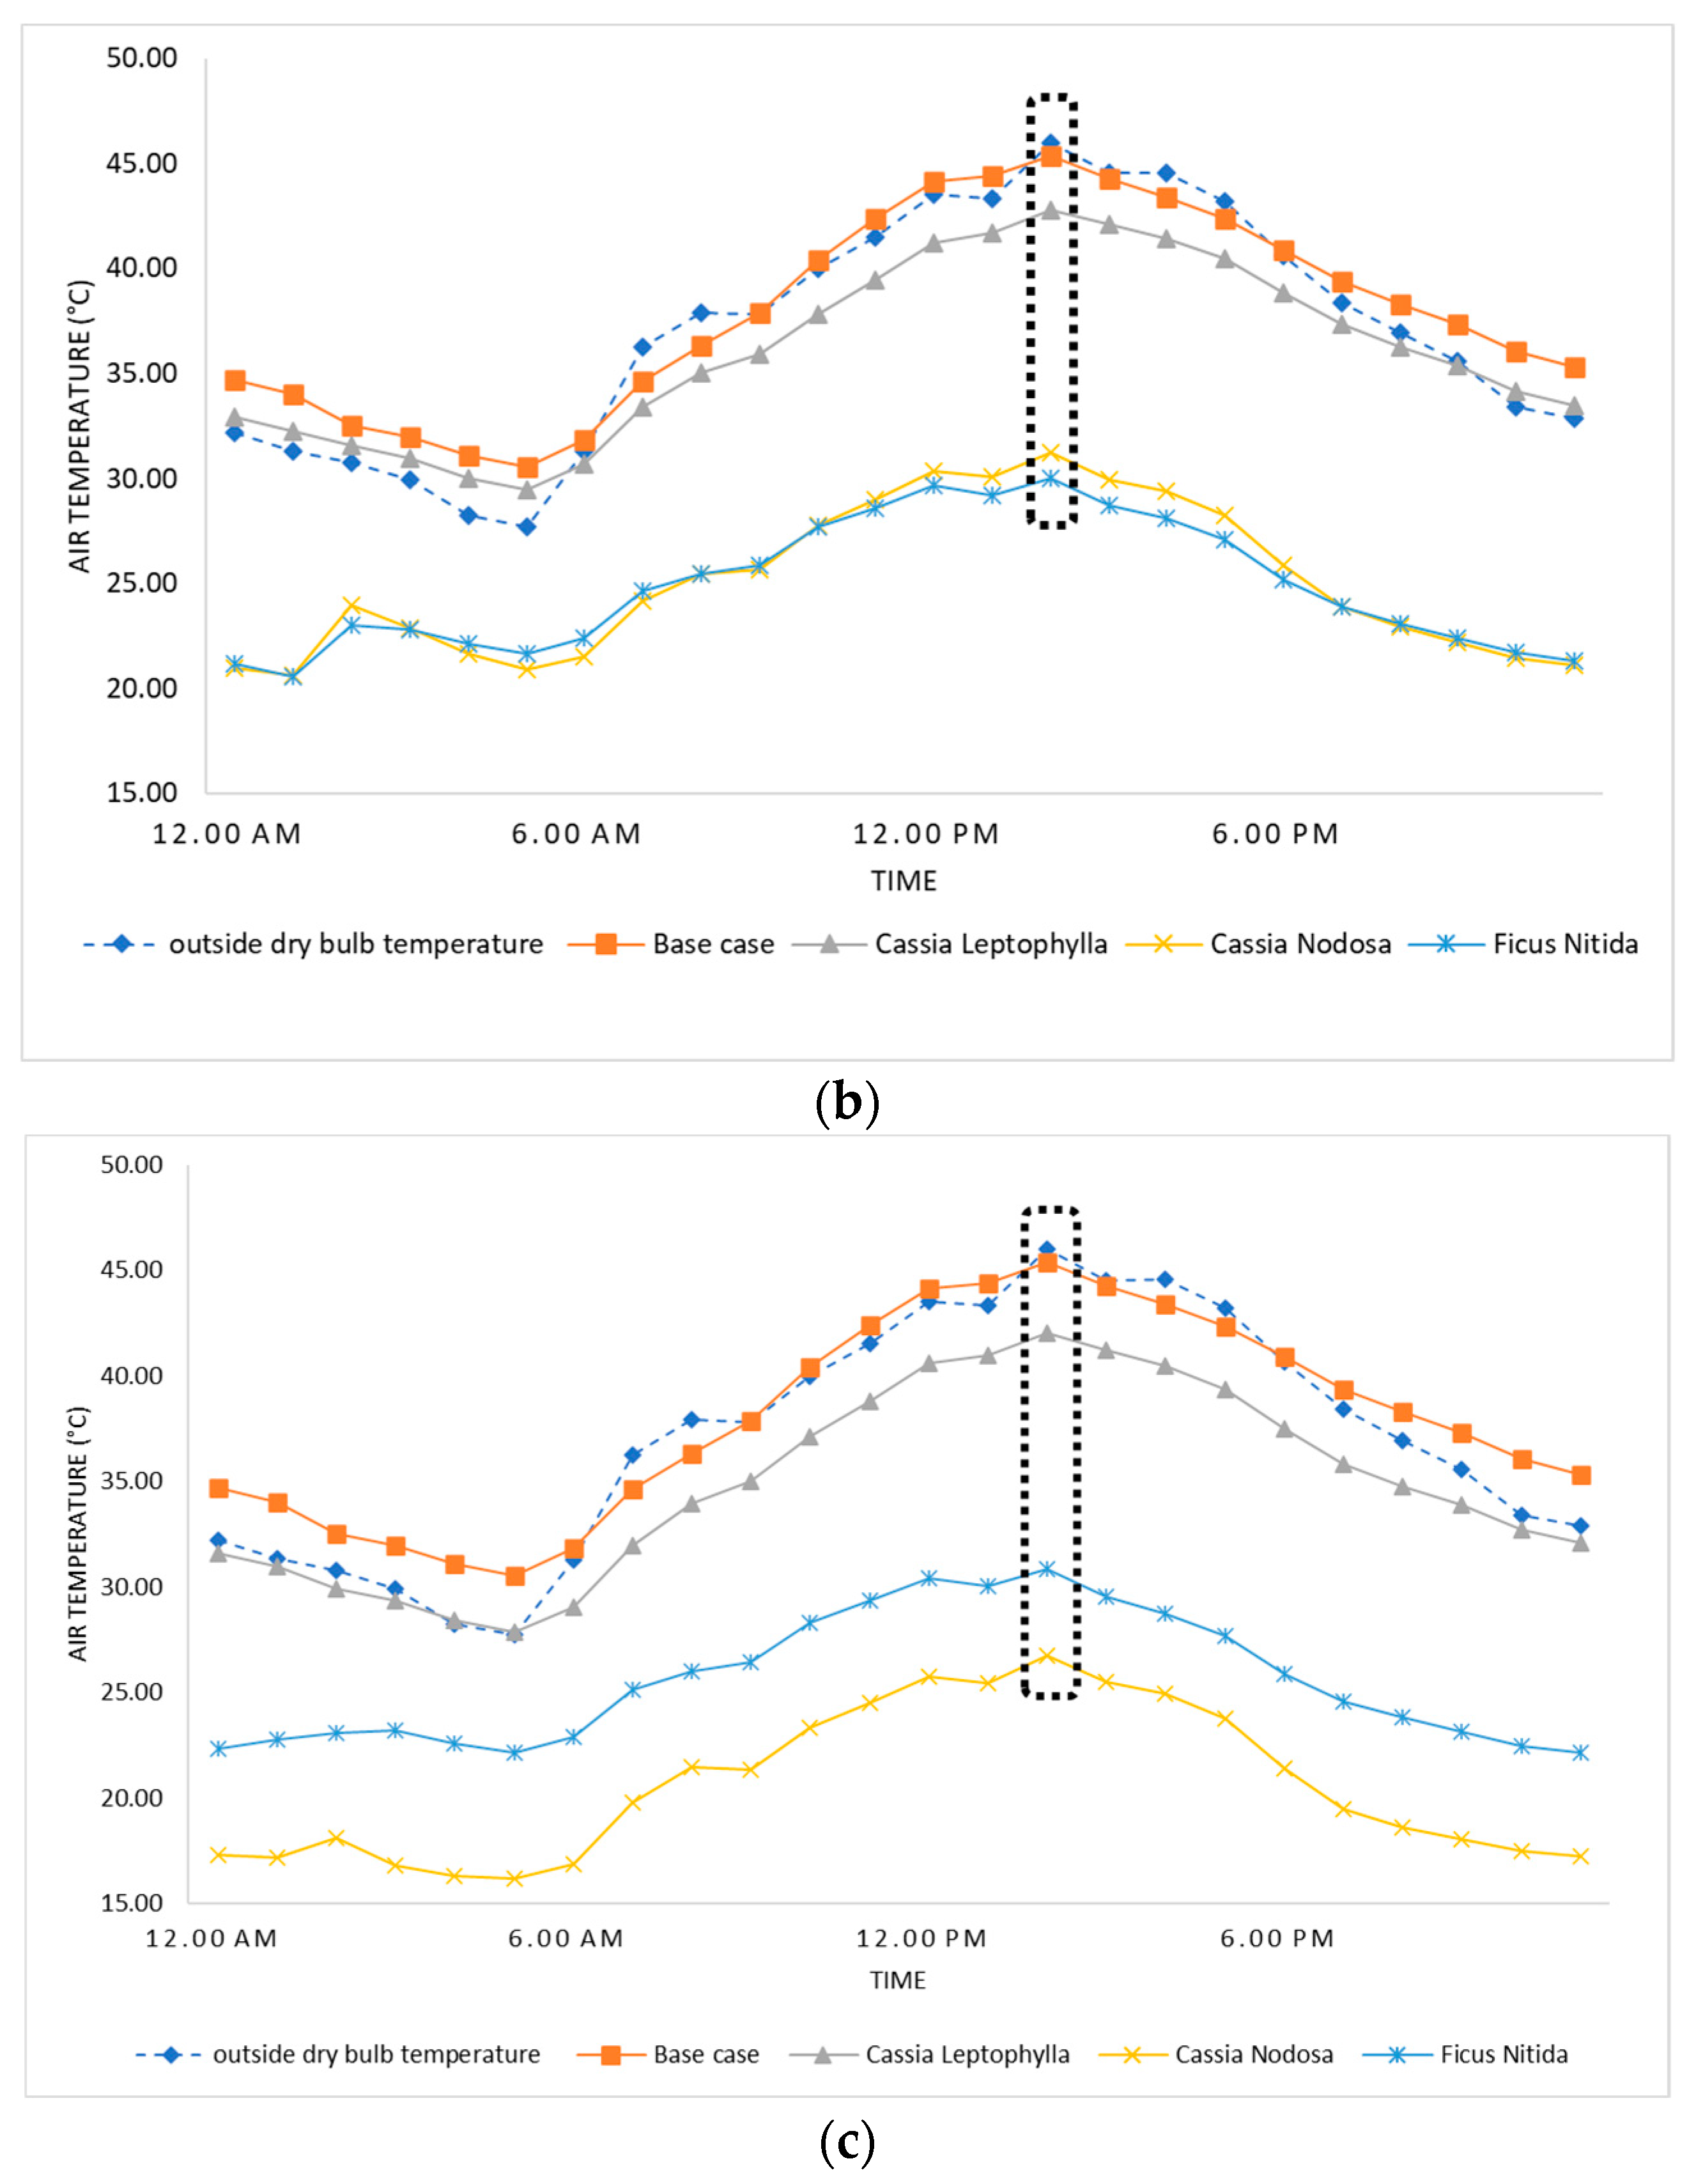
This study investigated the microclimate of the Faculty of Arts courtyard through simulations of nine distinct scenarios. In each simulated scenario, air temperature and relative humidity exhibited distinct diurnal patterns. The air temperature generally increased from 5:00 a.m. to reach a peak at 2:00 p.m. before decreasing throughout the afternoon and evening. Conversely, relative humidity displayed an inverse pattern, gradually decreasing until reaching a minimum at 2:00 p.m. and subsequently increasing towards 5:00 a.m. These consistent patterns across all scenarios suggest the presence of predictable diurnal cycles governing the thermal comfort within the courtyard.
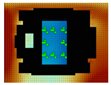
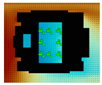
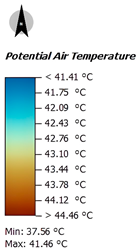
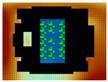
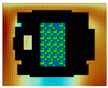
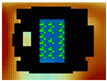
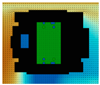
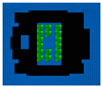
Figure 5 illustrates the impact of tree coverage on air temperature in a courtyard setting. The black-dotted rectangles in Figure 5a–c indicate the peak air temperature values recorded at 2:00 p.m. The results demonstrate that the presence of trees, particularly at a coverage level of 60%, significantly lowers the air temperature compared to the base case without trees. This cooling effect is attributed to the shading provided by trees, which helps to mitigate solar radiation and maintain a cooler microclimate. Additionally, trees contribute to air cooling through the release of water vapor via transpiration and subsequent evaporation. Notably, Cassia Nodosa and Ficus Nitida exhibit the most substantial cooling effect, with average air temperature reductions exceeding 12 °C compared to the base case. Specifically, the use of 20% of these trees in the courtyard results in average temperature reductions of 5.7 K and 6.6 K for Cassia Nodosa and Ficus Nitida, respectively. Increasing tree coverage to 40% further enhances the cooling effect, resulting in average temperature reductions of 12.8 K and 13 K for Cassia Nodosa and Ficus Nitida, respectively.
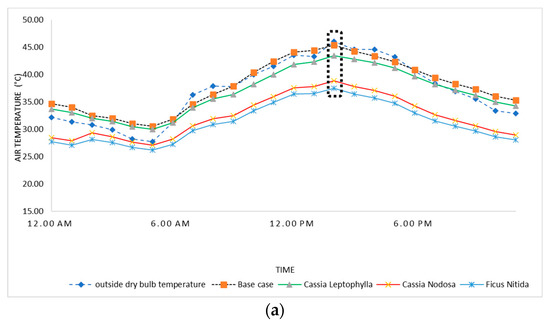
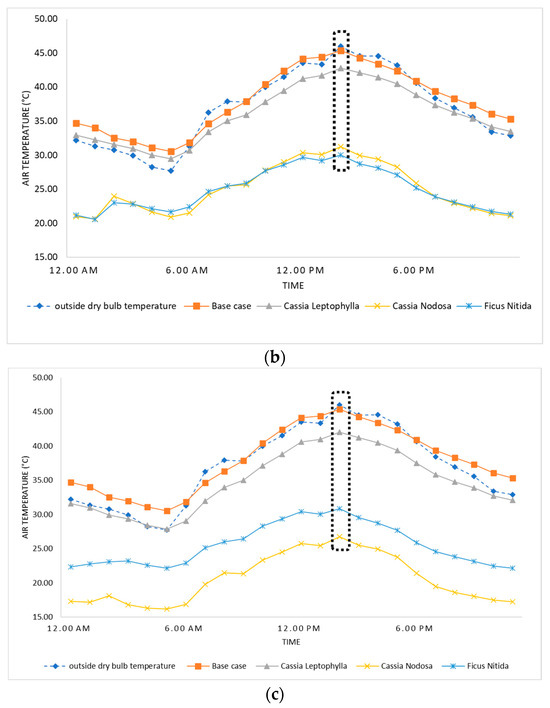
Figure 5.
Results of air temperature for trees coverage of (a) 20%; (b) 40%; (c) 60%. The dot line box refers to the maximum values during the day.
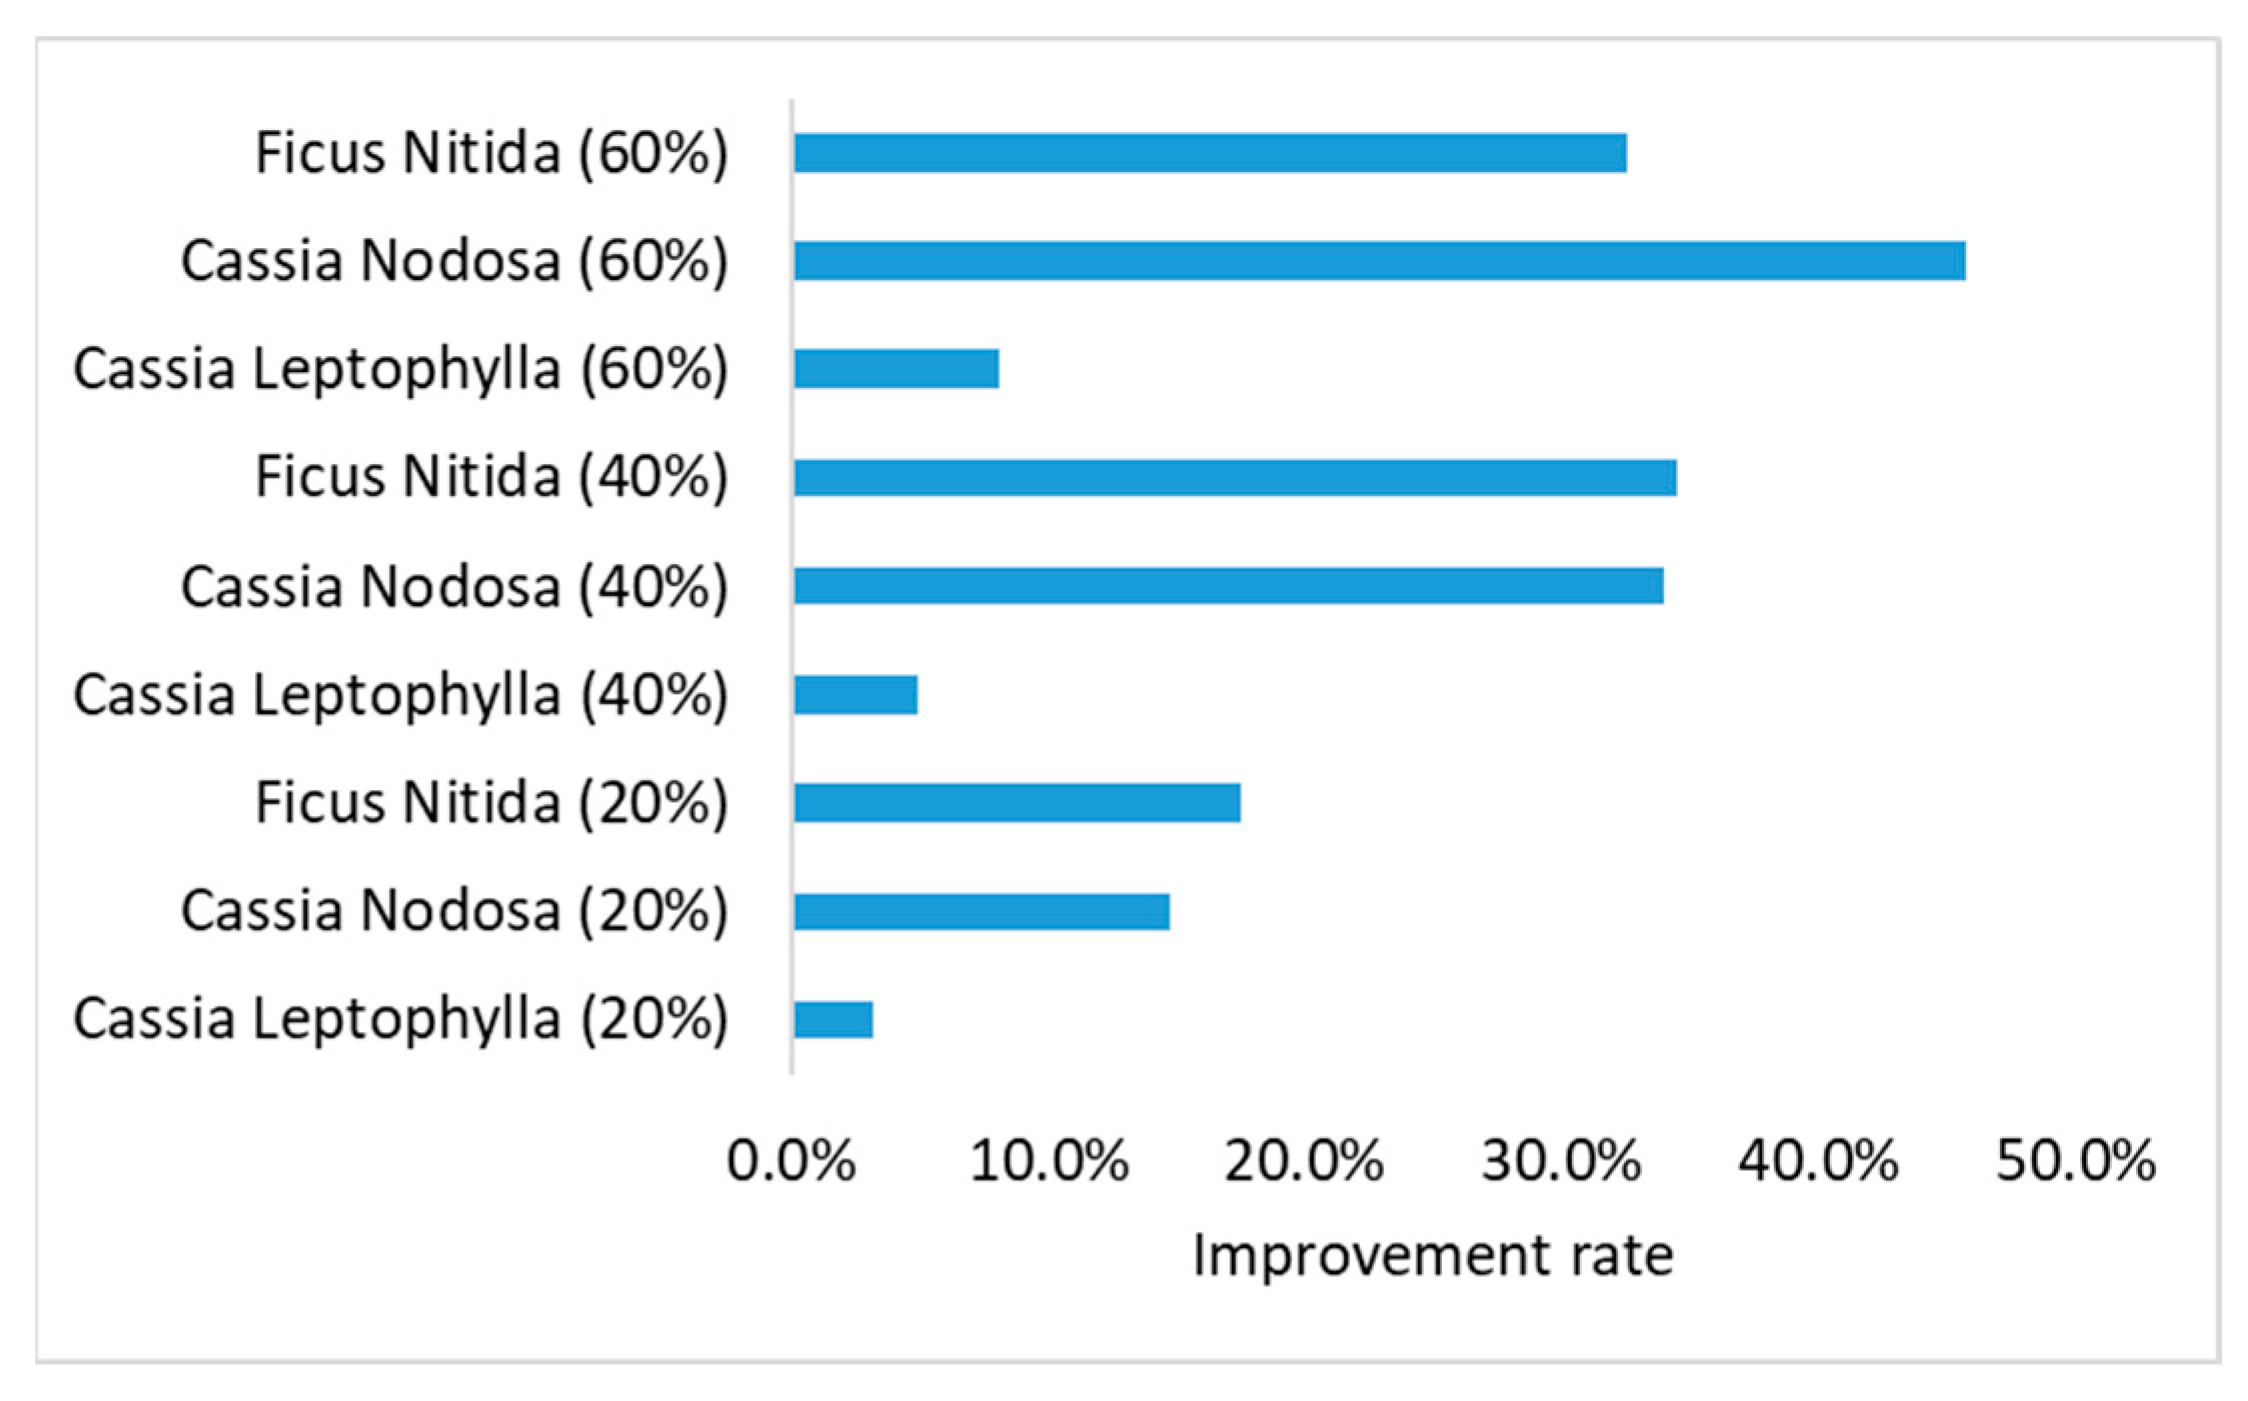
When 60% of the courtyard is covered with trees, average temperature reductions of 17.3 K and 12.3 K are observed for Cassia Nodosa and Ficus Nitida, respectively. Cassia Leptophylla also demonstrates a significant cooling effect, with average temperature reductions of 1.2 K, 1.9 K, and 3.1 K for 20%, 40%, and 60% tree coverage, respectively, compared to the base case. Notably, the most efficient scenario involves a 60% coverage of the courtyard with Cassia Nodosa, resulting in a remarkable improvement of 45.7% in courtyard air temperature, as seen in Figure 6. These findings highlight the efficacy of tree planting in urban areas to mitigate heat stress and enhance the thermal comfort of residents. Cassia Nodosa and Ficus Nitida emerge as particularly effective tree species for this purpose, while Cassia Leptophylla also offers a viable option.
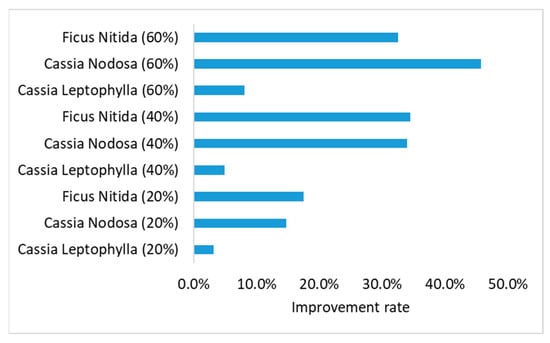
Figure 6.
Improvement rate in terms of air temperature reduction.
A notable observation is the reduction in the temperature mitigation efficacy of Ficus nitida at 60% courtyard coverage compared to 40% coverage. Specifically, temperature reduction was recorded at 32.5% for 60% coverage, whereas it was 34.4% for 40% coverage. This trend can be explained by the tree’s inherent characteristics and the complex interactions of microclimatic factors. Ficus nitida features a dense canopy and exhibits high rates of evapotranspiration, which contributes to effective air cooling. However, at 40% coverage, the interplay between shading and airflow appears to be more balanced, potentially optimizing cooling performance. When coverage increases to 60%, the dense foliage may restrict airflow, leading to the accumulation of warmer air and a diminished cooling effect. Additionally, the increased evapotranspiration associated with higher coverage could elevate humidity levels, potentially offsetting the cooling benefits.
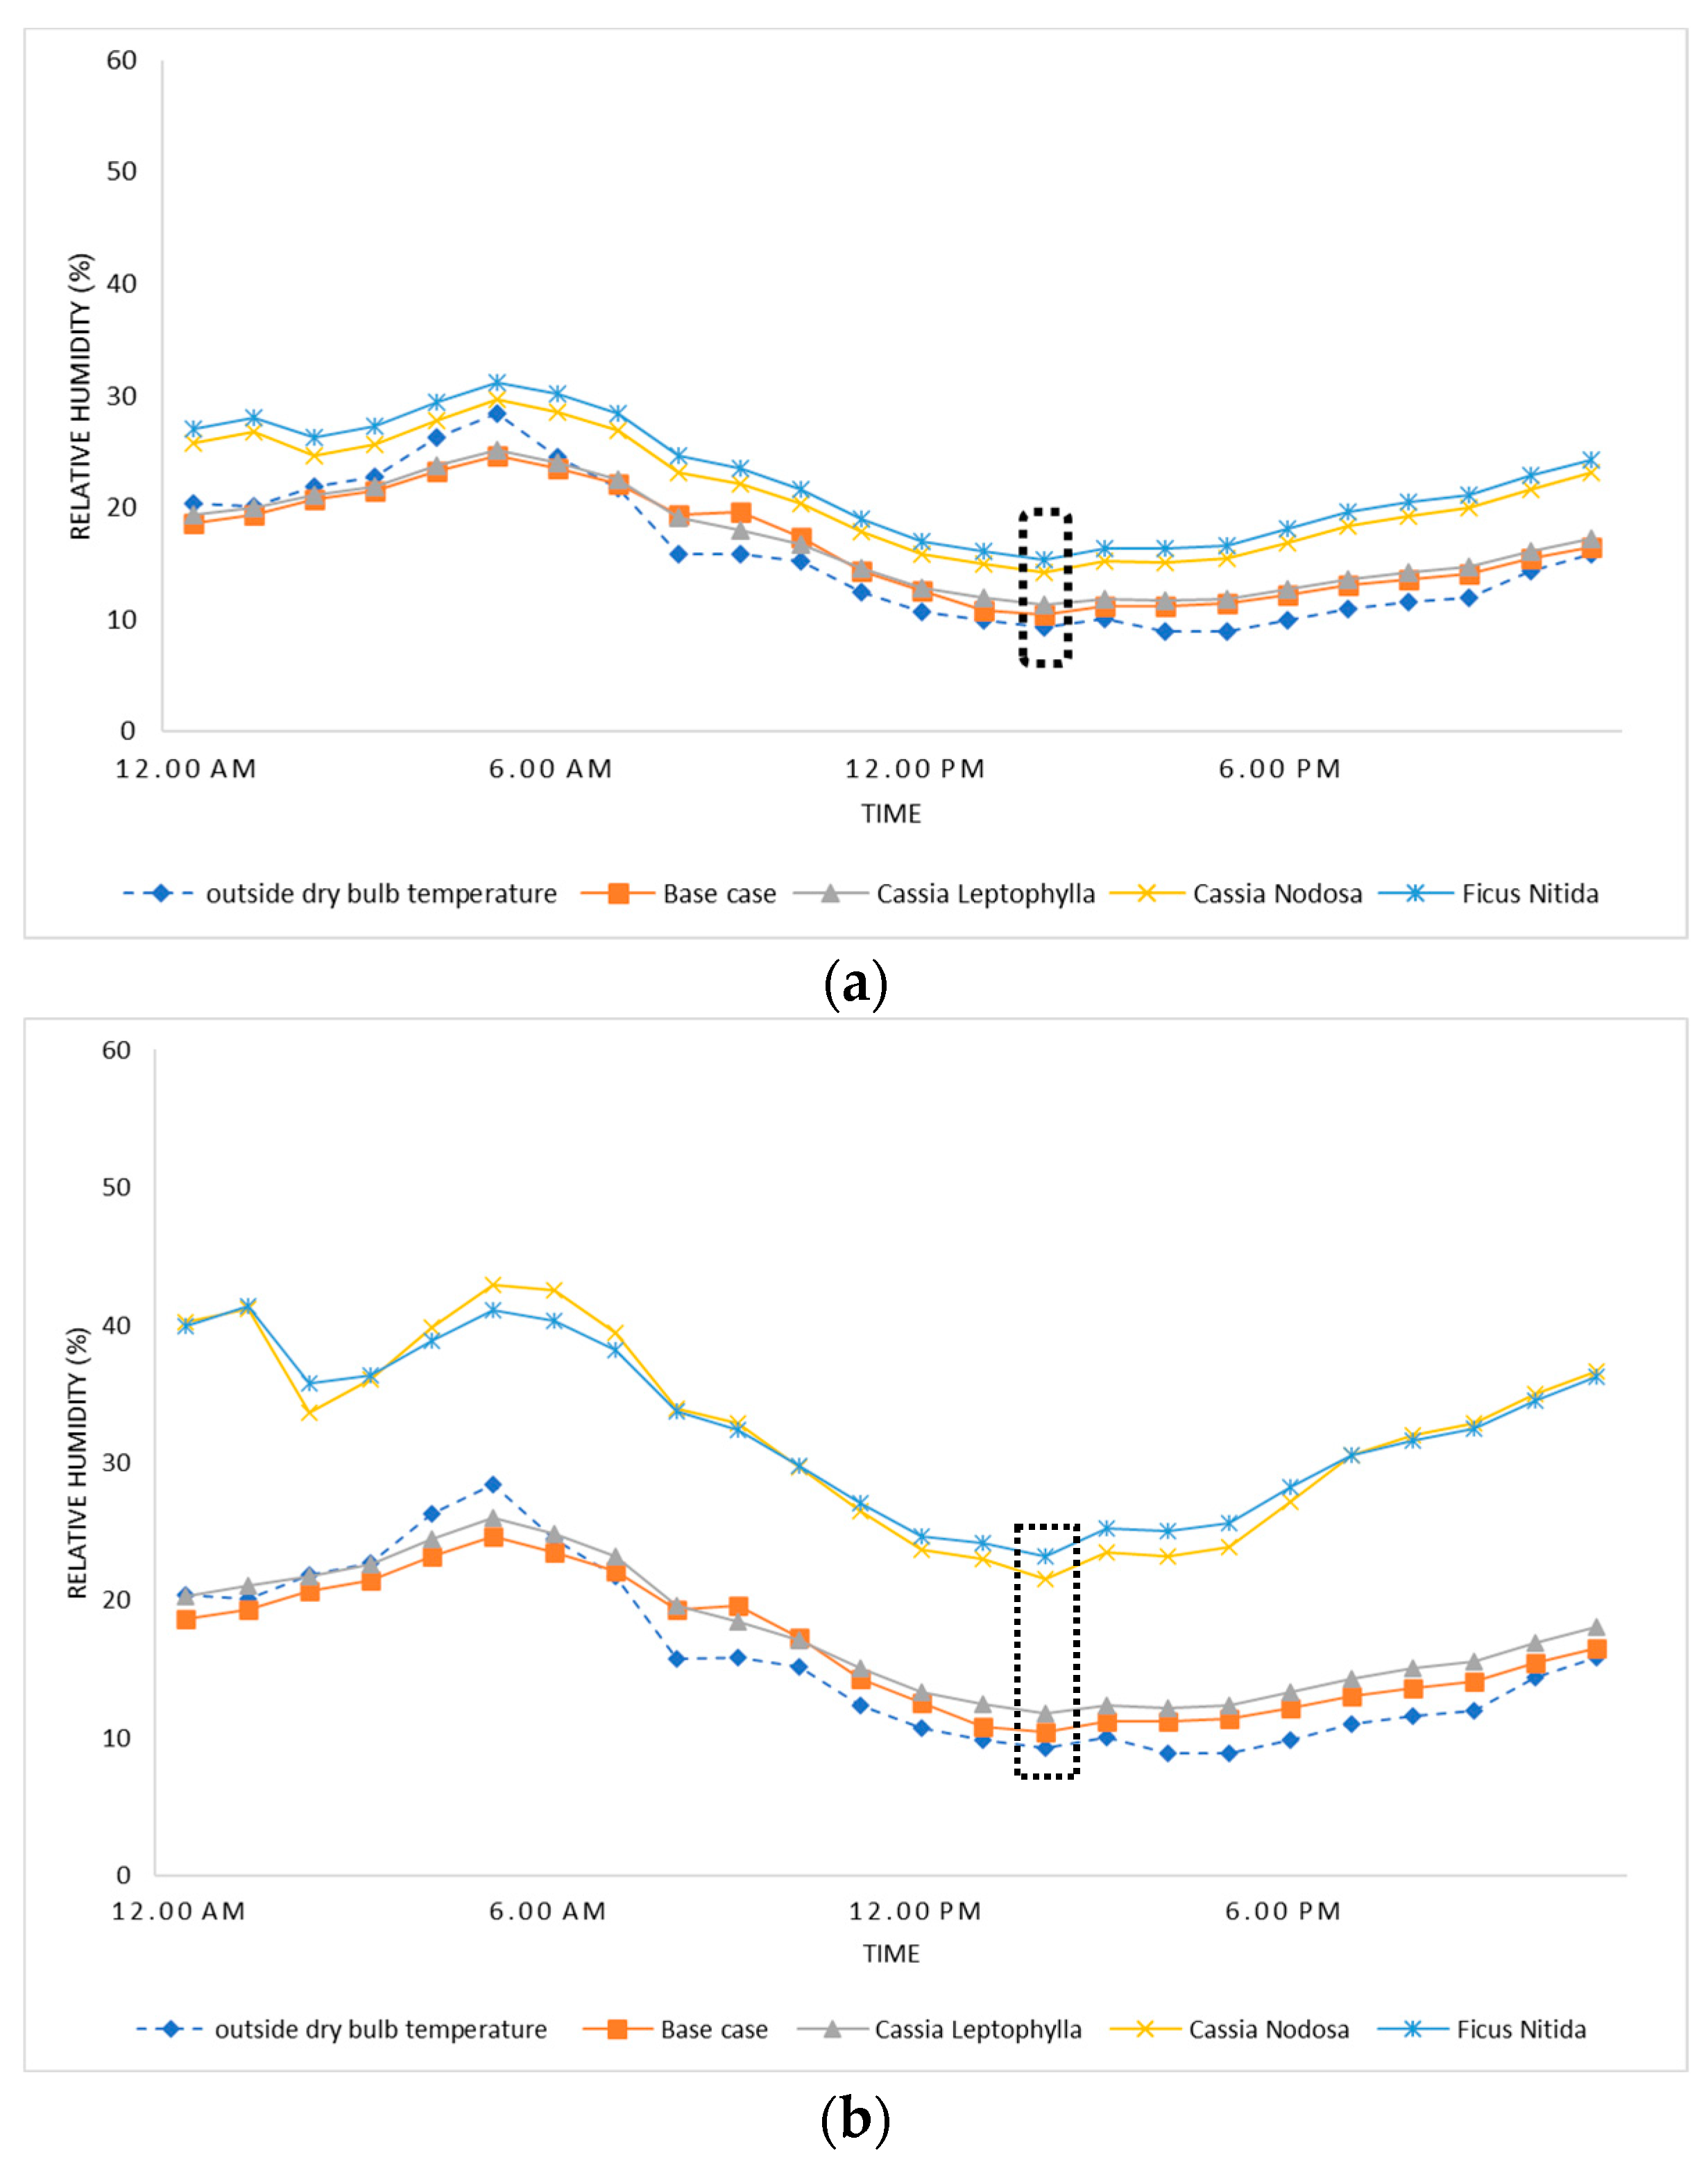
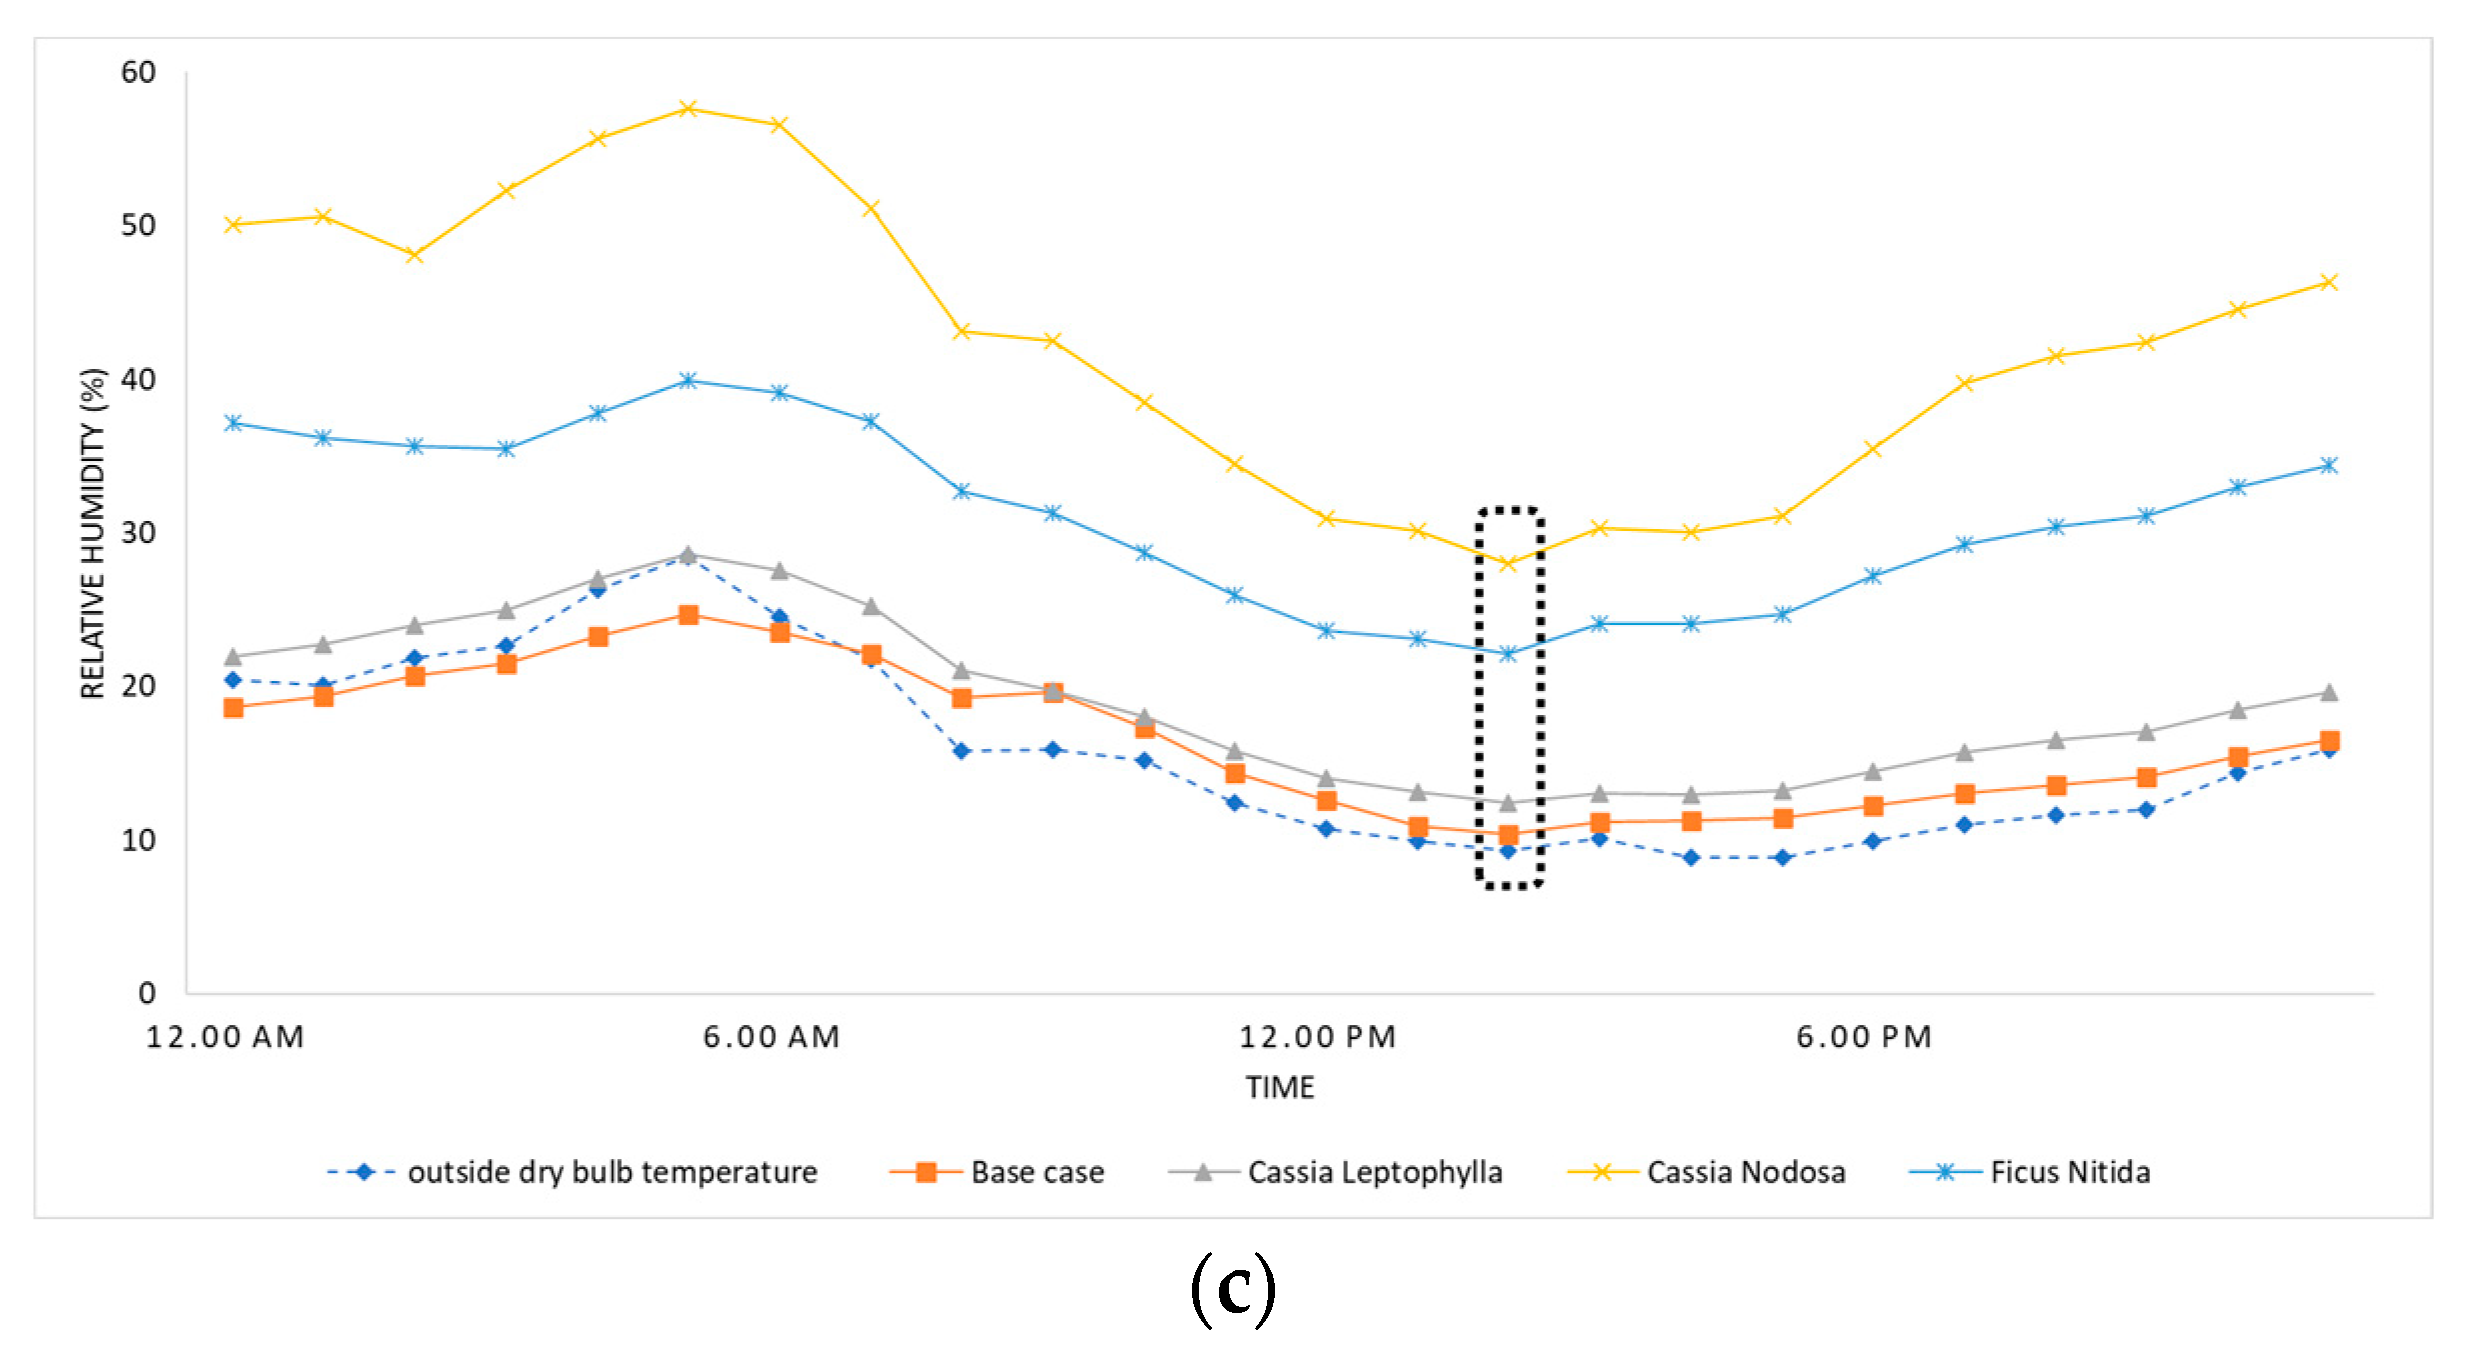
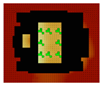
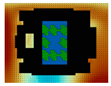
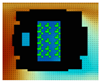
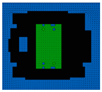
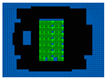
This study analyzed relative humidity variations within a courtyard under different scenarios, including the presence of various tree species. Without trees, relative humidity showed significant diurnal variation, peaking at 28.4% at 5:00 a.m. and dropping to a minimum of 9.3% at 2:00 p.m. The black-dotted rectangles in Figure 7a–c highlight the minimum relative humidity percentages recorded at 2:00 p.m. The introduction of different tree species altered these relative humidity patterns as follows:
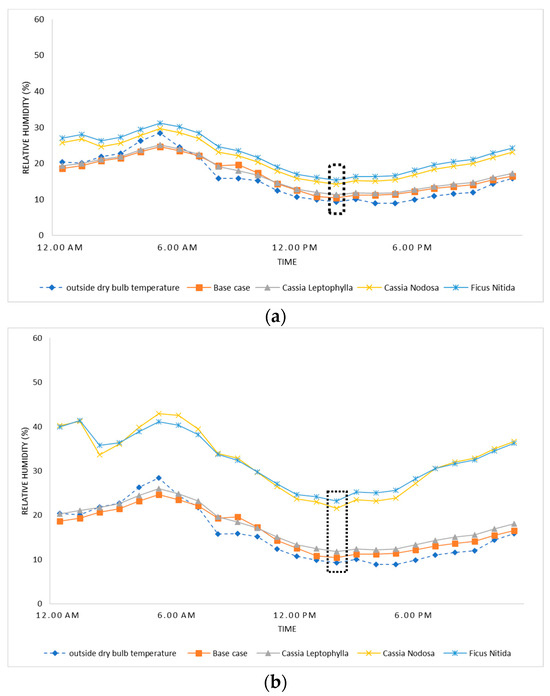
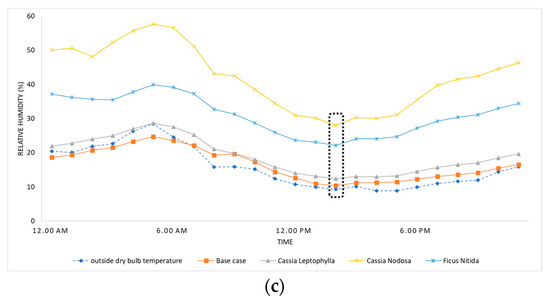
Figure 7.
Results of relative humidity for tree coverage of (a) 20%; (b) 40%; (c) 60%. The dot line box refers to the minimum values during the day.
- Cassia Leptophylla: This tree exhibited a slightly higher maximum relative humidity (28.6% at 5:00 a.m.) compared to the bare courtyard. However, the minimum relative humidity remained relatively close (12.4% at 2:00 p.m.), suggesting a moderate influence on the overall diurnal variation.
- Cassia Nodosa: This tree significantly increased the relative humidity within the courtyard, with a maximum value of 57.6% at 5:00 a.m. and a minimum of 28% at 2:00 p.m. This substantial impact indicates its potential to mitigate the extreme fluctuations experienced in the bare courtyard.
- Ficus Nitida: Similar to Cassia Nodosa, this tree also demonstrated a positive influence on relative humidity. It displayed a maximum value of 39.4% at 5:00 a.m. and a minimum of 22.4% at 2:00 p.m., suggesting a moderate increase in overall humidity compared to the bare courtyard.
An extensive simulation analysis examined the microclimatic air temperature distribution within a courtyard under varying scenarios. Measurements were parameterized at 1.5 m high to capture occupant-level thermal exposure across a typical day. Temperature values were recorded at discrete mid-day intervals of 10 a.m., 12 p.m., 2 p.m., 4 p.m., and 6 p.m. during peak summertime conditions to profile the heat scape over diurnal cycles, as shown in Table 4. Three tree species—Cassia Leptophylla, Cassia Nodosa, and Ficus Nitida were modeled at incremental coverage densities of 20%, 40%, and 60%.
Table 4.
Thermal patterns in the courtyard with different vegetation scenarios.
3.1.2. The Influence of Proposed Vegetation Scenarios on the PET
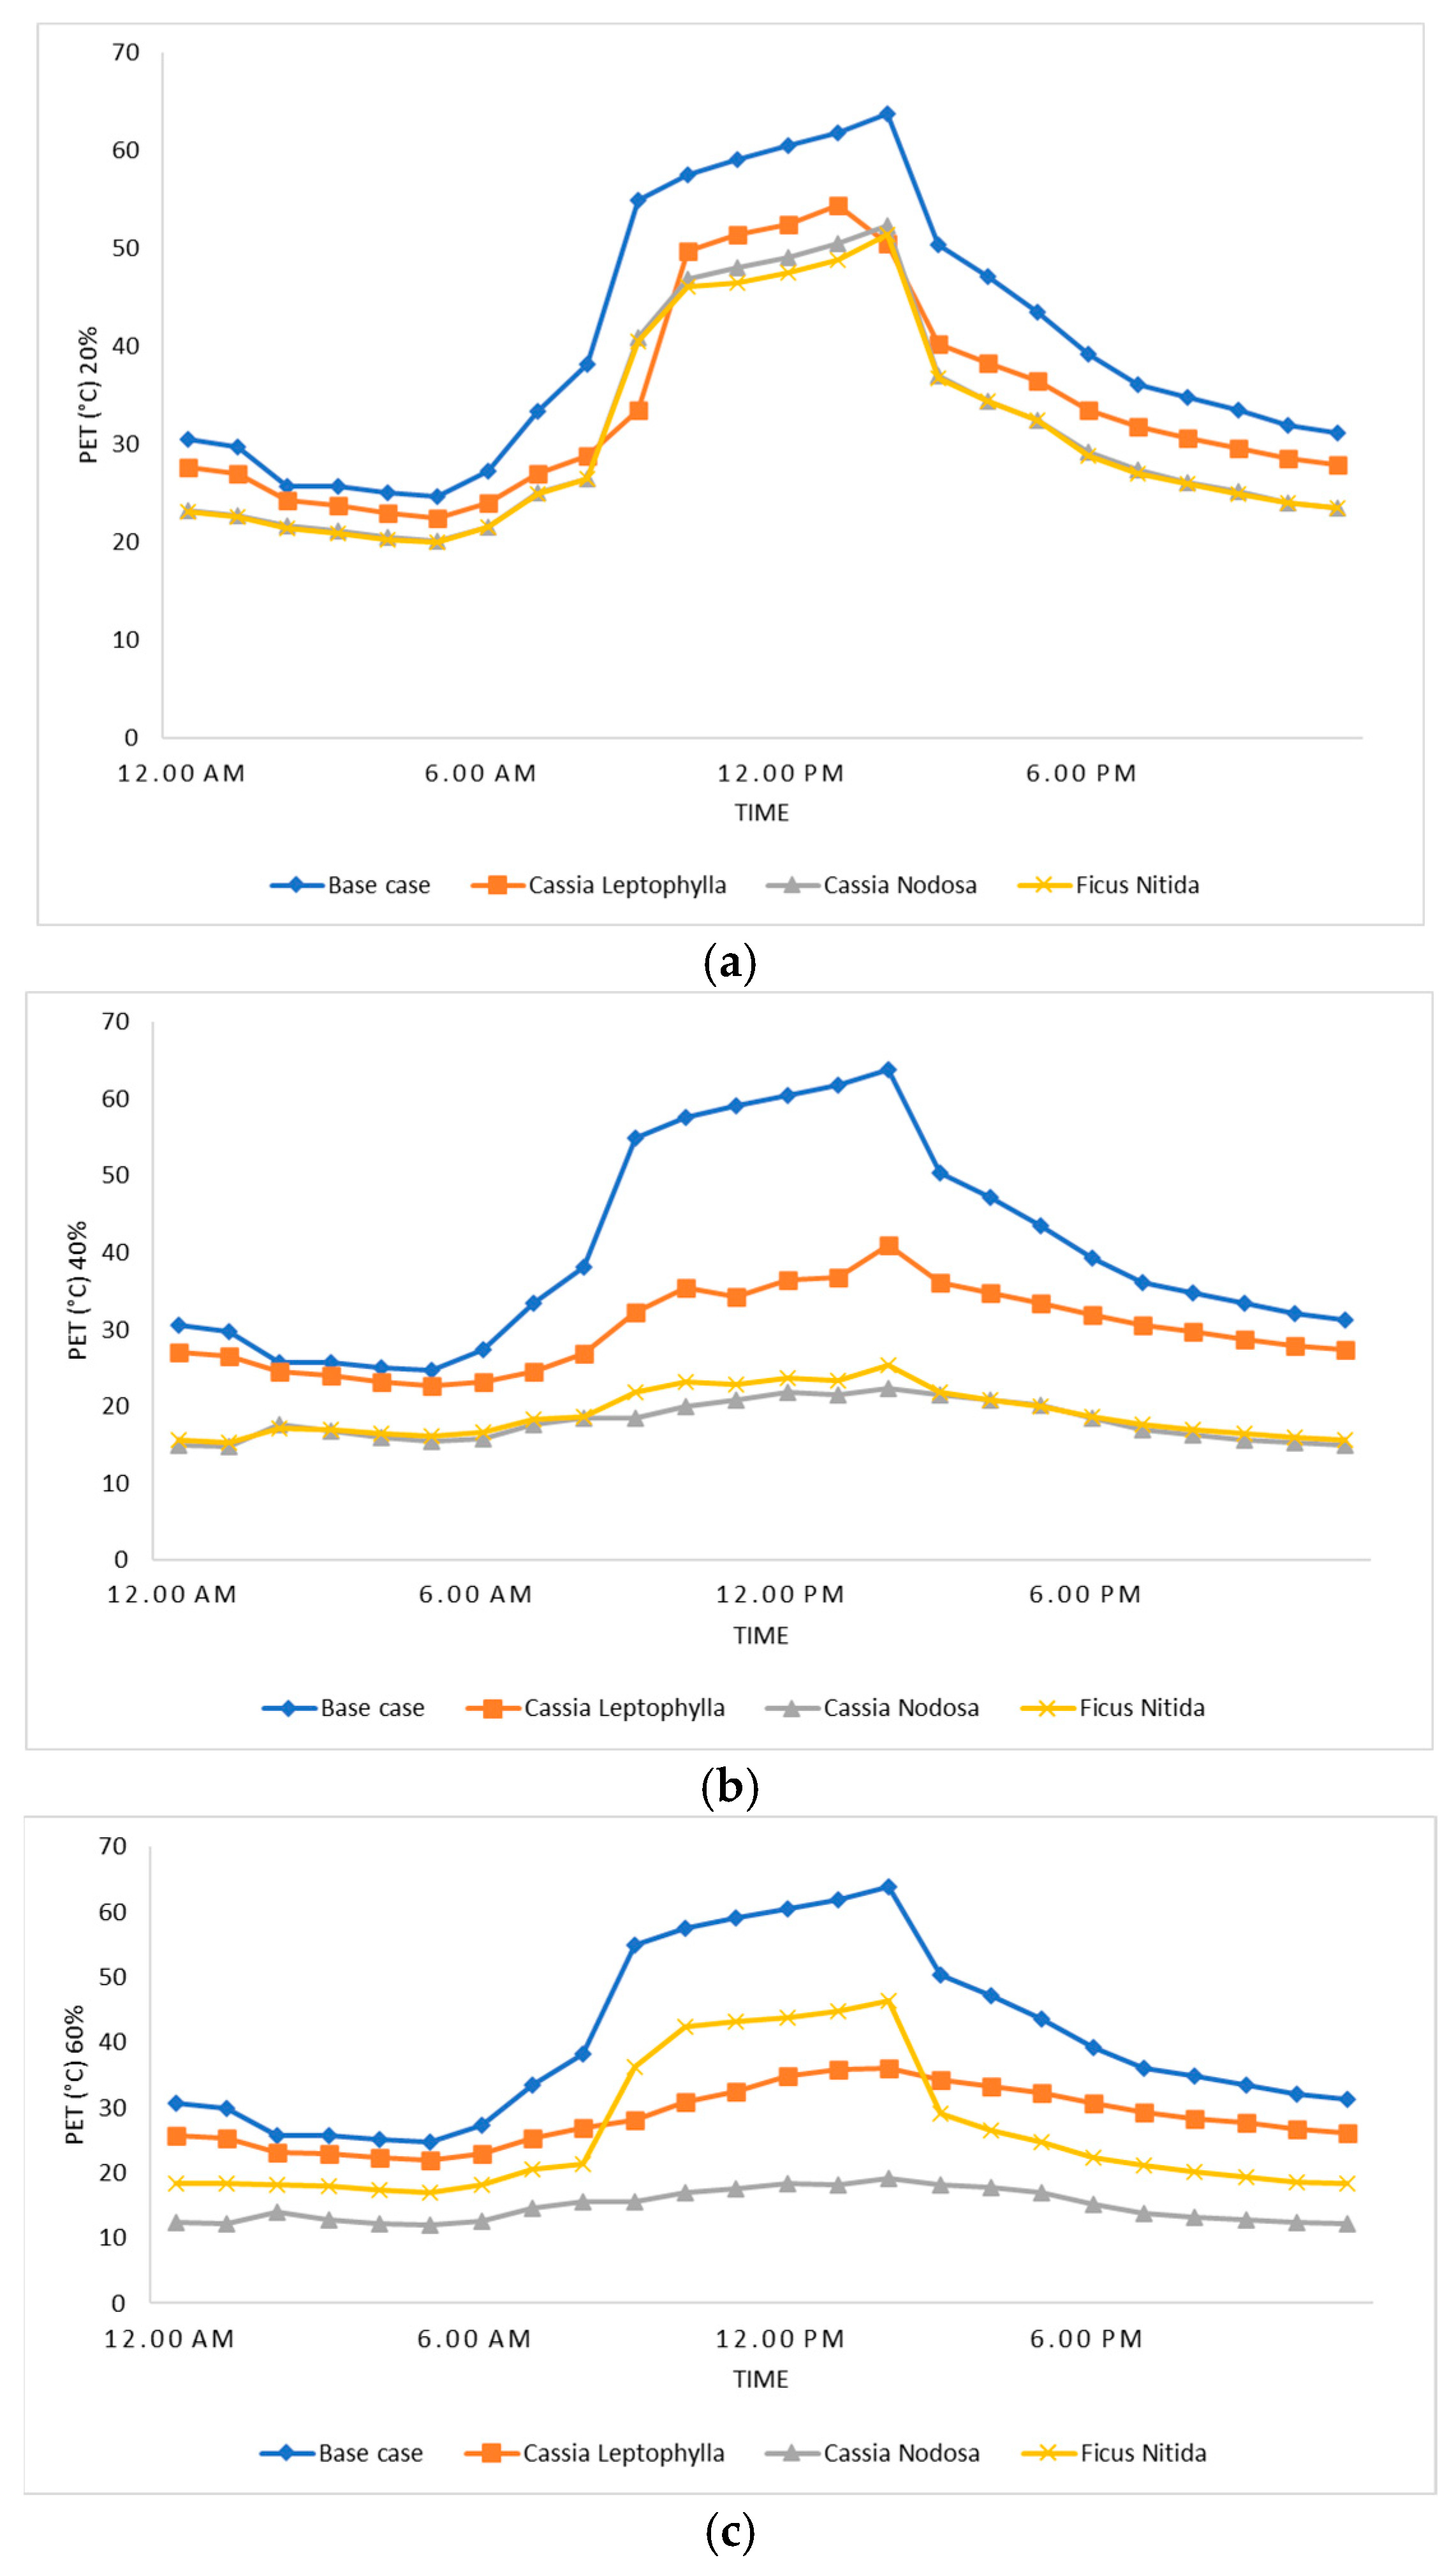
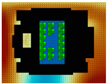
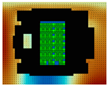
The findings provide evidence supporting the effectiveness of urban tree planting as a means to mitigate heat stress and enhance the thermal comfort of individuals. Figure 8a presents the results of the physiological equivalent temperature (PET) when 20% tree coverage is implemented, comparing these outcomes with the base case. In the base case, PET values range from 24.7 °C to 63.8 °C, with an average PET value of 40.3 °C, indicating significant heat stress, particularly during midday. Consequently, the absence of trees in the courtyard results in pronounced heat stress, primarily during midday hours.
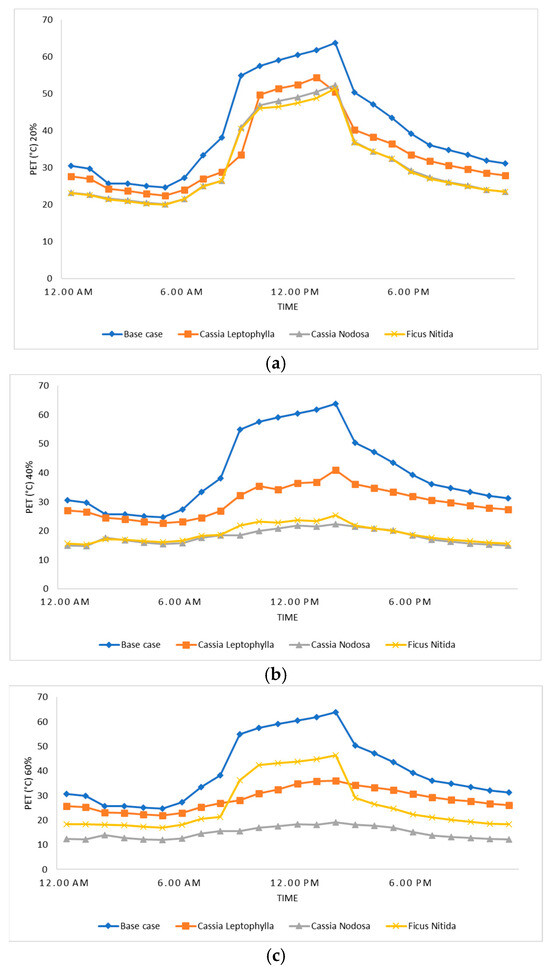
Figure 8.
Results of PET for tree coverage of (a) 20%; (b) 40%; (c) 60%.
The PET values for all tree species exhibit diurnal variation, with the lowest values observed in the early morning (5:00 AM) and the highest values recorded in the midday (2:00 PM) hours, reflecting the influence of solar radiation and other environmental factors. Over time, the PET values for all tree species decrease, presumably due to the significant effect of the investigated trees on reducing the heat stress in the courtyard. Notably, the PET values for Cassia Nodosa and Ficus Nitida exhibit a slower decline rate than Cassia Leptophylla, implying potential durability advantages for these two tree species in PET-based applications. Importantly, the PET values for all tree species remain lower than those of the base case, indicating the effective reduction in heat stress in the courtyard by all three tree species.
Cassia Leptophylla demonstrates PET values ranging from 22.5 °C to 54.5 °C, with an average PET value of 34.1 °C. This corresponds to an average PET reduction of approximately 6.1 °C compared to the base case, substantiating the efficacy of Cassia Leptophylla in mitigating heat stress in the courtyard. Cassia Nodosa displays PET values ranging from 20.1 °C to 52.4 °C, with an average PET value of 31.3 °C, resulting in an average PET reduction of over 9 °C compared to the base case. Thus, Cassia Nodosa emerges as one of the most effective tree species for reducing heat stress in the courtyard. Similarly, Ficus Nitida exhibits PET values ranging from 20 °C to 51.5 °C, with an average PET value of 30.9 °C, indicating an average PET reduction of over 9.4 °C compared to the base case. Consequently, Ficus Nitida also demonstrates high effectiveness in reducing heat stress in the courtyard.
Figure 8b presents the results of the PET in the courtyard when 40% tree coverage is employed, compared to the base case. Cassia Leptophylla exhibits PET values ranging from 22.6 °C to 40.9 °C, with an average PET value of 30 °C, representing an average PET reduction of approximately 10.3 °C compared to the base case. This suggests that Cassia Leptophylla effectively mitigates heat stress in the courtyard. Cassia Nodosa demonstrates PET values ranging from 14.7 °C to 22.4 °C, with an average PET value of 18 °C, resulting in an average PET reduction of over 24.2 °C compared to the base case. Thus, Cassia Nodosa emerges as the most efficient tree species in reducing heat stress. Similarly, Ficus Nitida displays PET values ranging from 15.3 °C to 25.3 °C, with an average PET value of 19 °C, indicating an average PET reduction of over 23.3 °C compared to the base case. Therefore, Ficus Nitida also proves to be highly effective in mitigating heat stress in the courtyard.
Figure 8c depicts the PET results when 60% tree coverage is implemented, compared to the base case. Cassia Leptophylla exhibits PET values ranging from 22 °C to 36 °C, with an average PET value of 28.5 °C, resulting in an average PET reduction of nearly 11.8 °C compared to the base case. This further confirms the high effectiveness of Cassia Leptophylla in reducing heat stress in the courtyard. Cassia Nodosa demonstrates PET values ranging from 12 °C to 19.1 °C, with an average PET value of 14.8 °C, representing an average PET reduction of over 25.4 °C compared to the base case. Consequently, Cassia Nodosa maintains its status as the most efficient tree species for mitigating heat stress. Similarly, Ficus Nitida displays PET values ranging from 17 °C to 46.4 °C, with an average PET value of 26 °C, indicating an average PET reduction of over 14.2 °C compared to the base case. Thus, Ficus Nitida also proves to be highly effective at reducing heat stress in the courtyard. All three tree species (Cassia Leptophylla, Cassia Nodosa, and Ficus Nitida) were effective at reducing heat stress in the courtyard. However, Cassia Nodosa was the most effective, followed by Ficus Nitida and then Cassia Leptophylla.
3.1.3. Analysis of Mean Radiant Temperature
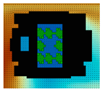
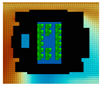
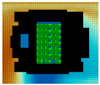
In Figure 9a, the Mean Radiant Temperature (Tmrt) outcomes are presented for the implementation of 20% of various tree species, comparing these results to the base case. The base case experiences a wide range of Tmrt values, from 18.7 °C to 74.2 °C, with an average Tmrt value of 40.9 °C. These findings indicate that the absence of trees in the courtyard leads to significant radiant heat stress, particularly during midday hours.
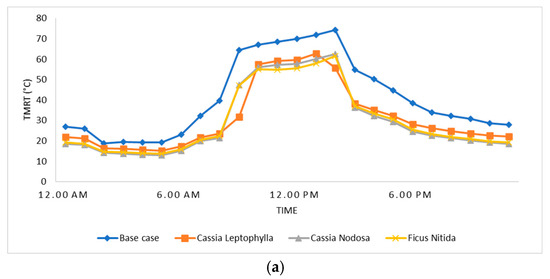
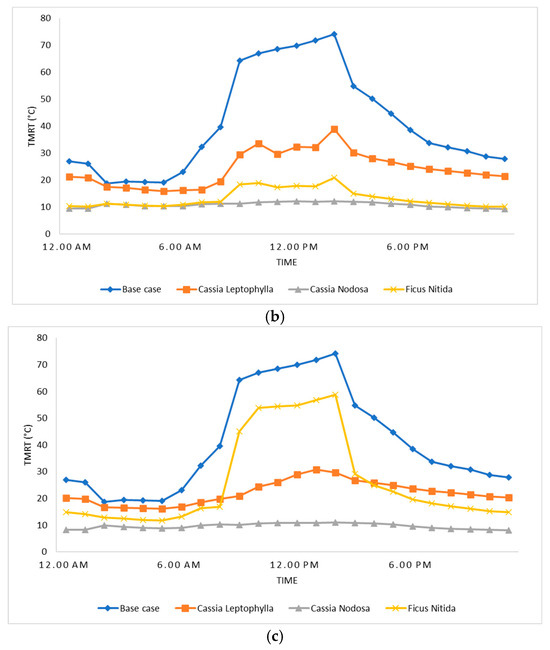
Figure 9.
Results of Tmrt for tree coverage of (a) 20%; (b) 40%; (c) 60%.
Cassia Leptophylla, when implemented at 20% coverage, demonstrates Tmrt values ranging from 15.2 °C to 62.7 °C, with an average Tmrt value of 31.1 °C. This results in an average Tmrt reduction of approximately 9.7 °C compared to the base case, indicating a moderate reduction in radiant heat stress by Cassia Leptophylla in the courtyard. Cassia Nodosa, at the same coverage, exhibits Tmrt values ranging from 13 °C to 62.4 °C, with an average Tmrt value of 29.7 °C. This represents an average Tmrt reduction of over 11.2 °C compared to the base case. Similarly, Ficus Nitida, also implemented at 20% coverage, displays Tmrt values ranging from 13.6 °C to 61.5 °C, with an average Tmrt value of 29.8 °C. This indicates an average Tmrt reduction of over 11 °C compared to the base case.
In Figure 9b, the Tmrt results are presented for the implementation of 40% of different tree species, comparing these outcomes with the base case. For Cassia Leptophylla at 40% coverage, Tmrt values range from 15.9 °C to 39 °C, with an average Tmrt value of 24.2 °C. This represents an average Tmrt reduction of nearly 16.7 °C compared to the base case. Cassia Nodosa, at the same coverage, exhibits Tmrt values ranging from 9.3 °C to 12.1 °C, with an average Tmrt value of 10.8 °C. Consequently, Cassia Nodosa demonstrates an average Tmrt reduction of over 30.1 °C compared to the base case. Similarly, Ficus Nitida, implemented at 40% coverage, displays Tmrt values ranging from 10.1 °C to 20.9 °C, with an average Tmrt value of 13.2 °C. This signifies an average Tmrt reduction of over 27.7 °C compared to the base case.
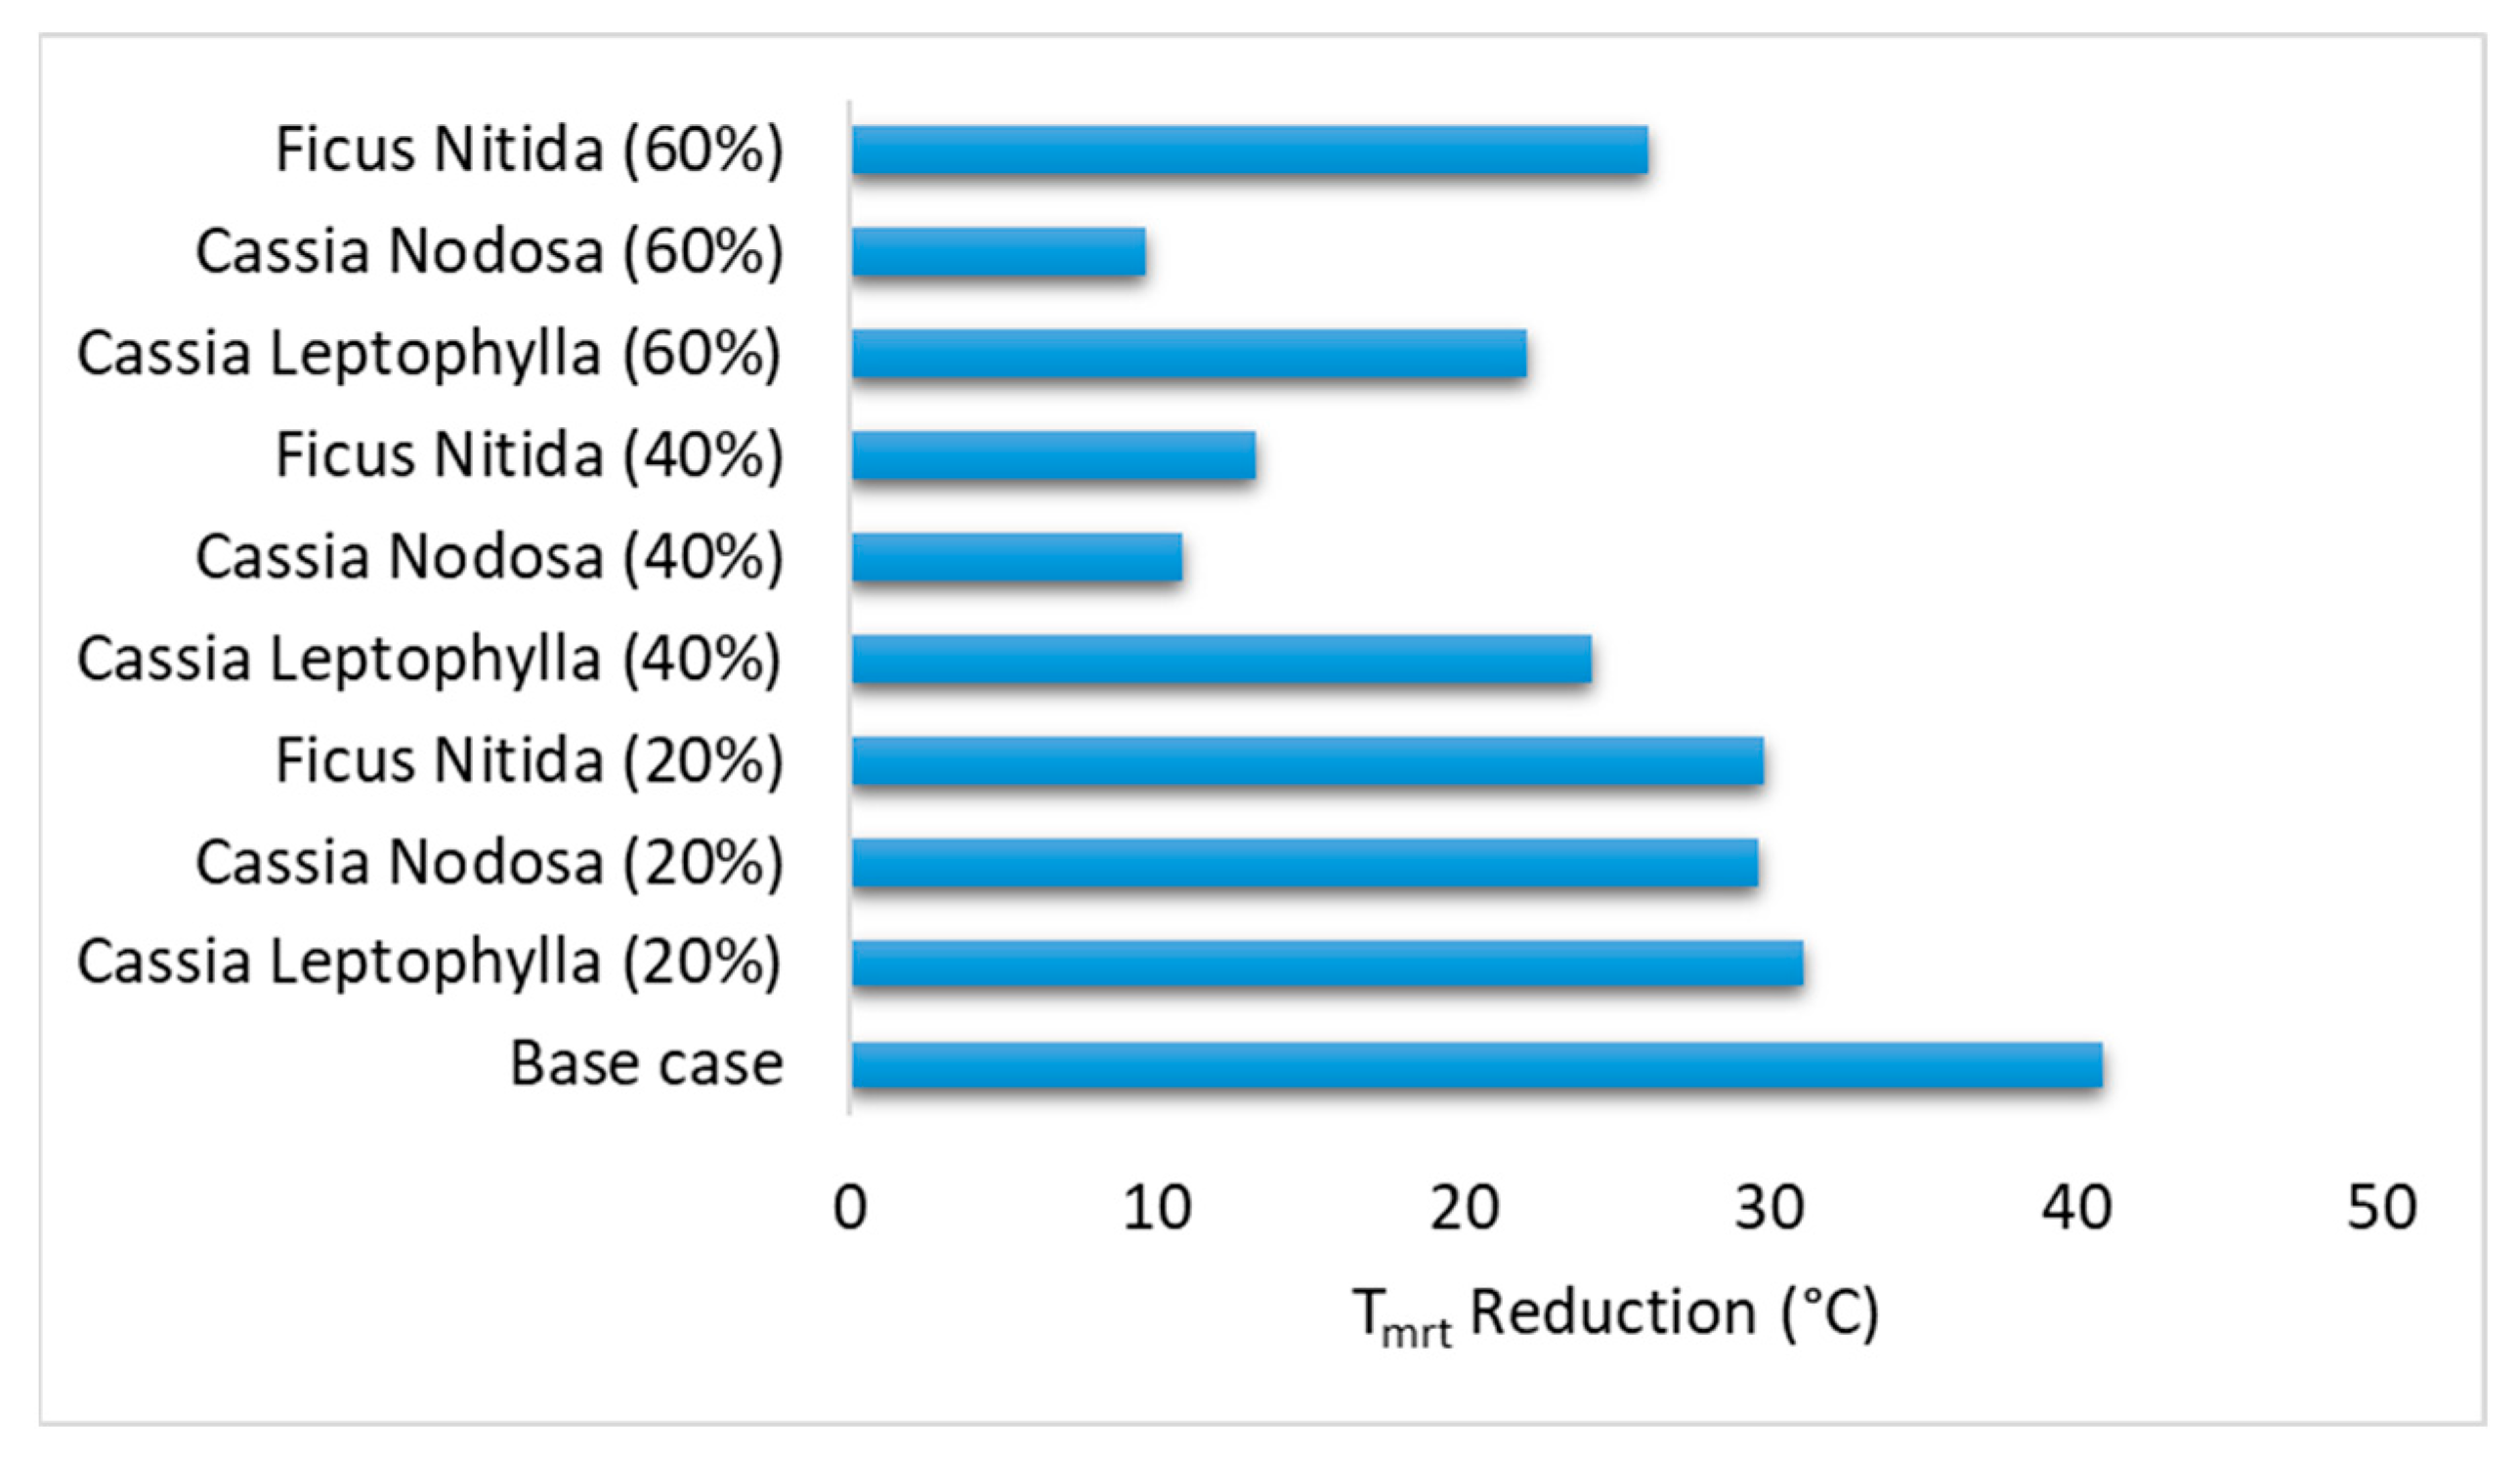
Figure 9c presents the Tmrt results when 60% of different tree species are implemented, comparing these outcomes with the base case. For Cassia Leptophylla at 60% coverage, Tmrt values range from 16.2 °C to 30.7 °C, with an average Tmrt value of 22.1 °C. This represents an average Tmrt reduction of over 18.8 °C compared to the base case, indicating that Cassia Leptophylla can significantly reduce radiant heat stress in the courtyard. Cassia Nodosa, at the same coverage, demonstrates Tmrt values ranging from 8.1 °C to 11 °C, with an average Tmrt value of 9.6 °C. Hence, Cassia Nodosa exhibits an average Tmrt reduction of over 31.3 °C compared to the base case, establishing it as the most effective tree species in reducing radiant heat stress in the courtyard. Ficus Nitida, implemented at 60% coverage, exhibits Tmrt values ranging from 11.8 °C to 58.8 °C, with an average Tmrt value of 26.1 °C. This indicates an average Tmrt reduction of over 14.8 °C compared to the base case, as shown in Figure 10, underscoring the effectiveness of Ficus Nitida in reducing radiant heat stress in the courtyard.

Figure 10.
The average of the minimum and the maximum of Tmrt reduction.
3.2. The Influence of Courtyard Tree Cover on the Indoor Thermal Comfort
This study investigated the influence of varying tree cover percentages on thermal comfort within a western-facing room located on the first floor of a building, specifically in the absence of air conditioning. According to established standards such as ASHRAE 55 [26] and ISO 7730 [73], the current study employed the operative temperature to assess thermal comfort. It incorporates several variables such as air temperature, clothing insulation, humidity, and metabolic rate. Clothing insulation values were set at 0.50 clo for summer and 0.66 clo for winter [74]. However, the methodology used for occupant placement, determined by the functional use of each space and furniture arrangement, may introduce variability in the calculations of mean radiant temperature. Despite this limitation, the application of the Zone Average Method (ZA) allows for a sufficiently accurate approximation of thermal conditions, thereby supporting the study’s overall objectives in evaluating the impact of tree cover on occupant comfort. Figure 11 presents the operative temperatures for different tree cover scenarios, revealing marked differences in thermal comfort levels. At a tree cover of 20%, the operative temperatures during peak hours, particularly at noon, reached as high as 31.61 °C. This indicates a significant discomfort for occupants, consistent with prior research indicating that spaces with limited shading are more vulnerable to elevated temperatures due to increased solar exposure. The discomfort is exacerbated in western-facing rooms, which receive intense sunlight during the afternoon [75,76,77].
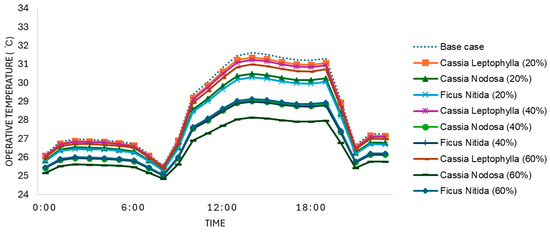
Figure 11.
The effect of the vegetation scenarios in the courtyard on indoor thermal comfort.
With an increase to 40% tree cover, there was a notable enhancement in thermal comfort. The highest operative temperature recorded during midday dropped to 30.49 °C, illustrating the positive impact of greater tree cover in reducing heat. The shade provided by the trees is instrumental in lowering indoor temperatures, thereby improving occupant comfort. The appropriate thermal comfort conditions were achieved at 60% tree cover, where operative temperatures peaked at 30.27 °C. This scenario facilitated a level of thermal satisfaction among occupants, suggesting that at this tree cover level, the room remained warm but still within an acceptable comfort range. This finding underscores the importance of strategic tree cover in improving indoor environmental conditions.
Additionally, an examination of different tree species indicated that Ficus Nitida consistently outperformed the others in terms of thermal comfort. In the 60% cover scenario, it yielded the lowest operative temperatures, highlighting its suitability for urban settings where maintaining thermal comfort is essential. While Cassia Nodosa and Cassia Leptophylla also contributed to improved thermal conditions, their effectiveness was not on par with that of Ficus Nitida. Generally, the findings demonstrate that increasing tree cover significantly enhances thermal comfort and has the potential to lower energy consumption for cooling. The thoughtful placement of suitable tree species is critical in urban planning and architectural design, especially for buildings subjected to high levels of solar radiation.
3.3. Energy Performance Associated with the Investigated Vegetation Scenarios
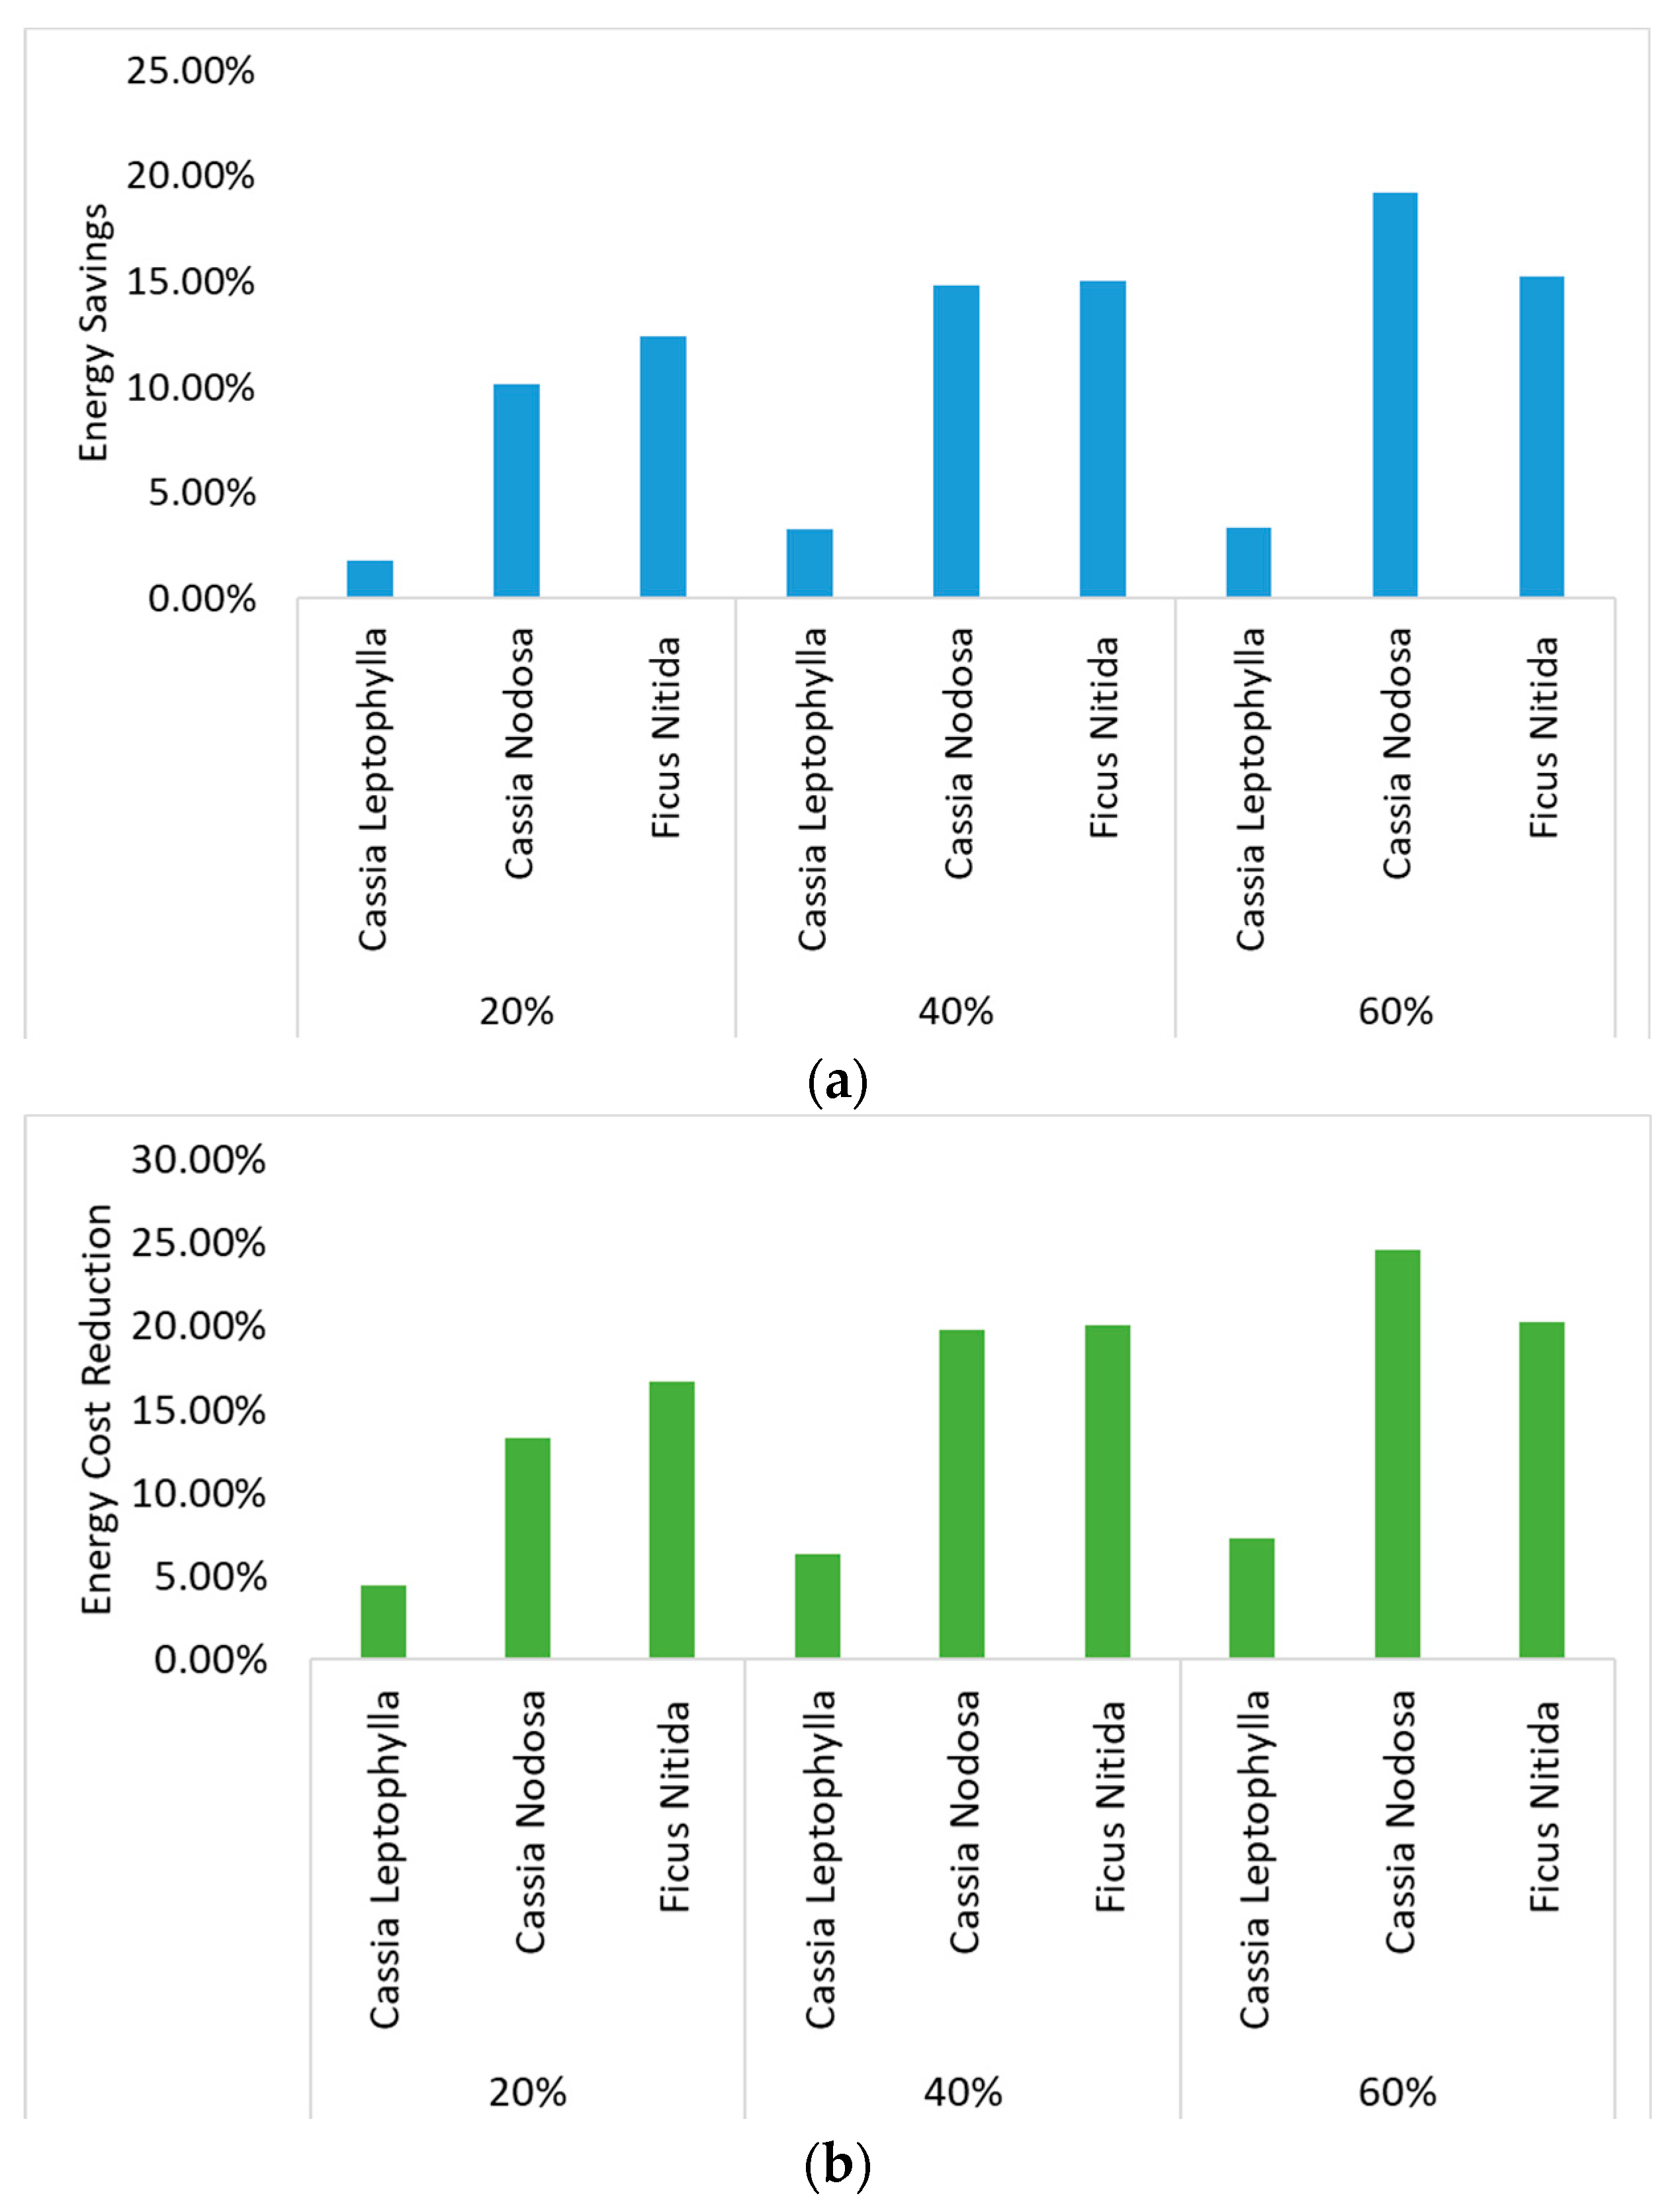
To assess the potential energy savings in terms of indoor domestic energy consumption, the scope of the study was expanded. The investigation focused on various vegetation scenarios and their impact on energy consumption, specifically electricity, and associated costs during the simulation month of July in Egypt in 2022, based on the commercial tariff of 2022. Figure 12 presents a comparative analysis that evaluates the energy consumption and cost implications of different vegetation scenarios. These figures provide valuable insights into the potential benefits of vegetation in terms of energy savings.
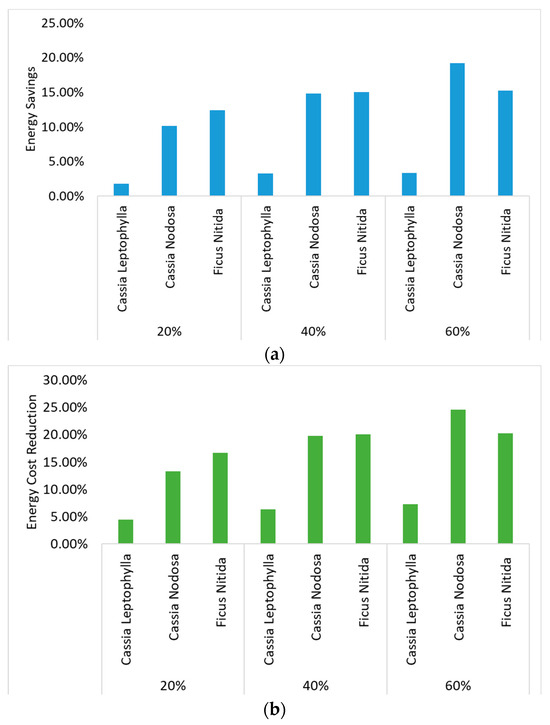
Figure 12.
The effect of the vegetation scenarios in the courtyard on the cooling energy of July: (a) energy savings percentages; (b) energy costs reduction.
For the vegetation scenario with a tree coverage of 20%, the results indicate significant energy savings. Specifically, the Cassia Leptophylla species achieved energy savings of 1.8%, Cassia Nodosa achieved 10.1% energy savings, and Ficus Nitida achieved 12.4% energy savings. These energy savings translate to cost reductions of 4.5%, 13.3%, and 16.7%, respectively, compared to the base case. When the tree coverage increases to 40%, the analysis reveals even higher energy savings. The Cassia Leptophylla species achieves energy savings of 3.3%, followed by 14.8% for Cassia Nodosa, and 15% for Ficus Nitida. These energy savings correspond to cost savings of 6.3%, 19.8%, and 20.1%, respectively, compared to the base case. Furthermore, as the tree coverage further increases to 60%, the results demonstrate additional energy savings. The Cassia Leptophylla species achieves energy savings of 3.3%, followed by 19.2% for Cassia Nodosa, and 15.2% for Ficus Nitida. These energy savings correspond to cost reductions of 7.3%, 24.6%, and 20.3%, respectively, compared to the base case.
These findings provide valuable insights into the potential energy savings and cost reductions that can be achieved through vegetation measures. They highlight the importance of considering tree coverage as a contributing factor in energy efficiency strategies for educational buildings, particularly in the context of the investigated scenarios.
4. Discussion
Vegetation strategies play a crucial role in cooling microclimates by providing shade, reducing solar radiation exposure, and maintaining lower ambient temperatures. Trees, in particular, contribute to cooling through processes such as transpiration and evaporation. In this study, simulation results demonstrate that high vegetation coverage within courtyards significantly cools the microclimate compared to a baseline scenario without trees. These findings are consistent with previous research, which suggests that increasing vegetation coverage by over 50% can notably improve outdoor thermal conditions [54,78,79].
Among the tree species evaluated, Cassia Nodosa and Ficus Nitida exhibit the most pronounced cooling effects, with average air temperature reductions exceeding 12 °C relative to the treeless baseline. These results align with earlier studies that identified these species as particularly effective in hot summer climates [80,81,82]. Specifically, introducing 20% coverage of Cassia Nodosa and Ficus Nitida in the courtyard leads to significant temperature reductions. Further increasing tree coverage to 40% amplifies the cooling effect, achieving temperature reductions of up to 13 K with Cassia Nodosa. The maximum cooling effect is observed with 60% tree coverage, where Cassia Nodosa reduces temperatures by more than 17.3 K.
Cassia Nodosa outperforms other species in cooling effectiveness due to its broad canopy, which provides extensive shading, and its high transpiration rate, which enhances evaporative cooling. This tree’s expansive leaf structure effectively blocks incoming solar radiation, further contributing to its superior cooling performance [79,80,81]. Ficus Nitida also demonstrates considerable cooling capacity, reducing temperatures by 12.3 K, though its more vertical growth habit and narrower canopy allow for greater light penetration, slightly diminishing its cooling potential compared to Cassia Nodosa. Conversely, Cassia Leptophylla shows a more modest cooling effect, with average temperature reductions of 3.1 K, largely due to its sparser foliage, which permits more solar radiation to pass through.
The significant microclimate improvement achieved with 60% coverage of Cassia Nodosa is reflected in a substantial reduction in the PET index by more than 25 °C, indicating the tree’s effectiveness in mitigating heat stress. These findings underscore the efficacy of targeted tree-planting strategies in alleviating heat stress and improving thermal comfort in urban environments. Notably, Cassia Nodosa emerges as the most effective species, achieving a remarkable 45.7% improvement in courtyard air temperature with 60% tree coverage. Ficus Nitida and Cassia Leptophylla also present viable options for significant microclimate cooling.
In the final phase of the study, a linear decrease in HVAC electricity demand was observed as vegetation coverage increased from 20% to 40% and 60%, respectively. This reduction in energy consumption and associated costs is directly linked to the improved microclimate conditions within the courtyard. The passive cooling effects of transpiration and shading provided by the urban trees, combined with higher overall vegetation coverage, resulted in substantial temperature decreases and enhanced outdoor thermal comfort [83,84,85,86]. Previous research has consistently shown that integrating microclimate mitigation strategies into building design and surrounding outdoor spaces can lead to significant reductions in cooling demands, both in the present and under future climate change scenarios [21,87,88].
These results highlight the importance of incorporating specific tree species and vegetation strategies in the design of university courtyards, particularly in hot, arid climates. Such strategies not only reduce air temperatures and enhance thermal comfort to create more comfortable outdoor spaces for students, but they also lower overall energy costs. This reduction in energy consumption helps decrease the need for ongoing financial support to maintain indoor comfort levels [79,89]. The findings reinforce the value of vegetation as a critical component of sustainable urban design.
While the environmental benefits of planting Cassia Nodosa, Cassia Leptophylla, and Ficus Nitida in hot and arid regions, such as improved microclimate and thermal comfort, are well-documented, it is important to acknowledge the potential limitations. Increased evapotranspiration rates due to climate change may lead to greater salinization of shallow groundwater, thereby heightening the need for water resources to sustain tree growth. This increased water demand can have economic implications, as securing adequate water resources in these regions may require substantial investments in infrastructure and water management systems. To address these challenges, careful selection of drought-tolerant species, such as Cassia Leptophylla, which is better adapted to arid conditions, over more water-dependent species like Ficus Nitida, is crucial. Additionally, developing effective water management strategies, including optimizing irrigation techniques and promoting water conservation practices, is essential to ensure the long-term sustainability of tree planting initiatives.
5. Future Perspectives
The findings of this study highlight the potential of vegetation to significantly enhance thermal comfort and reduce energy consumption in semi-enclosed spaces within hot, arid regions. While this research focused on a specific case study at the Faculty of Arts at New Aswan University, the results suggest broader implications for the design of similar environments in other newly developed desert cities.
Future research could explore the scalability of these strategies in different architectural contexts, such as residential or commercial buildings, and assess the long-term sustainability of various plant species under extreme climatic conditions. Additionally, integrating advanced technologies such as smart irrigation systems and real-time environmental monitoring could optimize the effectiveness of vegetation in maintaining thermal comfort. Further studies could also investigate the socio-economic impacts of such interventions, including potential cost savings from reduced energy consumption and the overall improvement in occupants’ well-being. By expanding the scope of this research, we can develop more comprehensive guidelines for the use of vegetation as a key element in urban design, particularly in regions facing similar environmental challenges.
6. Conclusions
This simulation-based study, combined with experimental measurements, provides compelling evidence demonstrating the effectiveness of vegetation in mitigating temperature and heat stress in vulnerable urban courtyard microclimates. The introduction of tree coverage at higher densities resulted in substantial cooling effects, with temperature reductions exceeding 12 °C for Cassia Nodosa and Ficus Nitida. These tree species also exhibited a moderate increase in relative humidity levels. Detailed temperature mapping over daily cycles revealed that vegetation can maintain more favorable conditions, even during extreme summer weather. The quantification of PET further confirmed the significant potential for heat reduction, with reductions of up to 25 °C observed under Cassia varieties. Moreover, at 60% tree coverage, Cassia Nodosa demonstrated superior performance in minimizing radiant heat exposure, as indicated by the Tmrt. Furthermore, the implementation of vegetation strategies resulted in substantial energy savings and associated cost reductions exceeding 20% in educational buildings compared to the base case without trees. The efficacy of the proposed vegetation-based strategies relies heavily on the growth characteristics of the tree species involved. According to the literature, the time required for the investigated tree species to reach their full mature size can range from as little as 8 years to up to 25 years.
These findings highlight the critical role of tree coverage as a crucial factor in energy efficiency strategies for educational buildings. While long-term monitoring across seasons is necessary to validate the reduction in heat stress, this study provides a robust foundation and framework for sustainable design strategies aimed at enhancing urban heat resilience. However, one limitation of this study is the lack of direct validation for mean radiant temperature (MRT), which, if included, would provide a more comprehensive understanding of the thermal environment. Future research endeavors can leverage these findings to explore different courtyard geometries, orientations, and vegetation strategies, utilizing advanced simulations to identify optimal passive cooling solutions for community spaces vulnerable to extreme heat. Ultimately, validated microclimate models can be scaled up to inform district- or city-level master planning, contributing to the protection of human health and well-being in the face of climate change.
Author Contributions
Conceptualization, A.F.M. and A.R.; methodology, E.O.; software, A.R. and E.O.; validation, A.F.M., M.M.G. and A.R.; formal analysis, A.R.; investigation, E.O. and A.R.; resources, M.M.G.; data curation, E.O.; writing—original draft preparation, E.O., M.M.G. and A.R.; writing—review and editing M.M.G.; visualization, E.O. and A.R.; project administration, M.M.G.; funding acquisition, M.M.G. All authors have read and agreed to the published version of the manuscript.
Funding
This research was funded by the Vice President for Graduate Studies, Research and Business (GRB) at Dar Al-Hekma University, Jeddah. The authors, therefore, acknowledge with thanks GRB for technical and financial support.
Data Availability Statement
Data are contained within the article.
Conflicts of Interest
The authors declare no conflicts of interest.
References
- Saito, I.; Ishihara, O.; Katayama, T. Study of the effect of green areas on the thermal environment in an urban area. Energy Build. 1990, 15, 493–498. [Google Scholar] [CrossRef]
- Grimm, N.B.; Faeth, S.H.; Golubiewski, N.E.; Redman, C.L.; Wu, J.; Bai, X.; Briggs, J.M. Global change and the ecology of cities. science 2008, 319, 756–760. [Google Scholar] [CrossRef] [PubMed]
- Shahidan, M.F.; Jones, P.J.; Gwilliam, J.; Salleh, E. An evaluation of outdoor and building environment cooling achieved through combination modification of trees with ground materials. Build. Environ. 2012, 58, 245–257. [Google Scholar] [CrossRef]
- Brysse, K.; Oreskes, N.; O’reilly, J.; Oppenheimer, M. Climate change prediction: Erring on the side of least drama? Glob. Environ. Chang. 2013, 23, 327–337. [Google Scholar] [CrossRef]
- Kjelistrom, T.; Holmer, I.; Lemke, B. Heat, work and health: Implications of climate change. Glob. Health Action 2009, 2, 2047. [Google Scholar]
- Oleson, K.W.; Monaghan, A.; Wilhelmi, O.; Barlage, M.; Brunsell, N.; Feddema, J.; Hu, L.; Steinhoff, D. Interactions between urbanization, heat stress, and climate change. Clim. Chang. 2015, 129, 525–541. [Google Scholar] [CrossRef]
- Zittis, G.; Hadjinicolaou, P.; Fnais, M.; Lelieveld, J. Projected changes in heat wave characteristics in the eastern Mediterranean and the Middle East. Reg. Environ. Chang. 2016, 16, 1863–1876. [Google Scholar] [CrossRef]
- Solomon, S.; Qin, D.; Manning, M.; Averyt, K.; Marquis, M. Climate Change 2007-the Physical Science Basis: Working Group I Contribution to the Fourth Assessment Report of the IPCC; Cambridge University Press: Cambridge, UK, 2007; Volume 4. [Google Scholar]
- Abulfotuh, F. Energy efficiency and renewable technologies: The way to sustainable energy future. Desalination 2007, 209, 275–282. [Google Scholar] [CrossRef]
- Taleb, H.M.; Sharples, S. Developing sustainable residential buildings in Saudi Arabia: A case study. Appl. Energy 2011, 88, 383–391. [Google Scholar] [CrossRef]
- Heating, A.S.o.; Engineers, A.-C.; Institute, A.N.S. Thermal Environmental Conditions for Human Occupancy; American Society of Heating, Refrigerating and Air-Conditioning Engineers: Atlanta, GA, USA, 2004; Volume 55. [Google Scholar]
- Abd Elrady, A.; Hassan, M. Conservation of morphological characters as an approach to thermal comfort. Signals Syst. A Primer MATLAB 2015, 15, 5729. [Google Scholar]
- Newburgh, L.H. Physiology of heat regulation and the science of clothing. Acad. Med. 1949, 25, 158. [Google Scholar]
- Bruse, M. Assessing urban microclimate from the user’s perspective-Multi-agent systems as a new tool in urban biometeorology. Ann. Meteorol. 2005, 41, 137–140. [Google Scholar]
- Hayatu, I.; Mukhtar, I.; Mu’az, N.; Enaburekhan, J. An assessment of thermal comfort in hot and dry season (a case study of 4 theaters at Bayero University Kano). Int. J. Multidiscip. Curr. Res. 2015, 3, 1117–1121. [Google Scholar]
- Haddad, S.; King, S.; Osmond, P. Enhancing thermal comfort in school buildings. In Proceedings of the 10th International Healthy Building Conference, Brisbane, Australia, 8–12 July 2012; pp. 8–12. [Google Scholar]
- Mohamed, A.F.; Amir, A.A.; Ragab, A. The effect of aerogel glazing on daylight and heat gain in school buildings in hot and dry climate. In Environment, Development and Sustainability; Springer: Berlin/Heidelberg, Germany, 2024; pp. 1–22. [Google Scholar]
- Dewidar, K.M.; Mahmoud, A.H. Moussa, “Enhancing the human thermal comfort in-side educational buildings in hot arid regions”. In Proceedings of the International Conference of Global Climate Change, Biodiversity and Sustainability, Challenges and Opportunities, Alexandria, Egypt, 15–19 April 2013. [Google Scholar]
- Abdallah, A.S.H. The influence of urban geometry on thermal comfort and energy consumption in residential building of hot arid climate, Assiut, Egypt. Procedia Eng. 2015, 121, 158–166. [Google Scholar] [CrossRef]
- Attaianese, E.; d’Ambrosio Alfano, F.R.; Palella, B.I.; Pepe, D.; Vanacore, R. An Integrated Methodology of Subjective Investigation for a Sustainable Indoor Built Environment. The Case Study of a University Campus in Italy. Atmosphere 2021, 12, 1272. [Google Scholar] [CrossRef]
- Mahmoud, H.; Ragab, A. Urban geometry optimization to mitigate climate change: Towards energy-efficient buildings. Sustainability 2020, 13, 27. [Google Scholar] [CrossRef]
- Zahiri, S.; Sharples, S.; Altan, H. Developing Sustainable School Design in Iran, a Thermal Comfort Survey of a Secondary School in Tehran, School of Architecture; University of Sheffield: Sheffield, UK, 2014. [Google Scholar]
- Shaari, N.A.; Zaki, S.A.; Mat Ali, M.S.; Abd Razak, A. Investigation of the PMV and TSV Models of Thermal Comfort in Air-Conditioned University Classrooms in Malaysia. Appl. Mech. Mater. 2016, 819, 207–211. [Google Scholar] [CrossRef]
- Woods, P.; Hyde, R. Climate Responsive Design: A Study of Buildings in Moderate and Hot Humid Climates; Taylor & Francis: Abingdon, UK, 2013. [Google Scholar]
- Yau, Y.H.; Chew, B.T.; Saifullah, A. Thermal comfort in lecture halls in the tropics. In Proceedings of the International Symposium on Heating, Ventilating and Air Conditioning 2011, Shanghai, China, 6–9 November 2011. [Google Scholar]
- ANSI/ASHRAE Standard. Thermal Environmental Conditions for Human Occupancy; ANSI/ASHRAE, 55; ASHRAE: Peachtree Corners, GA, USA, 2023; Volume 5. [Google Scholar]
- Farghal, A.; Wagner, A. Studying the adaptive comfort approach within a hot dry climate: A case study in educational buildings in the Egyptian climate. In Proceedings of the Conference Air Conditioning and the Low Carbon Cooling Challenge, Windsor, UK, 27–29 July 2008. [Google Scholar]
- Muhaisen, A.S. Shading simulation of the courtyard form in different climatic regions. Build. Environ. 2006, 41, 1731–1741. [Google Scholar] [CrossRef]
- Nasrollahi, N.; Hatami, M.; Khastar, S.R.; Taleghani, M. Numerical evaluation of thermal comfort in traditional courtyards to develop new microclimate design in a hot and dry climate. Sustain. Cities Soc. 2017, 35, 449–467. [Google Scholar] [CrossRef]
- Ragab, A. The Effects of Courtyard Envelope on the Energy Required for Cooling in the Hot Desert Climate. SVU-Int. J. Eng. Sci. Appl. 2023, 4, 155–164. [Google Scholar] [CrossRef]
- Zhu, J.; Feng, J.; Lu, J.; Chen, Y.; Li, W.; Lian, P.; Zhao, X. A review of the influence of courtyard geometry and orientation on microclimate. Build. Environ. 2023, 236, 110269. [Google Scholar] [CrossRef]
- Aldawoud, A. Thermal performance of courtyard buildings. Energy Build. 2008, 40, 906–910. [Google Scholar] [CrossRef]
- Mahmoud, H.; Ragab, A. Thermal Performance Evaluation of Unshaded Courtyards in Egyptian Arid Regions. In Smart and Sustainable Planning for Cities and Regions: Results of SSPCR 2019; Springer: Berlin/Heidelberg, Germany, 2021; Volume 3, pp. 109–121. [Google Scholar]
- Al-Masri, N.; Abu-Hijleh, B. Courtyard housing in midrise buildings: An environmental assessment in hot-arid climate. Renew. Sustain. Energy Rev. 2012, 16, 1892–1898. [Google Scholar] [CrossRef]
- Subhashini, S.; Thirumaran, K. CFD simulations for examining natural ventilation in the learning spaces of an educational building with courtyards in Madurai. Build. Serv. Eng. Res. Technol. 2020, 41, 466–479. [Google Scholar] [CrossRef]
- Al-Mumin, A.A. Suitability of sunken courtyards in the desert climate of Kuwait. Energy Build. 2001, 33, 103–111. [Google Scholar] [CrossRef]
- Forouzandeh, A. Numerical modeling validation for the microclimate thermal condition of semi-closed courtyard spaces between buildings. Sustain. Cities Soc. 2018, 36, 327–345. [Google Scholar] [CrossRef]
- Lin, T.-P.; Matzarakis, A.; Hwang, R.-L. Shading effect on long-term outdoor thermal comfort. Build. Environ. 2010, 45, 213–221. [Google Scholar] [CrossRef]
- Manioğlu, G.; Oral, G.K. Effect of courtyard shape factor on heating and cooling energy loads in hot-dry climatic zone. Energy Procedia 2015, 78, 2100–2105. [Google Scholar] [CrossRef]
- Kubota, T.; Zakaria, M.A.; Abe, S.; Toe, D.H.C. Thermal functions of internal courtyards in traditional Chinese shophouses in the hot-humid climate of Malaysia. Build. Environ. 2017, 112, 115–131. [Google Scholar] [CrossRef]
- Martinelli, L.; Matzarakis, A. Influence of height/width proportions on the thermal comfort of courtyard typology for Italian climate zones. Sustain. Cities Soc. 2017, 29, 97–106. [Google Scholar] [CrossRef]
- Soflaei, F.; Shokouhian, M.; Abraveshdar, H.; Alipour, A. The impact of courtyard design variants on shading performance in hot-arid climates of Iran. Energy Build. 2017, 143, 71–83. [Google Scholar] [CrossRef]
- Meir, I.A.; Pearlmutter, D.; Etzion, Y. On the microclimatic behavior of two semi-enclosed attached courtyards in a hot dry region. Build. Environ. 1995, 30, 563–572. [Google Scholar] [CrossRef]
- Taleghani, M.; Tenpierik, M.; van den Dobbelsteen, A. Indoor thermal comfort in urban courtyard block dwellings in the Netherlands. Build. Environ. 2014, 82, 566–579. [Google Scholar] [CrossRef]
- Shashua-Bar, L.; Pearlmutter, D.; Erell, E. The cooling efficiency of urban landscape strategies in a hot dry climate. Landsc. Urban Plan. 2009, 92, 179–186. [Google Scholar] [CrossRef]
- Berkovic, S.; Yezioro, A.; Bitan, A. Study of thermal comfort in courtyards in a hot arid climate. Sol. Energy 2012, 86, 1173–1186. [Google Scholar] [CrossRef]
- Yang, X.; Li, Y.; Yang, L. Predicting and understanding temporal 3D exterior surface temperature distribution in an ideal courtyard. Build. Environ. 2012, 57, 38–48. [Google Scholar] [CrossRef]
- Al-Hafith, O.; Satish, B.; Bradbury, S.; De Wilde, P. The Impact of Courtyard parameters on its shading level An experimental study in Baghdad, Iraq. Energy Procedia 2017, 134, 99–109. [Google Scholar] [CrossRef]
- Taleghani, M.; Sailor, D.J.; Tenpierik, M.; van den Dobbelsteen, A. Thermal assessment of heat mitigation strategies: The case of Portland State University, Oregon, USA. Build. Environ. 2014, 73, 138–150. [Google Scholar] [CrossRef]
- Taleghani, M.; Tenpierik, M.; van den Dobbelsteen, A.; Sailor, D.J. Heat mitigation strategies in winter and summer: Field measurements in temperate climates. Build. Environ. 2014, 81, 309–319. [Google Scholar] [CrossRef]
- Ghaffarianhoseini, A.; Berardi, U.; Ghaffarianhoseini, A. Thermal performance characteristics of unshaded courtyards in hot and humid climates. Build. Environ. 2015, 87, 154–168. [Google Scholar] [CrossRef]
- Wei, J.; Yu, F.; Liang, H.; Luo, M. Thermal Performance of Vertical Courtyard System in Office Buildings Under Typical Hot Days in Hot-Humid Climate Area: A Case Study. Sustainability 2020, 12, 2591. [Google Scholar] [CrossRef]
- Li, Z.; Chow, D.H.; Yao, J.; Zheng, X.; Zhao, W. The effectiveness of adding horizontal greening and vertical greening to courtyard areas of existing buildings in the hot summer cold winter region of China: A case study for Ningbo. Energy Build. 2019, 196, 227–239. [Google Scholar] [CrossRef]
- Gomaa, M.M.; El Menshawy, A.; Nabil, J.; Ragab, A. Investigating the Impact of Various Vegetation Scenarios on Outdoor Thermal Comfort in Low-Density Residential Areas of Hot Arid Regions. Sustainability 2024, 16, 3995. [Google Scholar] [CrossRef]
- Sözen, İ.; Oral, G.K. Outdoor thermal comfort in urban canyon and courtyard in hot arid climate: A parametric study based on the vernacular settlement of Mardin. Sustain. Cities Soc. 2019, 48, 101398. [Google Scholar] [CrossRef]
- Zhao, Y.; Chen, Y.; Li, K. A simulation study on the effects of tree height variations on the façade temperature of enclosed courtyard in North China. Build. Environ. 2022, 207, 108566. [Google Scholar] [CrossRef]
- Darvish, A.; Eghbali, G.; Eghbali, S.R. Tree-configuration and species effects on the indoor and outdoor thermal condition and energy performance of courtyard buildings. Urban Clim. 2021, 37, 100861. [Google Scholar] [CrossRef]
- Zango, M.S.; Ossen, D.R.; Toe, D.H.; Nimlyat, P.S.; Agboola, O.P.; Luke, B.J. The effect of vegetation in enhancing the performance of courtyard in buildings of tropical climate. J. Appl. Sci. Environ. Sustain. 2017, 3, 34–42. [Google Scholar]
- Bruse, M. ENVI-met 4: A Microscale Urban Climate Model. 2017. Available online: www.envi-met.com (accessed on 19 December 2019).
- ASHRAE. ASHRAE Guideline 14-2002 for Measurement of Energy and Demand Savings; American Society of Heating, Refrigeration and Air Conditioning Engineers: Atlanta, GA, USA, 2002. [Google Scholar]
- Day, A.; Knight, I.; Dunn, G.; Gaddas, R. Improved methods for evaluating base temperature for use in building energy performance lines. Build. Serv. Eng. Res. Technol. 2003, 24, 221–228. [Google Scholar] [CrossRef]
- Galal, O.M.; Mahmoud, H.; Sailor, D. Impact of evolving building morphology on microclimate in a hot arid climate. Sustain. Cities Soc. 2020, 54, 102011. [Google Scholar] [CrossRef]
- Abdelrady, A.; Sharma, S.; Sefelnasr, A.; El-Rawy, M.; Kennedy, M. Analysis of the performance of bank filtration for water supply in arid climates: Case study in Egypt. Water 2020, 12, 1816. [Google Scholar] [CrossRef]
- Aljawabra, F. Thermal Comfort in Outdoor Urban Spaces: The Hot Arid Climate; University of Bath: Bath, UK, 2014. [Google Scholar]
- Climate-Data.Org. Climate Data for Cities Worldwide. Available online: https://en.climate-data.org/ (accessed on 12 May 2023).
- Mahmoud, H.; Ghanem, H.; Sodoudi, S. Urban geometry as an adaptation strategy to improve the outdoor thermal performance in hot arid regions: Aswan University as a case study. Sustain. Cities Soc. 2021, 71, 102965. [Google Scholar] [CrossRef]
- Gomaa, M.; Ragab, A. Investigating the Spatial Autocorrelation of Surface-Air Temperature for Different Ground Materials in Hot Desert Climate. Egypt. Int. J. Eng. Sci. Technol. 2022, 39, 49–59. [Google Scholar] [CrossRef]
- Ministry of Housing, Utilities and Urban Communities. Egyptian Code for Cooling and Air Conditioning (304/1-2004); Ministry of Housing, Utilities and Urban Communities: Cairo, Egypt, 2020.
- Akbari, H.; Pomerantz, M.; Taha, H. Cool surfaces and shade trees to reduce energy use and improve air quality in urban areas. Sol. Energy 2001, 70, 295–310. [Google Scholar] [CrossRef]
- Tan, Z.; Lau, K.K.-L.; Ng, E. Urban tree design approaches for mitigating daytime urban heat island effects in a high-density urban environment. Energy Build. 2016, 114, 265–274. [Google Scholar] [CrossRef]
- Corner, E.J.H. Wayside Trees of Malaya in Two Volumes; CABI: Wallingford, UK, 1988. [Google Scholar]
- Ramírez, W. Ficus microcarpa L., F. benjamina L. and other species introduced in the New World, their pollinators (Agaonidae) and other tig wasps. Rev. De Biol. Trop. 1988, 36, 441–446. [Google Scholar]
- ISO 7730:2005; Ergonomics of the Thermal Environment–Analytical Determination and Interpretation of Thermal Comfort Rusing Calculation of the PMV and PPD Indices and Local Thermal Comfort Criteria. ISO: Geneva, Switzerland, 2006.
- ISO 9920; Ergonomics of the Thermal Environment—Estimation of Thermal Insulation and Water Vapour Resistance of a Clothing Ensemble. (ISO 9920: 2007, Corrected version 2008-11-01). ISO: Geneva, Switzerland, 2009.
- Aleksandrowicz, O.; Pearlmutter, D. The significance of shade provision in reducing street-level summer heat stress in a hot Mediterranean climate. Landsc. Urban Plan. 2023, 229, 104588. [Google Scholar] [CrossRef]
- Guo, F.; Guo, R.; Zhang, H.; Dong, J.; Zhao, J. A canopy shading-based approach to heat exposure risk mitigation in small squares. Urban Clim. 2023, 49, 101495. [Google Scholar] [CrossRef]
- Amores, T.R.P.; Ramos, J.S.; Delgado, M.G.; Medina, D.C.; Cerezo-Narvaéz, A.; Domínguez, S.Á. Effect of green infrastructures supported by adaptative solar shading systems on livability in open spaces. Urban For. Urban Green. 2023, 82, 127886. [Google Scholar] [CrossRef]
- Dardir, M.; Berardi, U. Development of microclimate modeling for enhancing neighborhood thermal performance through urban greenery cover. Energy Build. 2021, 252, 111428. [Google Scholar] [CrossRef]
- Wu, Z.; Man, W.; Ren, Y. Influence of tree coverage and micro-topography on the thermal environment within and beyond a green space. Agric. For. Meteorol. 2022, 316, 108846. [Google Scholar] [CrossRef]
- Joardar, S.D. Classification of landscape plants for environmental design uses. J. Archit. Plan. Res. 1998, 15, 109–132. [Google Scholar]
- Ali, E.M.N.; Fikry, A.A. A Design Methodology For Improving Outdoor Thermal Comfort In The Urban Space. Educ. Adm. Theory Pract. 2024, 30, 3903–3917. [Google Scholar]
- Abdallah, A.S.H.; Mahmoud, R.M.A. Urban morphology as an adaptation strategy to improve outdoor thermal comfort in urban residential community of new assiut city, Egypt. Sustain. Cities Soc. 2022, 78, 103648. [Google Scholar] [CrossRef]
- Park, M.; Hagishima, A.; Tanimoto, J.; Narita, K.-i. Effect of urban vegetation on outdoor thermal environment: Field measurement at a scale model site. Build. Environ. 2012, 56, 38–46. [Google Scholar] [CrossRef]
- Wang, Y.; Bakker, F.; de Groot, R.; Wortche, H.; Leemans, R. Effects of urban trees on local outdoor microclimate: Synthesizing field measurements by numerical modelling. Urban Ecosyst. 2015, 18, 1305–1331. [Google Scholar] [CrossRef]
- Tan, Z.; Lau, K.K.-L.; Ng, E. Planning strategies for roadside tree planting and outdoor comfort enhancement in subtropical high-density urban areas. Build. Environ. 2017, 120, 93–109. [Google Scholar] [CrossRef]
- Doick, K.J.; Peace, A.; Hutchings, T.R. The role of one large greenspace in mitigating London’s nocturnal urban heat island. Sci. Total Environ. 2014, 493, 662–671. [Google Scholar] [CrossRef]
- Aboelata, A.; Sodoudi, S. Evaluating the effect of trees on UHI mitigation and reduction of energy usage in different built up areas in Cairo. Build. Environ. 2020, 168, 106490. [Google Scholar] [CrossRef]
- Mahmoud, A.R.A.; Aly, A.M.; Hassan, M.H. Evaluating the thermal performance of urban spaces in aswan city “a case study of saad zaghloul street. JES J. Eng. Sci. 2015, 43, 766–782. [Google Scholar] [CrossRef]
- Derevyanko, B.; Nikolenko, L.; Severinova, O.; Turkot, O.; Volkovych, O. Financial Support for Organic Agricultural Production: Experience of Some EU Countries and Prospects for Ukraine. Int. J. Agric. Biosci. 2024, 13, 136–143. [Google Scholar]


Disclaimer/Publisher’s Note: The statements, opinions and data contained in all publications are solely those of the individual author(s) and contributor(s) and not of MDPI and/or the editor(s). MDPI and/or the editor(s) disclaim responsibility for any injury to people or property resulting from any ideas, methods, instructions or products referred to in the content. |
© 2024 by the authors. Licensee MDPI, Basel, Switzerland. This article is an open access article distributed under the terms and conditions of the Creative Commons Attribution (CC BY) license (https://creativecommons.org/licenses/by/4.0/).