Abstract
Urban green spaces are crucial for the exchange of energy fluxes, particularly sensible heat (QH) and latent heat (QE) fluxes. Therefore, this study aimed to investigate the characteristics of plant communities in urban green areas that affect turbulent fluxes, specifically QH and QE. The energy balance was measured using an eddy covariance system tower set up in three green areas at Kasetsart University: the Varunawan Garden (S1), the 100-Year Garden of Luang Suwan Vajokkasikit (S2), and the Phaholyothin Garden (S3). The results show that the canopy coverages of trees in S1, S2, and S3 were 526.23, 895.81, and 756.70 m2, respectively. The Bowen ratios (QH/QE) during the daytime in S1, S2, and S3 were 1.75, 1.09, and 1.43, respectively. These relationships suggest that dense trees, a dense canopy layer top, and the presence of water sources within the green areas resulted in a higher latent heat flux and a lower proportion of sensible heat flux. The findings of this study can be used as a guideline for the development and improvement of plant community structures in green areas within urban climate change adaptation.
1. Introduction
In the past few decades, rapid urbanization driven by economic and industrial growth has resulted in changes in land use to accommodate human activities in cities. In Bangkok, the land use in 2009 was 63.46% community and built-up areas, 26.84% agricultural area, 0.17% forest area, 2.57% water area, and 6.96% miscellaneous area, which changed to 67.36%, 23.67%, 0.16%, 2.96%, and 5.85%, respectively, in 2019 [1]. These changes from 2009 to 2019 show the significant land use changes in the Bangkok metropolis, where urban expansion has led to a decline in agricultural areas. The proportion of green areas (agricultural and forest areas) decreased by 3.18%, while that of community and built-up areas increased by 3.90%. This is consistent with the significant increase in the number of houses, from 2,334,126 in 2009 to 3,041,115 in 2019. The number of registered vehicles, which are components of transportation, also increased, from 6,444,631 in 2020 to 10,497,271 in 2019 [2]. These changes in land use and activities correspond to the highest recorded temperatures during the hot season. Bangkok, Thailand is a megacity in a tropical region, with an average ambient air temperature ranging between 26 and 34 °C, which tends to increase every year [3,4]. It was suggested that buildings/houses and emissions from combustion engine vehicles (BEMs) are the main contributors to anthropogenic and storage fluxes in urban environments and increases in these contribute to increases in the total energy fluxes within the urban environment [5]. This change can be attributed to the urban heat island effect, which is caused by the expansion of urban land use and the increase in infrastructure related to changes in the urban fabric. This leads to changes in the energy budget that amplify the storage period [6,7]. In parallel with land use changes, the increasing temperature is also a result of the proportion of green areas being replaced by heat-absorbing materials, such as cement, asphalt, rubber, and heat-absorbing roof tiles. In addition, emissions from anthropogenetic sources generated by engines and electrical appliances in various buildings further amplify the effects [8,9,10]. The factors that this study focuses on are the increasing urban heat island effects. This phenomenon is regarded as a driver of climate change, as increasing heat from BEMs has been attributed to changes in the air temperature, leading to further increases in heat emissions, especially in urban areas [11]. This is also in line with Pakarnseree et al. (2018) [4] and Maskulrath et al. (2023) [12], who discussed the importance of the physical characteristics of buildings, which affect the occurrence of the urban heat island phenomenon. Changes in the surface characteristics of buildings promote an increase in sensible heat in urban areas and a decrease in latent heat fluxes, leading to enhanced heat island effects.
Based on changes in the energy balance within cities, one of the most common mitigation measures for heat reduction within urban areas is the use of green spaces [13]. Plant transpiration is the main process that contributes to lowering the air temperature in green areas. In the process, the movement of water vapor through the leaf stomata, driven by the water potential gradient between the leaf and the atmosphere, releases latent heat and cools the leaf and the surrounding air [14,15,16]. As a part of this experiment, urban tropical measurements were measured within cities and their anthropogenic areas, as these represent the dominance of sensible and storage heat fluxes. Although this study considered the effects of trees and green areas on the latent heat fluxes, the study location is located in an urban environment, with influences of both the urban environment on the green areas and the green areas on the urban environment. With a special emphasis on the tropical plant community, for which studies on the energy balance were found to be lacking, this study aims to fill the knowledge gaps on how the plant community provides support for these urban energy interactions.
Additionally, tree canopies also play a role in shaping the rates of evapotranspiration. They have a complex three-dimensional shape, and the distribution of leaves in the canopy affects the proportion of solar radiation energy and the energy balance of the environment [17,18,19]. In this way, if the complexity of the canopy is greater, it results in more light synthesis. And, if the complexity of the canopy in the area is lower, the rate of light synthesis will be lower [17]. Regarding the mechanism of energy exchange between the atmosphere and green surface canopies, it was described that (1) green surface canopies influence the exchange between the incoming radiation and its applications within the canopy energy flux balance; (2) the complexity of the canopy can also shape the roughness length, leading to trapping water vapor within the canopy and resulting in an increase in the latent heat flux; (3) increases in the leaf area index promotes higher evapotranspiration, which regulates the latent heat flux portion of the surface energy budget; and (4) the ambient carbon dioxide flux is reduced via the photosynthesis process [20].
An energy balance study in the southwestern Amazon region found that the evapotranspiration rate in forested areas was higher than that in grassland areas. This is because forest areas can retain water, affecting the evapotranspiration balance, unlike grassland areas, where high-ground stress causes these areas to have a lower evapotranspiration balance [21]. Similarly, studies comparing the energy balance of Amazon forests with that of crops found that forested areas have higher evapotranspiration rates [22]. This supports increases in the latent heat (QE) flux, reducing the thermal sensible heat flux and thus decreasing the ambient air temperature. Different plant community structures contribute to enhancing the efficiency of air temperature reduction. Therefore, this study aimed to investigate the plant community structure of green areas and the species of vegetation that affect the energy balance within urban areas, as well as their efficiency in reducing the sensible heat of plant community structures in different green areas, to provide guidelines for the management of painted areas in cities with the aim of sustainable urban development.
2. Materials and Methods
2.1. Site Description
Bangkok, the capital city of Thailand, is located in the central region at approximately 13°44′ N and 100°34′ E and has a total area of 1565.22 km2 [1]. The city is characterized by its tropical and humid climate influenced by two monsoon winds, namely the northeast and southwest monsoons, resulting in three distinct seasons: summer, starting at the end of the northeast monsoon in mid-February to mid-May; the rainy season, from mid-May to mid-October; the winter season, from mid-October to mid-February. The study area of this research is located in the north of Bangkok at Kasetsart University, which is part of the project KU−GREEN CAMPUS. The university aims to promote and develop physical and environmental aspects, improve the landscape, and maintain garden areas. According to the land use measurement scale, it was found that 15.2% of Kasetsart University, which is located in urban Bangkok, is covered in water and green areas [12]. However, the measurement site was located within the university park, where the measurement height only allowed for the flux footprint to cover a 90% confidence variable of the measured fluxes. Additionally, all the 3 measurement locations within the study site were near each other, as this eliminated the majority and maintained a similar urban microclimate condition.
This study depicts three green areas in three locations within the university campus: the Varunawan Garden (S1), the 100-Year Garden of Luang Suwan Vajokkasikit (S2), and the Phaholyothin Garden (S3), as shown in Figure 1 and Table 1. The details of the study areas are as follows. S1, representing a forest garden, covers an area of 13,641.66 m2, with the green and water areas accounting for approximately 62.61% and 37.39%, respectively. The garden is located in the western part of the university and is surrounded by two main roads: Viphavadi Rangsit Road and Ngamwongwan Road. S2 is a harmonious blend of forestry plantations, herb gardens, and arboretums located at the center of the university. And, lastly, S3 is located in the southeastern part of the university and surrounded by two main roads, Phaholyothin Road and Ngamwongwan Road. It is a botanical garden with the green and water areas accounting for approximately 66.25% and 33.75%, respectively. To distinguish the features of the 3 measurement sites, their plant species, populations, ratios, and dispersions were identified.
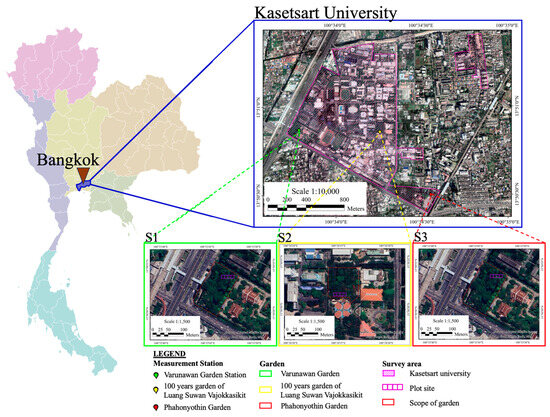
Figure 1.
Locations of the measurement station and surveyed area.

Table 1.
Flux measurement site description at Kasetsart University, Bangkok, Thailand.
2.2. Plant Community Analysis
The species diversity and plant communities were analyzed through species classification and the quantity, proportion, and distribution of plants within the study site. Measurements were taken by establishing plots to study the plant community structure in representative areas of the three measurement points. A 10 m × 40 m (400 m2) plot was established at each location. The tree diameter canopy cover and height were measured using a 2.0 m diameter tape measure (Lufkin W606PM, Apex Tool Group, Sparks, MD, USA) and laser altimeter (Forestry Pro II, Nikon Corporation (Nikon), Tokyo, Japan), respectively. The plant species present in the sample plots were recorded. Large trees were classified as trees with a trunk diameter of 4.5 cm and a height of more than 1.30 m above the ground. The canopy cover was recorded by measuring the length of the canopy spread in four directions from the trunk [23]. The classification of canopy layers (stratification) considers plant communities vertically and examines how the canopy is grouped and divided into layers based on the heights of large trees and shrubs. This study identified 4 canopy layers, which were the top canopy (tall tree stratum, >15 m), secondary canopy (intermediate tree stratum, 7.5–15 m), low canopy (low tree, high shrub stratum, 2.5–7.5 m), and lower shrub layer (low shrub, <2.5 m) [24]. For the overall tree area, profile diagrams were used to analyze the vertical and horizontal structure, while the species of trees were identified using Plants of the World Online, https://powo.science.kew.org/ (accessed on 22 October 2023). The total diversity of the sites was determined using the Shannon–Wiener diversity index [25].
2.3. Energy Balance and Bowen Ratio Analysis
To collect sample data from the infrared gas analyzer (IRGASON, Campbell Scientific Ltd., Loughborough, UK) integrated with a CO2 and H2O open-path gas analyzer, a 3D sonic anemometer was used to measure the momentum, heat, water vapor, and CO2 flux between the surfaces and the atmosphere. The resulting data were analyzed using a gas analyzer and transmitted to a data logger (CR3000, Campbell Scientific, Inc., Logan, UT, USA), which calculated the sensible and latent heat fluxes. The data processing was carried out using the EasyFlux program, which takes into account the stability, friction, and stability, along with the axis rotation and error correction, thus computing the 30 min flux average.
The measured parameters included the net radiation (Q*), latent heat flux (QE), sensible heat flux (QH), soil heat flux, and ground surface heat flux (QG) using HFP01−L: Soil Heat Flux Plate (Equation (1)). To measure the energy balance, the eddy covariance technique (EC) was employed, which involved four main meteorological measurement instruments: (1) a 3D sonic anemometer (measuring three-dimensional particle motion); (2) air temperature and relative humidity sensor with a radiation shield; (3) the SQ 110 Apogee Instrument (measuring photosynthetically active radiation, PAR, in mol photons m−2 s−1), with plants utilizing light in the wavelength range of 350 to 750 nm for photosynthesis; (4) the NR01-L: 4-Component Net Radiometer (measuring net radiation). The energy balance estimation was based on the study of the energy balance, as shown in Equation (1) [26].
Q* = QH + QE + QG + ∆QS,
- Q* = net radiation flux, Wm−2;
- QH = sensible heat flux, Wm−2;
- QE = latent heat flux, Wm−2;
- QG = ground heat flux, Wm−2;
- ∆QS = storage period by plant, building, etc., Wm−2.
Equation (1) represents the total energy of the area, where Q* is the net radiation of the sum of all the available energy used in the area. The turbulent heat flux was then calculated as the latent heat of evaporation (QE) and the sensible heat (QH), from which the ambient temperature is derived. Lastly, the ground heat flux (QG), which, in some cases, can be referred to as the storage heat flux, accounts for the available energy from the surface [27].
The IRGASON was installed in an open area away from disturbances and positioned at a height of 10 m above ground level. Measurements were taken continuously for 24 h for five consecutive days per monitoring site, from April to June 2022. The sampling details are listed in Table 1. Since this study was conducted in a confined space, a flux footprint analysis had to be carried out. This shows that all turbulent fluxes were covered within the desired area.
Figure 2 shows the results of the flux footprints; it can be seen that the full footprints do not fall within the desired measurement areas. However, the conditions of the urban environment account for about 10% of the measured flux. In the case of this research, this urban influence was taken into consideration. All the fluxes were measured with the eddy covariance system, while the Bowen ratio was calculated using the 30 min QE and QH flux data.
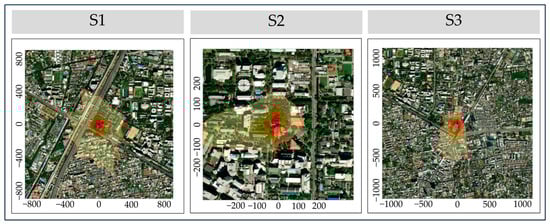
Figure 2.
Flux footprints throughout the day at Varunawan Garden (S1), 100-Year Garden of Luang Suwan Vajokkasikit (S2), and Phaholyothin Garden (S3), indicating flux measurements of about 10–90%.
The relevant IRGASON data were then postprocessed through the EasyFlux program, which calculated and adjusted the flux values and calculations (Bowen ratio; Equation (2)) into 30 min intervals. The program also considered other measurement information, including the height above ground (m), displacement height (m), roughness length (m), mean wind speed at zm (ms−1), Obukhov length (m), standard deviation of the lateral velocity fluctuations after rotation (ms−1), friction velocity (ms−1), and wind direction in degrees (of 360°) for the rotation of the footprint [28] (Flux Footprint Prediction, 2023). This postprocessing method also considered and adjusted the total axis rotation and the H2O lag, accounting for the error in the QE flux and the correction of humidity effects on the temperature for the QH flux.
Bowen Ratio (B) = QH/QE.
3. Results and Discussion
3.1. Characteristics of Plant Community Structure in Green Areas
The results of the plant community structure show that site S1, identified as a forest plantation, had 10 tree species in the area, with each type represented by one tree, including M. leucantha, A. lebbeck, S. siamensis, M. fruticosum, F. benghalensis, A. merrillii, L. speciosa, C. odollam, S. roxburghii, and P. pterocarpum. The tree canopy coverage was divided into two layers: a secondary and low canopy, measuring 419.01 and 107.22 m2, respectively. The total canopy coverage of trees in the sample plot was 526.23 m2. In S2, 9 of the 15 trees found in the sample plot were different species, including P. macathurii, C. cujete, P. pterocarpum, S. foetida, E. camaldulensis, L. chinensis, S. macrophylla, D. malabarica, and F. benjamina. The tree canopy coverage was divided into three layers: top, secondary, and low canopies, measuring 528.40, 335.89, and 31.53 m2, respectively. The total canopy coverage of trees in the sample plot was 895.81 m2. The S3 site was a typical garden with a single species, specifically P. pterocarpum, consisting of seven trees. The total crown cover of the upper canopy was 756.70 m2 (Figure 3).
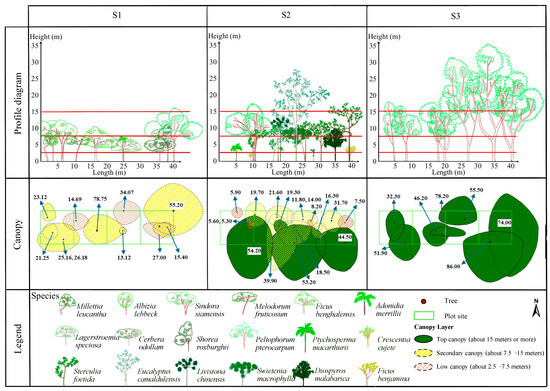
Figure 3.
Profile diagram of garden and canopy layers.
In all three sites, there was no lower shrub layer, with the canopy layers indicating the nature of the interchangeable growth of plants in the future and the durability of plants that have the opportunity to occupy the area. The complexity of the canopy layers in plant communities and their separation demonstrate the factors required for survival in the environment, which appear at different levels: energy, light, air humidity, temperature, nutrients, and other factors of plant communities.
According to Table 2, the diversity values of plant species in S1, S2, and S3, calculated using the Shannon–Wiener index of diversity [25], were 2.30, 1.98, and 0.36, respectively. The S1 and S2 sites exhibited higher species diversity than S3, with similar or undifferentiated species diversity between S1 and S2. Most of the plant species in these areas are found in humid tropical regions. When comparing the number of trees in all three plots, the S2 site had the highest number of trees, the greatest tree density, and the largest tree canopy coverage area. There was also a vertical distribution of the tree canopy layers and a dense horizontal spread of the tree canopy throughout S2. The size of the canopy cover is directly related to the leaf area index (LAI), where a dense canopy cover conveys a positive relationship with an increase in LAI values [29,30]. It is also an indicator of photosynthesis capabilities, where the exchange of water vapor and oxygen is a by-product of photosynthesis [31].
Table 2.
Types, quantities, proportions, and distributions of plants in the green areas.
3.2. Changes in the Net Energy and Energy Exchange between the Atmosphere and the Surface
Figure 4 shows the diurnal average variations in the energy fluxes over time at each site. S1 had an average Q* of 209.49 ± 178.94 Wm−2, peaking at 445.39 Wm−2 at 11:00 local time (LT). It had a decreasing trend from 11:00 to 13:00 LT, attributed to cloud cover (rainy season), and leading to a reduction in the net energy due to light absorption, reflection, and scattering [32]. However, it subsequently increased until 16:00 LT. S2 had an average Q* of 102.36 ± 106.92 Wm−2, peaking at 270.98 Wm−2 at 12:00 LT. The net radiation Q* of S2, which had the highest plant diversity, had the lowest average due to cloudy weather throughout the day. The direct impact of the reduction in QH is unclear; however, it was seen that there was an increase in QE and a lower Bowen ratio, which suggests that the effects of the complex canopy layers had a direct effect on the overall surface energy balance.
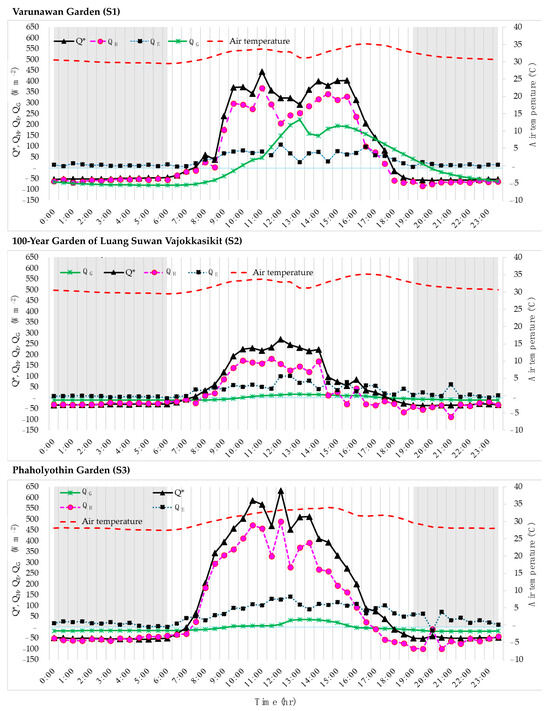
Figure 4.
Variations in net radiation (Q*), sensible heat (QH), latent heat (QE), and ground surface heat (QG) over time.
During the measurement period, the sky remained cloudy throughout the day. The S3 exhibited an average Q* of 271.75 ± 230.02 Wm−2, peaking at 633.34 Wm−2 at 12:00 LT. The sky was clear. These values are in line with the total average net radiation received in the central region of Thailand, indicating that the changes in Q* at each location depend on atmospheric obstacles [32,33]. The energy balance ratio can be influenced by the varying intensity of solar radiation, which is attributed to different types of cloud cover in the sky. Therefore, the energy balance proportions differed.
S1, S2, and S3 showed continuous upward trends in Q* in the morning (6:00 LT) until reaching their peak between 11:00 and 12:00 LT. Subsequently, there were alternating declines in the values from morning to evening (19:00 LT). During the night, no energy is received from the sun, promoting radiative cooling, which affects the variations in QE, QG, and QH.
QE showed a continuous upward trend, with the highest values observed between 12:00 and 12:30 LT, at 108.11, 102.07, and 141.99 Wm−2 for S1, S2, and S3, respectively. The values increased gradually from morning to noon (6:00–12:30 LT), and then decreased in the afternoon. Subsequently, the values gradually decreased in the evening (16:00–19:00 LT). At night, S2 had a higher average QE flux because the water vapor movement was supported by the tree canopy complexity. The average QE values at night for S1, S2, and S3 were 1, 3, and 23 Wm−2, respectively.
QG was the highest between 12:30 and 1:30 LT, with values of 13.09, 17.15, and 36.24 Wm−2 for S1, S2, and S3, respectively. All areas experienced their lowest values during the evening and nighttime, with −5.65, −10.68, and −18.65 Wm−2 for S1, S2, and S3, respectively. During the morning, QG was negative in all areas due to the presence of water bodies in the garden area, which resulted in negative values for an extended period. The average QG values during the night for S1, S2, and S3 were −4, −10, and −17 Wm−2, respectively. The results were found to be negative, indicating that there is energy use activity within the soil during the daytime as the temperature inside the soil was higher than that at the soil surface. The direction of heat movement in the soil was vertical, with heat being transferred upward to the surface, resulting in negative QG values [8]. Meanwhile, during the nighttime, loss of heat occurred.
QH showed a continuous increase from the moment solar energy was received. Meanwhile, the urban environment and measurement site settings supported the dominance of the QH flux in all the measured sites. This is a common finding in urban areas; green area effects alter the decrease in this energy flux. The results show maximum values of 368.07, 168.89, and 490.51 Wm−2 for S1, S2, and S3, respectively. Thereafter, the values gradually decreased in the afternoon. During the evening and night, the values of QH became negative, meaning that heat was flowing from the surface to the atmosphere due to radiative cooling.
3.3. Effects of Plant Community Structure in Green Areas on Energy Exchange
Table 3 presents the impacts of the plant community structure in the green areas on the energy exchange during the daytime (06:00–19:00 LT). Canopy size played a significant role in the energy exchange process, particularly for QE. S1, S2, and S3 had maximum canopy sizes of 526.23, 895.81, and 756.70 m2 with average QE values of 49.94 ± 28.20, 46.04 ± 26.63, and 81.83 ± 35.36 Wm−2, respectively. We observed that taller canopy structures contributed to enhanced plant evapotranspiration. Trees had a higher stomatal density and relative stomatal area than shrubs and herbs, and trees with larger relative stomatal areas had a higher photosynthetic capacity per unit area [34]. The opening and closing of the plant stomata are part of the photosynthetic and evapotranspiration process [9,35]. Therefore, areas with taller canopies had higher plant transpiration. The higher QE also affected the average QH values for S1, S2, and S3, which were 155.75 ± 17.53, 53.10 ± 10.37, and 185.01 ± 32.8 Wm−2, respectively, indicating improved energy exchange in the evaporation of water. This suggests that in green areas, the size, density, and type of green area have a direct correlation with the surface temperature [36].
Table 3.
The differences in the plant community structure compared to the energy balance of each area during the day (6:00–19:00 LT).
The complexity of the canopy also allows for greater accumulation of the QE fluxes within the tree canopy; it was seen that the complexity of the canopy cover allowed for an increase in the trapping of water vapor, which led to an increase in the QE flux. This is also due to the relationships among the different types of plant species found within each site. Higher complexity, especially in S2 and S3, presented higher QE values, leading to an overall lower temperature.
The differences in the species of trees present in all sites also indicate that the complexity of the tree species has suggested for also an increase in the overall LAI as this allowed for higher litter fall rates. This promotes higher digestion activity within the garden ground generating a higher QG flux. Overall, the complexity of trees or forests allows for the energy balance within the forest ecosystem to be dominated by the QE and QG fluxes [37].
In the diurnal variations in QE, it can be seen that the effects of solar radiation increased the total amount of QE. The higher the available energy, the stronger the effects of photosynthesis that rely on PAR energy, thus resulting in an increase in the energy exchange of water vapor, contributing to the overall QE [38].
The findings of this study also align with those of Morris et al. (2016) [39], who suggested that urban areas with vegetation showed consistently cooler air temperatures both in the morning and at night. The results of the flux measurements show that the sites with dense vegetation cover and taller canopies had higher QG and QE values and contributed to a decrease in the proportion of QH. Another aspect regarding the plant species and species diversity in the sample plots is that S1, S2, and S3 had values of 2.30, 1.98, and 0.36, respectively. These values impacted the increase or decrease in the QE value or the measured value of water evaporation in the air. These findings align with the research conducted by Hui and Chu (2019) [40] and Ouyang et al. (2020) [41], who found that transpiration was highly dependent on the size of the tree canopy and season.
Figure 5 shows QH/QE or the Bowen ratio (6:00–19:00 LT). S1, S2, and S3 had values of 1.75, 1.09, and 1.43, respectively, while the average air temperatures were 32.69, 30.90, and 31.49 °C, respectively. Among the sites, it was found that the Bowen ratios of all three were non-significant (p > 0.05). However, the differences in the ratios were found to present differences in both the sensible and the QE fluxes (Figure 5). Figure 5 also depicts a comparison of the Bowen ratio to the air temperatures at the different sites of measurement, where it was seen that increases in the air temperature were associated with higher Bowen ratios. This was due to the influence of the sensible heat on the average ambient temperature [12].
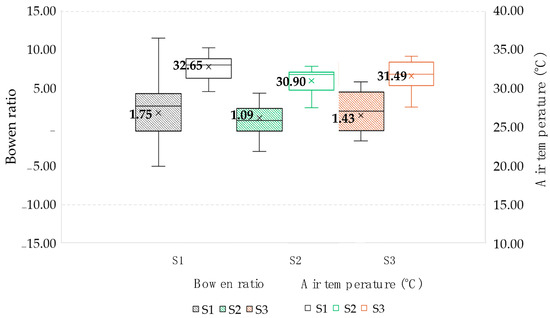
Figure 5.
Bowen ratio of garden (daytime 6:00–19:00 LT).
It was suggested that the influence of a high proportion of QE in a green area affects the air temperature, as it was found that urban areas with a higher proportion of green areas had lower temperatures than areas covered with water surfaces and built-up areas [42]. As determined by Morris et al. (2016) [38], the size and quantity of vegetation had a large impact on reducing the air temperature each day in Putrajaya City, Malaysia. Additionally, Taksadipong et.al. (2017) [43] found that larger green areas had a more significant influence on reducing the temperature in surrounding areas than smaller green areas. Furthermore, Ramírez-Cuesta et al. (2022) [44] found that bare soil surfaces exposed to direct sunlight underwent temperature changes more easily than shaded surfaces or surfaces covered by tree canopies. Variations in the surface of the soil without any cover lead to easier temperature changes in the surface temperature (near-surface meteorology) in the short term compared to surfaces covered by tree canopies.
It was also found that lower Bowen ratios were due to increases in the QE flux. The factor contributing to such increases was seen with increasing rates of evapotranspiration, which allowed for the energy exchange of water vapor from the tree canopy into the atmosphere. This led to an increase in the QE, contributing toward the overall energy of the measured area. Thus, an increasing QE in a green area then reduces the QH, which, in turn, lowers the ambient air temperature [5]. However, the objective of this study was to determine the trend of the energy balance due to the effects of the canopy layers. The measurement and placement of the eddy covariance system represented the energy flux of the area from where all data were acquired. The turbulent fluxes (QE and QH) of that particular location thus supported the calculation of the Bowen ratio.
Lastly, the limitations of this study include the measurement time frame in which the trends were observed. In future experiments, longer measurement durations should be taken into consideration. However, based on the differences in the fluxes measured at the different sites of the university green area, it can be seen that the measurement duration presented significant differences in the QE fluxes due to the garden characteristics. In addition, at the locations where the measurements were taken, the small area size did have an effect on the anthropogenic influence resulting from the surrounding landcover.
4. Conclusions
Green areas are crucial for the energy balance within tropical cities, such as Bangkok, and affect temperature changes at the surface level. In studying the influence of plant communities in humid tropical areas on sensible heat in urban environments, it was found that the plant community structure differed with the density of the trees, the canopy coverage, and the canopy layer levels in garden areas, which directly influenced sensible heat changes and lowered the ambient temperature. Green areas with a higher tree density, canopy coverage, and tree canopy layer levels had a direct impact on the energy exchange in terms of the latent heat and ground heat flow. Concluding that in this study which focuses on the small-scale green areas within urban surroundings, each site (S1, S2, and S3) showed a decrease in sensible heat, with values of 155.75 ± 17.53, 53.10 ± 10.37, and 185.01 ± 32.8 Wm−2, respectively. This reduction corresponded to an increase in the average QE values of 49.94 ± 28.20, 46.04 ± 26.63, and 81.83 ± 35.36 Wm−2, respectively. Overall, this indicates that the highest canopy layer areas resulted in temperatures of 30.90 °C for S2, and 32.69 °C, and 31.49 °C for S1 and S3, respectively.
This ability of plant community structures in garden areas supports the addition of water to the atmosphere, thus helping to alleviate high heat in the atmosphere surrounding cities where buildings have a high energy storage capacity and leading to higher efficiency of reducing sensible heat compared to areas with a lower tree density and lower canopy coverage. Additionally, it was also seen that plant species with wide canopies are selected along with trees of different height levels to increase the LAI value to make areas more efficient in production. This creates replacement trees for the next generation and can affect the energy balance in cities by reducing the predominance of sensible heat. The results of this study can be used as guidelines for developing, mitigating, and improving plant community structures in green areas within cities to adapt and respond effectively to changes in near-surface weather conditions in urban areas.
Author Contributions
Conceptualization, R.R. and P.C.; methodology, R.R., P.C., S.B. and T.R.; software, R.R. and Y.F.; validation, P.C., S.B., T.R. and P.M.; formal analysis, P.C. and S.B.; investigation, R.R., P.C. and P.M.; resources, S.B.; data curation, R.R. and Y.F.; writing—original draft preparation, R.R.; writing—review and editing, P.C., S.B. and P.M.; visualization, R.R. and Y.F.; supervision, P.C. All authors have read and agreed to the published version of the manuscript.
Funding
This research received no external funding.
Data Availability Statement
The data will be made available upon request.
Acknowledgments
This study was supported by the Atmospheric Science Research Group (ASRG), and the Faculty of Environment, Kasetsart University, Bangkok, Thailand.
Conflicts of Interest
The authors declare no conflicts of interest.
References
- Land Development Department. Summary of Land Use Types Bangkok Province, Year 2019. Available online: http://www1.ldd.go.th/web_OLP/Lu_62/Lu62_C/BKK2562.htm (accessed on 22 October 2023).
- National Statistical Office. Vehicle Registration Statistics of the Department of Land Transport Classified by Registration Act. 2020. Available online: http://ittdashboard.nso.go.th/preview.php?id_project=126 (accessed on 12 March 2023).
- Adulkongkaew, T.; Satapanajaru, T.; Charoenhirunyingyos, S.; Singhirunnusorn, W. Effect of land cover composition and building configuration on land surface temperature in an urban-sprawl city, case study in Bangkok Metropolitan Area, Thailand. Heliyon 2020, 6, e04485. [Google Scholar] [CrossRef]
- Pakarnseree, R.; Chunkao, K.; Bualert, S. Physical characteristics of Bangkok and its urban heat island phenomenon. Build. Environ. 2018, 143, 561–569. [Google Scholar] [CrossRef]
- Chen, H.C.; Huang, J.J.; Liang, H.; Wang, W.; Li, H.; Wei, Y.; Jiang, A.Z.; Zhang, P. Can evaporation from urban impervious surfaces be ignored? J. Hydrol. 2023, 616, 128582. [Google Scholar] [CrossRef]
- Sidiqui, P.; Roös, P.B.; Herron, M.; Jones, D.S.; Duncan, E.; Jalali, A.; Allam, Z.; Roberts, B.J.; Schmidt, A.; Tariq, M.A.U.R.; et al. Urban Heat Island vulnerability mapping using advanced GIS data and tools. J. Earth Syst. Sci. 2022, 131, 266. [Google Scholar] [CrossRef]
- Elliott, H.; Eon, C.; Breadsell, J.K. Improving City Vitality through Urban Heat Reduction with Green Infrastructure and Design Solutions: A Systematic Literature Review. Buildings 2020, 10, 219. [Google Scholar] [CrossRef]
- Suchatanon, P.; Bualert, S.; Kannasoot, S. Variation of energy balance in different Green Areas. Thai J. For. 2015, 34, 3–41. [Google Scholar]
- Ramamurthy, P.; Bou-Zeid, E. Heatwaves and urban heat islands: A comparative analysis of multiple cities. J. Geophys. Res. Atmos. 2016, 122, 168–178. [Google Scholar] [CrossRef]
- Maskooni, E.K.; Hashemi, H.; Berndtsson, R.; Arasteh, P.D.; Kazemi, M. Impact of spatiotemporal land-use and land-cover changes on surface urban heat islands in a semiarid region using Landsat data. Int. J. Digit. Earth 2021, 14, 250–270. [Google Scholar] [CrossRef]
- Waiworagit, S.; Buranakarn, V. Influenced factors of heat island effect temperature increase: Case study Pathum Thani province, Thailand. Int. J. Sci. Innov. Technol. 2021, 4, 26–33. [Google Scholar]
- Maskulrath, P.; Bualert, S.; Szymanski, W.W.; Choomanee, P.; Chunkao, K.; Pattamapitoon, T.; Saiohai, J.; Phupijit, J.; Utavong, T.; Rattanapotanan, T.; et al. Assessment of urban green areas towards changing surface energy balance fluxes in tropical study sites, Central Thailand. Environ. Chall. 2023, 11, 100715. [Google Scholar] [CrossRef]
- Zhou, W.; Yu, W.; Zhang, Z.; Cao, W.; Wu, T. How can urban green spaces be planned to mitigate urban heat island effect under different climatic backgrounds? A threshold-based perspective. Sci. Total Environ. 2023, 890, 164422. [Google Scholar] [CrossRef] [PubMed]
- Hamada, S.; Ohta, T. Seasonal variations in the cooling effect of urban green areas on surrounding urban areas. Urban For. Urban Green. 2010, 9, 15–24. [Google Scholar] [CrossRef]
- Oliveira, S.; Andrade, H.; Vaz, T. The cooling effect of green spaces as a contribution to the mitigation of urban heat: A case study in Lisbon. Build. Environ. 2011, 46, 2186–2194. [Google Scholar] [CrossRef]
- Aram, F.; García, E.H.; Solgi, E.; Mansournia, S. Urban green space cooling effect in cities. Heliyon 2019, 5, e01339. [Google Scholar] [CrossRef] [PubMed]
- Law, B.E.; Cascatti, A.; Baldocchi, D.D. Leaf area distribution and radiative transfer in open-canopy forests: Implications for mass and energy exchange. Tree Physiol. 2001, 21, 777–787. [Google Scholar] [CrossRef] [PubMed]
- Yang, R.; Friedl, M.A. Modeling the effects of three-dimensional vegetation structure on surface radiation and energy balance in boreal forests. J. Geophys. Res. Atmos. 2003, 108, 1–11. [Google Scholar] [CrossRef]
- Parker, G.G.; Harmon, M.E.; Lefsky, M.A.; Chen, J.; Pelt, R.V.; Weiss, S.B.; Thomas, S.C.; Winner, W.E.; Shaw, D.C.; Franklin, J.F. Three-dimensional structure of an old-growth Pseudotsuga-tsuga canopy and its implications for radiation balance, microclimate, and gas exchange. Ecosystems 2004, 7, 440–453. [Google Scholar] [CrossRef]
- McPherson, R.A. A review of vegetation—Atmosphere interactions and their influences on mesoscale phenomena. Prog. Phys. Geogr. 2007, 31, 216–285. [Google Scholar] [CrossRef]
- Ruezzene, C.B.; Parizotto, D.; Cidin, A.C.; Oliveira, D.d.; Pinto, T.J.d.S.; Crestana, S.; Miranda, R.B.d.; Mauad, F.F. Water balance and net radiation in forest and pasture area in Southwest Amazon. Santa Maria 2019, 23, 1–10. [Google Scholar] [CrossRef]
- Caioni, C.; Silvério, D.V.; Macedo, M.N.; Coe, M.T.; Brando, P.M. Droughts Amplify Differences Between the Energy Balance Components of Amazon Forests and Croplands. Ecohydrol. Remote Sens. 2020, 12, 525. [Google Scholar] [CrossRef]
- Hemery, G.E.; Savill, P.S.; Pryor, S.N. Applications of the crown diameter–stem diameter relationship for different species of broadleaved trees. For. Ecol. Manag. 2005, 215, 285–294. [Google Scholar] [CrossRef]
- Cain, S.A.; de Oliveira Castro, G.M. Manual of Vegetation Analysis; Harper: New York, NY, USA, 1959. [Google Scholar]
- Krebs, C.J. Ecology: The Experimental Analysis of Distribution and Abundance, 6th ed.; Eugene Hecht. Pearson Education, Inc. Pearson Benjamin Cummings: San Francisco, CA, USA, 2009. [Google Scholar]
- Foken, T.; Wimmer, F.; Mauder, M.; Thomas, C.; Liebethal, C. Some aspects of the energy balance closure problem. Atmos. Chem. Phys. 2006, 6, 4395–4402. [Google Scholar] [CrossRef]
- Mauder, M.; Foken, T.; Cuxart, J. Surface-Energy-Balance closure over land: A review. Bound.-Layer Meteorol. 2020, 177, 395–426. [Google Scholar] [CrossRef]
- Flux Footprint Prediction (FFP) Online Data Processing. Available online: https://geography.swansea.ac.uk/nkljun/ffp/www/upload.php (accessed on 12 December 2023).
- Nielsen, D.C.; Miceli-Garcia, J.J.; Lyon, D.J. Canopy Cover and Leaf Area Index Relationships for Wheat, Triticale, and Corn. Agron. J. 2012, 104, 1569–1573. [Google Scholar] [CrossRef]
- Raj, R.; Walker, J.P.; Pingale, R.; Nandan, R.; Naik, B.; Jagarlapudi, A. Leaf area index estimation using top-of-canopy airborne RGB images. Int. J. Appl. Earth Obs. Geoinf. 2021, 96, 102282. [Google Scholar] [CrossRef]
- Umaña, M.N.; Swenson, N.G.; Marchand, P.; Cao, M.; Lin, L.; Zhang, C. Relating leaf traits to seedling performance in a tropical forest: Building a hierarchical functional framework. Ecol. Soc. Am. 2021, 102, e03385. [Google Scholar] [CrossRef] [PubMed]
- Matuszko, D. Influence of the extent and genera of cloud cover on solar radiation intensity. Int. J. Climatol. 2012, 32, 2403–2414. [Google Scholar] [CrossRef]
- Intaraksa, A.; Chunkao, K.; Bualert, S. Bowen Ratio Method for Measuring Heat Transfer on Land Cover Change in Establishing Green Patch in Urban Heat Island of Bangkok. Mod. Appl. Sci. 2014, 8, 158–173. [Google Scholar] [CrossRef][Green Version]
- Li, Q.; Hou, J.; He, N.; Xu, L.; Zhang, Z. Changes in leaf stomatal traits of different aged temperate forest stands. J. For. Res. 2021, 32, 927–936. [Google Scholar] [CrossRef]
- Wang, C.; He, J.; Zhao, T.-H.; Cao, Y.; Wang, G.; Sun, B.; Yan, X.; Guo, W.; Li, M.-H. The Smaller the Leaf Is, the Faster the Leaf Water Loses in a Temperate Forest. Front. Plant Sci. 2019, 10, 58. [Google Scholar] [CrossRef]
- Yin, J.; Wu, X.; Shen, M.; Zhang, X.; Zhu, C.; Xiang, H.; Shi, C.; Guo, Z.; Li, C. Impact of urban greenspace spatial pattern on land surface temperature: A case study in Beijing metropolitan area, China. Landsc. Ecol. 2019, 34, 2949–2961. [Google Scholar] [CrossRef]
- Egipto, R.J.L.; Aquino, A.; Andújar, J.M. Predicting the canopy conductance to water vapor of grapevines using a biophysical model in a hot and arid climate. Front. Plant Sci. 2024, 15, 1334215. [Google Scholar] [CrossRef]
- Wang, W.; Smith, J.A.; Ramaurthy, P.; Baeck, M.L.; Bou-Zeid, E.; Scanlon, T.M. On the correlation of water vapor and CO2: Application to flux partitioning of evapotranspiration. Water Resour. Res. 2016, 52, 9452–9469. [Google Scholar] [CrossRef]
- Morris, K.I.; Chan, A.; Ooi, M.C.; Oozeer, M.Y.; Abakr, Y.A.; Morris, K.J.K. Effect of vegetation and waterbody on the garden city concept: An evaluation study using a newly developed city, Putrajaya, Malaysia. Comput. Environ. Urban Syst. 2016, 58, 39–51. [Google Scholar] [CrossRef]
- Hui, L.C.; Chu, L.M. Identifying suitable tree species for evapotranspiration covers of landfills in humid regions using seedlings. Urban For. Urban Green. 2019, 38, 157–164. [Google Scholar] [CrossRef]
- Ouyang, L.; Gao, J.; Zhao, P.; Rao, X. Species-specific transpiration and water use patterns of two pioneer dominant tree species under manipulated rainfall in alow-subtropical secondary evergreen forest. Ecohydrology 2020, 13, e2234. [Google Scholar] [CrossRef]
- Targino, A.C.; Coraiola, G.C.; Krecl, P. Green or blue spaces? Assessment of the effectiveness and costs to mitigate the urban heat island in a Latin American city. Theor. Appl. Climatol. 2019, 136, 971–984. [Google Scholar] [CrossRef]
- Taksadipong, S.; Chuntranuluk, S.; Rungratanaubon, T. Investigation of cooling effect of urban green area on air temperature and relative humidity. Asia-Pac. J. Sci. Technol. 2017, 18, 960–970. [Google Scholar]
- Ramírez-Cuesta, J.M.; Consoli, S.; Longo, D.; Longo-Minnolo, G.; Intrigliolo, D.S.; Vanella, D. Influence of short-term surface temperature dynamics on tree orchards energy balance fluxes. Precis. Agric. 2022, 23, 1394–1412. [Google Scholar] [CrossRef]


Disclaimer/Publisher’s Note: The statements, opinions and data contained in all publications are solely those of the individual author(s) and contributor(s) and not of MDPI and/or the editor(s). MDPI and/or the editor(s) disclaim responsibility for any injury to people or property resulting from any ideas, methods, instructions or products referred to in the content. |
© 2024 by the authors. Licensee MDPI, Basel, Switzerland. This article is an open access article distributed under the terms and conditions of the Creative Commons Attribution (CC BY) license (https://creativecommons.org/licenses/by/4.0/).